Fast logic? Examining the time course assumption of dual...
39
Fast logic? Examining the time course assumption of dual process theory in reasoning. Bence Bago Cognitive Science Msc Paris Descartes University Laboratory for the Psychology of Child Development and Education 2015 Supervisor: Wim De Neys Co-advisor: Olivier Houdé
Transcript of Fast logic? Examining the time course assumption of dual...

Fast logic? Examining the time course assumption of dual process
theory in reasoning.
Bence Bago
Cognitive Science Msc
Paris Descartes University
Laboratory for the Psychology of Child Development and Education
2015
Supervisor: Wim De Neys
Co-advisor: Olivier Houdé

2
Table of Contents Declaration of Originality ....................................................................................................................... 3
Declaration of Contribution ..................................................................................................................... 3
Abstract ................................................................................................................................................... 4
Introduction ............................................................................................................................................. 5
Experiment 1 ......................................................................................................................................... 10
Methods ............................................................................................................................................. 10
Participants .................................................................................................................................... 10
Materials ........................................................................................................................................ 10
Procedure ....................................................................................................................................... 12
Results ............................................................................................................................................... 18
Analysis strategy ........................................................................................................................... 18
Accuracy of final responses........................................................................................................... 18
Direction of change analysis ......................................................................................................... 19
Analyses of confidence ratings and response times ...................................................................... 20
Analysis of response latencies ....................................................................................................... 21
Analysis of confidence ratings ...................................................................................................... 23
Response stability analysis at individual level .............................................................................. 24
Discussion ......................................................................................................................................... 26
Experiment 2 – 4 ................................................................................................................................... 27
Methods ............................................................................................................................................. 27
Participants .................................................................................................................................... 27
Materials and procedure ................................................................................................................ 27
Results ............................................................................................................................................... 29
General discussion ................................................................................................................................. 30
Appendix 1. ........................................................................................................................................... 33
Appendix 2. ........................................................................................................................................... 34
Appendix 3. ........................................................................................................................................... 36
References: ............................................................................................................................................ 37

3
Declaration of Originality The aim of this study was to test the time course assumption behind the classic dual process
theory of reasoning. We wanted to examine whether people could generate logical responses
intuitively. This question was inspired by previous papers, but the available evidence was
found to be insufficient. In this study, we used a previously developed experimental
paradigm, the two response paradigm, to test the research question. A new analysis was
applied (direction of change analysis) to assure a direct test of the temporal assumptions of
dual process theory. In addition, we used a range of experimental methods to validate the two
response paradigm for the first time.
Declaration of Contribution I would like to gratefully thank Dr. Wim De Neys’ help on this thesis, who was my
supervisor. While the literature review, the programming of the experiments, the recruitment
of participants, online testing, and the statistical analysis were fully my work, he helped me
with several aspects of the research process. He helped me to identify the exact research
question, to determine the exact study design, and he proposed feedback on the experiments
before starting the testing phrase. He also kindly gave me feedback about the first drafts of the
written thesis, and helped me to identify grammatical and orthographical errors. Moreover, he
gave me advice concerning the style and the structure of the thesis, and he helped me with
theorizing the results of this study as well. I also want to say thanks to Eric Douglas Johnson
for his help in creating the instructions and stimuli for the cognitive load experiments, and
Bastien Trémolière, for his help familiarizing me with the Crowdflower surface. I would like
to express my gratitude to Oliver Houdé for hosting me in the lab. Finally, I would like to
thank the Ecole des Neurosciences de Paris organization for funding me during this
internship.

4
Abstract Decades of research on reasoning indicated that people’s thinking is often biased. The most
influential explanation for biased reasoning is put forward by the by the default interventionist
dual process theory; according to this theory people immediately produce a stereotype- or
belief- based type 1 heuristic response. Subsequently, slower, more deliberative type 2
processing might override the heuristic answer and result in the generation of the correct,
logical response. The aim of this study was to test this time course assumption of classic dual
process theory. We specifically wanted to see whether a logical response is only generated as
a result of slow, deliberative, type 2 processing. For this reason, we used the two response
paradigm, in which participants have to give an immediate, intuitive response, and afterwards
are given as much time as they want to indicate their final response (Experiment 1). Our key
finding is that we frequently observe correct, logical responses as the first, immediate
response. An analysis of reaction times, confidence ratings, and a control reading condition
supported the intuitive nature of the observed initial logical responses. In three additional
experiments we used a range of experimental procedures (Experiment 2: stringent response
deadline; Experiment 3: cognitive load manipulation; Experiment 4: both deadline and load
manipulation) to knock out type 2 processing and further establish that the initial logical
responses were truly intuitive in nature. Results were identical to the results of Experiment 1.
In sum, evidence was found that logical responding can occur as a result of fast, type 1
processing. We sketch a revised dual process model to account for the findings.

5
Introduction In the last few decades, a huge number of studies revealed that people do not follow
classic normative logical or probabilistic rules during reasoning. As an example, consider the
following question (De Neys & Glumicic, 2008):
“In a study 1000 people were tested. Among the participants there were 4 men and 996
women. Jo is a randomly chosen participant of this study. Jo is 23 years old and is finishing a
degree in engineering. On Friday nights, Jo likes to go out cruising with friends while
listening to loud music and drinking beer.
What is most likely?
a. Jo is a man
b. Jo is a woman”
On the basis of the base rate probabilities one should choose answer b, because there
are much more women than men in the sample. However, many studies have shown that
people tend to neglect the base rate probabilities. Participants typically base their choice on
the stereotypic information, thus most people believe and choose that Jo is a man. Several
similar biases of reasoning have been revealed and investigated so far in the literature
(Gilovich, Griffin, & Kahneman, 2002).
One of the possible explanations for this effect is presented by dual process theories of
thinking. According to these dual process theories, there are two different types of thinking:
type 1 and type 2 processes. Type 1 processing is fast, autonomous, does not require working
memory, operates unconsciously and immediately triggers an answer. Type 2 processing puts
a heavy load on working memory capacity, operates consciously, controlled and relatively
slow. The two types of processes are also often referred to as ‘intuitive’ or ‘heuristic’ and
‘deliberate’ or ‘analytical’ (Stanovich & Toplak, 2012). It is important to note that the above-
mentioned features of the systems are general labels, based on the traditional dual process
theories view. Dual process theory is an umbrella term; several kinds of dual process theories
exist. In this study, I focus on the influential classic default-interventionist view of dual
processes that has been advocated in the seminal work of Evans and Stanovich (2013) and
Kahneman (2011).

6
The standard assumption in the default-interventionist dual process (DI) framework is
that the automatic and fast type 1 process first produces a heuristic answer. Generation of the
heuristic answer might subsequently be followed by a deliberative, slow type 2 process, which
may result in a correction of the initial heuristic answer. Note that in cases - such as the
introductory reasoning problem - in which the initial heuristic response conflicts with the
correct logical1 response, the corrective type 2 thinking is believed to be critical to arrive at
the correct logical answer. In cases where the type 2 processing fails, the heuristic response
will not be corrected and the reasoner will end up giving the erroneous heuristic answer.
Thus, the expected dual process time course assumption is that reasoners will first generate a
heuristic answer and, if needed, will after additional reflection correct this to arrive at the
correct logical response.
Unfortunately, and perhaps somewhat surprisingly, there is little evidence in the
literature that allows us to directly validate this critical time course assumption. For example,
De Neys (2006a) found that it took participants more time to solve reasoning or heuristics and
biases tasks such as the introductory base-rate neglect problem if their answer was correct,
than if it was incorrect. One might argue that this finding is in agreement with the time course
assumption. However, this evidence does not entail the conclusion that correct reasoners
generated the incorrect answer first, and then they figured out the correct solution.
Evans & Curtis – Holmes (2005) used an experimental design in which people had to
judge the logical validity of reasoning problems under time pressure; one group of reasoners
were given only 2 seconds to answer, whereas a control group were allowed to take as much
time as they wanted to give an answer. An elevated percentage of incorrect answers was
found in the time pressure group. Hence, this also indicates that giving the correct response
requires time. However, this does not necessarily show that individuals who gave the correct
response in the free time condition generated the heuristic response first and corrected this
subsequently. It might be that reasoners engaged in type 2 thinking right away, without any
need to postulate an initial generation of a heuristic response.
1Note that I will be using the label “correct” or “logical” response as a handy shortcut to refer to “the response that
has traditionally been considered as correct or normative according to standard logic or probability theory”. The
appropriateness of these traditional norms has sometimes been questioned in the reasoning field (e.g., see
(Stanovich & West, 2000), for a review). Under this interpretation, the heuristic response should not be labeled as
“incorrect” or “biased”. For the sake of simplicity I stick to the traditional labeling. In the same vein, I use the term
“logical” as a general header to refer both to standard logic and probability theory.

7
Arguably, the most direct evidence has been given by experiments using the two
response paradigm (Thompson & Johnson, 2014; Thompson et al., 2011). In this paradigm,
participants are presented with a reasoning problem. They are instructed to respond as quickly
as possible with the first, intuitive response that comes to mind. Afterwards, they are
presented with the problem again, and they are given as much time as they want to think
about it and give a final answer. A key observation for our present purposes was that
Thompson and colleagues noted that people spent little time rethinking their answer in the
second stage and hardly ever changed their initial response. Note that the fact that people do
not change an initial heuristic response is not problematic for the dual process framework, of
course. It just implies that people failed to engage the optional type 2 processing. Indeed,
since such failures to engage type 2 are considered a key cause of incorrect responding, a
dominant tendency to stick to incorrect initial responses is little surprising from the classic
dual process stance. However, the lack of answer change tentatively suggest that in those
cases where a correct logical response was given as final response, the very same response
was generated from the start. Bluntly put, the logical response might have been generated fast
and intuitively based on mere type 1 processing. This would pose a major challenge for
standard dual process theory. Unfortunately, however, it cannot be excluded that Thompson et
al.’s participants engaged in type 2 processing when they gave their first, initial response.
Although Thompson et al. instructed participants to quickly give the first response that came
to mind, participants might have simply failed to respect the instruction and ended up with a
correct response precisely because they recruited type 2 thinking. Clearly, researchers have to
make sure that only type 1 processing is engaged at the initial response stage.
There is also some indirect evidence that could make one suspicious of the temporal
resolution assumption of the dual process. For example, De Neys (2015) argued that people
intuitively detect conflict between heuristic and logical basic logical principles. De Neys and
Glumicic (2008) gave a set of reasoning problems to participants, half of which were so-
called conflict problems in which a heuristically cued response conflicted with the correct
logical response . For the other half of the problems, the heuristically cued response and the
logical response were consistent. For example, the introductory base rate neglect problem that
I presented above was a conflict problem; the heuristically cued response is that Jo is a men
because of the provided stereotypic description, while the logical answer is that Jo is a women
because of the sample sizes. A no-conflict version of this problem can be constructed by
simply reversing the base rates (i.e., 997 men / 3 women). In this case the logical answer cued

8
by the base rates, and the heuristic answer, cued by the stereotype are pointing to the same
answer: Jo is a man. In a set of experiment De Neys and colleagues observed that the presence
of conflict affected people’s reasoning process. Even biased participants who failed to give
the correct response showed elevated response times (e.g., De Neys & Glumicic, 2008),
decreased post-decision confidence (e.g., De Neys, Cromheeke, & Osman, 2011; De Neys,
Rossi, & Houdé, 2013), and elevated skin resistance (De Neys, Moyens, & Vansteenwegen,
2010). De Neys argued that people detect the conflict between the heuristic answer and
logical principles intuitively. This would mean that there are two cued type 1 responses; one
is driven by beliefs or common stereotypes, and one is driven by logical or probabilistic
principles.
Related work by Handley and colleagues (e.g. Handley, Newstead, & Trippas, 2011;
Pennycook, Trippas, Handley, & Thompson, 2014) suggests that stereotypical beliefs can
interfere with logic in the early stadium of the decision process. According to the standard
dual-process model, people should process the belief-based heuristic response at the
beginning and then the logic-based information later. In opposition, they found that the logical
information is available to the reasoning process from the beginning, just as the stereotypic
information. These results also imply that type 1 processing is not only able to produce a
heuristic-based answer, but also a logic-based response as well. Furthermore, Banks & Hope
(2014) collected event-related potential data during a set of reasoning tasks. They found that
people process the logical validity and the believability of the problems simultaneously, at the
very beginning.
Additionally, Villejubert (2009) examined reasoning under time pressure. As people
have no time to engage in more analytical thinking, they were expected to rely mostly on their
cued heuristic answers, and produce more incorrect answers. This expected result was not
supported by the data; no significant difference has been found between the time pressured
group and the free time group. This finding could question the time course assumption as
well, and refer to the possibility that logical answer can be generated by type 1 answers.
Nonetheless, Villejubert (2009) used a 12 sec time limit in total, which might allow them to
engage in more deliberation. As well, this time limit is not based on reading times or any
empirical data, which might challenge this evidence.
However, the findings which support the logical intuition model are challenged (Klauer &
Singmann, 2013; Mata, Schubert, & Ferreira, 2014; Pennycook, Fugelsang, & Koehler, 2012;

9
Singmann, Klauer, & Kellen, 2014). Klauer and Singmann (2013) rightly emphasized that the
idea of logical intuition is in opposition with the classical view of dual process theories in
which a logical response must be the result of slow and effortful type 2 deliberation. Klauer
and Singmann (2013) pointed out that researchers have to be sure that empirical evidence is
not driven by any confound before one should be persuaded to revise the classic theory. Even
supporters of the logical intuition theory admit that this area is its infancy and further
validation and experimentation is required (De Neys, 2014).
Overall, previous literature has not provided sufficient evidence for the time course
assumption of dual process theories, and recent evidence challenged this presumption as well.
In this study we aimed to provide a direct test of the time course assumption of default-
interventionist dual process models. For this purpose, we used the two response paradigm.
Participants were asked to give an immediate first answer, and then they were allowed to take
as much time as they needed to give a final answer. Participants were also asked to indicate
their confidence level after both responses.
Default-interventionist (DI) dual process theory would predict that people always give
the heuristic answer for the first response, which is the incorrect answer in the case of conflict
problems. Afterwards, when sufficient time is allotted for type 2 processing to occur, they
might be able to correct their initial response and arrive at the correct answer. In sum,
according to standard DI theory there should be only two answer types: either incorrect for
first response – incorrect for second response or incorrect for first response – correct for
second response. Our key question is whether generation of a correct final response is indeed
preceded by generation of an initial incorrect response or whether people can generate the
correct logical answer for the first answer as well. This latter pattern would provide direct
evidence for the existence of fast, logical type 1 reasoning.
Critically, we wanted to make sure and validate that the first response that participants
gave only reflected the output of type 1 processing. For this reason, in four experiments we
used a combination of correlational and experimental techniques that allowed us to minimize
or control the impact of type 2 processing. In Experiment 1, we contrasted performance in a
reasoning condition with a baseline control condition in which participants merely read the
problems. In Experiment 2-4 we knocked out type 2 processing experimentally by imposing a
challenging response deadline (Experiment 2), a cognitive load task (Experiment 3), and even
a combination of both a response deadline and cognitive load (Experiment 4).

10
Finally, to check the generality of the findings, two different reasoning tasks were
used; a syllogistic reasoning and a base rate task. These were selected because of two reasons:
first, these tasks are highly popular in the research community and have inspired much of the
theorizing in the field. Furthermore, the tasks are different in the sense that different
normative systems are required to solve them correctly (standard logic for syllogistic
reasoning, and probability theory for base rate task). The differences or similarities between
the tasks will give us an indication of the generality of the findings.
Experiment 1
Methods
Participants
A total of 101 participants were tested (61 female, Mean age = 38.95, SD = 12.69) in
the actual experiment (i.e., reasoning condition). In a pretest, an additional 52 participants (31
female, Mean age = 44.13, SD = 13.2) were tested (i.e., reading condition; see further). The
participants were recruited via the Crowdflower platform, and received $0.30 for their
participation in the reasoning condition, and $0.11 in the reading condition. Only native
English speakers from the USA or Canada were allowed to participate in the study. The
distribution of highest educational properties of the samples can be found at Table 1.
Table 1. Distribution of highest educational level of participants across experimental conditions. Exact number of
people in parenthesis.
Experiment 1 Reading pretest
Less than high school 0% (0) 0% (0)
High school 48% (48) 40,4% (21)
Bachelor degree 41% (41) 46,2% (24)
Masters degree 7% (7) 9,6% (5)
Doctoral degree 4% (4) 3,8% (2)
Did not provide inf. 0,9% (1) 0% (0)
Materials
Base rates. Participants solved a total of eight base-rate problems. All problems were
taken from Pennycook et al. (2014). In the base rate tasks, participants always receive a
description of a sample, which includes two kinds of groups, for example, nurses/doctors,
women/men, librarians/high school students. In addition, participants received a stereotypic

11
description of a randomly drawn individual from the sample. Three kinds of base rates were
used: 997/3, 996/4, 995/5. The task was to indicate to which group the person most likely
belonged. Two kinds of items were used, conflict and no-conflict items. In no-conflict items
the base rate probabilities and the stereotypic information referred to the same group, while in
conflict items the stereotypic information referred to the smaller base rate group. Participants
solved a total of four conflict and 4 no-conflict items.
To minimize reading time influences on the reaction time, we used the “rapid response
base rate paradigm”, introduced by Pennycook et al., 2014). In this paradigm, the base rates
and descriptive information are presented serially, one-by-one. First, participants received the
names of the two groups, for example “this study contains clowns and accountants”, then they
receive a stereotypic information, which was a single word such us, “kind”, “funny”,
“strong”. Note that Pennycook et al. (2014) selected these specific words on the basis of
extensive pretesting to make sure that they were strongly associated with a member of the
group in question. Finally, participants received the base rate information. The items were
counterbalanced by changing the base rates (in one question set the incongruent items were
the congruent ones and vice-versa). The following illustrates the problem format:
This study contains clowns and accountants.
Person 'L' is funny.
There are 995 clowns and 5 accountants.
Is Person 'L' more likely to be:
o A clown
o An accountant
Each problem started with the presentation of a fixation cross for 1000 ms. After the
fixation cross disappeared, the sentence which specified the two groups appeared for 2000
msec. Then the stereotypic information appeared, for another 2000 ms, while the first
sentence remained on the screen. Finally, the last sentence specifying the base rates appeared
together with the question and two response alternatives. Once the question was presented
participants were able to select their answer by clicking on it. The position of the correct
answer alternative (i.e., first or second response option) was randomly determined for each
item. The eight items were presented in random order. An overview of the problem set can be
found in Appendix 1.
12
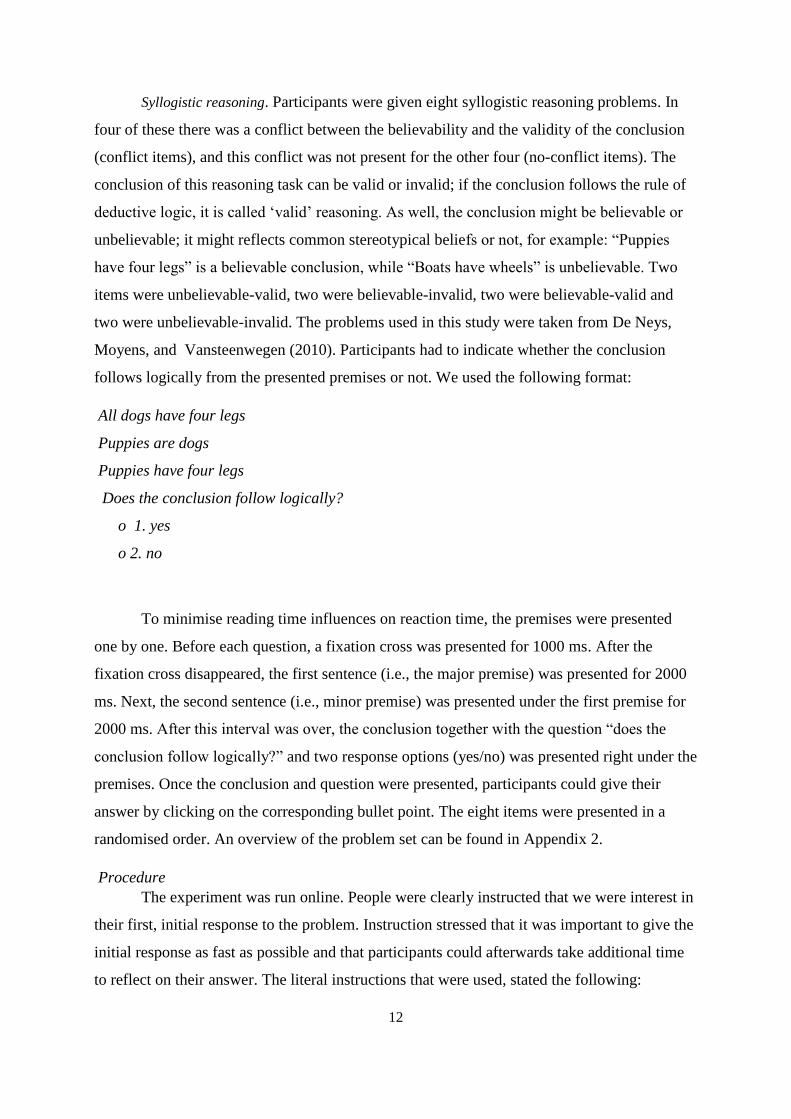
Syllogistic reasoning. Participants were given eight syllogistic reasoning problems. In
four of these there was a conflict between the believability and the validity of the conclusion
(conflict items), and this conflict was not present for the other four (no-conflict items). The
conclusion of this reasoning task can be valid or invalid; if the conclusion follows the rule of
deductive logic, it is called ‘valid’ reasoning. As well, the conclusion might be believable or
unbelievable; it might reflects common stereotypical beliefs or not, for example: “Puppies
have four legs” is a believable conclusion, while “Boats have wheels” is unbelievable. Two
items were unbelievable-valid, two were believable-invalid, two were believable-valid and
two were unbelievable-invalid. The problems used in this study were taken from De Neys,
Moyens, and Vansteenwegen (2010). Participants had to indicate whether the conclusion
follows logically from the presented premises or not. We used the following format:
All dogs have four legs
Puppies are dogs
Puppies have four legs
Does the conclusion follow logically?
o 1. yes
o 2. no
To minimise reading time influences on reaction time, the premises were presented
one by one. Before each question, a fixation cross was presented for 1000 ms. After the
fixation cross disappeared, the first sentence (i.e., the major premise) was presented for 2000
ms. Next, the second sentence (i.e., minor premise) was presented under the first premise for
2000 ms. After this interval was over, the conclusion together with the question “does the
conclusion follow logically?” and two response options (yes/no) was presented right under the
premises. Once the conclusion and question were presented, participants could give their
answer by clicking on the corresponding bullet point. The eight items were presented in a
randomised order. An overview of the problem set can be found in Appendix 2.
Procedure
The experiment was run online. People were clearly instructed that we were interest in
their first, initial response to the problem. Instruction stressed that it was important to give the
initial response as fast as possible and that participants could afterwards take additional time
to reflect on their answer. The literal instructions that were used, stated the following:

13
General instructions.
“Welcome to the experiment! Please read these instructions carefully!
This experiment is composed of 16 questions and a couple of practice questions. It will take
about 20 minutes to complete and it demands your full attention. You can only do this
experiment once.
In this task we'll present you with a set of reasoning problems. We want to know what your
initial, intuitive response to these problems is and how you respond after you have thought
about the problem for some more time. Hence, as soon as the problem is presented, we will
ask you to enter your initial response. We want you to respond with the very first answer
that comes to mind. You don't need to think about it. Just give the first answer that
intuitively comes to mind as quickly as possible. Next, the problem will be presented again
and you can take all the time you want to actively reflect on it. Once you have made up
your mind you enter your final response. You will have as much time as you need to
indicate your second response.
After you have entered your first and final answer we will also ask you to indicate your
confidence in the correctness of your response. In sum, keep in mind that it is really crucial
that you give your first, initial response as fast as possible. Afterwards, you can take as
much time as you want to reflect on the problem and select your final response. You will
receive $0.30 for completing this experiment. Please confirm below that you read these
instructions carefully and then press the "Next" button.”
All participants were presented with both the syllogistic reasoning and base-rate task
in a randomly determined order. After the general instructions were presented the specific
instructions for the upcoming task (base-rates or syllogisms) were presented. These
instructions were used:
Syllogistic reasoning.
“In this part of this experiment you will need to solve a number of reasoning problems. At
the beginning you are going to get two premises, which you have to assume being true. Then
a conclusion will be presented. You have to indicate whether the conclusion follows logically
from the premises or not. You have to assume that the premises are all true. This is very
important.
Below you can see an example of the problems.
Premise 1: All dogs have four legs
Premise 2: Puppies are dogs
Conclusion: Puppies have four legs
Does the conclusion follow logically?
1. yes
2. no
The two premises and the conclusion will be presented on the screen one by one. Once the
conclusion is presented you can enter your response.
As we told you we are interested in your initial, intuitive response. First, we want you to
respond with the very first answer that comes to mind. You don't need to think about it. Just
give the first answer that intuitively comes to mind as quickly as possible. Next, the problem
will be presented again and you can take all the time you want to actively reflect on it. Once
you have made up your mind you enter your final response. After you made your choice and
clicked on it, you will be automatically taken to the next page. After you have entered your
first and final answer we will also ask you to indicate your confidence in the correctness of
your response. Press "Next" if you are ready to start the practice session!”

14
Base rate task.
“In a big research project a large number of studies were carried out where a psychologist
made short personality descriptions of the participants. In every study there were participants
from two population groups (e.g., carpenters and policemen). In each study one participant
was drawn at random from the sample. You’ll get to see one personality trait of this
randomly chosen participant. You’ll also get information about the composition of the
population groups tested in the study in question. You'll be asked to indicate to which
population group the participant most likely belongs. As we told you we are interested in
your initial, intuitive response. First, we want you to respond with the very first answer that
comes to mind. You don't need to think about it. Just give the first answer that intuitively
comes to mind as quickly as possible. Next, the problem will be presented again and you can
take all the time you want to actively reflect on it. Once you have made up your mind you
enter your final response. After you made your choice and clicked on it, you will be
automatically taken to the next page. After you have entered your first and final answer we
will also ask you to indicate your confidence in the correctness of your response.
Press "Next" if you are ready to start the practice session!”
After the task specific instructions, participants were familiarized with the task and
solved two practice problems. Then they were able to start the experiment. For the first
response people were instructed to give a quick, intuitive response. After they clicked on the
answer, they were asked to give their confidence in their answer, in a sale from 0 to 100, with
the following question: “How confident are you in your answer? Please type a number from 0
(absolutely not confident) to 100 (absolutely confident)”. Next, they were presented with the
problem again, and they were told that they could take as much time as they needed to give a
final answer. As a last step, they were asked to give the confidence in their final answer. The
colour of the actual question and answer options were green during the first response, and
they were blue during the second response phase, to visually remind participants which
question they were answering at the moment. For this purpose, right under the question a
reminder sentence was placed: “Please indicate your very first, intuitive answer!” and “Please
give your final answer.” respectively.
The order of presenting base rate and syllogistic reasoning tasks was randomized.
After participants finished the first task they could briefly pause, were presented with the
instructions and practice problems of the second task, and started the second task. For both the
base-rate and syllogistic reasoning task two different problem sets were used. The conflict
items in one set were the no-conflict items in the other, and vice-versa. This was done by
reversing the base-rates (base-rate task) or by switching the conclusion and minor premise
(syllogisms). Each of the two sets was used for half of the participants. Appendix 2 gives an
overview of all problems in each of the sets. This counterbalancing ruled out the possibility

15
that mere content or wording differences between conflict and no-conflict items could
influence the results. At the end of the study participants were asked to answer demographic
questions.
Reading pretest
In the reading pretest participants were presented with each of the base-rate and base-
rate neglect problems but were simply asked to read the problems. The basic goal of this
reading condition was to have a raw baseline against which the intuitive or type 1 nature of
the response times for the first response in the actual reasoning condition could be evaluated2.
Participants were instructed that the goal of the study was to determine how long people
needed to read item materials. They were instructed that there was no need for them to try to
solve the problems and simply needed to read the items in the way they typically would.
When they were finished reading, they were asked to randomly click on one of the presented
response options to advance to the next problem. Presentation format was the same as in the
actual reasoning condition presented above. The only difference was that the problem was not
presented a second time and participants were not asked for a confidence rating. To make sure
that participants would be motivated to actually read the material we told them that we would
present them with two (for both tasks, four in sum) very easy verification questions at the end
of the study to check whether they read the material. The literal instructions were as follows:
General introduction.
“Welcome to the experiment! Please read these instructions carefully! This experiment is
composed of 16 questions and 4 practice questions. It will take 5 minutes to complete and it
demands your full attention. You can only do this experiment once. In this task we'll present
you with a set of problems we are planning to use in future studies. Your task in the current
study is pretty simple: you just need to read these problems. We want to know how long
people need on average to read the material. In each problem you will be presented with two
answer alternatives. You don’t need to try to solve the problems or start thinking about them.
Just read the problem and the answer alternatives and when you are finished reading you
randomly click on one of the answers to advance to the next problem. The only thing we ask
of you is that you stay focused and read the problems in the way you typically would. Since
we want to get an accurate reading time estimate please avoid whipping your nose, taking a
phone call, sipping from your coffee, etc. before you finished reading. At the end of the study
we will present you with some easy verification questions to check whether you actually read
the problems. This is simply to make sure that participants are complying with the
instructions and actually read the problems (instead of clicking through them without paying
attention). No worries, when you simply read the problems, you will have no trouble at all at
answering the verification questions.
2 Note that as many critics have argued, dual process theories are massively underspecified in this respect. The
theory only posits that type 1 processes are relatively faster than type 2 processes. However, no criterion is
available that would allow us to a priori characterize a response as a type 1 response in an absolute sense (i.e.,
faster than x seconds = type 1). Our reading baseline provides a practical validation criterion.

16
You will receive $0.11 for completing this experiment. Please confirm below that you read
these instructions carefully and then press the "Next" button.”
Specific instructions before the syllogistic items started:
“In the first part of this experiment you will need to read a specific type of reasoning
problems. At the beginning you are going to get two premises, which you have to assume
being true. Then a conclusion, question and answer alternatives will be presented. We want
you to read this information and click on any one of the two answers when you are finished.
Again, no need to try to solve the problem. Just read it. Below you can see an example of the
problems.
Premise 1: All dogs have four legs
Premise 2: Puppies are dogs
Conclusion: Puppies have four legs
Does the conclusion follow logically?
1. yes
2. no
The two premises and the conclusion will be presented on the screen one by one. Once the
conclusion is presented, you simply click on one of the answer alternatives when you
finished reading and the next problem will be presented. Press "Next" if you are ready to
start a brief practice session!”
Specific instructions before the base rate items started:
“This is the first part of this experiment. In a big research project a large number of studies
were carried out where a psychologist made short personality descriptions of the participants.
In every study there were participants from two population groups (e.g., carpenters and
policemen). In each study one participant was drawn at random from the sample. You’ll get
to see one personality trait of this randomly chosen participant. You’ll also get information
about the composition of the population groups tested in the study in question. Then, a
question to indicate to which population group the participant most likely belongs will
appear. We simply want you to read this question and the two answer alternatives. Once you
finished reading this, you simply click on either one of the answer alternatives and then the
next problem will be presented. Again no need to try to solve the problem, just read the
question and simply click on either one of the answers when you are finished. Press "Next" if
you are ready to start a brief practice session!”
An example of the verification question for syllogistic reasoning:
“We asked you to read the conclusions of a number of problems. Which one of the following
conclusions was NOT presented during the task:
Whales can walk
Boats have wheels
Roses are flowers
Waiters are tired”

17
An example of the verification question for the base rate task:
“We asked you to read problems about a number of population groups. Which one of the
following combination of two groups was NOT presented during the task:
Nurses and artists
Man and woman
Scientists and assistants
Cowboys and Indians”
The verification questions were constructed such that a very coarse reading of the
problems would suffice to recognize the correct answer. Note that 94% of the verification
questions were solved correctly, which indicates that by and large, participants were
minimally engaged in the reading task. Only those participants were analysed, who correctly
solved both verification question regarding one task.
In sum, the reading condition should give us a baseline against which the reasoning
response times for the initial response can be evaluated. Any type 1 response during reasoning
also minimally requires that the question and response alternatives are read and participants
move the mouse to select a response. The reading condition allows us to partial out the time
needed for these two components. In other words, the reading condition will gives us a raw
indication of how much time a type 1 response should minimally take. That is, if participants
in the reasoning condition do not comply with the instructions and engage in time-consuming
additional type 2 thinking before giving a first response, the response times for the initial
response in the reasoning condition will be substantially longer than the reading time.
However, if the initial reasoning responses do not differ from mere reading times, this will
provide a strong validation of the intuitive nature of the initial responses.
Results3 showed that the average first response time in the reasoning condition did not
differ from the average reading times in the syllogistic reasoning condition (b = 0.02 t (484) =
0.996, p = 0.32). Regarding the base rate problems, there was significant difference between
3 Note that for this analysis, we used mixed effect models, where the ID of the participants were entered as a
random effect factor to the model. Rationale for this analysis can be found under the subsection: “Analysis of
confidences and response times”.

18
the two condition (b = 0.07, t (495) = 2.89, p = 0.004), but mean reading times were longer
(M = 3.02 sec, SD = 1.99) than mean reasoning times (M = 2.62 sec, SD = 1.97).
Results
Analysis strategy
Our primary interest in the present study is what we will refer to as “Direction of
Change” analysis for the conflict items. By direction of change, we mean the way or direction
in which a given person in a specific trial changed (or didn’t change) her initial answer during
the rethinking phase. More specifically, people can give a correct or incorrect response in
each of the two response stages. Hence, in theory this can result in four different types of
answer change patterns: 1) a person could either give the incorrect (heuristic) answer as the
first response , and then change to the correct (logical) answer as the final response (we will
use the label “01” to refer to this type of change pattern), 2) one can give the incorrect answer
as the first response and final response (we use the label “00” for this type of pattern), 3) one
can give the correct answer as the first response and change to the incorrect response as the
final response (we use the label “10” for this type of pattern), and 4) one can give the correct
answer for the first and final response (we use the label “11” for this pattern). To recap, we
will use the following labels to refer to these four types of potential answer change patterns:
“01” (i.e., response 1 incorrect, response 2 correct), “00” (i.e., response 0 incorrect, response
2 incorrect), “10” (i.e., response 1 correct, response 2 incorrect), and “11” (i.e., response 1
correct, response 2 correct).
This presentation strategy allows us to look at the frequency of each type of direction
of change pattern and analyse response times and response confidence for each of them.
Accuracy of final responses
However, for consistency with previous work we first present the response accuracies
for the final response. Table 2 gives an overview of the results. As the table indicates,
accuracies are in line with previous studies that adopted a single response paradigm. Both for
the base-rate χ2(1) = 179.67, p < .0001 and syllogistic reasoning task χ2(1) = 21.73, p < .0001,
performance was significantly better in the no-conflict than in the conflict problems. By and
large, this indicates that the two response paradigm did not alter the nature of the reasoning
task. Final response accuracies are in line with what can be expected to be observed in a
classic single response paradigm.
19
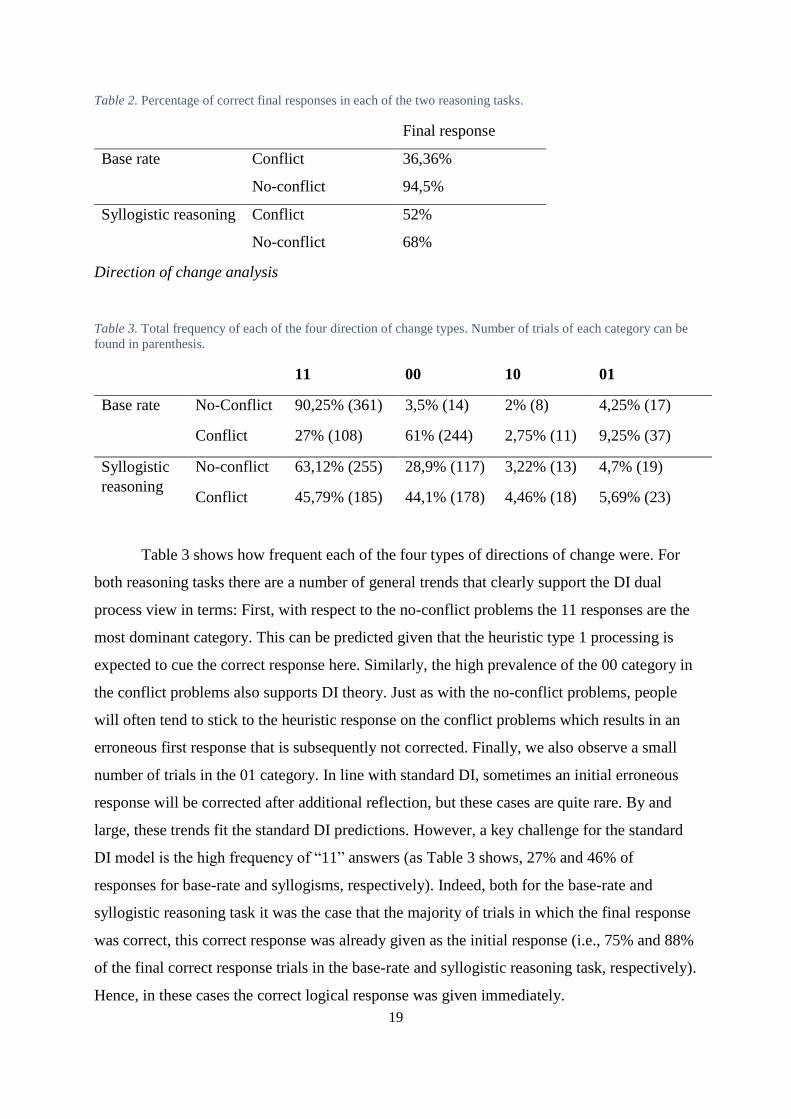
Table 2. Percentage of correct final responses in each of the two reasoning tasks.
Final response
Base rate Conflict 36,36%
No-conflict 94,5%
Syllogistic reasoning Conflict 52%
No-conflict 68%
Direction of change analysis
Table 3. Total frequency of each of the four direction of change types. Number of trials of each category can be
found in parenthesis.
11 00 10 01
Base rate No-Conflict 90,25% (361) 3,5% (14) 2% (8) 4,25% (17)
Conflict 27% (108) 61% (244) 2,75% (11) 9,25% (37)
Syllogistic
reasoning
No-conflict 63,12% (255) 28,9% (117) 3,22% (13) 4,7% (19)
Conflict 45,79% (185) 44,1% (178) 4,46% (18) 5,69% (23)
Table 3 shows how frequent each of the four types of directions of change were. For
both reasoning tasks there are a number of general trends that clearly support the DI dual
process view in terms: First, with respect to the no-conflict problems the 11 responses are the
most dominant category. This can be predicted given that the heuristic type 1 processing is
expected to cue the correct response here. Similarly, the high prevalence of the 00 category in
the conflict problems also supports DI theory. Just as with the no-conflict problems, people
will often tend to stick to the heuristic response on the conflict problems which results in an
erroneous first response that is subsequently not corrected. Finally, we also observe a small
number of trials in the 01 category. In line with standard DI, sometimes an initial erroneous
response will be corrected after additional reflection, but these cases are quite rare. By and
large, these trends fit the standard DI predictions. However, a key challenge for the standard
DI model is the high frequency of “11” answers (as Table 3 shows, 27% and 46% of
responses for base-rate and syllogisms, respectively). Indeed, both for the base-rate and
syllogistic reasoning task it was the case that the majority of trials in which the final response
was correct, this correct response was already given as the initial response (i.e., 75% and 88%
of the final correct response trials in the base-rate and syllogistic reasoning task, respectively).
Hence, in these cases the correct logical response was given immediately.

20
Note that taken together, these results also support Thompson et al. (2011) earlier
observations that indicate that people mostly stick to their initial response and rarely change
their answer regardless whether it was correct or not. However, the key finding of the present
direction of change analysis is the high prevalence of “11” response. This tentatively suggests
that in those cases where people arrive at a correct final response, the correct response was
already generated intuitively.
Analyses of confidence ratings and response times
By examining response latencies and confidence for the four different types of
direction of change categories, one can get some further insight in the reasons behind people
answer change (or lack thereof).
Results are presented in Figure 1-4. Visual inspection of the figure suggests a clear and very
similar pattern across both tasks.
With respect to latencies of syllogistic reasoning. The results for the first response
latencies suggest that response times for 11, 00, and 01 were very similar and fast (within 3 s).
Latencies for the few 10 response were clearly deviant and were considerably longer,
suggesting that participants did not respect the instruction and that the correct initial response
resulted from slower type 2 thinking. Latencies for the second responses were similar and fast
for the 00, 11 and 10 cases. This indicates that participants spent little time rethinking their
answer. The clear exception here were the 01 cases. Response 2 latencies were clearly much
longer here. This fit with the assumption that the correct final response results from additional
type 2 processing.
These results are further supported by the confidence findings. As Figure 3 and Figure
4 shows, the 00 and 11 case show very high confidence both for Response 1 and Response 2.
Confidence for the 01 and 10 cases is much lower for both responses. Hence, the initial
response in the 00 and 11 cases was given fast and with very high confidence. The 01 first
response was also given quickly, but with much lower confidence, and was subsequently
changed after considerable additional processing time.
Regarding base rate condition: confidence and latency pattern was very similar, but
one might note that in this task the 11 latencies for the first response tended to take slightly
longer than those for 00 responses.

21
Note that the horizontal dotted lines in Figure 1 and Figure 2 represent the average
reading time of participants in our reading condition baseline. As the figures indicates, except
for the rare 10 case in the syllogistic reasoning task, response 1 reading times were about
equal or faster than the mere reading times4. By and large this, supports the claim that
participants respected the instructions and gave the first response purely intuitively without
additional time-consuming deliberation.
We used the nlme statistical package in R to create mixed effect multi-level models
(Pinheiro, Bates, Debroy, & Sarkar, 2015). This allows us to analyse the data in a trial-by-trial
basis, while accounting for the random effect of subjects (Baayen, Davidson, & Bates, 2008).
Mixed effect models have increased statistical power due to the inclusion of random effects,
and the ability to handle data which violates the assumption of homoscedasticity (Baayen et
al., 2008). The direction of change category and the response number (first or final response)
were entered to the model as fixed effect factors, and the ID of the participants was entered as
a random factor.
Analysis of response latencies
We analysed latencies as a function of response number (first or final response) and direction
of change category (00, 11, 01, 10). We ran a separate analysis for each of the two reasoning
tasks. Means and standard deviations of confidence ratings and response latencies can be
found in Appendix 3.
Regarding syllogistic reasoning response latencies, the main effect of direction of change
χ2(9) = 19.97, p = .0002 and the interaction between direction of change and response
number χ2 (12) = 17.86, p = .0005 significantly improved model fit (Figure 1), but the main
effect of response number did not χ2 (6) = 0.026, p = .8716. As Figure 1 and our visual
inspection suggested this indicates that participants did not think for equal time among the
direction of change categories (main effect of direction of change). Moreover, the significant
interaction means that difference between response 1 and response 2 is not equal among
direction of change categories. This confirm our visual inspection that the final response took
longer than first responses in 01 category, but not in 11 or 00 categories.
4 As we noted in the method section, for both tasks it was the case that average response 1 latencies and reading
times did not differ significantly, except in the case of base rates, when reading took them longer, then
reasoning.

22
Figure 1. Average response times (logarithmically transformed) for the first and second response for each of the four types of
direction of change categories in syllogistic reasoning. The dashed horizontal line represents the average reading time for
these problems in the reading baseline condition.
Analysis of base rate neglect response time revealed that only the direction of change
significantly improved model fit χ2(9) = 10.43, p = .015, but response number χ2(6) = 0.08, p
= .731 did not. The interaction between both factors reached marginal significance, χ2(12) =
7.23, p = .0648 (Figure 2). This pattern also confirms the visually observed trends.
Figure 2. Average response times (logarithmically transformed) for the first and second response for each of the four types of
direction of change categories in base rate task. The dashed horizontal line represents the average reading time for these
problems in the reading baseline condition.

23
Finally, it was important for us to compare 11 and 00 response latencies at time 1,
given that it is possible, that correct reasoners did not follow the instructions and arrived at a
correct initial response because they simply took additional time to deliberate and engage type
2 processing. Our reading time control condition already minimized this possibility but an
additional test can be to contrast the response 1 reasoning times for the 00 and 11 responses
directly. A simple effect analysis indicated that there was no significant difference regarding
the syllogistic reasoning task (b = -0.05, t (296) = -1.44, p = 0.15), but significant difference
was found in the base rate task (b = -0.1, t (188) = -2.26, p = .02). Hence, this indicates that in
in the base rate task, initial 11 answers are somewhat slower than 00 answers. Despite the
reading findings, this might imply that initial correct responses in the 11 base rate case
resulted from some minimal type 2 thinking. However, it might also be the case that logical
type 1 base-rate intuitions are slightly slower than heuristic type 1 base-rate intuitions. The
experimental controls in Experiment 2-4 will allow us to eliminate any potential impact of
type 2 processing completely.
Analysis of confidence ratings
Only the main effect of direction of change had a significant effect on syllogistic
reasoning confidence ratings χ2(9) = 39.08, p < .0001, while neither the main effect of
response number χ2(6) = 3.38, p = .066, neither the interaction improved significantly model
fit χ2(12) = 4.19, p = .241. Hence, as the visual inspection suggested, in trials when the answer
was changed, participants were less confident in their initial and in their final response as
well, than in 11 and 00 categories.
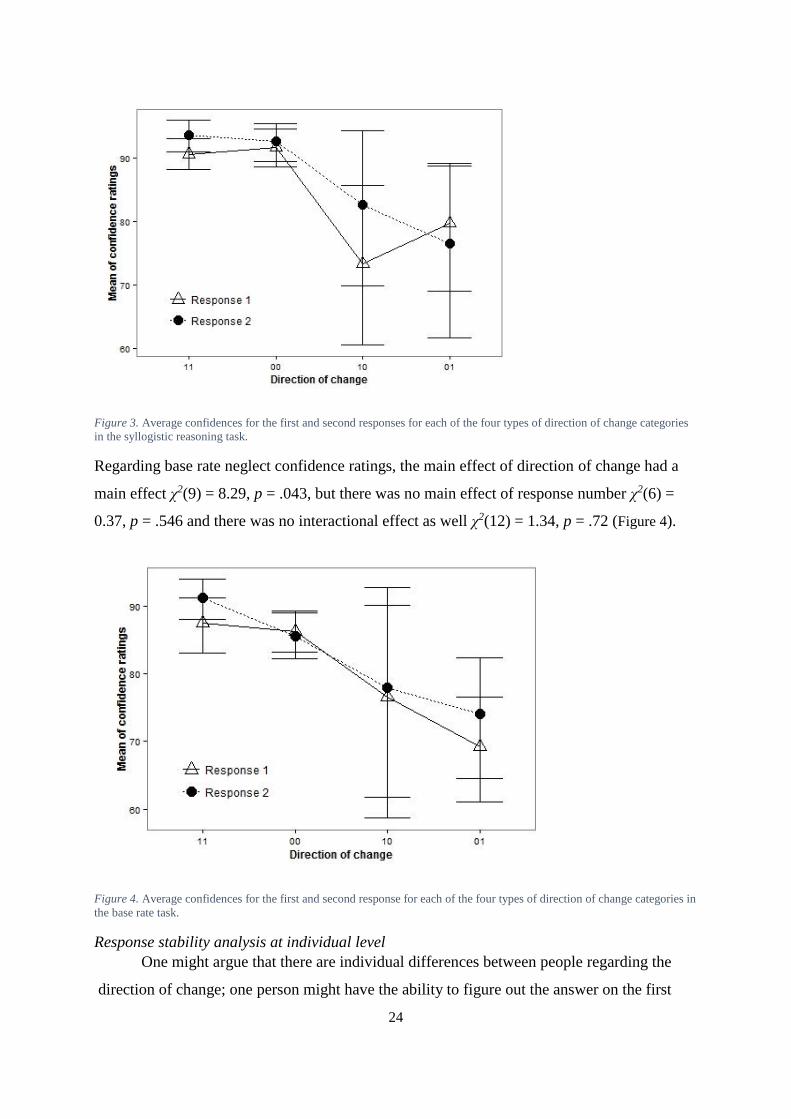
24
Figure 3. Average confidences for the first and second responses for each of the four types of direction of change categories
in the syllogistic reasoning task.
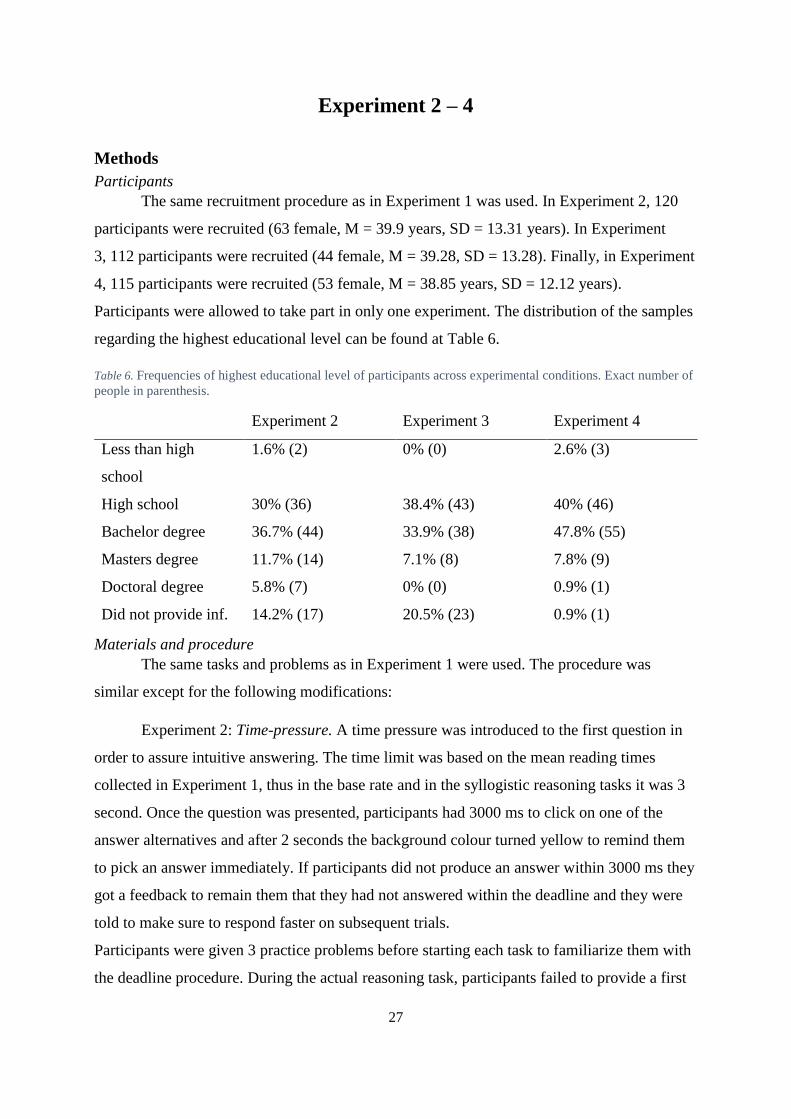
Regarding base rate neglect confidence ratings, the main effect of direction of change had a
main effect χ2(9) = 8.29, p = .043, but there was no main effect of response number χ2(6) =
0.37, p = .546 and there was no interactional effect as well χ2(12) = 1.34, p = .72 (Figure 4).
Figure 4. Average confidences for the first and second response for each of the four types of direction of change categories in
the base rate task.
Response stability analysis at individual level
One might argue that there are individual differences between people regarding the
direction of change; one person might have the ability to figure out the answer on the first

25
response, one might have the ability to change from the incorrect to the correct, etc. Thus,
one can compute a dominant category index, which refers to the direction of change category
which is most frequent for each individual. For example, if an individual out of the four
conflict problems that she solved, shows three times a 11 pattern and one 00 pattern the
individual would be labelled a “dominant 11” individual. If no pattern was observed, or two
patterns were observed equally often the individual would be labelled as a “no dominant
category” individual. Table 4 shows the results. As the table indicates we replicate the pattern
we observed in the item based analysis at the individual level. The most frequent categories
are the 00 and 11 categories. Table 5 further indicates that the type of change is pretty stable
at the individual level. The table shows the percentage of participants who displayed the
same direction of change type on 100% (4/4), 75%, 50%, or 25% of trials. As the table shows
the majority of participants displayed the exact same type of change on 3 out of 4 conflict
problems. This indicates that the type of change is fairly stable at the individual level. In
addition, we also would like to know whether people are stable in their dominant category,
which means the percentage of trials belong to the dominant category. These calculations
were applied to the base rate and syllogistic reasoning tasks separately, and the incongruent
problems were used only.
Table 4. Frequencies of dominant categories for each direction of change categories.
11 00 10 01 No dominant
category
Base rate 25,74% 60,39% 0,99% 4,95% 7,92%
Syllogistic
reasoning
27,72% 40,59% 0,99% 2,97% 27,72%
Table 5. Total frequency of stability indexes for each direction of change categories.
25% 50% 75% 100%
Base rate 2% 14% 21% 63 %
Syllogistic
reasoning
1,98% 40,59% 39,6% 17,82%

26
Discussion
In experiment 1, the time course assumption of DI dual process theory was tested. On
one hand, some of the results were in agreement with the classic DI account: 00 and 01
response patterns were found. On the other hand, other results did not support the classic DI
model; we observed a high proportion of 11 responses. Furthermore, the analysis of response
latencies revealed that people produce an equally quick first answer in 11, 00 and 01 groups in
the syllogistic reasoning task, while in 11 cases, they were very confident in their initial
answer. These results suggest that in the 11 condition, participants have produced the logical
answer intuitively. Furthermore, stability and dominant category analysis revealed that people
produce stable answer patterns, which can be interpreted as stable individual differences.
The results of Thompson and Johnson (2014); Thompson et al. (2011) have been also
replicated since people were able to produce the normative answer intuitively. However,
Pennycook and Thompson (2012) examined only the base rate task, and argued that people
are equally likely to change from the heuristic to the logical answer than to change from the
logical to the heuristic answer, which is not supported by the base rate neglect data, but
supported by the syllogistic reasoning results. Similarly, Pennycook and Thompson (2012)
found that 53.8% of the participants changed their answers in the conflict problems, while in
this study only 11% of the participants changed their answer, which difference may be due to
the difference in experimental strategy as Pennycook and Thompson asked participants to
give probability estimations instead of asking them to directly choose between the two
options.
However, the reaction time results in the syllogistic reasoning task were not
completely replicated in the base rate task, where we only found a marginally significant
interaction between response times and direction of change category and observed a
difference between 11 and 00 responses at time 1. This could mean that 11 people engaged in
type 2 thinking at time 1. Even though, reading times were longer or at least not different
from reasoning tasks, which could confirm that participants did not engage in deliberation
during time 1. Nevertheless, this does not fully rule out the possibility of type 2 engagement
at response 1. For this reason, the results of this study have to be validated before drawing any
conclusion. In experiment 2-4 we further examined this research question by adding time
pressure in response 1 and introducing cognitive load.
27
Experiment 2 – 4
Methods
Participants
The same recruitment procedure as in Experiment 1 was used. In Experiment 2, 120
participants were recruited (63 female, M = 39.9 years, SD = 13.31 years). In Experiment
3, 112 participants were recruited (44 female, M = 39.28, SD = 13.28). Finally, in Experiment
4, 115 participants were recruited (53 female, M = 38.85 years, SD = 12.12 years).
Participants were allowed to take part in only one experiment. The distribution of the samples
regarding the highest educational level can be found at Table 6.
Table 6. Frequencies of highest educational level of participants across experimental conditions. Exact number of
people in parenthesis.
Experiment 2 Experiment 3 Experiment 4
Less than high
school
1.6% (2) 0% (0) 2.6% (3)
High school 30% (36) 38.4% (43) 40% (46)
Bachelor degree 36.7% (44) 33.9% (38) 47.8% (55)
Masters degree 11.7% (14) 7.1% (8) 7.8% (9)
Doctoral degree 5.8% (7) 0% (0) 0.9% (1)
Did not provide inf. 14.2% (17) 20.5% (23) 0.9% (1)
Materials and procedure
The same tasks and problems as in Experiment 1 were used. The procedure was
similar except for the following modifications:
Experiment 2: Time-pressure. A time pressure was introduced to the first question in
order to assure intuitive answering. The time limit was based on the mean reading times
collected in Experiment 1, thus in the base rate and in the syllogistic reasoning tasks it was 3
second. Once the question was presented, participants had 3000 ms to click on one of the
answer alternatives and after 2 seconds the background colour turned yellow to remind them
to pick an answer immediately. If participants did not produce an answer within 3000 ms they
got a feedback to remain them that they had not answered within the deadline and they were
told to make sure to respond faster on subsequent trials.
Participants were given 3 practice problems before starting each task to familiarize them with
the deadline procedure. During the actual reasoning task, participants failed to provide a first

28
response within the deadline on 12 % of the trials. These missed trials were discarded and
were not included in the reported data.
Experiment 3: Load condition. In this condition, we used a visuospatial working
memory load task, the dot memorization task (Miyake, Friedman, Rettinger, Shah, & Hegarty,
2001), to burden participants executive cognitive resources. The idea behind load
manipulation is that Evans and Stanovich (2013) argued that the defining feature of type 1
processing that it does not demand cognitive load; hence if we burden cognitive load, we
reduce the possibility to engage in analytic thinking (De Neys, 2006; De Neys & Schaeken,
2007; Franssens & De Neys, 2009).
In every trial, after the fixation cross disappeared, participants were shown to a three
by three matrix, in which 4 dots were presented (see Figure 5) for 2000 ms. Participants were
instructed to memorize this pattern. After the matrix disappeared, they had to indicate their
first response and their first confidence. After this, they were shown 4 matrices with different
dot patterns and they had to select the correct, to-be-memorized matrix. Participants were
given feedback as to whether they recalled the correct matrix or not. There was no time limit
on neither responses. Trials on which an incorrect matrix was selected (11% of trials) were
removed from the analysis.
Before the actual experiment they had to solve a set of practice questions. First, they
received a reasoning problem (base rate or syllogistic reasoning) which was identical to the
practice question used in Experiment 1. After, participants were presented to a cognitive load
practice question – they were simply presented to a dot pattern for 2000 ms, and after it
disappeared they could identify the pattern from the four presented options. As a last step,
they were presented to two more practice reasoning problems, which included the cognitive
load and the reasoning problem in the two response paradigm format as well.
Experiment 4. Load and time pressure. In this condition, the same working memory
load task was applied as in Experiment 3, the only exception was that participants had to
answer both questions and confidence ratings under load.
In this experiment they had the same time limit for the first answer as in experiment 2. Trials
on which an incorrect matrix was selected (12% of trials) were removed from the analysis.
Practice problems were identical to Experiment 3, the only exception was the applied time
limit. Time limit for the first responses was applied to each practice problems. 6.3% of the

29
first responses was remained unanswered due to the time limit. In sum, 16.7% of the trials
were excluded from the analysis.
Figure 5. An example for the dot pattern, which participants had to memorize.
Results
The analysis was identical to the one applied in Experiment 1. We repeated it in the
next 3 experiments. Regarding experiment 2 and 3, only those trials were analysed when the
participant correctly solved the dot memorization task. In the load + time pressure condition
the 88% of the answers were correct, while in the load condition 89% of the answers were
correct. For easy of presentation we focus here on the key results concerning the direction of
change analysis.

30
Table 7. Total frequency of each of the four direction of change types, presented for each experiments. Number of
trials of each category can be found in parenthesis.
The results of experiment 2-4 are very clear. We basically observe the same pattern that was
observed in Experiment 1. Although we used 3 different methods to eliminate the impact of
type 2 thinking on the first response stage, the key finding that challenged DI theory in
Experiment 1, a considerable proportion of 11 responses – is still observed. Indeed, if
anything the proportion of 11 responses tended to be slightly higher in Experiment 2-4 than in
Experiment 1. This directly established that the initial correct logical responses that we
identified in these set of experiments result from purely intuitive, type 1 processing.
General discussion In this study, we examined the standard time course assumption of classic DI theory.
DI theory suggest that people should produce a heuristic-based type 1 response by default,
and then they might override the heuristic answer and produce a logic-based type 2 response.
Hence, a key claim is that logical responding must originate from slow, deliberative type 2
processing. Our results did not fully support this expected time course pattern. In four
experiments, we found evidence for the existence for intuitively generated logical responses.
Our direction of change analysis revealed that 11 responses occurred very frequently, and
people barely changed their initial answer. Answers in the 11 and 00 categories were given
11 00 10 01
Base rate Experiment 1 27% (108) 61% (244) 2.75% (11) 9.25% (37)
Time pressure 25.1% (92) 59.9% (217) 4.4% (16) 11.2% (41)
Load 38.8% (122) 52.5% (179) 2.3% (8) 9.4% (32)
Time pressure
+Load
32.7% (127) 53.4% (207) 3.1% (13) 10.7% (41)
Syllogistic
reasoning
Experiment 1 45.79% (185) 44.1% (178) 4.46% (18) 5.69% (23)
Time pressure 49% (175) 40.1% (143) 5.6% (20) 5.3% (19)
Load 54.6% (185) 35.4% (120) 4.1% (14) 5.9% (20)
Time pressure
+ Load
56.8% (219) 35.5% (137) 3.1% (12) 4.7% (18)

31
very quickly both for time 1 and time 2, with a relatively high confidence. The rare 01
responses were given quickly but with low confidence at time 1. The final response for this 01
category was given slower but also with relatively low confidence. The existence of 00 and 01
responses was expected by the classic dual process view. However, the robust 11 responses
are problematic for the classic DI theory. How might one interpret these results?
One possible explanation is offered by the logical intuition model (De Neys, 2012,
2014). This idea suggests that people intuitively detect the conflict between heuristic
responses and standard logical principles. The original idea is that conflict is caused by two
simultaneously activated type 1 responses, one is based on normative rules, another is based
on heuristic cues. Furthermore, De Neys (2014) suggested that this theory does not entail that
the two type 1 responses are similar in their strength. More specifically, the idea is that people
are biased because they their belief-based heuristic response is more salient or has a higher
activation level (i.e., is “stronger”) than the intuitive logical response. The results of this study
can be interpreted in the light of this logical intuition theory; It is possible that for 11
responses the logic-based type 1 response gained more strength, while in the case of 00
responses the heuristic-based response had more strength. That is different individuals might
differ in the relative strength of the two type of intuitions. Although everyone generates the
two intuitions, some people will have a stronger heuristic intuition (00 cases) and others will
have a stronger logical intuition (11). An evidence for this theory is that these answers were
equally quick, and people were similarly very confident in their responses.
Interestingly, Thompson and Johnson (2014) previously found that IQ was correlated
with normative responding at time 1. This could implicate for example that for high capacity
reasoners the logical type 1 response is stronger. In contrast, for low capacity reasoners the
heuristic-based response might be strongest. This is somewhat supported by our individual
level analysis, where it was found that most of the participants can be categorized into one
direction of change category, and they were found to be very consistent in their answers
across items. However, more research will be required to reveal other possible psychological
factors which could be responsible for individual differences in the strength of the different
type 1 answers. Similarly, “strength” of a response is an undefined concept at the moment,
more theorizing will be necessary to develop this model.
Another important issue regarding this research is that we used various research
designs to assure the validity of the two response paradigm. A limitation of the original tow

32
response paradigm was that researches could not be sure that there is no type 2 engagement
during time 1. By using cognitive load and time pressure manipulations, we virtually
eliminated the possibility of type 2 engagement at the initial response stage. However, note
that ultimately one might never be sure that first response is really intuitive, given that we do
not know how much time (or cognitive resources) is specifically required to produce a type 1
response. But at the very least one can be assured that the probability of type 2 engagement at
time 1 is highly decreased due to the above mentioned manipulations.
One might wonder wow these findings could help us to revise interventionist dual
process model. As we noted above, one possibility is to use De Neys’ solution in proposing
that at the beginning of the reasoning process, two type 1 responses are generated, which
might be inhibited and overridden by type 2 processing. The present findings validate the
existence of an intuitive logical response. However, it should be clear that this model leaves
many questions unanswered. For example, how does the inhibition process work? Is it equally
possible to inhibit a logic-based and a heuristic-based type 1 response (i.e., do people need to
block the logical intuitive response to give the heuristic response?). Likewise, as we already
noted, how do we operationalize and directly measure the “strength” of different competing
intuitions?
Clearly a lot of future work will be needed to answer these fundamental questions.

33
Appendix 1. Base rate problems
This study contains scientists and assistants.
Person 'C' is intelligent.
There are 4 scientists and 996 assistants.
(No-conflict)
This study contains lawyers and gardeners.
Person 'W' is argumentative.
There are 3 lawyers and 997 gardeners.
(Conflict)
This study contains clowns and accountants.
Person 'L' is funny.
There are 995 clowns and 5 accountants.
(No-conflict)
This study contains high school students and librarians.
Person 'M' is loud.
There are 995 high school students and 5 librarians.
(Conflict)
This study contains lab technicians and
aerobics instructors.
Person 'D' is active.
There are 5 lab technicians and 995 aerobics
instructors.
(No-conflict)
This study contains I.T. technicians and boxers.
Person 'F' is strong.
There are 997 I.T. technicians and 3 boxers.
(Conflict)
This study contains nurses and artists.
Person 'S' is creative.
There are 3 nurses and 997 artists.
(No-conflict)
This study contains businessmen and firemen.
Person 'K' is brave.
There are 996 businessmen and 4 firemen.
(Conflict)

34
Appendix 2. Syllogistic reasoning problems
Type „A” questionnaire Type „B” questionnaire
All flowers need light
Roses are flowers
Roses need light
(No-conflict: Valid/Believable)
All flowers need light
Roses need light
Roses are flowers
(Conflict: Invalid/Believable)
All things made of wood can be used as fuel
Trees can be used as fuel
Trees are made of wood
(Conflict: Invalid/Believable)
All things made of wood can be used as fuel
Trees are made of wood
Trees can be used as fuel
(No-conflict: Valid/Believable)
All mammals can walk
Spiders can walk
Spiders are mammals
(No-conflict: Invalid/Unbelievable)
All mammals can walk
Whales are mammals
Whales can walk
(Conflict: Valid/Unbelievable)
All vehicles have wheels
Boats are vehicles
Boats have wheels
(Conflict: Valid/Unbelievable)
All vehicles have wheels
Trolley suitcases have wheels
Trolley suitcases are vehicles
(No-conflict: Invalid/Unbelievable)
All birds have wings
Crows are birds
Crows have wings
(No-conflict: Valid/Believable)
All birds have wings
Crows have wings
Crows are birds
(Conflict: Invalid/Believable)
All cannons fire bullets
Water cannons are cannons
Water cannons fire bullets
(Conflict: Valid/Unbelievable)
All cannons fire bullets
Guns fire bullets
Guns are cannons
(No-conflict: Invalid/Unbelievable)

35
All flowering plants have leafs
Bracken has leafs
Bracken is a flowering plant
(No-conflict: Invalid/Unbelievable)
All flowering plants have leafs
Cacti are flowering plants
Cacti have leafs
(Conflict: Valid/Unbelievable)
All dogs have snouts
Labradors have snouts
Labradors are dogs
(Conflict: Invalid/Believable)
All dogs have snouts
Labradors are dogs
Labradors have snouts
(No-conflict: Valid/Believable)

36
Appendix 3. Table 8. Mean confidence ratings and standard deviations for Experiment 1.
First response Second response
Mean SD Mean SD
Base rate C-C 87.43 21.32 91.17 16.38
I-I 86.21 23.98 85.54 25.46
C-I 76.54 24.22 77.91 30.72
I-C 69.19 24.74 73.97 27.39
Syllogistic
reasoning
C-C 90.64 18.43 93.59 16.71
I-I 91.69 20.36 92.67 19.08
C-I 73.29 27.86 82.71 28.35
I-C 79.74 26.07 76.52 33.06
Table 9. Means and standard deviations of reaction times by tasks, response number and direction of change
category. Only the conflict items were analysed. In parentheses the back-transformed responses times can be
seen in seconds.
First response Second response
Mean SD Mean SD
Base rate 11 0.535 (3,43) 0.279 (1,9) 0.467 (2,93) 0.364 (2,31)
00 0.383 (2,42) 0.275 (1.88) 0.394 (2,48) 0.279 (1,9)
10 0.45 (2,82) 0.376 (2,38) 0.384 (2,42) 0.259 (1,82)
01 0.38 (2,4) 0.327 (2,12) 0.596 (3,94) 0.392 (2,47)
Syllogistic
reasoning
11 0.431 (2,7) 0.262 (1,828) 0.432 (2,7) 0.32 (2,09)
00 0.388 (2,44) 0.282 (1,914) 0.397 (2,39) 0.338 (2,18)
10 0.732 (5,4) 0.413 (2,588) 0.44 (2,75) 0.483 (3,04)
01 0.404 (2,535) 0.262 (1,828) 0.705 (5,07) 0.429 (2,69)
37
References: Baayen, R. H., Davidson, D. J., & Bates, D. M. (2008). Mixed-effects modeling with crossed
random effects for subjects and items. Journal of Memory and Language, 59(4), 390–
412.
Banks, A. P., & Hope, C. (2014). Heuristic and analytic processes in reasoning: An event‐
related potential study of belief bias. Psychophysiology, 51(3), 290–297.
De Neys, W. (2006). Automatic–heuristic and executive–analytic processing during
reasoning: Chronometric and dual-task considerations. The Quarterly Journal of
Experimental Psychology, 59(6), 1070–1100.
De Neys, W. (2014). Conflict detection, dual processes, and logical intuitions: Some
clarifications. Thinking & Reasoning, 20(2), 169–187.
De Neys, W. (2015). Heuristic Bias and Conflict Detection During Thinking. Psychology of
Learning and Motivation.
De Neys, W., Cromheeke, S., & Osman, M. (2011). Biased but in doubt: Conflict and
decision confidence. PloS One, 6(1), e15954.
De Neys, W., & Glumicic, T. (2008). Conflict monitoring in dual process theories of thinking.
Cognition, 106(3), 1248–1299.
De Neys, W., Moyens, E., & Vansteenwegen, D. (2010). Feeling we’re biased: Autonomic
arousal and reasoning conflict. Cognitive, Affective, & Behavioral Neuroscience,
10(2), 208–216.
De Neys, W., Rossi, S., & Houdé, O. (2013). Bats, balls, and substitution sensitivity:
Cognitive misers are no happy fools. Psychonomic Bulletin & Review, 20(2), 269–273.
De Neys, W., & Schaeken, W. (2007). When people are more logical under cognitive load.
Experimental Psychology (formerly Zeitschrift Für Experimentelle Psychologie),
54(2), 128–133.

38
Evans, J. S. B., & Curtis-Holmes, J. (2005). Rapid responding increases belief bias: Evidence
for the dual-process theory of reasoning. Thinking & Reasoning, 11(4), 382–389.
Evans, J. S. B., & Stanovich, K. E. (2013). Dual-process theories of higher cognition
advancing the debate. Perspectives on Psychological Science, 8(3), 223–241.
Franssens, S., & De Neys, W. (2009). The effortless nature of conflict detection during
thinking. Thinking & Reasoning, 15(2), 105–128.
Gilovich, T., Griffin, D. W., & Kahneman, D. (2002). Heuristics and biases: The psychology
of intuitive judgement. Cambridge Univ Pr.
Handley, S. J., Newstead, S. E., & Trippas, D. (2011). Logic, beliefs, and instruction: A test
of the default interventionist account of belief bias. Journal of Experimental
Psychology: Learning, Memory, and Cognition, 37(1), 28.
Kahneman, D. (2011). Thinking, fast and slow. Macmillan.
Klauer, K. C., & Singmann, H. (2013). Does logic feel good? Testing for intuitive detection
of logicality in syllogistic reasoning. Journal of Experimental Psychology: Learning,
Memory, and Cognition, 39(4), 1265.
Mata, A., Schubert, A.-L., & Ferreira, M. B. (2014). The role of language comprehension in
reasoning: How “good-enough” representations induce biases. Cognition, 133(2),
457–463.
Miyake, A., Friedman, N. P., Rettinger, D. A., Shah, P., & Hegarty, M. (2001). How are
visuospatial working memory, executive functioning, and spatial abilities related? A
latent-variable analysis. Journal of Experimental Psychology: General, 130(4), 621.
Pennycook, G., Cheyne, J. A., Barr, N., Koehler, D. J., & Fugelsang, J. A. (2014). Cognitive
style and religiosity: The role of conflict detection. Memory & Cognition, 42(1), 1–10.
Pennycook, G., Fugelsang, J. A., & Koehler, D. J. (2012). Are we good at detecting conflict
during reasoning? Cognition, 124(1), 101–106.

39
Pennycook, G., Trippas, D., Handley, S. J., & Thompson, V. A. (2014). Base rates: Both
neglected and intuitive. Journal of Experimental Psychology: Learning, Memory, and
Cognition, 40(2), 544.
Pinheiro, J., Bates, D., Debroy, S., & Sarkar, D. (2015). nlme: Linear and Nonlinear Mixed
Effects Models.
Singmann, H., Klauer, K. C., & Kellen, D. (2014). Intuitive logic revisited: new data and a
Bayesian mixed model meta-analysis. PloS One, 9(4), e94223.
Stanovich, K. E., & Toplak, M. E. (2012). Defining features versus incidental correlates of
Type 1 and Type 2 processing. Mind & Society, 11(1), 3–13.
Stanovich, K. E., & West, R. F. (2000). Advancing the rationality debate. Behavioral and
Brain Sciences, 23(05), 701–717.
Thompson, V. A., & Johnson, S. C. (2014). Conflict, metacognition, and analytic thinking.
Thinking & Reasoning, 20(2), 215–244.
Thompson, V. A., Prowse Turner, J. A., & Pennycook, G. (2011). Intuition, reason, and
metacognition. Cognitive Psychology, 63(3), 107–140.
Villejoubert, G. (2009). Are representativeness judgments automatic and rapid? The effect of
time pressure on the conjunction fallacy. In Proceedings of the Annual Meeting of the
Cognitive Science society (Vol. 30, pp. 2980–2985). Cognitive Science Society.