
Fashion & Luxury Private Equity and Investors Survey · PDF fileFashion & Luxury Private...
56
Fashion & Luxury Private Equity and Investors Survey 2017 Global report
Transcript of Fashion & Luxury Private Equity and Investors Survey · PDF fileFashion & Luxury Private...

Fashion & Luxury Private Equity and Investors Survey 2017 Global report


Fashion & Luxury Private Equity and Investors Survey 2017| Summary
01
Preface 02
Methodology 03
Key takeaways 05
Business Performance of F&L Industry 13
M&A Deal Monitor 2016 21
Private Equity and Investors Survey 2017 29
• Fashion & Luxury Market Outlook 29
• 2017 Exit and Investment Strategy 33
• Profile of Survey Respondents 43
Glossary 49
Contacts 50
Contents

02
Fashion & Luxury Private Equity and Investors Survey 2017| Preface
In 2016 several global economic and geopolitical trends had a deep impact on the Fashion & Luxury industry.
Rising commodity prices, trade stagnation, new monetary policies and their influence on exchange rate dynamics, financial stimulus measures in major economies and continuous digitalization have been the main factors influencing business models in the industry.
Key players are now ready to divest and re-organise their underperforming and peripheral brands, diversifying their business models in order to boost or at least sustain profits.
Against this background, global investors interested in the Fashion & Luxury industry are reviewing their future expectations and strategies. In order to analyse market trends and expectations with regards to M&A activities, Deloitte has launched the second edition of the “Global Fashion & Luxury Private Equity and Investors Survey”.
Preface

03
Fashion & Luxury Private Equity and Investors Survey 2017| Methodology
Methodology
F&L Industry businessperformance analysis
M&A Deal Monitor 2016 Private Equity and Investors Survey 2017
••
•
•
•
••
••
•
Global
Cont
ents
Geo
Scop
eD
ata
sour
ceRe
mar
ks •
•
Primary data level
•
•
•
Primary data level
Primary data level
•
•
•
•
Full primary dataFull secondary data
Global Global
The study has been conducted with the support of Deloitte offices in: China, France, Germany, Hong Kong, Italy, Luxembourg, Singapore, Spain, Switzerland, United Kingdom, United States
The survey targeted senior members within investment funds, with a substantial knowledge of the F&L industry
Company annual financial reports and presentations
Deloitte expertise
News and reports from major media providersInvestor press releasesCompany press releases
Online survey based on Computer Assisted Web Interviewing (CAWI)Interviews with Private Equity funds top management
F&L market outlook
Exit and investment strategies in 2017Investors’ current portfolio of F&L assets
Size of M&A deals by F&L sector Target company profilesInvestor profiles Analysis of global deals
Sales performance by sectorMargins performance by sectorAnalysis of F&L sectors’ attractiveness for investors
Market segmentationSectors covered
Personal Luxury Goods
Apparel & accessories
Furniture
Luxury hotels Luxury cruises Digital luxury1
Private jets Yachts Luxury cars
Cosmetics & fragrances
Watches & jewellery
Aspirational
Accessible
Fashion
Absolute
Pric
e po
int a
naly
sis
Cons
umer
s’ p
erce
ptio
n
1 Covered only in the Private Equity and Investors Survey chapter

Fashion & Luxury Private Equity and Investors Survey 2017 | Key takeaways

Fashion & Luxury Private Equity and Investors Survey 2017| Key takeaways
05
Apparel & Accessories and Watches & Jewellery are the most attractive sectors for F&L investors with strong turnover growth, profitability and increasing M&A activity.
Deloitte F&L Market and M&A index
Note: The Index has been computed as the variance of sectors’ value on the F&L industry weighted average
23
46
60
81
96Apparel &Accessories
Hotels
Cruises
Yachts
Cosmetics &Fragrances
Furniture 100
119Private Jets
Watches &Jewellery 147
Cars 107
12
59
71
78
89
94
120
106
Cars
Cosmetics &Fragrances
Cruises
142Apparel &Accessories
Watches &Jewellery
Yachts
Private Jets
Furniture
Hotels
1
10
14
16
32
55
77
Furniture
Watches &Jewellery
Cars
Private Jets
130
Cruises
Yachts
Cosmetics &Fragrances
Apparel &Accessories
Hotels
Turnover trend index Profitability index M&A deals index
0
Note: The Index has been computed as the variance of sectors’ value on the F&L industry weighted average
Key takeaways

Fashion & Luxury Private Equity and Investors Survey 2017 | Key takeaways
06
Deals in 2015
Sector
Apparel & Accessories
Hotels
Watches & Jewellery
Furniture
Cosmetics & Fragrances
Yachts
Private Jets
Cruises
20162015 Growth
+36
+2
+ 2 3
+3
+4
+3
- 2
+1
Top luxury deals of 2016
Month Target BidderValue($m)
Sep.
Mar.
Oct.
Jun.
Mar.
Nov.
Oct.
Jul.
Aug.
Oct.
Jul.
StarwoodStrategic Hotels & Resorts
Hilton
Diamond Resorts
Tumi
Too Faced
Goodwood Hotel
It Cosmetics
Whistler Blackcomb.RIMOWA GmbH
Donna Karan
Marriott
Anbang
HNA TourismApollo Global
Samsonite
Estée Lauder
Hotel Holdings
L'Oréal
Vail Resorts
LVMH
G- III Apparel
12,893
6,500
6,497
2,224
1,809
1,450
1,389
1,200
1,051
716
650
Deals in 2016 Deals+70
Overview of deals in 2016 by sector
141
335115197790
69533822111071
211
Note: the analysis considers both closed and announced deals during 2016Source: Elaboration on Deloitte intelligence data
Overview of M&A deals in 2016 by sector
Note: the analysis considers both closed and announced deals during 2016Source: Elaboration on Deloitte intelligence data

Fashion & Luxury Private Equity and Investors Survey 2017| Key takeaways
07
Fashion & Luxury industry performance trendThe analysis of top Fashion & Luxury (F&L) Groups’ economics shows that industry turnover is 1.7 times the value it was in 2010 (at constant exchange rates), with Personal Luxury Goods (PLG) decelerating in the last three years and Experiential & Other Luxury maintaining their growth rates.Industry profitability is stable, with an average EBITDA margin of 17 per cent (+0.7 percentage points vs FY 2010). Watches and Jewellery proved to be the most attractive sector for F&L investors, with outstanding sales growth and margins, while Apparel and Accessories outperformed in terms of profits generation.
Personal Luxury Goods focusThe slowdown of PLG (+13.3 per cent CAGR 2010-14 vs +4 per cent year-on-year in 2014-15) was mostly driven by Apparel & Accessories and Watches & Jewellery which are both affected by a decline in consumption (mainly in the Asian market) and by an increase in competition from new entrants (e.g. contemporary brands). However, Cosmetics & Fragrances is maintaining a stable growth
rate thanks to the development of the prestige segment in the Americas and Asia, as well as stimulus from the digitalisation of the sector. While the sales performance of PLG is flattening, margins are becoming larger (EBITDA margin of 21.7 per cent in 2015), due to gains registered by Cosmetics & Fragrances’ players (+2.9 percentage points from 2010).
Other Luxury Sectors key trendsDifferent patterns are shown within “Other Luxury” segments:• cars have been growing steadily, with
premium players gaining market share and new technologies reshaping the sector
• cruises boomed, sustained by increasing demand in all destinations, excluding the Mediterranean
• hotels shrank, mainly in Europe, influenced by recurring terrorist attacks
• furniture improved, with European players consolidating their global leadership
• finally, Yachts showed a recovery, mainly in the Superyachts segment, while Private Jets decelerated.
Business Performance of F&L Industry
Fashion & Luxury Private Equity and Investors Survey 2017 | Key takeaways
08
M&A deal overview
The Fashion & Luxury industry proved to be fertile soil for M&A activities with 211 deals registered in 2016, an increase of 70 deals compared to the previous year. Deals involving Personal Luxury Goods steadily increased (62 more deals than in 2015), with both Apparel & Accessories (33 per cent of the total) and Watches & Jewellery (18 per cent of the total) driving growth by +36 and +23 deals respectively. On the other hand, M&A deal volumes in other sectors did not radically change compared to the previous year (+8 deals).Despite an increase in the number of transactions, the average deal value has downsized, from $582 million to $449 million in 2016 (-23 per cent), due to the reduction of achieved multiples. 2016 saw an increase of M&A deals in Asia Pacific and North America (+22 and +24 deals), driven by Apparel & Accessories (+8 and +11 deals) and Watches & Jewellery (+5 and +6 deals). In addition, there were 14 more deals in Europe, with Personal Luxury Goods acting as a major contributor.
Top deals
Acquisitions of Hotels drove numbers in 2016: • Starwood Hotels & Resorts Worldwide
acquired by Marriott International (~$12.9 billion for 100 per cent ownership)
• Strategic Hotels & Resorts by Anbang Insurance Group (~$6.5 billion for 100 per cent)
• Hilton Worldwide Holdings by HNA Tourism Group (~$6.5 billion for 25 per cent).
Other relevant deals involved the Apparel & Accessories and Cosmetics & Fragrances segments:• Tumi acquired by Samsonite (~$1.8 billion for
100 per cent)• Too Faced by Estée Lauder (~$1.5 billion for
100 per cent)• It Cosmetics by L’Oréal (~$1.2 billion for 100
per cent)• RIMOWA by LVMH (~$700 million for 80 per
cent)• Donna Karan by G-III Apparel (~$650 million).
M&A features and strategies
Of the M&A deals completed, 68 per cent were carried out by strategic investors, an increase of 73 deals compared to 2015. Financial investors, on the other hand, did not carry out more deals when compared to 2015.Strategic sellers were involved in 77 per cent of transactions (+10 percentage points versus 2015). Generally, bidders’ investments focused on a turnaround strategy (+42 deals versus 2015).
M&A Deal Monitor 2016

Fashion & Luxury Private Equity and Investors Survey 2017| Key takeaways
09
Fashion & Luxury market outlook
Within its Private Equity Survey, Deloitte focused on understanding investors’ perceptions of the potential growth in the F&L market in coming years. The consensus view is that major players in Personal Luxury Goods (PLG) are projected to achieve 1.3 times their current sales index by 2018 (~ +8 per cent CAGR FY 2015-18), while other Luxury sectors are expected to achieve 1.2 times their value (~ +6 per cent).
Within the next three years, investors forecast that the F&L industry will continue to grow by 5-10 per cent annually. Digital Luxury and Cosmetics & Fragrances are projected to outperform strongly, growing by more than 10 per cent per year. Apparel & Accessories, Hotels and Furniture are consolidating (with expected annual growth of 5-10 per cent ), while Watches & Jewellery and Yachts are projected to remain stable (0-5 per cent annual growth). Growth in the Selective Retailing segment is expected to decrease in the short run.
Investors have formed a more positive consensus view on both Asia and the Middle East compared to 2016 as the forecast sees these sectors stimulating the growth of the F&L industry. Expectations for North America are positive (5-10 per cent annual growth), but sentiment has fallen considerably compared to 2016 (-48 per cent). Latin America will remain stable, while sentiment concerning the European market has deteriorated. Finally, Japan is forecast to experience a decrease in coming years though investor sentiment towards the country is improving slightly.
Private Equity and Investors Survey 2017

Fashion & Luxury Private Equity and Investors Survey 2017 | Key takeaways
10
Exit strategy
The report considers potential strategies investors will undertake in 2017 to enhance or disinvest their Fashion & Luxury portfolios. About 36 per cent of funds are considering divesting an F&L asset in 2017, a slight decrease from the previous year (-8 percentage points). Generally, an investor’s exit is motivated by an opportunity for high returns, the closing of the investment period, market trends mismatches or concerns related to the shrinking of multiples.
Investment strategy
During 2017, 90 per cent of funds are considering investing in an F&L asset, with notable interest rising in: Apparel & Accessories (where 68 per cent intend to invest), Cosmetics & Fragrances (49 per cent), Selective Retailing (30 per cent), Furniture (26 per cent), Watches & Jewellery (21 per cent) and Digital Luxury (15 per cent).
Even though interest is declining relative to the previous year, Apparel & Accessories, Selective Retailing and Furniture remain remarkably attractive to investors. Virtualization trends in the consumer purchasing process are leading to the creation of a new cluster of firms focusing on Digital Luxury, mostly within the Cosmetics & Fragrances segment.
Despite a slowdown in the Asian market, investors’ attraction to Watches & Jewellery remains stable due to their appeal as less volatile assets.
While current investors, mainly in the EMEA area, are more attracted to innovative segments (such as Digital Luxury), newcomers prefer consolidated sectors within the F&L industry (e.g. Cosmetics & Fragrances) where market knowledge is widespread.
With respect to 2016, the continuous consolidation of the F&L industry is moving investments towards larger-sized companies (+10 percentage points), where investors plan to boost performance by implementing internationalisation, digital and restructuring strategies.
The consensus is that forecast returns will range from 21 to 30 per cent, with Selective Retailing and Furniture representing the top performers (>30 per cent); EMEA investors expect higher internal rates of return (IRR) compared to the US and China.
Private Equity and Investors Survey 2017

Fashion & Luxury Private Equity and Investors Survey 2017| Key takeaways

Fashion & Luxury Private Equity and Investors Survey 2017 | Business Performance of F&L Industry

Fashion & Luxury Private Equity and Investors Survey 2017 | Business Performance of F&L Industry
13
The Deloitte Fashion & Luxury panel
The Fashion & Luxury industry business performance analysis was conducted on a panel of 84 companies with a total of $550bn in sales.
21
Players by area
21 Players
$86.5bnTot. turnover
Apparel & Accessories
Deloitte F&L panel:
Top
play
ers
map
FY2
015
19%
81%
10
Players by area
10 Players
$324bn
Tot. turnover
Luxury cars
10%
90%
5 2
Players by area
5 Players
$32.9bn
Tot. turnover
Luxury hotels
2 Players
$6.2bnTot. turnover
Private jets
10%
20%
50%
50%
12
Players by area Players by area
12 Players
$54.5bn
Tot. turnover
Watches & Jewellery
17%
41%
42%
6
Players by area
Players by area
6 player
$36.4bn
Tot. turnover
39 Players
32%
Cosmetics & Fragrances Personal luxury goods
17%
41%
42%
33%
17%
50%
60%
4
Players by area
4 Players
$2.9bnTot. turnover
Luxury cruises
25%
75%
8 16
Players by area
8 Players
$3.6bnTot. turnover
Furniture
16 Players
$3.1bnTot. turnover
Yachts
13%
87% 100%
of totalturnover
45 Players
84 Players $550bn Total turnover
68%
Other F&Isectors
of total turnover
EuropeNorth AmericaRest of the WorldNotes: Values reported at constant exchange rateSource: Elaboration on Company Financial Report data
Business Performance of F&L Industry
Notes: Values reported at constant exchange rateSource: Elaboration on Company Financial Report data

Fashion & Luxury Private Equity and Investors Survey 2017 | Business Performance of F&L Industry
14
Sales index trend
Key findings
The F&L industry has grown consistently in recent years, reaching a value 1.7 times higher than 2010. PLG grew at a CAGR of 11.4 per cent in 2010-15, despite decelerating since 2012. Other Luxury sectors have maintained steady growth rates in the same period (+11.1 per cent).
The EBITDA of PLG players are about 7 percentage points higher than the average operating margins for other sectors and demonstrate constant growth since 2010 (+1.3 percentage points).
The F&L top players sales index is 1.7 times the 2010 value.Personal Luxury Goods have decelerated in the last three years (but with improving margins). Other luxury sectors have maintained their growth rates.
171
170
2010 2011 2012 2013 2014 2015
Index 180
100
140
160
80
120
FY2010-15 F&L sales index evolution(Index of Sales 2010=100; Percentage)
EBITDA %PLG
20.4%
EBITDA %Other Lux
20.8% 21.4% 21.5% 21.3% 21.7%
14.2% 14.2% 14.3% 14.5% 15.0% 14.6% +0.4
% point change2010-15
2010-15
+1.3
CAGR
11.4%
11.1%
PersonalLuxury GoodsOther LuxurySectors
Notes: Values reported at constant exchange rateSource: Elaboration on Company Financial Report data and Deloitte survey
Notes: Values reported at constant exchange rateSource: Elaboration on Company Financial Report data and Deloitte survey
Fashion & Luxury Private Equity and Investors Survey 2017 | Business Performance of F&L Industry
15
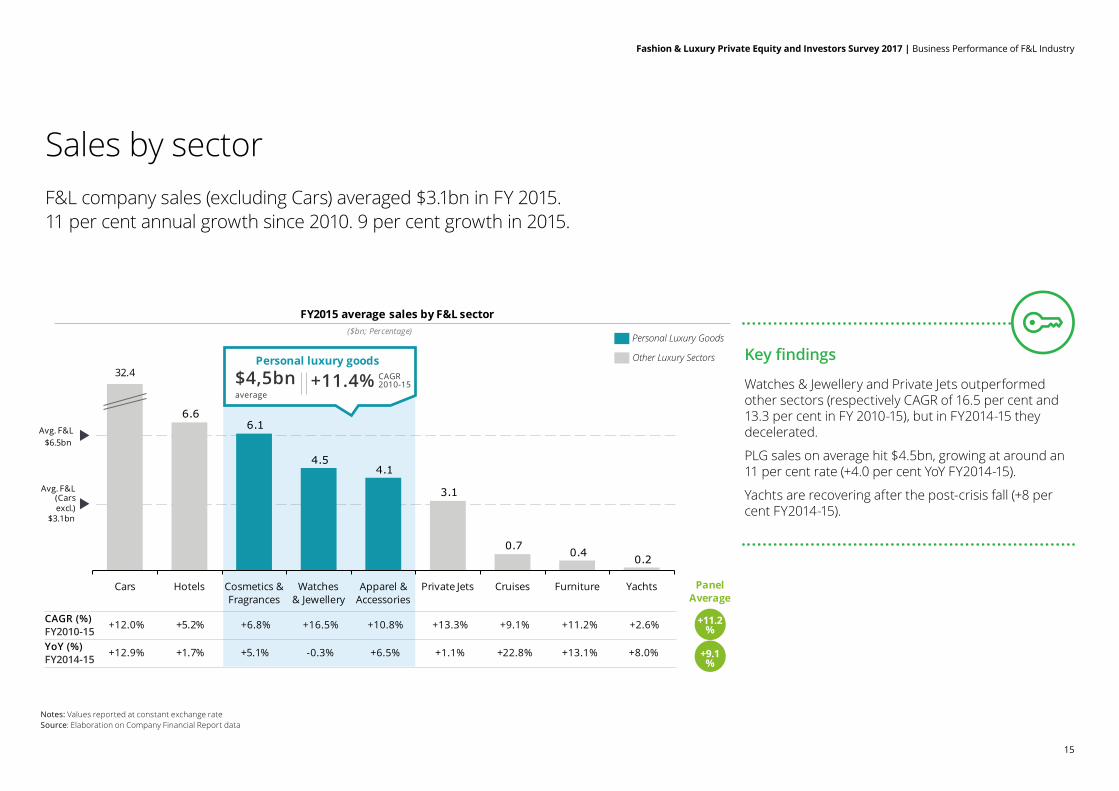
Sales by sectorF&L company sales (excluding Cars) averaged $3.1bn in FY 2015. 11 per cent annual growth since 2010. 9 per cent growth in 2015.
FY2015 average sales by F&L sector($bn; Percentage)
0.20.4
0.7
3.1
6.6
4.14.5
6.1
Furniture YachtsCruises
Avg. F&L(Carsexcl.)
$3.1bn
Avg. F&L $6.5bn
Watches & Jewellery
Apparel & Accessories
Cosmetics & Fragrances
32.4
Private JetsHotelsCars
Other Luxury Sectors
Personal Luxury Goods
CAGR (%)FY2010-15
+12.0% +16.5% +13.3%+6.8% +10.8% +9.1% +11.2%+5.2% +2.6%
YoY (%)FY2014-15
+12.9% -0.3% +1.1%+5.1% +6.5% +22.8% +13.1%+1.7% +8.0%
Personal luxury goods
+9.1%
Panel Average
$4,5bnaverage
+11.4% CAGR 2010-15
+11.2%
Notes: Values reported at constant exchange rateSource: Elaboration on Company Financial Report data
Key findings
Watches & Jewellery and Private Jets outperformed other sectors (respectively CAGR of 16.5 per cent and 13.3 per cent in FY 2010-15), but in FY2014-15 they decelerated.
PLG sales on average hit $4.5bn, growing at around an 11 per cent rate (+4.0 per cent YoY FY2014-15).
Yachts are recovering after the post-crisis fall (+8 per cent FY2014-15).
Notes: Values reported at constant exchange rateSource: Elaboration on Company Financial Report data

Fashion & Luxury Private Equity and Investors Survey 2017 | Business Performance of F&L Industry
16
Sector profitabilityThe average EBITDA margin in Luxury Sectors was 17 per cent in FY2015 (+0.7 percentage points vs FY2010), with Personal Luxury Goods (21.7 per cent) outperforming the industry.Since 2010 Private Jets and Cruises are the top growing sectors in terms of profitability.
Notes: Values reported at constant exchange rateSource: Elaboration on Company Financial Report data
24.1%
20.3%
Apparel & Accessories
Cosmetics & Fragrances
17.9%
Watches & Jewellery
Cars
15.0%
Avg.F&L17%
Yachts
2.0%
Furniture
11.9%
Hotels
13.2%
9.9%
Private JetsCruises
15.9%
% pt CHANGE
% pt CHANGE
FY2010-15
FY2014-15
0.6 6.3 0.42.9 0.2 6.6 3.00.7 - 2.9
AVERAGE PERSONAL LUXURY GOODS
0.0 3.4 - 0.81.1 - 0.4 3.0 0.90.2 0.7 -0.2
Panel Average
+0.7
FY2015 average EBITDA margin by sector
Other Luxury Sectors
Personal Luxury Goods
21.7%
(Percentage)
Key findings
Personal Luxury Goods are the most profitable segments, all with an EBITDA margin higher than the industry average of 17 per cent in FY2015.
The operating margin in F&L sectors has increased by 0.7 percentage points compared to its 2010 value, though it decreased in the past year by 0.2 percentage points due to the slowdown in the Cars and Hotels segments.
Cruises and Private Jets are the sectors showing the highest growth in terms of profitability, 6.3 and 6.6 percentage points respectively, compared to 2010.
Notes: Values reported at constant exchange rateSource: Elaboration on Company Financial Report data

Fashion & Luxury Private Equity and Investors Survey 2017 | Business Performance of F&L Industry
17
Sectoral performance analysisWatches & Jewellery is the most attractive sector for F&L investors, with outstanding sales growth and margins. Apparel & Accessories is still best in terms of profits generation.
F&L sectors business performance map(Percentage)
Total Sector Sales 2015
Personal Luxury Goods
Notes: Values reported at constant exchange rateSource: Elaboration on Company Financial Report data
14 %
12 %
2%
4% 10 %6% 14 %
24 %
16 % 18 %2% 8%0%
20 %
12 %
10 %
22 %
26 %
18 %
16 %
Cosmetics & Fragrances
Private Jets
Apparel & Accessories
Furniture
Cruises
Sales growth(Percentage – CAGR FY2010-15)
(Per
cent
age
– FY
2015
)
Hotels
Watches & Jewellery
YachtsFast growing
High profitability
Underperformers
Best in class
AVG
Cars
AVG
EBIT
DA
Mar
gin
Notes: Values reported at constant exchange rateSource: Elaboration on Company Financial Report data

Fashion & Luxury Private Equity and Investors Survey 2017 | Business Performance of F&L Industry
18
Sectors’ performance evolutionF&L growth has slowed slightly (down 0.6 percentage points in FY2015 vs FY2010-14). Margins have been preserved (averaging ~17 per cent).
F&L sectors business performance map(Percentage)
2015
2010-14 avg
Notes: Values reported at constant exchange rateSource: Elaboration on Company Financial Report data
24%
12%
16%
22%
8%
4%
8%6%
26%
20%
18%
12%
6%
0%22%
2%
16%14%
10%
10%4%0% 2%
14%
Sales growth
Hotels
Apparel & Accessories
Watches & Jewellery
Private Jets
Cosmetics &Fragrances
Cruises
Furniture
Yachts
EBIT
DA
Mar
gin AVG
AVG
10
-15
AVG
10
-14
Fast growing
High profitability
Underperformers
Best in class
Cars
Key findings
The sales CAGR of F&L sectors decreased from 11.8 per cent in FY2010-14 to 11.2 per cent in FY2010-15.
Margins seem unaffected by slower sales performance (16.7 per cent in FY2010-14 vs 16.9 per cent in FY2015).
Notes: Values reported at constant exchange rate; the bubble size represents the total sector salesSource: Elaboration on Company Financial Report data

Fashion & Luxury Private Equity and Investors Survey 2017 | Business Performance of F&L Industry
19
A window on key market trends Apparel & Accessories
• Slower due to a decline in Apparel luxury products consumption, mainly in the US and China
• Increased competition for luxury groups from “contemporary brands”
• Accessories are growing through consolidation in leather goods and shoes
Watches & Jewellery
• After years of strong growth the sector is showing signs of fragility as Asian markets contract
• Decreased consumption and intensified competition are reducing top players’ market share
Cosmetics & Fragrances
• The prestige segment is growing mainly through make-up and fragrances
• North America, South America and Asia consumption are driving the marke
• Sector digitalisation is speeding through acquisitions of specialised players
Luxury Cars
• Steady recovery in the automotive market, growing for the past six years
• Premium players are gaining market share on luxury car manufacturers
• The sector continues its rapid technological development (e.g. Electric Vehicles, Automation, etc.)
Luxury Hotels
• The Hotels sector is decelerating as tourist flows in major European cities fall
• The sector’s performance is influenced by terrorist attacks and disruptive innovations (e.g. the sharing economy, peer-to-peer lodging, etc.)
Private Jets
• Luxury Private Jets players’ performance is decelerating due to the market entry of firms extending services to aspirational consumers
• Development of new offer segments is favoured by digital trends (e.g. charter booking apps)
Luxury Cruises
• The sector has boomed in the past year, boosted by prices, capacity and the rise in global demand
• The Mediterranean business is shrinking• Outstanding growth for river cruises and non-stop itineraries
(e.g. Antarctica)
Furniture
• Improving performance overall• European players are driving growth through acquisition of
major shares in developing markets (e.g. Asia)• The living and bedroom segments are stimulating the market
Yachts
• Yachts’ ongoing recovery is favoured by:-Superyachts, with more sales to high net worth individuals -Success of the speculative production model-Development of the small boating market-Access to financing (e.g. leasing)
Negative trend Stable trend Positive trendNotes: Values reported at constant exchange rateSource: Elaboration on Company Financial Report data

Fashion & Luxury Private Equity and Investors Survey 2017| M&A Deal Monitor 2016
Fashion & Luxury Private Equity and Investors Survey 2017| M&A Deal Monitor 2016
21
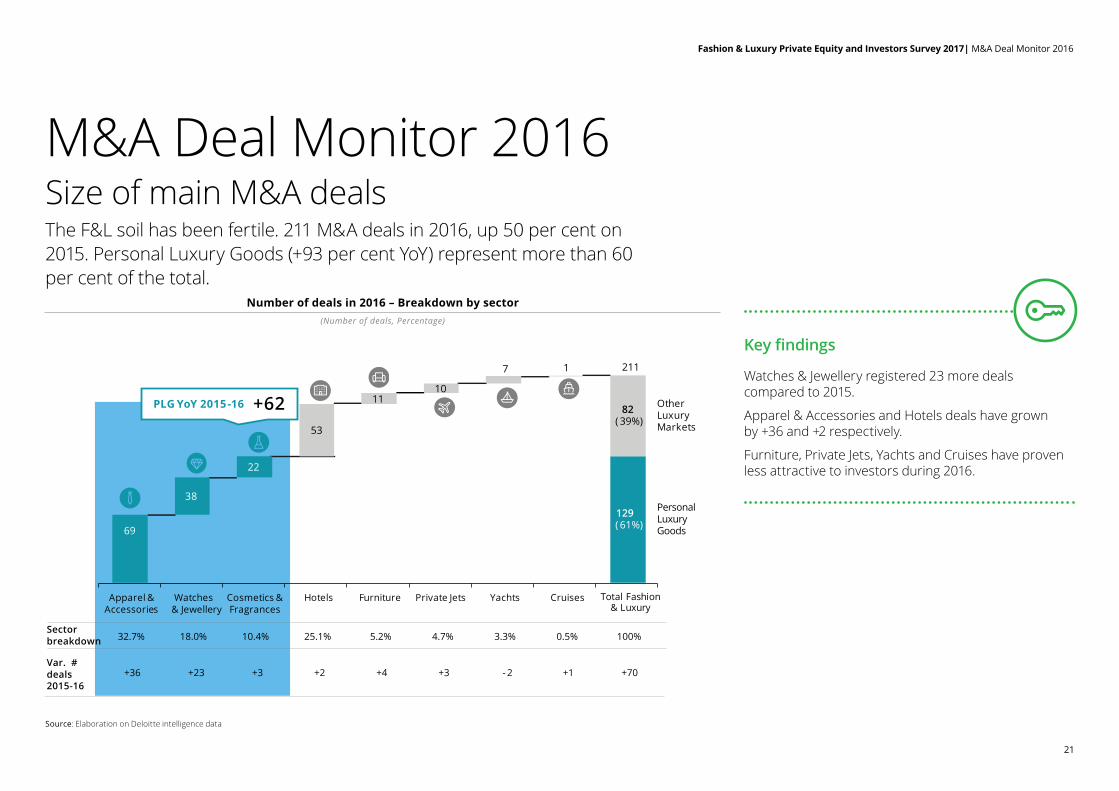
M&A Deal Monitor 2016Size of main M&A dealsThe F&L soil has been fertile. 211 M&A deals in 2016, up 50 per cent on 2015. Personal Luxury Goods (+93 per cent YoY) represent more than 60 per cent of the total. Number of deals in 2016 – Breakdown by sector
(Number of deals, Percentage)
Source: Elaboration on Deloitte intelligence data
53
11
22
38
1
82( 39%)
Yachts Cruises Total Fashion & Luxury
Private JetsCosmetics & Fragrances
129( 61%)
OtherLuxuryMarkets
211
Personal LuxuryGoods
7
10
FurnitureHotelsApparel & Accessories
Watches & Jewellery
Sector breakdown 32.7% 25.1% 4.7%10.4% 5.2% 3.3% 0.5%18.0%
Var. # deals 2015-16
+36 +2 +3+3 +4 - 2 +70 +23
100%
+1
+62PLG YoY 2015-16
69
Number of deals in 2016 – Breakdown by sector(Number of deals, Percentage)
Source: Elaboration on Deloitte intelligence data
53
11
22
38
1
82( 39%)
Yachts Cruises Total Fashion & Luxury
Private JetsCosmetics & Fragrances
129( 61%)
OtherLuxuryMarkets
211
Personal LuxuryGoods
7
10
FurnitureHotelsApparel & Accessories
Watches & Jewellery
Sector breakdown 32.7% 25.1% 4.7%10.4% 5.2% 3.3% 0.5%18.0%
Var. # deals 2015-16
+36 +2 +3+3 +4 - 2 +70 +23
100%
+1
+62PLG YoY 2015-16
69
Key findings
Watches & Jewellery registered 23 more deals compared to 2015.
Apparel & Accessories and Hotels deals have grown by +36 and +2 respectively.
Furniture, Private Jets, Yachts and Cruises have proven less attractive to investors during 2016.
Source: Elaboration on Deloitte intelligence data

Fashion & Luxury Private Equity and Investors Survey 2017| M&A Deal Monitor 2016
22
M&A deals by region and sector
Overview of deals in 2016 by region
Europe North America Asia-Pacific
Japan Middle East Rest of World
(Number of deals)
38
18
2016
95
19
155
2015
81
15
24
10
27
5
2016
59
15
2015
35
6 8
4
16
10
10
4
15
610
14
2016
363
8
11
2015
4
7
2
5
1
2015
2
2
1 2
5
2016
1
86
2
2016
5
2
1
2015
2
1
1
2015
3
2
5
2016
3
1
8
Apparel & Accessories
Cosmetics & Fragrances OtherHotels
Watches & Jewellery
Private Jets
Yachts
+2 +3 +5
+22+24+14
Source: Elaboration on Deloitte intelligence data
Key findingsEurope, North America and Asia Pacific showed a significant increase in M&A activity oriented towards Fashion & Luxury players during 2016, with 14, 24 and 22 more deals respectively than in 2015, driven by Apparel & Accessories and Watches & Jewellery.
There is consistent investor interest in luxury hotels as the main target industry for each region.
A slight decrease in interest from funds investing in Private Jets and Yachts, where fewer deals have been registered.
# Variance 2015-16
Source: Elaboration on Deloitte intelligence data

Fashion & Luxury Private Equity and Investors Survey 2017| M&A Deal Monitor 2016
23
Average value of main deals by sectorDespite an increase in the number of transactions, the average deal value has decreased, from $582m to $449m in 2016 (- 23 per cent).
Key findingsIn most F&L sectors the average deal value fell in 2016.
Only Apparel & Accessories, Watches & Jewellery and Yachts recorded YoY 2015-16 increases (+9.9 per cent, +111.5 per cent and +11.1 per cent respectively).
Average value per deal in 2016 – Breakdown by sector($m; Percentage)
Notes : The average deal value has been calculated based upon data of disclosed transactions Source: Elaboration on Deloitte intelligence data
59
794
Private JetsFurniture
Avg. PLG$311m
YachtsApparel & Accessories
Cosmetics &
Fragrances
F&L Average
Watches & Jewellery
Hotels Cruises
Other Luxury SectorsPersonal Luxury Goods
449415
343326
192
27 20
Notes: The average deal value has been calculated based upon data of disclosed transactions Source: Elaboration on Deloitte intelligence data
Fashion & Luxury Private Equity and Investors Survey 2017| M&A Deal Monitor 2016
24
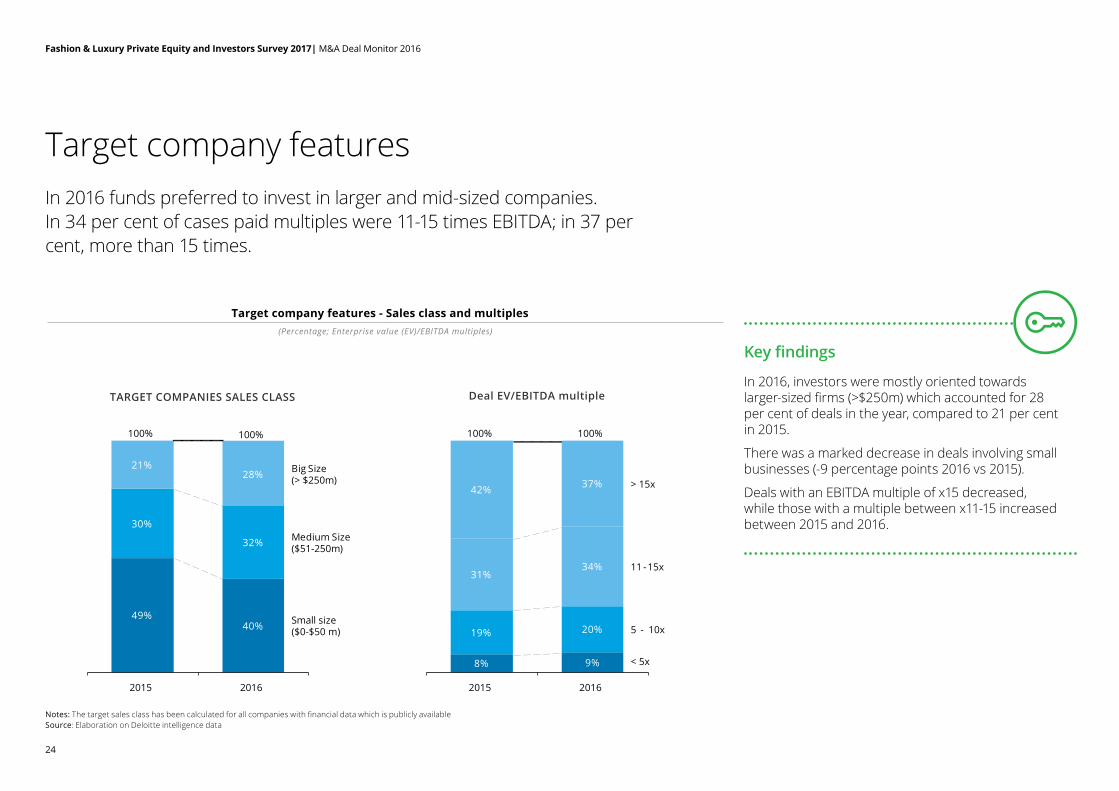
Key findings
In 2016, investors were mostly oriented towards larger-sized firms (>$250m) which accounted for 28 per cent of deals in the year, compared to 21 per cent in 2015.
There was a marked decrease in deals involving small businesses (-9 percentage points 2016 vs 2015).
Deals with an EBITDA multiple of x15 decreased, while those with a multiple between x11-15 increased between 2015 and 2016.
Target company featuresIn 2016 funds preferred to invest in larger and mid-sized companies. In 34 per cent of cases paid multiples were 11-15 times EBITDA; in 37 per cent, more than 15 times.
Target company features - Sales class and multiples(Percentage; Enterprise value (EV)/EBITDA multiples)
Notes: The target sales class has been calculated for all companies with financial data which is publicly availableSource: Elaboration on Deloitte intelligence data
TARGET COMPANIES SALES CLASS
49%40%
30%
32%
21%28%
100%
2015
100%
2016
Small size($0-$50 m)
Medium Size($51-250m)
Big Size(> $250m)
Deal EV/EBITDA multiple
9%
19% 20%
31%34%
42% 37%
8%
5 - 10x
2016
< 5x
11- 15x
> 15x
100%
2015
100%
Notes: The target sales class has been calculated for all companies with financial data which is publicly available Source: Elaboration on Deloitte intelligence data

Fashion & Luxury Private Equity and Investors Survey 2017| M&A Deal Monitor 2016
25
Investor profilesIn 2016, 68 per cent of investors were strategic buyers, mainly active in Apparel & Accessories, Hotels, and Watches & Jewellery. Deals completed by financial investors decreased.
Key findings
Deals conducted by strategic investors, mainly operating in the Apparel & Accessories, Hotels and Watches & Jewellery sectors, represent 68 per cent of the total deals. This is an increase compared to the previous year (+73 deals).
There was a slight reduction in deals conducted by financial investors (-4 deals compared to 2015).
Main bidders’ profile(Percentage; Number of deals)
68%
32%
Other Investors
Breakdown by Investor type
Private Equity/Venture Capital 88%
100%
12%
Financial investors Strategic investors
Apparel& Accessories
18%
5%
Cosmetics& Fragrances
Other Industries
25%
9%Furniture
100%
Watches& Jewellery
Breakdown by Investor core industry
Yachts
27%
Hotels
5%11%
+73- 4
Source: Elaboration on Deloitte intelligence data
Change in number of deals YoY 2015-16Source: Elaboration on Deloitte intelligence data

Fashion & Luxury Private Equity and Investors Survey 2017| M&A Deal Monitor 2016
26
Portfolio exit strategiesIn 2016, 77 per cent of the deals had a strategic seller whose aim, in about 25 per cent of cases, was effecting a turnaround. There were 42 more deals with this purpose than in 2015.
Exit types vs investment strategies
(Percentage) (Percentage) (Number of deals)
Notes: The deal strategy analysis has been performed based upon data of disclosed transactions Source: Elaboration on Deloitte intelligvence data
29%
52%
20%
16%
13%7%
25%
Sponsorto sponsor
100%
Strategicto strategic
Strategicto sponsor
Sponsorto strategic
20162015
38%
100%
Strategic Seller
Exit types patterns
Financial Seller
26% 21% 23%
20%21% 20%
31%
16%20%
15%
11%13%
5%
13%10%
18% 14%3%
100%
Consolidations
Growth capital
Turnarounds
Acquisitioncapital
Other
Total
Buyouts
FinancialInvestor
100%
StrategicInvestor
100%
Investment strategy by bidder type YoY 2015-16
+15
+12
- 48
+14
+42
+26
23%
77%
Key findings
There was a strong increase in M&A operations carried out by ‘strategic’ sellers in 2016 (77 per cent). In 2015 only 57 per cent of investors were ‘strategic’. Furthermore, the exit patterns of financial investors decreased from 33 per cent in 2015 to 23 per cent in 2016.
There was growth in investments aimed at a strategic turnaround (+42 deals) and acquisition capital (+26 deals). Growth capital oriented deals, mainly enacted by financial investors, decreased sharply.
Notes: The deal strategy analysis has been performed based upon data of disclosed transactionsSource: Elaboration on Deloitte intelligence data
Fashion & Luxury Private Equity and Investors Survey 2017| M&A Deal Monitor 2016
27
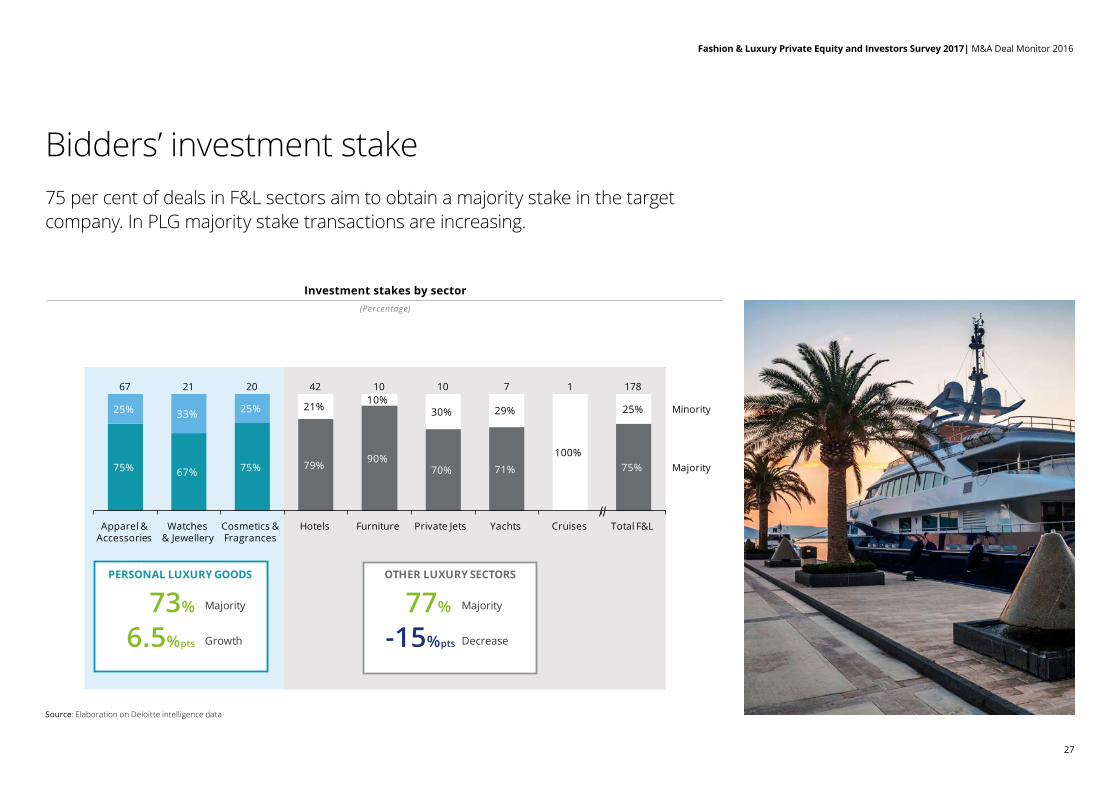
Bidders’ investment stake75 per cent of deals in F&L sectors aim to obtain a majority stake in the target company. In PLG majority stake transactions are increasing.
Investment stakes by sector(Percentage)
75% 67% 75% 79%90%
70% 71% 75%
21%10%
30% 29%
100%
25%25%33%25%
178
Minority
Majority
Total F&LCruises
10 17
FurnitureCosmetics & Fragrances
20
Watches & Jewellery
Private JetsHotels Yachts
10422167
Apparel & Accessories
PERSONAL LUXURY GOODS OTHER LUXURY SECTORS
Majority
Growth
Majority
Decrease
73% 77%
-15%pts6.5%pts
Source: Elaboration on Deloitte intelligence data
Source: Elaboration on Deloitte intelligence data

Fashion & Luxury Private Equity and Investors Survey 2017 | Private Equity and Investors Survey 2017

Fashion & Luxury Private Equity and Investors Survey 2017 | Private Equity and Investors Survey 2017
29
Rising sales forecastInvestors expect PLG top players to achieve 1.3 times the 2015 sales index by 2018, an 8 per cent CAGR. Other luxury sectors are expected to be at 1.2 times the current value (about 6 per cent CAGR).
FY2015-18 F&L sales index outlook(Index on Sales 2010=100)
Forecast
Notes: Values reported at constant exchange rateSource: Elaboration on Company Financial Report data and Deloitte survey
Index
220
200
180
160
100
140
120
80
171
2010 20132012 201520142011 2018F
CAGR2015-18
~ 8.0%
~6.0%Other LuxurySectors
PersonalLuxury Goods
199
170
216
Fashion & Luxury Market OutlookPrivate Equity and Investors Survey 2017
Notes: Values reported at constant exchange ratesSource: Elaboration on Company Financial Report data and Deloitte survey

Fashion & Luxury Private Equity and Investors Survey 2017 | Private Equity and Investors Survey 2017
30
Trend by F&L sectorIn the next three years investors expect the F&L industry to grow by 5-10 per cent annually, driven by Cosmetics & Fragrances and Digital Luxury. Apparel & Accessories, Hotels and Design are consolidating. Cars, Private Jets and Retailing are forecast to shrink.
Key findings
Private Equity funds expect the F&L industry to grow by around 5-10 per cent annually in the next three years, confirming last year’s sentiment.
The main sectors that will drive this growth are Cosmetics & Fragrances and Digital Luxury, with growth rates higher than 10 per cent and continuously improving sentiment. A slower trend is predicted for Apparel & Accessories, Hotels and Furniture (between 5-10 per cent annually), while Watches & Jewellery and Yachts will remain stable.
Forecasts are less favourable for Cars, Private Jets and Selective Retailing, where the growth rates might be negative and Private Equity sentiment is weakening markedly.
Expected F&L market trends for the next 3 years – Breakdown by sector(Index on responses)
Note: (1) “Digital Luxury” option wasn’t available in the 2016 survey edition Source: Elaboration on Deloitte survey
FurnitureYachts Privatejets
Cos&FraWat&Jew RetailingCars DigitalLuxury 1
Hotels TotalF&L
App&Acc
Strong Increase
(> 10%)
Increase(5-10%)
Stable
Decrease(< 0%)
2016-17change in sentiment
Notes: (1) “Digital Luxury” option wasn’t available in the 2016 survey editionSource: Elaboration on Deloitte survey
Fashion & Luxury Private Equity and Investors Survey 2017 | Private Equity and Investors Survey 2017
31
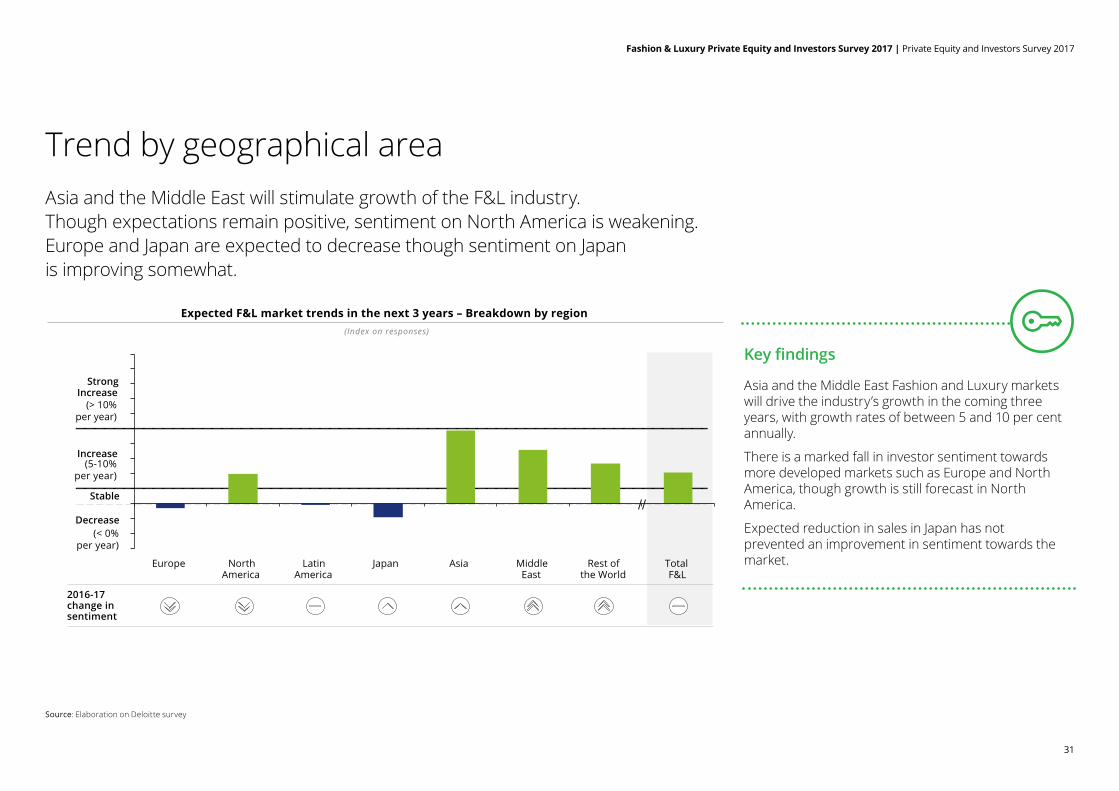
Trend by geographical areaAsia and the Middle East will stimulate growth of the F&L industry. Though expectations remain positive, sentiment on North America is weakening. Europe and Japan are expected to decrease though sentiment on Japan is improving somewhat.
(Index on responses)
Expected F&L market trends in the next 3 years – Breakdown by region
Source: Elaboration on Deloitte survey
LatinAmerica
MiddleEast
NorthAmerica
Rest of the World
TotalF&L
AsiaEurope Japan
Strong Increase
(> 10%per year)
Increase
Stable
Decrease(< 0%
per year)
(5-10%per year)
2016-17change in sentiment
Key findings
Asia and the Middle East Fashion and Luxury markets will drive the industry’s growth in the coming three years, with growth rates of between 5 and 10 per cent annually.
There is a marked fall in investor sentiment towards more developed markets such as Europe and North America, though growth is still forecast in North America.
Expected reduction in sales in Japan has not prevented an improvement in sentiment towards the market.
Source: Elaboration on Deloitte survey

Fashion & Luxury Private Equity and Investors Survey 2017| M&A Deal Monitor 2016

Fashion & Luxury Private Equity and Investors Survey 2017 | Private Equity and Investors Survey 2017
33
Funds’ F&L exit strategy for 2017
Funds considering divesting an F&L asset in 2017 decreased by 8 percentage points. The main drivers of exit are the prospect of high returns, closing of the investment period and market trend mismatches. Smaller multiples are expected by investors.
(Percentage of respondents)
Funds that are going to divest at least one asset in 2017
Source: Elaboration on Deloitte survey
Exit drivers(Percentage of respondents)
29%26%
11%
2017
41%
2016
100%
12%
100%
52%
11%18%
Other driversMarket trendsmismatchexpectations
High returnsopportunity
Closing of theinvestmentperiod
Exit strategies(Percentage of respondents)
Exit multiple(Percentage of respondents)
Trade sale
IPO
Secondbuyout
2017
60%
20%
100%
20%38%
2016
100%
8%
54%
27%
< 10x(EV/EBITDA)
2016
> 10x(EV/EBITDA)55%
2017
45%
100% 100%
73%
36%-8%pts
Key findings36 per cent of funds participating in the survey expect at least one disinvestment within their F&L portfolio, a strong decrease compared to the results of the survey carried out last year (-8 percentage points).
The main drivers to influence exits will be: high returns opportunities (41 per cent), the closing of the investment period (29 per cent) and mismatches in market trends (12 per cent).
In 60 per cent of cases, the exit will be completed through trade sales operations, with 55 per cent of investors paying an EBITDA with a multiple higher than 10 times, a strong decrease compared to expectations in 2016 when 73 per cent expected multiples greater than 10 times.
2017 Exit and Investment Strategy
Source: Elaboration on Deloitte survey

Fashion & Luxury Private Equity and Investors Survey 2017 | Private Equity and Investors Survey 2017
34
Expected new investments in 2017Personal Luxury Goods remain the most attractive sectors for investors, with Apparel & Accessories and Cosmetics & Fragrances becoming more prominent. The disruptive trend of Digital Luxury is becoming focal.
Key findings
Survey respondents identified the following sectors as the most attractive: Apparel & Accessories (68 per cent), Cosmetics & Fragrances (49 per cent), Selective Retailing (30 per cent) and Furniture (26 per cent).
Interest in Watches & Jewellery is stable, with 21 per cent of funds ready to invest.
Digital Luxury is the new entry, attracting 15 per cent of investors.
No
Yes
Will your fund acquire an F&L asset in 2017?
100%
90%of PEfunds
10%
(Percentage of respondents)
Watches& Jewellery
26%Furniture
Cosmetics &Fragrances
Digitalluxury
21%
49%
Apparel &Accessories
15%
Selectiveretailing 30%
68%
(Percentage points)
-7%
Personal Luxury Goods Other F&L sectors
Source: Elaboration on Deloitte survey
-4%
1%
0%
-12%
18%
Most attractive sectors for investors Change in 2016-17
Source: Elaboration on Deloitte survey

Fashion & Luxury Private Equity and Investors Survey 2017 | Private Equity and Investors Survey 2017
35
F&L sector attractivenessBoth Apparel & Accessories and Cosmetics & Fragrances are remarkably attractive to investors, yet the appeal of Apparel & Accessories has declined. Market and consumer dynamics are creating interest in Digital Luxury.
Map of investor attraction in F&L sectors
Source: Elaboration on Deloitte survey
-25
-20
-15
-10
-5
0
5
10
15
20
40 % 60%20 % 30 % 50 %0 70%10 % 80%
Ch
ange
in 2
016-
17(P
erce
ntag
e po
ints
)
Watches& Jewellery
Investment propensity 2017(Percentage of respondents)
Other
Digital
Furniture
SelectiveRetailing
Cosmetics& Fragrances
Apparel& Accessories
Personal luxury goodsKey findings
Virtualization trends in the consumer purchasing process are leading to the creation of a new cluster of firms focusing on Digital Luxury, mainly in the Cosmetics & Fragrances sector.
The attraction of Watches & Jewellery remains stable, despite the slowing Asian market, given that they are less volatile.
The appeal of Apparel & Accessories has fallen, yet the sector remains the primary choice for investors, attracted by higher margins performances.
Notes: The bubble size represents the general investory propensitySource: Elaboration on Deloitte survey
Fashion & Luxury Private Equity and Investors Survey 2017 | Private Equity and Investors Survey 2017
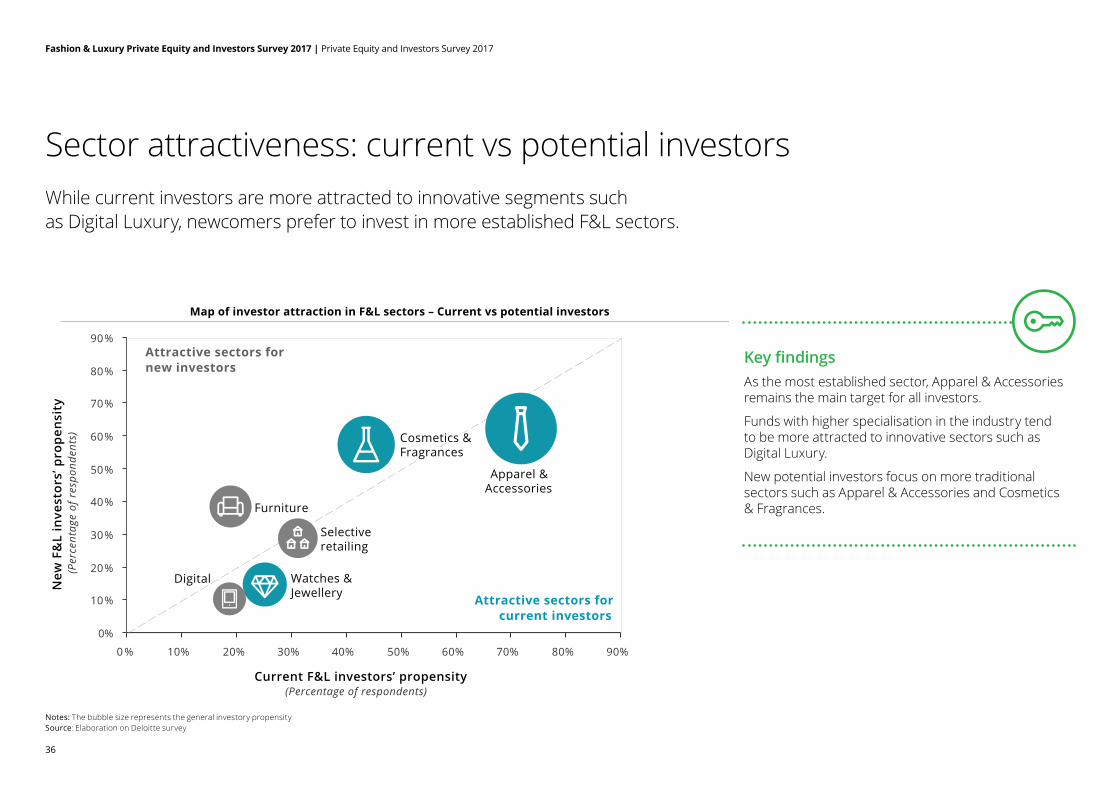
36
Sector attractiveness: current vs potential investorsWhile current investors are more attracted to innovative segments such as Digital Luxury, newcomers prefer to invest in more established F&L sectors.
Map of investor attraction in F&L sectors – Current vs potential investors
90%70%50%30%0 %
90%
80%
70%
50%
40%
60%
30%
20%
10%
0%
80%60%40%20%10%
(Per
cent
age
of r
espo
nden
ts)
Current F&L investors’ propensity(Percentage of respondents)
Watches &Jewellery
Furniture
Selectiveretailing
Digital
Apparel &Accessories
Attractive sectors for current investors
Attractive sectors for new investors
New
F&
L in
vest
ors’
pro
pen
sity
Source: Elaboration on Deloitte survey
Cosmetics &Fragrances
Key findingsAs the most established sector, Apparel & Accessories remains the main target for all investors.
Funds with higher specialisation in the industry tend to be more attracted to innovative sectors such as Digital Luxury.
New potential investors focus on more traditional sectors such as Apparel & Accessories and Cosmetics & Fragrances.
Notes: The bubble size represents the general investory propensitySource: Elaboration on Deloitte survey

Fashion & Luxury Private Equity and Investors Survey 2017 | Private Equity and Investors Survey 2017
37
Growth strategies for the F&L portfolioInternationalisation, digital strategies and restructuring are becoming more important drivers of F&L portfolios.
Key findingsInternationalisation is now the main strategic lever (67 per cent) adopted by F&L investors to grow their asset value.
According to investors, Digital Strategy Design (23 per cent) is becoming a priority topic for F&L companies seeking faster growth.
Frequently funds acquire underperforming companies, aiming to bring sales growth and margins up to the average sector performance.
Source: Elaboration on Deloitte survey
Main adopted strategic drivers for the F&L portfolio(Percentage of respondents, Percentage)
Digital strategy design
23%
Performance improvement
19%
New production
development
24% 24%30%
Restructuring/leverage strategy
New distribution
channel
Internatio -nalisation
67%
+13 - 18+20- 4- 30+15
90%
Change in % points 2016-17
Source: Elaboration on Deloitte survey

Fashion & Luxury Private Equity and Investors Survey 2017 | Private Equity and Investors Survey 2017
38
Size of potential investment in F&LInvestors are more inclined to acquire small and medium-sized firms. However, F&L industry consolidation is provoking investments in larger-sized targets.
Key findingsInvestors are typically attracted to small (42 per cent) and medium-sized (35 per cent) businesses.
But the continuous consolidation of the F&L industry also led investors in 2016 towards larger companies (+10 percentage points)
Target companies in Cosmetics & Fragrances, Watches & Jewellery, Furniture and Digital Luxury tend to be smaller (<$50m), while in Apparel & Accessories the average target turnover is higher.
Average sales of potential target companies(Percentage of respondents)
90%
36%47% 45% 44% 44% 45% 42%
39%
38%27% 31%
56%
30% 35%
25%15%
28% 25% 25% 23%
Wat & Jew
100%100%100%
Cos & FraApp & Acc
100%
Total F&L
100%100% 100%
FurnitureRetailing Digital
Medium ($50-$250m) Small (< $50m)Big (> $250m) Change in 2016-17 (% points)
+10%
- 21%
Source: Elaboration on Deloitte survey
+10%
Source: Elaboration on Deloitte survey

Fashion & Luxury Private Equity and Investors Survey 2017 | Private Equity and Investors Survey 2017
39
Main features of the M&A dealThe preferred deal strategies are Leveraged Buyout (LBO), Expansion Capital and Management Buyout (MBO), financed mostly through senior debt, aimed at acquiring a majority stake in the targeted companies.
Key findingsThe main deal strategies adopted by investors in 2017 are: LBO/Replacement (33 per cent), Support to the MBO (29 per cent) and Expansion capital (25 per cent).
Operations financed through senior debt have been increasing at the expense of shareholder loans. Mezzanine financing has become one of the most used sources.
Most deals focus on acquisitions of majority stakes.
Structure of the new F&L investment deals(Percentage of respondents)
90%
18%
25%
100%
28%
25%
29%
LBO/Replacement
100%
13%
Supportto MBO/MB
Other
2017
33%
Expansioncapital
29%
2016
Deal type
19%
20%
Shareholders’loan
2017
Senior debt
15%
46%
2016
100%
44%
Mezzaninefinancing
100%
Other
24%
17%
15%
Funding Stake
2017
Minority
Majority
100%
2016
100%
73%
27%
81%
19%
Source: Elaboration on Deloitte survey
Source: Elaboration on Deloitte survey

Fashion & Luxury Private Equity and Investors Survey 2017 | Private Equity and Investors Survey 2017
40
Return expected from new investmentsInvestors forecast rates of return from their assets ranging from 21 per cent to 30 per cent, with Selective retailing and Furniture the expected top performers (>30 per cent).
Key findingsOn average funds expect an IRR from their investments ranging from 21 per cent to 30 per cent, while 9 per cent forecast a higher performance (>30 per cent).
Lower expected rates of return for Watches & Jewellery do not play a major role in investors’ strategies, given the lower volatility of this segment.
Retailing and Furniture are expected to guarantee investors a higher IRR.
Internal Rate of Return (IRR) expected from new F&L investments
90%
22%12%
27%19% 21%
72%77%
73%
63%71%
70%
11% 18% 22%9%
7%
6%
App & Acc
100%
Cos & Fra
100%
Wat & Jew
100%100%
Retailing
100%
Furniture Total F&L
100%
Change in 2016-17 (% points)
- 2%
0%
+8%
(Percentage of respondents)
10-20%21-30% > 30%
Source: Elaboration on Deloitte survey
Source: Elaboration on Deloitte survey

Fashion & Luxury Private Equity and Investors Survey 2017 | Private Equity and Investors Survey 2017
41
Return from new investments: small yields moreRespondents confirm the existence of a correlation between a target firm’s size and the expected rate of return from investment. A return grater than 20 per cent is more likely from mid-sized and small firms.
IRR expected from new F&L investments – Breakdown by target company size(Percentage)
Source: Elaboration on Deloitte survey
Targ
et T
urn
over
Siz
e (P
erce
ntag
es)
Medium company($50-$250m )
Expected IRR(Percentages)
> 20%
Small company(< $50m)
Big company(> $250m)
< 20%
9%
26%
36%
37%
55%
37%
Source: Elaboration on Deloitte survey

Fashion & Luxury Private Equity and Investors Survey 2017 | Profile of Survey Respondents

Fashion & Luxury Private Equity and Investors Survey 2017 | Private Equity and Investors Survey 2017
43
Funds’ key features95 per cent of survey participants are medium-large Private Equity Funds. In 31 per cent of cases, they hold a portfolio of net assets greater than $1bn.
Fund strategy
Fund core industries
Private Equity Fund
95%
5%
Other types
100%
31% > $1bn
$100m - $500m
$501m -$1bn
< $100m
% of respondents
13%
47%
9%
100%
60%
15%
Growth
% of respondents
Other1
Buyout
25%
21%
19%
17%
16%
100%
9%
% of repondents
Retail &Consumer
HealthcareTMT
Industrial
Other
F&L18%
Fund net assets
Investor type% of respondents
The main strategic approach of the involved funds are: buyout (60 per cent) and growth (25 per cent) strategies
About 47 per cent of funds participating in the survey have net assets ranging from $100-500m, while 31 per cent have full net assets greater than $1bn
The main industries represented in investors’ portfolios are: Retail & Consumer (21 per cent), Industrial (19 per cent), F&L (18 per cent) and Healthcare (16 per cent)
Note: (1) Other investors: Family offices, Luxury Holdings and Sovereign Wealth fundsSource: Elaboration on Deloitte survey
Note: (1) Other investors: Family offices, Luxury Holdings and Sovereign Wealth fundsSource: Elaboration on Deloitte survey
Profile of Survey Respondents

Fashion & Luxury Private Equity and Investors Survey 2017 | Private Equity and Investors Survey 2017
44
Profile of survey respondentsRespondents are senior members of their funds, with substantial knowledge of F&L.
RESPONDENTS’ LOCATIONS RESPONDENTS’ ROLES
Managing Directorand/or Partner
53%
Investmentmanager
16%
Directorand/orPrincipal
31%
(Percentage of respondents)
Main countries
GLOBAL
Source: Elaboration on Deloitte survey
Source: Elaboration on Deloitte survey

Fashion & Luxury Private Equity and Investors Survey 2017 | Private Equity and Investors Survey 2017
45
Funds’ current F&L portfolio Main sectorsInvestors mainly manage assets in Apparel & Accessories (82 per cent) and Watches & Jewellery (30 per cent), Retailing (18 per cent), Furniture (15 per cent) and Cosmetics & Fragrances (15 per cent).
Note: (1) “Other F&L Sectors” includes mainly: Yachts (9%), Hotels (6%), Cruise (3%) and Digital luxury (6%)Source: Elaboration on Deloitte survey
15% 15%
Cosmetics& Fragrances
Furniture OtherF&L Sectors1
SelectiveRetailing
33%
18%
Apparel& Accessories
Watches& Jewellery
30%
82%
Main F&L assets managed by investors(Percentage of respondents)
of investors have a Fashion & Luxury asset in their portfolio 56%
Note: (1) “Other F&L Sectors” includes mainly: Yachts (9 per cent), Hotels (6 per cent), Cruises (3 per cent) and Digital luxury (6 per cent)Source: Elaboration on Deloitte survey

46
Fashion & Luxury Private Equity and Investors Survey 2017 | Private Equity and Investors Survey 2017
84 per cent of current F&L investors focus 25 per cent or less of their overall portfolio on the F&L industry. Investors usually hold their F&L assets for less than 5 years, with a majority stake.
Portfolio equity stake and duration(Percentage of respondents)
79%
21%
27%
73%
Equity stake Duration
Minority
Majority > 5 years
< 5 years
Portfolio focus in F&L industry(Percentage of respondents)
Low focus(< 5% of AuM)
16%
48%
36%
High focus(>25% of AuM) Medium focus
(5 - 25% of AuM) - 7%
Change in 2016-17(% points)
-1%
+ 8%
Source: Elaboration on Deloitte survey
Funds’ current F&L portfolio Structure
Source: Elaboration on Deloitte survey
Fashion & Luxury Private Equity and Investors Survey 2017 | Private Equity and Investors Survey 2017
47
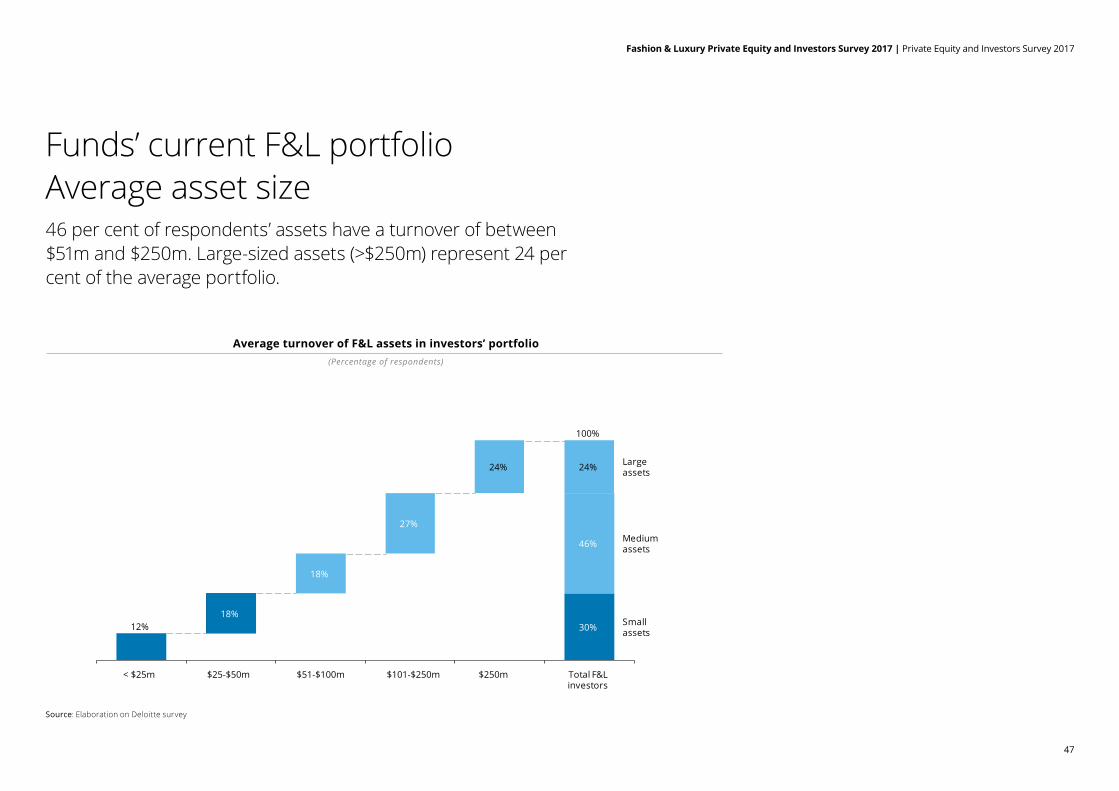
46 per cent of respondents’ assets have a turnover of between $51m and $250m. Large-sized assets (>$250m) represent 24 per cent of the average portfolio.
24%
46%
18%
Mediumassets
Smallassets12%
$250m
18%
100%
Largeassets
30%
Total F&Linvestors
24%
27%
< $25m $25-$50m $51-$100m $101-$250m
(Percentage of respondents)
Average turnover of F&L assets in investors’ portfolio
Source: Elaboration on Deloitte survey
Funds’ current F&L portfolio Average asset size
Source: Elaboration on Deloitte survey

Fashion & Luxury Private Equity and Investors Survey 2017 | About Deloitte and its F&L Practice

49
Fashion & Luxury Private Equity and Investors Survey 2017 | Glossary
Main Terms and Abbreviations
Personal Luxury Goods
Personal Luxury Goods include the following sectors: Apparel & Accessories, Cosmetics & Fragrances and Watches & Jewellery
App&Acc Abbreviation for Apparel & Accessories
AuM Acronym for Assets Under Management
CAGR Acronym for Compound Annual Growth Rate
Cos&Fra Abbreviation for Cosmetics & Fragrances
F&L Abbreviation for Fashion & Luxury
IRR Acronym for Internal Rate of Return
PE Acronym for Private Equity
PLG Acronym for Personal Luxury Goods
RoW Acronym for Rest of the World
Wat&Jew Abbreviation for Watches & Jewellery
Glossary

50
Contacts
EMEA Fashion & Luxury LeaderPatrizia [email protected]
FranceBenedicte [email protected]
Germany Karsten [email protected]
ItalyPatrizia [email protected]
NetherlandsVictor [email protected]
ChinaIvan Man Kit [email protected]
FranceClaire [email protected]
Germany Karsten [email protected]
ItalyElio [email protected]
Tommaso [email protected]
Mirko [email protected]
LuxemburgNick [email protected]
SpainJuan José [email protected]
SwitzerlandKarine [email protected]
TurkeyHakan [email protected]
UKNick [email protected]
SingaporeJiak See [email protected]
SpainRoberto Martinez [email protected]
Tomas De [email protected]
SwitzerlandAndreas X [email protected] UKRichard [email protected]
Mark [email protected]
USALorin DeMordaunt [email protected]
Deloitte Financial Advisory contactsDeloitte Fashion & Luxury Leaders
50
Fashion & Luxury Private Equity and Investors Survey 2017 | Contacts

Fashion & Luxury Private Equity and Investors Survey 2017 | About Deloitte and its F&L Practice

Notes & comments


Deloitte provides audit, consulting, financial advisory, risk management, tax and related services to public and private clients spanning multiple industries. With a globally connected network of member firms in more than 150 countries and territories, Deloitte brings world class capabilities and high-quality service to clients, delivering the insights they need to address their most complex business challenges.
This publication has been written in general terms and therefore cannot be relied on to cover specific situations; application of the principles set out will depend upon the particular circumstances involved and we recommend that you obtain professional advice before acting or refraining from acting on any of the contents of this publication. This publication and the information contained herein is provided “as is,” and Deloitte University EMEA CVBA makes no express or implied representations or warranties in this respect and does not warrant that the publication or information will be error-free or will meet any particular criteria of performance or quality. Deloitte University EMEA CVBA accepts no duty of care or liability for any loss occasioned to any person acting or refraining from action as a result of any material in this publication.
© 2017 Deloitte University EMEA CVBA
Responsible publisher: Deloitte University EMEA CVBA, with registered office at B-1831 Diegem, Berkenlaan 8b