Fashion Crimes: Trending-Term Exploitation on the Web · Fashion Crimes: Trending-Term Exploitation...
12
Fashion Crimes: Trending-Term Exploitation on the Web Tyler Moore Wellesley College ∗ [email protected] Nektarios Leontiadis Carnegie Mellon University [email protected] Nicolas Christin Carnegie Mellon University [email protected] ABSTRACT Online service providers are engaged in constant conflict with mis- creants who try to siphon a portion of legitimate traffic to make illicit profits. We study the abuse of “trending” search terms, in which miscreants place links to malware-distributing or ad-filled web sites in web search and Twitter results, by collecting and ana- lyzing measurements over nine months from multiple sources. We devise heuristics to identify ad-filled sites, report on the prevalence of malware and ad-filled sites in trending-term search results, and measure the success in blocking such content. We uncover collu- sion across offending domains using network analysis, and use re- gression analysis to conclude that both malware and ad-filled sites thrive on less popular, and less profitable trending terms. We build an economic model informed by our measurements and conclude that ad-filled sites and malware distribution may be economic sub- stitutes. Finally, because our measurement interval spans February 2011, when Google announced changes to its ranking algorithm to root out low-quality sites, we can assess the impact of search- engine intervention on the profits miscreants can achieve. Categories and Subject Descriptors K.4.1 [Public Policy Issues]: Abuse and crime involving comput- ers General Terms Measurement, Security, Economics Keywords Online crime, search engines, malware, advertisements 1. INTRODUCTION News travels fast. Blogs and other websites pick up a news story only about 2.5 hours on average after it has been reported by tra- ditional media [21]. This leads to an almost continuous supply of ∗ This work was primarily done while T. Moore was at Harvard University. Permission to make digital or hard copies of all or part of this work for personal or classroom use is granted without fee provided that copies are not made or distributed for profit or commercial advantage and that copies bear this notice and the full citation on the first page. To copy otherwise, to republish, to post on servers or to redistribute to lists, requires prior specific permission and/or a fee. CCS’11, October 17–21, 2011, Chicago, Illinois, USA. Copyright 2011 ACM 978-1-4503-0948-6/11/10 ...$10.00. Figure 1: Ad-filled website appearing in the results for trending terms (only 8 words from the article, circled, appear on screen). new “trending” topics, which are then amplified across the Internet, before fading away relatively quickly. However narrow, these first moments after a story breaks present a window of opportunity for attackers to infiltrate web and social network search results in response. The motivation for doing so is primarily financial. Websites that rank high in response to a search for a trending term are likely to receive considerable amounts of traffic, regardless of their quality. Web traffic can in turn be mone- tized in a number of ways, as shown in related work [6, 10, 17, 20]. In short, manipulation of web or social network search engine re- sults can be a profitable enterprise for its perpetrators. In particular, the sole goal of many sites designed in response to trending terms is to produce revenue through the advertisements that they display in their pages, without providing any original con- tent or services. Figure 1 presents a screenshot for eworldpost. com, which has appeared in response to 549 trending terms be- tween July 2010 and March 2011. The actual article (circled) is hard to find, when compared to the amount of screen real estate dedicated to ads. Such sites are often referred to as “Made for AdSense” (MFA) after the name of the Google advertising plat- form they are often targeting. Whether such activity is deemed to be criminal or merely a nuisance remains an open question, and largely depends on the tactics used to prop the sites up in the search- engine rankings. Some other sites devised to respond to trending terms have more overtly sinister motives. For instance, a number of malicious sites serve malware in hopes of infecting visitors’ ma- chines [30], or peddle fake anti-virus software [2, 8, 36]. Both MFA and malware-hosting sites are enough of a scourge to trigger response from search engine operators. Google modi- fied its search algorithm in February 2011 in part to combat MFA sites [35], and has long been offering the Google Safe Browsing API to block malware-distribution sites. Trending-term exploita-
Transcript of Fashion Crimes: Trending-Term Exploitation on the Web · Fashion Crimes: Trending-Term Exploitation...

Fashion Crimes: Trending-Term Exploitation on the Web
Tyler MooreWellesley College∗
Nektarios LeontiadisCarnegie Mellon University
Nicolas ChristinCarnegie Mellon University
ABSTRACT
Online service providers are engaged in constant conflict with mis-creants who try to siphon a portion of legitimate traffic to makeillicit profits. We study the abuse of “trending” search terms, inwhich miscreants place links to malware-distributing or ad-filledweb sites in web search and Twitter results, by collecting and ana-lyzing measurements over nine months from multiple sources. Wedevise heuristics to identify ad-filled sites, report on the prevalenceof malware and ad-filled sites in trending-term search results, andmeasure the success in blocking such content. We uncover collu-sion across offending domains using network analysis, and use re-gression analysis to conclude that both malware and ad-filled sitesthrive on less popular, and less profitable trending terms. We buildan economic model informed by our measurements and concludethat ad-filled sites and malware distribution may be economic sub-stitutes. Finally, because our measurement interval spans February2011, when Google announced changes to its ranking algorithmto root out low-quality sites, we can assess the impact of search-engine intervention on the profits miscreants can achieve.
Categories and Subject Descriptors
K.4.1 [Public Policy Issues]: Abuse and crime involving comput-ers
General Terms
Measurement, Security, Economics
Keywords
Online crime, search engines, malware, advertisements
1. INTRODUCTIONNews travels fast. Blogs and other websites pick up a news story
only about 2.5 hours on average after it has been reported by tra-ditional media [21]. This leads to an almost continuous supply of
∗This work was primarily done while T. Moore was at HarvardUniversity.
Permission to make digital or hard copies of all or part of this work forpersonal or classroom use is granted without fee provided that copies arenot made or distributed for profit or commercial advantage and that copiesbear this notice and the full citation on the first page. To copy otherwise, torepublish, to post on servers or to redistribute to lists, requires prior specificpermission and/or a fee.CCS’11, October 17–21, 2011, Chicago, Illinois, USA.Copyright 2011 ACM 978-1-4503-0948-6/11/10 ...$10.00.
Figure 1: Ad-filled website appearing in the results for trendingterms (only 8 words from the article, circled, appear on screen).
new “trending” topics, which are then amplified across the Internet,before fading away relatively quickly.
However narrow, these first moments after a story breaks presenta window of opportunity for attackers to infiltrate web and socialnetwork search results in response. The motivation for doing so isprimarily financial. Websites that rank high in response to a searchfor a trending term are likely to receive considerable amounts oftraffic, regardless of their quality. Web traffic can in turn be mone-tized in a number of ways, as shown in related work [6, 10, 17, 20].In short, manipulation of web or social network search engine re-sults can be a profitable enterprise for its perpetrators.
In particular, the sole goal of many sites designed in responseto trending terms is to produce revenue through the advertisementsthat they display in their pages, without providing any original con-tent or services. Figure 1 presents a screenshot for eworldpost.com, which has appeared in response to 549 trending terms be-tween July 2010 and March 2011. The actual article (circled) ishard to find, when compared to the amount of screen real estatededicated to ads. Such sites are often referred to as “Made forAdSense” (MFA) after the name of the Google advertising plat-form they are often targeting. Whether such activity is deemedto be criminal or merely a nuisance remains an open question, andlargely depends on the tactics used to prop the sites up in the search-engine rankings. Some other sites devised to respond to trendingterms have more overtly sinister motives. For instance, a numberof malicious sites serve malware in hopes of infecting visitors’ ma-chines [30], or peddle fake anti-virus software [2, 8, 36].
Both MFA and malware-hosting sites are enough of a scourgeto trigger response from search engine operators. Google modi-fied its search algorithm in February 2011 in part to combat MFAsites [35], and has long been offering the Google Safe BrowsingAPI to block malware-distribution sites. Trending-term exploita-

tion makes both MFA and malware sites even more dynamic thanthey used to be, thereby complicating the defenders’ task.
This paper provides the first large-scale measurement and anal-ysis of trending-term exploitation on the web. Based on a collec-tion of over 60 million search results and tweets gathered over ninemonths, we characterize how trending terms are used to performweb search-engine manipulation and social-network spam. An im-portant feature of our work is that we bring an outsider’s perspec-tive. Instead of relying on proprietary data tied to a specific searchengine, we use comparative measurements of publicly observabledata across different web search engines (Google, Yahoo!/Bing)and social network (Twitter) posts.
Our specific contributions are as follows. We (1) provide a method-ology to automate classification of websites as MFA, (2) show salientdifferences between tactics used by MFA site operators and mal-ware peddlers, (3) construct an economic model to characterize thetrade-offs between advertising and malware as monetization vec-tors, quantifying the potential profit to the perpetrators, and (4) ex-amine the impact of possible intervention strategies.
The rest of this paper is organized as follows. We introduceour measurement and classification methodology in Section 2. Weanalyze the measurements collected in Section 3 to characterizetrending-term exploitation on the web. Notably, we uncover collu-sion across offending domains using network analysis, and we useregression analysis to conclude that both malware and MFA sitesthrive on less popular and profitable trending terms. We then usethese findings to build an economic model of attacker revenue inSection 4, and examine the effect of search-engine intervention inSection 5. We compare our study with related work in Section 6,before drawing brief conclusions in Section 7.
2. METHODOLOGYWe start by describing our methodology for data collection and
website classification. At a high level, we need to issue a numberof queries on various search engines for current trending terms, fol-low the links obtained in response to these queries, and classify thewebsites we eventually reach as malicious or benign. Within thecollection of malicious sites so obtained, we have to further distin-guish between malware-hosting sites and ad-laden sites. Moreover,we need to compare the results obtained with those collected from“ordinary,” rather than trending, terms.
The data collection hinges on a number of design choices that wediscuss and motivate here. Specifically, we must determine how tobuild the corpus of trending terms to use in queries (“trending set”);identify a set of control queries (“control set”) against which we cancompare responses to queries based on trending terms; decide onhow frequently, and for how long, we issue each set of queries; andfind mechanisms to classify sites as benign, malware-distributing,and MFA.
2.1 Building query corporaBuilding a corpus of trending terms is not in itself a challenging
exercise. Google, through Google Hot Trends [15], provides a listof twenty current “hot searches,” which we determined, throughpilot experiments, to be updated hourly. Likewise, Twitter avails alist of ten trending topics [37] and Yahoo! gives a “buzz log” [38]containing the 20 most popular searches over the past 24 hours.
These different lists sometimes have very little overlap. Forinstance, combining the 20 Yahoo! Buzz logs, 20 Google HotTrends, and 10 Twitter Trending Topics, it is not uncommon to findmore than 40 distinct trending terms over short time intervals. Thiswould seem to make the case for aggregating all sources to buildour query corpus. However, all search APIs limit the rate at which
queries can be issued. We thus face a trade-off between the timegranularity of our measurements and the size of our query corpus.Trending set. Fortunately, we can capture most of the interestingpatterns we seek to characterize by solely focusing on Google HotTrends. Indeed, a recent measurement study conducted by Johnet al. [17] shows that over 95% of the terms used in search en-gine manipulation belong to the Google Hot Trends. However, be-cause Twitter abuse may not necessarily follow the typical searchengine manipulation patterns, we use both Google Hot Trends andthe Twitter current trending topics in our Twitter measurements.
Hot trends, by definition, are constantly changing. We updateour trending term corpus every hour by simply adding the currentGoogle Hot Trends to it. Determining when a term has “cooled”and should be removed from the query corpus is slightly less straight-forward. We could simply remove terms from our query corpus assoon as they disappear from the list of Google Hot Trends. How-ever, unless all miscreants stop poisoning search results with agiven term as soon as this term has “cooled,” we would likely missa number of attempts to manipulate search engine results. Further-more, Hot Trends are selected based upon their rate of growth inquery popularity. Terms that have fallen out of the list in mostcases still enjoy a sustained period of popularity before falling.
We ran a pilot experiment collecting Google and Twitter searchresults on 20 hot terms for up to four days. As Figure 2(a) shows,95% of all unique Google search results and 81% of Twitter resultsare collected within three days. Thus, we settled on searching fortrending terms while they remain in the rankings, plus up to threedays after they drop out of the rankings.Control set. It is necessary to compare results from the trendingset to a control set of consistently popular search terms, to identifywhich phenomena are unique to the trending nature of the terms asopposed to their overall popularity. We build a control list of themost popular search terms in 2010 according to Google Insights forSearch [13]. Google lists the top 20 most popular search terms for27 categories. These reduce to 495 unique search terms, which weuse as a control set.
2.2 Data collectionFor each term in our trending and control sets, we run automated
searches on Google and Yahoo! between July 24, 2010 and April24, 2011. We investigate MFA results throughout that period, andstudy the timeliness of malware identification between January 26and April 24, 2011. We study Twitter results gathered betweenMarch 10 and April 18, 2011.
We use the Google Web Search API [1] to pull the top 32 searchresults for each term from the Google search engine, and the Ya-hoo! BOSS API to fetch its top 100 Yahoo! results for each term.Since the summer of 2010 Yahoo! and Bing search results areidentical [23]. Consequently, while in the paper we refer to Ya-hoo! results, they should also be interpreted as those appearing onBing. Likewise, we use the Twitter Atom API to retrieve the top 16tweets for each term in Google’s Hot Trends list and Twitter’s Cur-rent Trends list. We resolve and record URLs linked from tweets,as well as the authors of these tweets linking to other sites.
Because all these APIs limit the number of queries that can berun, we had to limit the frequency with which we ran the searchqueries. To better understand the trade-offs between search fre-quency and comprehensiveness of coverage, we selected 20 termsfrom a single trending list and ran searches using the Google APIevery 10 minutes for one week. We then compared the results wecould obtain using the high-frequency sampling to what we foundwhen sampling less often. The results are presented in Figures 2(b)and 2(c). Sampling once every 20 minutes, rather than every 10

0 20 40 60 80 100
02
04
06
08
01
00
Hours since start of collection
% tota
l re
sults c
olle
cte
d
GoogleTwitter
(a) New search results as a function of timein Twitter and Google. More than 80% ofGoogle results appear within 3 days, whileTwitter continuously produces new results.
50 100 150 200
12
00
13
00
14
00
dis
tinct U
RLs Google
50 100 150 200
40
00
10
00
01
60
00
collection intervals (minutes)
dis
tinct U
RLs Twitter
(b) Number of distinct URLs collected us-ing different collection intervals. The mea-surement lasted for two weeks using a fixedset of terms that was trending at the begin-ning of the experiment.
50 100 150 200
02
04
06
08
0
collection intervals (minutes)
% o
f m
issed r
esults
GoogleTwitter
(c) Number of distinct URLs that we failedto collect using different collection inter-vals. The measurement lasted for twoweeks using a fixed set of terms that wastrending at the beginning of the experiment
Figure 2: Calibration tests weigh trade-offs between comprehensiveness and efficiency for collecting trending-term results.
minutes, caused 4% of the Google search results to be missed.Slower intervals caused more sites to be missed, but only slightly:85% of the search results found when reissuing the query every10 minutes could also be retrieved by sampling only once every4 hours. So, even for trending topics, searching for the hot termsonce every four hours provides adequate coverage of Google re-sults. For consistency, we used the same interval on Twitter despitethe higher miss rate. Twitter indeed continues producing new re-sults over a longer time interval, primarily due to the “Retweet”function which allows users to simply repost existing contents.
2.3 Website classificationWe next discuss how we classified websites as benign, malware-
distributing, or ad-filled. We define a website as a set of pageshosted on the same second-level DNS domain. That is, this.example.com and that.example.com belong to the samewebsite.1 While we realize that different websites may be hostedon the same second-level domains, they are ultimately operated orendorsed by the same entity – the owner of the domain. Hence, in aslight abuse of terminology we will equivalently use “website” and“domain” in the rest of this discussion.
Malware-distributing sites. We pass all search results to Google’sSafe Browsing API, which indicates whether a URL is currentlyinfected with malware by checking it against a blacklist. Becausethe search results deal with timely topics, we are only interested infinding which URLs are infected near the time when the trendingtopic is reported. However, there may be delays in the blacklistupdates, so we keep checking the results against the blacklist for14 days after the term is no longer hot.
When a URL appears in the results and is only later added to theblacklist, we assume that the URL was already malicious but notyet detected as such. It is, of course, also possible that the reasonthe URL was not in the blacklist is that the site had not yet beeninfected. In the case of trending terms, however, a site appearingin results indicates a likely compromise, since the attacker’s modusoperandi is to populate compromised web servers with content thatreflects trending results [17].
1So do this.example.co.uk and that.example.co.uk,as co.uk is considered a top-level domain; as are a few others(e.g., ac.jp) for which we maintain an exhaustive list.
The possibility of later compromise further justifies our decisionto stop checking the search results against the blacklist after twoweeks have passed. While it is certainly possible that some mal-ware takes more than two weeks to be detected, the potential forprematurely flagging a site as compromised also grows with time.Indeed, in a study of spam on Twitter [10], the majority of tweetsflagged by the Google Safe Browsing API as malicious were notadded to the blacklist until around a month had passed. We sus-pect that many of the domains marked as malicious were in factonly compromised much later. Consequently, our decision to onlyflag malware detected within two weeks is a conservative one thatminimize false positives while slightly increasing false negatives.
Dealing with long-delayed reports of malware poses an addi-tional issue for terms from the control set, because these searchresults are more stable over time. Sometimes a URL appears in theresults of a term for years. If that website becomes infected, then itwould clearly be incorrect to claim that the website was infected butundetected the entire time. In fact, most malware appearing in theresults for the control set are for websites that have only recently“pushed” their way into the top search results after having beeninfected. For these sites, delays in detection do represent harm.
We thus exclude from our analysis of malware in the control setURLs that appeared in the results between December 20-31, 2010,when we began collecting results for the control set. To eliminatethe potential for edge effects, our analysis of malware does not be-gin until January 26, 2011. As in the trending set, we also only flagresults as malware when they are detected within 14 days.
Finally, we note that sometimes malware is undetected by theSafeBrowsing API on the top-level URL, but that URLs loaded ex-ternally by the website are blocked. Consequently, our analysisprovides an upper bound on malware success.
MFA sites. Automated identification of MFA sites is a dauntingtask. There are no clear rules for absolutely positive identification,and even human inspection suggests a certain degree of subjectivityin the classification. We discuss here a set of heuristics we use indetermining whether a site is MFA or not.
While 182 741 different domains appeared in the top 32 Googleand Yahoo! search results for trending terms over 9 months, only6 558 (3.6%) appeared in the search results for at least 20 differenttrending terms. Because the goal of MFA sites is to appear high inthe search results for as many terms as possible, we investigate fur-
ther which of these 6 558 websites are in fact legitimate sources ofinformation, and which are low-quality, ad-laden sites. To that ef-fect we selected a statistically significant (95% confidence interval)random sample of 363 websites for manual inspection. From thissample, we identified five broad categories of websites indicativeof MFA sites. All MFA sites appear to include a mechanism forautomatically updating the topics they cover; differences emerge inhow the resulting content is presented.
1. Sites which reuse snippets created by search engines and providedirect links to external sites with original content (e.g., http://newsblogged.com/tornado-news-latest-real-time).
2. Sites in blog-style format, containing a short paragraph of con-tent that is likely copied from other sources and only slightly tweaked– usually by a machine algorithm, rather than a human editor (e.g,http://toptodaynews.com/water-for-elephants-
review).
3. Sites that automatically update to new products for sale point-ing to stores through paid advertisements (for instance, http://tgiblackfriday.com/Online-Deals/-261-up-
Europe-On-Sale-Each-Way-R-T-required--deal).
4. Sites aggregating content by loading external websites into aframe so that they keep the user on the website along with theirown overlaid ads (e.g., http://baltimore-county-news.newslib.com/).
5. Sites containing shoddily, but seemingly manually written con-tent based on popular topics informed by trending terms (e.g., http://snarkfood.com/mel-gibsons-mistress-says-
hes-not-racist/310962/).
Based on manual inspection of our random sample of 363 sites,we decided to classify websites in any of the first four categoriesas MFA, while rejecting sites in the fifth category. (Including thosewould have driven up the false positive rate to unacceptable levels.)This results in 44 of the 363 websites being tagged as MFA.
Subsequently, we used a supervised machine-learning algorithm(Bayesian Network [29] constructed using the K2 algorithm [7]) toautomatically categorize the remaining 6 195 candidate websites.
The set of measures used to describe each page is a combinationof structural and behavioral characteristics: (1) the number of in-ternal links, i.e. links to the same domain as the web page underexamination; (2) the number of external links, i.e. links directedto external domains; and (3) the existence of advertisements in theweb page. We calculate these three quantities for each of the 6 558domains by parsing the front page of the domain and a set of fiveadditional web pages within the same domain, randomly chosenamong the direct links existing in the front page.
We experimented with many more features in the classifier (e.g„time since the website was registered, private WHOIS registration,number of trending terms where a website appears in the search re-sults, presence of JavaScript, etc). As manual inspection confirmed,this did not improve classification accuracy beyond the three fea-tures described in the paper. MFA sites exhibit large numbers ofexternal links but few internal links, because unlike external linksto ads, internal links do not (directly) generate revenue.
We determine whether a website has advertisements by lookingfor known advertising domains in the collected HTML. Becausethese domains often appear in JavaScript, we use regular expres-sions to search throughout the page. We use manually-collectedlists of known advertising domains used by Google and Yahoo!,complemented by the “Easy List” maintained by AdBlock Plus [3](Jan. 12, 2011).
We used a subset of the 363 sample domains as a training setfor the machine learning algorithm. We did not use the entire set
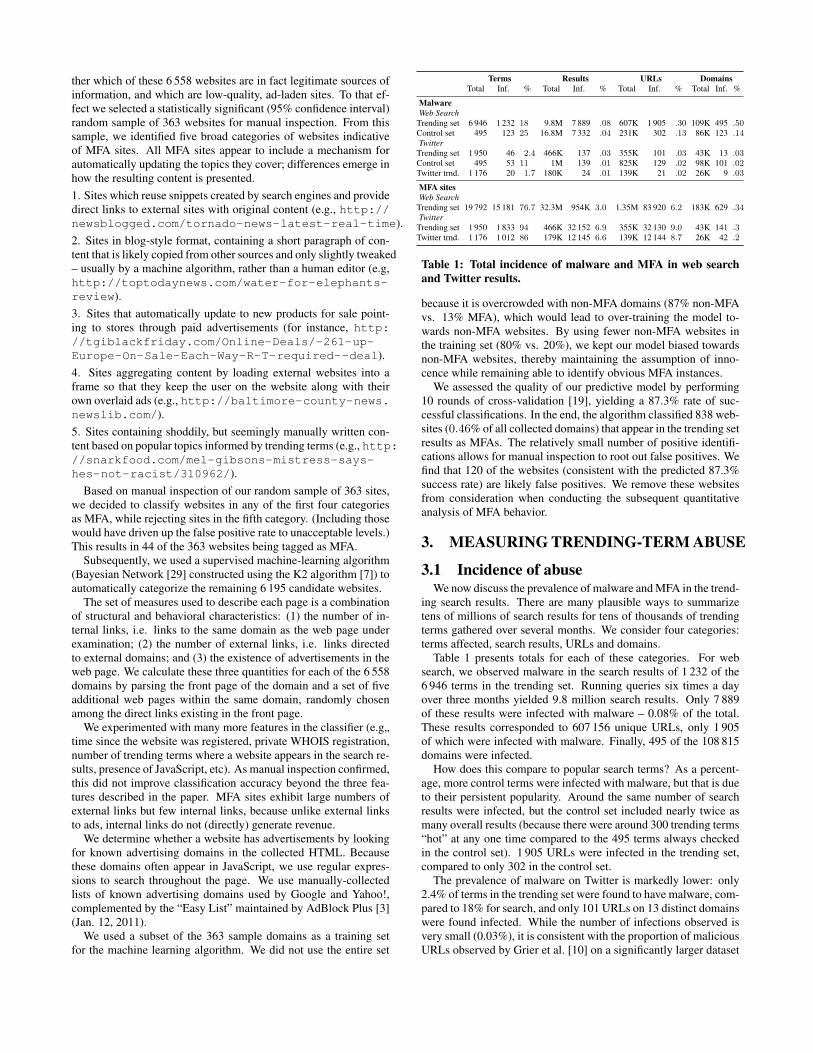
Terms Results URLs DomainsTotal Inf. % Total Inf. % Total Inf. % Total Inf. %
MalwareWeb Search
Trending set 6 946 1 232 18 9.8M 7 889 .08 607K 1 905 .30 109K 495 .50Control set 495 123 25 16.8M 7 332 .04 231K 302 .13 86K 123 .14Twitter
Trending set 1 950 46 2.4 466K 137 .03 355K 101 .03 43K 13 .03Control set 495 53 11 1M 139 .01 825K 129 .02 98K 101 .02Twitter trnd. 1 176 20 1.7 180K 24 .01 139K 21 .02 26K 9 .03
MFA sitesWeb Search
Trending set 19 792 15 181 76.7 32.3M 954K 3.0 1.35M 83 920 6.2 183K 629 .34Twitter
Trending set 1 950 1 833 94 466K 32 152 6.9 355K 32 130 9.0 43K 141 .3Twitter trnd. 1 176 1 012 86 179K 12 145 6.6 139K 12 144 8.7 26K 42 .2
Table 1: Total incidence of malware and MFA in web searchand Twitter results.
because it is overcrowded with non-MFA domains (87% non-MFAvs. 13% MFA), which would lead to over-training the model to-wards non-MFA websites. By using fewer non-MFA websites inthe training set (80% vs. 20%), we kept our model biased towardsnon-MFA websites, thereby maintaining the assumption of inno-cence while remaining able to identify obvious MFA instances.
We assessed the quality of our predictive model by performing10 rounds of cross-validation [19], yielding a 87.3% rate of suc-cessful classifications. In the end, the algorithm classified 838 web-sites (0.46% of all collected domains) that appear in the trending setresults as MFAs. The relatively small number of positive identifi-cations allows for manual inspection to root out false positives. Wefind that 120 of the websites (consistent with the predicted 87.3%success rate) are likely false positives. We remove these websitesfrom consideration when conducting the subsequent quantitativeanalysis of MFA behavior.
3. MEASURING TRENDING-TERM ABUSE
3.1 Incidence of abuseWe now discuss the prevalence of malware and MFA in the trend-
ing search results. There are many plausible ways to summarizetens of millions of search results for tens of thousands of trendingterms gathered over several months. We consider four categories:terms affected, search results, URLs and domains.
Table 1 presents totals for each of these categories. For websearch, we observed malware in the search results of 1 232 of the6 946 terms in the trending set. Running queries six times a dayover three months yielded 9.8 million search results. Only 7 889of these results were infected with malware – 0.08% of the total.These results corresponded to 607 156 unique URLs, only 1 905of which were infected with malware. Finally, 495 of the 108 815domains were infected.
How does this compare to popular search terms? As a percent-age, more control terms were infected with malware, but that is dueto their persistent popularity. Around the same number of searchresults were infected, but the control set included nearly twice asmany overall results (because there were around 300 trending terms“hot” at any one time compared to the 495 terms always checkedin the control set). 1 905 URLs were infected in the trending set,compared to only 302 in the control set.
The prevalence of malware on Twitter is markedly lower: only2.4% of terms in the trending set were found to have malware, com-pared to 18% for search, and only 101 URLs on 13 distinct domainswere found infected. While the number of infections observed isvery small (0.03%), it is consistent with the proportion of maliciousURLs observed by Grier et al. [10] on a significantly larger dataset

Terms Results Domains URLs# % # # % # %
Trending terms – web search (point in time)
detected 12.8 4.4 14.8 13.8 0.089 8.7 0.146top 10 2.9 1.0 3.2 3.1 0.020 2.4 0.040
undetected 6.2 2.1 7.6 6.7 0.0 3.718 0.061top 10 1.2 0.4 1.5 1.4 0.009 0.9 0.015
Control terms – web search (point in time)
detected 9.5 1.9 14.1 11.5 0.043 8.9 0.067top 10 3.1 0.6 3.9 3.7 0.014 3.1 0.023
undetected 1.0 0.2 1.0 1.0 0.0 0.856 0.006top 10 0.1 0.0 0.1 0.1 0.000 0.1 0.001
Table 2: Prevalence of malware in trending and control terms,presented as the average prevalence of malware at every pointin time when searches are issued.
of 25 million unique URLs. The control and Twitter-trending setsalso reveal similarly low levels of infection.
Grier et al. observed a much higher proportion of “spammy”behavior on Twitter. Likewise, we observe substantial promotion ofMFA websites on Twitter: 94% of trending terms contained tweetswith MFA domains. While most terms are targeted, only a smallnumber of domains are promoted – 141 in the trending set and 42 inthe Twitter-trending set. Web search is also targeted substantiallyby MFA sites. 77% of terms in the trending set included one ormore of the 629 MFA domains in at least one result.
From the figures in Table 1 alone, it would appear that malwareon trending terms is largely under control, while MFA sites are rel-atively rampant. However, aggregating figures across a large periodof time can obscure the potential harm of malware distributed viatrending terms. Table 2 presents the malware infection rate at a sin-gle point in time: counting the number of terms and search resultsthat are infected with malware for each of the trending terms withina 3-day window of rising. For example, on average, 12.8 trendingterms are infected with malware that has already been flagged bythe Safe Browsing API, which corresponds to 4.4% of recently hotterms at any given moment. A further 6.2 trending terms are in-fected but not yet detected by the blacklist. On average, 1.2 termsinclude a top 10 result that distributes malware and has not yet beendetected by the Safe Browsing API. Viewed in this manner, thethreat from web-based malware appears more worrisome.
But is the threat worse for trending terms? 9.5 control termsinclude detected malware at a given point in time, with one terminfected but not yet detected. Hence, popular terms are still tar-geted for malware, but less frequently than trending terms and withless success. Finally, the false negative rate for the trending set ismuch higher than for the control set: 34% (7.6 results undetectedcompared to 14.8 detected) vs. 7% (1 undetected result comparedto 14.1 detected).
3.2 Network characteristicsWe next turn to characterizing how sites preying on trending
terms are connected to each other. To prop up their rankings inGoogle, one would expect a group of sites operated by a same en-tity to link to each other – essentially building a “link farm [11].”Thus, we conjecture that looking at the network structure of bothMFA and malware-serving sites may yield some insight on boththe actors behind these attacks, and the way campaigns are orches-trated.
MFA domains. We build a directed graph GMFA where each nodecorresponds to one of the 629 domains we identified as MFA sites,and each of the 3 221 (directed) edges corresponds to an HTML
Campaign ID # Domains Duration Distinct ASes
949 590 >1 year >2005100 36 >8 months 15101 25 >8 months 15041 11 4 days 25053 10 2 days 14979 9 11 days 24988 9 8 days 2
Table 3: Malware campaigns observed.
link between two domains. We construct the graph by fetching1 000 backlinks for each of the sites from Yahoo! Site Explorer [39].Extracting the strongly connected components from GMFA yieldsfamily of sites that link to each other. We find 407 distinct stronglyconnected components, most (392) only contain singletons. Moreinterestingly, 193 sites (30.7% of all MFA sites) form a stronglyconnected component. These nodes have on average a degree (in-and out-links) of 12.83, and an average path length between twonodes of 3.92, indicating a quite tightly connected network. It thusappears that a significant portion of all MFA domains may be oper-ated by the same entity – or at the very least, by a unique group ofaffiliates all linking to each other. Further inspecting where thesesites are hosted indicates that 130 of the 193 sites belong to one ofonly seven distinct Autonomous Systems (AS); here, sites within asame AS are usually hosted by the same provider, which confirmsthe presence of a fairly large, collusive, MFA operation.
Malware-serving sites. Examining the network characteristics ofmalware-distributing sites serves a slightly different purpose. Here,sites connected to each other are unlikely to be operated by thesame entity, but are likely to have been compromised by the samegroup or as part of the same campaign. This is consistent withthe behavior observed by John et al. [17], who found that miscre-ants add links between malicious websites to elevate PageRank. Aswith MFA sites, we build a directed graph Gmal where each nodecorresponds to one of the 6 133 domains we identified as malware-serving based on a longer collection of trending terms gatheredfrom April 6, 2010 to April 27, 2011. Each (directed) edge cor-responds to an HTML link between two malware-serving domains.Gmal contains 6 133 nodes and 18 864 edges, and 5 125 distinctstrongly connected components, only 216 of which contain morethan one node. Table 3 lists the largest strongly connected com-ponents (“campaigns”) in Gmal. For each of the nodes in thesecampaigns, we look up the time at which they were first listed asinfected. By comparing the first and last nodes to be infected withina given campaign, we can infer the campaign’s duration. We alsolook up the number of distinct ASes in each campaign.
We observe divergent campaign behaviors, each characterized bymarkedly different attacker tactics. The largest campaign (949) isstill ongoing at the time of this writing: nodes are compromised ata relatively constant rate, and are hosted on various ASes. This in-dicates a long-term, sustained effort. This campaign affects at least9.6% of all the malware-infested sites we observed. Campaigns5100 and 5101 are likely part of the same effort: all nodes share thesame set of servers, and seem compromised by the same exploit.Interestingly, this campaign went unabated for at least 8 months(until Dec. 2010). Finally, the other four notable campaigns weobserved target small sets of servers, that are compromised almostsimultaneously, and all immediately link to each other.
Our definition of a campaign is extremely conservative: we areonly looking for strongly connected components in the graph wehave built. It is thus likely that many of the singletons we ob-

# of MFA domains tweeted by an author
# o
f a
uth
ors
15
10
50
50
0
1 5 9 14 22 28 34 42
(a) Number of Twitter authorsposting unique URLs contain-ing MFA domains. Most au-thors post up to 14 distinct do-mains.
0 50 100 150 200
20
40
60
80
10
0
# of MFA domains
% t
we
ets
re
ce
ive
d
Control setTrending set
(b) CDF of tweets associatedwith MFA domains. The x-axisshows the number of domainsassociated with a portion of thetweets.
Figure 3: Trending-term exploitation on Twitter.
served are in fact part of larger campaigns. Further detection ofsuch campaigns would require more complex clustering analysis.For instance, one could try to use the feature set of the classifi-cation algorithm as a coordinate system, and cluster nodes withnearby coordinates. However, it is unclear that this specific coordi-nate system would provide definitive evidence of collusion.
3.3 MFA in TwitterWe turn our attention now to the use of MFA links in Twitter
posts. We are interested in measuring the amount of unique MFA-related URLs each malicious user posts, and the popularity of theMFA websites among them.
Figure 3(a) shows that 95% of the authors who post MFA URLslink to 5 domains or less – this amounts to about 20 000 posts.However, the remaining 5% is responsible for about 55 000 posts,and links to 870 domains. The control set gives similar numbers.
In other words, a small number of authors are responsible forwide promotional campaigns of MFA websites. The vast majorityof authors post a small number of MFA links, and it is unclearwhether they are actually malicious or not.
Similarly, the number of MFA domains that receive the majorityof related tweets is small as Figure 3(b) shows. 50% of the MFAinfected tweets direct users to 14 MFA domains, with the remaining50% distributed across 180 MFA domains.
3.4 Search-term characteristicsWe now examine how characteristics of the trending terms them-
selves influence the prevalence of malware and MFA sites in theirsearch results. We focus on the importance of the term’s category,popularity in searches, and expected advertising revenue.
Measuring term category, popularity and ad prices. We com-bine results from several Google tools in order to learn more aboutthe characteristics of each of the trending terms. First, we classifythe trending terms into categories using Google Insights for Search,which assigns arbitrary search terms to the most likely category, outof the same 27 categories used for constructing the control sampledescribed in Section 2.1 above.
Second, Google offers a free service called Traffic Estimator thatestimates for any phrase the number of global monthly searchesaveraged over the past year [14]. For trending terms, averaging overthe course of a year significantly underestimates the search trafficwhen a term is peaking in popularity. Fortunately, Google alsooffers a measure of the relative popularity of terms through GoogleTrends [15], provided at the granularity of one week. The relativemeasure is normalized against the average number of searches for
Category Malware MFAname % CPC % terms % terms % top 10 coef.
Arts & Humanities 2.7 $0.44 20.1 40.6 6.8Automotive 1.3 $0.67 16.0 29.2 5.2 −0.0062Beauty & Personal Care 0.8 $0.76 19.6 32.5 6.9Business 0.4 $0.87 7.4 32.9 6.9Computers & Electronics 2.4 $0.61 14.5 31.7 5.9Entertainment 30.6 $0.34 18.6 41.0 6.4 −0.0043Finance & Insurance 1.4 $1.26 20.2 30.4 5.6Food & Drink 2.9 $0.43 17.1 49.5 7.9 +0.0105Games 2.3 $0.32 13.4 30.0 5.6 −0.0073Health 2.5 $0.85 14.1 27.6 5.9 −0.0046Home & Garden 0.5 $0.76 7.1 29.7 7.2Industries 1.6 $0.50 26.1 38.6 6.6 −0.0072Internet 0.7 $0.49 7.7 43.7 6.0Lifestyles 4.5 $0.33 25.4 45.8 6.5Local 11.0 $0.51 21.8 39.2 6.9 −0.0027News & Current Events 3.6 $0.39 19.7 45.0 7.0Photo & Video 0.2 $0.59 0.0 21.9 6.4Real Estate 0.2 $1.02 6.2 34.2 6.5Recreation 1.0 $0.43 13.7 43.5 6.5Reference 1.4 $0.43 14.5 55.4 8.7 +0.0203Science 1.4 $0.40 16.0 44.9 9.1 +0.0095Shopping 3.2 $0.56 11.6 43.7 8.8 +0.0106Social Networks 0.5 $0.19 27.8 59.1 6.4Society 5.1 $0.62 15.2 33.7 5.6 −0.0085Sports 15.4 $0.38 20.7 44.9 6.9 −0.0044Telecommunications 0.8 $0.91 10.9 36.4 4.6Travel 1.7 $0.88 10.1 29.3 6.4Average (category) 3.7 $0.59 18.4 38.3 6.6
Table 4: Malware and MFA incidence broken down by trendingterm category.
the past year, precisely the figure returned by the Traffic Estimator.We obtain the peak-popularity estimate Pop(s) for a term s bymultiplying the relative estimate for the week when the term peakedby the absolute long-run popularity estimate.
The Google Traffic Estimator also indicates the advertising valueof trending terms, by providing estimates of the anticipated cost perclick (CPC) for keywords. We collect the CPC for all trending andcontrol terms. Many trending terms are only briefly popular andreturn the minimum CPC estimate of US$0.05. We use the CPC toapproximate the relative revenue that might be obtained for searchresults on each term. The CPC is a natural proxy for the prospectiveadvertising value of user traffic because websites that show ads arelikely to present ads similar to the referring term.
Empirical analysis. Table 4 breaks down the relative prevalenceof trending terms, and their abuse, by category. Over half of theterms fall into three categories – Entertainment, Sports and Local.These categories feature topics that change frequently and brieflyrise from prior obscurity. 18% of trending terms include malwarein their results, while 38% feature MFA websites in at least 1% ofthe top 10 results.
We observe some variation in malware and MFA incidence acrosscategories. However, perhaps the most striking result from exam-ining the table is that all categories are targeted, irrespective of thecategory’s propensity to “trendiness.” Miscreants do not seem tobe specializing yet by focusing on particular keyword categories.
If we instead look at popularity and ad prices, substantial differ-ences emerge. Figure 4 shows how the incidence of malware andMFA varies according to the peak popularity and ad price of thetrending term. The left-most graph shows how malware varies ac-cording to the term’s peak popularity. The least popular terms (lessthan 1 000 searches per day at their peak) attract the most malwarein their top results. 38% of such terms include malware, while 9%

peak popularity of term
% o
f te
rms w
ith m
alw
are
010
20
30
40
50
60 % terms with malware
% terms undetected malware
<10001001−10,000
10,000−100,000 >100,000
ad price for term
% o
f te
rms w
ith m
alw
are
010
20
30
40
50
60 % terms malware
% terms undetected malware
<$.10 $.10−.49 $.50−.99 >$1
peak popularity of term
%
010
20
30
40
50
60 % terms with MFA results
% top 10 results MFA
<10001001−10,000
10,000−100,000 >100,000
ad price for term
%
010
20
30
40
50
60 % terms with MFA results
% top 10 results MFA
<$.10 $.10−.49 $.50−.99 >$1
Figure 4: Exploring how popularity and ad price of trending terms affects the prevalence of malware (left) and ad-laden sites (right).
of these terms include malware that is not initially detected. Asterms increase in peak popularity, fewer are afflicted by malware:only 6.2% of terms with peak popularity greater than 100 000 dailysearches include malware in their results, and only 2% of termsinclude malware that is not immediately detected. A similar pat-tern follows for malware incidence according to the term’s ad price.30% of terms with ad prices under 10 cents per click had malwarein their results, compared to 8.8% of terms with ad prices greaterthan $1 per click.
A greater fraction of terms overall include MFA websites in theirresults than malware (37% vs. 19%). Consequently, all proportionsare larger in the two graphs on the right side of Figure 4. 60% ofterms with peak popularity of less than 1 000 daily searches includeMFA sites in their results. This proportion drops steadily until only17.4% of terms attracting over 100 000 daily visits include MFAin the top 10 search results. A similar reduction can be seen forvarying ad prices in the right-most figure. The two right figuresshow the percentage of all terms that have MFA, followed by thepercentage of top 10 results that are MFA, for only those terms thathave MFA terms present. Here we can see that the percentagesremain relatively steady irrespective of term popularity and price.For unpopular terms, 10% of their results point to MFA, droppingmodestly to 8% for the most popular terms. The drop is more sig-nificant for ad prices – from 10% to 6%. Consequently, while thesuccess in appearing in results diminishes with popularity and ris-ing ad prices, when a term does have MFA, a similar proportion ofits results are polluted.
Of course, ad prices and term popularity are correlated – morepopular search terms tend to attract higher ad prices, and vice versa.Consequently, we use linear regression to disentangle the effectboth have on the prevalence of abuse.
Because the dependent variable is binary in the case of malware(either the term has malware present or does not), we use a logitmodel for the regression of the following form:
logit(pHasMalware) = β + AdPricex1 + log2(Popularity)x2
We also ran a logit regression with the term’s categories, but noneof the category values were statistically significant. Thus, we havesettled on this simpler model. The results of the regression revealthat a term’s ad price and search popularity are both negatively cor-related with the presence of malware in a term’s search results, andthe relationship is statistically significant:
coef. odds Std. Err. SignificanceAdPrice −0.509 .601 0.091 p < 0.001log2(Popularity) −0.117 0.889 0.012 p < 0.001
These coefficients mean that a $1 increase in the ad price cor-responds to a 40% decrease in the odds of having malware in the
term’s results. Likewise, when the popularity of a term doubles, theodds of having malware in the term’s results decreases by 11%.
We also devised a linear regression using the fraction of a term’stop 10 results classified as MFA as the dependent variable:
FracTop10MFA = β+AdPricex1+log2(Popularity)x2+Categoryx3 .
The Category variable is encoded as a 27-part categorical variableusing deviation coding. Deviation coding is used to measure eachcategories’ deviation from the overall mean value, rather than devi-ations across categories.
For this regression, the term’s ad price and search popularity areboth statistically significant and negatively correlated with the frac-tion of a trending term’s top 10 results classified as MFA:
coef. Std. Err. SignificanceAdPrice −0.0091 0.091 p < 0.001log2(Popularity) −0.004 0.012 p < 0.001Coefficients for category variables in Tab. 4, R2: 0.1373
A $1 increase in the ad price corresponds to a 0.9% decrease inthe MFA rate, while a doubling in the popularity of a search termmatches a 0.4 percentage point decrease. This may not seem much,but recall that, on average, 6.6% of a term’s top 10 results link toMFA sites. A 0.9% decrease in MFA prevalence represents a 13.2%decrease from the average rate.
Each of the coefficients listed in the right-most column in Table 4are statistically significant (all have p values less than 0.001, exceptLocal, Health, and Automotive, where p < 0.05). For instance,Food & Drink terms correspond to a 1 percentage point increase inthe rate of MFA domains in their top 10 results, while Referenceterms suffer a 2% higher MFA rate.
Implications of analysis. The results just presented demonstratethat, for both malware and MFA sites, miscreants are struggling tosuccessfully target the more lucrative terms. An optimistic inter-pretation is that defenders manage to relegate the abuse to the moreobscure terms that have less overall impact. A more pessimisticinterpretation is that miscreants are having success in the tail of hotterms, which are more difficult to eradicate.
It is not very surprising that malware tends to be located in theresults of terms that demand lower ad prices, given that higher adprices do not benefit malware distribution. However, it is quiteunexpected that the prevalence of MFA terms is negatively cor-related with a term’s ad price, since those promoting MFA siteswould much prefer to appear in the search results of more expensiveterms. One reason why malware and MFA appears less frequentlyon pages with higher ad prices could be that there is stronger legiti-mate competition in these results than for results fetching lower adprices.

# VisitorsTotal Period Monthly Rate
MFA 39 274 200 275 days 4 284 458Malware (trending set)detected 454 198 88 days 154 840Bing, Yahoo! 189 511 88 days 64 606
undetected 143 662 88 days 48 975Malware (control set)detected 12 825 332 88 days 4 372 272Bing, Yahoo! 6 352 378 88 days 2 165 583
undetected 83615 88 days 28505
Table 5: Estimated number of visits to MFA and malware sitesfor trending terms.
Furthermore, there is a potential incentive conflict for search en-gines to eradicate ad-laden sites, when many of the pages run ad-vertisements for the ad platforms maintained by the search engines.It is therefore encouraging that the evidence suggests that searchengines do a better job at expelling MFA sites from the results ofterms that attract higher ad prices.
Finally, the data helps to answer an important question: are mal-ware and ad abuse websites competitors, or do they serve differentparts of the market? The evidence suggests that, in terms of beinga technique to monetize search traffic, malware and MFA behavemore like substitutes, rather than complements. Both approachesthrive on the same types of terms, low-volume terms where ads areless attractive. Consequently, a purely profit-motivated attacker notfearful of arrest might choose between the two approaches, depend-ing on which method generates more revenue.
4. ECONOMICS OF TRENDING-TERMEXPLOITATION
We next examine the revenues possible for both malware andads, by first characterizing the volumes of population affected, be-fore deriving actual expected revenues.
4.1 Exposed populationWe first estimate the number of visits malware and MFA sites at-
tract from trending-term searches. The cumulative number of visitsover an interval t to a website w for a search term s is given by
V (w, s, t) = C(Rank(w, s)) · Pop(s) ·4
30× 24× t ,
where Pop(s) is the monthly peak popularity of the term, as definedin Section 3.4. Rank(w, s) is the position in search results websitew occupies in response to a query for s, and C(r) defines a clickprobability function for search rank 1 ≤ r ≤ 10 following theempirical distribution observed by Joachims et al. [16]. They foundthat 43% of users clicked on the first result, 17% on the secondresult, and 98.9% of users only clicked on results in the first page.We ignore results in ranks above 10 (i.e., C(r) = 0 for r > 10).
Pop(s) is measured at a monthly rate, so we normalize the vis-its to the four-hour interval between each search. We also weighGoogle and Yahoo! search results differently. Google has report-edly an 64.4% market share in search, while Yahoo! and Bing havea combined market share of 30% [12]. Since our estimates arebased on what Google observes, we anticipate that Yahoo! andBing attract 30%
64.4%= 46.5% of the searches that Google does.
The results are given in Table 5. MFA sites attract 39 millionvisits over nine months, or 4.3 million visits per month. For the
05000
10000
15000
# d
aily
vic
tim
s
2011−
01−
29
2011−
02−
05
2011−
02−
12
2011−
02−
19
2011−
02−
26
2011−
03−
05
2011−
03−
12
2011−
03−
19
2011−
03−
26
2011−
04−
02
2011−
04−
09
2011−
04−
16
2011−
04−
23
trending termscontrol terms
Figure 5: Number of estimated daily victims for malware ap-pearing in trending and control terms.
malware results, we compare the estimated visits for both controland trending terms. While more users see malware in the results ofcontrol terms than trending terms (about 4.4 million versus about200 000 per month over three months), over 99% of the visits fromcontrol terms are blocked by the Safe Browsing API. By contrast,24% of the visits triggered from the results of trending terms are notblocked by the Safe Browsing API. In aggregate, trending termsexpose around 49 000 victims per month to undetected malware,compared to about 28 000 for control terms.
The table also lists the number of Bing and Yahoo! users thatencounter malware detected by Google’s SafeBrowsing API. Wecannot say for certain whether or not these users will be exposedto malware. If they attempt to visit the malicious site using theChrome or Firefox browser then they would be protected, sinceGoogle’s SafeBrowsing API is integrated into those browsers. In-ternet Explorer users would be protected only if the sites appear inIE’s internal blacklist. Unfortunately, we could not verify this sincethe blacklist is not made publicly accessible.
The sums presented in the table mask several peculiarities of thedata. First, for malware, the number of visitors exposed is highlyvariable. Figure 5 plots the number of daily victims over time.Most days the number of victims exposed is very small, often zero.Because terms in the control set are always very popular, successfulattacks cause large spikes, but tend to be rare. On the other hand,trending terms exhibit frequent spikes, but many of the spikes aresmall. This is because many trending terms are in fact not very pop-ular, even at their peak. A big spike, as happened around March 5,results from the conjunction of three factors: (1) the attacker mustget their result towards the top of the search results; (2) the resultcannot be immediately spotted and flagged; and (3) the trendingterm has to be popular enough to draw in many victims. Conse-quently, there is a downside to the constantly replenishing pool oftrending terms for the attacker – they are often not popular enoughfor the attacker to do much damage. This is further exacerbatedby the finding from the last section – more popular terms are lesslikely to be manipulated. At the same time, the figure demonstratesthat even the odd success can reel in many victims.
Figure 6 plots the cumulative distribution of user visits comparedto the affected domains. The graph indicates high concentration –most of the traffic is drawn to a small number of domains. The con-centration of visitors is particularly extreme for malware, whichmakes sense given the spikes observed in Figure 5. The concen-tration in MFA sites shows that a few websites profit handsomelyfrom trending terms, and that many more are less successful. Thisis consistent with our earlier finding that there are only a few largeconnected clusters of MFA sites linking to each other. One conse-

0 20 40 60 80 100
02
04
06
08
01
00
% of affected domains
% o
f a
ll u
se
r vis
its
adsmalware
Figure 6: CDF of visits for domains used to transmit malwareor ads in the search results of trending terms.
quence of this concentration is that we can approximate the revenueto the biggest players simply by considering aggregate figures.
4.2 Revenue analysisWe next compare revenues miscreants generate from MFA sites
and from malware-hosting sites.
MFA revenue. Essentially, the aggregate revenue for MFA web-sites is a sum of the revenues generated by all MFA sites w obtainedin response to all the search terms s considered. Each website gen-erates a revenue equal to the number of website visitors times theadvertising revenue that can be obtained from these visitors:
RMFA(t) =∑
w∈MFA(s)
∑
s
V (w, s, t) · (pPPC · pclk · rPPC
+ pbanner · rbanner + paff · p′
clk · raff) .
There are three broad classes of online advertising in use on MFAdomains – pay-per-click (PPC) (e.g., Google AdSense), banners(e.g., Yahoo! Right Media) and affiliate marketing (e.g., Commis-sion Junction). Banner advertisements are paid rbanner by the visit,PPC only pays rPPC when the user clicks on an ad (which happenswith probability pclk), and affiliate marketing pays raff whenever avisitor clicks the ad and then buys something (which happens withprobability p′clk). By inspecting our corpus of MFA sites, we dis-cover that 83% include PPC ads, 66% use banner ads, and 16%include affiliate ads. 50% of sites use two types of advertising,and 7% use all three. We include each type of advertisement inthe revenue calculation with probability pad type, and we assign theprobability according to the percentage of MFA site visits that in-clude each class of ad. For the MFA websites we have identified,pPPC = 0.94, pbanner = 0.53, and paff = 0.33.
To calculate the earning potential of each ad type, we piece to-gether rough measures gathered from outside sources. Estimatingthe “click-through rate” (CTR) pclk is difficult, as click-throughrates vary greatly, and ad platforms such as Google keep very tight-lipped on average click-through rates. One Google employee re-ported that an average CTR is “in the neighborhood of 2%” [32].We anticipate that the CTR for MFA sites is substantially higherthan 2%, since sites have multiple ads aggressively displayed andlittle original content. Nonetheless, we assign pclk = 0.02.
To measure per-click ad revenue rPPC, we turn to the CPC es-timates Google provides for advertising keywords. We expect thatmore persistent search terms are likely to appear as keywords forads, even on websites about trending terms. Hence, we assume thatadvertising revenue for trending terms matches the CPC for mostpopular keywords in the corresponding category. We assign the ex-pected advertising revenue to the mean of ad prices for the 20 most
popular search terms weighted by the amount each category is rep-resented in the results from the trending set (see Table 4, column1). This yields rPPC = $0.97.
Calculating banner advertising revenue is a bit easier, since noclicks are required to earn money. Public estimates of averagerevenue are hard to come by, but the ad network Adify issued apress release stating that its median cost per 1 000 impressions inQ2 2010 was $5.29 [4], so we assign rbanner = $0.00529.
For affiliate marketing, we assume assume that p′clk = pclk =0.02, the same as for PPC ads. To estimate the revenue raff thatcan be earned, we turn to Commission Junction (CJ), one of thelargest affiliate marketing networks that matches over 2 500 adver-tisers with affiliates. CJ provides an estimate of expected earningsfrom advertisers per 100 clicks; we collected this estimate for alladvertisers on Commission Junction in December 2009, and foundit to be $26.49. Consequently, we estimate that raff = $0.265.
Putting it all together, we estimate the monthly revenue to MFAsites to be:
RMFA(1 month) =4 284 458× (0.94× 0.02× $0.97
+ 0.53× $0.00529 + 0.33× 0.02× $0.265)
=$97 637 .
So, MFA sites gross roughly $100,000 per month from trending-term exploitation. There are, however, costs that are not factoredinto the above derivation, which makes it an upper bound. Forinstance, Google generally imposes a 32% fee on advertising rev-enues [24]. Furthermore, servers have to be hosted and maintained.As an example, most sites in the largest cluster in Section 3.2 arehosted by the same service provider, which charges $140/server/month.That cluster contains 193 nodes hosted on 155 unique servers, which,ignoring economies of scale, would come up to $21 700/month inmaintenance. Nevertheless, it is worth noting that these costs canbe amortized over other businesses – it is unlikely that such serversare only set up for the purpose of trending-term exploitation.
Malware revenue. Attackers have experimented with several dif-ferent business models to monetize drive-by-downloads, from ad-ware to credential-stealing trojans [31]. However, researchers haveobserved that attackers exploiting trending terms have tended torely on fake antivirus software [2, 8, 36]. We therefore define therevenue due to malware in trending results as:
Rmal(t) =∑
w∈mal(s)
∑
s
V (w, s, t) · pexp · ppay ∗ rAV ,
where we multiply the number of visits times the likelihood of ex-posure, the probability of a victim paying for the software, and theamount paid. For these figures, we turn to the analysis of Stone-Gross et al. [36], who acquired a copy of back-end databases de-tailing the revenues and expenses of three large fake antivirus pro-grams, each of which were advertised by compromising trendingsearch results. They found that 2.16% of all users exposed to fakeantivirus ultimately paid for a “license,” at an average cost of $58.We can use these figures directly in our model for the revenues dueto malware, setting ppay = 0.0216 and rAV = $58.
Unlike most drive-by-downloads, fake antivirus software doesnot need to exploit a vulnerability in the client visiting the infectedsearch result in order for a user to be exposed. Instead, the serverwill use a server-side warning designed to appear as though it is onthe client’s machine, and then prompt a user to install software [2].Because of this, every user that visits a link distributing fake AVis exposed, and so we assign pexp = 1. These parameters yield a

01
23
45
6
% t
op
10
re
su
lts M
FA
20
10
−0
7−
24
20
10
−0
8−
08
20
10
−0
8−
23
20
10
−0
9−
07
20
10
−0
9−
22
20
10
−1
0−
07
20
10
−1
0−
22
20
10
−1
1−
06
20
10
−1
1−
21
20
10
−1
2−
06
20
10
−1
2−
21
20
11
−0
1−
05
20
11
−0
1−
21
20
11
−0
2−
05
20
11
−0
2−
20
20
11
−0
3−
07
20
11
−0
3−
22
20
11
−0
4−
06
20
11
−0
4−
21
GoogleYahoo!/Bing
Figure 7: MFA prevalence in the top 10 search results fell afterGoogle announced changes to its ranking algorithm on Febru-ary 24, 2011, designed to counter “low-quality” results.
monthly revenue from malware of:
Rmal(1 month) = 48 975× 1× 0.0216× 58 ≈ $61 356 .
Thus, malware sites (e.g., fake anti-virus sites) generate roughly$60,000/month just from trending-term exploitation.
Here too, there are costs associated with deploying these sites,but server maintenance is a lot cheaper than in the case of MFAsites, given that most machines hosting malware have been com-promised rather than purchased. Bots go for less than a dollar [5,and references therein], while a compromised server (presumablywith high quality network access) goes at most for $25 accordingto Franklin et al. [9]. Note that we do not adjust the returns on mal-ware for the risk of being caught because the likelihood of beingarrested for cyber-criminal activity is currently negligible in manyjurisdictions where cyber-criminals operate.
One conclusion of this analysis is that malware and MFA hostinghave quite different revenue models, but yield surprisingly similaramounts of money to their perpetrators. This lends further supportto the hypothesis that they could be treated as substitutes.
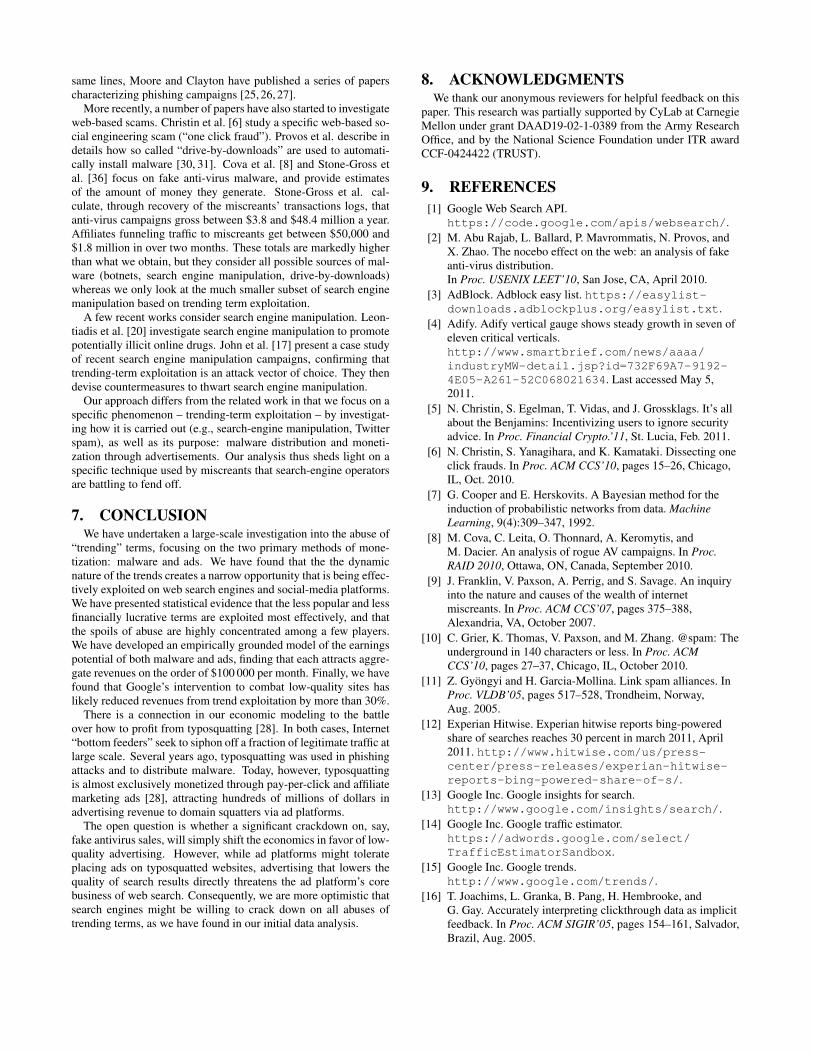
5. SEARCH-ENGINE INTERVENTIONOn February 24, 2011, following a series of high-profile reports
of manipulation of its search engine (e.g., [33, 34]), Google an-nounced changes to its search ranking algorithm designed to eradi-cate “low-quality” results [35]. Google defined low-quality sites asthose which are “low-value add for users, copy content from otherwebsites or sites that are just not very useful.” The MFA sites ex-amined in this paper certainly appear to match that definition. Be-cause we were already collecting search results on the trending set,we can measure the effectiveness of the intervention in eradicatingabuse targeting trending terms.
Figure 7 plots over time the average percentage of top 10 searchresults marked as MFA for terms in the trending set. From July toFebruary, 3.1% of Google’s top 10 results (solid line) for trendingterms pointed to MFA sites, compared to 2.0% for Yahoo!’s top 10results (dotted line). The vertical dashed line marks February 24,2011, the day of Google’s announcement. The proportion of MFAsites quickly fell, stabilizing a month later at a rate of 0.47% forGoogle. Curiously, Yahoo!’s share of top 10 MFA results also fell,to an average of 0.56%.
Landing in the top results tells only part of the story. The under-lying popularity of the trending terms is also important. We com-pute the estimated site visits to MFA sites, which is more directlytied to revenue. Table 6 compares the number of visits referred to
Monthly MFA visitsPre-intervention Post-intervention % change
Google search 3 364 402 1 788 480 -47%Google ads 2 989 821 1 763 709 -41%Other ads 374 556 24 770 -93%
Yahoo!/Bing search 1 302 314 1 448 058 +11%Google ads 1 204 928 1 424 323 +18%Other ads 95 363 23 734 -75%
Total 4 666 716 3 236 538 -31%
Table 6: Estimated number of visits to MFA and malware sitesfor trending terms.
by Google and Yahoo! search results before and after the interven-tion. Between July 24, 2010 and February 24, 2011, MFA sitesattracted 4.67 million monthly visits on average. Between March10 and April 24, 2011, the monthly rate fell 31% to 3.2 million.
However, the changes differed greatly across search engines. Re-ferrals from Google search results fell by 47%, while on Yahoo!and Bing the visits increased by 11%. The table also distinguishesbetween whether the MFA site uses Google ads or another provider.81% of MFA sites show Google ads, which is not surprising givenGoogle’s dominance in pay-per-click advertising. It is an openquestion whether Google might treat MFA sites hosting its own adsdifferently than sites with other ads. Striking them from the searchresults reduces Google’s own advertising revenue. However, it is inGoogle’s interest to provide high-quality search results, the amountof foregone revenue is small, and is likely to be partly replaced byother search results. Our figures support the latter rationale. Siteswith Google ads fell by 1.2 million visits, or 41%. Visits to sites notusing AdSense fell by 91%, but, in absolute terms, the reductionwas smaller than for sites with Google ads. By contrast, Yahoo!results with Google ads rose by 18%.
Using the pre- and post-intervention MFA visit rates into therevenue equations developed in Section 4.2, the average monthlytake for MFA sites has fallen from $106 000 to $74 000. If this re-duction holds over time, what are the implications for miscreants?First, they may decide to devote more effort to manipulating Ya-hoo! and Bing, despite their lower market penetration, since theMFA revenues are growing more equitable in absolute terms. Sec-ond, malware becomes more attractive as an alternative source ofrevenue, so one unintended consequence of the intervention to im-prove search quality could be to foster more overtly criminal activ-ities harming consumers. Third, revenue models based on adver-tising require volume, and external efforts that reduce traffic levelscan cause significant pain to the miscreant. By contrast, malwareoffers substantially more expected revenue per visitor, and is there-fore likely to be much more difficult to eradicate.
Given the striking change in MFA prevalence following Google’sintervention, it is worth checking whether this intervention altersthe significance of the empirical conclusions reached in Section 3.4.We included a dummy variable into the MFA regression reflectingwhether Google’s intervention had yet occurred, and found that thisinclusion does not alter the significance of the dependent variablespresented in Section 3.4.
6. RELATED WORKOur work inscribes itself in the body of literature on understand-
ing the underground online economy. Some of the early econo-metric work in that domain revolves around quantities bartered inunderground forums [9], and on email spam campaigns [18, 22].Grier et al. [10] extend this literature to Twitter spam. Along the
same lines, Moore and Clayton have published a series of paperscharacterizing phishing campaigns [25, 26, 27].
More recently, a number of papers have also started to investigateweb-based scams. Christin et al. [6] study a specific web-based so-cial engineering scam (“one click fraud”). Provos et al. describe indetails how so called “drive-by-downloads” are used to automati-cally install malware [30, 31]. Cova et al. [8] and Stone-Gross etal. [36] focus on fake anti-virus malware, and provide estimatesof the amount of money they generate. Stone-Gross et al. cal-culate, through recovery of the miscreants’ transactions logs, thatanti-virus campaigns gross between $3.8 and $48.4 million a year.Affiliates funneling traffic to miscreants get between $50,000 and$1.8 million in over two months. These totals are markedly higherthan what we obtain, but they consider all possible sources of mal-ware (botnets, search engine manipulation, drive-by-downloads)whereas we only look at the much smaller subset of search enginemanipulation based on trending term exploitation.
A few recent works consider search engine manipulation. Leon-tiadis et al. [20] investigate search engine manipulation to promotepotentially illicit online drugs. John et al. [17] present a case studyof recent search engine manipulation campaigns, confirming thattrending-term exploitation is an attack vector of choice. They thendevise countermeasures to thwart search engine manipulation.
Our approach differs from the related work in that we focus on aspecific phenomenon – trending-term exploitation – by investigat-ing how it is carried out (e.g., search-engine manipulation, Twitterspam), as well as its purpose: malware distribution and moneti-zation through advertisements. Our analysis thus sheds light on aspecific technique used by miscreants that search-engine operatorsare battling to fend off.
7. CONCLUSIONWe have undertaken a large-scale investigation into the abuse of
“trending” terms, focusing on the two primary methods of mone-tization: malware and ads. We have found that the the dynamicnature of the trends creates a narrow opportunity that is being effec-tively exploited on web search engines and social-media platforms.We have presented statistical evidence that the less popular and lessfinancially lucrative terms are exploited most effectively, and thatthe spoils of abuse are highly concentrated among a few players.We have developed an empirically grounded model of the earningspotential of both malware and ads, finding that each attracts aggre-gate revenues on the order of $100 000 per month. Finally, we havefound that Google’s intervention to combat low-quality sites haslikely reduced revenues from trend exploitation by more than 30%.
There is a connection in our economic modeling to the battleover how to profit from typosquatting [28]. In both cases, Internet“bottom feeders” seek to siphon off a fraction of legitimate traffic atlarge scale. Several years ago, typosquatting was used in phishingattacks and to distribute malware. Today, however, typosquattingis almost exclusively monetized through pay-per-click and affiliatemarketing ads [28], attracting hundreds of millions of dollars inadvertising revenue to domain squatters via ad platforms.
The open question is whether a significant crackdown on, say,fake antivirus sales, will simply shift the economics in favor of low-quality advertising. However, while ad platforms might tolerateplacing ads on typosquatted websites, advertising that lowers thequality of search results directly threatens the ad platform’s corebusiness of web search. Consequently, we are more optimistic thatsearch engines might be willing to crack down on all abuses oftrending terms, as we have found in our initial data analysis.
8. ACKNOWLEDGMENTSWe thank our anonymous reviewers for helpful feedback on this
paper. This research was partially supported by CyLab at CarnegieMellon under grant DAAD19-02-1-0389 from the Army ResearchOffice, and by the National Science Foundation under ITR awardCCF-0424422 (TRUST).
9. REFERENCES
[1] Google Web Search API.https://code.google.com/apis/websearch/.
[2] M. Abu Rajab, L. Ballard, P. Mavrommatis, N. Provos, andX. Zhao. The nocebo effect on the web: an analysis of fakeanti-virus distribution.In Proc. USENIX LEET’10, San Jose, CA, April 2010.
[3] AdBlock. Adblock easy list. https://easylist-downloads.adblockplus.org/easylist.txt.
[4] Adify. Adify vertical gauge shows steady growth in seven ofeleven critical verticals.http://www.smartbrief.com/news/aaaa/
industryMW-detail.jsp?id=732F69A7-9192-
4E05-A261-52C068021634. Last accessed May 5,2011.
[5] N. Christin, S. Egelman, T. Vidas, and J. Grossklags. It’s allabout the Benjamins: Incentivizing users to ignore securityadvice. In Proc. Financial Crypto.’11, St. Lucia, Feb. 2011.
[6] N. Christin, S. Yanagihara, and K. Kamataki. Dissecting oneclick frauds. In Proc. ACM CCS’10, pages 15–26, Chicago,IL, Oct. 2010.
[7] G. Cooper and E. Herskovits. A Bayesian method for theinduction of probabilistic networks from data. Machine
Learning, 9(4):309–347, 1992.
[8] M. Cova, C. Leita, O. Thonnard, A. Keromytis, andM. Dacier. An analysis of rogue AV campaigns. In Proc.
RAID 2010, Ottawa, ON, Canada, September 2010.
[9] J. Franklin, V. Paxson, A. Perrig, and S. Savage. An inquiryinto the nature and causes of the wealth of internetmiscreants. In Proc. ACM CCS’07, pages 375–388,Alexandria, VA, October 2007.
[10] C. Grier, K. Thomas, V. Paxson, and M. Zhang. @spam: Theunderground in 140 characters or less. In Proc. ACM
CCS’10, pages 27–37, Chicago, IL, October 2010.
[11] Z. Gyöngyi and H. Garcia-Mollina. Link spam alliances. InProc. VLDB’05, pages 517–528, Trondheim, Norway,Aug. 2005.
[12] Experian Hitwise. Experian hitwise reports bing-poweredshare of searches reaches 30 percent in march 2011, April2011. http://www.hitwise.com/us/press-center/press-releases/experian-hitwise-
reports-bing-powered-share-of-s/.
[13] Google Inc. Google insights for search.http://www.google.com/insights/search/.
[14] Google Inc. Google traffic estimator.https://adwords.google.com/select/
TrafficEstimatorSandbox.
[15] Google Inc. Google trends.http://www.google.com/trends/.
[16] T. Joachims, L. Granka, B. Pang, H. Hembrooke, andG. Gay. Accurately interpreting clickthrough data as implicitfeedback. In Proc. ACM SIGIR’05, pages 154–161, Salvador,Brazil, Aug. 2005.

[17] J. John, F. Yu, Y. Xie, M. Abadi, and A. Krishnamurthy.deSEO: Combating search-result poisoning. In Proc.
USENIX Security’11, San Francisco, CA, August 2011.
[18] C. Kanich, C. Kreibich, K. Levchenko, B. Enright,G. Voelker, V. Paxson, and S. Savage. Spamalytics: Anempirical analysis of spam marketing conversion. In Proc.
ACM CCS’08, pages 3–14, Alexandria, VA, Oct. 2008.
[19] R. Kohavi. A study of cross-validation and bootstrap foraccuracy estimation and model selection. In Proc. IJCAI’95,pages 1137–1145, Montreal, QC, Canada, Aug. 1995.
[20] N. Leontiadis, T. Moore, and N. Christin. Measuring andanalyzing search-redirection attacks in the illicit onlineprescription drug trade. In Proc. USENIX Security’11, SanFrancisco, CA, August 2011.
[21] J. Leskovec, L. Backstrom, and R. Kleinberg.Meme-tracking and the dynamics of the news cycle. In Proc.
ACM KDD’09, Paris, France, June 2009.
[22] K. Levchenko, N. Chachra, B. Enright, M. Felegyhazi,C. Grier, T. Halvorson, C. Kanich, C. Kreibich, H. Liu,D. McCoy, A. Pitsillidis, N. Weaver, V. Paxson, G. Voelker,and S. Savage. Click trajectories: End-to-end analysis of thespam value chain. In Proc. IEEE Symp. Security & Privacy,pages 431–446, Oakland, CA, May 2011.
[23] Microsoft. Microsoft, yahoo! change search landscape.http://www.microsoft.com/presspass/
press/2009/jul09/07-29release.mspx.
[24] N. Mohan. The AdSense revenue share, May 2010.http://adsense.blogspot.com/2010/05/
adsense-revenue-share.html.
[25] T. Moore and R. Clayton. Examining the impact of websitetake-down on phishing. In Proc. APWG eCrime’07,Pittsburgh, PA, October 2007.
[26] T. Moore and R. Clayton. Evil searching: Compromise andrecompromise of internet hosts for phishing. In Proc.
Financial Crypto’09, pages 256–272, Barbados, Feb. 2009.
[27] T. Moore, R. Clayton, and H. Stern. Temporal correlationsbetween spam and phishing websites. In Proc. USENIX
LEET’09, Boston, MA, April 2009.
[28] T. Moore and B. Edelman. Measuring the perpetrators andfunders of typosquatting. In Proc. Financial Crypto.’10,pages 175–191, Tenerife, Spain, Jan. 2010.
[29] J. Pearl. Bayesian Networks: A Model of Self-ActivatedMemory for Evidential Reasoning. In Proc. 7th Conf. of the
Cognitive Science Society, pages 329–334, Irvine, CA,Aug. 1985.
[30] N. Provos, P. Mavrommatis, M. Abu Rajab, and F. Monrose.All your iFrames point to us. In Proc. USENIX Security’08,San Jose, CA, August 2008.
[31] N. Provos, D. McNamee, P. Mavrommatis, K. Wang, andN. Modadugu. The ghost in the browser: Analysis ofweb-based malware. In Proc. USENIX HotBots’07,Cambridge, MA, April 2007.
[32] B. Schwarz. Google adwords click through rates: 2% isaverage but double digits is great, January 2010.http://www.seroundtable.com/archives/
021514.html. Last accessed May 3, 2011.
[33] D. Segal. A bully finds a pulpit on the web. New York Times,November 2010. Article appeared in print on November 28,2010, on page BU1 of the New York edition. Availableonline at http://www.nytimes.com/2010/11/28/business/28borker.html.
[34] D. Segal. The dirty little secrets of search. New York Times,February 2011. Article appeared in print on February 13,2011, on page BU1 of the New York edition. Availableonline at http://www.nytimes.com/2011/02/13/business/13search.html.
[35] A. Singha. Finding more high-quality sites in search,February 2011.http://googleblog.blogspot.com/2011/02/
finding-more-high-quality-sites-in.html.
[36] B. Stone-Gross, R. Abman, R. Kemmerer, C. Kruegel,D. Steigerwald, and G. Vigna. The underground economy offake antivirus software. In Proc. (online) WEIS 2011,Fairfax, VA, June 2011.
[37] Twitter. Twitter developers trends resources.http://dev.twitter.com/doc/get/trends/.
[38] Yahoo! Inc. Yahoo buzzlog.http://buzzlog.yahoo.com/overall/.
[39] Yahoo! Inc. Yahoo site explorer.http://siteexplorer.search.yahoo.com/.