FASB Statement 166 and Commercial Loan...
29
FASB Statement 166 and Commercial Loan Participations Meeting Complex Accounting and Disclosure Standards for presents Meeting Complex Accounting and Disclosure Standards for Lead and Participating Lenders presents A Live 110-Minute Teleconference/Webinar with Interactive Q&A Today's panel features: Bill McGaughey, Executive Vice President and Director of Capital Markets, Excel National Bank, Beverly Hills, Calif. Brett Schwantes, Senior Manager and Technical Issues Committee Chair, Wipfli LLP, Wausau, WI Melissa Beck, Attorney, Morrison & Foerster, New York Ken Kohler, Partner, Morrison & Foerster, Los Angeles Wednesday, March 24, 2010 The conference begins at: 1 pm Eastern 1 pm Eastern 12 pm Central 11 am Mountain 10 am Pacific CLICK ON EACH FILE IN THE LEFT HAND COLUMN TO SEE INDIVIDUAL PRESENTATIONS. You can access the audio portion of the conference on the telephone or by using your computer's speakers. Please refer to the dial in/ log in instructions emailed to registrations. If no column is present: click Bookmarks or Pages on the left side of the window. If no icons are present: Click V iew, select N avigational Panels, and chose either Bookmarks or Pages. If you need assistance or to register for the audio portion, please call Strafford customer service at 800-926-7926 ext. 10
Transcript of FASB Statement 166 and Commercial Loan...

FASB Statement 166 and Commercial Loan Participations
Meeting Complex Accounting and Disclosure Standards forpresents Meeting Complex Accounting and Disclosure Standards for Lead and Participating Lenders
presents
A Live 110-Minute Teleconference/Webinar with Interactive Q&AToday's panel features:
Bill McGaughey, Executive Vice President and Director of Capital Markets, Excel National Bank, Beverly Hills, Calif.Brett Schwantes, Senior Manager and Technical Issues Committee Chair, Wipfli LLP, Wausau, WI
Melissa Beck, Attorney, Morrison & Foerster, New YorkKen Kohler, Partner, Morrison & Foerster, Los Angelesg
Wednesday, March 24, 2010
The conference begins at:1 pm Eastern1 pm Eastern12 pm Central
11 am Mountain10 am Pacific
CLICK ON EACH FILE IN THE LEFT HAND COLUMN TO SEE INDIVIDUAL PRESENTATIONS.
You can access the audio portion of the conference on the telephone or by using your computer's speakers.Please refer to the dial in/ log in instructions emailed to registrations.
If no column is present: click Bookmarks or Pages on the left side of the window.
If no icons are present: Click View, select Navigational Panels, and chose either Bookmarks or Pages.
If you need assistance or to register for the audio portion, please call Strafford customer service at 800-926-7926 ext. 10

Briefing Document: FASB Statement 166 and 167
The FASB concluded its deliberations of two proposals on May 18,2009 which were finalized as standards on June 12, 2009. One of theproposals relates to the consolidation of variable interest entities, andone will amend existing guidance for when a company “derecognizes”transfers of financial assets. A variable interest entity (VIE) is abusiness structure that allows an investor to hold a controlling interestin the entity, without that interest translating into possessing enoughvoting privileges to result in a majority. After considering all of thefeedback received on these original proposals exposed for comment inSeptember 2008, the FASB concluded its deliberations and expects toissue final standards in June 2009.
Both new standards will require a number of new disclosures.
FIN 46(R) amends existing consolidation guidance for variable interestentities. Variable interest entities generally are thinly-capitalizedentities and include many “special-purpose entities”, or “SPEs.” Theprimary amendment to FIN 46(R) relates to how a companydetermines if it must consolidate a variable interest entity. UnderGAAP, a company must consolidate any entity in which it has a“controlling interest.” The new standard now requires a company toperform a qualitative analysis when determining whether it mustconsolidate a variable interest entity. Under the standard, if thecompany has an interest in a variable interest entity that provides itwith control over the most significant activities of the entity (and theright to receive benefits or the obligation to absorb losses) thecompany must consolidate the variable interest entity. Under the newstandard, the quantitative analysis often used previously is no longer,by itself, determinative. The newly-approved standard requiresongoing reassessments to determine if a company must consolidate avariable interest entity. This differs from existing guidance, whichrequires a company to determine if it consolidates a variable interestentity only when specific events occur. Under existing guidance, asexpected credit losses increased significantly due to unpredictedmarket events, some companies did not reconsider whether theyshould consolidate a variable interest entity. The new standardrequires a company to update its consolidation analysis on an ongoingbasis.
The new standard requires a company to provide additionaldisclosures about its involvement with variable interest entities andany significant changes in risk exposure due to that involvement. Acompany will be required to disclose how its involvement with avariable interest entity affects the company’s financial statements. Forexample, if a company consolidates a variable interest entity and theassets of that consolidated entity are restricted, the company mustdisclose the nature of those restrictions and the carrying amount ofsuch assets. A company will also be required to disclose anysignificant judgments and assumptions made in determining whetherit must consolidate a variable interest entity.
The second standard now headed for finalization—Statement140—enhances information reported to users of financial statementsby providing greater transparency about transfers of financial assetsand a company’s continuing involvement in transferred financialassets. It removes the concept of a qualifying “special-purpose entity”from U.S. GAAP, changes the requirements for derecognizingfinancial assets, and requires additional disclosures about atransferor’s continuing involvement in transferred financial assets.
A special purpose entity is a legal entity created to fulfill narrow,

specific or temporary objectives. SPEs are typically used bycompanies to isolate the firm from financial risk. A company willtransfer assets to the SPE for management or use the SPE to financea large project—thereby achieving a narrow set of goals withoutputting the entire firm at risk.
Qualifying special-purpose entities (QSPEs) generally areoff-balance-sheet entities that are exempt from consolidation. The newstandard eliminates that exemption from consolidation. Manyqualifying special-purpose entities that currently are off balance sheetwill become subject to the revised consolidation guidance in theproposal on consolidations of variable interest entities.
The standard on derecognition restricts when a company may transfera portion of a financial asset and account for the transferred portion asbeing sold. Existing guidance permits companies to report manytransfers of portions or components of financial assets as sales. Underthe new standard, a transfer of a portion of a financial asset may bereported as a sale only when that transferred portion is a pro-rataportion of an entire financial asset, no portion is subordinate toanother, and other restrictive criteria are met.
This clarifies the legal isolation requirements to ensure that acompany considers all of its involvements and the involvements of itsconsolidated entities to determine whether a transfer of financialassets may be accounted for as a sale. The newly approved standardalso eliminates an exception that currently permits a company toderecognize certain transferred mortgage loans when the companyhas not surrendered control over those loans.
The new standard requires a company to provide additionaldisclosures about all of its continuing involvements with transferredfinancial assets. Continuing involvement can take many forms—forexample, recourse or guarantee arrangements, servicingarrangements, and providing certain derivative instruments. The newstandard also requires a company to provide expanded disclosuresabout its continuing involvement until it has no continuing involvementin the transferred financial assets. A company will also need to provideadditional information about transaction gains and losses resultingfrom transfers of financial assets during a reporting period.
Generally, the approved standards will be effective as of thebeginning of 2010 and will apply to existing entities, including existingqualifying special purpose entities. However, the amendments on howto account for transfers of financial assets will apply prospectively totransfers occurring on or after the effective date.

March 19, 2010
Ad M b hHome > In The News > In Focus > 2009 Archive > September 2009 e-InFocus
In The News
Daily News
In Focus
2009 Archive
2008 Archive
2007 Archive
2006 Archive
2005 Archive
2004 Archive
2003 Archive
2002 Archive
2001 Archive
News Flash
Feature Article
by Bill McGaughey Excel National Bank
Due to recent changes in Financial Accounting Standard (FAS) 140, SBA lenders involved in the secondary market may not receive sales treatment when selling the guaranteed portion of 7(a) loans at par and retaining more than 1% in lender’s fees. In addition, lenders might not be able to record the sale of the guaranteed portion until the warranty period expires.
Changes in the accounting treatment of sales of the guaranteed portion of SBA 7(a) loans could very well impact how you sell loans. In June 2009, the Financial Accounting Standards Board (FASB) issued Statement of Financial Accounting Standards No. 166, Accounting for Transfers of Financial Assets (“FAS 166”). The new FAS 166 standard amends paragraph 8 of FAS 140, Accounting for Transfers and Servicing of Financial Assets and Extinguishments of Liabilities, through the addition of items 8A and 8B. In order to obtain sales treatment for the sale of a portion of a loan, it must meet the participation definition.
FAS 140 paragraph 8B states that a participating interest has the following characteristics:
1. It represents a proportionate (pro rata) ownership interest in an entire individual financial asset. 2. From the date of the transfer, all cash flows received from the entire financial asset are divided proportionately among the participating interest holders in an amount equal to their share of ownership. 3. The rights of each participating interest holder have the same priority, and that priority does not change in the event of bankruptcy or other receivership of the transferor, the original debtor, or any participating interest holder. Participating interest holders have no recourse, other than standard representations and warranties, to the transferor or to each other, and no participating interest holder is subordinated to another. 4. No party has the right to pledge or exchange the entire financial asset.
If the transfer of a portion of a loan meets the definition of a participating interest and the other conditions for sales accounting discussed in FAS 140 paragraph 9, the transfer is treated as a sale. If the transfer does not meet the definition of a participating interest, or does not meet the conditions of FAS 140 paragraph 9, the transaction is treated as a secured borrowing with pledge of collateral.
Fortunately, FASB states in FAS 140 paragraph 26H, “Recourse in the form of an independent third-party guarantee shall be excluded from the evaluation of whether the participating interest definition is met. Similarly, cash flows allocated to a third-party guarantor for the guarantee fee shall be excluded from the determination of whether the cash flows are divided proportionately among the participating interest holders.” Therefore, it appears that lender’s who sell the guaranteed portions of SBA 7a loans, will still be able to get sales treatment, if the loan is sold for a premium.
FAS 166 Amends Accounting Rules for Sold 7(a) Loans May Change How YOU Sell Loans
Page 1 of 2NAGGL | Feature Article
3/19/2010mhtml:file://C:\Documents and Settings\CSacco\Local Settings\Temporary Internet Files\...
The timing of recording the loan sale might be impacted by FAS 140 paragraph 26G: “In certain transfers, recourse is provided to the transferee that requires the transferor to reimburse any premium paid by the transferee if the underlying financial asset is prepaid within a defined time frame of the transfer date. Such recourse would preclude the transferred portion from meeting the definition of a participating interest. However, once the recourse provision expires, the transferred portion shall be reevaluated to determine if it meets the participating interest definition.” This means that the 90 day warranty period for prepayments might result in the loan sale being recorded 90 days after settlement.
It appears that SBA par sales or sales where the originating lender retains an excessive permanent lender’s fee would result in the transaction not meeting the participating interest definition. FAS 140 paragraph 26F states, “For example, if the transferor transfers an interest in an entire financial asset and the transferee agrees to incorporate the excess interest into the contractually specified servicing fee, the excess interest would likely result in the conveyance of an interest-only strip to the transferor from the transferee. An interest-only strip would result in a disproportionate division of cash flows of the financial asset among the participating interest holders and would preclude the portion from meeting the definition of a participating interest.”
FAS 166 shall be effective as of the beginning of each reporting entity’s first annual reporting period that begins after November 15, 2009, for interim periods within that first annual reporting period and for interim and annual reporting periods thereafter. Earlier application is prohibited. The recognition and measurement provisions of FAS 166 shall be applied to transfers that occur on or after the effective date. Thus it appears that the transactions recorded under the previous guidelines will not have to be restated.
SBA lenders that sell their loans are encouraged to discuss FAS 166 with their independent accountants to plan for the changes coming in 2010.
Review FAS 166 >
Don’t miss Bill McGaughey (Excel National Bank) & Stuart Mitchell (BBVACompass) as they present the annual conference breakout session Discover the Impact of the New Accounting Rule for Sold Loans.
Inside the Industy >
Unconventional Wisdom >
Members Get It >
Back to TOC > . . . . . . . . . . . . . . . . . . . . . . . . . . . . . . . . . . . . . . . . . . . . . . . . . . . . . . . . . . . . In Focus - September 2009 - Volume 25, Issue 8 National Association of Government Guaranteed Lenders, Inc. © 2009, NAGGL, Inc. All rights reserved. Nothing may be reprinted in whole or part without written permission from NAGGL.
home | login | search | privacy policy | downloads | contact us | sitemap©2009 NAGGL, Inc., All Rights Reserved.
Email this page
Page 2 of 2NAGGL | Feature Article
3/19/2010mhtml:file://C:\Documents and Settings\CSacco\Local Settings\Temporary Internet Files\...

Bob Judge, Government Loan Solutions, Editor
Bob Judge is a partner at Govern-ment Loan Solutions. Government Loan Solutions is a provider of valuation services, pre-payment analytics and operational support for the SBA marketplace. Bob has 25 years of experience in the fixed income markets. He holds a B.A. in Economics from Vassar College and an M.B.A. in Finance from NYU Stern School of Busi-ness.
Coleman Government Loan Solutions’ CPR Report Providing the most detailed monthly SBA 7(a) and 504 prepayment, default and market information
© 2009 Coleman and Government Loan Solutions. All Rights Reserved.
Volume 3 , Issue #12
N OV E M B E R CPR: P R E PA Y M E N T S F A L L B E L OW 8%
December, 2009
Special points of interest:
• Prepayments Fall
• FASB 166 and SBA Lending
• December TALF Update
• Default Rate falls
I N S I D E T H I S I S S U E :
November CPR 1-2, 14-16
Default Curtailment Ratios 10 & 19
December TALF 5
Sale & Settle Tip 7
GovGex Corner 8
Value Indices 9, 11-13
Default Rate 10
FASB 166 1 & 4
FASB 166 A N D SBA L E N D I N G
By Bill McGaughey Implementation of Financial Accounting Standard (“FAS”) 166 for most lenders is January 1, 2010. The sale of the guaran-teed portion of SBA 7a loans will change with the implemen-tation of FAS 166. If the lender retains more than the 1% mini-mum lenders permanent fee, the transaction will be treated as a secured borrowing and not a sale. If the lender sells the guaranteed portion for a pre-
After a jump in October, prepayment speeds fell 23%, dropping to CPR 7.34% last month. Octo-ber not withstanding, prepayment speeds have returned to the sub-8% prepayment trend that began in July of this year. In fact, preliminary data from Colson for Decem-ber suggests that next month’s prepayment speed could be sub-7%
and possibly below the record low of CPR 6.55% set in September..
To date, the 2009 overall prepayment speed is CPR 8.85%, having fallen from a YTD in October of 9.00%.
The Voluntary Prepay
CPR (green line) re-mained below 3% for the sixth month in a row and remained at VCPR 2.73%. With the VCPR
remaining the same, the Default CPR (red line) was the reason for the decrease in overall pre-payments.
Specifically, the DCPR fell 32% to 4.61% from 6.79% in October. This reading was the second time the DCPR has fallen below 5% this year, with
Continued on page 2
mium and only retains 1%, the transaction will be treated as a secured borrowing until the 90 day warrant period for prepay-ments expires and/or the bor-rowers’ first three payments are received in the month in which it was due. After the warranty period expires the transaction can be treated as a sale. The implementation will have negative impacts to lenders that sell their guaranteed portions of
SBA 7a loans. The first impact is the loss of income from the gain on sale of loans that have been sold with a lenders perma-nent fee in excess of 1%. The second impact is the delay in recognizing the gain on sale of loans that were sold for a pre-mium with the retention of a 1% lenders permanent fee. The third is the impact of not being able to remove the guaranteed portions of SBA 7a loans from
Continued on page 4

The reason for this call is that defaults continue to trend down and there is no reason to believe that voluntary pre-payments will approach pre-2008 levels.
From an investor perspective SBA-related assets remain attractive, from a fundamental point of view, as we head into the new year.
For further information on the terminology and concepts used in this article, please refer to the “Glossary and Definitions” at the end of the report.
EDITORIAL DISCLAIMER DISCLAIMER OF WARRANTIES – GOV-ERNMENT LOAN SOLUTIONS (GLS) MAKES NO REPRESENTATIONS OR WARRANTIES REGARDING THE ACCU-RACY, RELIABILITY OR COMPLETE-NESS OF THE CONTENT OF THIS RE-PORT. TO THE EXTENT PERMISSIBLE BY LAW, GLS DISCLAIMS ALL WARRAN-TIES, EXPRESS OR IMPLIED, INCLUD-ING BUT NOT LIMITED TO IMPLIED WARRANTIES OF MERCHANTABILITY AND FITNESS FOR A PARTICULAR PURPOSE. Limitation of Liability - GLS shall not be liable for damages of any kind, including without limitation special or consequential damages, arising out of your use of, or reliance upon, this publication or the con-tent hereof. This Report may contain advice, opinions, and statements of various information providers and content providers. GLS does not represent or endorse the accuracy or reliability of any advice, opinion, statement or other information provided by any infor-mation provider or content provider, or any user of this Report or other person or entity. Reliance upon any such opinion, advice, statement, or other information shall also be at your own risk. Prior to the execution of a purchase or sale or any security or investment, you are advised to consult with investment profes-sionals, as appropriate, to verify pricing and other information. Neither GLS, its informa-tion providers or content providers shall have any liability for investment decisions based upon, or the results obtained from, the information provided. Neither GLS, its information providers or content providers guarantee or warrant the timeliness, se-quence, accuracy, or completeness of any such information. Nothing contained in this Report is intended to be, nor shall it be construed as, investment advice.
Coleman
© 2009 Coleman and GLS. All Rights Reserved
Bob Judge can be reached at (216) 456-2480 ext. 133 or
“With the Default CPR falling back
below 5% and next month’s reading expected to be
below 4%, fears of defaults reaching double-digits this
year have fortunately not materialized.”
the low of 3.96% having been seen in August.
For November, prepayment speeds fell in five out of the six maturity categories. The largest decrease was seen in the 16-20 year maturity bucket, which fell 57% to CPR 5.69%. Other decreases were seen in the 20+ (-39% to CPR 4.95%), 13-16 (-11% to CPR 6.68%), 8-10 (-6% to CPR 12.05%), and <8 (-3% to CPR 9.72%). The only in-crease was seen in the 10-13 category, which rose by 3.24% to CPR 11.72%.
With the Default CPR falling back below 5% and next month’s reading expected to be
below 4%, fears of defaults reaching double-digits this year have fortunately not material-ized.
From a prepayment perspec-tive, this is good news. The recent recipe of voluntary pre-payments below 3% and de-faults sub-6% calls for an ex-pectation of sub-10% for over-all prepayment speeds into 2010.
As to how long we can remain in a sub-10% prepay environ-ment, our expectation is for single digit speeds throughout next year.
Page 2
NOV E M B E R CPR. . .CO N T I N U E D
Data on pages 14-16
Government Loan Solutions’ CPR Report

Page 3 Coleman Government Loan Solutions’ CPR Report

Page 4 Coleman Government Loan Solutions’ CPR Report
FA SB 166 . . .C O N T I N U E D
the lender’s balance sheet, which results in the lender having to provide capital for guaranteed portions of SBA 7a loans sold. If a lender were originating and selling $5,000,000 in guaranteed portions a month, the delay in sales treatment per FAS 166, would result in the lender having to retain an additional $750,000 in capi-tal based on a leverage ratio of 5%. ($5,000,000 x 3 months x 5%) Also, due to the delay the lender would postpone the recognition of approximately $1.2 million in income during the first year of adoption of FAS 166. (The income is based on $15,000,000 in loan sales at 110% with an assumption that 80% of the premium would be recognized as income.) Example: A SBA 7a loan is made for $1,000,000 for 25 years with an interest rate of prime + 2.75% (6%). The guaranteed portion of $900,000 is sold on the same day for 108% or $972,000 with a pass through rate of prime + 1.75% (5%). The implicit interest rate of the sold portion of the note is 3.85%. (The implicit interest rate is based on $972,000 with payments of $5,049 a month over 300 periods.) The accounting entries would be as follows: Make the Loan:
Loans $1,000,000 Cash $1,000,000 Settle the loan sale:
Cash $972,000 Secured Borrowing $972,000 Balance Sheet:
Assets:
Cash $972,000 Loans $1,000,000 Total Assets $1,972,000
Liabilities:
Secured borrowing $972,000 Equity $1,000,000 Total Liabilities and Equity $1,972,000 1st Payment received:
Cash $6,443 Interest Income $5,000 Loans $1,443 1st Payment sent to guaranteed holder:
Secured Borrowing $1,930 Interest Expense $3,119 Cash $5,049 After the first 3 payments are received and 90 days, recognize the loan sale1:
Servicing Asset $14,785 Secured Borrowing $966,189 Loans $896,085 Discount on Unguaranteed $7,866 Gain on Sale $77,023 As shown above, FAS 166 will add a new level of complexity to accounting for SBA 7a loan sales and could have a significant nega-tive impact to a lender’s capital ratios and income in 2010. Footnote: 1Information on the numbers: Value of servicing asset (995,650 x (1% - .4%) x 2.75); Cost allocation Guaranteed fair value 980,974 (secured bor-rowing balance 966,189 + 14,785 servicing asset) or 90.79% of the total fair value; Unguaranteed fair value (gross loan balance $995,650 x 10%) 99,565 or 9.21% of the total fair value; Discount on unguaranteed (995,650 x 10%) – (996,650 x 9.21%) = 7,866; Gain = (servicing asset 14,785 + secured borrowing 966,189) – (Note balance 995,650 x 90.79%)
About the Author:
Mr. McGaughey is the Executive Vice President and Director of Capital Markets at Excel National Bank. Bill is the author of Accounting for SBA Loans Sold in the Secondary Market, published by NAGGL in 2008. He has experience originating, purchasing, selling and securitizing SBA 7(a) and 504 loans. He is on NAGGL's Secondary Market Committee and is a former member of NAGGL’s board of directors. He has a B.S. in accounting from the University of Northern Colorado, holds a State of Colorado CPA certificate, holds the designation of CFA, and is a graduate of Pacific Coast Banking School.

Page 5 Coleman Government Loan Solutions’ CPR Report
D E C E M B E R TAL F U P DA T E
After five months of volume increases, small business ABS financed by the TALF decreased by $55 million, or 14%, in De-cember. While the last few months have been dominated by 7a pool financings, we esti-mate that slightly less than 50% of the securities funded this month were 7a pools, with the rest being 504 debentures. Because of their fixed-rate nature, 504 debentures are considered “riskier” assets inside the TALF, due to the uncertainty regarding future interest rates and the value of the security at the end of the TALF period. For this reason, floating-rate 7a pools possess less interest rate risk and are, generally speaking, more attractive to the average TALF investor. With 7a pool assemblers having securitized their inventory of high gross margin, long maturity loans faster than they can replace them, we suspect the decrease was due to a lack of supply, as opposed to slackening demand for high margin, long dated pools. SBA 7a pools continue to be popular with TALF investors, due to the return advan-tages over other TALF asset classes. Util-izing our assumptions for prepayment speeds and exit prices, TALF returns on 7a pools continue to be in the 8% to 10% range, as compared to sub-5% on many other TALF investment options.
With the TALF scheduled to end in March of next year, we are nearing the end of the “TALF impact” on the 7a secondary mar-ket. Due to the fact that the last pool origina-tion month that can go into the TALF is February, loans purchased in December, January and early February will be the last ones placed into TALF-eligible pools, bar-ring an extension of the program.
Can the secondary market maintain the price increases seen in the past few months without TALF? We will likely find out the answer to that question sometime in the first quarter of 2010.
GLS provides valuations for: • SBA 7(a), 504 1st mortgage and USDA
servicing rights • SBA 7(a) and 504 1st mortgage pools • Guaranteed and non-guaranteed 7(a)
loan portions Interest-only portions of SBA and USDA loans
Government Loan Solutions The nationwide leader in the valuation of SBA and USDA
In these times of market uncer-tainty, let GLS help you in deter-
mining the value of your SBA and USDA related-assets.
For further information, please contact Rob Herrick at (216) 456-2480 ext. 144 or at [email protected]

Government Loan Solutions’ CPR Report Page 6 Coleman

Page 7 Coleman Government Loan Solutions’ CPR Report
GLS 7(a) Sale & Settlement Tip of the Month
Sale and Settlement Strategies: Tip #16 – Don’t count on miracles…
At least not when it comes to last minute settlements. While this has been mentioned more than once in this piece recently, it bears repeating – DO NOT WAIT until the last minute and expect Colson to push loans through the settlement process. If you have sold loans pending corrections, it is imperative to take immediate action to rectify the problem and communicate this to Colson and your buyers. With 166 taking effect in January, this is more important this year than any year before. Loans settling in 2010 will be subject to the new accounting rules, no ifs, ands, or buts.
Scott Evans is a partner at GLS. Mr. Evans has over 18 years of trading experience and has been involved in the SBA secondary markets for the last eight of those years. Mr. Evans has bought, sold, settled, and securitized nearly 20,000 SBA loans and now brings some of that expertise to the CPR Report in a recurring article called Sale and Settlement Tip of the Month. The article will focus on pragmatic tips aimed at helping lenders develop a more consis-tent sale and settlement process and ultimately deliver them the best execution possible.
Increase your premium dollars by eliminating brokerage fees and selling your SBA and USDA Loans “Investor Direct” to
Thomas USAF, America’s largest direct investor.
Contact Mike or Vasu at 404-365-2040

The GovGex Corner Coleman Government Loan Solutions’ CPR Report Page 8
The GovGex Index™ reached a record high in the 25-year loan category during the month of November, while 10-year loans edged down slightly but remained close to October prices. Fully priced 25-year loans continued to trade at 110, with servicing be-coming the playing field for bidders, reaching up to 1.3%. To account for the increased servicing fees, we updated our pricing model for November, resulting in more accurate predictions for the loans that fetch the highest premiums.
Note: the above tables represent aggregated data. Subscribers of the GovGex Independent Pricing Service™ receive regular updates of actual transactions and bid levels on GovGex - including loan details and high premium and par bids. Recent reports show P+2.75 transactions at 107% to 110% range, with only slight changes in loan structure driving premiums. Lenders use the pricing service to structure deals in light of what the market is currently valuing. The GovGex Independent Pricing Service is the only service to provide actual bid levels based on loans presented for sale on GovGex.
About GovGex.com GovGex is the secure online exchange for selling SBA and USDA loans. GovGex works with a network of over 30 Buyers, including the leading pool assemblers who are so critical to providing liquidity to small business lenders – a vital engine for American growth. GovGex is an independent source for secondary market pricing information - built on actual bid levels as seen on GovGex. Contact GovGex for all of your secondary market needs.
Below is recent price and trend information on SBA loan sale premiums as reported by the GovGex Independent Pricing Service. GovGex Transactions shows actual bids received on loans presented for sale through GovGex. The GovGex Index™ shows what a Prime + 2 loan of the given term that had just been funded would sell for in each month. The GovGex Index robustly cap-tures month-to-month pricing trends, while also controlling for factors including the age of the loan at the time of sale. For 10 year loans, the Index premium fell 10 basis points between October and November, and for 25 year loans, the premium rose a striking 40 basis points, crossing 108 for the first time.
Month 10 Year 25 Year Sep 106.9 107.6 Oct 106.6 107.9 Nov 106.5 108.3
GovGex IndexTM P + 2%
Deal Term Premium 25 110.00% 15 110.00% 10 109.50%
Servicing 1.30% 1.23% 1.00%
GovGex Transactions—Nov
GLS provides valuations for: • SBA 7(a), 504 1st mortgage and USDA servicing
rights • SBA 7(a) and 504 1st mortgage pools • Guaranteed and non-guaranteed 7(a) loan portions
Interest-only portions of SBA and USDA loans
Government Loan Solutions The nationwide leader in the valuation of SBA and USDA assets.
In these times of market uncertainty, let GLS help you in determining the value of
your SBA and USDA related-assets.
For further information, please contact Rob Herrick at (216) 456-2480 ext. 144 or at

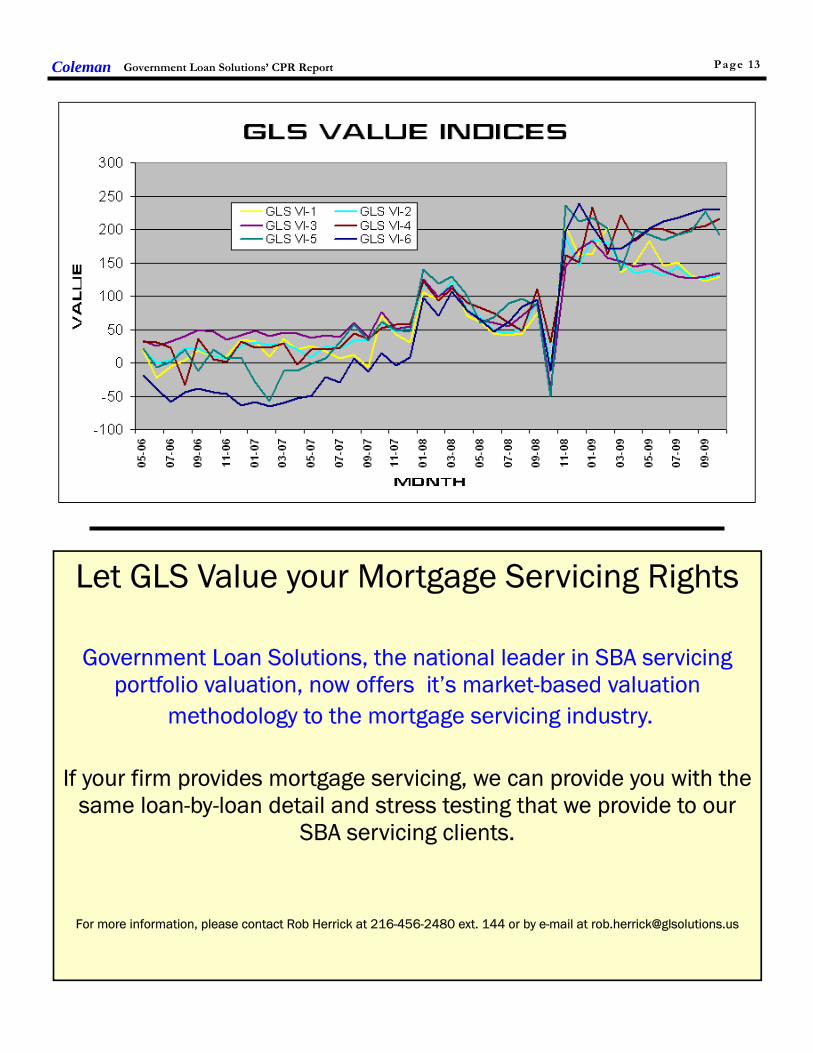
S TA B I L I T Y S E E N I N T H E G L S V A L U E I N D I C E S The GLS Value Indices remained mostly stable in October, as the short-end dis-played single-digit percentage gains and the long-end single-digit percentage de-creases. This result was not unexpected, as the sub-15 year maturities decreased in price in October while the long-end wit-nessed continued servicing bid increases. While the movements were not as large as in past months, the prepayment element continues to decrease and the Base Rate / Libor spread continues to increase. Specifically, the Base Rate / Libor spread rose for the eighth month in a row, reach-ing 299 basis points, a 3 basis point in-crease over September. We are now within 10 basis points of the all-time high of 309 bps seen in January, 2008. Addi-tionally, the prepayment element decreased
in four out of six maturity sectors. As we have seen in past few months, in-creasingly positive fundamentals were im-portant in maintaining the indices, espe-cially in the long-end where the secondary market continued to rally throughout Oc-tober. Turning to the specifics, the largest in-crease was in the GLS VI-4, which in-creased by 5.13% to 216 basis points. Other single-digit increases were recorded in VI-1 (+5.10% to 128.2), VI-3 (+4.36% to 133.9) and VI-2 (+3.79% to 131.3). Decreases were seen in VI-5, which fell by 15.14% to 191.2 and VI-6, which de-creased by 0.35% to 228.6. Since the scheduled end of the TALF for SBA pools is in sight, it will be interesting to see the price action as we approach the
end of the first quarter of 2010. We expect continued positive fundamen-tals (i.e. Base/Libor spread and prepay-ment speeds), but will that be enough to sustain the market? For further information on the GLS Value Indi-ces, please refer to the “Glossary and Definitions” at the end of the report.
Data on pages 11-12, Graph on page 13
Coleman Government Loan Solutions’ CPR Report Page 9
Maturity Gross Margin Fees Servicing 10/30/2009
Price Net
Margin 10 yrs. 2.75% 0.6750% 1.00% 109.40 1.075% 15 yrs. 2.75% 0.6750% 1.00% 109.50 1.075% 20 yrs. 2.75% 0.6750% 1.09% 110.00 0.985% 25 yrs. 2.75% 0.6750% 1.14% 110.00 0.935%
Last Month Price
109.65 109.80
110.00 / 1.00% 110.00 / 1.07%
3-Mos. Ago Price
109.25 109.375 109.50 109.75
6-Mos. Ago Price NA NA NA NA
7(a) Secondary Market Pricing Grid: October 2009*
Content Contributors The editors of the “CPR Report” would like to thank the following secondary market participants for contributing to this month’s report:
For more information regarding our ser-vices, please contact:
Mike White at: (901) 435-8404, or via e-mail at [email protected]
Coastal Securities is a Texas based broker/dealer and is a major participant in the secondary market for SBA
7(a) and USDA government guaranteed loans.
For a bid or loan sale analysis contact your Coastal representative or Greg Putman at (713) 435-4385.
www.coastalsecurities.com
Signature Securities Group, located in Houston, TX, provides the following services to meet your needs:
• SBA Loans and Pools
• Assistance meeting CRA guidelines
• USDA B&I and FSA Loans
• Fixed Income Securities For more information, please call
Toll-free 1-866-750-7150
Securities and Insurance products are: • NOT FDIC INSURED • NO BANK GUARANTEE • MAY LOSE VALUE Signature Securities Group Corporation (SSG), member of FINRA/SIPC, is a registered broker dealer, registered investment advisor and licensed insurance agency. SSG is a wholly owned subsidiary of Signature Bank.
*Please note that we have changed the loan descriptions to better reflect the characteristics of loans being sold into the secondary market.
Government Loan Solutions’ CPR Report Coleman
D E FA U L T - C U R TA I L M E N T R A T I O S
Because of another record high Default-Curtailment Ratio (DCR) reading, the 504 DCR exceeded the 7a ratio for the third time in four months. Please note that an increase in the DCR does not necessarily mean that the default rate is rising, only that the percentage of early curtailments attributable to defaults has increased. As has been the case for nearly the past year and a half, both ratios continued the trend of recession-level readings of 30%+ for 7(a) and 20%+ for 504 loans.
SBA 7(a) Default Ratios For the 18th month in a row, the 7(a) DCR exceeded 30%,coming in at 62.82%, which represents a 12% decrease from the previous month’s record reading of 71.35%. As has been the case all year, this is both a function of low voluntary prepay-ments and higher defaults. Turning to defaults, we witnessed a $42.3 million decrease in October, falling to $122 million. Voluntary prepayments rose slightly, moving to $72.1 million from $65.9 million.
SBA 504 Default Ratios Also for the 18th month in a row, the 504
DCR came in above 20%, having reached another all-time high of 70.23%, the first reading above 70%. This figure is once again significantly above our threshold for weakened conditions in the 504 small busi-ness sector. Specifically, the dollar amount of defaults increased by $9.8 million to $111.8 million in the month of October. At the same time, voluntary prepayments also rose, increasing by $3.1 million to $47.4 million, but not enough to lower the 504 DCR.
Summary
In summary, both DCRs continue to sug-gest weakness in the small business sector. While we are seeing some positive data regarding defaults, there is still work to be done before we can declare the recession to be over. For further information on the terminology and concepts used in this article, please refer to the “Glossary and Definitions” at the end of the report.
Graph on page 19
Page 10
D E FA U L T R A T E F A L L S T O 4 . 8 1 %
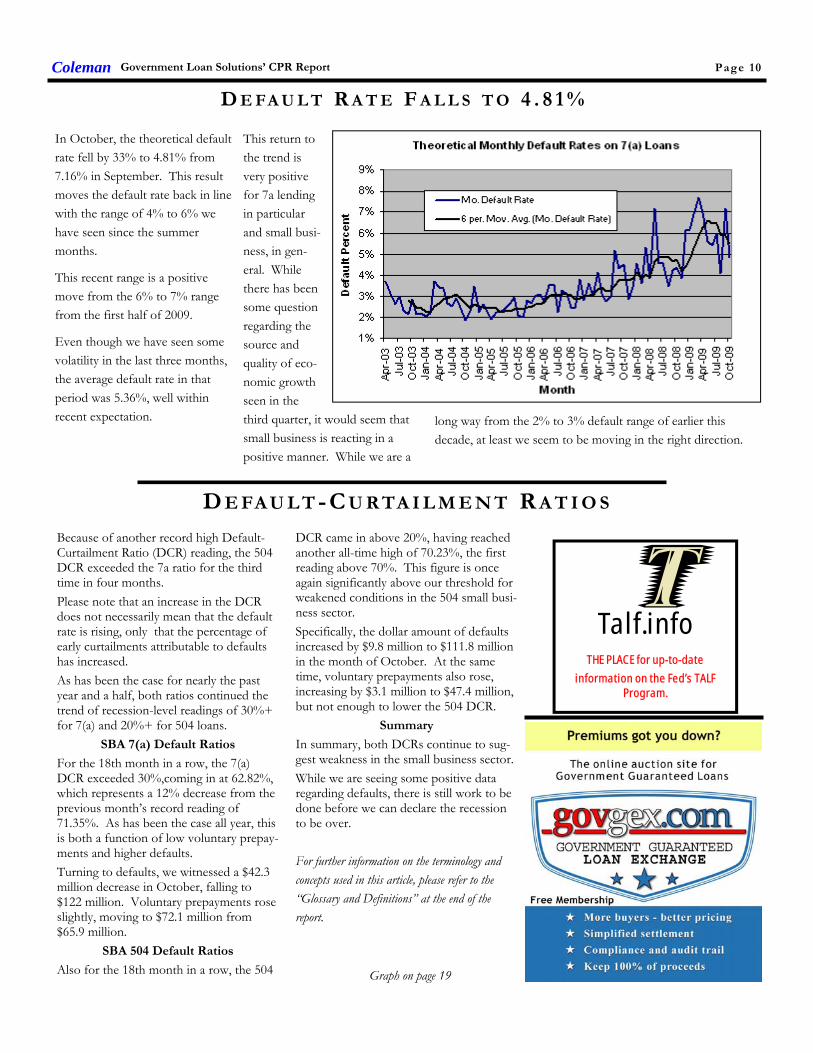
In October, the theoretical default rate fell by 33% to 4.81% from 7.16% in September. This result moves the default rate back in line with the range of 4% to 6% we have seen since the summer months.
This recent range is a positive move from the 6% to 7% range from the first half of 2009.
Even though we have seen some volatility in the last three months, the average default rate in that period was 5.36%, well within recent expectation.
This return to the trend is very positive for 7a lending in particular and small busi-ness, in gen-eral. While there has been some question regarding the source and quality of eco-nomic growth seen in the third quarter, it would seem that small business is reacting in a positive manner. While we are a
long way from the 2% to 3% default range of earlier this decade, at least we seem to be moving in the right direction.
Talf.info THE PLACE for up-to-date
information on the Fed’s TALF Program.

Table 1:
Rolling six-month CPR speeds for all maturity buckets. Source: Colson Services
GLS V A L U E IN D I C E S : SU P P O RT I N G D A TA
Page 11 Government Loan Solutions’ CPR Report Coleman
MONTH BUCKET
1 CPR BUCKET
2 CPR BUCKET
3 CPR BUCKET
4 CPR BUCKET
5 CPR BUCKET
6 CPR May-06 18.84% 17.05% 13.80% 14.99% 19.00% 20.39% Jun-06 19.80% 18.23% 13.34% 15.88% 19.57% 21.59% Jul-06 20.48% 19.32% 13.77% 16.88% 19.58% 22.41%
Aug-06 19.27% 19.32% 14.15% 17.76% 20.10% 23.06% Sep-06 20.33% 19.89% 14.29% 18.83% 20.84% 24.55% Oct-06 19.72% 19.72% 14.32% 19.17% 20.42% 24.51% Nov-06 18.17% 19.54% 14.82% 19.32% 20.91% 24.83% Dec-06 16.78% 18.62% 14.44% 18.97% 20.67% 24.48% Jan-07 16.44% 17.36% 13.95% 18.23% 20.89% 24.14% Feb-07 17.47% 17.00% 13.86% 17.95% 21.81% 24.21% Mar-07 16.07% 16.65% 13.54% 17.22% 20.95% 23.23% Apr-07 16.21% 16.49% 13.55% 17.99% 19.52% 23.13% May-07 18.09% 17.35% 13.47% 18.38% 19.68% 22.95% Jun-07 18.39% 17.03% 13.89% 18.96% 20.60% 22.97% Jul-07 18.52% 17.35% 14.00% 19.55% 20.25% 23.25%
Aug-07 17.72% 17.15% 13.56% 19.48% 18.01% 23.10% Sep-07 19.18% 17.10% 14.19% 19.85% 18.61% 23.98% Oct-07 18.14% 17.04% 14.59% 19.16% 18.57% 23.85% Nov-07 17.68% 16.02% 14.82% 18.87% 18.32% 24.16% Dec-07 17.14% 15.38% 14.42% 17.22% 17.99% 23.23% Jan-08 15.70% 14.68% 13.96% 16.44% 17.45% 22.00% Feb-08 15.91% 13.98% 14.19% 16.20% 17.53% 21.19% Mar-08 15.58% 13.42% 13.27% 15.08% 15.41% 19.34% Apr-08 16.16% 13.40% 13.05% 14.59% 15.19% 18.74% May-08 15.49% 12.93% 12.65% 13.77% 14.33% 17.33% Jun-08 15.29% 13.36% 12.96% 14.75% 13.62% 17.14% Jul-08 15.70% 13.03% 12.78% 14.40% 12.49% 16.59%
Aug-08 15.45% 13.28% 12.87% 13.73% 12.24% 15.89% Sep-08 14.03% 12.49% 12.77% 13.28% 12.36% 15.20% Oct-08 12.98% 11.67% 12.16% 12.13% 11.97% 14.06% Nov-08 12.08% 12.36% 11.45% 11.49% 11.49% 13.22% Dec-08 12.37% 11.81% 10.46% 9.79% 11.08% 11.41% Jan-09 12.86% 11.55% 10.45% 9.29% 10.61% 10.40% Feb-09 12.30% 11.30% 10.36% 8.39% 9.99% 9.30% Mar-09 12.96% 11.97% 10.58% 8.57% 10.47% 8.79% Apr-09 13.23% 12.34% 11.23% 8.75% 9.81% 8.55% May-09 13.12% 11.89% 11.80% 8.68% 9.92% 7.98% Jun-09 13.18% 11.85% 12.36% 8.57% 8.73% 8.02% Jul-09 12.40% 12.00% 12.51% 8.56% 8.23% 7.36%
Aug-09 13.38% 12.49% 12.36% 8.01% 7.34% 7.21% Sep-09 12.79% 11.01% 11.83% 7.48% 6.70% 6.89% Oct-09 12.50% 11.03% 11.35% 7.25% 7.85% 6.79%

Page 12
Table 2:
GLS VI values for all maturity buckets for last 42 months.
GLS V A L U E IN D I C E S : HI S TO R I C A L VA L U E S
INDICES LEGEND HIGHEST READING LOWEST READING
Government Loan Solutions’ CPR Report Coleman
MONTH WAVG LIBOR
WAVG BASE
BASE LIBOR
SPD GLS VI-1
GLS VI-2
GLS VI-3
GLS VI-4
GLS VI-5
GLS VI-6
May-06 5.18% 7.94% 2.76% 18.4 18.8 33.5 30.2 21.0 -19.5 Jun-06 5.37% 8.03% 2.66% -22.8 -0.1 25.0 29.6 -6.4 -37.9 Jul-06 5.48% 8.25% 2.77% -5.9 3.6 31.2 22.0 0.9 -59.1
Aug-06 5.40% 8.25% 2.85% 3.8 21.4 39.8 -33.9 19.7 -43.5 Sep-06 5.37% 8.25% 2.88% 17.8 21.0 49.8 36.2 -12.4 -38.1 Oct-06 5.37% 8.25% 2.88% 10.0 11.3 46.3 5.4 19.1 -43.5 Nov-06 5.37% 8.25% 2.88% 10.9 7.0 33.7 1.4 6.2 -46.7 Dec-06 5.36% 8.25% 2.89% 34.6 24.0 41.1 31.0 8.0 -63.8 Jan-07 5.35% 8.25% 2.90% 31.0 29.8 48.6 21.3 -30.1 -59.4 Feb-07 5.36% 8.25% 2.89% 9.2 25.4 39.4 21.3 -57.0 -65.7 Mar-07 5.34% 8.25% 2.91% 35.9 28.9 45.0 28.5 -12.7 -60.9 Apr-07 5.35% 8.25% 2.90% 18.8 19.4 43.4 -2.9 -12.5 -53.0 May-07 5.35% 8.25% 2.90% 24.5 8.5 37.6 18.9 -1.4 -50.0 Jun-07 5.36% 8.25% 2.89% 16.3 25.2 40.6 18.6 7.0 -22.1 Jul-07 5.35% 8.25% 2.90% 6.8 20.9 38.1 22.2 30.1 -29.9
Aug-07 5.48% 8.25% 2.77% 12.9 33.5 59.8 43.6 57.8 7.0 Sep-07 5.70% 8.21% 2.51% -7.3 32.2 38.1 36.3 33.3 -14.1 Oct-07 5.05% 7.74% 2.69% 70.2 61.9 75.6 52.2 61.9 14.6 Nov-07 4.96% 7.50% 2.54% 42.6 46.7 50.5 57.8 48.7 -4.3 Dec-07 5.02% 7.35% 2.33% 30.4 55.2 54.4 57.0 46.7 7.9 Jan-08 3.77% 6.86% 3.09% 105.1 118.6 124.7 121.4 140.1 96.8 Feb-08 3.10% 6.00% 2.90% 94.4 98.7 98.6 93.3 118.0 69.9 Mar-08 2.90% 5.95% 3.05% 118.1 120.5 116.2 112.0 128.8 107.4 Apr-08 2.81% 5.25% 2.44% 69.9 79.5 77.4 90.6 100.8 77.4 May-08 2.78% 5.15% 2.37% 61.2 66.7 64.1 82.9 60.5 65.1 Jun-08 2.67% 5.00% 2.33% 44.1 47.4 59.8 74.6 66.9 47.2 Jul-08 2.75% 5.00% 2.25% 41.7 43.4 55.3 60.8 89.1 61.6
Aug-08 2.74% 5.02% 2.27% 44.0 52.5 70.1 47.4 95.8 83.1 Sep-08 3.00% 5.00% 2.00% 73.3 91.2 88.5 111.3 85.2 94.2 Oct-08 4.43% 4.56% 0.12% 2.3 -3.1 -38.6 30.5 -51.0 -12.9 Nov-08 2.06% 4.00% 1.94% 203.9 187.0 143.2 161.1 236.0 196.6 Dec-08 1.64% 3.89% 2.25% 162.2 144.9 170.3 151.0 212.5 238.6 Jan-09 1.11% 3.25% 2.14% 164.8 185.5 181.7 233.2 218.3 204.4 Feb-09 1.15% 3.25% 2.10% 203.6 179.5 157.4 162.9 201.5 171.3 Mar-09 1.06% 3.25% 2.19% 135.3 150.3 151.6 220.4 138.0 169.7 Apr-09 0.96% 3.28% 2.32% 149.4 134.8 144.3 182.0 198.3 184.5 May-09 0.70% 3.26% 2.57% 182.1 138.7 149.6 200.3 192.4 200.8 Jun-09 0.55% 3.25% 2.70% 144.8 130.3 137.3 200.2 183.8 212.8 Jul-09 0.48% 3.25% 2.77% 150.9 143.8 129.1 191.9 192.4 217.4
Aug-09 0.39% 3.25% 2.86% 129.7 127.4 125.7 201.7 197.3 222.8 Sep-09 0.29% 3.25% 2.96% 122.0 126.5 128.3 205.5 225.3 229.6 Oct-09 0.26% 3.25% 2.99% 128.2 131.3 133.9 216.0 191.2 228.8
Coleman Government Loan Solutions’ CPR Report Page 13
Let GLS Value your Mortgage Servicing Rights
Government Loan Solutions, the national leader in SBA servicing portfolio valuation, now offers it’s market-based valuation
methodology to the mortgage servicing industry.
If your firm provides mortgage servicing, we can provide you with the same loan-by-loan detail and stress testing that we provide to our
SBA servicing clients.
For more information, please contact Rob Herrick at 216-456-2480 ext. 144 or by e-mail at [email protected]
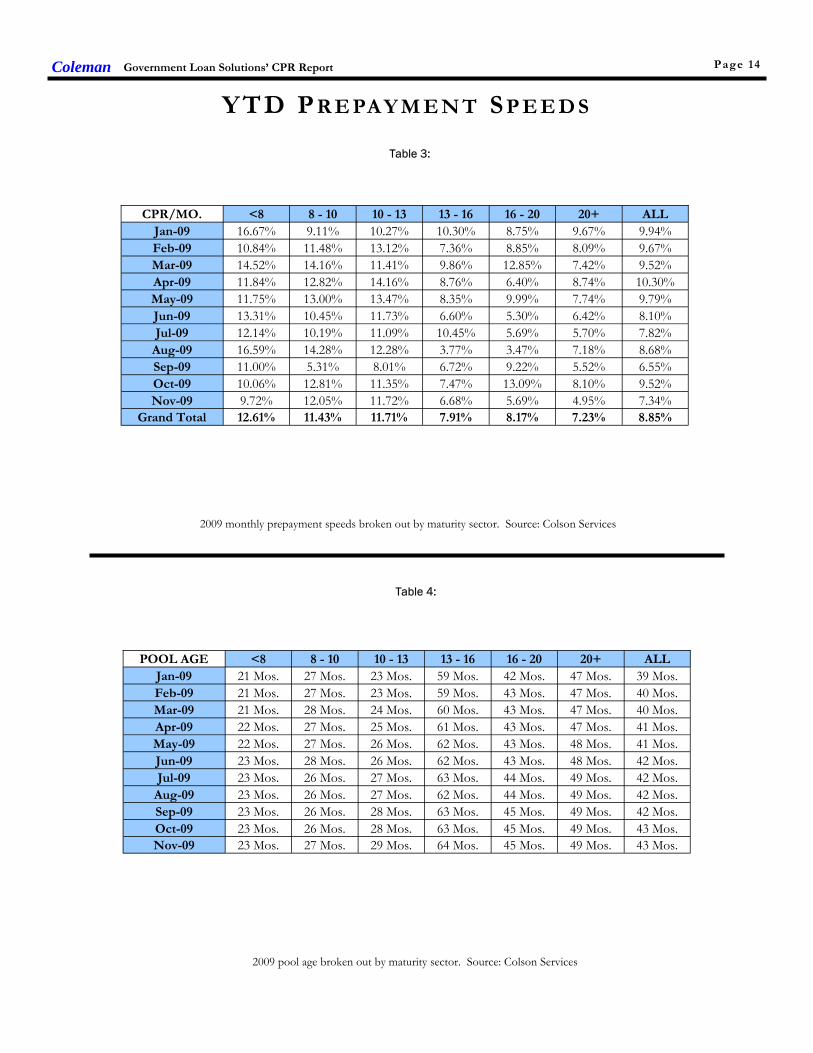
Table 3:
2009 monthly prepayment speeds broken out by maturity sector. Source: Colson Services
Table 4:
2009 pool age broken out by maturity sector. Source: Colson Services
YTD P R E PA Y M E N T SP E E D S
Coleman Government Loan Solutions’ CPR Report Page 14
CPR/MO. <8 8 - 10 10 - 13 13 - 16 16 - 20 20+ ALL Jan-09 16.67% 9.11% 10.27% 10.30% 8.75% 9.67% 9.94% Feb-09 10.84% 11.48% 13.12% 7.36% 8.85% 8.09% 9.67% Mar-09 14.52% 14.16% 11.41% 9.86% 12.85% 7.42% 9.52% Apr-09 11.84% 12.82% 14.16% 8.76% 6.40% 8.74% 10.30% May-09 11.75% 13.00% 13.47% 8.35% 9.99% 7.74% 9.79% Jun-09 13.31% 10.45% 11.73% 6.60% 5.30% 6.42% 8.10% Jul-09 12.14% 10.19% 11.09% 10.45% 5.69% 5.70% 7.82%
Aug-09 16.59% 14.28% 12.28% 3.77% 3.47% 7.18% 8.68% Sep-09 11.00% 5.31% 8.01% 6.72% 9.22% 5.52% 6.55% Oct-09 10.06% 12.81% 11.35% 7.47% 13.09% 8.10% 9.52% Nov-09 9.72% 12.05% 11.72% 6.68% 5.69% 4.95% 7.34%
Grand Total 12.61% 11.43% 11.71% 7.91% 8.17% 7.23% 8.85%
POOL AGE <8 8 - 10 10 - 13 13 - 16 16 - 20 20+ ALL Jan-09 21 Mos. 27 Mos. 23 Mos. 59 Mos. 42 Mos. 47 Mos. 39 Mos. Feb-09 21 Mos. 27 Mos. 23 Mos. 59 Mos. 43 Mos. 47 Mos. 40 Mos. Mar-09 21 Mos. 28 Mos. 24 Mos. 60 Mos. 43 Mos. 47 Mos. 40 Mos. Apr-09 22 Mos. 27 Mos. 25 Mos. 61 Mos. 43 Mos. 47 Mos. 41 Mos. May-09 22 Mos. 27 Mos. 26 Mos. 62 Mos. 43 Mos. 48 Mos. 41 Mos. Jun-09 23 Mos. 28 Mos. 26 Mos. 62 Mos. 43 Mos. 48 Mos. 42 Mos. Jul-09 23 Mos. 26 Mos. 27 Mos. 63 Mos. 44 Mos. 49 Mos. 42 Mos.
Aug-09 23 Mos. 26 Mos. 27 Mos. 62 Mos. 44 Mos. 49 Mos. 42 Mos. Sep-09 23 Mos. 26 Mos. 28 Mos. 63 Mos. 45 Mos. 49 Mos. 42 Mos. Oct-09 23 Mos. 26 Mos. 28 Mos. 63 Mos. 45 Mos. 49 Mos. 43 Mos. Nov-09 23 Mos. 27 Mos. 29 Mos. 64 Mos. 45 Mos. 49 Mos. 43 Mos.
Page 15
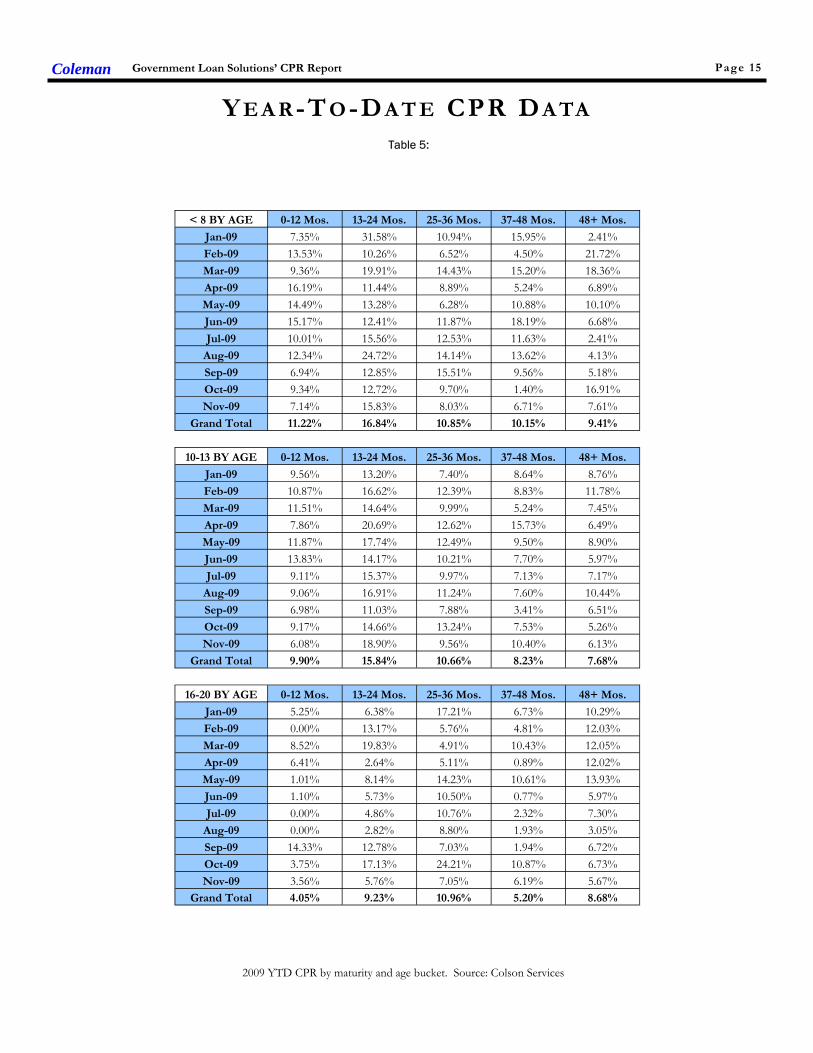
2009 YTD CPR by maturity and age bucket. Source: Colson Services
Table 5:
Y E A R-T O -D A T E CPR D A TA
Government Loan Solutions’ CPR Report Coleman
< 8 BY AGE 0-12 Mos. 13-24 Mos. 25-36 Mos. 37-48 Mos. 48+ Mos.
Jan-09 7.35% 31.58% 10.94% 15.95% 2.41% Feb-09 13.53% 10.26% 6.52% 4.50% 21.72% Mar-09 9.36% 19.91% 14.43% 15.20% 18.36% Apr-09 16.19% 11.44% 8.89% 5.24% 6.89% May-09 14.49% 13.28% 6.28% 10.88% 10.10% Jun-09 15.17% 12.41% 11.87% 18.19% 6.68% Jul-09 10.01% 15.56% 12.53% 11.63% 2.41%
Aug-09 12.34% 24.72% 14.14% 13.62% 4.13% Sep-09 6.94% 12.85% 15.51% 9.56% 5.18% Oct-09 9.34% 12.72% 9.70% 1.40% 16.91% Nov-09 7.14% 15.83% 8.03% 6.71% 7.61%
Grand Total 11.22% 16.84% 10.85% 10.15% 9.41%
10-13 BY AGE 0-12 Mos. 13-24 Mos. 25-36 Mos. 37-48 Mos. 48+ Mos.
Jan-09 9.56% 13.20% 7.40% 8.64% 8.76% Feb-09 10.87% 16.62% 12.39% 8.83% 11.78% Mar-09 11.51% 14.64% 9.99% 5.24% 7.45% Apr-09 7.86% 20.69% 12.62% 15.73% 6.49% May-09 11.87% 17.74% 12.49% 9.50% 8.90% Jun-09 13.83% 14.17% 10.21% 7.70% 5.97% Jul-09 9.11% 15.37% 9.97% 7.13% 7.17%
Aug-09 9.06% 16.91% 11.24% 7.60% 10.44% Sep-09 6.98% 11.03% 7.88% 3.41% 6.51% Oct-09 9.17% 14.66% 13.24% 7.53% 5.26% Nov-09 6.08% 18.90% 9.56% 10.40% 6.13%
Grand Total 9.90% 15.84% 10.66% 8.23% 7.68%
16-20 BY AGE 0-12 Mos. 13-24 Mos. 25-36 Mos. 37-48 Mos. 48+ Mos.
Jan-09 5.25% 6.38% 17.21% 6.73% 10.29% Feb-09 0.00% 13.17% 5.76% 4.81% 12.03% Mar-09 8.52% 19.83% 4.91% 10.43% 12.05% Apr-09 6.41% 2.64% 5.11% 0.89% 12.02% May-09 1.01% 8.14% 14.23% 10.61% 13.93% Jun-09 1.10% 5.73% 10.50% 0.77% 5.97% Jul-09 0.00% 4.86% 10.76% 2.32% 7.30%
Aug-09 0.00% 2.82% 8.80% 1.93% 3.05% Sep-09 14.33% 12.78% 7.03% 1.94% 6.72% Oct-09 3.75% 17.13% 24.21% 10.87% 6.73% Nov-09 3.56% 5.76% 7.05% 6.19% 5.67%
Grand Total 4.05% 9.23% 10.96% 5.20% 8.68%

Page 16
2009 YTD CPR by maturity and age bucket. Source: Colson Services
Table 6:
Y E A R-T O -D A T E CPR D A TA
Government Loan Solutions’ CPR Report Coleman
8-10 BY AGE 0-12 Mos. 13-24 Mos. 25-36 Mos. 37-48 Mos. 48+ Mos.
Jan-09 7.89% 12.32% 8.52% 3.96% 12.50% Feb-09 11.59% 11.43% 15.08% 5.57% 12.29% Mar-09 11.28% 22.85% 10.72% 10.13% 12.67% Apr-09 12.82% 21.12% 11.37% 5.64% 7.08% May-09 11.09% 21.71% 8.76% 6.27% 10.23% Jun-09 6.57% 16.04% 8.81% 6.67% 10.70% Jul-09 5.85% 18.36% 8.90% 5.97% 8.92%
Aug-09 14.14% 23.41% 8.80% 5.77% 9.32% Sep-09 5.03% 6.72% 4.71% 5.23% 4.31% Oct-09 10.56% 17.51% 16.67% 4.28% 10.54% Nov-09 13.42% 15.68% 13.08% 6.39% 6.47%
Grand Total 10.05% 17.19% 10.66% 6.07% 9.50%
13-16 BY AGE 0-12 Mos. 13-24 Mos. 25-36 Mos. 37-48 Mos. 48+ Mos.
Jan-09 0.00% 9.70% 0.00% 10.03% 11.28% Feb-09 20.67% 4.28% 0.00% 7.21% 7.03% Mar-09 0.00% 2.39% 14.62% 5.15% 12.71% Apr-09 8.89% 9.78% 0.00% 4.95% 10.55% May-09 0.00% 32.61% 0.00% 6.13% 8.85% Jun-09 0.00% 15.88% 0.55% 4.14% 7.32% Jul-09 0.00% 0.00% 29.55% 11.09% 9.84%
Aug-09 0.00% 0.00% 0.00% 3.25% 4.42% Sep-09 0.00% 5.76% 11.26% 1.25% 7.53% Oct-09 25.31% 7.87% 5.85% 0.00% 6.71% Nov-09 0.00% 0.00% 0.00% 41.24% 7.40%
Grand Total 5.86% 7.27% 6.99% 6.63% 8.41%
20+ BY AGE 0-12 Mos. 13-24 Mos. 25-36 Mos. 37-48 Mos. 48+ Mos.
Jan-09 10.77% 12.40% 10.16% 7.43% 8.21% Feb-09 3.56% 6.57% 12.17% 5.72% 9.25% Mar-09 6.12% 9.38% 7.45% 5.64% 7.61% Apr-09 7.53% 12.23% 10.84% 5.36% 7.91% May-09 6.47% 9.24% 10.55% 4.41% 7.66% Jun-09 5.38% 9.05% 5.77% 1.86% 7.58% Jul-09 3.75% 5.89% 6.95% 6.22% 5.59%
Aug-09 2.53% 9.86% 9.15% 6.66% 6.61% Sep-09 3.39% 8.33% 6.48% 4.17% 5.04% Oct-09 3.07% 13.70% 11.53% 6.90% 6.35% Nov-09 2.32% 7.30% 5.99% 5.93% 4.19%
Grand Total 5.06% 9.47% 8.96% 5.45% 6.84%

GLOSSARY AND DEFINITIONS: PART 1 Default-Curtailment Ratio
The Default-Curtailment Ratio (DCR), or the percentage of secondary loan curtailments that are attributable to defaults, can be con-sidered a measurement of the health of small business in the U.S. GLS, with default and borrower prepayment data supplied by Colson Services, has calculated DCRs for both SBA 7(a) and 504 loans since January, 2000. The default ratio is calculated using the following formula:
Defaults / (Defaults + Prepayments) By definition, when the DCR is increasing, defaults are increasing faster than borrower prepayments, suggesting a difficult business environment for small business, perhaps even recessionary conditions. On the flip side, when the DCR is decreasing, either defaults are falling or borrower prepayments are outpacing defaults, each suggesting improving business conditions for small business. Our research suggests that a reading of 20% or greater on 7(a) DCRs and 15% or greater on 504 DCRs suggest economic weakness in these small business borrower groups.
Theoretical Default Rate Due to a lack of up-to-date default data, we attempt to estimate the current default rate utilizing two datasets that we track: 1. Total prepayment data on all SBA pools going back to 2003. This is the basis for our monthly prepayment information. Total prepayment data on all secondary market 7(a) loans going back to 1999, broken down by defaults and voluntary prepayments. This is the basis for our monthly default ratio analysis. With these two datasets, it is possible to derive a theoretical default rate on SBA 7(a) loans. We say “theoretical” because the reader has to accept the following assumptions as true: 1. The ratio of defaults to total prepayments is approximately the same for SBA 7(a) pools and secondary market 7(a) loans. Fact: 60% to 70% of all secondary market 7(a) loans are inside SBA pools. 2. The default rate for secondary market 7(a) loans closely approximates the default rate for all outstanding 7(a) loans. Fact: 25% to 35% of all outstanding 7(a) loans have been sold into the secondary market. While the above assumptions seem valid, there exists some unknown margin for error in the resulting analysis. However, that does not invalidate the potential value of the information to the SBA lender community. The Process
To begin, we calculated total SBA pool prepayments, as a percentage of total secondary loan prepayments, using the following for-mula:
Pool Prepay Percentage = Pool Prepayments / Secondary Loan Prepayments This tells us the percentage of prepayments that are coming from loans that have been pooled. Next, we calculated the theoretical default rate using the following equation:
((Secondary Loan Defaults * Pool Prepay Percentage) / Pool Opening Balance) * 12 This provides us with the theoretical default rate for SBA 7(a) loans, expressed as an annualized percentage.
GLS Long Value Indices
Utilizing the same maturity buckets as in our CPR analysis, we calculate 6 separate indexes, denoted as GLS VI-1 to VI-6. The num-bers equate to our maturity buckets in increasing order, with VI-1 as <8 years, VI-2 as 8-10 years, VI-3 as 10-13 years, VI-4 as 13-16 years, VI-5 as 16-20 years and ending with VI-6 as 20+ years.
The new Indices are basically weighted-average spreads to Libor, using the rolling six-month CPR for pools in the same maturity bucket, at the time of the transaction. While lifetime prepayment speeds would likely be lower for new loans entering the secondary market, utilizing six-month rolling pool speeds allowed us to make relative value judgments across different time periods.
We compare the bond-equivalent yields to the relevant Libor rate at the time of the transaction. We then break the transactions into the six different maturity buckets and calculate the average Libor spread, weighting them by the loan size.
For these indices, the value can be viewed as the average spread to Libor, with a higher number equating to greater value in the trading levels of SBA 7(a) loans.
Coleman Government Loan Solutions’ CPR Report Page 17

GLOSSARY AND DEFINITIONS: PART 2 Prepayment Calculations
SBA Pool prepayment speeds are calculated using the industry convention of Conditional Prepayment Rate, or CPR. CPR is the an-nualized percentage of the outstanding balance of a pool that is expected to prepay in a given period. For example, a 10% CPR sug-gests that 10% of the current balance of a pool will prepay each year. When reporting prepayment data, we break it into seven different original maturity categories: <8 years, 8-10 years, 10-13 years, 13-16 years, 16-20 years and 20+ years. Within these categories we provide monthly CPR and YTD values. In order to get a sense as to timing of prepayments during a pool’s life, we provide CPR for maturity categories broken down by five different age categories: 0-12 months, 13-24 months, 25-36 months, 37-48 months and 48+ months. As to the causes of prepayments, we provide a graph which shows prepayment speeds broken down by voluntary borrower prepay-ment speeds, denoted VCPR and default prepayment speeds, denoted as DCPR. The formula for Total CPR is as follows:
Total Pool CPR = VCPR + DCPR
SBA Libor Base Rate The SBA Libor Base Rate is set on the first business day of the month utilizing one-month LIBOR, as published in a national financial newspaper or website, plus 3% (300 basis points). The rate will be rounded to two digits with .004 being rounded down and .005 be-ing rounded up. Please note that the SBA’s maximum 7(a) interest rates continue to apply to SBA base rates: Lenders may charge up to 2.25% above the base rate for maturities under seven years and up to 2.75% above the base rate for maturities of seven years or more, with rates 2% higher for loans of $25,000 or less and 1% higher for loans between $25,000 and $50,000. (Allowable interest rates are slightly higher for SBAExpress loans.)
Risk Types The various risk types that impact SBA pools are the following: Basis Risk: The risk of unexpected movements between two indices. The impact of this type of risk was shown in the decrease in the Prime/Libor spread experienced in 2007 and 2008. Prepayment Risk: The risk of principal prepayments due to borrower voluntary curtailments and defaults. Overall prepayments are expressed in CPR, or Conditional Prepayment Rate. Interest Rate Risk: The risk of changes in the value of an interest-bearing asset due to movements in interest rates. For pools with monthly or quarterly adjustments, this risk is low. Credit Risk: Losses experienced due to the default of collateral underlying a security. Since SBA loans and pools are guaranteed by the US government, this risk is very small.
TALF The TALF, or Term Asset-Backed Security Loan Facility, was announced by the Federal Reserve Bank and the US Treasury on November 25, 2008. The purpose of the TALF is to make credit available to consumers and small businesses on more favorable terms by facilitating the issuance of asset-backed securities (ABS) and improving the market conditions for ABS more generally. The most recent update was released by the Federal Reserve on May 19th, 2009. The Federal Reserve Bank of New York will make up to $1 trillion of loans under the TALF. TALF loans will have a term of three years; will be non-recourse to the borrower; and will be fully secured by eligible ABS. The US Treasury Department will provide $100 billion of credit protection to the Federal Reserve in connection with the TALF. SBA Pools issued in 2008 and beyond are considered eligible securities. SBA Pools are eligible for 3 or 5 year TALF loans.
Coleman Government Loan Solutions’ CPR Report Page 18

Coleman Government Loan Solutions’ CPR Report Page 19
Let GLS Value your Mortgage Servicing Rights
Government Loan Solutions, the national leader in SBA servicing portfolio valuation, now offers it’s market-based valuation
methodology to the mortgage servicing industry.
If your firm provides mortgage servicing, we can provide you with the same loan-by-loan detail and stress testing that we provide to our
SBA servicing clients.
For more information, please contact Rob Herrick at 216-456-2480 ext. 144 or by e-mail at [email protected]

Powered By:
www.glsolutions.us
Government Loan Solutions’ CPR Report is a monthly elec-tronic newsletter published by
Coleman. The opinions, unless otherwise stated, are exclusively those of
the editorial staff. This newsletter is not to be reproduced or distributed in any form or fashion, without the express written consent of Coleman or Government Loan
Solutions. Government Loan Solutions’ CPR Report is distributed in
pdf format via e-mail. Spread-sheets relating to the presented data are available to paid sub-
scribers upon request. The subscription to the Gov-ernment Loan Solutions’ “CPR Report” is free to all members
of the SBA Community. To subscribe, please contact
Coleman at (800) 617-1380 or via email at:
Partners
Scott Evans Bob Judge
Rob Herrick
812 Huron Road Cleveland, OH 44115
Government Loan Solut ions
Phone: (216) 456-2480 Fax: (216) 456-2481 Web Site: www.glsolutions.us E-mail: [email protected]
Government Loan Solutions, Inc. (GLS) was founded by three former Bond Traders in Cleveland, OH. Scott Evans, Rob Herrick and Bob Judge possess a combined 70 years experi-ence in the institutional fixed income markets, 40 of which are in the SBA securitization busi-ness. GLS formally began operations in January, 2007. Our mission is as follows:
“The purpose of Government Loan Solutions is to bring greater efficiency, productivity and transparency to the financial markets. Through the use of proprietary technology, we intend to aid lenders in all aspects of their government lending, help pool assemblers be more productive in their operational procedures and provide quality research to the investor community .”
Services available include:
Lenders: • Manage loan sales to the secondary market • Process loan settlements via our electronic platform, E-Settle • Third-Party servicing and non-guaranteed asset valuation • Model Validation • Specialized research projects • Mortgage Servicing Valuation Pool Assemblers:
• Manage loan settlements and pool formation • Loan and IO accounting • Loan, Pool and IO Mark-To-Market • Specialized research projects Institutional Investors:
• Loan, Pool, and IO Mark-To-Market • Specialized research projects • Portfolio consulting, including TALF
For additional information regarding our products and capabilities, please contact us at: Phone: (216)456-2480 E-mail at: [email protected] web: www.glsolutions.us
Coleman Government Loan Solutions’ CPR Report Page 20

ACCOUNTING INSIGHT
www.wipfli.com
In June 2009, the Financial Accounting Standards Board (FASB) issued a new accounting standard (Financial Accounting Standard No. 166) that amends previous guidance on accounting for transfers of financial assets. This standard is effective as of the beginning of an entity’s first annual reporting period beginning after November 15, 2009 (for calendar-year entities, it will be effective January 1, 2010). This new standard will change current accounting practices in two very significant ways:
• The concept of a qualifying special-purpose entity (QSPE) and the exception from applying the accounting guidance on consolidation of variable interest entities to QSPEs is now removed from accounting standards.
• If an entity transfers a portion of a financial asset rather than the entire financial asset, the standard will limit when the transfer will qualify as a sale and consequently when the institution will be able to remove the asset from its financial statements and recognize any gain or loss on sale.
ELIMINATION OF THE QUALIFYING SPECIAL-PURPOSE ENTITY Prior to this new guidance, institutions could set up a QSPE, transfer assets to this entity, and automatically disregard this entity when preparing consolidated financial statements, thereby removing the assets from the institution’s balance sheet. A common example of this occurs when loans are securitized. The institution will transfer the loans to a QSPE and issue securities that are collateralized by the loans in the QSPE. Since the loans are removed from the institution’s balance sheet, the institution has renewed capacity to originate or purchase additional loans. After adoption of this new standard, such institutions will have to consider the consolidation requirements of variable interest entities to determine whether a QSPE can be disregarded or must be included in the institution’s consolidated financial statements. While there are several important issues that will impact institutions with QSPEs, this Accounting Insight will not address these issues. Instead, this Accounting Insight focuses on the impact to institutions that transfer a portion of a financial asset through loan participations sold.
ACCOUNTING FOR TRANSFERS OF FINANCIAL ASSETS
FAS No. 166, Accounting for Transfers of Financial Assets, is effective for transfers of financial assets (e.g., loans) that occur after the beginning of an entity’s first annual reporting period beginning after November 15, 2009 (transfers on or after January 1, 2010, for calendar-year entities). FAS No. 166 can be found in its entirety at www.fasb.org under “Pre-Codification Standards” in the Standards menu.
Updated: February 12, 2010

Wipfli Accounting Insight 2 Accounting for Transfers of Financial Assets
www.wipfli.com
ACCOUNTING INSIGHT PARTICIPATIONS SOLD When an institution transfers an entire financial asset (for example, the sale of a fixed-rate mortgage loan to the secondary market), the institution can treat this transfer as a sale and remove the asset from its own balance sheet if and only if the following conditions are met (ASC 860-10-40-5, as amended):
• The transferred financial asset is isolated from the selling institution – that is, put presumptively beyond the reach of the selling institution and its creditors, even in bankruptcy or other receivership.
• Each transferee has the right to pledge or exchange the assets it received.
• The selling institution does not maintain effective control over the transferred financial asset.
These requirements remain largely unchanged from previous accounting guidance. However, the new accounting guidance may significantly impact institutions that transfer a portion of a financial asset. A common example of this occurs when an institution sells a participation in a loan (“participation sold”). Participations sold may include a variety of terms, but in its simplest form, an institution will sell a specific percent of a loan originated by the institution to a third party. As the borrower makes payments on the original loan, the institution remits a pro rata amount of each payment less a servicing fee to the third party. When an institution does not sell an entire financial asset, as is the case with a participation sold, it must meet the above requirements and the additional criteria of a “participating interest” to be treated as a sale. A participating interest has all of the following characteristics:
• From the date of the transfer, the sold portion represents a proportionate (pro rata) ownership interest in an entire financial asset.
• From the date of the transfer, all cash flows received from the entire financial asset are divided proportionately among the participating interest holders in an amount equal to their share of ownership.
• The rights of each participating interest holder (including the selling institution in its role as a participating interest holder) have the same priority, and no participating interest holder’s interest is subordinated to the interest of another participating interest holder.
o As part of this requirement, participating interest holders have no recourse to the selling institution or to each other (normal servicing arrangements do not violate this requirement).
• No party has the right to pledge or exchange the entire financial asset unless all participating
interest holders agree to pledge or exchange the entire financial asset.
Wipfli Accounting Insight 3 Accounting for Transfers of Financial Assets
www.wipfli.com
ACCOUNTING INSIGHT SALES VERSUS SECURED BORROWING TRANSACTIONS If sale treatment is permitted for a transfer of financial assets, such as a participation sold, the institution benefits by being able to reduce its loans for the portion of the loan sold and to recognize any applicable gain on sale at the time of the transfer. If a transfer of a financial asset does not qualify for sale treatment, the transferring institution continues to recognize the asset on its own balance sheet, records a secured borrowing (liability) with a pledge of collateral, and is not permitted to recognize any gain on sale. Accounting Standards Codification (ASC) 860-30 includes accounting guidance on how the transferor and transferee should account for a secured borrowing. A secured borrowing transaction has less favorable regulatory treatment than a sale, too. If sale treatment is allowed, the participation sold is removed from the loan portfolio, which has the effect of improving regulatory capital ratios. Since the institution continues to recognize the entire loan as an asset in a secured borrowing transaction, such transactions do not improve regulatory capital ratios. In addition, if sale treatment is not allowed for a participation sold and the loan balance is not reduced, the institution cannot use the participation sold to reduce large loan balances below the institution’s legal lending limit.
PROBLEM TERMS IN PARTICIPATION SOLD AGREEMENTS The new guidance will be effective for participations sold and other transfers of financial assets that occur after the institution is required to adopt the guidance. Thus, institutions will not have to evaluate participations sold currently in effect, although they will have to evaluate the arrangements if they are renewed or modified after the effective date of the accounting standard. Although not a complete list, the following are some common scenarios that will likely disqualify an institution from using sale treatment:
• Line of credit participation – Some institutions have participated interests in lines of credit or other loans whereby the selling institution funds the first draws up to a certain dollar amount and then participates the remaining draws as they are made. This is not a proportionate ownership in the loan and does not qualify as a sale under the new accounting standard. To qualify as a sale, this arrangement could be modified to participate all draws proportionately to all of the participants as the draws are made.
• Last in, first out and similar arrangements – In some participation sold agreements, all of the first payments from the borrower are passed along to the participating interest holders and the selling institution receives the remaining payments after the participating interest holders have been paid off. This results in disproportionate cash flows and disallows the use of sale treatment. The arrangement could qualify for sale treatment if, instead, it required all payments received by the selling institution be divided equally among the participating interest holders, including the selling institution.
• Excessive servicing fees – Some institutions retain a fee for servicing the loan that is significantly higher than the fee that would fairly compensate the institution for its servicing obligation. This also results in a disproportionate division of cash flows among the participating interest holders. To qualify as a sale, the selling institution could modify the arrangement so that it retains a servicing fee that fairly compensates it for servicing the loan.

Wipfli Accounting Insight 4 Accounting for Transfers of Financial Assets
www.wipfli.com
ACCOUNTING INSIGHT PROBLEM TERMS IN PARTICIPATION SOLD AGREEMENTS (CONTINUED)
• Interest-only strips – In some cases, the contractual interest rate of the loan exceeds the market rate at the time of transfer. The participation agreement may include a provision that the selling institution will only pass along the market interest rate to the participating interest holders and retain the excess interest, which usually results in the recognition of an interest-only strip and disqualifies sale treatment. (This is especially common with sales of the guaranteed portion of SBA loans.) The institution may qualify for sale treatment if it charged a premium to the participating interest holders at the transfer date to compensate for the above-market interest and then remitted the full contractual interest amounts (less applicable servicing fees) to the participants as they are received from the borrower.
• Recourse obligations – Most recourse provisions will disqualify the use of sale treatment for participations sold. Examples of recourse obligations include an agreement that the selling institution will repurchase loans that default within 90 days of sale or refund any premium paid by the participating interest holder if the loan is prepaid within a defined time frame. If the recourse provision expires, the institution can reevaluate the participation agreement to determine if it subsequently meets the participating interest criteria.
CONCLUDING THOUGHTS This guidance applies to all transfers that occur on or after the beginning of an entity’s first annual reporting period beginning after November 15, 2009 (January 1, 2010, for calendar-year entities). The standard does not impact loan participations sold prior to this date where the only activity related to the participation is the remittance of payments. However, this standard will affect new draws on lines of credit that are participated out since these are new transfers, even though the participation agreement was entered into prior to the effective date of the standard. In addition, it appears this standard will affect loan participation renewals and extensions occurring after the effective date. The new accounting guidance issued for transfers of financial assets may have a significant impact on financial institutions that sell loan participations to other parties. We recommend management become familiar with this new guidance and train those that work directly with loan participations sold to identify terms of participation agreements that could disqualify the institution from using sale treatment.
CONTACT INFORMATION For more information, please contact your Wipfli relationship executive or:
Brett Schwantes Technical Issues Committee Chair 715.843.7404
Or e-mail us at [email protected].
Please check our website (www.wipfli.com) regularly for current updates!