Farmer perceptions and genetic studies of rosette disease ...
155
Farmer perceptions and genetic studies of rosette disease in groundnut (Arachis hypogaea L.) in northern Mozambique By Amade Muitia MSc. Crop Science (Plant Breeding) (Texas Tech University, USA) BSc. Crop Science (Agronomy) (Universidade Eduardo Mondlane, Mozambique) A thesis submitted in partial fulfilment of the requirements for the degree of Doctor of Philosophy (PhD) in Plant Breeding African Centre for Crop Improvement School of Agricultural, Earth and Environmental Sciences University of KwaZulu-Natal Republic of South Africa December 2011
Transcript of Farmer perceptions and genetic studies of rosette disease ...

Farmer perceptions and genetic studies of rosette disease in groundnut (Arachis
hypogaea L.) in northern Mozambique
By
Amade Muitia
MSc. Crop Science (Plant Breeding) (Texas Tech University, USA)
BSc. Crop Science (Agronomy) (Universidade Eduardo Mondlane, Mozambique)
A thesis submitted in partial fulfilment of the requirements for the degree of
Doctor of Philosophy (PhD) in Plant Breeding
African Centre for Crop Improvement
School of Agricultural, Earth and Environmental Sciences
University of KwaZulu-Natal
Republic of South Africa
December 2011
ii
THESIS ABSTRACT
Groundnut (Arachis hypogaea L.) is an important food and cash crop in Mozambique
and production has been constrained by lack of high-yielding cultivars and disease
infection. Objectives of this study were: 1) to identify farmers’ major groundnut
production constraints and their preferences for cultivars; 2) to determine genotypic
variation among landraces for agro-morphological traits and resistance to groundnut
rosette disease; 3) to determine agronomic performance and resistance to groundnut
rosette disease among advanced groundnut lines; and 4) to determine the inheritance of
resistance to groundnut rosette disease. The study was conducted in northern
Mozambique from 2008/2009 to 2010/2011.
In attempt to identify farmers’ major groundnut production constraints and their
preferences in cultivars, a participatory rural appraisal (PRA) was conducted in Namuno
and Erati districts in northern Mozambique. Results from the PRA showed that farmers
were aware of the constraints affecting groundnut production and productivity in the
study area. The major constraints included groundnut rosette disease, insect pests, lack
of seeds and improved cultivars, low soil fertility and lack of infra-structure. Groundnut
rosette disease was ranked the most important constraint, and it was widespread in the
region. Selection criterion for groundnut cultivars used by women differed from that used
by men within village and across villages. However, high yield and oil content were the
most important traits preferred by farmers followed by pod and seed size, earliness,
disease and insect pest resistance.
Fifty-eight groundnut landraces were collected from northern Mozambique (Nampula,
Cabo Delgado, Niassa and Zambezia) and evaluated for variation in agro-morphological
traits and resistance to groundnut rosette disease. The landraces showed high
phenotypic diversity in agro-morphological traits. Clustering by nearest neighbour
method indicated that the genotypes could be grouped into six clusters, indicating that
agro-morphological diversity exists. The highest yielding genotypes were Pambara-4,
Pambara-2, Pambara-6, Ile-1, Imponge-1-Tom and Gile-5. There was considerable
genetic variability for resistance to groundnut rosette disease among the landraces. Four
landraces (PAN-4, Imponge-4, Pambara-3, Metarica Joao) were classified as resistant.
No significant correlation was observed between seed yield and groundnut rosette
incidence.
iii
Thirty-two improved lines were evaluated for performance in two growing seasons
across three locations in northern Mozambique (Nampula, Namapa and Mapupulo). The
results indicated that the highest yielding genotype was 23A and the highest yielding
location was Namapa. There was a significant and negative correlation between seed
yield and groundnut rosette disease indicating that the seed yield was negatively
influenced by the disease. The results on stability analysis indicated that genotype 35B
was the most stable across environments since it had coefficient of regression around
unity (bi=1.024), high coefficient of determination (R2=0.999), and small variance
deviation (var-dev=162.8), and 13 % above average seed yield. It is, therefore,
concluded that genotype 35A could be recommended for cultivation on diverse
environments of northern Mozambique.
A trial was conducted using the parents and F2 populations derived from a 7 X 7 diallel
cross. The test materials were infected with groundnut rosette disease using the
spreader-row technique. The results indicated that no genotype was immune to disease.
The mean squares due to both general combining ability (GCA) and specific combining
ability (SCA) were significant indicating that additive and non-additive gene actions were
involved in the expression of resistance to groundnut rosette disease. The general
predictability ratio (GCA:SCA) was 0.97, indicating the predominance of additive over
non-additive gene action in the inheritance of the disease. The study also found that
groundnut rosette disease was controlled by two recessive genes. However, some
genetic modifiers may also be present and influence disease expression.
In general, the study revealed that breeding opportunities do exist, incorporating farmers
preferred traits and major groundnut production constraints into new groundnut cultivars.
Improving cultivars for resistance to groundnut rosette disease will be a major breeding
focus, while selection for other traits and constraints will not be ignored. Resistance has
been identified from local landraces. Advanced lines with high yields across
environments were identified that can be recommended for release. The high significant
additive effects observed for groundnut rosette disease implied genetic advance could
be effective in the F2 and later generations through selection, although modifiers could
slow the progress.

iv
DECLARATION
I, Amade Muitia, declare that:
1. The research reported in this thesis, except where otherwise indicated, is my original
research.
2. This thesis has not been submitted for any degree or examination at any other
university.
3. This thesis does not contain other persons’ data, pictures, graphs or other information,
unless specifically acknowledged as being sourced from other persons.
4. This thesis does not contain other persons' writing, unless specifically acknowledged
as being sourced from other researchers. Where other written sources have been
quoted, then:
a. Their words have been re-written but the general information attributed to them
has been referenced
b. Where their exact words have been used, then their writing has been placed in
italics and inside quotation marks, and referenced.
5. This thesis does not contain text, graphics or tables copied and pasted from the
Internet, unless specifically acknowledged, and the source being detailed in the thesis
and in the references sections.
Signed:
………………………………………………………………….....…………………….. Amade Muitia
As the candidate’s supervisors, we agree to the submission of this thesis:
……………………………………………………………………………………………… Dr. Githiri Mwangi (Supervisor)
………………………………………..……………………………………………………
Prof. Mark Laing (Co-Supervisor)

v
ACKNOWLEDGEMENTS
My thanks and prayers go to all the wonderful people who directly or indirectly made this
study a reality. It would be impossible for me to list all these people on one page. For
those not listed here, I have not forgotten you.
First, I would like to express my thanks to Dr. Githiri Mwangi, my supervisor, for
accepting me as his student. It was a challenge for him to supervise a student whose
English is even not a third language. Through his wisdom and guidance, the language
barrier was overcome and I am deeply indebted to him.
My appreciation goes to Professor Mark Laing and Dr. Steve Boahen, co-supervisor and
in-country supervisor, respectively, who devoted their time and knowledge to helping me
on this journey. I also like to thank Dr. Julia Sibiya, who dedicated her time and gave me
a lot of insights about data analysis and data presentation.
My gratitude goes to Dr. Emmanuel Monyo, plant breeder in charge of the groundnut
regional breeding program at the International Crops Research Institute for the Semi-
Arid Tropics (ICRISAT)-Malawi, for providing the germplasm used in the genetic study.
My thanks also go to all the members of academic and administrative staff at the African
Centre for Crop Improvement (ACCI) for their support during my work.
I also wish to acknowledge Mrs. Jacinta de Carvalho, technician in the groundnut
breeding program at Nampula Research Station, Mozambique. Jacinta was in charge of
all field work, and she guaranteed that it was done on time.
My gratitude goes to my fellow 2007 COHORT members: Margaret, Patrick, Tulole,
Vincent, Robert and Abush, who helped me overcome rough times and encouraged me
to continue with the journey.
I would like to express my gratitude to The Alliance for a Green Revolution in Africa
(AGRA) for making this study possible through provision of funding.
I would like to thank the Agricultural Research Institute of Mozambique (IIAM), Northeast
Zone Center (CZnd) for hosting me during the three years of field work, and the
University of KwaZulu-Natal for accepting me as graduate student.
Finally, I wish to express my deep appreciation to my parents, sister and wife and
particularly to my two girls, Clidemia and Edmonia, who inspired me to pursue a PhD
degree.

vi
DEDICATION
This thesis is dedicated to people closest to me who have always believed in me: my
daughters (Clidemia and Edmonia), my sister (Julieta Miliano) and my late parents
(Miliano Muitia and Aina Faquihi).

vii
TABLE OF CONTENTS
THESIS ABSTRACT .................................................................................................................. ii
DECLARATION ......................................................................................................................... iv
ACKNOWLEDGEMENTS .......................................................................................................... v
DEDICATION ............................................................................................................................ vi
TABLE OF CONTENTS ........................................................................................................... vii
GENERAL INTRODUCTION ...................................................................................................... 1
Groundnut production in the world and Africa ......................................................................... 1
Groundnut production in Mozambique .................................................................................... 2
Justification ............................................................................................................................. 6
Objectives of the study ............................................................................................................ 7
References ............................................................................................................................. 8
I. LITERATURE REVIEW ............................................................................................ 10
1.0 Introduction ............................................................................................................... 10
1.1 Origin and distribution of groundnut ........................................................................... 10
1.2 Groundnut botany...................................................................................................... 10
1.2.1 Taxonomy .............................................................................................................. 10
1.2.2 Reproduction in groundnuts ................................................................................... 13
1.2.3 Genetics of groundnuts .......................................................................................... 14
1.3 Groundnut production ................................................................................................ 15
1.3.1 Importance of groundnut ........................................................................................ 15

viii
1.3.2 Groundnut production constraints in Mozambique ................................................. 15
1.4 Groundnut rosette disease ........................................................................................ 17
1.5 Resistance to groundnut rosette disease ................................................................... 18
1.6 Breeding for resistance to groundnut rosette disease ................................................ 19
1.7 Methods for detecting groundnut rosette virus ........................................................... 19
1.8 Groundnut rosette management ................................................................................ 20
1.9 Mating design ............................................................................................................ 21
1.10 The diallel cross ........................................................................................................ 22
1.11 Combining ability analysis ......................................................................................... 23
1.12 Combining ability studies in groundnut ...................................................................... 23
References ........................................................................................................................... 25
II. GROUNDNUT (ARACHIS HYPOGAEA L.) PRODUCTION CONSTRAINTS
FARMERS PREFERRED TRAITS AND GROUNDNUT ROSETTE DISEASE
INCIDENCE IN THE NORTHERN REGION OF MOZAMBIQUE .............................. 33
Abstract ................................................................................................................................ 33
2.1 Introduction ............................................................................................................... 34
2.2 Materials and methods .............................................................................................. 35
2.2.1 Study area ............................................................................................................. 35
2.2.2 Data collection ....................................................................................................... 36
2.2.3 Data analysis ......................................................................................................... 38
2.3 Results ...................................................................................................................... 39
2.3.1 Gender and age distribution ................................................................................... 39
ix
2.3.2 Area under cultivation and crops grown ................................................................. 41
2.3.3 Groundnut production ............................................................................................ 43
2.3.4 Preferred traits for groundnut cultivars ................................................................... 44
2.3.5 Groundnut production constraints .......................................................................... 47
2.3.6 Groundnut rosette disease prevalence in the Northern region of
Mozambique .......................................................................................................... 49
2.4 Discussion ................................................................................................................. 50
2.5 Conclusions ............................................................................................................... 54
References ........................................................................................................................... 54
III. EVALUATION OF NORTHERN MOZAMBIQUE GROUNDNUT (ARACHIS
HYPOGAEA L.) LANDDRACES FOR RESISTANCE TO GROUNDNUT
ROSETTE DISEASE AND SELECTED AGRO-MORPHOLOGICAL TRAITS ......... 57
Abstract ................................................................................................................................ 57
3.1 Introduction ............................................................................................................... 58
3.2 Materials and methods .............................................................................................. 59
3.2.1 Groundnut genotypes ............................................................................................. 59
3.2.2 Study area ............................................................................................................. 60
3.2.3 Field establishment ................................................................................................ 60
3.2.4 Data collection ....................................................................................................... 63
3.2.5 Data analysis ......................................................................................................... 63
3.3 Results ...................................................................................................................... 66
3.3.1 Phenotypic variation among groundnut landraces .................................................. 66

x
3.3.2 Yield and yield components ................................................................................... 69
3.3.3 Clustering based on agro-morphological traits ....................................................... 72
3.3.4 Correlations among quantitative traits .................................................................... 73
3.3.5 Evaluation under high groundnut rosette disease pressure .................................... 75
3.3.6 Correlations among quantitative traits under disease pressure .............................. 78
3.3.7 Classification of genotypes with respect to resistance to groundnut rosette
disease .................................................................................................................. 78
3.4 Discussion ................................................................................................................. 79
3.5 Conclusion ................................................................................................................ 81
References ........................................................................................................................... 82
IV. MULTILOCATIONAL EVALUATION OF ADVANCED GROUNDNUT LINES
IN NORTHERN MOZAMBIQUE ............................................................................... 85
Abstract ................................................................................................................................ 85
4.1 Introduction ............................................................................................................... 86
4.2 Materials and methods .............................................................................................. 87
4.2.1 Study area ............................................................................................................. 87
4.2.2 Groundnut genotypes evaluated ............................................................................ 87
4.2.3 Field establishment ................................................................................................ 88
4.2.4 Data collection ....................................................................................................... 88
4.2.5 Data analysis ......................................................................................................... 89
4.3 Results ...................................................................................................................... 90
4.3.1 Combined data across locations and seasons ....................................................... 90

xi
4.3.1.1 Analysis of variance ............................................................................................... 90
4.3.1.2 Phenotypic variation ............................................................................................... 91
4.3.1.3 Yield, yield components and rosette disease incidence .......................................... 94
4.3.2 Data for individual locations ................................................................................... 96
4.3.2.1 Analysis of variance ............................................................................................... 96
4.3.2.2 Mean yield, yield components and rosette disease incidence ................................ 98
4.3.3 Correlations among agro-morphological traits ...................................................... 101
4.3.4 GGE biplot and stability analysis for yield across locations .................................. 103
4.4 Discussion ............................................................................................................... 106
4.5 Conclusion .............................................................................................................. 108
References ......................................................................................................................... 108
V. INHERITANCE OF RESISTANCE TO GROUNDNUT ROSETTE DISEASE IN
GROUNDNUT (ARACHIS HYPOGAEA L.) ........................................................... 111
Abstract .............................................................................................................................. 111
5.1 Introduction ............................................................................................................. 112
5.2 Materials and methods ............................................................................................ 114
5.2.1 Study area ........................................................................................................... 114
5.2.2 Germplasm development and field establishment ................................................ 114
5.2.3 Data collection and analysis ................................................................................. 115
5.3 Results .................................................................................................................... 117
5.3.1 Combining ability analysis for groundnut rosette disease incidence ..................... 117

xii
5.3.2 Segregation for groundnut rosette disease incidence ........................................... 120
5.4 Discussion ............................................................................................................... 122
5.5 Conclusion .............................................................................................................. 124
References ......................................................................................................................... 124
VI. GENERAL OVERVIEW .......................................................................................... 128
RESEARCH IMPLICATIONS .................................................................................................. 131
Appendix 1: Participatory rural appraisal questionnaire ....................................................... 132
Appendix 2: Morphological variation of local groundnut landraces ...................................... 136
Appendix 3: Yield and yield components of local groundnut landraces ............................... 138
Appendix 5: Combined ANOVA for advanced groundnut lines ............................................ 143

1
GENERAL INTRODUCTION
Groundnut production in the world and Africa
Groundnut is an important food crop in the world. It is cultivated in more than 100
countries located in tropical, sub-tropical, and warm temperate regions of the world.
Over two-thirds of global groundnut production occurs in seasonally dry regions, where
drought is a potential constraint for crop production (Smartt, 1994). During 2009 it was
harvested on about 23.39 million ha with an estimated total production of
36.46 million tonnes (groundnuts in shell) and an average yield of 1.52 t ha-1 (FAOSTAT,
2011).
Over one-quarter of the world groundnut production is in Africa with average yield of
about 0.91 t ha-1 (Table 1), a figure that is far much lower than the world average of
1.52 t ha-1 (FAOSTAT, 2011). The ten major groundnut producing countries in Africa in
2009 were Nigeria, Senegal, Sudan, Ghana, Chad, Tanzania, DR Congo, Guinea, Mali
and Burkina Faso. Mozambique was ranked among the top 25 major groundnut
producing countries in Africa.
Table 1: World groundnut production in 2009
Region Area (103 ha) production (103 tonnes)
Yield (kg ha-1) Relative contribution
(%)
Africa 11024.08 10021.70 0.91 27.49
America 999.14 2936.10 2.94 8.05
Asia 11901.86 23465.62 1.97 64.37
Europe 10.47 8.43 0.81 0.02
Oceania 15.61 24.94 1.60 0.07
Rest of World 23951.16 36456.79 1.52
Source: FAOSTAT (2011)
2
Groundnut production in Mozambique
Groundnut (Arachis hypogaea L.) is the third most important crop in Mozambique, after
maize (Zea mays L.) and cassava (Manihot esculenta L.) (Walker et al., 2006). It is one
of the major cash crops and the main source of protein and cooking oil for many
Mozambican families (Muitia, 2005). Groundnut occupies the largest area among grain
legumes in Mozambique (Arias and Libombo, 1994) and is the most important oilseed
crop followed by cotton (Gossypium hirsitun L.) and sunflower (Helianthus annuus L.).
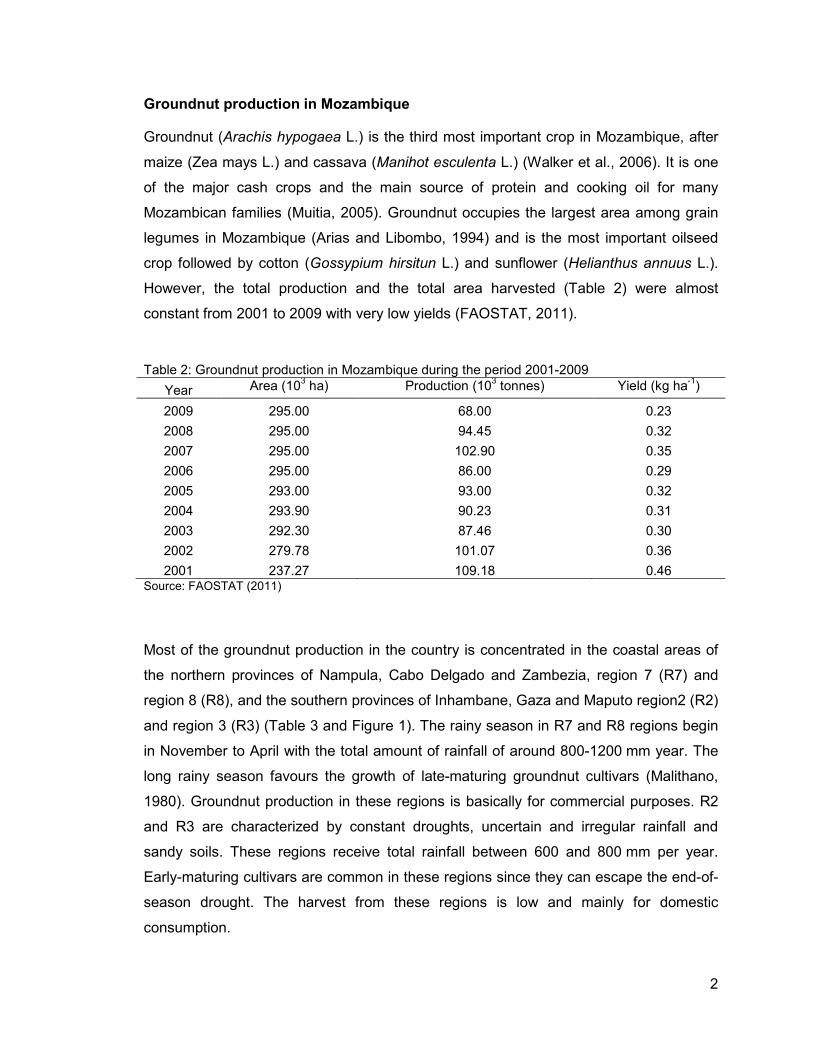
However, the total production and the total area harvested (Table 2) were almost
constant from 2001 to 2009 with very low yields (FAOSTAT, 2011).
Table 2: Groundnut production in Mozambique during the period 2001-2009
Year Area (103 ha) Production (103 tonnes) Yield (kg ha-1)
2009 295.00 68.00 0.23
2008 295.00 94.45 0.32
2007 295.00 102.90 0.35
2006 295.00 86.00 0.29
2005 293.00 93.00 0.32
2004 293.90 90.23 0.31
2003 292.30 87.46 0.30
2002 279.78 101.07 0.36
2001 237.27 109.18 0.46 Source: FAOSTAT (2011)
Most of the groundnut production in the country is concentrated in the coastal areas of
the northern provinces of Nampula, Cabo Delgado and Zambezia, region 7 (R7) and
region 8 (R8), and the southern provinces of Inhambane, Gaza and Maputo region2 (R2)
and region 3 (R3) (Table 3 and Figure 1). The rainy season in R7 and R8 regions begin
in November to April with the total amount of rainfall of around 800-1200 mm year. The
long rainy season favours the growth of late-maturing groundnut cultivars (Malithano,
1980). Groundnut production in these regions is basically for commercial purposes. R2
and R3 are characterized by constant droughts, uncertain and irregular rainfall and
sandy soils. These regions receive total rainfall between 600 and 800 mm per year.
Early-maturing cultivars are common in these regions since they can escape the end-of-
season drought. The harvest from these regions is low and mainly for domestic
consumption.

3
Groundnut is mainly grown by poor small scale farmers in Mozambique. Low yields and
quality are realized by these farmers as a result of several constraints. The major
production constraints include insect pests, poor cultural practices, diseases, drought,
and post-harvest related issues (Malithano et al., 1984). The major insect pests are
termites (Isoptera), aphids (Aphis craccivora Koch), thrips (Frankiniella fusca) and
foliage feeding pests (Aproarema modicella Deventer) (Ramanaiah et al., 1988). Some
of these pests (aphids) are vectors of groundnut rosette disease, the most destructive
viral disease in sub-Saharan Africa.
Diseases constitute a major constraint to groundnut production in Mozambique. The
most common diseases are early leaf spot (Cercospora arachidicola), late leaf spots
(Cercosporidium personatum Berk and Curt), groundnut rosette disease and rust
(Puccinia arachidis). Groundnut rosette disease can cause up to 100 % crop loss
(Subrahmanyam et al., 1997; Subrahmanyam et al., 1998; Adamu et al., 2008). When
the disease strikes, rural communities are greatly affected and they lose a very important
source of protein, a valuable source of income and substantial amount of seed for next
season of planting, leading to food insecurity. In order to prevent the disruption of rural
economies, it is vital to prevent the epidemics of groundnut rosette disease by using host
plant resistance to the pathogen or to the disease vector.
High yielding groundnut cultivars adapted to Mozambican conditions and preferred by
farmers are yet to be developed. The National Research System in collaboration with
ICRISAT-Malawi tested several groundnut populations in different agro-ecological zones
of Mozambique. Some high yielding cultivars adapted to Mozambican conditions were
identified. These cultivars were small-seeded and susceptible to groundnut rosette
disease, and therefore not popular with farmers and buyers.

4
Table 3: Characteristics of the major groundnut producing regions of Mozambique
R2 R3 R7 R8
Province Coastal Gaza Gaza Central Zambezia Cabo Delgado
Inhambane Northern Maputo Interior Nampula Coastal Nampula
Coastal Maputo Central Tete Coastal Zambezia
Interior Cabo Delgado
Altitude Below 200 m Below 200 m 200 – 1000 m Below 200 m
Rainfall 800-1000 mm 500-800 mm 800–1400 mm 800–1400 mm
ET0>1500 mm ET0>1500 mm 1000<ET0<1400 mm 1000<ET0<1400 mm
Soil type Sodic Sandy Deep brown loam Sandy
sandy black loam Red loam sandy loam
red calcareous red loam
Sodic
Sandy loam
Key: ETo = Evapotranspiration potential (Source: IIAM and UEM, 2010)

5
Figure 1: Agro-ecological zones of Mozambique (Codes for the zones are as defined in Table 3

6
Justification
Groundnuts constitute one of the major cash crops and the main source of cooking oil
for many Mozambican families. The crop is grown all over the country by resource-poor
small-scale farmers under rainfed conditions.
Groundnut rosette disease is one of the most important production constraint. Yield
losses of up to 100% have been reported from various parts of the world (Naidu et al.,
1998). Several methods for groundnut rosette disease management have been reported
and include: insecticide application, manipulation of cropping systems and host plant
resistance for both vector and virus (Naidu et al., 1998; Naidu et al., 1999). In sub-
Saharan Africa, the use of host plant resistance is the most economically-effective and
environmentally-beneficial method of controlling diseases. Resistant cultivars can easily
fit into the resource-poor farmers’ practices (Russell, 1978).
Many studies evaluated groundnut germplasm for resistance to groundnut rosette
disease since 1907 when the disease was first reported, with no appreciable success. In
1952 significant resistance to the disease was identified in Burkina Faso (Nigam and
Bock, 1990; Subrahmanyam et al., 1998; Olorunju et al., 2001). Since then, other
sources of resistance have been identified from various parts of the world and used in
breeding programmes to develop resistant cultivars. Such resistant cultivars have been
successfully used in Burkina Faso, Malawi and Nigeria. Some resistant cultivars
developed by ICRISAT were released in Mozambique but not widely accepted by
farmers in the country.
There is a need to identify/develop farmer-acceptable groundnut cultivars for cultivation
by Mozambican farmers. However, information on major groundnut production
constraints, farmer preferences for groundnut traits and prevalence of groundnut rosette
disease in Mozambique is limited. This study was undertaken to address some of these
constraints.

7
Objectives of the study
The overall goal of the study was to improve food security and reduce the poverty of
small scale farmers in the northern region of Mozambique by increasing groundnut
production and productivity.
The specific objectives of the research were as follows:
i. To identify farmers’ major groundnut production constraints and their preferences
for groundnut traits.
ii. To determine genotypic variation among landraces for agro-morphological traits and resistance to groundnut rosette disease.
iii. To determine agronomic performance and resistance to groundnut rosette disease among advanced groundnut lines across locations in northern Mozambique
iv. To determine the gene action governing the inheritance of groundnut rosette disease resistance.

8
References
Adamu, A.K., P.E. Olorunju, S.G. Ado and S.O. Alabi. 2008. General and specific
combining ability estimates for rosette resistance, early maturity and other traits
in groundnuts (Arachis hypogaea L.). International Journal of Pure and Applied
Sciences. 2:33-41.
Arias, F.J. and M.L. Libombo. 1994. Groundnut Evaluation in Mozambique : Preliminary
Results from the 1993/94 Season in Maputo Province. In: Ndunguru, B.J.et al.,
(Eds.). Sustainable Groundnut Production in South and Eastern Africa,
International Crops Research Institute for the Semi-Arid Tropics, Mbabane,
Swaziland.
FAOSTAT. 2011. FAOSTAT-Agriculture. FAO Statistics Division.
http://faostat.fao.org/site/567/default.aspx#ancor.
Instituto de Investigação Agrária de Moçambique (IIAM) and Universidade Eduardo
Mondlane (UEM). 2010. Fichas Técnicas de Culturas. Pátria-Serigrafia, Gráfica e
Serviços, Ltd. Maputo, Moçambique. pp247.
Malithano, A.D. 1980. Groundnut Production, Utilization, Research Problems and
Further Research Needs in Mozambique. International Workshop on
Groundnuts, International Crops Research Institute for the Semi-Arid Tropics,
Lilongwe, Malawi. pp. 257-261.
Malithano, A.D., K.V. Ramanaiah, A.M. Monjana, B.S. Chilengue and R.N. Uaiene.
1984. Factors Affecting Groundnut Production in Mozambique. In: McDonald, D.
(Ed.). Regional Groundnut Workshop for Southern Africa, International Crops
Research Institute for the Semi-Arid Tropics, Lilongwe, Malawi. pp. 61-67.
Muitia, A. 2005. Combination of Root-Knot Nematodes (Meloidogyne spp.) Resistance
and Edible Seed Quality for Peanut (Arachis hypogaea L.) Production in
Mozambique and in the U.S., Plant and Soil Science, Texas Tech University,
Lubbock, Texas. pp. 64.
Naidu, R.A., H. Bottenberg, P. Subrahmanyam, F.M. Kimmins, D.J. Robinson and J.M.
Thresh. 1998. Epidemiology of groundnut rosette virus disease: Current status
and future research needs. Annals of Applied Biology. 132:525-548.

9
Naidu, R.A., F.M. Kimmins, C.M. Deom, P. Subrahmanyam, A.J. Chiyembekeza and
P.J.A.v.d. Merwe. 1999. Groundnut rosette: a virus disease affecting groundnut
production in Sub-Saharan Africa. Plant Disease. 83:700-709.
Nigam, S.N. and K.R. Bock. 1990. Inheritance of resistance to groundnut rosette virus in
groundnut (Arachis hypogaea L.). Annals of Applied Biology. 117:553-560.
Olorunju, P.E., B.R. Ntare, S. Pande and S.V. Reddy. 2001. Additional sources of
resistance to groundnut rosette disease in groundnut germplasm and breeding
lines. Annals of Applied Biology. 139:259-268.
Ramanaiah, K.V., M.J. Freire, B.S. Chilengue and A.V. Munguambe. 1988. Research on
Groundnuts in Mozambique. In: ICRISAT (Ed.). Third Regional Groundnut
Workshop for Southern Africa, International Crops Research Institute for the
Semi-Arid Tropics, Lilongwe , Malawi. pp. 157-161.
Russell, G.E. 1978. Plant Breeding for Pest Disease Resistance England Butterworth &
Co (Publishers) Ltd. London.
Smartt, J. 1994. The Groundnut crop - A Scientific Basis for Improvement. Chapman &
Hall. London, UK.
Subrahmanyam, P., G.L. Hildebrand, R.A. Naidu, L.J. Reddy and A.K. Singh. 1998.
Sources of resistance to groundnut rosette disease in global groundnut
germplasm. Annals of Applied Biology. 132:473-485.
Subrahmanyam, R., P.S.V. Wyk, C.T. Kisyombe, D.L. Cole, G.L. Hildebrand, A.J.
Chiyembekeza and P.J.A.V.D. Merwe. 1997. Diseases of groundnut in the
Southern African Development Community (SADC) region and their
management. International Journal of Pest Management. 43:261-273.
Walker, T., R. Pitoro, A. Tomo, I. Sitoe, C. Salencia, R. Mahanzule, C. Donovan and F.
Mazuze. 2006. Priority Setting for Public-Sector Agricultural Research in
Mozambique with the National Agricultural Survey Data, IIAM, Maputo,
Mozambique.

10
I. LITERATURE REVIEW
1.0 Introduction
In this chapter, the literature on groundnut is reviewed in the following sections: origin
and distribution; botany; production; groundnut rosette disease; breeding for resistance
to groundnut rosette disease; methods for detecting groundnut rosette disease and
mating design schemes. In addition, this section reviews groundnut production in
Mozambique.
1.1 Origin and distribution of groundnut
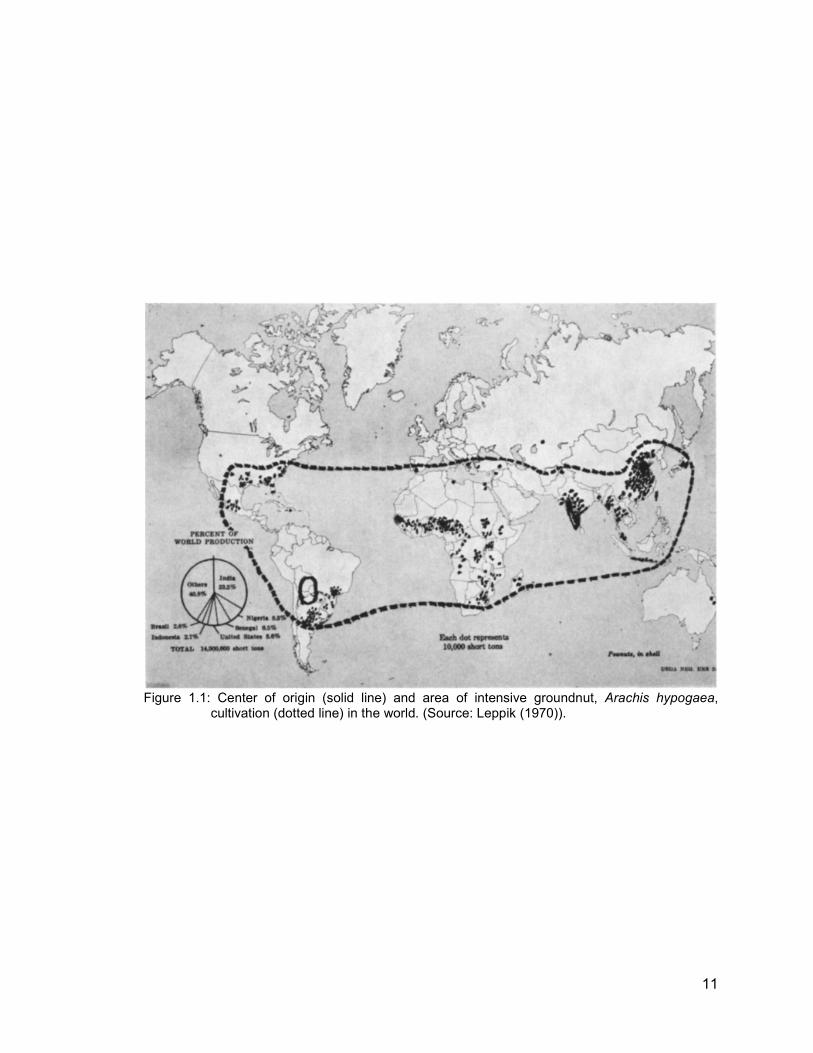
Archaeological evidence suggests that groundnut has been cultivated for more than
3500 years, and was probably first domesticated in northern Argentina and eastern
Bolivia (Singh and Simpson, 1994). It is believed that the cultivated type, Arachis
hypogaea, originated in this region, since Arachis monticola, the only wild tetraploid
species that is cross compatible with it, is found in this area (Stalker and Moss, 1987;
Singh and Simpson, 1994). The crop was introduced to other parts of the world through
various routes and reasons. Today, groundnut is grown worldwide (Figure 1.1) with
China, India and the United States of America (USA) being the largest producers.
1.2 Groundnut botany
1.2.1 Taxonomy
The botanical name of groundnut is Arachis hypogaea. The name is derived from the
Greek word arachis meaning ‘legume’ and hypogaea meaning ‘below ground’, referring
to the formation of pods in the soil (Pattee and Stalker, 1995). Groundnut is a member of
the family Leguminosae, tribe Aeschynomeneae, subtribe Stylosanthinae of genus
Arachis. Arachis hypogaea is an annual herb of indeterminate growth habit which has
been divided into two subspecies, hypogaea and fastigiata, each with several botanical
cultivars (Holbrook and Stalker, 2003). Sub-specific and varietal classifications (Table
1.1) are mostly based on location of flowers on the plant, patterns of reproductive nodes
on branches, numbers of trichomes and pod morphology (Krapovickas and Gregory,
1994).
11
Figure 1.1: Center of origin (solid line) and area of intensive groundnut, Arachis hypogaea,
cultivation (dotted line) in the world. (Source: Leppik (1970)).

12
Table 1.1 Subspecific and varietal classification of Arachis hypogaea
Subspecies Botanical cultivar
Market type
Location where found
Important traits
Hypogaea Hypogaea - Bolivia, Amazona
No flowers on the main stem; alternating pairs of floral and reproductive nodes on lateral branches; branches relatively short, and few trichomes
Virgina - Large-seeded; less hairy
Runner - Small-seeded; less hairy
Hirsuta Peruvian Peru More hairy; flowers on the main stem; sequential pairs of floral and vegetative axes on branches
Fastigiata Fastigiata Valencia Brazil (Guaranian, Goias, Minas Gerais), araguay, Peru, Uruguay
Little branched, curved branches
Peruviana - Peru Less hairy; deep pod reticulation
Aequatoriana - Ecuador Very hairy; deep pod reticulation; purple stems; more branched and erect
Vulgaris Spanish Brazil (Guaranian, Goias, Minas Gerais), araguay, Peru, Uruguay
More branched, upright branches
Adapted from Holbrook and Stalker (2003).
13
1.2.2 Reproduction in groundnuts
The groundnut flower is orange to yellow in colour, with standard, wing and keel,
bisexual, zygomorphic, complete and sessile. It is produced above ground in the axils of
leaves near the base of the plant about four to six weeks after planting, depending on
genotype and environment, especially temperature (Holbrook and Stalker, 2003). The
flower is inserted on top of a pedicel that curves downward and pushes the flower into
the soil following pollination and fertilization where it produces seed (Stalker, 1997).
Smith (1950) described the groundnut flower as having a curved beaked keel, with two
petals fused along the dorsal edges to the apex but opened ventrally at the base.
As the stigma and the anthers are shielded within the flowers, self-pollination is most
common with a high frequency (Murty et al., 1980), but cross-pollination may occur in
the range of less than 1 % to 3.9 % (Rao and Murty, 1994). The cross-pollination in
groundnuts is primarily induced by honeybees (Stalker, 1997; Maiti and Wesche-
Ebeling, 2002), but other groundnut pests such as thrips can be vectors of groundnut
pollen (Hammons and Leuck, 1966). (Stalker, 1997) reported that several wild species
may require bees’ visitation for pollination to occur. The groundnut flower contains 10
anthers with the staminal column surrounding the ovary, five of which are small and
globular and five are oblong (Rao and Murty, 1994; Stalker, 1997). Rao and Murty
(1994) stated that two of the 10 anthers are sterile while Stalker (1997) reported that one
or more of the anthers is usually sterile and difficult to observe. Fertilization is complete
in about 6 hours after pollination and within 5 to 6 hours the flower may wither (Rao and
Murty, 1994). The flower petals droop and the fertilised ovary elongates after fertilization,
forming the peg (Beattie and Beattie, 1943; Rao and Murty, 1994).
The peg grows down into the soil as a positively geotropic stalk-like structure (Coolbear,
1994), and the peg tip continues to enlarge, eventually forming a groundnut pod below
the soil surface in 7 to 10 weeks (Gregory et al., 1951). The pegs which fail to contact
and enter into the soil after expanding usually die. The number of kernels per pod may
range from one to five and sometimes to six and is influenced by cultivar and
environmental factors (Rao and Murty, 1994). However, members of subsp. hypogaea
and subsp. fastigiata var. vulgaris always produce two-seeded pods (Stalker, 1997), and
cultivars belonging to var. fastigiata are three or four-seeded (Rao and Murty, 1994).
14
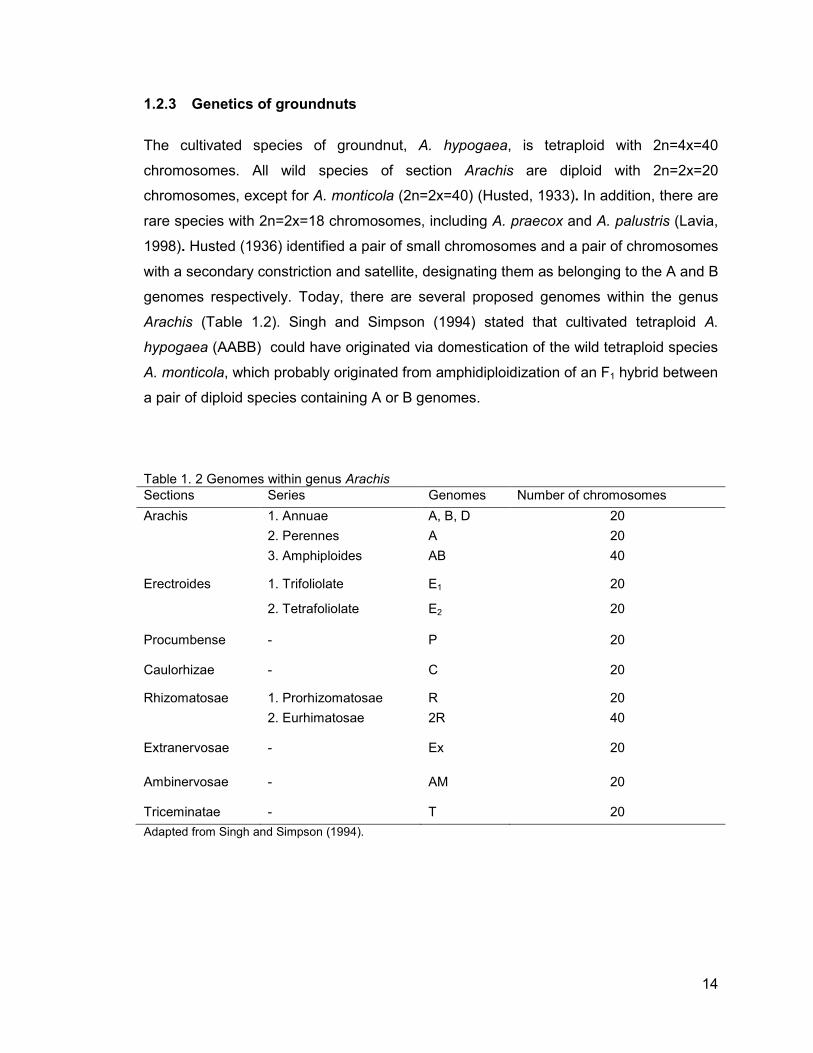
1.2.3 Genetics of groundnuts
The cultivated species of groundnut, A. hypogaea, is tetraploid with 2n=4x=40
chromosomes. All wild species of section Arachis are diploid with 2n=2x=20
chromosomes, except for A. monticola (2n=2x=40) (Husted, 1933). In addition, there are
rare species with 2n=2x=18 chromosomes, including A. praecox and A. palustris (Lavia,
1998). Husted (1936) identified a pair of small chromosomes and a pair of chromosomes
with a secondary constriction and satellite, designating them as belonging to the A and B
genomes respectively. Today, there are several proposed genomes within the genus
Arachis (Table 1.2). Singh and Simpson (1994) stated that cultivated tetraploid A.
hypogaea (AABB) could have originated via domestication of the wild tetraploid species
A. monticola, which probably originated from amphidiploidization of an F1 hybrid between
a pair of diploid species containing A or B genomes.
Table 1. 2 Genomes within genus Arachis Sections Series Genomes Number of chromosomes
Arachis 1. Annuae A, B, D 20
2. Perennes A 20
3. Amphiploides AB 40
Erectroides 1. Trifoliolate E1 20
2. Tetrafoliolate E2 20
Procumbense - P 20
Caulorhizae - C 20
Rhizomatosae 1. Prorhizomatosae R 20
2. Eurhimatosae 2R 40
Extranervosae - Ex 20
Ambinervosae - AM 20
Triceminatae - T 20
Adapted from Singh and Simpson (1994).

15
1.3 Groundnut production
1.3.1 Importance of groundnut
Groundnut is one of the most important legume crops for several million people in the
world and is a valuable cash crop for small-scale farmers in developing countries. It is an
annual legume and grown primarily for its high quality edible oil and easily digestible
protein in its seeds (Upadhyaya et al., 2006). Groundnut seeds are characterized by
high contents of oil (40-50 %), protein (20-40 %), and a low percentage of carbohydrates
(10-20 %) (Ahmed and Young, 1982; Maiti and Wesche-Ebeling, 2002). Groundnuts
have a cultivar of uses, including human food (roasted, boiled, cooking oil), animal feed
(pressings, straw, seeds), and industrial raw materials (soap, detergent, cosmetics)
(Maiti and Wesche-Ebeling, 2002). Groundnut oil can be used in cooking, lighting, fuel
and as a food constituent. A large percentage of the world production of groundnuts is
used for edible oil, whereas in the USA, approximately 60 % of total groundnut
production is used for human food (Ahmed and Young, 1982; Moss and Rao, 1995). The
principal uses are groundnut butter, groundnut candy, in-shell, and shelled nuts. In some
places, the vines with leaves are used as source of protein hay for horses and ruminant
livestock; the shells can be used as feed for livestock and burned for fuel.
1.3.2 Groundnut production constraints in Mozambique
Groundnut yields realized by small scale farmers in Mozambique are quite low (400-
600 kg ha-1). The low yields have been attributed to several constraints. Some of the
major groundnut production constraints include poor cultural practices, pests, weeds,
drought, and diseases (Malithano, 1984). The poor cultural practices include low plant
population, and delays in planting due to uncertainty of rainfall. Farmers plant groundnut
in wide spacing leading to very low plant density. The low plant density may be attributed
to lack of seed and to the mixed cropping systems practiced by the farmers. Most of
farmers use their own seed for sowing in the following season because groundnut prices
at the beginning of growing season are quite high and most of the farmers do not afford.
Mixed cropping system is common for many farmers in Mozambique. The system
reduces the risk of crop loss due to adverse conditions thereby ensuring substantial yield
advantages and harvests as compared to sole cropping.

16
The major pests affecting groundnut include termites, aphids (Aphis cracivora), thrips
(Frankliniella fusca) and foliage feeding pests (Ramanaiah, 1988). Termites are a major
pest at all stages of crop growth and they feed on pods, seeds and plant foliage. Aphids
are a major pest at seedling stage and they suck plant sap. Thrips attack flower buds
and consequently contribute to low seed set. Foliage feeding pests attack the crop
during vegetative growth. They reduce photosynthetic area. Some of these pests (i.e.
aphids) are vectors of the most destructive virus diseases in sub-Saharan Africa, such
as groundnut rosette disease. Besides groundnut rosette disease, aphids are also
vectors of peanut mottle, peanut stripe, peanut stunt and peanut chlorotic streak
(Kokalis-Burelle et al., 1997). The control measures applied by farmers to reduce insect
pest infestation include cultural practices and insecticide application. Cultural practices
include early planting, such that the crop matures before the period of peak pest
population, and mixed cropping. Insecticides are effective in killing insects. However,
they should be applied only if economically sustainable since they are expensive.
Weeds constitute a major problem for groundnut during the first few weeks after planting
and at the harvesting. Failure to control weeds can result in reduced crop yields since
they compete with the groundnut crop for nutrients and water. In addition, they interfere
with the harvesting process. Furthermore, they harbour pests and disease vectors.
Cultural practices such as good land preparation and crop rotation are the most
recommended control measures for weeds. In addition, herbicide application, when
available, is also recommended for weed control (Kokalis-Burelle et al., 1997).
Drought stress may affect the crop at different stages during the growing season. In
groundnut, drought stress during flowering and pod filling stage is critical for yield and
agronomic characters. Drought at these stages leads to reduction in crop yield by
affecting the number of pods per plant (Boote et al., 1982), and irregular and scarce
rainfall at pod filling reduces the yield greatly (Malithano, 1980). Not only the yield of
groundnut but also the quality of products decreases under drought stress (Rucker et al.
1995). When drought occurs in the last 20-40 days of the season, pre-harvest infection
by Aspergillus flavus is increased and consequently, aflatoxin concentration increase.
found that genotype selection for drought tolerance may improve aflatoxins resistance,
and under drought stress conditions, drought tolerant cultivars yield more than
susceptible (Cole et al., 1989; Sanders et al., 1993 and Arunyanarka et al., 2010).

17
Diseases constitute a major constraint to groundnut production. Early leaf spot
(Cercospora arachidicola Hori) and late leaf spot (Cercosporidium personatum Berk and
Curt), rust (Puccinia arachidis Speg.) and groundnut rosette disease virus are very
common and can cause significant losses to the crop. Leaf spots and rust damage the
crop by reducing the photosynthetic area through lesion formation and stimulating leaflet
abscission. The shedding of the leaflets results in premature ageing of the crop, and
therefore, yields loss. Crop rotation, use of tolerant cultivars and use of fungicides are
some control measures for these diseases. Groundnut rosette disease alone can cause
up to 100 % crop loss (Subrahmanyam et al., 1997; Subrahmanyam et al., 1998; Adamu
et al., 2008). When the disease occurs, rural economies that depend on groundnuts are
completely disrupted since smallholder farmers in sub-Saharan Africa, grow groundnut
for both subsistence and as cash crop (Naidu et al., 1999). When a disaster such as
groundnut rosette disease strikes, rural farmers lose a very important source of protein,
a valuable source of income and substantial part of seed for next planting leading to food
insecurity (Naidu et al., 1998). Consequently, suggested that cultivars with resistance to
the pathogens would be needed to suppress the two leaf spot diseases even if
fungicides controlled the diseases (Holbrook and Stalker, 2003). In the case of rosette
disease, it is vital to prevent the epidemics of the disease by using host resistance to the
pathogen or to the disease vector. Other control measures for diseases include crop
rotation, deep ploughing, removal of debris and planting on time and insecticide
application against disease vectors.
1.4 Groundnut rosette disease
Groundnut rosette disease was first described in 1907 by Zimmermann in Tanzania
Naidu et al. (1998). It is the most destructive virus disease of groundnuts in sub-Saharan
Africa (Nigam and Bock, 1990; Naidu et al., 1998; Olorunju and Ntare, 2008). Today, the
disease is widely distributed in sub-Saharan Africa and offshore islands, including
Madagascar (Nigam and Bock, 1990; Naidu et al., 1998).
Groundnut rosette disease is caused by a complex of three agents namely: groundnut
rosette assistor virus (GRAV), groundnut rosette virus (GRV) and a satellite RNA (sat
RNA) (Murant et al., 1988; Naidu et al., 1998). It is transmitted by an aphid vector, Aphis
craccivora Koch, in a persistent manner. In order for the aphid to be able to successfully

18
transmit the disease, all three agents must be present together in the host plant
(Subrahmanyam et al., 1998). Subrahmanyam et al. (1992) reported three types of
groundnut rosette namely chlorotic, green and mosaic, while Naidu et al. (1999) reported
that there are two predominant symptom types of groundnut rosette disease namely
chlorotic and green rosette. Chlorotic rosette is widely distributed in sub-Saharan Africa;
green rosette is most prevalent in West Africa while mosaic type of rosette is found in
Eastern, Central and Southern Africa (Naidu et al., 1998).
Different variants of the satellite RNA of groundnut rosette virus are responsible for the
chlorotic and green forms of groundnut rosette disease (Murant and Kumar, 1990). In
chlorotic rosette, the leaves show a bright yellow chlorosis (the limb of the leaves is
chlorotic with green spots and the veins are green and conspicuous) which may affect
the whole leaf or only parts of the leaf. The symptoms may appear over almost the entire
plant, or only in parts of the plant. In addition, the leaves are twisted and distorted. In
green rosette the leaves are darker green than normal or show light green or dark green
mosaic, and are much reduced in size. In mosaic rosette, young leaflets show
conspicuous mosaic symptoms. In both forms of rosette, plants are stunted and give
limited or no yield.
1.5 Resistance to groundnut rosette disease
Many studies have evaluated groundnut germplasm for resistance to groundnut rosette
disease since its description in 1907. The existence of significant resistance within A.
hypogaea germplasm was first reported in 1952 from Burkina Faso when an epidemic of
groundnut rosette disease destroyed a large collection of germplasm (Nigam and Bock,
1990; Subrahmanyam et al., 1998; Olorunju et al., 2001). Some germplasm accessions
from Burkina Faso survived the epidemic and were resistant to the disease. Later it was
determined that the resistance is controlled by two independent recessive genes
(Berchoux de, 1960; Bock et al., 1990; Nigam and Bock, 1990). However, from a cross
between RMP-12 and M1204.78I, it was detected that resistance is controlled by one
dominant gene (Olorunju, 1990).
Three mechanisms of resistance to rosette disease were suggested by Olorunju (1990)
namely: resistance to initial infection, restriction of virus movement, and restricted
production of sat RNA. In the last two decades, existing resistant germplasm and

19
breeding lines were susceptible to groundnut rosette virus assistor, and the resistance in
these lines was to groundnut rosette virus and indirectly against its satellite RNA
Olorunju et al. (1991) and (Subrahmanyam et al., 1998). Such genotypes are not
immune, do not develop symptoms and can be overcome under high disease pressure
or adverse environmental conditions (Bock et al., 1990).
1.6 Breeding for resistance to groundnut rosette disease
The discovery of sources of resistance of groundnut rosette disease in 1952 was a major
step forward for groundnut improvement (Olorunju et al., 1992). These sources formed
the basis for the rosette resistance breeding programmes throughout Africa
(Subrahmanyam et al., 1998; Olorunju et al., 2001) leading to the development of
several groundnut rosette disease resistant cultivars.
Subsequent studies in other parts of the world have been able to identify additional
sources of resistance to groundnut rosette (Olorunju et al., 1992; Subrahmanyam et al.,
1998). These attempts resulted in the development of long-duration cultivars such as
RMP-12, RMP-40 and RG-1 (140-150 days) and early-maturing cultivars (90 days)
Spanish such as KH-149A and KH-241C (Bockelée-Morvan, 1983). Resistance among
these cultivars were effective against both chlorotic and green rosette (Berchoux de,
1960).
ICRISAT launched a program in Malawi in the early 1980s and in West Africa in the late
1980s with the objective of developing cultivars which are suitable for small-scale
farmers in semi-arid tropics of Africa by combining groundnut rosette resistance, early
maturity and high-yielding (Olorunju et al., 2001). These two programs have produced a
wide range of early-, medium- and late-maturing cultivars suitable for various cropping
systems in semi-arid tropics of Africa (Ntare et al., 2008).
1.7 Methods for detecting groundnut rosette virus
Diagnostic techniques for viruses in general fall into two broad categories that were
comprehensively described by Naidu and Hughes (2008). They include: biological
properties related to the interaction of the virus with its host and/or vector (e.g.,

20
symptomatology and transmission tests) and intrinsic properties of the virus itself (coat
protein and nucleic acid).
Groundnut rosette disease has for a long time been identified in groundnut cultivars
based on visual symptoms in the field. Recent advances in diagnosis have been
achieved through the development of improved diagnostic methods including triple
antibody sandwich enzyme-linked immunosorbent assay (TAS-ELISA), dot blot
hybridization assay (DBH) and reverse transcription-polymerase chain reaction (RT-
PCR) (Naidu et al., 1998; Naidu et al., 1999). The new techniques enable the detection
of the complex of the three agents involved in the groundnut rosette disease namely
GRV, GRAV and sat RNA (Naidu et al., 1999).
The field screening technique that is based on virus symptoms on the host plants is the
most commonly used method for screening groundnut genotypes for resistance to
groundnut rosette disease. The technique involves planting one infector row of the highly
susceptible cultivar after every two adjacent rows of test lines at the onset of rains such
that every test rows is adjacent to one infector row (Bock and Nigam, 1988). A large
number of seedlings of a susceptible groundnut cultivar is raised in the greenhouse and
inoculated with GRV, using a greenhouse viruliferous culture of Aphis craccivora which
has been maintained on susceptible groundnut cultivar (Bock et al., 1990; Olorunju et
al., 1991; Olorunju et al., 2001). About one week after emergency of the seedlings in the
field, rosette-disease plants reared in the greenhouse, heavily infested with A. craccivora
are transplanted at 1.5 to 2.0 m intervals into infector rows (Bock et al., 1990; Nigam and
Bock, 1990; Olorunju et al., 2001). The aphids migrate from the transplanted plants onto
to infector rows and later onto the test material. Single plants from each genotype are
monitored for presence or absence of virus symptoms at regular interval. Disease
incidence (DI) is determined by calculating the percentage of plants with rosette
symptoms for each genotype.
1.8 Groundnut rosette management
Several methods for groundnut rosette disease management have been suggested
which include insecticide application, cultural practices and breeding for both vector and
virus resistance (Naidu et al., 1998; Naidu et al., 1999). Insecticide application reduces
the vector population in the field thereby reducing the chances of disease spread.

21
Insecticide application is not the best approach for the farmers of sub-Saharan Africa
region due to the high costs of the chemicals, while improper use of these chemicals
may result in development of insecticide-resistant biotypes (Naidu et al., 1999) as well
as death of natural enemies.
Cultural practices have been found to be effective in reducing the incidence of groundnut
rosette disease (Ntare et al., 2007). Commonly used cultural practices include early
planting and high plant density of the groundnut crop. In case of early planting, the crop
escapes the period of high pest population that occurs late in the season. In case of
plant density, aphids have been reported to prefer widely spaced plants over closely
spaced ones. However, farmers do not follow these recommendations for several
reasons including crop priority, lack of adequate quantities of seed and uncertainty of
rainfall.
In sub-Saharan Africa, the use of host plant resistance is the best way of controlling
diseases (Russell, 1978) because it is the most economically-effective and
environmentally friendly. The use of resistant cultivars to groundnut rosette disease
could allow groundnut growers to save money which would otherwise be used for
purchase and application of insecticide. Likewise, the reduction in use of insecticide
could avoid pollution of environment as well as allow the increase of natural enemies of
virus vectors.
1.9 Mating design
Mating designs are used to generate genetic pedigrees, germplasm that can be used in
breeding programs and genetic information such as pedigrees and gene effects
(Dabholkar, 1992). The choice of mating designs depends on the objectives and the
overall breeding strategy of the particular breeding program. The most common
objectives of mating designs are: a) to provide information for evaluating parents; b) to
estimate genetic parameters; c) to produce a base population for advanced generation
selection; and d) to estimate realized gain directly (McKinley, 1983). The most common
mating designs are the biparental, diallel, and the North Carolina designs (Comstock,
1952). Genetic components of variance estimated from the mating designs are
translated to covariances among related individuals and portioned into additive,

22
dominance, and epistatic genetic components (Becker, 1984; Christie and Shattuck,
1992).
1.10 The diallel cross
A diallel cross involves n parents producing n2 possible single crosses and selfs
(Griffing, 1956). The diallel analyses differ depending on whether the selfed parents
and/or the reciprocal F1’s have been included and each of them necessitates a different
form of analysis (Griffing, 1956; Becker, 1984; Dabholkar, 1992). Half diallel is when the
reciprocal crosses have been excluded, while a modified diallel is one in which the
parents have been excluded (Griffing, 1956).
The practical choice of using reciprocals depends on the convenience, the availability of
resources and the genetics of the material under study. Reciprocals are excluded in
case of limitations of time, space, labour to manage the large crosses, and for crops in
which maternal effects are known to be smaller or non-existent (Christie and Shattuck,
1992). Including reciprocals has been a problem since synchronised flowering is often a
major problem (Stuber, 1980).
Two genetic models; model 1 (random effects i.e. cultivar and block are random), and
model 2 (fixed effects i.e. cultivar and block are constant) are commonly used by plant
breeders and quantitative geneticists (Griffing, 1956; Dabholkar, 1992). The analytical
and interpretation aspects of breeding experiments follow these models. In model 1 the
genotypic effects are considered random variables and in the second model they are
fixed.
There are three levels at which diallel analyses can be conducted: the combining ability
analysis; genetic variance component analysis; and complete genetic analysis. The
combining ability level of analysis is generally preferred as it is purely statistical in nature
and therefore needs none of the restrictive genetical assumptions (Christie and
Shattuck, 1992). Estimation of the genetic components of GCA and SCA also requires
the assumptions of no epistasis and the independent distribution of genes in the parents
to be made (Griffing, 1956). For the level genetic variance component analysis, the
population should be in Hardy-Weinberg equilibrium with respect to individual loci, and
linkage equilibrium with respect to all pairs of loci. A complete genetic analysis can be

23
made if further assumptions concerning the parents are made. If homozygosity of the
parents is assumed, and the assumption of no-multiple allelism is also made, then the
additive genetic variance can be subdivided into further components (Mather and Jinks,
1971). Such subdivision provides information on the gene action and gene frequencies.
1.11 Combining ability analysis
In the diallel mating design, the estimation of genetic variances is made in terms of the
combining ability (Griffing, 1956). In the combining ability analyses, the cultivar effects
are considered in terms of GCA and SCA effects. A relatively larger GCA/SCA variance
ratio demonstrates the importance of additive genetic effects and the lower ratio
indicates predominance of dominance and/or epistatic gene effects (Christie and
Shattuck, 1992). Furthermore, the GCA effects are calculated only when mean squares
for GCA is found to be significant (Dabholkar, 1992). Parent with larger GCA, or more
significant is referred to as a best combiner. Thus, these significant parental lines are
chosen for hybridisation. The same is done for SCA and this is based on whether the
crosses have one parent in common or not. In this case breeders can choose best
crosses.
1.12 Combining ability studies in groundnut
Genetic studies conducted in groundnut were reviewed by Singh and Oswalt (1991).
Hariprasanna et al. (2008) used full diallel to examine the combining ability and to
understand the type of gene action governing shelling percentage, 100-pod weight, 100-
seed weight, number and proportion of mature seeds in groundnut. They found that the
expression of majority of the traits was controlled predominantly by additive gene action,
and non-additive gene action was important on seed size. These results were
complemented by Anderson et al. (1992) on F1 and F2 populations for pod and seed
sizes. Mothilal and Ezhil (2010) found the magnitude of specific combining ability
variances much greater than those of general combining ability for plant height, number
of mature pods plant-1, pod yield, seeds yield plant-1 and shelling percentage.
Layrisse et al. (1980) studied the combining ability from F2 generation of ten groundnut
lines from South American centres of diversity for yield, pod, seed protein and oil

24
content. They found that both GCA and SCA were significant for all traits, except for the
SCA estimates for protein, and that GCA component was larger than the SCA for all
traits. Additive and non-additive gene action was reported by Sangha and Labana (1982)
for number of pods and yield.
Using half diallel, Jayalakshmi et al. (2002) studied from F1 generation the gene action
of morphological and physiological attributes (specific leaf area, secondary nodes plant-1,
ill and immature pods plant-1, pod yield, root dry mass shoot bio-mass, seed yield)
influencing groundnut yield. They found that both additive and non-additive gene actions
were important in the expression of the most of traits.
A diallel analysis of six groundnut parents was conducted by Redona and Lantican
(1985) to examine the general and specific combining abilities for seed and pod yield
plant-1, weight seed-1, weight pod-1, number of pods and seeds plant-1, and height of
main axis. They found that both GCA and SCA mean squares were significant, and
estimates of GCA effects were greater than the SCA estimates for all traits, this
indicating that additive gene action was important in the expression of all traits.
General and specific combining abilities for resistance to peanut bud necrosis tospovirus
(PBNV) were examined to understand the gene action controlling the disease from F1
and F2 populations resulting from six parent diallel crosses (Pensuk et al., 2002). It was
observed that both GCA and SCA effects were significant, but the magnitude of GCA
was greater than of that of SCA, suggesting that additive gene effect was mainly
responsible for the expression of the disease. A diallel analysis of four groundnut
parents was conducted by Varnam et al. (1989) to examine the genetics of F1
populations for rust resistance. From this experiment, it was detected that resistance
was governed by both additive and non-additive gene effects but additive being
predominant.
Ouedraogo et al. (1995) studied the combining ability for components of resistance to
early leaf spot (latent period, lesion diameter and amount of sporulation) and yield
components (pod weight plant-1, seed weight plant-1 and 20 seed weight) of groundnut
lines. They found that both GCA and SCA were significant for all traits, but the GCA and
SCA ratios indicated that additive gene action was effective on controlling lesion
diameter and amount of sporulation. Similar results were reported by Dwivedi et al.

25
(2002) when studying the combining ability of components of resistance (latent period,
lesion leaf-1, lesion diameter, sporulation index, percentage of leaf area damaged,
percentage of leaf defoliation and disease score).
Adamu et al. (2008) studied the general and the specific combining abilities for
groundnut rosette disease resistance and other traits in groundnuts (early maturity,
haulm yield, pod yield, shelling percentage, days to 50% flowering) on F2 and F3
populations. They found that GCA and SCA estimates were significant for all traits,
except SCA estimates for haulm yield and shelling percentage in F2 populations, while
SCA estimates in F3 populations were significant for groundnut rosette resistance. They
added that the magnitude of GCA estimates was greater than SCA for all traits in both
generations, and they suggested that additive gene action was more important than the
non-additive effects on the expression of the disease.
References
Adamu, A.K., P.E. Olorunju, S.G. Ado and S.O. Alabi. 2008. General and specific
combining ability estimates for rosette resistance, early maturity and other traits
in groundnuts (Arachis hypogaea L.). International Journal of Pure and Applied
Sciences. 2:33-41.
Ahmed, E.M. and C.T. Young. 1982. Composition, Quality, and Flavor of Peanuts. In:
Pattee, H.E.and C.T. Young (Eds.). Peanut Science and Technology. American
Peanut Research and Education Society. Yoakum, Texas. pp. 655-688.
Anderson, W.F., M.S. Fitzner, T.G. Isleib, J.C. Wynne and T.D. Phillips. 1992. Combinig
ability for large pod and seed traits in peanut. Peanut Science. 20:49-52.
Arunyanarka, A., S. Jogloya, S. Wongkaewa, C. Akkasaenga, N. Vorasoota, T.
Kesmalaa and A. Patanothaia. 2010. Heritability of aflatoxin resistance traits and
correlation with drought tolerance traits in peanut. Field Crops Research.
117:258-264.
Beattie, W.R. and J.H. Beattie. 1943. Peanut Growing. Farmers' Bulletin, U.S.
Department of Agriculture. pp. 31.

26
Becker, W.A. 1984. Manual of Quantitative Genetics. 4th ed. Academic Enterprises.
Washington State University, Pullman, Washington.
Berchoux de, C.D. 1960. La rosette de l’arachide en Haute-Volta. Comportement de
lignées résistantes. Oléagineux. 15:229-233.
Bock, K.R., A.F. Murant and R. Rajeshwari. 1990. The nature of the resistance in
groundnut to rosette disease. Annals of Applied Biology. 117:379-384.
Bock, K.R. and S.N. Nigam. 1988. Methodology of Groundnut Rosette Screening and
Vector-Ecology Studies in Malawi. In: ICRISAT (Ed.). Coordinated research on
groundnut rosette virus disease. International Crops Institute for the Semi-Arid
Tropics (ICRISAT). Patancheru, Andhra Pradesh 502 324, India. pp. 6-10.
Bockelée-Morvan, A. 1983. Le différent variétiés d’arachide. Répartition géographique et
climatique, disponibilité. Oléagineux. 38:73-116.
Boote, K.J., J.R. Stansell, A.M. Schubert and J.F. Stone. 1982. Irrigation, Water Use,
and Water Relation. In: Pattee, H.E.and C.T. Young (Eds.). Peanut Science and
Technology. American Peanut Research and Education Society, Inc. . Yoakum,
Texas. pp. 164-205.
Christie, B.R. and V.I. Shattuck. 1992. The Diallel cross: design, analysis, and uUse for
plant breeders. Plant Breeding Reviews. 9:9-36.
Cole, R.J., T.J. Sanders, J.W. Dorner and P.D. Blankenship. 1989. Environmental
Conditions Required to Induce Pre-harvest Concentration in Groundnut.
Summary of six years research. International Workshop on Aflatoxin
Concentration in Groundnut, International Crops Research Institute for the Semi-
Arid Tropics, Patancheru, India. pp. 279-287.
Comstock, R.E., and R. H. Robinson. 1952. Estimation of average dominance of genes.
In: Gowen, J.W. (Ed.). Heterosis. Iowa State College Press. Ames, IA. pp. 494-
516.

27
Coolbear, P. 1994. Reproductive Biology and Development. In: Smartt, J. (Ed.). The
Groundnut Crop: A Scientific Basis for Improvement. Chapman & Hall. London,
UK. pp. 138-172.
Dabholkar, R.R. 1992. Elements of Biometrical Genetics Ashok Kumar Mittal Concept
Publishing Company. New Delhi, India.
Dwivedi, S.L., S. Pande, J.N. Rao and S.N. Nigam. 2002. Components of resistance to
late leaf spot and rust among interspecific derivatives and their significance in a
foliar disease resistance breeding in groundnut (Arachis hypogaea L.).
Euphytica. 125:81-88.
Gregory, W.C., B.W. Smith and J.A. Yarbrough. 1951. Morphology Genetics and
Breeding. In: Arant, F.S. (Ed.). The Peanut: Unpredictable Legume - A
Symposium. The National Fertilizer Association. Washington.
Griffing, B. 1956. Concept of general and specific combining ability in relation to diallel
crossing. Australian Journal of Biology. 9:463-493.
Hammons, R.O. and D.B. Leuck. 1966. Natural cross-pollination of the peanut, Arachis
hypogaea L. in the presence of bees and thrips. Agronomy Journal. 58:396.
Hariprasanna, K., C. Lal, T. Radhakrishnan, H.K. Gor and B.M. Chikani. 2008. Analysis
of diallel cross for some physical-quality traits in peanut (Arachis hypogaea L.).
Euphytica 160:49-57.
Holbrook, C.C. and H.T. Stalker. 2003. Peanut Breeding and Genetic Resources. In:
Janick, J. (Ed.). Plant Breeding Reviews. John Wiley and Sons, Inc. New York.
pp. 297-356.
Husted, L. 1933. Cytological studies of the peanut Arachis. I. Chromosome number and
morphology. Cytologia. 5:109-117.
Husted, L. 1936. Cytological studies of the peanut Arachis. II. Chromosome number,
morphology and behavior and their application to the origin of cultivated forms.
Cytologia. 7:396-423.

28
Jayalakshmi, V., C.R. Reddy, P.V. Reddy and G.L. Reddy. 2002. Combining ability
analyis of morphological and physiological attributes in groundnut (Arachis
hypogaea L.). Indian Journal of Agricultural Resources. 36:177 - 181.
Kokalis-Burelle, N., D.M. Porter, R. Rodriguez-Kabana, D.H. Smith and P.
Subrahmanyam. 1997. In: Kokalis-Burelle, N.et al., (Eds.). Compendium of
Peanut Diseases. The American Phytopathology Society. Minnesota, USA.
Krapovickas, A. and W.C. Gregory. 1994. Taxonomia del genero Arachis
(Leguminosae). Bonplandia. 8.
Lavia, G.I. 1998. Karyotypes of Arachis palustris and A. praecox (Section Arachis), two
species with basic chromosome number x=9. Cytologia. 63:177-181.
Layrisse, A.J., J.C. Wynne and T.G. Isleib. 1980. Combining ability for yield, protein, and
oil of peanut lines from South American centres of diversity. Euphytica. 29:561-
570.
Leppik, E.E. 1970. Assumed gene centers of peanuts and soybeans. Plant Introduction
Investigation Paper, United States Department of Agriculture, USA.
Maiti, R.K. and P. Wesche-Ebeling. 2002. Vegetative, Reproductive Growth, and
Productivity. In: Maiti, R.K.and P. Wesche-Ebeling (Eds.). The Peanut (Arachis
hypogaea L.) Crop. Science Publishers, Inc. New Hampshire, USA. pp. 73-106.
Malithano, A.D. 1980. Groundnut Production, Utilization, Research Problems and
Further Research Needs in Mozambique. International Workshop on
Groundnuts, International Crops Research Institute for the Semi-Arid Tropics,
Lilongwe, Malawi. pp. 257-261.
Malithano, A.D., K.V. Ramanaiah, A.M. Monjana, B.S. Chilengue and R.N. Uaiene.
1984. Factors Affecting Groundnut Production in Mozambique. In: McDonald, D.
(Ed.). Regional Groundnut Workshop for Southern Africa, International Crops
Research Institute for the Semi-Arid Tropics, Lilongwe, Malawi. pp. 61-67.
Mather, K. and J.L. Jinks. 1971. Biometrical Genetics: The Study of Continuous
Variation. New York, Cornell University Press.

29
McKinley, C.R. 1983. Objectives of Progeny Tests. S-23 Workshop on Progeny Testing
of Forest Trees, 1982, Southern Cooperative Series Bulletin, Auburn, Alabama.
Moss, P.J. and V.R. Rao. 1995. The Peanut Production, Development to Plant Maturity.
In: Pattee, H.E.and C.T. Young (Eds.). Peanut Science and Technology.
American Peanut Research and Education Society, Inc. Yoakum, Texas.
Mothilal, A. and A. Ezhil. 2010. Combining ability analysis for yield and its components in
groundnut (Arachis hypogaea L.). Electronic Journal of Plant Breeding. 1:162-
166.
Murant, A.F. and T.I.I.K. Kumar. 1990. Different variants of the satellite of groundnut
rosette virus are responsible for the chlorotic and green forms of groundnut
rosette disease. Annals of Applied Biology. 117:85-92.
Murant, A.F., R. Rajeshwari, D.J. Robinson and J.H. Raschke. 1988. A satellite RNA of
groundnut rosette virus that is largely responsible for symptoms of groundnut
rosette disease. Journal of General Virology. 69:1479-1486.
Murty, U.R., N.G.P. Rao, P.B. Kirti and M. Bharati. 1980. Fertilization in groundnut,
Arachis hypogaea L. Oléagineux. 36:73-76.
Naidu, R.A., H. Bottenberg, P. Subrahmanyam, F.M. Kimmins, D.J. Robinson and J.M.
Thresh. 1998. Epidemiology of groundnut rosette virus disease: current status
and future research needs. Annals of Applied Biology. 132:525-548.
Naidu, R.A. and J.d.A. Hughes. 2008. Methods for the detection of plant virus diseases.
Plant Virology in sub-Saharan Africa:233-260.
Naidu, R.A., F.M. Kimmins, C.M. Deom, P. Subrahmanyam, A.J. Chiyembekeza and
P.J.A.v.d. Merwe. 1999. Groundnut rosette: a virus disease affecting groundnut
production in sub-Saharan Africa. Plant Disease. 83:700-709.
Nigam, S.N. and K.R. Bock. 1990. Inheritance of resistance to groundnut rosette virus in
groundnut (Arachis hypogaea L.). Annals of Applied Biology. 117:553-560.
Ntare, B.R., J. Ndjeunga, F. Waliyar, O. Kodio, C.A. Echekwu, K. I., A. Da Sylva, A.T.
Diallo, A. Amadou, H.Y. Bissala and K.p. Sako. 2007. Farmer Participatory

30
Evaluation and Dissemination of Improved Groundnut Cultivars in West Africa.
International Crops Research Institute for the Semi-Arid Tropics., Bamako, Mali.
Ntare, B.R., P. Subrahmanyam and F. Waliyar. 2008. Progress in combating groundnut
rosette disease in sub-Saharan Africa. Plant Virology in sub-Saharan Africa:285-
293.
Olorunju, P.E. 1990. Groundnut Rosette: Disease Reaction and Inheritance of
Resistance of Peanut Genotypes to Groundnut Rosette Virus and Groundnut
Rosette Assistor Virus. Plant Pathology, University of Georgia, Athens, GA. pp.
118.
Olorunju, P.E., C.W. Kuhn, J.W. Demski, S.M. Misari and A. Ansa. 1991. Disease
reactions and yield performance of peanut genotypes under groundnut rosette
and rosette free field environments. Plant Disease. 75:1269-1273.
Olorunju, P.E., C.W. Kuhn, J.W. Demski, S.M. Misari and A. Ansa. 1992. Inheritance of
resistance in peanut to mixed infections of groundnut rosette virus (GRV) and
groundnut rosette assistor virus and a single infection of GRV. Plant Disease.
76:95-100.
Olorunju, P.E. and B.R. Ntare. 2008. Combating viruses and virus diseases of groundnut
through the use of resistant varieties: a case study of Nigeria. Plant Virology in
sub-Saharan Africa:189-202.
Olorunju, P.E., B.R. Ntare, S. Pande and S.V. Reddy. 2001. Additional sources of
resistance to groundnut rosette disease in groundnut germplasm and breeding
lines. Annals of Applied Biology. 139:259-268.
Ouedraogo, M., O.D. Smith, C.E. Simpson and B. Besler. 1995. Combining ability for
components of rsistance to early leaf spot and yield of inter-and intraspecific
peanut lines. Oleagineux, Corps Gras, Lipides. 2:149-156.
Pattee, H.E. and H.T. Stalker. 1995. Advances in Peanut Science. American Peanut
Research and Education Society, Inc., Stillwater, OK.

31
Pensuk, V., S. Wongkaew, S. Jogloy and A. patanothai. 2002. Combining ability for
resistance in peanuts (Arachis hypogaea) to peanut bud necrosis tospovirus
(PBNV). Annals of Applied Biology. 141:143-146.
Ramanaiah, K.V., M.J. Freire, B.S. Chilengue and A.V. Munguambe. 1988. Research on
Groundnuts in Mozambique. In: ICRISAT (Ed.). Third Regional Groundnut
Workshop for Southern Africa, International Crops Research Institute for the
Semi-Arid Tropics, Lilongwe , Malawi. pp. 157-161.
Rao, V.R. and U.R. Murty. 1994. Botany - Morphology and Anatomy. In: Smartt, J. (Ed.).
The Groundnut Crop: A Scientific Basis for Improvement. Chapman & Hall.
London, UK. pp. 42-95.
Redona, E.D. and R.M. Lantican. 1985. Genetic analysis of some quantitative traits in
peanut, Arachis hypogaea L. I. General and specific combining ability estimates.
Philippines Journal Crop Science. 10:81-86.
Rucker, K.S., C.K. Kvien, C.C. Holbrook and J.E. Hook. 1995. Identification of peanut
genotypes with improved drought advoidance traits. Peanut Science. 22:14-18.
Russell, G.E. 1978. Plant Breeding for Pest Disease Resistance England Butterworth &
Co (Publishers) Ltd. London.
Sanders, T.H., R.J. Cole, P.D. Blankenship and J.W. Dorner. 1993. Aflatoxin
concentration of peanuts from plants drought stressed in pod or root zones.
Peanut Science. 20:5-8.
Sangha, A.S. and K.S. Labana. 1982. Diallel analysis in groundnut (Arachis hypogaea
L.). Theoretical and Applied Genetics. 64:59-63.
Singh, A.K. and C.E. Simpson. 1994. Biosystematics and Genetics Resources. In:
Smartt, J. (Ed.). The Groundnut Crop: A scientific basis for improvement.
Chapman & Hall. London. pp. 97-137.
Singh, F. and D.L. Oswalt. 1991. Genetics and Breeding of groundnut. In: Singh, F.
(Ed.). Skill development series, International Crops Research Institute for the
Semi-Arid Tropics, Patancheru, India.

32
Smith, B.W. 1950. Arachis hypogaea. Aerial flower and subterranean fruit. American
Journal of Botany. 37:802-815.
Stalker, H.T. 1997. Peanut (Arachis hypogaea L.). Field Crops Research. 53:205-217.
Stalker, H.T. and J.P. Moss. 1987. Speciation, Cytogenetics and Utilization of Arachis
species. Journal series of The North Carolina Agricultural Research Service:1-
40.
Stuber, C.W. 1980. Mating Designs, Field Nursery Layouts, and Breeding Records. In:
Fehr, W.R.and H. Henry (Eds.). Hybridisation of Crop Plants. American Society
of Agronomy-Crop Science Society of America. Madison, WI. pp. 83-104.
Subrahmanyam, P., G.L. Hildebrand, R.A. Naidu, L.J. Reddy and A.K. Singh. 1998.
Sources of resistance to groundnut rosette disease in global groundnut
germplasm. Annals of Applied Biology. 132:473-485.
Subrahmanyam, P., S. Wongkaew, D.V.R. Reddy, J.W. Demski, D. McDonald, S.B.
Sharma and D.H. Smith. 1992. Field diagnosis of groundnut diseases.,
Information Bulletin, ICRISAT, Patancheru, India. pp. 84.
Subrahmanyam, R., P.S.V. Wyk, C.T. Kisyombe, D.L. Cole, G.L. Hildebrand, A.J.
Chiyembekeza and P.J.A.V.D. Merwe. 1997. Diseases of groundnut in the
Southern African Development Community (SADC) region and their
management. International Journal of Pest Management. 43:261-273.
Upadhyaya, H.D., L.J. Reddy, C.L.L. Gowda and S. Singh. 2006. Identification of diverse
groundnut germplasm: Sources of early maturity in a core collection. Field Crops
Research. 97:261-271.
Varnam, P.V., T.S. Raveendran and T. Ganapathy. 1989. Genome and plasm effects on
rust in groundnut (Arachis hypogaea L.). Philippines. Journal Crop Science.
14:11-13.

33
II. GROUNDNUT (ARACHIS HYPOGAEA L.) PRODUCTION CONSTRAINTS
FARMERS PREFERRED TRAITS AND GROUNDNUT ROSETTE DISEASE
INCIDENCE IN THE NORTHERN REGION OF MOZAMBIQUE
Abstract
Groundnut is an important crop in Mozambique. However, yields have remained low,
regardless of the availability of improved cultivars. The objectives of this study were to
obtain farmers’ groundnut (Arachis hypogaea L.) cultivar selection criteria and
production constraints which could be important for breeding programmes. The study
was conducted Namuno (13° 36' 39" S, 38° 48' 15" E and 200-500 m.a.s.l) in Cabo
Delgado and Erati (13° 43' 41" S, 39° 50' 41" E and 200-500 m.a.s.l.) in Nampula
province. Open-ended interviews with a group of farmers and guided by a questionnaire
were undertaken to obtain detailed information on groundnut production in the region.
The main issues addressed in the study were major crops grown, farmers’ groundnut
cultivar selection criteria, cropping systems, groundnut production constraints, and
farmers’ awareness of groundnut rosette disease. The study established that the main
crops grown in the region were maize (Zea mays L.), groundnut, cassava (Manihot
esculenta), cowpea (Vigna unguiculata) and sorghum (Sorghun bicolour). Groundnut
was the third most important crop after cassava and maize. The major constraints for
groundnut production were diseases, insect pests and a lack of suitable improved
cultivars. About 27 % of women and 41 % of men reported that diseases, specifically
groundnut rosette disease, were the most important constraint affecting groundnut
production. In Namuno, 100 % of farmers grew local landraces and recycled their own
seed every growing season, but in Erati about 56 % of farmers had replaced landraces
with improved cultivars. In some cases, selection criterion for groundnuts was dependent
on sex and villages. However, farmers in this region preferred erect or runner, red
seeded testa groundnut cultivars that are medium to large in size, early to medium
maturing, medium to high yielding, high oil content, tolerant to drought, diseases and
insect pests. Over 60 % of fields evaluated in the region were infested by groundnut
rosette disease and over of 50 % of these fields had between 10 and 30 % of disease
incidence. Therefore, there is need to develop groundnut cultivars that are resistant to
biotic and abiotic stresses aforementioned.
Keywords: Mozambique, groundnut (Arachis hypogaea), rosette disease, participatory
rural appraisal
34
2.1 Introduction
Groundnut (Arachis hypogaea L.) is an important crop in northern Mozambique where it
is grown more as a cash crop than a food crop. The demand for seed is high especially
at planting time. In the 1990s, the National Research System of Mozambique in
collaboration with ICRISAT-Malawi released high-yielding and adapted cultivars to the
region. However, recent surveys in farmers’ fields and local markets have indicated that
the level of adoption of the new released cultivars was very low. Some of the reasons
for the low adoption were that farmers had little exposure to improved groundnut
cultivars and/or cultivars did not satisfy farmers’ preferences and needs. Similar reasons
for low adoption of new groundnut cultivars were reported by Ntare et al. (2007) in West
Africa. The adoption rates of new technology have a tendency of being low particularly in
areas where farmers are not involved in development of the technology (Tripp, 1982;
Maurya et al., 1988), which might be the case of northern Mozambique.
Governmental and non-governmental institutions have recognised the need to move
away from the top down flow of extension information to more participatory approaches
of identification of needs and technology development. The participatory approaches
involve supporting communities in their bid to set and accomplish their own
developmental goals (Hagmann et al., 1999).
The involvement of the farmers in the process of developing new and resistant cultivars
is very important for the adoption of these new cultivars among farmers (Adu-Dapaah et
al., 2004; Dorward et al., 2007; Gyawali et al., 2007; Morris and Bellon, 2004). This has
been in response to the widespread perception that conventional breeding approaches
have not been as successful as they might in high stress and diverse environments
(Atlin and Witcombe, 2002). During the process, farmers assess the cultivars under their
own conditions, preferences and management practices (Sperling et al., 1993;
Witcombe et al., 1996; Sperling et al., 2001; Witcombe et al., 2005; Witcombe et al.,
2006).
The use of participatory tools and techniques, such as key informant interviews, transect
walks, matrix scoring and ranking can promote exchange of ideas between researchers
and villagers leading to improvement of the efficiency and impact of the research
(Chambers, 1992). Yield increases attributable to the adoption of new cultivars resulting

35
from participatory plant breeding programmes were reported in South and Southeast
Asia (Witcombe et al., 2002), Colombia, India, Nepal, Namibia, Rwanda (Witcombe et
al., 1996), Andean region (Danial et al., 2007), and West Africa (Ntare et al., 2007) in
grain legumes, potato (Solanum tubercosum), rice (Oryza sativa), wheat (Triticum
aestirum L.), barley (Hordem vulgare), pearl millet (Pennisetum typhoides) and maize
(Zea mays).
It was, therefore, a good opportunity to test the participatory plant breeding approach in
Mozambique by conducting, first, a participatory rural appraisal (PRA) to obtain baseline
information that could be used by the groundnut breeding programme in Nampula. The
objectives of the PRA were to: 1) identify major constraints limiting groundnut
production; 2) identify groundnut traits that are preferred by farmers. In addition, a
survey was conducted to determine the prevalence of groundnut rosette disease in the
region.
2.2 Materials and methods
2.2.1 Study area
The PRA was conducted in 2009 in Namuno (13° 36' 39" S, 38° 48' 15" E and
200-500 m.a.s.l) in Cabo Delgado province and Erati (13° 43' 41" S, 39° 50' 41" E and
200-500 m.a.s.l.) in Nampula province (Figure 1), northern Mozambique. In Namuno the
annual precipitation is between 800 and 1200 mm from October to April, with heavy
rains occurring in January and February. The district experiences an annual average
temperature between 20 and 25o C (MÉTIER, 2005b). Erati receives annual precipitation
between 800 and 1200 mm from October to April, with heavy rains occurring in January
and February. Annual average temperature in the district is between 20 and 25o C. Soils
in the two districts are intermediate to heavy textured and are characterized as being
sandy loam, deep and well-drained (MÉTIER, 2005a). The two districts were selected
since they are located in the northern groundnut belt of Mozambique. Three villages
(Milipone, Napuri and Ncoela) in Namuno district and two villages (Namicore and
Muloco) in Erati district were selected for the PRA study.

36
In addition, a groundnut rosette disease survey was conducted in the region between
March and early April in 2010/2011 growing season. A total of 126 fields were visited in
13 districts; four in Nampula province (Meconta, Monapo, Nacaroa and Erati), four in
Cabo Delgado (Chiure, Montepuez, Balama, and Namuno), two in Zambezia (Gile and
Maganja da Costa) and three in Niassa (Nipepe, Maua and Metarica) (Figure 2.1).
2.2.2 Data collection
The PRA tools used to gather information included interviews using a semi-structured
questionnaire (Appendix 1), transect walk, problem listing, and focused group
discussion. Data gathered from transect walk, problem listing and focused group
discussion were used to support and validate the information obtained from the semi-
structured questionnaire. Other supporting information was obtained through reports and
other sources such as Ministry of Agriculture and National Institute of Statistics. Key
informants, community leaders and local extension officers were contacted in the
process to validate the data.

37
Figure 2.1: Map of northern Mozambique showing participatory rural appraisal and disease
survey sites
Selection of farmers was done at community level with the assistance of agricultural
extension officers and local leaders. The participants in the study included local leaders,
innovative farmers, women and men, poor farmers with limited resources and
community based organization members.
The semi structured questionnaire (Appendix 1) was used to obtain relevant information
from the farmers about their villages and needs. In each village, twenty five farmers were
randomly selected and interviewed. The information collected in these interviews
included major food and cash crops grown; number of the household members and their
ages; farmers’ groundnut cultivar selection criteria (such as seed size, seed colour,
taste, plant characteristics, maturity, pest and disease tolerance); groundnut production
practices (planting methods, rotation, single or multi-cropping systems); groundnut
production constraints (abiotic, biotic and socio-economic); and farmers’ awareness of
groundnut rosette disease and disease management strategies.
Tanzania
Indian Ocean
Malawi
Zimbabwe
Erati
Namuno

38
A transect walk was done by walking through and making direct observations on 10 to
15 fields in each village. Information collected from these direct observations included
major food and cash crops grown, soil type, land use, cropping pattern, acreage
allocated to groundnut, incidence and prevalence of groundnut rosette disease.
A focused-group discussion was conducted with a group of community members in each
village. The group comprised of about 20 to 25 members and included key informants,
elders, women group representatives, community based organization representatives,
farmers, village leaders and religious leaders. These farmers were identified based on
their interest in the groundnut crop, knowledge of groundnut production, knowledge of
the village history and farmers’ influence in the village. In these discussions, farmers
provided information on their farming systems, crop production practices, groundnut
production constraints, and important traits used by the communities for groundnut
cultivar choices.
Groundnut rosette disease survey was conducted through direct visits to farmers’ fields.
Observations were recorded in groundnut fields located at 30-50km intervals. Visual
disease symptoms (presence or absence) were recorded for each field from a sample of
50 plants using diagonal approach. Disease incidence (DI) was determined by recording
the percentage of plants with rosette symptoms from each field (Waliyar et al., 2007),
and disease prevalence was determined by the relation between the number of fields
with disease symptoms over the total fields visited in each district.
2.2.3 Data analysis
Statistical analyses for both quantitative and qualitative data were performed in SPSS
(Release 19.0) computer package. Data were classified as nominal or ordinal when
entering into the SPSS spreadsheet. For exploring relationships, frequencies and
descriptive statistics were computed for data collected in each village. Charts were
constructed in Microsoft Office Excel 2007.

39
2.3 Results
2.3.1 Gender and age distribution
Percentage of women and men participating in the interviews is presented in Figure 2.2.
On average over 70 % of the participants were males and less than 30 % were females.
In Muloco and Napuri the gap between males and females participating in the study was
big since males were over 80 % and females were less than 20 %. In Namicori, the male
and female participants were almost equal (55 % male:45 % female).
Figure 2.2: Percentage of males and females participating in the PRA in the study area

40
About 40 % of the respondents ranged between 31 to 40 years of age. Over 50 years of
age ranged on average between 1.0 to 5 %, being 4.8 % for age interval of 51 to 60 and
1.6 % of the age over 70 (Table 2.1).
Table 2. 1: Percent distribution of respondents agewise in the study area
Age interval (years)
District
Total Namuno Erati
Milipone Ncoela Napuri
Namicori Muloco
<30 4.0 12.0 56.0 32.0 12.0 23.2
31-40 44.0 60.0 24.0 32.0 48.0 41.6
41-50 48.0 20.0 12.0 32.0 28.0 28.0
51-60 4.0 8.0 0.0 4.0 8.0 4.8
61-70 0.0 0.0 0.0 0.0 4.0 0.8
>70 0.0 0.0 8.0 0.0 0.0 1.6
Percent distribution of the number of persons per household in the study area is
presented in Figure 2.3. About 45 % of the total household in the two districts comprised
of more than 4 people and only about 5 % of the households comprised of 2 people.
Within villages, in Milipone and Ncoela, most of the households, over 33 %, comprised
of more than 4 persons while in Muloco about 40 % of the households consisted of 3
persons and other 40% of more than 4 persons.

41
Figure 2. 3: Percent distribution of number of persons per household in the study area
2.3.2 Area under cultivation and crops grown
About 53 % of farmers cultivated all their crops in more than 1.0 ha and only 13 % of
respondents cultivated less than 0.5 ha (Table 2.2). Within villages, in Ncoela, 60 % of
respondents cultivated their crops in areas between 0.5 and 1.0 ha, while in Napuri,
68 % of farmers cultivated areas over 1.0ha. In Namicori, over 80 % of the farmers
cultivated areas more than 1.0 ha.
Table 2. 2: Percent distribution of farm size in the two districts
District Village Area (ha)
less than 0.5 between 0.5 and 1.0 More than 1.0
Namuno Milipone 20.0 52.0 28.0 Ncoela 12.0 60.0 28.0 Napuri 16.0 16.0 68.0
Erati Namicori 0.0 16.0 84.0 Muloco 16.0 28.0 56.0
Total 12.8 34.4 52.8

42
According to the farmers, most of the crops are grown during the rainy season (October
to April) and a few crops are grown during the dry season, along river basins. The main
crops grown during the rainy season included cassava, groundnuts, sorghum, maize,
sesame (Sesamum indicum), cowpea, sweet-potatoes (Ipomea batatas), cotton,
(Gossypium hirsutum) green-gram (Vigna radiata), pigeon-pea (Cajanus Cajan), rice,
sugar-cane (Saccharum officinarum) and bambara-groundnuts (Vigna subterranea)
(Table 2.3). Groundnut was ranked third after cassava and maize, while sweet potato
was ranked last in importance. The few crops grown during the dry season (May to
September) included tomato (Lycopersicon esculentum), cabbage (Brassica oleracea)
and onion (Allium cepa).
Table 2. 3: Percent distribution of the respondents by major crops grown in five villages in the study
Crop Village
Mean Rank Milipone Ncoela Napuri Namicori Muloco
Cassava 22.2 17.5 19.7 23.7 29.8 22.6 1
Maize 22.5 17.8 18.2 19.4 17.2 19.0 2
Groundnut 18.5 17.8 16.9 16.3 16.3 17.2 3
Sorghum 4.9 5.8 4.9 5.2 4.6 5.1 5
Cowpea 4.3 6.2 5.8 4.5 5.2 5.2 4
Sesame 4.6 4 3.1 5.2 2.5 3.9 9
Cotton 4.9 6.8 3.7 3.1 3.4 4.4 7
Bambara nut 4.6 4.6 4.3 3.1 3.7 4.1 8
greengram 3.7 5.2 5.8 5.2 3.1 4.6 6
Sugar cane 4.0 3.1 4.0 3.0 2.6 3.3 13
Rice 1.8 3.7 4.9 3.7 3.1 3.4 12
Sweet potato 3.4 2.8 4.3 3.4 3.7 3.5 11
Pigeon pea 0.6 4.6 4.3 3.7 4.6 3.6 10
Others 0.0 0.1 0.1 0.5 0.2 0.2 14

43
2.3.3 Groundnut production
In this study, groundnut was grown by every household across the two districts. It was
ranked the third most important crop after cassava and maize (Table 2.3). In Namuno
district (Milipone, Ncoela and Napuri), 100 percent of the farmers (Figure 2.4) grew local
landraces which matured after 150 days with yields varying between 500-700 kg ha-1.
On the contrary, about 56 % in Namicori and 60 % in Muloco, villages in Erati district,
grew improved groundnut cultivar Nametil instead of landraces. Nametil matures around
90 days and its yield can reach up to 1200 kg ha-1.
Figure 2. 4: Percent distribution of respondents by type of groundnut cultivar grown in Namuno
and Erati districts

44
2.3.4 Preferred traits for groundnut cultivars
In this study, farmers selected groundnut cultivars for production on the basis of seed
colour, seed size, market price, yield potential, palatability, earliness, oil content, and
tolerance to pests and diseases (Table 2.4). In some of the cases, the selection criterion
used by women differed from that used by men within village and across villages. For
example, in Milipone, Namuno, about 42 % of women preferred cultivars with small pods
and small seeds, 25 % preferred medium pods and seeds and 33 % big pods and
seeds. On the other hand, about 11 % preferred small pods and seeds, 34 % medium
and 55 % big pods and seeds. About all respondents in the two districts preferred
cultivars with red seed. But slightly over 20 % of farmers in Erati preferred cultivars with
tan seed, and about 5 % of respondents in Ncoela and Napuri (Namuno) preferred
cultivars with any seed colour.
Preference for groundnut maturity was different across villages. In Namuno district,
16 %, 35 % and 65 % of the men in Milipone, Ncoela and Napuri villages, respectively
preferred medium maturing cultivars. In Erati, about 14 % of men in Namicori and 29 %
in Muloco preferred medium maturing cultivars.
Overall, females preferred erect cultivars, except in Ncoela and Napuri where 63 % and
40 % of females preferred runners, respectively. Males preferred runners, except 50 %
and 62 % of males in Namicori and Muloco who preferred erect types. Big pod and seed
sizes were preferred by both males and females, except 42 % of females in Milipone and
50 % of males in Muloco who preferred small pod and seed sizes. Red primary seed
colour was preferred by both males and females. Early maturing cultivars were preferred
for both males and females, except 40% females and 65 % of males in Napuri who
preferred medium maturing and 42 % of males in Milipone who preferred late maturing
cultivars. Both males and females preferred high yielding cultivars, except 50 % of
females in Muloco who preferred medium yielding. Both males and females preferred
high resistant cultivars to insect pests, diseases and drought. High oil content cultivars
were preferred by both males and females, except 50 % of females in Muloco who
preferred medium oil content cultivars.

45
Table 2.4: Percent distribution of preferred traits in groundnut cultivars by gender in Namuno and Erati districts in Mozambique
Trait Gender Preference
District
Mean Namuno Erati
Milipone Ncoela Napuri Namicori Muloco Growth habit
Females Erect 50.0 25.0 20.0 81.8 75.0 50.4
Bunch 33.3 12.5 40.0 0.0 0.0 17.2
Runner 16.7 62.5 40.0 18.2 25.0 32.5
Males Erect 10.5 41.2 10.0 50.0 61.9 34.7
Bunch 10.5 0.0 20.0 21.4 14.3 13.2
Runner 78.9 58.8 70.0 28.6 23.8 52.0
Pod and seed size
Females Small 41.7 12.5 0.0 31.8 12.5 19.7
Medium 25.0 31.3 40.0 27.3 37.5 32.2
Big 33.3 56.3 60.0 40.9 50.0 48.1
Males Small 10.5 20.6 2.5 28.6 50.0 22.4
Medium 34.2 23.5 35.0 21.4 21.4 27.1
Big 55.3 55.9 62.5 50.0 28.6 50.5
Seed colour Females Red 100.0 100.0 60.0 72.7 100.0 86.5
Tan 0.0 0.0 0.0 27.3 0.0 5.5
Any 0.0 0.0 40.0 0.0 0.0 8.0
Males Red 100.0 88.2 85.0 78.6 76.2 85.6
Tan 0.0 5.9 10.0 21.4 23.8 12.2
Any 0.0 5.9 5.0 0.0 0.0 2.2

46
Table 2.4: Continued
Trait Gender Preference
District
Mean Namuno Erati Milipone Ncoela Napuri Namicori Muloco
Maturity Females Early 100.0 87.5 40.0 100.0 75.0 80.5
Medium 0.0 12.5 40.0 0.0 25.0 15.5
late 0.0 0.0 20.0 0.0 0.0 4.0
Males Early 42.1 64.7 20.0 71.4 71.4 53.9
Medium 15.8 35.3 65.0 14.3 28.6 31.8
late 42.1 0.0 15.0 14.3 0.0 14.3
Yield Females Low 0.0 0.0 0.0 0.0 0.0 0.0
Medium 16.7 0.0 20.0 0.0 50.0 17.3
High 83.3 100.0 80.0 100.0 50.0 82.7
Males Low 0.0 0.0 0.0 0.0 0.0 0.0
Medium 36.8 11.8 10.0 0.0 19.0 15.5
High 63.2 88.2 90.0 100.0 81.0 84.5
Disease, pest and drought Resistance
Females Low 0.0 0.0 40.0 6.1 0.0 9.2
Medium 5.6 4.2 6.7 0.0 33.3 10.0
High 94.4 95.8 53.3 93.9 66.7 80.8
Males Low 3.5 0.0 8.3 4.8 0.0 3.3
Medium 35.1 15.7 6.7 0.0 15.9 14.7
High 61.4 84.3 85.0 95.2 84.1 82.0
Oil content Females Low 0.0 0.0 20.0 0.0 0.0 4.0
Medium 16.7 0.0 0.0 0.0 50.0 13.3
High 83.3 100.0 80.0 100.0 50.0 82.7
Males Low 0.0 0.0 0.0 0.0 0.0 0.0
Medium 36.8 0.0 10.0 0.0 14.3 12.2
High 63.2 100.0 90.0 100.0 85.7 87.8

47
2.3.5 Groundnut production constraints
Several production constraints affecting groundnut production were mentioned by
farmers in the two districts (Tables 2.5). The major constraints included diseases and
insect pests, low soil fertility and lack of groundnut seed. There was a difference in the
way men and women perceived the main constraints affecting groundnut production
within and across villages. For example, low soil fertility was ranked fifth main constraint
affecting groundnut production by women in Ncoela, Namuno, but the men in the same
villages ranked this constraint second. On the other hand, soil fertility was ranked third,
fourth and fifth, in Napuri, Milipone and Ncoela, in Namuno district, respectively, while
Namicori was ranked fourth and Muloco fifth.
Diseases and insect pests were ranked first and third, respectively by both women and
men. About 35 % of women and 33 % of men in the study area reported that diseases
were the most important constraints for groundnut production and productivity. On the
other hand, about 9 % of women and 9 % of men mentioned that insect pests were
responsible for low groundnut production and productivity in the region.
Lack of new improved cultivars and seed are some of important constraints that
contribute to low yields and yield lose in groundnut production. Lack of seed was ranked
third by women as a constraint for groundnut production while men rank lack of seed
fourth as an important problem for groundnut production. Lack of new improved cultivars
was ranked fifth by about 8 % of women and sixth by about 9 % of men as problem
affecting groundnut production in the two districts.
In addition, farmers also reported that lack of buyers, labour, infra-structure and drought
negatively influenced groundnut production. Inadequate infrastructure was ranked
second by about 10% of women and seventh by men in the study area as problem
affecting groundnut production, and labour was ranked fourth and fifth by women and
men, respectively.
The perception of the problems affecting groundnut production in the study area was
different within and across villages as well as between men and women within village.
However, some of the constraints were perceived the same way by both women and
men.

48
Table 2.5: Percentage of farmers reporting groundnut production constraints in Namuno and Erati districts in Mozambique
Gender Problem Namuno Erati
Total Overall Rank Milipone Ncoela Napuri
Namicori Muloco
Females Drought 7.4(3)* 6.9(4) 4.4(5) 9.1(3) 5.6(6) 7.2 6
Low soil fertility 5.6(4) 5.6(5) 8.9(3) 7.1(4) 8.3(5) 6.9 7
Diseases 37.0(1) 43.1(1) 31.1(1) 29.3(1) 33.3(1) 34.6 1
Insect pests 9.3(2) 6.9(4) 8.9(3) 10.1(2) 11.1(4) 9.2 3
Lack of seed 9.3(2) 6.9(4) 8.9(3) 9.1(3) 13.9(2) 9.2 3
Lack of improved cultivars 5.6(4) 5.6(5) 8.9(3) 10.1(2) 8.3(5) 7.8 5
Lack of market 7.4(3) 8.3(3) 8.9(3) 7.1(4) 0.0(7) 6.9 7
Lack of labour 9.3(2) 6.9(4) 6.7(4) 9.1(3) 11.1(3) 8.5 4
Lack of infra-structure 9.3(2) 9.7(2) 13.3(2) 9.1(3) 8.3(5) 9.8 2
Males Drought 5.8(8) 9.2(4) 6.1(6) 6.3(6) 7.4(7) 7.0 8
Low soil fertility 8.8(5) 10.5(2) 8.9(2) 10.3(2) 9.5(4) 9.5 2
Diseases 34.5(1) 20.9(1) 41.7(1) 42.1(1) 24.9(1) 32.5 1
Insect pests 9.9(3) 10.5(2) 8.9(2) 7.9(4) 9.0(5) 9.3 3
Lack of seed 9.4(4) 9.2(4) 6.7(5) 8.7(3) 11.6(2) 9.2 4
lack of improved cultivars 11.1(2) 9.8(3) 6.7(5) 5.6(7) 9.5(4) 8.7 6
Lack of market 5.3(9) 9.2(4) 5.6(7) 4.8(8) 9.5(4) 7.0 8
Lack of labour 8.2(6) 10.5(2) 8.3(3) 7.1(5) 10.6(3) 9.0 5
Lack of infra-structure 7.0(7) 10.5(2) 7.2(4) 7.1(5) 7.9(6) 7.9 7
*Number in parenthesis represents constraint rank

49
2.3.6 Groundnut rosette disease prevalence in the Northern region of
Mozambique
From this study, the results showed that all districts visited had over 50 % of the fields
that had groundnut were infected with groundnut rosette disease. Balama district had
the lowest number of groundnut fields infected with this disease with slightly over 50%
and Nipepe had the highest with over 80 % (Figure 2.4).
Disease incidence in the 2010/2011 growing season in various districts studied ranged
from 0 to 40% (Table 2.6). Most of the fields visited had disease incidence between 10
and 30 %. Nipepe had the highest number of fields (80 %) infected with groundnut
rosette disease while Balama had the lowest (44 %) number of infected fields.
Figure 2.5: Groundnut rosette disease prevalence in the northern region of Mozambique

50
Table 2.6: Gorundnut rosette disease incidence in the northern region of Mozambique during the 2010/2011 growing season
Province District Number of
fields observed Disease incidence intervals (%)
0-10 10-30 >30 Nampula Meconta 10 40.0 50.0 10.0
Monapo 8 25.0 50.0 25.0
Nacaroa 10 40.0 40.0 20.0
Erati 15 33.3 46.7 20.0
Cabo Delgado Montepuez 12 16.7 58.3 25.0
Chiure 15 26.7 53.3 20.0
Balama 9 44.4 33.3 22.2
Namuno 12 25.0 58.3 16.7
Zambezia Gilé 7 42.9 42.9 14.3
Maganja da Costa 8 25.0 50.0 25.0
Niassa Nipepe 5 0.0 80.0 20.0
Maua 8 12.5 62.5 25.0
Metarica 7 28.6 57.1 14.3
Total 126 28.6 51.6 19.8
2.4 Discussion
Farmers in Erati and Namuno districts cultivated small fields that were less than five
hectares. This is probably due to lack of labour since most of the farmers use household

51
labour. The mean number of persons per households was four and varied from two to
just above four members in the two districts. According to the farmers, a household of
two members was basically the wife and husband, and no children. This type of
household had limited labour, and therefore, cultivated areas less than one hectare. A
household of three, in general, consisted of grandparents and a grandchild. They
produced their crops in small fields with very limited labour. Households of four or more
members were wife and husband and two or more children. These households had more
labour and cultivated areas over two hectares. These findings were confirmed by Davies
(1997) while describing Niassa, Mozambique, farming system. The study also showed
that active farmers were between 30-50 years old in both districts. This was because
people of less than 30 years of age had alternative jobs in the nearest towns or they
were selling goods within the villages.
The main crops cultivated in the two districts in order of decreasing importance were
cassava, maize, groundnut, sorghum, sesame, cowpea, sweet-potato, cotton, green-
gram, pigeon-pea, rice, sugar-cane and bambara-groundnut. Groundnut was grown for
food and cash. Other crops such as cassava, maize, sorghum and cowpea were grown
specifically for food security. As a food crop, farmers used groundnut as a source of
cooking oil or snack (roasted or boiled).
Intercropping (mixed cropping) was found to be the most common cropping system
practiced by farmers in the two districts. Most of the fields had mixtures of cassava,
groundnut, cowpea and pigeon pea, and a few farmers practised mono-cropping of
groundnut in small plots. Groundnut was the only crop which appeared in all inter-
cropping systems. Métier (2005a, b) confirmed that groundnut was grown in all three
main cropping systems described in Namuno and Erati, which is an indication of the
importance of groundnut crop in the region. By intercropping several crops including
groundnut, farmers improved their food security status because if one crop failed
farmers could still harvest others.
About 47 % of respondents cultivated small fields that were less than one hectare in
size, while 53% of respondents cultivated fields that were 1-5 ha. This is an indication
that crops grown in the region, even though important for food security, were grown in
small fields.

52
It is very important for breeders to know the characteristics of groundnuts that farmers
prefer when developing a new cultivar. Most of the farmers in this region preferred large-
seeded, erect, early maturing, high yielding, high insect pest, disease and drought
resistant, and high oil content groundnut cultivars. However, there were some
differences on preference between males and females within and across villages. Kitch
et al. (1998) pointed out that farmer preferred cultivars with particular traits, such as
large-seeded and red-coloured cultivars, that give the best price.
The results of this study indicated that farmers were aware of the constraints affecting
their crops. Constraints such as diseases, insect pests, and lack of new and improved
cultivars were reported to be limiting factors for groundnut production in the region. The
most important groundnut disease mentioned by farmers was groundnut rosette disease.
They used descriptive names for symptoms, such as stunted plants, deformed leaves,
yellowing of leaves in order to indicate the disease. For example, farmers compared
groundnut rosette disease with leprosy disease in humans: the affected plants were
stunted just as with fingers of persons suffering from leprosy. They noted that this
disease was sporadic, but it could destroy an entire crop when it occurred. Other
diseases mentioned by farmers were leaf spots and leaf rust. Farmers related leaf spots
and rust diseases with crop maturity since the diseases appeared late in the season
when the crop was about to mature, however they were not aware of the real impact of
these diseases. The most important insect pests mentioned by farmers were termites
and white grubs. According to the farmers, termites attacked groundnut crop from
emergence to harvest, while white grubs attacked plants during the seedling stage,
causing wilting and death.
In Namuno, all farmers grew local landraces, which were large-seeded, low-yielding and
susceptible to groundnut rosette disease. This indicated that improved cultivars that had
been released in the area were not adopted by the farmers due to possession of small
pods and seeds which required more labour for shelling. The farmers were aware of the
advantages of growing improved cultivars which were high yielding. However, they
continued growing the landraces for two main reasons: 1) lack of buyers at the local
level for the small-seeded improved cultivars and 2) high labour demand for the shelling
process. The farmers indicated that they did not have means to transport their produce
to the nearest major town and the stockists in the rural areas did not buy small-seeded
cultivars.

53
On the contrary, farmers in Erati had replaced local landraces with improved groundnut
cultivar, Nametil, which is resistant to groundnut rosette disease, high-yielding, early-
maturing, small-seeded with high oil content. The main reason for this replacement was
because Erati district is close to a big town (Nampula) and is traversed by a major road
which links two big urban areas of northern Mozambique, Pemba and Nampula. In these
two towns, small-seeded groundnuts are preferred.
Another constraint mentioned repeatedly was the selling price. According to farmers,
most of the produce was sold to individuals, local markets and fellow farmers. Farmers
sold their groundnuts at prices ranging between 10 and 12 Mozambican currency
(about US$0.40) per kg during the harvesting period from May to September, while
toward the onset of rains when groundnut seed was in high demand, prices reached up
to 50 Mozambican currency (about US$2.0 per kg).
Groundnut rosette disease was recorded in all districts surveyed. Its incidence was
generally low but varied from one district to another. Serious disease incidence occurred
in Nipepe and Maua, Niassa province. Groundnut rosette disease is known to cause
occasional epidemics under favourable conditions (Haciwa and Kannaiyan, 1995).
Therefore, even with low disease incidence in the 2010/2011 growing season, the
groundnut breeding programme must aim at developing rosette disease tolerant high
yielding cultivars with other preferred traits.
This study initiated dialogue between farmers and researchers which helped understand
the main constraints for groundnut production faced by farmers in the northern region of
Mozambique. This dialogue, through the participatory approach, confirmed that farmers
were aware of the various issues affecting their daily lives including crop production.
Biggs (1978) confirmed that farmers have valuable knowledge and they can contribute to
agricultural research.
During this study, farmers of both districts mentioned that they did not participate in
research programmes occurring in their regions, which lead to low adoption of new
technologies. Farmer participation is important because it empowers them (Sperling et
al., 1993) and increases the efficiency of the research by orienting it to their needs
(Witcombe, 1996; Witcombe et al., 1996; Witcombe et al., 2005; Witcombe et al., 2006).
Biggs (1989) opined that farmers must be consulted in order to diagnose problems and

54
modify research plans. They have to sense that they are active partners in the research,
and they have to lead the direction of research.
2.5 Conclusions
Based on the results obtained from the PRA, it is concluded that farmers were aware of
the constraints affecting groundnut production and productivity in the study area. The
major constraints included groundnut rosette disease, insect pests, lack of seeds and
improved cultivars, low soil fertility and lack of infra-structure. Selection criterion used by
women differed from that used by men within village and across villages. However, high
yield and oil content were the most important traits followed by pod and seed size,
earliness and disease and insect pest resistance. Farmers did not accept groundnut
rosette resistant cultivars since they were not suitable for local needs. Those near major
towns accepted since they can market their produce. Farmers were aware of groundnut
rosette disease and it was ranked the most important constraint by both women and
men. Groundnut rosette disease was found in all districts surveyed. Its incidence was
generally low, but varied among the districts. The most serious disease incidence
occurred in Niassa province.
References
Adu-Dapaah, H.K., J.Y. Asibuo, O.A. Danquah, H. Asumadu, J. Haleegoah and B.A.
Agyei. 2004. Farmer participation in groundnut rosette resistant varietal selection
in GHANA. In: Institute, C.R. (Ed.). 4th International Crop Science Congress,
Crops Research Institute, Brisbane, Australia.
Atlin, G. and J. Witcombe. 2002. Introduction. In: Witcombe, J.et al., (Eds.). Breeding
rainfed rice for drought-prone environments: integrating conventional and
participatory plant breeding in South and Southeast Asia. , Procceedings of a

55
DFID Plant Sciences Research Programme/IRRI Conference IRRI, Los Banos,
Laguna, Phillipines.
Biggs, S.D. 1978. Planning rural technologies in the context of social structures and
reward systems. Journal of Agricultural Economics. 29:257-277.
Biggs, S.D. 1989. Resource-poor farmer participation in research: A synthesis of
experiences from nine national agricultural research systems. OFCOR
Comparative Study Paper 3, The Hague: International Service for National
Agricultural Research, The Netherlands.
Chambers, R. 1992. Rural Appraisal: rapid, relaxed and participatory., Discussion Paper,
University of Sussex, United Kingdom.
Danial, D., J. Parlevliet, C. Almekinders and G. Thiele. 2007. Farmers' participation and
breeding for durable disease resistance in the Andean region. Euphytica.
153:385-396.
Davies, G. 1997. Descrição do sistema de produção do planalto do Niassa - racional,
estrangulamentos e oportunidades, Instituto Nacional de Investigação
Agronómica, INIA, Maputo, Mozambique.
Dorward, P., P. Craufurd, K. Marfo, W. Dogbe and R. Bam. 2007. Improving
participatory varietal selection processes: participatory varietal selection and the
role of informal seed diffusion mechanisms for upland rice in Ghana. Euphytica.
155:315-327.
Gyawali, S., S. Sunwar, M. Subedi, M. Tripathi, K.D. Joshi and J.R. Witcombe. 2007.
Collaborative breeding with farmers can be effective. Field Crops Research.
101:88-95.
Haciwa, H.C. and K. J. 1995. Prevalence of groundnut diseases and extent of yield
losses due to leaf spot diseases in Zambia. International Arachis Newsletter. 15.
Hagmann, J., E. Chuma, K. Murwira and M. Connolly. 1999. Putting process into
practice: operationalising participatory extension., Agricultural Research and
Extension Network Paper, London, United Kingdom.

56
Kitch, L.W., O.C. Boukar, C. Endondo and L.L. Murdock. 1998. Farmer acceptability
criteria in breeding cowpea. Experimental Agriculture. 34:475-486.
Maurya, D., A. Bottrall and J. Farrington. 1988. Improved livelihoods, genetic diversity
and farmer participation: a strategy for rice breeding in rainfed areas of India.
Experimental Agriculture. 24:311-320.
MÉTIER. 2005a. Perfil do Distrito de Erati - Província de Nampula. In: Estatal, M.d.A.
(Ed.). Perfis dos Distritos de Moçambique, Direcção Nacional de Administração
Local, Maputo. pp. 54.
MÉTIER. 2005b. Perfil do Distrito de Namuno - Província de Cabo Delgado. In: Estatal,
M.d.A. (Ed.). Perfis Distritais de Moçambique, Direcção Nacional de
Administração Local, Maputo. pp. 57.
Morris, M.L. and M.R. Bellon. 2004. Participatory plant breeding research: opportunities
and challenges for the international crop improvement system. Euphytica.
136:21-35.
Ntare, B.R., J. Ndjeunga, F. Waliyar, O. Kodio, C.A. Echekwu, K. I., A. Da Sylva, A.T.
Diallo, A. Amadou, H.Y. Bissala and K.p. Sako. 2007. Farmer Participatory
Evaluation and Dissemination of Improved Groundnut Varieties in West Africa.
International Crops Research Institute for the Semi-Arid Tropics., Bamako, Mali.
Sperling, L., J. Ashby, M. Smith, E. Weltzien and S. McGuire. 2001. A framework for
analyzing participatory plant breeding approaches and results. Euphytica.
122:439-450.
Sperling, L., M.E. Loevinsohn and B. Ntabomvura. 1993. Rethinking the farmer’s role in
plant breeding: local bean experts and on-station selection in Rwanda.
Experimental Agriculture. 29:509-519.
Tripp, R. 1982. Data collection, site selection and farmer participation in on-farm
experimentation. CIMMYT Working Paper, International Maize and Wheat
Improvement Centre (CIMMYT), Mexico D.F., Mexico.

57
Waliyar, F., P.L. Kumar, B.R. Ntare, E. Monyo, S.N. Nigam, A.S. Reddy, M. Ositu and
A.T. Diallo. 2007. Groundnut Rosette Disease and its Management. Information
Bulletim. 75:32.
Witcombe, J.R. 1996. Participatory Approaches to Plant Breeding and Selection.
Biotechnology and Development Monitor. 29:1-26.
Witcombe, J.R., S. Gyawali, S. Sunwar, B.R. Sthapit and K.D. Joshi. 2006. Participatory
plant breeding is better described as highly client-oriented plant breeding II.
Optional farmer collaboration in the segregating generations. Experimental
Agriculture. 42:79-90.
Witcombe, J.R., A. Joshi, K.D. Joshi and B.R. Sthapit. 1996. Farmer participatory crop
improvement. I. Varietal selection and breeding methods and their impact on
biodiversity. Experimental Agriculture. 32:445-460.
Witcombe, J.R., K.D. Joshi, S. Gyawali, A.M. Musa, C. Johansen, D.S. Virk and B.R.
Sthapit. 2005. Participatory plant breeding is better described as highly client-
oriented plant breeding. I. Four indicators of client-orientation in plant breeding.
Experimental Agriculture. 41:299-320.
Witcombe, J.R., L.B. Parr and G.N. Atlin. 2002. Breeding raifed rice for drought-prone
environments: integrating conventional and participatory plant breeding in South
and Southeast Asia, Centre for Arid Zone Studies (CAZS), University of Wales,
Gwynedd, LL57 2UW, UK, Los Banos, Laguna, Philippines. pp. 104.
III. EVALUATION OF NORTHERN MOZAMBIQUE GROUNDNUT (ARACHIS
HYPOGAEA L.) LANDDRACES FOR RESISTANCE TO GROUNDNUT ROSETTE
DISEASE AND SELECTED AGRO-MORPHOLOGICAL TRAITS
Abstract
Groundnut (Arachis hypogaea L.)is an important cash and food crop for many families in
Mozambique. No information is available on the diversity of groundnut landraces present
in the country. The objective of this study was to evaluate the groundnut landraces with
respect to rosette disease and selected morphological traits. Fifty-eight local groundnut
landraces collected from northern Mozambique were evaluated in the 2008/2009 and
2009/2010 growing seasons for agro-morphological traits and 2010/2011 growing
58
season for groundnut rosette disease incidence at Nampula Research Station. In this
study, flower colour of yellow-orange group was observed. Two main primary seed
colours (purple and tan) were found; both colours varied from light to dark. Four types of
growth habit pattern were recorded being decumbent-1, decumbent-2, decumbent-3 and
erect. Green and purple main stem colours were found; some genotypes had a mixture
of the two colours. Leaflet shapes were classified as obovate, lanceolate, wide-elliptic
and oblong-elliptic. Three pod sizes (small, medium and big) were recorded, and pod
constriction varied between very deep, deep, moderate, slight and none. Pod beak was
classified as prominent, moderate and slight. Most landraces gave low mean seed yield,
similar to that obtained by Mozambican groundnut producers of 600 to 800 kg ha-1. The
highest yielding genotypes were Pambara-4, Ile-1, Imponge-1-Tom, Pambara-2,
Imponge-42, Gile-5 and Pambara-6 with over 800 kg ha-1. For 100 seed weight, the
landraces were grouped into three different classes: (i) less than 30 g, (ii) between 30
and 45 g and (iii) more than 45 g. The average number of pods plant-1 was 107, and the
average pod length was 2.5 cm with the largest of 3 cm and the shortest of 2 cm pod
length. Four genotypes, PAN-4, Imponge-4, Pambara-3 and Metarica Joao were
classified as resistant to groundnut rosette disease. There was no significant (P>0.05)
correlation between seed yield and groundnut rosette disease incidence. The Clustering
of the genotypes by the nearest neighbour method based on agro-morphological traits
gave six Clusters which indicated that there was wide diversity among landraces,
suggesting that they could be useful for a breeding programme.
Keywords: Mozambique, landraces, groundnut, Arachis hypogaea, Morphological
characterization, groundnut rosette disease.
3.1 Introduction
Groundnut (Arachis hypogaea L.) is the third most important crop in Mozambique after
maize (Zea mays) and cassava (Manihot esculenta) (Walker et al., 2006). It is a major
cash crop and the main source of cooking oil for many Mozambican families (Muitia,
2005). In terms of production, groundnut occupies the largest area among the grain
legumes in the country (Arias and Libombo, 1994). The crop is mainly grown by small
scale farmers under rainfed conditions. Low groundnut yields that are of poor quality are
realized by farmers in Mozambique as a result of several constraints. The major

59
constraints include: diseases (i.e., groundnut rosette disease, early and late leaf spots),
drought, insect pests (e.g., leaf borers), and post-harvest related issues (i.e., aflatoxins).
Groundnut rosette is the most destructive viral disease of groundnut in Sub-Saharan
Africa and can cause up to 100 % crop loss (Bock et al., 1990; Naidu et al., 1998; Naidu
et al., 1999). The disease is manifested in the form of mosaic, chlorosis or green where
by leaves show mosaic symptoms, yellow chlorosis and dark green, respectively. The
identification of genotypes with resistance to groundnut rosette disease would be an
important component of the genetic improvement of groundnut in Sub-Saharan Africa,
including Mozambique, where the disease is endemic. Sources of resistance to
groundnut rosette disease have been identified at ICRISAT (ICRISAT, 1991; Ntare et al.,
2007). These resistant cultivars are not popular with Mozambican farmers since they
have small pods and seeds which are laborious to shell. Such resistance, on the other
hand, could be incorporated into popular but susceptible local landraces through
breeding.
Groundnut has been cultivated by farmers in Mozambique since the 16th century when
the crop was first introduced by portuguese. There is a wide range of landraces currently
grown by farmers in the country. Some of these landraces may already carry genes for
resistance to rosette disease, in addition to other traits. Hence, there is a need to
evaluate a number of landraces in order to identify genotypes with desirable traits such
as resistance to groundnut rosette disease, medium to big seed size, early maturity and
high oil content. The objectives of this study were to evaluate groundnut landraces
collected from northern Mozambique for variation in selected agro-morphological traits
and to identify groundnut germplasm sources resistance to groundnut rosette disease for
future use in breeding programmes.
3.2 Materials and methods
3.2.1 Groundnut genotypes
Fifty-eight local groundnut landraces were collected from the northern region of
Mozambique (Nampula, Cabo Delgado, Niassa and Zambézia). The genotypes were
labelled with the names of the villages or regions where they were collected (Table 3.1).

60
3.2.2 Study area
The study was conducted at Nampula Research Station (PAN), which is located about 7
km east of Nampula in northern Mozambique (15º 09’ S, 39º 30’ E) and is elevated at
432 m above sea level. The soil type is sandy loam and the vegetation is predominantly
grassland. The average rainfall is slightly over 1000 mm which starts around
November/December up to April/May with its peak in January. The maximum
temperature in the region is about 39o C and the minimum temperature is 19o C.
3.2.3 Field establishment
The study was carried out in the 2008/2009, 2009/2010 and 2010/2011 growing
seasons. During the first two growing seasons (2008/2009 and 2009/2010), the
genotypes were evaluated for agro-morphological characteristics at low disease
pressure. Since Nampula is a hotspot for groundnut rosette disease, the experiment was
planted in December of each growing season so that the plants could escape the period
of heavy disease infection late in the season. The 58 genotypes were planted in an
α-resolvable design (29 blocks containing 2 row plots each) with two replications. The
replicates were separated by 2 m alleys. Two replications were used in order to keep the
experiment in a manageable size because of the number of accessions and the design
of the infector row where by each test line is surrounded by infector made the
experiment quite big. An individual genotype was planted in a 4 m single row at a
spacing of 0.6 m between rows (genotypes) and 0.2 m within rows. The seeds were
sown at a depth of 5 cm. The field was kept weed free by hand weeding. No fertilizer,
pesticides or supplementary water were applied because fertilizers and pesticides are
not available and farmers do not user fertilizers non pesticides on their crop.
In the 2010/2011 growing season, the genotypes were evaluated at high disease
pressure in Nampula and Namapa for groundnut rosette disease screening. The
experiment in Namapa was destroyed by heavy rains occurred by mid February of 2011
and is not reported in this thesis. The experiment was planted in late January in order to
expose the genotypes to high disease pressure. The 58 genotypes were planted in a
α-resolvable design (29 blocks containing 2 row plots each) with two replications. The
replicates were separated by 2 m alleys. An individual genotype was planted in a 4 m
single row at spacing of 0.6 m between rows (genotypes) and 0.2 m within rows. Blocks

61
were flanked with two rows of a susceptible cultivar. Care was taken to ensure uniform
planting. The field was kept weed free by hand weeding. No fertilizer, pesticides or
supplementary water were applied.
The genotypes were infested with disease using the spreader-row technique. This was
done by planting the tester genotypes (landraces) in single row plots adjacent to a
susceptible cultivar (JL-24), that was planted 15 days earlier to provide large population
of aphids and groundnut rosette disease inoculum (Figure 3.1)..
Figure 3.1 Screening groundnut genotypes to groundnut rosette disease resistance
JL-24
JL-24
Tester A
Tester B
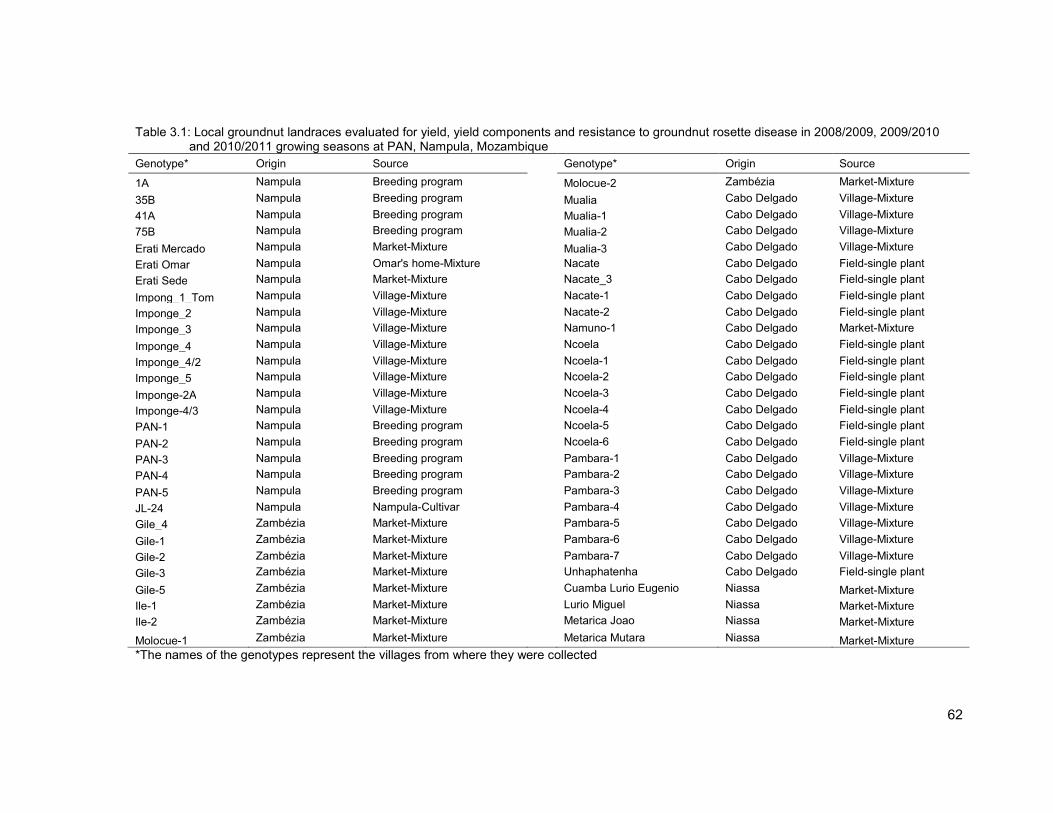
62
Table 3.1: Local groundnut landraces evaluated for yield, yield components and resistance to groundnut rosette disease in 2008/2009, 2009/2010 and 2010/2011 growing seasons at PAN, Nampula, Mozambique
Genotype* Origin Source Genotype* Origin Source
1A Nampula Breeding program Molocue-2 Zambézia Market-Mixture
35B Nampula Breeding program Mualia Cabo Delgado Village-Mixture
41A Nampula Breeding program Mualia-1 Cabo Delgado Village-Mixture
75B Nampula Breeding program Mualia-2 Cabo Delgado Village-Mixture
Erati Mercado Nampula Market-Mixture Mualia-3 Cabo Delgado Village-Mixture
Erati Omar Nampula Omar's home-Mixture
Nacate Cabo Delgado Field-single plant
Erati Sede Nampula Market-Mixture
Nacate_3 Cabo Delgado Field-single plant
Impong_1_Tom Nampula Village-Mixture
Nacate-1 Cabo Delgado Field-single plant
Imponge_2 Nampula Village-Mixture
Nacate-2 Cabo Delgado Field-single plant
Imponge_3 Nampula Village-Mixture
Namuno-1 Cabo Delgado Market-Mixture
Imponge_4 Nampula Village-Mixture
Ncoela Cabo Delgado Field-single plant
Imponge_4/2 Nampula Village-Mixture
Ncoela-1 Cabo Delgado Field-single plant
Imponge_5 Nampula Village-Mixture
Ncoela-2 Cabo Delgado Field-single plant
Imponge-2A Nampula Village-Mixture
Ncoela-3 Cabo Delgado Field-single plant
Imponge-4/3 Nampula Village-Mixture
Ncoela-4 Cabo Delgado Field-single plant
PAN-1 Nampula Breeding program
Ncoela-5 Cabo Delgado Field-single plant
PAN-2 Nampula Breeding program
Ncoela-6 Cabo Delgado Field-single plant
PAN-3 Nampula Breeding program
Pambara-1 Cabo Delgado Village-Mixture
PAN-4 Nampula Breeding program
Pambara-2 Cabo Delgado Village-Mixture
PAN-5 Nampula Breeding program
Pambara-3 Cabo Delgado Village-Mixture
JL-24 Nampula Nampula-Cultivar
Pambara-4 Cabo Delgado Village-Mixture
Gile_4 Zambézia Market-Mixture
Pambara-5 Cabo Delgado Village-Mixture
Gile-1 Zambézia Market-Mixture
Pambara-6 Cabo Delgado Village-Mixture
Gile-2 Zambézia Market-Mixture
Pambara-7 Cabo Delgado Village-Mixture
Gile-3 Zambézia Market-Mixture
Unhaphatenha Cabo Delgado Field-single plant
Gile-5 Zambézia Market-Mixture
Cuamba Lurio Eugenio Niassa Market-Mixture
Ile-1 Zambézia Market-Mixture
Lurio Miguel Niassa Market-Mixture
Ile-2 Zambézia Market-Mixture
Metarica Joao Niassa Market-Mixture
Molocue-1 Zambézia Market-Mixture Metarica Mutara Niassa Market-Mixture *The names of the genotypes represent the villages from where they were collected

63
3.2.4 Data collection
Some groundnut descriptors reported by the International Board for Plant Genetic
Resources (IBPGR) and International Crops Research Institute for the Semi-Arid
Tropics (lCRISAT) were used (IBPGR and ICRISAT, 1992) for evaluating the
genotypes during 2008/2009 and 2009/2010 growing seasons (Table 3.2). The traits
evaluated included qualitative traits (primary seed colour, flower colour, leaflet shape,
growth habit, pod size, pod constriction, pod beak, stem colour) and quantitative
traits (seed yield, 100 seed weight, pods plant-1 and pod length). Yield was
determined for each groundnut genotype at the end of the maturity period by shelling
and weighing the sun dried seeds. Seed weight, measured in gm-2, was converted to
kg ha-1.
In the 2010/2011 growing season, single plants from each genotype were monitored
for presence or absence of virus symptoms at 60 days after planting. Disease
incidence (DI) was determined by calculating the percentage of plants with rosette
symptoms for each genotype (Waliyar et al., 2007).
3.2.5 Data analysis
The data on yield, morphological characteristics and disease incidence were
analyzed using the Genstat 14 Statistical program (Payne et al., 2011). The following
statistical model was used to analyse data:
Where: Yijkl = observed landrace response; µ = overall population mean; Ei = Effect of
the ith environment; Gl = Effect of the lth genotype; Yj = Effect of the j
th year; EYij =
Interaction effect of the ith environment and the jth year; Rk(ij) = Effect of the kth
replication in the ith environment; GEil = Interaction effect of the lth genotype and the ith
environment; GYjl = Interaction effect of the lth genotype and the jth year; GEYijl =
Interaction effect of the lth genotype, ith environment and jth year; εijkl = Experimental
error.
Where G was considered as fixed effect and E, Y, GY, GE and GEY were considered
as random effects.

64
Mean separation for yield and disease incidence data was performed using Fisher’s
protected least significant difference (LSD) for each season separately and for
combined data. Phenotypic correlations between disease incidence and yield and
yield components were determined using Pearson’s Correlation procedure. Cluster
analysis was performed for the morphological characteristics, yield, and yield
components using SPSS for Windows 19 (SPSS, Inc., 2010, Chicago, IL,
www.spss.com) for combined data. Hierarchical cluster analysis was carried out
using nearest neighbour method and applying squared Euclidean distance as the
similarity measure.
This experiment was conducted in two locations (Nampula and Namapa), but only
data from one location (Nampula) will be presented since the trial from the other site
was washed out by heavy rains which occurred in mid-February, 2011.

65
Table 3.2: Descriptors used in the evaluation of Mozambican groundnut landraces grown at Nampula Research Station
Descriptor Category definition Remarks Qualitative traits Primary seed colour 1=white; 2=off-white; 3=yellow; 4=very pale tan; 5=pale tan; 6=light tan;
7=tan; 8=dark tan; 9=grey orange; 10=rose; 11=salmon; 12=light red; 13=red; 14=dark red; 15=purplish; 16=light purple; 17=purple; 18=dark purple; 19=very dark purple; 20=other
Recorded from dry, mature and wrinkle free seeds
Flower colour 1=white; 2=lemon yellow; 3=yellow; 4=orange-yellow; 5=orange; 6=dark orange; 7=garnet/brick red; 8=other
Colour of front face of the stand petal of fresh and opened flowers
Leaflet shape 1=cuneate; 2=obcuneate; 3=elliptic; 4=oblong-elliptic; 5=narrow-elliptic; 6=wide-elliptic; 7=suborbicular; 8=orbicular; 9=ovate; 10=obovate; 11=oblong; 12=oblong-lanceolate; 13=lanceolate; 14=linear lanceolate; 15=other
Shape of fully expanded, apical leaflet of the third leaf on the main stem
Growth habit 1=procumbent-1; 2=procumbent-2; 3=decumbent-1; 4=decumbent-2; 5=decumbent-3; 6=erect; 7=other
Taken at podding stage (45-60 days after planting)
Pod size* 1=small; 2=medium; 3=big Recorded from fully mature pods
Pod constriction 0=none; 3=slight; 5=moderate; 7=deep; 9=very deep Taken from fully mature pods
Pod beak 0=absent; 3=slight; 5=moderate; 7=prominent; 9=very prominent Recorder from fully mature pods
Stem colour* 1=purple; 2=green; 3=mixture of the two Recorded on the main stem of mature plants (45-60 days after planting)
Quantitative traits 100 seed weight weight of 100 random, mature and
wrinkle-free seeds
pods per plant Total number of pods recorded from 5 random plants
pod length Recorded from a mean of 20 fully mature pods selected randomly
Rosette disease incidence HR=<10%; R=11-30%; MR=31-50%; S=>50%
*Not included on the IBPGR descriptor. HR=High resistant; R=Resistant; MR=Moderate resistant; S=Susceptible

66
3.3 Results
3.3.1 Phenotypic variation among groundnut landraces
The genotypes studied differed with respect to pod size, pod constriction, primary
seed colour, pod beak, leaflet shape and growth habit (Figure 3.2, Figure 3.3 and
Appendix 2). They were, however, similar for yellow-orange flower colour. Pod size
comprised of small, medium and big. Seventy-nine percent of the genotypes
evaluated had medium pod size, 9 % were big-seeded and 12 % were small-seeded.
Pod constriction varied from very deep to none. Most of the genotypes, over 75 %,
had moderate pod constriction and 14 % had deep pod constriction. The landraces
studied had seeds with various shades of purple primary colour (light, pale and deep
purple) or tan primary colour (light, pale and dark). Thirty-one percent of the
genotypes had purple, and 30 % had pale tan, as primary seed colours, respectively.
Their pod beaks varied from prominent to slight, with moderate pod beak being the
most common, in 57 % of the genotypes. Leaflet shape varied between obovate,
lanceolate, wide-elliptic and oblong elliptic. Over 40 % of the genotypes had wide-
elliptic leaflet shape followed by obovate leaflet shape with about 24 % of the
genotypes, and growth habit varied from erect to decumbent-3 (Figure 3.3). Over
50 % of the landraces evaluated had a decumbent-2 growth habit and only 10 %
were erect. Sixty per cent of the landraces had green stem colour, while 28 % and
12 % of the landraces had purple and mixed stem colours, respectively.

67
Figure 3.2: Frequency distribution (%) of 58 groundnut landraces for selected agro-
morphological traits

68
Figure 3.3a: Pod constriction, pod beak and primary seed colours recorded in groundnut
landraces grown in Mozambique. A1: No pod constriction, A2: Moderate pod constriction, A3: Very deep pod constriction, B1: Moderate pod beak, B2: Prominent pod beak and C: Primary seed colours.

69
Figure 3.3b: Growth habits of groundnut landraces grown in Mozambique. A: Decumbent-1,
B: Decumbent-3, C: Erect, and D: Decumbent-2
3.3.2 Yield and yield components
The mean yield and yield components were significantly (P<0.05) different among
the groundnut genotypes (Table 3.3 and Appendix 3.). The mean yields ranged
between 441.7 and 952 kg ha-1. The highest yielding genotype across the two
seasons was Pambara-4 (952 kg ha-1). In the 2008/2009 growing season, the highest
yielding genotype was Gile-5 (906 kg ha-1), and in 2009/2010, the highest yielding
genotype was Ncoela-5 with 1039.5 kg ha-1.
The lowest yielding genotype across the two seasons was Erati Omar with
441.7 kg ha-1. The lowest yielding genotype in the 2008/2009 growing season was
Erati Omar with mean of 214.1 kg ha-1, and the lowest yielding genotype in
2009/2010 was Gile-2 with mean of 263.5 kg ha-1. The 2008/2009 growing season
gave a higher mean yield of 681.0 kg ha-1 compared to that of 2009/2010 growing
season (743.0 kg ha-1).

70
The 100 seed weight ranged from 28.1 to 61.3 g. Over 55 % of the genotypes had a
100 seed weight of more than 45.0 g, about 16 % less than 35.0 g and about 28 %
between 35.0 and 45.0 g. Genotype Gile-2 had the highest 100 seed weight (61.3 g)
and genotype Erati Omar had the lowest (26.6 g).
The mean number of pods plant-1 ranged from 91 to 153, with genotype Imponge-42
having the highest number (153) and genotypes Gile-2, PAN-1, Mualia-1, Nacate-3,
Erati Mercado and Unhaphatenha having the lowest number of pods per plant (91).
Most of the genotypes had over 100 pods per plant.
All genotypes had pods over 2.0 cm long, except Pambara-6 and Ncoela-2 with 1.8
and 1.7 cm, respectively. Genotype Ncoela-2 had the shortest pod length (1.7 cm)
while genotype Metarica Joao had the longest pod length (3.0 cm).

71
Table 3.3: Yield and yield components of 58 groundnut genotypes evaluated at Nampula in 2008/2009 and 2009/2010 growing seasons*
Genotype** Seed yield (kg ha-1) 100 seed weight (g) Number of pods plant -1 Pod length (cm)
2009 2010 Combined 2009 2010 Combined 2009 2010 Combined 2009 2010 Combined Top 10 landraces Pambara-4 874.4 1029.5 952.0 46.2 47.4 46.8 91.0 91.0 91.0 2.4 2.1 2.2 Ile-1 852.5 918.0 885.2 55.0 48.6 51.8 149.0 113.0 131.0 1.5 1.9 1.7
Impong_1_Tom 808.3 957.1 882.7 40.5 33.6 37.1 91.0 131.0 111.0 2.3 2.9 2.6
Pambara-2 853.6 858.6 856.1 50.7 49.9 50.3 91.0 93.5 92.3 2.4 2.8 2.6
Imponge_42 865.3 832.9 849.1 38.7 37.4 38.0 126.5 100.0 113.3 2.9 2.6 2.7
Gile-5 906.0 761.7 833.9 46.0 40.5 43.3 97.5 97.0 97.3 2.2 2.1 2.1
Pambara-6 817.6 785.0 801.3 41.8 42.1 41.9 91.0 134.5 112.8 2.8 2.4 2.6
PAN-5 786.5 788.4 787.4 40.6 39.1 39.8 121.5 156.5 139.0 2.8 2.7 2.8
1A 816.1 735.2 775.6 40.0 40.0 40.0 92.0 91.0 91.5 2.1 2.6 2.3
Namuno-1 839.0 692.1 765.5 44.9 49.1 47.0 111.5 91.0 101.3 2.1 2.2 2.2
Bottom 10 landraces Cuamba Lurio Eugenio 476.3 435.7 456.0 33.7 35.2 34.5 131.0 91.0 111.0 2.7 2.6 2.6
Pambara-7 404.3 425.7 415.0 34.8 35.9 35.4 134.5 91.0 112.8 2.6 2.6 2.6
Imponge-2A 363.8 456.6 410.2 26.9 36.8 31.8 91.0 93.5 92.3 2.6 2.1 2.3
Pambara-3 393.1 412.0 402.5 36.8 38.4 37.6 93.5 91.0 92.3 2.8 2.1 2.5
Molocue-2 433.6 357.2 395.4 42.5 48.6 45.5 95.5 113.0 104.3 2.6 2.9 2.8
Erati Mercado 398.4 385.1 391.7 44.8 29.3 37.0 91.0 91.0 91.0 2.2 2.5 2.3
Lurio Miguel 503.7 263.5 383.6 35.0 23.2 29.1 131.0 96.5 113.8 2.6 2.4 2.5
Ncoela-3 484.9 270.6 377.7 39.8 38.4 39.1 99.5 112.5 106.0 2.7 2.6 2.6
Gile-1 326.2 349.8 338.0 47.4 50.0 48.7 111.0 92.5 101.8 2.7 1.8 2.2 Erati Omar 214.1 447.1 330.6 32.4 23.8 28.1 123.0 119.5 121.3 2.6 2.6 2.6
Check JL-24 804.5 681.2 742.8 41.3 37.6 39.4 126.0 91.0 108.5 2.3 2.2 2.2
Mean 682.0 498.0 587.0 41.7 40.6 41.1 107.3 97.4 101.0 2.5 2.5 2.5
LSD(5%) 227.7 223.4 141.0 12.4 10.1 14.1 25.5 24.7 32.9 0.8 0.8 0.6
CV(%) 21.6 19.1 17.2 15.3 18.7 11.0 13.3 11.8 16.4 10.7 12.1 14.6 *Genotypes sorted based on the combined yield; **whole list of genotypes given in Appendix 3.2
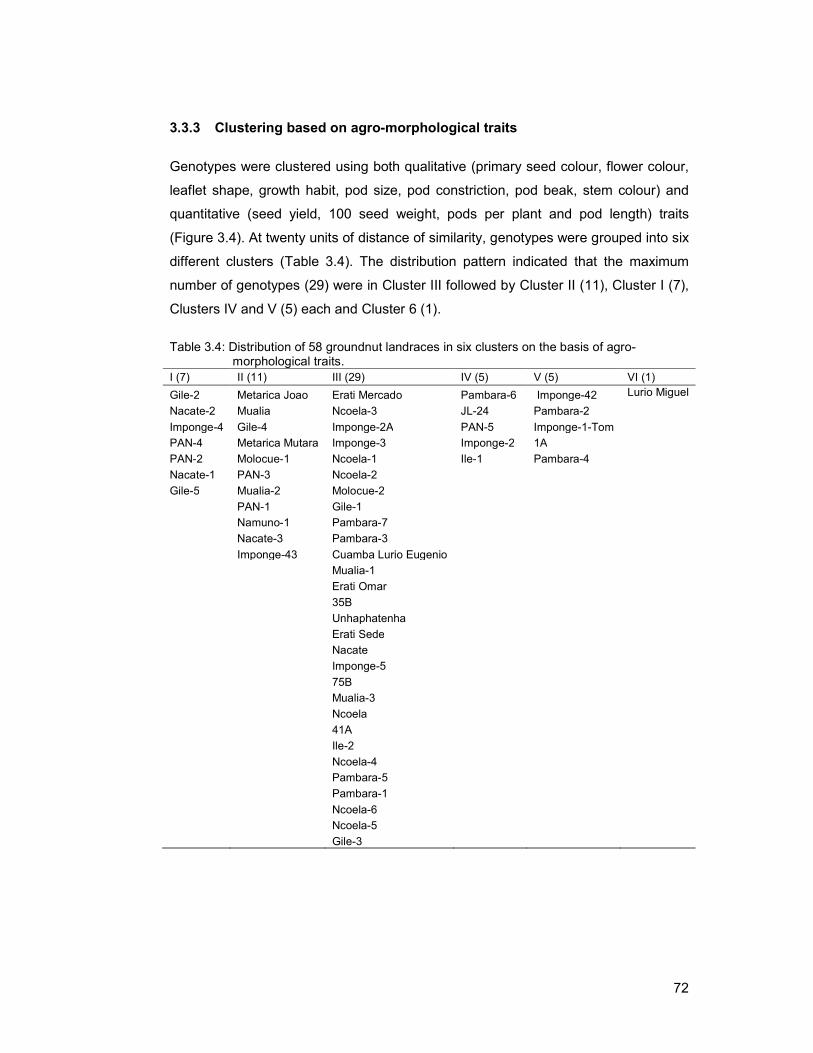
72
3.3.3 Clustering based on agro-morphological traits
Genotypes were clustered using both qualitative (primary seed colour, flower colour,
leaflet shape, growth habit, pod size, pod constriction, pod beak, stem colour) and
quantitative (seed yield, 100 seed weight, pods per plant and pod length) traits
(Figure 3.4). At twenty units of distance of similarity, genotypes were grouped into six
different clusters (Table 3.4). The distribution pattern indicated that the maximum
number of genotypes (29) were in Cluster III followed by Cluster II (11), Cluster I (7),
Clusters IV and V (5) each and Cluster 6 (1).
Table 3.4: Distribution of 58 groundnut landraces in six clusters on the basis of agro-morphological traits.
I (7) II (11) III (29) IV (5) V (5) VI (1)
Gile-2 Metarica Joao Erati Mercado Pambara-6 Imponge-42 Lurio Miguel
Nacate-2 Mualia Ncoela-3 JL-24 Pambara-2
Imponge-4 Gile-4 Imponge-2A PAN-5 Imponge-1-Tom
PAN-4 Metarica Mutara Imponge-3 Imponge-2 1A
PAN-2 Molocue-1 Ncoela-1 Ile-1 Pambara-4
Nacate-1 PAN-3 Ncoela-2
Gile-5 Mualia-2 Molocue-2
PAN-1 Gile-1
Namuno-1 Pambara-7
Nacate-3 Pambara-3
Imponge-43 Cuamba Lurio Eugenio
Mualia-1
Erati Omar
35B
Unhaphatenha
Erati Sede
Nacate
Imponge-5
75B
Mualia-3
Ncoela
41A
Ile-2
Ncoela-4
Pambara-5
Pambara-1
Ncoela-6
Ncoela-5
Gile-3

73
3.3.4 Correlations among quantitative traits
The phenotypic correlations among quantitative traits are given in Table 3.5.
Correlations between 100 seed weight and seed yield (r=0.3624, P<0.001), and
number of pods per plant and pod length (r=0.1559, P<0.01) were significant and
positive. The rest of the correlation values were not significant.
Table 3.5: Phenotypic correlation among selected quantitative traits recorded in groundnut
landraces grown at Nampula, in 2008/2009 and 2009/2010 growing seasons
Seed yield 100 seed weight Pod length Number of pods plant-1
Seed yield 1 100 seed weight 0.3624*** 1
Pod length -0.0409 0.0375 1 Number of pods plant-1 0.0491 0.0118 0.1559** 1
** Significant at P = 0.01; ***Significant at P = 0.001;

74
Figure 3.4: Dendogram of 58 landraces based on hierarchical cluster analysis using nearest neighbour method and squared Euclidean distance as
distance measure.

75
3.3.5 Evaluation under high groundnut rosette disease pressure
The infector row technique was efficient in spreading the virus among the groundnut
genotypes. The reactions recorded on the genotypes included symptomless plants, leaf
deformation, stunted plants and chlorotic plants (Figure 3.5). There were significant
(P<0.05) differences among genotypes for incidence of groundnut rosette disease
(Table 3.6 and Appendix 4). Groundnut rosette disease incidence ranged from 6.2 to
80 %. Four genotypes (PAN-4, Imponge-4, Pambara-3 and Metarica Joao) had
groundnut rosette disease incidence less than 10 %. Sixteen of the genotypes had less
than 30 % disease incidence, 21 genotypes had less than 50 % and 19 had more than
50 % of disease incidence. Genotype Namuno-1 had disease incidence of 80 %.
The mean seed yield for the genotypes ranged from 64.3 to 844.7 kg ha-1. Genotype
Nacate-1 had the highest mean seed yield of 844.7 kg ha-1 and Lurio Miguel had the
lowest seed yield (64.3 kg ha-1). About 46 % of the genotypes yielded less than
500.0 kg ha-1 in the 2010/2011 growing season and only 3 genotypes had over
700.0 kg ha-1.
The 100 seed weight ranged from 23.2 to 54.0 g. Twenty four genotypes had a 100 seed
weight less than 35.0 g and only 10 genotypes had a 100 seed weight of more than
45.0 g. Genotype Imponge-3 had the highest 100 seed weight with a mean of 54.0 g and
genotype Lurio Miguel had the lowest (23.2 g). The mean number of pods plant-1 ranged
from 71 to 142. Genotype Erati Omar with the highest number with of 142 and 16
genotypes had the lowest number of pods per plant with a mean of 71.
All genotypes had pods that were over 2.0 cm long, except Ncoela-3 and Gile-2 with 1.8
and 1.7 cm, respectively. Genotype Gile-2 had the shortest pod length with a mean of
1.7 cm while genotype Pambara-2 had the longest pod (3.1 cm).

76
Figure 3.5: Symptoms of groundnut rosette disease observed on different genotypes. A. Health
groundnut plant. B. Infected plant accompanied with leaf yellowing and plant stunting. C. Severe rosette infection showing leaf deformation and plant stunting.

77
Table 3.6: Groundnut rosette disease incidence at 60 days after planting, yield and yield components of groundnut landraces grown at Nampula, in 2010/2011 growing season
Genotype* Disease
incidence (%) Seed yield (kg ha-1)
100 seed weight (g)
Number of pods plant -1
Pod length (cm)
Top 20 landraces
PAN-4 6.2 739.8 39.0 105.5 2.8
Imponge_4 9.2 423.1 41.1 71.0 2.1
Pambara-3 9.2 240.7 38.4 71.0 2.1
Metarica Joao 9.9 432.0 30.5 77.0 2.1
Imponge-43 11.1 322.4 34.4 103.0 2.5
Pambara-6 12.9 565.3 42.1 76.0 2.4
Pambara-4 14.3 522.0 47.4 91.5 2.5
Pambara-5 15.6 149.1 28.2 106.0 2.5
Impong_1_Tom 19.6 661.3 33.6 71.0 2.2 Pambara-1 23.9 337.5 40.5 71.0 2.2 Ile-2 25.0 455.9 30.5 78.5 2.6 Gile-2 25.9 535.7 30.5 81.5 2.4 PAN-2 27.5 688.2 38.2 87.5 2.5
Nacate 29.2 299.8 39.3 79.5 2.8
35B 29.8 425.3 32.8 103.5 2.2
Pambara-7 29.8 272.7 35.9 71.0 2.5
1A 30.2 767.3 40.0 71.0 2.2
75B 30.9 338.2 30.0 72.5 1.8
Mualia 31.3 498.0 49.7 71.0 2.3 Imponge_3 33.6 271.3 38.3 71.0 2.3 Bottom 20 landraces
Erati Omar 50.0 539.5 23.8 82.5 2.9
Molocue-2 50.7 252.4 30.5 78.0 2.1
Metarica Mutara 51.7 585.0 28.9 123.0 2.4
Gile_4 52.4 315.4 30.5 112.0 2.1
Pambara-2 52.5 559.5 49.9 71.0 2.3
Ncoela-4 53.9 333.2 47.6 71.0 2.5
Nacate-2 55.0 469.5 50.3 71.0 2.6
Imponge_42 55.7 570.9 37.4 72.0 2.0
Gile-3 57.3 334.1 30.5 71.0 2.6
PAN-3 61.0 501.5 31.5 82.0 2.4
Molocue-1 61.4 461.4 30.5 91.5 3.0
Nacate_3 62.4 342.0 30.5 97.0 2.6
Imponge_2 63.1 656.7 42.9 114.0 2.7
Gile-5 63.7 266.7 30.5 71.0 2.1
Lurio Miguel 64.8 64.3 23.2 77.5 2.3
Mualia-1 65.8 280.6 40.3 104.0 2.6
Cuamba Lurio Eugenio 70.0 270.1 35.2 71.0 2.2
Ncoela-5 70.9 341.9 50.8 117.0 3.1
Unhaphatenha 71.5 441.3 38.0 111.0 2.6
Namuno-1 80.0 374.0 44.1 107.0 1.7 Check JL-24 32.6 585.2 37.6 114.5 2.4
Mean 41.0 419.0 37.3 87.3 2.4 LSD (5%) 24.5 231.7 19.3 26.8 0.8 CV (%) 26.6 15.3 23.1 21.9 12.4 *Genotypes sorted based on the disease incidence, and whole results in appendix 3.3

78
3.3.6 Correlations among quantitative traits under disease pressure
The phenotypic correlations among agro-morphological traits for the 58 groundnut
landraces under rosette disease pressure are given in Table 3.7. The correlation
between seed yield and 100 seed weight (r=0.2199, P<0.05) was significant and
positive. The rest of the correlations were not significant.
Table 3.7: Correlation between disease incidence, seed yield, 100-seed weight, number of pods
plant-1 and pod length in the local landraces grown at Nampula, in 2008/2009 and 2009/2010 growing seasons
Disease incidence
Pod length
Number of pods plant-1
100 seed weight
Pod length -0.1517 Number of pods plant-1 0.0261 0.0782 100 seed weight -0.0917 -0.0823 -0.0574 Seed yield 0.0101 -0.1536 0.1512 0.2199* *Significant at P = 0.05
3.3.7 Classification of genotypes with respect to resistance to groundnut rosette
disease
The classification of genotypes into various groups on the basis of final disease
incidence (DI) is given on Table 3.8. The genotypes that had DI values less than 10 %
and from 11 to 30 % were considered resistant and moderately resistant, respectively.
The genotypes ranging from 31 to 50 % DI were considered susceptible and those
genotypes with more than 50 % DI were considered highly susceptible.

79
Table 3.8: Classification of groundnut genotypes into groups based on disease incidence (DI)
Resistant Moderately Resistant Susceptible Highly Susceptible
PAN-4 1A Mualia Molocue-2
Imponge-4 35B JL-24 Metarica Mutara
Pambara-3 75B Imponge-3 Gile-4
Metarica Joao Ile-2 Ncoela-6 Pambara-2
Gile-2 Erati Sede Ncoela-4
Imponge-Tom-1 Mualia-3 Imponge-42
Imponge-43 Erati Mercado Gile-3
Nacate Ncoela-1 Molocue-1
Pambara-1 Ile-1 Nacate-3
Pambara-4 41A Imponge-2
Pambara-5 Imponge-5 Gile-5
Pambara-6 Imponge-2A Lurio Miguel
Pambara-7 Ncoela-2 Mualia-1
PAN-2 PAN-5 Cuamba Lurio Eugenio
Gile-1 Ncoela-5
Mualia-2 Unhaphatenha
Ncoela-3 Namuno-1
Nacate-1
PAN-1
Ncoela
Erati Omar
3.4 Discussion
Significant variation was observed amongst the landraces for most of the traits studied,
except flower colour where all the 58 landraces had yellow-orange flowers. The
landraces had stems with green, purple or a mixture of the two colours. Leaflet shapes
of these landraces were classified as obovate, lanceolate, wide-elliptic and
oblong-elliptic. Pod beak was classified as prominent, moderate and slight. Pod
constriction varied between very deep, deep, moderate, slight and none. Most of the
genotypes had moderate pod constriction. Growth habit varied from erect to decumbent-
3. Most of the genotypes had decumbent-2 growth habit. The seed colour, pod size and
100 seed weight data indicated that in the northern region of Mozambique, various
groundnut market types are present. Most of the genotypes in this region had either big
pods or small pods and purple seed colour. This variation of morphological
characteristics suggested that landraces grown in Mozambique come from different
80
gene pools. Groundnut in Mozambique is believed to have been introduced from Brazil
and India by the Portuguese (Higgins, 1951; Krapovickas and Gregory, 1994;
Upadhyaya et al., 2006).
Under low disease pressure, the positive correlation between seed yield and 100 seed
weight was significant (r=0.3624, P<0.001), which indicated that high yielding genotypes
also had high 100 seed weight. The positive and high correlation between pod size and
pod length (r=0.6874, P<0.001) found in this study suggested that the size of a pod is
dependent on its length, and the correlation between 100 seed weight and growth habit
(r=-0.1601, P<0.001) suggested that a weight of 100 seeds could be dependent on the
growth habit. Upadyaya (2005) and Upadyaya et al. (2006) found positive correlation
between 100 seed weight and pod yield per plot when studying the variability for drought
resistance related traits in the mini core collection and sources of early maturity in a core
collection of groundnut, respectively.
In this study and based on selected characteristics, 6 different clusters were identified at
a 20-distance of level of dissimilarity among genotypes. This suggests that the
genotypes show high phenotypic diversity and can therefore be used in the hybridization
and selection programmes for various traits (Swamya et al., 2003) in addition to
groundnut rosette disease resistance.
There was a low mean seed yield obtained from most of the groundnut genotypes
evaluated. Almost all landraces attained about the average yield obtained by
Mozambican smallholder groundnut producers of 600 to 800 kg ha-1. These yields are
quite low compared to the African average yield (900 kg ha-1) and the American average
yield of about 3000 kg ha-1 (FAOSTAT, 2011). These low yields suggest that there are
opportunities for groundnut improvement in Mozambique, in order to raise presently
attained yields.
The groundnut genotypes were categorized into resistance groups based on disease
incidence (Waliyar et al., 2007). The reactions of the genotypes observed during the
experiment consisted of symptomless plants, deformed leaves, stunted plants and
chlorotic plants (Dollet et al., 1986). The levels of infection varied significantly among the
genotypes.

81
The genotypes were grouped into four groups on the basis of percentage of disease
incidence: resistant (0-10 %); moderately resistant (11-30 %); susceptible (31-50 %) and
highly susceptible (>50 %). Based on this grouping, genotypes PAN-4, Imponge-4,
Pambara-3, Metarica Joao were classified as resistant to groundnut rosette disease.
However, these results do not suggest that the resistant category was absolute even for
plants with no visual rosette symptoms because seasonal effects associated with
temperature and relative humidity can have an effect on the disease development in the
plant (Schuerger and Hammer, 1995). In addition, groundnut plants that show no
symptoms may be infected by one or more components of the virus complex (Bock et
al., 1990) since these symptoms are associated with infection by groundnut rosette
disease but are caused by a satellite RNA (Murant et al., 1988; Murant and Kumar,
1990).
3.5 Conclusion
There was high phenotypic diversity among evaluated landraces. This variation on
morphological characteristics suggested that landraces grown in Mozambique come
from different gene pools and can, therefore, be used in the hybridization and selection
programmes. The results showed considerable genetic variability for resistance to
groundnut rosette disease among genotypes. In this respect, four landraces were
classified as resistant and could be used in breeding programmes as sources of
groundnut rosette disease resistance. There was no association between seed yield and
groundnut rosette disease incidence. The lack of correlation between yield and disease
incidence does not suggest that the disease did not influence the yield. It may be that
yield was already affected due to late planting, and other factors which could not be
isolated.

82
References
Arias, F.J. and M.L. Libombo. 1994. Groundnut Evaluation in Mozambique: Preliminary
Results from the 1993/94 Season in Maputo Province, Maputo, Mozambique.
Bock, K.R., A.F. Murant and R. Rajeshwari. 1990. The nature of the resistance in
groundnut to rosette disease. Annals of Applied Biology. 117:379-384.
Dollet, M., J. Dubern, C. Fauquet, J.-C. Thouvenel and A. Bockelee-Mowan. 1986.
Groundnut viral disease in West Africa. Tropical Agriculture Research Center,
Ministry of Agriculture, Forestry and Fisheries, JAPAN.
Higgins, B.B. 1951. Origin and Early History of the Penaut. In: Higgins, B.B. (Ed.). The
Peanut - Unpredictable Legume. The National Fertilizer Association.
Washimgton, DC. pp. 118-127.
IBPGR and ICRISAT. 1992. Descriptors for Groundnut International Board for Plant
Genetic Resources, Roma, Italy, and International Crops Research Institute for
the Semi-Arids Tropics, Patancheru, India. Roma, Italy.
ICRISAT. 1991. Groundnut Rosette Virus Diseases in Africa. Fourth Meeting of the
Consultative Group on Collaborative Research on Groundnut Rosette Virus
Disease, ICRISAT, Montpellier, France.
Krapovickas, A. and W.C. Gregory. 1994. Taxonomia del genero Arachis
(Leguminosae). Bonplandia. 8.
Muitia, A. 2005. Combination of Root-Knot Nematodes (Meloidogyne spp.) Resistance
and Edible Seed Quality for Peanut (Arachis hypogaea L.) Production in
Mozambique and in the U.S., Plant and Soil Science, Texas Tech University,
Lubbock, Texas. pp. 64.
Murant, A.F. and T.I.I.K. Kumar. 1990. Different variants of the satellite of groundnut
rosette virus are responsible for the chlorotic and green forms of groundnut
rosette disease. Annals of Applied Biology. 117:85-92.

83
Murant, A.F., R. Rajeshwari, D.J. Robinson and J.H. Raschke. 1988. A satellite RNA of
groundnut rosette virus that is largely responsible for symptoms of groundnut
rosette disease. Journal of General Virology. 69:1479-1486.
Naidu, R.A., H. Bottenberg, P. Subrahmanyam, F.M. Kimmins, D.J. Robinson and J.M.
Thresh. 1998. Epidemiology of groundnut rosette virus disease: current status
and future research needs. Annals of Applied Biology. 132:525-548.
Naidu, R.A., F.M. Kimmins, C.M. Deom, P. Subrahmanyam, A.J. Chiyembekeza and
P.J.A.v.d. Merwe. 1999. Groundnut rosette: a virus disease affecting groundnut
production in sub-Saharan Africa. Plant Disease. 83:700-709.
Ntare, B.R., J. Ndjeunga, F. Waliyar, O. Kodio, C.A. Echekwu, K. I., A. Da Sylva, A.T.
Diallo, A. Amadou, H.Y. Bissala and K.p. Sako. 2007. Farmer Participatory
Evaluation and Dissemination of Improved Groundnut Varieties in West Africa.
International Crops Research Institute for the Semi-Arid Tropics., Bamako, Mali.
Payne, R.W., D.A. Murray and S.A. Harding. 2011. An Introduction to the GenStat
Command language, VSN International, Hemel Hempstead, UK.
Schuerger, A.C. and W. Hammer. 1995. Effects of temperature on disease development
of tomato mosaic virus in Capsicum annum in hydroponic systems. Plant
Disease. 79:880-885.
Swamya, B.P.M., H.D. Upadhyaya, P.V.K. Goudara, B.Y. Kullaiswamya and S. Singh.
2003. Phenotypic variation for agronomic characteristics in a groundnut core
collection for Asia. Field Crops Research. 84:359-371.
Upadhyaya, H.D. 2005. Variability for drought resistance related traits in the mini core
collection of peanut. Crop Science.45:1432-1440.
Upadhyaya, H.D., L.J. Reddy, C.L.L. Gowda and S. Singh. 2006. Identification of diverse
groundnut germplasm: Sources of early maturity in a core collection. Field Crops
Research. 97:261-271.

84
Waliyar, F., P.L. Kumar, B.R. Ntare, E. Monyo, S.N. Nigam, A.S. Reddy, M. Ositu and
A.T. Diallo. 2007. Groundnut Rosette Disease and its Management. Information
Bulletim. 75:32.
Walker, T., R. Pitoro, A. Tomo, I. Sitoe, C. Salencia, R. Mahanzule, C. Donovan and F.
Mazuze. 2006. Priority Setting for Public-Sector Agricultural Research in
Mozambique with the National Agricultural Survey Data, IIAM, Maputo,
Mozambique.

85
IV. MULTILOCATIONAL EVALUATION OF ADVANCED GROUNDNUT LINES IN
NORTHERN MOZAMBIQUE
Abstract
Groundnut (Arachis hypogaea L.) is one of important legumes grown for cash crops in
Mozambique. However, most of groundnut producers use local landraces in part due to
lack of improved cultivars. The objective of the present study was to determine yield
stability of advanced groundnut lines response to environments. Thirty-one advanced
groundnut lines developed by the local breeding programme and the check cultivar,
Nametil, were evaluated in the 2009/2010 and 2010/2011 growing seasons in
randomized complete block design at three locations (Nampula, Namapa and
Mapupulo). Three main primary seed colours (off-white, tan and purple) were found.
Genotypes were significantly (P≤0.01) different for all traits. Effects due to Year and
Environment were significant (P≤0.01) for seed yield, rosette, maturity and 100 seed
weight. Genotype effects were significant (P≤0.01) for seed yield, rosette, maturity, 100
seed weight and plant height. Genotype X Environment interactions were significant
(P≤0.01) for rosette and 100 seed weight. The average plant height was 21.4 cm.
Genotype 26B was the tallest (40.2 cm) and genotype 32A was the shortest (14.7 cm).
All genotypes had a 100 seed weight over 30.0 g, except 41A and 75B which had a 100
seed weight less than 30.0 g. Genotype 40A had the highest 100 seed weight (44.6 g).
Over 90 % of the lines had 1 -2 seeds per pod. About 2/3 of the genotypes had over
60 % pod maturity. Genotype 72B had the highest pod maturity (90.6 %) and genotype
27A had the lowest (44.4 %). The mean yield was 1811.0 kg ha-1 and ranged between
1353.3 and 2165.9 kg ha-1. The highest yielding genotype was 23A (2165.9 kg ha-1)
while 75B (1353.3 kg ha-1) gave the lowest yield. Twelve genotypes outyielded the check
cultivar (Nametil). The groundnut rosette disease incidence across environments in
general was very low (0.4 and 6.5 %). Seed yield was positively correlated to 100 seed
weight (r=0.368, P≤0.01), and negatively correlated to groundnut rosette disease (r=-
0.127, P≤0.01). Genotype 35B was the most stable across environments since it had
coefficient of regression around unity (bi=1.024), high coefficient of determination
(R2=0.999) and above average yield (13 % above average seed yield). Therefore,
genotype 35B is ideal for cultivation across northern Mozambique.
Keywords: Mozambique, Arachis hypogaea, groundnut rosette disease, biplot, stability
GGE, and G X E interaction

86
4.1 Introduction
Groundnut (Arachis hypogaea L.) occupies the largest area among the grain legumes in
Mozambique (Arias and Libombo, 1994). It is the most important oilseed crop followed
by cotton (Gossypium hirsutum) and sunflower (Helianthus annuus). It is estimated that
groundnut is cultivated on about 332.000 hectares, which correspond to about 9 % of the
total cropped area in Mozambique (INE, 2005), and it is the third most important crop
after maize (Zea mays L.) and cassava (Manihot esculenta). The main producing
province is Nampula, followed by Cabo Delgado, Zambezia, Inhambane and Gaza.
Groundnut is one of the major cash crops and the main source of vegetable proteins for
over 90% of rural families in Mozambican (ADAP-SF, 2006). Groundnut production in
Mozambique fluctuates annually due to uncertain rainfall pattern and sensitive behaviour
of the genotypes to different environmental conditions. Stability performance of
groundnut cultivars is required for successful cultivation across different environments.
Identification of superior cultivars incorporating stability and yield is important for the
purpose of selecting cultivars which will give better yields consistently.
A number of concepts of stability and techniques for computing simultaneously high yield
and stability parameters have been proposed, compared and used in various crops by
many scientists. The technique most often used in measuring and comparing cultivar
stabilities is regression analysis whereby the genotypic mean is regressed on the
environmental means (environmental index) and the coefficient of regression of a
cultivar measures the sensitivity or response of the cultivar to changes of environments
(Zhang and Geng, 1986).
Several versions of this technique have been proposed, and some include deviations
from the fitted regression as measure of stability (Finlay and Wilkinsons, 1963; Eberhart
and Russell, 1966; Perkins and Jinks, 1968). In this model, regression coefficient (b=1))
is considered as measure of response and deviation mean square (S2d=0) as measure
of stability. Recently, genotype main effect plus genotype by environment interaction
(GGE) biplot analysis has been proposed as graphical method to study stability (Yan et
al. 2007). The main objective of the present study was to determine yield stability and
the pattern of response of advanced lines across environments in northern Mozambique.

87
4.2 Materials and methods
4.2.1 Study area
The study was carried out at three locations (Nampula, Namapa and Mapupulo) in
northern Mozambique in the 2009/2010 and 2010/2011 growing seasons. Nampula
Research Station is located about 7 km east of Nampula town and lies at 15º 09’ 00’’S,
39º 30’ E and 432 m.a.s.l. The soil type is sandy loam and the vegetation is
predominantly grassland. The annual precipitation is slightly over 1000 mm from
November/December to April/May with its pack in January. The maximum temperature
in the district is about 39.9o C and the minimum temperature is 19o C.
Namapa Research Station is located about 8 km west of Nampa town in Erati district
about 250 km north of Nampula and lies at 13° 43' 41" S, 39° 50' 41" E and 500 m.a.s.l.
The soils are sandy loam, deep and well-drained. It receives annual precipitation
between 800 and 1200 mm between October to April, with heavy rains occurring in
January and February. Annual average temperature is between 20 and 250C.
Mapupulo is located about 12 km west of Montepuez town about 200 km west of Pemba,
which lies at 13o 13’ S, 39o 03’ E and 535 m.a.s.l. The soils are clay loam and deep
brown loam. It receives annual precipitation of 1200 mm in average from
November/December to April/May, and the average temperature is between 20 and
25o C.
4.2.2 Groundnut genotypes evaluated
A total of thirty-two genotypes (31 advanced lines and 1 check) were used in the study.
The advanced lines resulted from crosses made in the USA in 2002 between two
Spanish-type low Oleic/Linoleic ratio groundnut cultivars (PI 268573 and PI 268673) and
one Spanish-type high oleic peanut cultivar (OLin) and one runner type high oleic
cultivar (Tamrun OL01) in order to develop groundnut populations with high oleic fatty
acid content and adapted to Mozambique. The two low oleic cultivars were introduced
from Zambia into the USA and obtained from the Southern Regional Plant Introduction
Station in Griffin, GA; the two high oleic cultivars were from the USA. Cultivars from
Zambia were used because no homozygous groundnut cultivars from Mozambique were
available, and Zambian cultivars are generally adapted to Mozambique. Both high oleic
cultivars were released in 2002 (Simpson et al., 2003a; Simpson et al., 2003b) by the

88
Texas A&M University. The procedure described by López et al. (2001) was used for oil
analysis and the F2 progeny having Oleic/Linoleic ratio values of 9:1 or higher were
selected in 2004 for evaluation in Mozambique starting in 2005. In the 2009, when this
study began, these lines were in the F7 generation.
4.2.3 Field establishment
The study was carried out during two growing seasons (2009/2010 and 2010/2011)
Nampula, Namapa and Mapupulo. The test materials were evaluated using a
randomized complete block design with four replications. The replicates were separated
by 2 m alleys. An individual genotype was planted in 6 m long and 6 row plots at spacing
of 0.45 m between rows and 0.15 m within row. The experiments were established
between 15th December and 5th January at the onset of the rains. The seeds were sown
at a depth of 5 cm. The fields were kept weed free by hand weeding. No fertilizer,
pesticides or supplementary water were applied, and no seed treatment before planting
was applied.
4.2.4 Data collection
Data were collected on plant height, 1-2 seeds pod-1, primary seed colour, 100 seed
weight, pod maturity, seed yield, and groundnut rosette disease incidence. Plant height
(cm) was taken at 70 days after emergence from soil surface to top of the main axis of
plant.
A random sample of 50 pods genotype-1 was taken and pods were divided into two
groups: one group with pods containing 1 or 2 seeds; the other group with pods
containing 3 or more seeds. The number of pods in each of the two groups was counted
and the data converted into percentage.
Primary seed colour was recorded from dry, mature and wrinkle-free seeds for each
genotype. Colours were assigned based on the descriptors for groundnut that were
described by IBPGR and ICRISAT (1992). The 100 seed weight was obtained from a
random sample of 100 mature seeds for each genotype.
The internal shell-out method was used to estimate genotype maturity. Fifty randomly
selected pods were shelled and sorted into white, yellow, orange, brown and black

89
categories, depending on the colour on the inner side of the shell wall. Mature pods were
considered to be those with some orange, brown or black colouring inside the shell,
while immature pods had white or yellow colouring inside the shell.
Yield was determined for each advanced line at the end of the maturity period by
shelling and weighing the dried seeds. Seed weight, measured in kg m-2, was converted
to kg ha-1.
Individual plants from each advanced line were monitored for presence or absence of
virus symptom at 60 days after planting. Disease incidence (DI) for each genotype was
calculated as the percentage of plants with rosette symptoms (Waliyar et al., 2007).
4.2.5 Data analysis
The data on yield, yield-related traits and groundnut rosette disease incidence were
analyzed using the Genstat 14 statistical software (Payne et al., 2011). The following
statistical model was used to analyse the combined data:
Where: Yijkl = observed landrace response; µ = overall population mean; Ei = Effect of
the ith environment; Gl = Effect of the lth genotype; Yj = Effect of the j
th year; EYij =
Interaction effect of the ith environment and the jth year; Rk(ij) = Effect of the kth replication
in the ith environment; GEil = Interaction effect of the lth genotype and the ith environment;
GYjl = Interaction effect of the lth genotype and the jth year; GEYijl = Interaction effect of
the lth genotype, ith environment and jth year; εijkl = Experimental error.
Where G was considered as fixed effect and E, Y, GY, GE and GEY were considered as
random effects.
Mean separation was performed using Fisher’s protected least significant difference
(LSD) where the main effects were significant of 95 % of confidence level. GGE analysis
was performed using yield data to determine the genotype x environment relationship
among test environments and among genotypes (Gauch and Zobel, 1997; Yan et al.,
2001; Yan and Rajcan, 2002).

90
Linear regressions were carried out for each of the cultivar based on the Eberhart and
Russell (1966) method whereby each advanced line was regressed over the means of
the three environments which are considered as environmental indices. According to this
method, regression coefficient (b=1) and deviation from regression or variance deviation
(var-dev=0) indicates stability. In this analysis, var-dev is the error mean square of the
regression analysis as suggested by Alwala et al. (2010).
Phenotypic correlations between disease incidence and yield components were
determined using Pearson’s correlation procedure in SPSS 19 to determine whether
there is causal relationship between the two.
4.3 Results
4.3.1 Combined data across locations and seasons
4.3.1.1 Analysis of variance
Results on analysis of variance across years and locations are presented in Table 4.1.
The results indicated that there were highly significant differences (P≤0.001) among
genotypes for most traits studied, except groundnut rosette disease incidence which was
significantly different at P≤0.01. The effects due to year and environment were
significant (P≤0.001) for seed yield, maturity and 100 seed weight. However, significant
(P≤0.001) effects due to environment were also observed for rosette. In this study, the
genotypic effects were significant (P≤0.001) for seed yield, rosette, 1-2 seeds pod-1,
maturity, 100 seed weight and plant height. In the first order of interaction effects due to
year by environment interaction were significant (P≤0.001) for seed yield, maturity and
100 seed weight while the genotype by environment interaction were significant
(P≤0.001) for rosette and 100 seed weight.
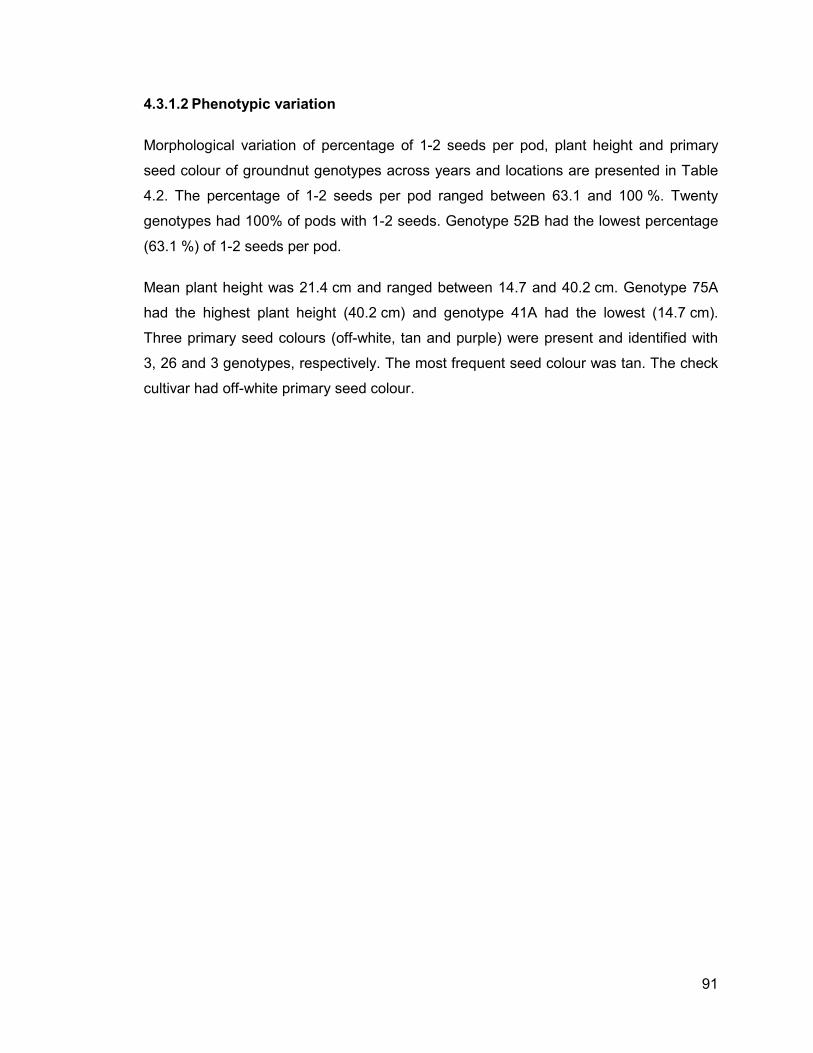
91
4.3.1.2 Phenotypic variation
Morphological variation of percentage of 1-2 seeds per pod, plant height and primary
seed colour of groundnut genotypes across years and locations are presented in Table
4.2. The percentage of 1-2 seeds per pod ranged between 63.1 and 100 %. Twenty
genotypes had 100% of pods with 1-2 seeds. Genotype 52B had the lowest percentage
(63.1 %) of 1-2 seeds per pod.
Mean plant height was 21.4 cm and ranged between 14.7 and 40.2 cm. Genotype 75A
had the highest plant height (40.2 cm) and genotype 41A had the lowest (14.7 cm).
Three primary seed colours (off-white, tan and purple) were present and identified with
3, 26 and 3 genotypes, respectively. The most frequent seed colour was tan. The check
cultivar had off-white primary seed colour.

92
Table 4.1: Combined analysis of variance for seed yield, groundnut rosette disease incidence, pod maturity, 100 seed weight and plant height of
groundnut advanced lines evaluated across 3 environments over 2 years
Source of variation df
Mean squares
Seed yield Rosette 1-2 seeds Maturity 100 seed weight Plant height Year (Y) 1 125907299.1*** 11.1 1.2 5002.1*** 716.9*** 1.3 Environment (E) 2 13335503.2*** 2241.5*** 3.5 15006.3 *** 602.9*** 3.9 Y X E 2 44809843.4*** 12.8 1.2 5002.1*** 1228.5 *** 1.2 Rep(Y X E) 18 15479953.5 137.3 81.9 878.6 194.9 476.8 Genotype (G) 31 1032106.8*** 64.5** 3142.7*** 2670.0*** 268.7 *** 876.3*** G X E 62 356516.5 60.3*** 13.9 404.2 45.8*** 0.2 G X Y 31 871316.5** 6.9 4.7 134.7 22.7 0.1 G X E X Y 62 308893.1 2.1 4.7 134.7 24.6 0.1 Pooled error 558 457365.6 34.1 82.2 373.5 21.9 57.1
CV (%) 37.4 27.2 9.2 29.4 12.9 35.3 ** Data significant at P = 0.01; ***Data significant at P = 0.001

93
Table 4.2: Morphological variation of 1-2 seeds per pod, plant height and primary seed colour of groundnut genotypes combined over two seasons and three locations
Genotype 1- 2 seeds per pod (%) Plant height (cm) Seed colour
19A 95.0 23.4 8.0 (Dark tan)
32A 100.0 21.9 2.0 (Off-white)
21A 100.0 15.9 8.0 (Dark tan)
75B 88.8 19.6 8.0 (Dark tan)
31A 100.0 17.9 8.0 (Dark tan)
45B 100.0 25.4 5.0 (Pale tan)
34A 100.0 16.4 8.0 (Dark tan)
26B 100.0 14.8 8.0 (Dark tan)
52B 100.0 14.8 5.0 (Pale tan)
1A 100.0 16.5 5.0 (Pale tan)
17A 100.0 23.5 5.0 (Pale tan)
23A 68.1 19.4 6.0 (Light tan)
6A 85.0 40.2 5.0 (Pale tan)
35B 96.9 14.9 6.0 (Light tan)
24A 100.0 26.8 6.0 (Light tan)
41A 100.0 16.4 8.0 (Dark tan)
15A 100.0 14.7 8.0 (Dark tan)
37A 100.0 18.8 8.0 (Dark tan)
72B 100.0 21.2 8.0 (Dark tan)
27A 100.0 33.1 6.0 (Light tan)
8A 100.0 16.7 5.0 (Pale tan)
16A 95.0 20.6 5.0 (Pale tan)
13A 100.0 21.4 5.0 (Pale tan)
10A 64.4 26.9 17.0 (Purple)
28A 100.0 21.5 6.0 (Light tan)
4A 63.1 30.2 17.0 (Purple)
33A 99.4 16.8 8.0 (Dark tan)
20A 100.0 18.1 8.0 (Dark tan)
25B 100.0 23.8 2.0 (off-white)
40A 70.6 32.0 17.0 (Purple)
Nametil 99.4 20.6 5.0 (Pale tan)
5A 88.1 20.1 2.0 (Off-white)
Mean 94.3 21.4 7.1
LSD 4.6 3.7 2.1
CV(%) 6.15 16.7 0.8

94
4.3.1.3 Yield, yield components and rosette disease incidence
Mean seed yield, 100 seed weight, pod maturity and groundnut rosette disease
incidence are presented in Table 4.3 and appendix 5. The results showed that
genotypes were significantly different (P≤0.05) for all traits. The mean yield across the
three locations over two years was 1811 kg ha-1 and ranged between 1353.3 and
2165.9 kg ha-1. The highest yielding genotype was 23A (2165.9 kg ha-1), and the lowest
was 20A (1353.3 kg ha-1).
The mean 100 seed weight over across locations over the two years was 36.4 g and
ranged between 29.9 and 44.6 g. All genotypes had a 100 seed weight over 30.0 g,
except 41A and 75B which had a 100 seed weight less than 30.0 g. Genotype 40A had
the highest 100 seed weight (44.6 g) and genotypes 41A and 75B had the lowest 100
seed weight (29.9 g).
Most of the genotypes across the three locations and two seasons had over 60% mean
pod maturity, and it ranged between 90.6 and 44.4 %. Genotype 72B had the highest
pod maturity (90.6 %) and genotype 27A had the lowest (44.4 %).
The groundnut rosette disease incidence across the three locations over two years was
generally very low and it ranged between 0.4 and 6.5 %. Genotype 15A had the highest
disease incidence (6.5 %) and genotype 75B had the lowest (0.4 %).

95
Table 4.3: Mean seed yield, 100 seed weigth, pod maturity and groundnut rosette disease
incidence of advanced lines across locations and two seasons
Genotype Seed yield (kg ha-1) 100 seed weight (g) Maturity (%) Rosette incidence (%)
10A 1457.0 36.3 71.3 4.1
13A 2013.9 29.9 81.9 0.8
15A 1704.9 39.1 73.8 3.3
16A 1782.4 44.6 56.3 6.5
17A 1690.6 37.5 50.6 2.5
19A 2066.9 37.9 66.9 1.6
1A 2099.3 38.6 58.1 2.2
20A 2045.8 37.5 63.1 0.4
21A 1868.9 36.5 68.8 5.4
23A 2165.9 36.6 68.1 3.0
24A 1626.8 31.9 67.5 4.3
25B 1702.6 33.5 67.5 1.5
26B 1948.1 37.1 71.3 1.8
27A 1840.5 38.9 44.4 3.5
28A 1995.4 36.0 58.1 1.7
31A 1879.9 39.8 55.6 2.0
32A 1492.7 37.1 55.0 2.2
33A 1839.8 41.2 69.4 5.2
34A 1894.2 39.6 71.9 0.9
35B 2086.4 29.9 81.9 0.6
37A 1829.3 39.0 71.3 3.0
40A 1591.7 34.5 61.9 0.8
41A 1584.3 37.4 62.5 6.4
45B 1711.5 34.7 61.3 1.3
4A 2017.4 36.6 61.9 2.4
52B 1428.6 35.0 56.3 3.9
5A 1882.8 38.2 46.3 1.3
6A 1828.4 38.5 70.0 1.8
72B 1820.3 29.8 90.6 2.7
75B 1353.3 34.4 72.5 2.4
8A 1810.7 35.0 65.6 1.6
Nametil 1876.8 31.6 85.0 1.0
Mean 1811 36.4 65.8 2.6
LSD (5%) 381.7 2.8 10.5 3.2
CV (%) 18.1 8.2 13.7 11.3

96
4.3.2 Data for individual locations
4.3.2.1 Analysis of variance
Results on analysis of variance of each location are presented in Table 4.4a,b and c.
The results indicated that there were highly significant differences (P≤0.001) among
genotypes for most traits studied. Years and year x genotype interactions were not
significantly (P≥0.05) different for percentage of 1-2 seeds per pod and plant height for
the three locations. Genotypes were significantly different for all traits, except seed yield
in Nampula.

97
Table 4.4a: ANOVA Table for Nampula data
*Data significant at P=0.05; ** Data significant at P = 0.01; ***Data significant at P = 0.001
Table 4.4b: ANOVA Table for Mapupulo data
Source of variation df Seed yield Rosette 1-2 seeds Maturity 100 seed weight Plant height
Year (Y) 1 36797493.4*** 36.7*** 3.5 15006.3*** 31.6 3.9
Rep(Y) 6 16071836.1 3.0 81.9 878.6 230.3 476.8
Genotype (G) 31 472006.44* 5.2** 1047.6*** 890.0*** 131.9*** 292.1***
G X Y 31 1009574.08* 5.7*** 14.0 404.2 32.2 0.2
Pooled error 186 586347.7 2.5 82.2 373.5 22.5 57.1
*Data significant at P=0.05; ** Data significant at P = 0.01; ***Data significant at P = 0.001
Table 4.4c: ANOVA Table for Namapa data Source of variation df Seed yield Rosette 1-2 seeds Maturity 100 seed weight Plant height
Year (Y) 1 119152995.1*** 0.1*** 0.0 0.0 1971.1*** 0.0
Rep(Y) 6 11519355.2 1.0 67.0 788.7 163.5 305.7
Genotype (G) 31 381554.1* 3.9** 749.9*** 1240.9*** 43.0*** 199.3***
G X Y 31 319685.7 3.7** 0.0 0.0 18.4 0.0
Pooled error 186 282878.1 2.0 61.5 340.5 16.4 38.2
*Data significant at P=0.05; ** Data significant at P = 0.01; ***Data significant at P = 0.001
Source of variation df Seed yield Rosette 1-2 seeds Maturity 100 seed weight Plant height
Year (Y) 1 178729492.6*** 0.1 0.0 0.0 2956.6*** 0.0
Rep(Y) 6 17279032.8 1.5 100.5 1183.0 245.2 458.5
Genotype (G) 31 572331.1 5.9** 1124.8*** 1861.3*** 64.5*** 298.89***
G X Y 31 479528.6 5.5** 0.0 0.0 27.6 0.0
Pooled error 186 424317.1 3.0 92.3 510.7 24.6 57.3

98
4.3.2.2 Mean yield, yield components and rosette disease incidence
Mean yield and 100 seed weight over the two years across locations are presented in
Table 4.5a. The results showed that genotypes were significantly (P<0.05) different for
all traits, except for seed yield in Nampula. In Namapa, the mean seed yield over the two
years was 2037 k gha-1 and ranged between 1462.9 and 2496.3 kg ha-1. The highest
yielding genotype was 20A (2496.3 kg ha-1), and the lowest yielding genotype was 32A
(1462.9 kg ha-1). For Mapupulo, the mean seed yield was 1814 kg ha-1 and ranged
between 1208.3 and 2349.8 kg ha-1. Genotype 28A had the highest seed yield with
2349.3 kg ha-1, genotype 16A had the lowest mean seed yield with 1208.3 kg ha-1.
In Nampula, the 100 seed weight was 34.9 g and ranged between 29.4 and 40.0 g.
Genotypes 40A and 26B had the highest 100 seed weight (40.0 g) and genotype 41A
had the lowest (29.4 g). The mean 100 seed weight in Namapa was 38.0 g and ranged
between 30.0 and 46.3 g. Genotype 40A had the highest 100 seed weight and genotype
41A had the lowest (30.0 g). For Mapupulo, the average mean 100 seed weight was
36.2 g where the highest 100 seed weight was observed in genotype 40A (47.6 g) and
the lowest in genotype 52B (27.0 g).
Mean pod maturity and groundnut rosette incidence are presented in Table 4.5b. In
Nampula, pod maturity was 58.2 % and ranged between 33.8 and 90.0 %. Genotype
72B had the highest pod maturity (90.0 %) and genotype 27A had the lowest (33.8 %).
The mean pod maturity percentage in Namapa was 65.8 % and ranged between 44.4
and 90.6 %. Genotype 72B had the highest pod maturity (90.6 %) and genotype 27A
had the lowest (44.4 %). In Mapupulo, mean pod maturity was 73.3 % and ranged
between 48.8 and 92.5 %. Genotype 13A had the highest pod maturity (92.5 % and
genotype 5A had the lowest (48.8 %).
In Nampula, the disease incidence was 1.1 % and ranged between 0.0 and 4.1 %.
Genotype 72B had the highest disease incidence (4.1 %) and genotypes Nametil and 8A
had the lowest (0.0 %). For Namapa, the mean disease incidence was 0.7 % and ranged
between 0.0 and 3.6 %. Genotype 72B had the highest disease incidence (3.6 % and
genotypes 52B, 21A, 75B, 32A, 16A, 17A, 8A and Nametil had the lowest (0.0 %). The
mean disease incidence in Mapupulo was 5.9 % and ranged between 0.4 and 6.8 %.

99
Genotype 15A had the highest disease incidence (6.5 %) and genotype 75B had the
lowest (0.4 %).
Table 4.5a: Mean seed yield and 100 seed weight of advanced lines grown at three locations and
two seasons
Genotype
Seed yield (kg ha-1) 100 seed weight (g)
NPLns NMP* MPL* NPL* NMP* MPL* 10A 1377.5 1676.3 1317.1 38.1 38.8 32.1 13A 1836.0 2279.8 1925.9 29.4 30.0 30.3 15A 1452.4 1887.2 1775.1 33.8 41.3 42.4 16A 1433.8 1868.4 2045.0 40.0 46.3 47.6
17A 1348.1 1876.8 1846.9 35.6 39.4 37.4
19A 1970.3 2185.2 2045.3 35.0 39.4 39.4
1A 1681.1 2393.0 2223.8 36.9 41.3 37.8
20A 1873.6 2496.3 1767.5 35.6 40.0 36.9
21A 1862.8 2246.3 1497.7 38.8 37.5 33.1
23A 2234.6 2370.1 1892.9 35.0 38.1 36.6
24A 1634.5 1893.4 1352.4 31.9 33.1 30.8
25B 1461.9 2091.3 1554.7 30.6 34.4 35.5
26B 1443.0 2181.3 2219.9 36.9 38.1 36.3
27A 1529.2 1939.2 2053.2 38.1 42.5 36.0
28A 1785.5 2072.2 2128.5 32.5 33.1 42.5
31A 1240.2 2049.6 2349.8 36.3 40.6 42.5
32A 1371.5 1462.9 1643.5 33.8 39.4 38.3
33A 1495.0 2019.4 2004.9 37.5 45.0 41.1
34A 1642.0 2251.3 1789.5 40.0 41.3 37.6
35B 1846.0 2312.9 2100.2 30.6 30.6 28.4
37A 1709.6 1972.0 1806.2 36.9 41.3 38.9 40A 1521.5 1731.6 1521.9 31.9 32.5 39.3 41A 1447.1 1727.1 1578.8 36.3 40.0 35.9 45B 1269.7 1870.9 1993.8 34.4 36.3 33.5 4A 1875.2 2379.9 1797.1 35.6 37.5 36.6
52B 1158.8 1918.5 1208.3 35.6 35.6 33.6 5A 1727.0 2094.4 1827.1 35.6 40.6 38.3
6A 1201.1 2184.6 2099.5 35.6 42.5 37.4 72B 1556.7 1809.8 2094.5 30.0 32.5 27.0 75B 1034.2 1718.9 1306.7 34.4 35.0 33.8 8A 1765.0 2118.2 1549.0 35.6 39.4 30.1 Nametil 1791.4 2103.4 1735.6 30.6 33.1 31.0 Mean 1581.0 2037.0 1814.0 34.9 38.0 36.2 LSD 889.0 792.6 548.5 5.5 4.8 4.2 CV 21.3 18.9 15.6 13.2 11.7 8.8 NPL=Nampula; NMP=Namapa; MPL=Mapupulo; ns=Data not significant; *=Data significant at P=0.05

100
Table 4.5b: Mean pod maturity and groundnut rosette disease incidence of advanced lines grown at three locations and two seasons
Genotype
Maturity (%) Rosette incidence (%)
NPL* NMP* MPL* NPL* NMP* MPL*
10A 63.8 71.3 78.8 4.1 3.6 4.8
13A 71.3 81.9 92.5 0.0 0.0 2.3
15A 76.3 73.8 71.3 1.1 0.5 8.3
16A 45.0 56.3 67.5 1.7 1.5 16.4
17A 41.3 50.6 60.0 0.5 0.0 7.0
19A 67.5 66.9 66.3 1.3 0.8 2.7
1A 42.5 58.1 73.8 2.6 2.0 2.1
20A 53.8 63.1 72.5 0.4 0.0 0.8
21A 58.8 68.8 78.8 1.4 0.7 14.0
23A 55.0 68.1 81.3 0.4 0.3 8.3
24A 70.0 67.5 65.0 2.1 1.9 8.9
25B 65.0 67.5 70.0 1.3 0.2 3.1
26B 73.8 71.3 68.8 1.4 0.3 3.7
27A 33.8 44.4 55.0 1.5 1.1 8.0
28A 40.0 58.1 76.3 0.9 0.5 3.8
31A 48.8 55.6 62.5 0.4 0.1 5.3
32A 36.3 55.0 73.8 2.3 1.2 3.2
33A 66.3 69.4 72.5 0.6 1.1 14.0
34A 67.5 71.9 76.3 1.7 0.6 0.6
35B 80.0 81.9 83.8 0.0 0.0 1.9
37A 65.0 71.3 77.5 1.1 1.6 6.3
40A 41.3 61.9 82.5 1.2 0.3 0.9
41A 58.8 62.5 66.3 0.2 0.0 19.1
45B 52.5 61.3 70.0 1.1 0.3 2.5
4A 38.8 61.9 85.0 0.7 0.0 6.5
52B 38.8 56.3 73.8 0.1 0.0 11.5
5A 43.8 46.3 48.8 0.6 0.0 3.2
6A 67.5 70.0 72.5 0.7 0.2 4.6
72B 90.0 90.6 91.3 1.3 1.3 5.4
75B 70.0 72.5 75.0 0.4 0.3 6.5
8A 53.8 65.6 77.5 0.2 0.1 4.4
Nametil 85.0 85.0 85.0 0.9 0.7 1.5
Mean 58.2 65.8 73.5 1.1 0.7 5.9
LSD 22.1 19.2 14.0 1.7 1.7 8.9
CV(%) 21.3 18.6 13.2 15.4 16.1 24.9 NPL=Nampula; NMP=Namapa; MPL=Mapupulo; *=Data significant at P= 0.05

101
4.3.3 Correlations among agro-morphological traits
The phenotypic correlations among agro-morphological traits are given in Table 4.6. The
results showed that most of the traits were significantly correlated. The phenotypic
correlation between seed yield and groundnut rosette disease incidence was significant
and negative (r=-0.127, P<0.01), while correlation between seed yield and 100 seed
weight was significant and positive (r=0.368, P<0.01).
Groundnut rosette disease incidence was significantly and positively correlated to pod
maturity (r=0.115, P<0.01). Pod maturity and 100 seed weight were significantly and
negatively correlated (r=-0.087, P<0.05).
Plant height was significantly and positively correlated to pod maturity (r=0.072, P<0.05).
It was also negatively correlated (r=-0.141, P<0.01) to 100 seed weight and percentage
of 1-2 seeds pod-1 (r=-0.345, P<0.01).

102
Table 4.6: Phenotypic correlation among agro-morphological traits recorded in advanced groundnut lines grown at three locations and two seasons in Mozambique
Disease incidence Seed yield 1-2 seeds pod-1 100 seed weight maturity Plant height
Disease incidence 1
Seed yield -0.127** 1
1-2 seeds pod-1 -0.006 0.040 1
100 seed weight 0.001 0.368** 0.064 1
maturity 0.115** 0.002 0.009 -0.087* 1
Plant height -0.022 0.054 -0.345** -0.141** 0.072* 1 *Significant at P = 0.05; ** Significant at P = 0.01

103
4.3.4 GGE biplot and stability analysis for yield across locations
The GGE biplot based on seed yield data of advanced lines explained 90.96%
(59.15 % by PC1 and 31.82 % by PC2, respectively) of the total variation (Figure
4.1). The three environments fell into two sectors (Namapa+Nampula and Mapupulo)
with different winning genotypes. Genotype 31A was the highest yielding in
Mapupulo, and genotype 23A was the highest yielding in Nampula and Namapa.
Genotypes 20A and 4A were very close in performance to genotype 23A in Nampula
and Nampula.
Mean seed yield, regression coefficients (bi), variance deviation from regression (var-
dev) and coefficient of determination (R2) are presented in Table 4.7. Coefficient of
regression ranged from 0.208 (32A) to 2.169 (6A). Six genotypes (4A, 35B, 13A,
16A, 15A and 27A) had coefficient of regression around unity. Twelve genotypes had
slope more than unity and 14 genotypes had regression coefficient less than unity.
Genotype 31A had the highest variance deviation while genotype 41A had the lowest
(86.17).

104
Figure 4.1: GGE biplot based on yield data of 32 advanced lines grown at three locations over
two years, environment-centred

105
Table 4.7: Genotype mean yield, regression coefficient (bi), variance deviation (var-dev) and coefficient of determination of 32 groundnut advanced lines grown at 3 locations over 2 seasons
Genotype Mean yield (kg ha-1) bi var-dev R2
10A 1457 0.648 30263.0 0.591
13A 2014 0.969 12486.0 0.887
15A 1705 0.957 6737.0 0.934
16A 1782 0.966 100934.0 0.490
17A 1691 1.167 34849.0 0.802
19A 2067 0.470 807.5 0.932
1A 2099 1.567 21344.0 0.923
20A 2046 1.352 119989.0 0.613
21A 1869 0.823 209822.0 0.251
23A 2166 0.284 112561.0 0.069
24A 1627 0.554 114460.0 0.218
25B 1703 1.373 34894.0 0.849
26B 1948 1.632 106465.0 0.722
27A 1841 0.909 65931.0 0.566
28A 1995 0.635 25739.0 0.820
31A 1880 1.797 322915.0 0.510
32A 1493 0.208 33834.0 0.117
33A 1840 1.158 39020.0 0.781
34A 1894 1.331 17891.0 0.911
35B 2086 1.024 162.8 0.999
37A 1829 0.574 936.2 0.973
40A 1592 0.457 7625.0 0.740
41A 1584 0.614 86.2 0.998
45B 1711 1.332 115856.0 0.614
4A 2017 1.096 75245.0 0.624
52B 1429 1.655 76457.0 0.788
5A 1883 0.803 5118.0 0.923
6A 1828 2.169 104457.0 0.824
72B 1820 0.568 111217.0 0.232
75B 1353 1.499 3989.0 0.983
8A 1811 0.762 104777.0 0.365
Nametil 1877 0.677 30875.0 0.607
Mean 1811

106
4.4 Discussion
The results of analysis of variance across environments and seasons indicated highly
significant differences (P≤0.01) among genotypes for all traits studied. Seasons,
environments and their interactions were significantly different for most the traits,
which suggested that the advanced lines differed significantly in their response to
changes in the environment. Some of the genotypes outyielded the check cultivar
(Nametil) and others were more resistant to groundnut rosette disease than the
check cultivar. These results suggested that the check cultivar can be replaced with
some of the evaluated new genotypes which is high yielding and groundnut rosette
disease resistant.
The results indicated that groundnut rosette disease incidence was generally low in
all the environments. However, environments and genotypes reacted differently on
the disease incidence. Mapupulo had higher disease pressure compared to Nampula
and Namapa. Most of the genotypes were groundnut rosette disease free in
Namapa. The low disease incidence in Namapa might be because of the regular
rainfall and well distributed during the growing seasons where by plant
establishment, canopy cover and high plant density were achieved few weeks after
planting. High plant density promotes the establishment of a microclimate which
prevents the aphid from growing wings and limits disease transmission (Dollet et al.,
1986).
The results showed that most of the traits were significantly correlated with one
another. The phenotypic correlations between seed yield and groundnut rosette
disease incidence was significant and negative which indicated that seed yield was
influenced negatively by groundnut rosette disease incidence. The positive
correlation between seed yield and 100 seed weight indicated that high yielding
genotypes also had high 100 seed weight. Mekontchou et al. (2006) reported that
seed yield from breeding groundnut lines in Camerron was positively associated with
100 seed weight. This significant and positive correlation, according to the authors,
indicated that the increase of 100 seed weight, there is also an increase on yield.
Groundnut rosette disease had significant and positive correlation to pod maturity.
This positive correlation indicated that genotypes with resistance to groundnut rosette
disease also had early pod maturity.
Mega-environment is defined as a group of locations that consistently share the best
performing set of genotypes across years (Yan and Rajcan, 2002). Yan et al. (2007)

107
suggested that data from multiple years were essential to decide whether or not the
target region can be divided into different mega-environments. Based on the
definitions, the data on seed yield of the advanced lines were grouped into two
mega-environments (Namapa+Nampula and Mapupulo) with different winning
genotypes. From the biplot analysis, the results indicated that genotype 31A was the
best in Mapupulo, while genotype 23A was the best in Nampula and Namapa.
Further results indicated that genotypes 75B and 35B were the most stable across
environments.
A genotype is judged more stable over locations which have regression coefficient
(bi) equal to or very close to unity and high R2 (Petersen, 1989). Eberhart and
Russell (1966) also indicated that a genotype is stable if its coefficient of regression
is equal to or close to unity. The authors further reported that coefficient slopes less
than unity shows adaptability in low yielding environments and coefficient slopes over
unity reveal adaptability in high yielding environments. In this study, six genotypes
(4A, 35B, 13A, 16A, 15A and 27A) had coefficient of regression around unity
suggesting that these genotypes could be cultivated in a wide range of environments.
Fourteen of the genotypes (e.g. 35B, 17A, 1A, 20A and 6A) had regression
coefficient more than unity and some showed above average seed yield (e.g. 35B,
1A, 20A and 26A). These results suggest that these genotypes could be cultivated in
good environments. Other genotypes (e.g. 10A, 19A, 23A and 24A) had regression
coefficient less than unity which suggest that these genotypes are less stable and are
suitable for poor environments. The results in this study were in agreement with
those of Mekontchou et al. (2006) who evaluated newly development groundnut lines
for yield and yield components in Cameroon.
In the present study and according to the stability models, genotype 35B was stable
across environments since it had coefficient of regression around unity (bi=1.024),
high coefficient of determination (R2=0.999), and small variance deviation (var-
dev=162.8) and above average yield (13 % above average seed yield). It is,
therefore, concluded that genotype 35A had wide adaptability and could be
recommended for cultivation in diverse environments of northern Mozambique.
Nawaz et al. (2009) et al. (2009) reported similar results in Pakistan whereby
genotype ICGV-92040 was stable across environments since it had above average
yield performance, small variance deviation, high value of coefficient of determination
and coefficient of regression around unity.

108
4.5 Conclusion
The advanced lines responded differently across environments. The different
responses indicated that some of the advanced lines could be suitable for good
environments, others in poor environments and others could be suitable in wide
range of environments. Based on regression coefficient, six advanced lines were
suitable for cultivation in a wide range of environments. Line 35B was the best
among them and it could be recommended for cultivation on diverse environments in
northern Mozambique. Groundnut rosette disease incidence was generally low in all
environments. However, Mapupulo had higher disease incidence compared to
Namapa and Nampula. Most of the traits were significantly correlated with seed yield
and groundnut rosette disease. The correlation between seed yield and disease
incidence was significant and negative indicating that seed yield was influenced
negatively by disease incidence.
References
ADAP-SF. 2006. Sector Familiar da província de Nampula. Associação de
Desenvolvimento Agropecuária no Sector Fomiliar, Nampula, Moçambique.
Alwala, A., T. Kwolek, M. McPherson, J. Pellow and D. Meyer. 2010. A
comprehensive comparison between Eberhart and Russell joint regression
and GGE biplot analysis to identify stable and high yielding maize hybrids.
Field Crops Research. 119:225-2230.
Aremu, C.O., O.J. Ariyo and B.D. Adewale. 2007. Assessment of selection
techniques in genotype X environment interaction in cowpea Vigna
unguiculata (l.) walp. African Journal of Agricultural Research. 2:352-355.
Arias, F.J. and M.L. Libombo. 1994. Groundnut Evaluation in Mozambique :
Preliminary Results from the 1993/94 Season in Maputo Province, Maputo,
Mozambique.
Dollet, M., J. Dubern, C. Fauquet, J.-C. Thouvenel and A. Bockelee-Mowan. 1986.
Groundnut viral disease in West Africa. Tropical Agriculture Research Center,
Ministry of Agriculture, Forestry and Fisheries, JAPAN.

109
Eberhart, S.A. and W.A. Russell. 1966. Stability parameters for compareing varieties.
Crop Science. 6:36-40.
Finlay, K.S. and G.N. Wilkinsons. 1963. The analysis of adaptation in a plant
breeding programme. Australian Journal of Agricultural Resources. 14:742-
754.
Francis, T.R. and L.W. Kannenberg. 1978. Yield stability studies in short-season
maize. I. A descriptive method for grouping genotypes. Canadian Journal of
Plant Science. 58. 1029-1034.
Gauch, H.G. and R.W. Zobel. 1997. Identifying mega-environments and targeting
genotypes. Crop Science. 37:311-326.
IBPGR and ICRISAT. 1992. Descriptors for Groundnut. International Board for Plant
Genetic Resources, Roma, Italy, and International Crops Research Institute
for the Semi-Arids Tropics, Patancheru, India. Roma, Italy.
INE. 2005. Censo Agro-pecuário 2004-2005: Resultados Temáticos, Instituto
Nacional de Estatística, Maputo-Moçambique.
Lin, C.S. and M.R. Binn. 1988. A method of analyzing cultivar X location X year: a
new stability parameter. Theoretical and Applied Genetics. 76. 425-430.
López, Y., D.O. Smith, S.A. Senseman and W.L. Rooney. 2001. Genetic factors
influencing high oleic acid content in Spanish market-type peanut cultivars.
Crop Science. 41:51-56.
Mekontchou, T., M. Ngueguim and M. Fobasso. 2006. Stability analysis for yield and
yield components of selected peanut breeding lines (Arachis hypogaea L.) in
the northern province of Cameroon. Tropicultura. 24:90-94.
Nawaz, M.S., N. Nawaz, M. Yousuf, M.A. Khan, M.Y. Mirza, A.S. Mohmad, M.A.
Sher and M.A. Massod. 2009. Stability performance for pod yield in
groundnut. Pakistan Journal of Agricultural Resources. 22:116119.
Ngeve, J.M. and J.C. Bouwkamp. 1993. Comparison of statistical methods to
asssess yield stability in sweetpotato. Journal of American Society of
Horticulture Science. 118:304-310.
110
Payne, R.W., D.A. Murray and S.A. Harding. 2011. An Introduction to the GenStat
Command language, VSN International, Hemel Hempstead, UK.
Perkins, J.M. and J.L. Jinks. 1968. Environmental and genotypic-environmental
components of variability. III. Multiple lines and crosses. Heredity. 23:339-
356.
Petersen, R.G. 1989. Special topics in biometry. In: Khan, N.A. (Ed.). National
Agricultural Research Centre. Islamabad, Pakistan. pp. 60-68.
Simpson, C.E., M.R. Baring, A.M. Schubert, H.A. Melouk, M.C. Black, Y. López and
K.A. Keim. 2003a. Registration of ‘Tamrun OL01'. Crop Science. 43:2298.
Simpson, C.E., M.R. Baring, A.M. Schubert, H.A. Melouk, Y. López and J.S. Kirby.
2003b. Registration of ‘OLin. Crop Science. 43:1880-1881.
Waliyar, F., P.L. Kumar, B.R. Ntare, E. Monyo, S.N. Nigam, A.S. Reddy, M. Ositu
and A.T. Diallo. 2007. Groundnut Rosette Disease and its Management.
Information Bulletim. 75:32.
Yan, W., P.L. Cornelius, J. Crossa and L.A. Hunt. 2001. Two types of GGE biplots for
analyzing multi-environment trial data. Crop Science. 41:656-663.
Yan, W., M.S. Kang, B. Ma, S. Woods and P.L. Cornelius. 2007. GGE biplot vs.
AMMI analysis of genotype-by-environment data. Crop Science. 47:643-655.
Yan, W. and I. Rajcan. 2002. Biplot evaluation of test sites and trait relations of
soyabean in Ontario. Crop Science. 42:11-20.
Zhang, Q. and S. Geng. 1986. A method of estimating varietal stability for data of
long-term trials. Theoretical and Applied Genetics. 71:810-814.

111
V. INHERITANCE OF RESISTANCE TO GROUNDNUT ROSETTE DISEASE
IN GROUNDNUT (ARACHIS HYPOGAEA L.)
Abstract
Groundnut (Arachis hypogaea L.) rosette disease is one of the important diseases in
groundnut. Information on the genetics of groundnut rosette disease in Mozambique
is limited and breeders and other scientists working on groundnut depend entirely on
outside information. Therefore, a study was conducted to determine inheritance of
resistance to groundnut rosette disease. Twenty-one F2 populations from a
seven-parent half diallel cross and their parents were evaluated under field
conditions for resistance to groundnut rosette disease using the spreader row
technique in a randomized complete block design at Nampula Research Station,
Mozambique during the 2010/2011 growing season. The results showed that JL-24
had the highest DI (99.5 %) while ICGV-SM 01711 had the lowest (1.2 %). Both
general combining ability (GCA) and specific combining ability (SCA) variances were
highly significant (P≤0.001). Genotype JL-24 had the highest positive GCA (42.5) and
genotype ICGV-SM 01513 the highest negative (-18.8). The highest positive SCA
was observed for cross CG 7 X ICGV-SM 01711 (23.7). The cross between the two
susceptible cultivars (JL-24 and CG) had the highest negative SCA (-23.3). The
GCA:SCA ratio was 0.97 indicating that additive gene action was more important
than non-additive gene action in the expression of resistance to groundnut rosette
disease. The segregation pattern from 7 F2 populations (ICG 12991 X CG 7, ICGV-
SM 01513 X CG 7, ICGV-SM 90704 X CG 7, JL-24 X ICGV-SM 01513, JL-24 X
ICGV-SM 01731, JL-24 X ICG-SM 01711 and CG 7 X ICGV-SM 01711) showed that
groundnut rosette disease was controlled by two recessive genes. Segregation from
two populations (ICG 12991 X JL-24 and ICGV-SM 90704 X JL-24) indicated that
groundnut rosette was controlled by one recessive gene. Pooled data of resistant X
susceptible and susceptible X resistant F2 populations did not fit 1:3 or 1:15 ratios.
The segregation patterns in this study suggested that apart from one or two
recessive genes, genetic modifiers might also be involved in the expression of
resistance to groundnut rosette disease.
Key words: Groundnut rosette disease, Arachis hypogaea, inheritance, combining
ability, gene action

112
5.1 Introduction
Groundnut rosette disease is widely distributed in sub-Saharan Africa region and the
offshore islands, including Madagascar (Nigam and Bock, 1990; Naidu et al., 1998).
It is the most destructive virus disease of groundnuts in sub-Saharan Africa (Nigam
and Bock, 1990; Naidu et al., 1998; Olorunju and Ntare, 2008). Yield losses up to
100 % have been reported under severe disease conditions. The disease is caused
by a complex of three agents namely: groundnut rosette assistor virus (GRAV),
groundnut rosette virus (GRV) and a satellite RNA (sat RNA) (Murant et al., 1988;
Naidu et al., 1998). The disease is transmitted by an aphid vector, Aphis craccivora
Koch, in a persistent manner. In order for the aphid be to able to transmit the disease
successfully, all the three agents must be present together in the host plant
(Subrahmanyam et al., 1998).
Several methods for groundnut rosette disease management have been suggested
and include insecticide application, cropping practices and breeding for both vector
and virus resistance (Naidu et al., 1998; Naidu et al., 1999). Insecticides kill the
vectors thereby preventing the spread of rosette disease. Cropping practices involve
early planting and uniform plant density. Although cropping practices can reduce the
incidence of groundnut rosette disease, farmers do not follow these
recommendations for several reasons, including farmer priority, lack of seed and
uncertainty of rainfall.
In sub-Saharan Africa, the use of host resistance is the most economically-effective
and environmentally-beneficial method of combating diseases and pests (Russell,
1978). The use of cultivars resistant to groundnut rosette disease will allow
groundnut growers to save money which would otherwise be used for insecticide
purchase and application.
Many studies have evaluated A. hypogaea germplasm for resistance to groundnut
rosette disease since 1907 when the disease was first described. The existence of
significant resistance within A. hypogaea germplasm was reported from Burkina Faso
in 1952, when an epidemic of groundnut rosette disease destroyed a large collection
of germplasm (Nigam and Bock, 1990; Subrahmanyam et al., 1998; Olorunju et al.,
2001). The sources identified then, formed the basis for the rosette resistance
breeding programmes throughout Africa (Subrahmanyam et al., 1998; Olorunju et al.,
2001) leading to the development of several groundnut rosette disease resistant
cultivars.
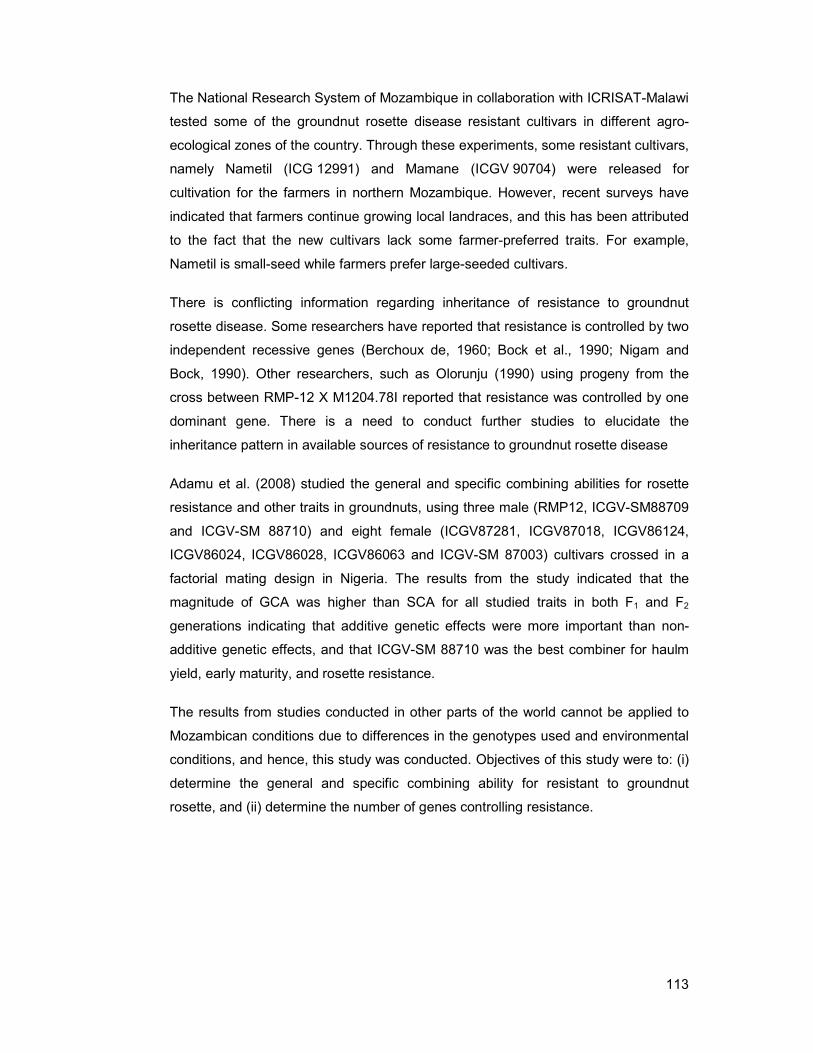
113
The National Research System of Mozambique in collaboration with ICRISAT-Malawi
tested some of the groundnut rosette disease resistant cultivars in different agro-
ecological zones of the country. Through these experiments, some resistant cultivars,
namely Nametil (ICG 12991) and Mamane (ICGV 90704) were released for
cultivation for the farmers in northern Mozambique. However, recent surveys have
indicated that farmers continue growing local landraces, and this has been attributed
to the fact that the new cultivars lack some farmer-preferred traits. For example,
Nametil is small-seed while farmers prefer large-seeded cultivars.
There is conflicting information regarding inheritance of resistance to groundnut
rosette disease. Some researchers have reported that resistance is controlled by two
independent recessive genes (Berchoux de, 1960; Bock et al., 1990; Nigam and
Bock, 1990). Other researchers, such as Olorunju (1990) using progeny from the
cross between RMP-12 X M1204.78I reported that resistance was controlled by one
dominant gene. There is a need to conduct further studies to elucidate the
inheritance pattern in available sources of resistance to groundnut rosette disease
Adamu et al. (2008) studied the general and specific combining abilities for rosette
resistance and other traits in groundnuts, using three male (RMP12, ICGV-SM88709
and ICGV-SM 88710) and eight female (ICGV87281, ICGV87018, ICGV86124,
ICGV86024, ICGV86028, ICGV86063 and ICGV-SM 87003) cultivars crossed in a
factorial mating design in Nigeria. The results from the study indicated that the
magnitude of GCA was higher than SCA for all studied traits in both F1 and F2
generations indicating that additive genetic effects were more important than non-
additive genetic effects, and that ICGV-SM 88710 was the best combiner for haulm
yield, early maturity, and rosette resistance.
The results from studies conducted in other parts of the world cannot be applied to
Mozambican conditions due to differences in the genotypes used and environmental
conditions, and hence, this study was conducted. Objectives of this study were to: (i)
determine the general and specific combining ability for resistant to groundnut
rosette, and (ii) determine the number of genes controlling resistance.

114
5.2 Materials and methods
5.2.1 Study area
The study was conducted in 2010/2011 growing season at Nampula Research
Station. The station is located about 7 km east of Nampula (15º 09’ S, 39º 30’ S)
town in northern Mozambique and is elevated 432 m above sea level. The soil type is
sandy loam and the vegetation is predominantly grassland. The average rainfall is
slightly over 1000 mm. The rainy season starts around November/December up to
April/May with its peak in January. The maximum temperature in the region is about
39o C and the minimum temperature is 19o C.
5.2.2 Germplasm development and field establishment
Seven groundnut cultivars that were originally obtained from ICRISAT-Malawi and
were adapted to Mozambican conditions were used in this study. They included two
cultivars that were susceptible to groundnut rosette disease (JL-24 and CG 7) and
five resistant cultivars (ICG 12991, ICGV-SM 01513, ICGV-SM 01731,
ICGV-SM 90704 and ICGV-SM 01711) (Table 5.1).
The seven cultivars were planted in a crossing block on 15th December, 2008. A
second planting was made on 30th of December, 2008 to ensure that enough flowers
were available for hybridization. At flowering, cultivars were crossed in a half diallel
mating design, using standard artificial hybridization procedures for groundnut
(Norden, 1980; Knauft and Ozias-Akins, 1995).
The 21 F1 populations resulting from the crosses were planted at Nampula Research
Station in 2009/2010 growing season and allowed to self-pollinate to generate F2
populations. The F2 populations along with the parents were evaluated for resistance
to groundnut rosette disease in the 2010/2011 growing season.
The test materials (7 parents and 21 F2 populations) were planted at Nampula
Research Station on 20th January, 2011 in a randomized complete block design with
two replications. The replicates were separated by 2 m alleys. An individual genotype
was planted in 2 row plots, 4 m long with 0.5 m between rows and 0.2 m within rows.
The test materials were infected using the spreader-row technique whereby each test
genotype was flanked with two spreader rows. The experiment was planted in late
January in order to subject the test material to high groundnut rosette disease

115
pressure that generally occurs late in the season. The spreader rows were planted
with a groundnut rosette susceptible cultivar (JL-24) 15 days earlier than the test
materials.
Table 5.1: Name, market type and rosette disease reaction of the groundnut cultivars used in this study
Genotype Botanical classification
Reaction to rosette
Remarks
ICG 12991 Spanish bunch Resistant Released in Mozambique
JL-24 Spanish bunch Susceptible Released in Mozambique
ICGV-SM 01513 Spanish bunch Resistant Released in Mozambique
ICGV-SM 01731 Virginia bunch Resistant On-farm trials in Mozambique
CG 7 Virginia bunch Susceptible Released in Mozambique
ICGV-SM 90704 Virginia bunch Resistant Released in Mozambique
ICGV-SM 01711 Virginia bunch Resistant On-farm trials in Mozambique
5.2.3 Data collection and analysis
Individual plants from each genotype were monitored for presence or absence of
virus symptoms at 60 days after planting. Disease incidence (DI) for each genotype
was calculated as the percentage of plants in a plot with rosette symptoms (Waliyar
et al., 2007). Data on DI were subjected to log10 transformation before analysis.
Data was analyzed for combining ability using the Griffing’s diallel analysis Model 1
(fixed effects) Method 2 (parents included, reciprocals excluded) (Griffing, 1956;
Christie and Shattuck, 1992; Dabholkar, 1992). This approach partitions the variance
due to diallel progenies into two components (Table 5.2): 1) due to general
combining ability (GCA) and 2) due to specific combining ability (SCA). From the
mean sum of squares estimates of GCA effects (gi) for each parent and SCA effects
(sij) for each cross combination effects were calculated. The statistical model applied
was: ijkijjiijk sggµy ε++++= ,
where,
yijk = Disease incidence of the cross between lines i and j in k replications;
µ = overall mean; gi +gj+ sij = the genotypic contribution for cross i x j;
gi = the GCA of parent i;
gj = the GCA of parent j;
sij = SCA of the cross between parents i and j;
εijl = random error (assumed as normally and independently distributed i.e.
µ=0 and σ²=1).

116
The combining ability estimates were calculated based on the methods described by
Singh and Chaudhary (1985), and Huff and Wu (1992) as follows:
Independent GCA effects were calculated for male and female parents using the
same formula. GCA was regarded as significantly different from zero using a t-test,
at 27 degrees of freedom.
Predicted value of a cross = GCA of female parent + GCA of male parent + Grand
mean of all crosses.
.
SCA was regarded as significantly different from zero using a t-test, at 27
degree of freedom.
Table 5.2: Analysis of variance and expected mean squares for Model I, Method 2 from Griffing's (1956)
Source df SS MS Expectation of mean squares
GCA
SCA
Error m
where,
Mg = mean square due to GCA,
Ms = mean squqre due to SCA,
Me = mean error
p = number of parents
m = error degrees of freedom

117
Data were analysed using Diallel-SAS05, a SAS statistical program for Griffing’s
diallel analyisis (Zhang and Kang, 1997). The F ratios were used to test for
significance of the GCA and SCA main effects and t-values were used to test for
significance of GCA and SCA estimate effects. The GCA/SCA ratio to estimate the
relative importance of the genetic effects (additive, dominant or epistatic) was
calculated as reported by Baker (1978) as follows: .
The Chi-square ( 2) was used to test the F2 populations for fit to a 1:3
(resistant:susceptible) or 1:15 (resistant:susceptible) segregation ratio expected from
a one-gene and two-gene inheritance using the formula (Gomez and Gomez, 1984),
respectively: .
5.3 Results
5.3.1 Combining ability analysis for groundnut rosette disease incidence
Analysis of variance for combining ability (Table 5.3) showed that mean square due
to general combining ability (GCA) and specific combining ability (SCA) were
significant (P<0.001) for disease incidence. The GCA to SCA ratio was 0.97
indicating significant importance of additive gene action over non-additive effects for
resistance to groundnut rosette disease.
Table 5.3: Mean squares from analysis of variance for combining ability for groundnut rosette
from a 7x7 diallel cross
Source df MS
GCA 6 107.19***
SCA 21 6.34***
Error 27 1.76
GCA/SCA 0.97 * **Data significant at P≤0.001

118
The mean disease incidence and general combining ability for groundnut rosette
disease were significantly (P<0.05) and (P<0.001) different among the parents (Table
5.4), respectively. The mean disease incidence for the parents ranged between 1.2
and 99.5 %. JL-24 had the highest disease incidence of 99.5 % and ICGV-SM 01711
had the lowest (1.2 %).
The desirable effects for disease incidence should be negative. The susceptible
parents (JL-24 and CG 7) had positive GCA while the resistant parents (ICG 12991,
ICGV-SM 01513, ICGV-SM 01731, ICGV-SM 90704 and ICGV-SM 01771) had
negative values of GCA. The highest positive values were observed from parent JL-
24 (3.7), and the lowest negative value was observed from parent ICGV-SM 01513 (-
1.9).
Table 5.4: Parental mean and general combining ability (GCA) effects for groundnut rosette disease resistance from a 7x7 diallel cross
Parent Phenotype Mean (DI) GCA JL-24 S 99.5 3.7**
CG 7 S 87.0 3.4***
ICGV-SM 01513 R 1.4 -1.9***
ICGV-SM 01731 R 2.5 -1.2***
ICG 12991 R 6.9 -0.9***
ICGV-SM 90704 R 2.6 -1.4***
ICGV-SM 01711 R 1.2 -1.7***
Mean 28.7
LSD (5%) 15.5 **Data significant at P≤0.001; ***Data significant at P≤0.0001
The F2 progeny resulting from the cross between the two susceptible parents (JL-24
and CG 7) had 100.0 % disease incidence (Table 5.5). The cross between ICGV-SM
01513 and ICGV-SM 01731 had the lowest disease incidence (2.5 %). All
resistant x susceptible and susceptible x resistant crosses had mean disease
incidence of over 80.0 %.
All specific combining abilities involving R X S or S X R crosses were significantly
(P<0.05) different except for crosses JL-24 X ICGV-SM 90704 and JL-24 X ICGV-SM
01731 significant at P<0.001, and CG 7 X ICGV-SM 90704 not significant (P>0.05).
The highest positive SCA effect (2.3) among R X S and S X R crosses was between
the cross CG 7 X ICGV-SM 01711 and the lowest (1.1) was between the crosses
ICG 12991 X JL-24 and CG 7 X ICGV-SM 90704.
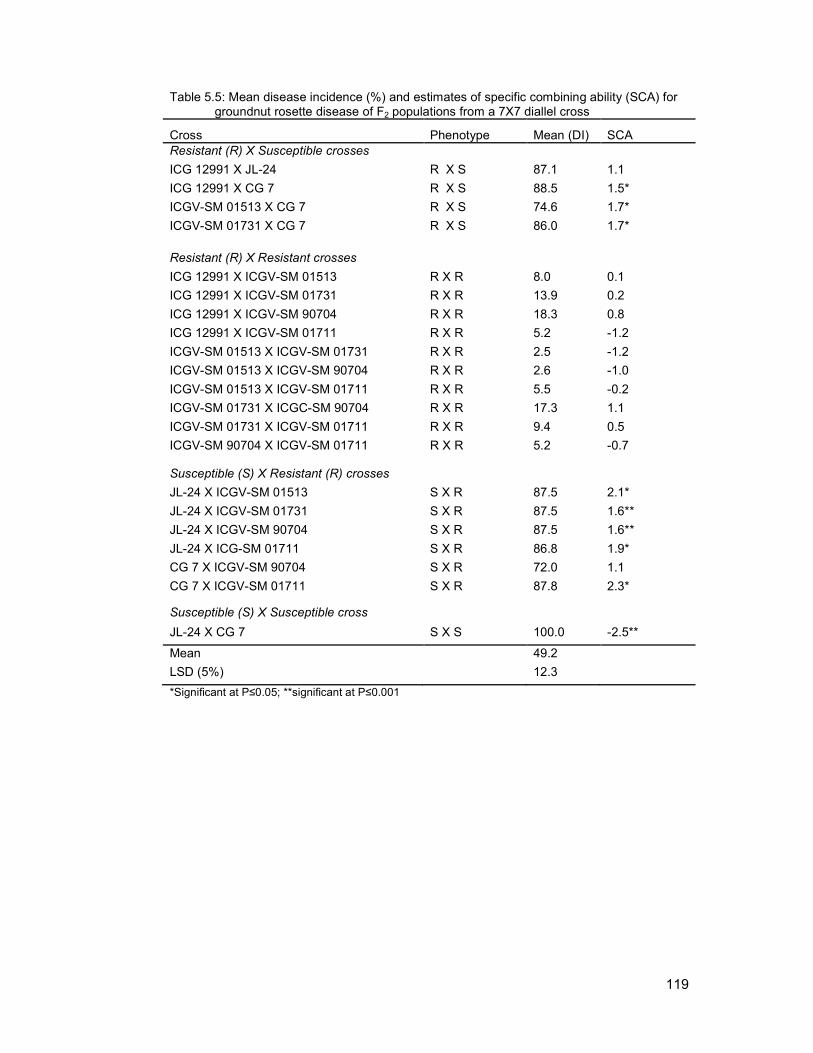
119
Table 5.5: Mean disease incidence (%) and estimates of specific combining ability (SCA) for groundnut rosette disease of F2 populations from a 7X7 diallel cross
Cross Phenotype Mean (DI) SCA Resistant (R) X Susceptible crosses
ICG 12991 X JL-24 R X S 87.1 1.1
ICG 12991 X CG 7 R X S 88.5 1.5*
ICGV-SM 01513 X CG 7 R X S 74.6 1.7*
ICGV-SM 01731 X CG 7 R X S 86.0 1.7*
Resistant (R) X Resistant crosses
ICG 12991 X ICGV-SM 01513 R X R 8.0 0.1
ICG 12991 X ICGV-SM 01731 R X R 13.9 0.2
ICG 12991 X ICGV-SM 90704 R X R 18.3 0.8
ICG 12991 X ICGV-SM 01711 R X R 5.2 -1.2
ICGV-SM 01513 X ICGV-SM 01731 R X R 2.5 -1.2
ICGV-SM 01513 X ICGV-SM 90704 R X R 2.6 -1.0
ICGV-SM 01513 X ICGV-SM 01711 R X R 5.5 -0.2
ICGV-SM 01731 X ICGC-SM 90704 R X R 17.3 1.1
ICGV-SM 01731 X ICGV-SM 01711 R X R 9.4 0.5
ICGV-SM 90704 X ICGV-SM 01711 R X R 5.2 -0.7
Susceptible (S) X Resistant (R) crosses
JL-24 X ICGV-SM 01513 S X R 87.5 2.1*
JL-24 X ICGV-SM 01731 S X R 87.5 1.6**
JL-24 X ICGV-SM 90704 S X R 87.5 1.6**
JL-24 X ICG-SM 01711 S X R 86.8 1.9*
CG 7 X ICGV-SM 90704 S X R 72.0 1.1
CG 7 X ICGV-SM 01711 S X R 87.8 2.3*
Susceptible (S) X Susceptible cross
JL-24 X CG 7 S X S 100.0 -2.5**
Mean 49.2
LSD (5%) 12.3
*Significant at P≤0.05; **significant at P≤0.001
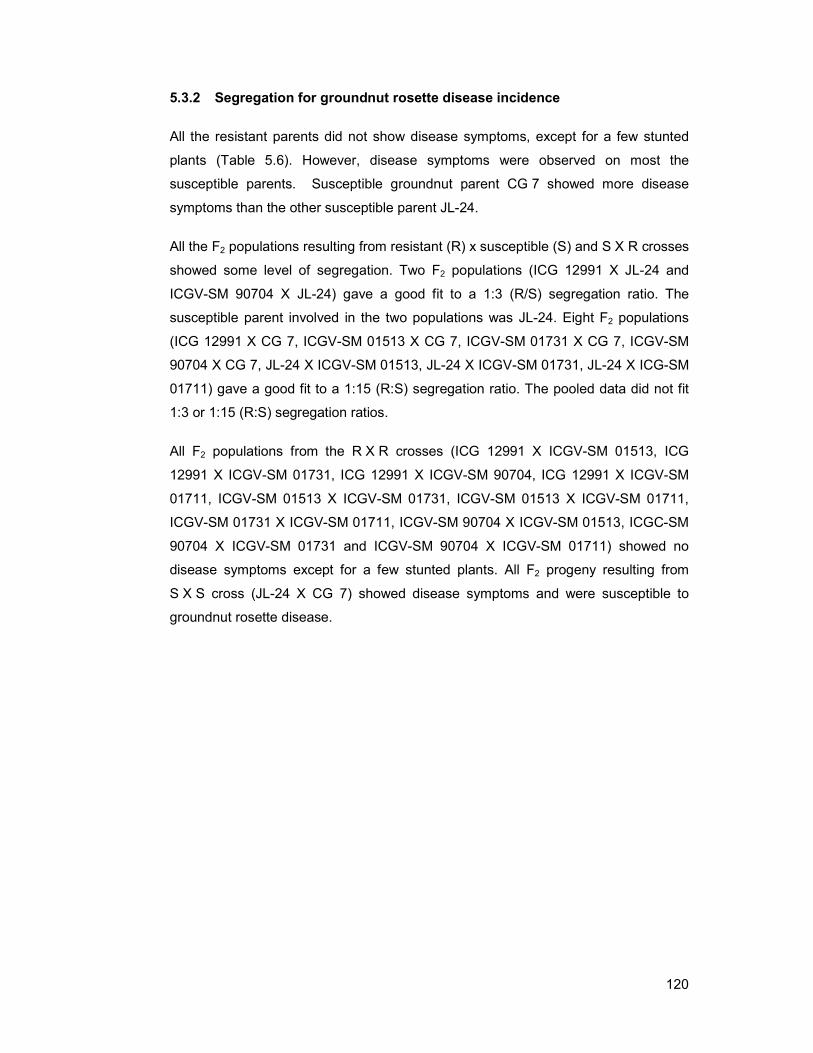
120
5.3.2 Segregation for groundnut rosette disease incidence
All the resistant parents did not show disease symptoms, except for a few stunted
plants (Table 5.6). However, disease symptoms were observed on most the
susceptible parents. Susceptible groundnut parent CG 7 showed more disease
symptoms than the other susceptible parent JL-24.
All the F2 populations resulting from resistant (R) x susceptible (S) and S X R crosses
showed some level of segregation. Two F2 populations (ICG 12991 X JL-24 and
ICGV-SM 90704 X JL-24) gave a good fit to a 1:3 (R/S) segregation ratio. The
susceptible parent involved in the two populations was JL-24. Eight F2 populations
(ICG 12991 X CG 7, ICGV-SM 01513 X CG 7, ICGV-SM 01731 X CG 7, ICGV-SM
90704 X CG 7, JL-24 X ICGV-SM 01513, JL-24 X ICGV-SM 01731, JL-24 X ICG-SM
01711) gave a good fit to a 1:15 (R:S) segregation ratio. The pooled data did not fit
1:3 or 1:15 (R:S) segregation ratios.
All F2 populations from the R X R crosses (ICG 12991 X ICGV-SM 01513, ICG
12991 X ICGV-SM 01731, ICG 12991 X ICGV-SM 90704, ICG 12991 X ICGV-SM
01711, ICGV-SM 01513 X ICGV-SM 01731, ICGV-SM 01513 X ICGV-SM 01711,
ICGV-SM 01731 X ICGV-SM 01711, ICGV-SM 90704 X ICGV-SM 01513, ICGC-SM
90704 X ICGV-SM 01731 and ICGV-SM 90704 X ICGV-SM 01711) showed no
disease symptoms except for a few stunted plants. All F2 progeny resulting from
S X S cross (JL-24 X CG 7) showed disease symptoms and were susceptible to
groundnut rosette disease.

121
Table 5.6: Segregation for groundnut rosette disease incidence in crosses among resistant and susceptible cultivars
Genotype Phenotype Number of plants
Chi-square ( 2) for ratio (R:S)
Total Susceptibl
e Resistant 1:3 1:15
Resistant parents
ICGV-SM 01513 R 70 0 70
ICGV-SM 01711 R 76 0 76
ICGV-SM 90704 R 76 4 72
ICG 12991 R 74 8 66
ICGV-SM 01731 R 74 4 70
Susceptible parents
JL-24 S 74 74 0
CG 7 S 78 68 10
Resistant (R) X Resistant (R) crosses
ICG 12991 X ICGV-SM 01513 R X R 74 6 68
ICG 12991 X ICGV-SM 01731 R X R 72 10 62
ICG 12991 X ICGV-SM 90704 R X R 70 12 58
ICG 12991 X ICGV-SM 01711 R X R 78 4 74
ICGV-SM 01513 X ICGV-SM 01731
R X R 80 2 78
ICGV-SM 01513 X ICGV-SM 01711
R X R 70 4 66
ICGV-SM 01731 X ICGV-SM 01711
R X R 64 6 58
ICGV-SM 90704 X ICGV-SM 01513
R X R 78 2 76
ICGC-SM 90704 X ICGV-SM 01731
R X R 72 12 60
ICGV-SM 90704 X ICGV-SM 01711
R X R 78 2 76
Resistant X Susceptible or Susceptible X Resistant crosses
ICG 12991 X JL-24 R X S 70 57 13 1.54 ns 18.14*
ICG 12991 X CG 7 R X S 70 62 8 6.88* 3.20
ICGV-SM 01513 X CG 7 R X S 74 69 5 13.14* 0.03
ICGV-SM 01731 X CG 7 R X S 72 63 9 6.00* 3.74
ICGV-SM 90704 X JL-24 R X S 72 61 11 3.63 10.01*
ICGV-SM 90704 X CG 7 R X S 74 66 8 7.95* 2.63
JL-24 X ICGV-SM 01513 S X R 72 65 7 8.96* 1.48
JL-24 X ICGV-SM 01731 S X R 72 64 8 7.41* 2.90
JL-24 X ICG-SM 01711 S X R 76 68 8 8.49* 2.37
CG 7 X ICGV-SM 01711 S X R 66 60 6 8.91* 0.91
Susceptible X Susceptible cross
JL-24 X CG 7 S X S 74 74 0 24.67* 4.93*
Pooled (S X R and R X S) 792 709 83 89.06* 24.18* * Data significant from the expected ratio at a level of significance of P=0.05.

122
5.4 Discussion
All groundnut rosette disease resistant genotypes had some level of susceptibility,
which implies that none of them was immune. These results were similar to those
reported by Kapewa et al. (2002) that JL-24 was more susceptible to groundnut
rosette disease than other genotypes evaluated. Further, the results were in
agreement with Olorunju et al. (1991a) who reported that under severe disease
conditions all groundnut genotypes develop severe rosette symptoms. Hildebrand et
al. (1991) found similar results and reported that the recessive genes that governed
resistance to groundnut rosette disease did not confer immunity. The authors further
suggested that resistance in groundnut could be overcome by the effects of high
temperatures and the simultaneous inoculation of the virus by large numbers of
aphids. ICGV-SM 01711 was the most resistant (1.2 %) and ICG 12991 was the least
(6.9 %). Between the susceptible genotypes, JL-24 was more susceptible (99.5%)
than CG 7 (87.0 %).
On average, the F2 populations developed from a cross with JL-24, as the
susceptible parent, had higher disease incidence than those involving CG 7, the
other susceptible parent. These findings confirmed that JL-24 was more susceptible
to the disease compared to CG 7.
When the segregation data was treated as a quantitative trait the results showed
significant GCA and SCA effects which indicated that both additive and non-additive
gene action were involved in the expression of resistance to groundnut rosette
disease. GCA effects for disease resistance were both positive and negative,
indicating that the per se parent performances should be good indicators of the
performance of resulting F2 progeny. The low and negative effect observed from
JL-24 suggests that this parent is the better combiner for groundnut rosette disease
when compared to CG 7. Traits with high GCA are highly influenced by
environmental conditions. The use of only one environment in this study implies that
the results may be biased (Pensuk et al., 2004; Gichuru et al., 2011) and not reliable
because the role of G X E in affecting repeatability has not been quantified. However,
the disease pressure applied in this study was sufficiently high to effectively
differentiate among genotypes for groundnut rosette disease resistance.
The significant SCA estimates in the F2 populations were an indicative of the
presence of non-additive effects (dominance and epistasis). But Hammons (1973)
observed that the general combining abilities in most studies with self-pollinated

123
crops where fixed models have been assumed are normally greater than the specific
combining abilities. However, non-additive effects are expected to decrease after
several generations due to inbreeding, making the improvement of the trait through
selection possible (Redona and Lantican, 1985; Masood and Kronstad, 2000).
A relatively larger GCA/SCA ratio demonstrates the importance of additive genetic
effects and the lower ratio indicates predominance of dominance and/or epistatic
gene effects (Christie and Shattuck, 1992). In this study, the ratio of GCA to SCA
was close to one. This indicated the predominance of additive gene action in the
inheritance of resistance to groundnut rosette disease. The additive gene action in
groundnut rosette disease resistance can be exploited through conventional selection
methods such as mass selection, pedigree selection or family selection (Redona and
Lantican, 1985). However, the presence of non-additive gene effects, even at a lower
magnitude, suggests that selection for groundnut rosette disease would be more
effective at later generations when the non-additive gene effect is reduced following
several generations of inbreeding.
The resistance to groundnut rosette disease is controlled by two recessive genes
(Nigam and Bock, 1990; Olorunju et al. (1991b).When the segregation data in F2
populations was treated as qualitative trait, the inheritance of resistance to groundnut
rosette disease was not similar for all crosses in this study. The F2 progeny of
crosses ICG 12991 X JL-24 and ICGV-SM 90704 X JL-24 showed that resistance
was controlled by a single recessive gene (1 resistant : 3 susceptible).
The F2 progeny of crosses ICG 12991 X CG 7, ICGV-SM 01513 X CG 7, ICGV-SM
01731 X CG 7, ICGV-SM 90704 X CG 7, JL-24 X ICGV-SM 01513, JL-24 X ICGV-
SM 01731 and JL-24 X ICG-SM 01711 showed that resistance to groundnut rosette
disease was controlled by two recessive genes. However, the results were not in
agreement with Olorunju et al. (1992) who reported that resistance to groundnut
rosette resistance was conditioned by a dominant gene (1 susceptible : 3 resistant).
The disparity in their results could be due to background in which resistance genes
are placed, differences in the genotypes and environments used in these and other
studies. Results of the study suggest that apart from the one or two recessive genes,
genetic modifiers may be involved in the expression of resistance to groundnut
rosette disease.

124
5.5 Conclusion
In both parents and segregating populations there was no immunity recorded for
groundnut rosette disease. Both GCA and SCA were significant indicating that both
additive and non-additive gene action were important in the expression of resistance
to groundnut rosette disease. GCA:SCA ratio was close to unity suggesting that GCA
effects were more important than SCA effects. This indicated the predominance of
additive gene action in the inheritance of groundnut rosette disease. Groundnut
rosette disease was controlled by two recessive genes. However, some genetic
modifiers may also be present and influence disease expression.
References
Adamu, A.K., P.E. Olorunju, S.G. Ado and S.O. Alabi. 2008. General and specific
combining ability estimates for rosette resistance, early maturity and other
traits in groundnuts (Arachis hypogaea L.). International Journal of Pure and
Applied Sciences. 2:33-41. www.ijpas.com.
Baker, R.J. 1978. Issues of diallel analysis. Crop Science. 18:533-536.
Berchoux de, C.D. 1960. La rosette de l’arachide en Haute-Volta. Comportement de
lignées résistantes. Oléagineux. 15:229-233.
Bock, K.R., A.F. Murant and R. Rajeshwari. 1990. The nature of the resistance in
groundnut to rosette disease. Annals of Applied Biology. 117:379-384.
Christie, B.R. and V.I. Shattuck. 1992. The diallel cross: design, analysis, and use for
plant breeders. Plant Breeding Reviews. 9:9-36.
Dabholkar, R.R. 1992. Elements of Biometrical Genetics Ashok Kumar Mittal
Concept Publishing Company. New Delhi, India.
Gichuru, L., K. Njoroge, J. Ininda and L. Peter. 2011. Combining ability of grain yield
and agronomic traits in diverse maize lines with maize streak virus resistance
for Eastern Africa region. Agriculture and Biology Journal of North America.
2:432-439.
Gomez, K.A. and A.A. Gomez. 1984. Chi-square test: Statistical Procedures for
Agricultural Research 2nd Ed. John Wiley and Sons. New York, USA.

125
Griffing, B. 1956. Concept of general and specific combining ability in relation to
diallel crossing. Australian Journal of Biology. 9:463-493.
Hammons, R.O. 1973. Genetics of Arachis hypogaea L. In: Wilson, C.T. (Ed.).
Peanut: Culture and Uses. American Peanut Research and Education
Association. Stillwater, Oklahoma, USA. pp. 135-173.
Hildebrand, G.L., K.R. Bock and S.N. Nigam. 1991. Groundnut Rosette Virus: Recent
Research Progress in Southern Africa. In: Reddy, D.V.R.et al., (Eds.). Fourth
Meeting of the Consultative Group on Collaborative Research on Groundnut
Rosette Virus Disease, International Crops Research Institute for the Semi-
Arid Tropics, Patancheru, Andhra Pradesh 502 324, India, Montpellier,
France.
Huff, D. R. and Wu, L. 1992. Distribution and inheritance of inconstant sex forms in
natural populations of dioecious buffalograss (Buchloe dactyloides). American
Journal of Botany. 79:207-215.
Kapewa, T., A.J. Chiyembekeza, P. Subrahmanyam and P.J.A.V. Merwe. 2002.
Performance of Long- and Short-duration Rosette-resistant Groundnut
Genotypes in Malawi. Malawi Journal of Agricultural Sciences. 1:1-8.
Knauft, D.A. and P. Ozias-Akins. 1995. Recent Methodologies for Germplasm
Enhancement and Breeding. In: Pattee, H.E.and H.T. Stalker (Eds.).
Advances in Peanut Science. American Peanut Research and Education
Society, Inc. Stillwater, OK, USA. pp. 54-94.
Masood, M.S. and W.E. Kronstad. 2000. Combining ability analysis over various
generations in a diallel cross of bread wheat. Pakistan Journal of Agricultural
Resources. 16.
Murant, A.F., R. Rajeshwari, D.J. Robinson and J.H. Raschke. 1988. A satellite RNA
of groundnut rosette virus that is largely responsible for symptoms of
groundnut rosette disease. Journal of General Virology. 69:1479-1486.
Naidu, R.A., H. Bottenberg, P. Subrahmanyam, F.M. Kimmins, D.J. Robinson and
J.M. Thresh. 1998. Epidemiology of groundnut rosette virus disease: current
status and future research needs. Annals of Applied Biology. 132:525-548.

126
Naidu, R.A., F.M. Kimmins, C.M. Deom, P. Subrahmanyam, A.J. Chiyembekeza and
P.J.A.v.d. Merwe. 1999. Groundnut rosette: a virus disease affecting
groundnut production in sub-Saharan Africa. Plant Disease. 83:700-709.
Nigam, S.N. and K.R. Bock. 1990. Inheritance of resistance to groundnut rosette
virus in groundnut (Arachis hypogaea L.). Annals of Applied Biology. 117:553-
560.
Norden, A.J. 1980. Peanut. In: Fehr, W.R.and H.H. Hadley (Eds.). Hybridization of
Crop Plants. American Society of Agronomy and Crop Science Society of
America, Publishers. Madison, Wisconsin, USA. pp. 443-465.
Olorunju, P.E. 1990. Groundnut rosette: Disease reaction and inheritance of
resistance of peanut genotypes to groundnut rosette virus and groundnut
rosette assistor virus. Plant Pathology, University of Georgia, Athens, GA. pp.
118.
Olorunju, P.E., C.W. Kuhn, J.W. Demski, S.M. Misari and A. Ansa. 1991a. Disease
reactions and yield performance of peanut genotypes under groundnut
rosette and rosette free field environments. Plant Disease. 75:1269-1273.
Olorunju, P.E., C.W. Kuhn, J.W. Demski, S.M. Misari and O.A. Ansa. 1991b.
Resistance in Groundnut to Mixed Infections of Groundnut Rosette Virus
(GRV) and Groundnut Rosette Assistor Virus (GRAV), and to Infection by
GRV alone. In: Reddy, D.V.R.et al., (Ed.). Fourth Meeting of the Consultative
Group on Collaborative Research on Groundnut Rosette Virus Disease,
International Crops Research Institute for the Semi-Arid Tropics, Patancheru,
Andhra Pradesh 502 324, India, Montpellier, France.
Olorunju, P.E., C.W. Kuhn, J.W. Demski, S.M. Misari and O.A. Ansa. 1992.
Inheritance of resitance in peanut to mixed infections of groundnut rosette
virus (GRV) and groundnut rosette assistor virus in a sinlge infection of GRV.
Plant Disease. 76:95-100.
Olorunju, P.E. and B.R. Ntare. 2008. Combating viruses and virus diseases of
groundnut through the use of resistant cultivars: a case study of Nigeria. Plant
Virology in sub-Saharan Africa:189-202.
127
Olorunju, P.E., B.R. Ntare, S. Pande and S.V. Reddy. 2001. Additional sources of
resistance to groundnut rosette disease in groundnut germplasm and
breeding lines. Annals of Applied Biology. 139:259-268.
Pensuk, V., S. Jogloy, S. Wongkaew and A. Patanothai. 2004. Generation mean
analysis of resistance to peanut bud necrosis caused by peanut but necrosis
tospovirus in peanut. Plant Breeding. 123:90-92.
Redona, E.D. and R.M. Lantican. 1985. Genetic analysis of some quantitative traits
in peanut, Arachis hypogaea L. I. Genearl and specific combining ability
estimates. Philippines Journal Crop Science. 10:81-86.
Russell, G.E. 1978. Plant Breeding for Pest Disease Resistance England Butterworth
& Co (Publishers) Ltd. London.
Singh, R.K. and Chaudhary, B.D. 1985. Biometrical Methods in Quantitative Genetic
analysis. Kalyani Publishers, New Dehli, India pp211-213.
Subrahmanyam, P., G.L. Hildebrand, R.A. Naidu, L.J. Reddy and A.K. Singh. 1998.
Sources of resistance to groundnut rosette disease in global groundnut
germplasm. Annals of Applied Biology. 132:473-485.
Waliyar, F., P.L. Kumar, B.R. Ntare, E. Monyo, S.N. Nigam, A.S. Reddy, M. Ositu
and A.T. Diallo. 2007. Groundnut Rosette Disease and its Management.
Information Bulletim. 75:32.
Zhang, Y. and M.S. Kang. 1997. DIALLEL-SAS: a SAS program for Griffing's diallel
analysis. Agronomy Journal. 89:176-182.

128
VI. GENERAL OVERVIEW
Groundnut (Arachis hypogaea L.) is an important food and cash crop in Mozambique.
The crop is grown by resource-poor small scale farmers under rainfed conditions.
Low yields are realized by farmers in the country. The low yields have been attributed
to a number of constraints, among which diseases feature prominently. Groundnut
rosette disease is one of the most important production constraints in Mozambique.
The use of host plant resistant is the most economically effective method for
controlling groundnut rosette disease in Mozambique. The aim of the study was to
improve the level of resistance to groundnut rosette disease in local groundnut
landraces for the benefit of Mozambican farmers.
The objectives of the study were: 1) to identify farmers’ major groundnut production
constraints and their preferences for cultivars; 2) to evaluate local groundnut
landraces for variation in agro-morphological traits and resistance to groundnut
rosette disease; 3) to evaluate advanced groundnut lines developed by the local
breeding programme in Nampula for agronomic performance and resistance to
groundnut rosette disease across locations; and 4) to determine the inheritance of
resistance to groundnut rosette disease.
The first objective aimed to obtain baseline information regarding major constraints
limiting groundnut production in northern Mozambique and groundnut traits preferred
by farmers for cultivars. The study was conducted using a participatory rural
appraisal methodology. During the study a survey on prevalence of groundnut rosette
disease was conducted in 13 districts. Results from the study showed that farmers
were aware of the main constraints affecting groundnut production and productivity in
their region, and the specific needs they would prefer a new groundnut cultivar.
Intercropping was a common practice among the majority of farmers in the region.
Groundnut was the third most important crop after cassava and maize.
Groundnut rosette disease was prevalent in all the fields visited and was the most
important constraint affecting groundnut production in the region. This observation
highlighted the idea that the disease has the potential to cause severe yield losses in
all the groundnut growing regions in northern Mozambique. Nevertheless, the study
showed that there was variability of the disease incidence across districts implying
that environmental factors had an influence on the occurrence of the disease.

129
Other constraints mentioned by farmers included insect pests, lack of good quality
seed, lack of improved cultivars, low soil fertility, lack of labour and lack of infra-
structure. From this list of constraints, it was clear that there is a huge demand for
improved groundnut cultivars, and that the currently grown cultivars do not always
have the preferred traits.
During the focus group discussions, farmers indicated that research should target
certain traits such as resistance to diseases, high oil content and large pod and seed
sizes. Release of cultivars lacking these traits may lead to low adoption or rejection
of the cultivars. The selection criteria used by women differed from that used by men
within village and across villages. High yield and oil content were the most important
traits followed by pod and seed size, earliness and disease and insect pest
resistance.
The second objective of the study was to evaluate local groundnut landraces with
respect to groundnut rosette disease and selected morphological traits. Fifty-eight
local landraces were collected from northern Mozambique and evaluated under field
conditions. The highest yielding genotypes were Pambara-4, Pambara-2, Pambara-
6, Ile-1, Imponge-1-Tom and Gile-5. The data indicated that no correlation between
yield and rosette disease under high disease pressure. The results showed high
phenotypic variation among the landraces. The variation on morphological
characteristics indicated diversity exist among the Mozambican landraces and could
be useful for breeding programmes. Clustering of the genotypes on the basis of
morphological traits gave six clusters. Based on visual rosette disease symptoms,
four local landraces (PAN-4, Imponge-4, Pambara-3, Metarica Joao) were identified
with resistance to groundnut rosette disease. These landraces will be used in future
breeding programmes in Mozambique.
The third objective of the study was to evaluate advanced groundnut lines for
agronomic performance and groundnut rosette disease resistance across locations.
Thirty-one advanced lines and one check were evaluated at three locations for two
consecutive growing seasons. Groundnut rosette disease infestation was generally
very low in all the locations and years. The data indicated negative correlation
between yield and groundnut rosette disease incidence.
On the basis of yield data, the advanced lines responded differently across
environments. The different responses indicated that some of the advanced lines
could be suitable for good environments, others in poor environments and others

130
could be suitable in wide range of environments. Six advanced lines were found to be
suitable in a wide range of environments. Line 35B was the most stable across
environments, and could be recommended for cultivation on diverse environments in
northern Mozambique.
The fourth objective of the study was to determine the inheritance of groundnut
rosette disease. Twenty-one F2 populations from a seven-parent half diallel cross
and their parents were evaluated under field conditions using the spreader row
technique. The results of the study showed that both additive and non-additive
genetic factors were important in the expression of resistance to groundnut rosette
disease. GCA (additive gene action) was more important than SCA (non-additive) in
determining the inheritance of resistance to disease.
The chi-square test using segregating F2 populations showed that resistance to
groundnut rosette disease may be controlled by one or two recessive genes.
However, some genetic modifiers may have influenced disease expression.
Overall, the significant findings made in this study are as follows:
1) The participatory rural appraisal approach was an efficient and effective
technique that enabled farmers to provide detailed information about the
groundnut cropping system by prioritizing the main constraints limiting its
production in the region and by listing preferred traits of groundnut cultivars.
2) Several groundnut local landraces possessed good levels of resistance to
groundnut rosette disease, which will be useful to the groundnut breeding
programme in Mozambique.
3) One advanced line (35B) was high-yielding and stable across environments,
and could be recommended for cultivation in a wide range of environments in
northern Mozambique.
4) One or two recessive genes conditioned resistance to groundnut rosette
disease. However, some modifiers may have influenced the disease
expression
5) Both additive and non-additive gene effects were important for groundnut
rosette disease expression, but additive gene action was predominant.
Some of the limitations encountered during the study included:
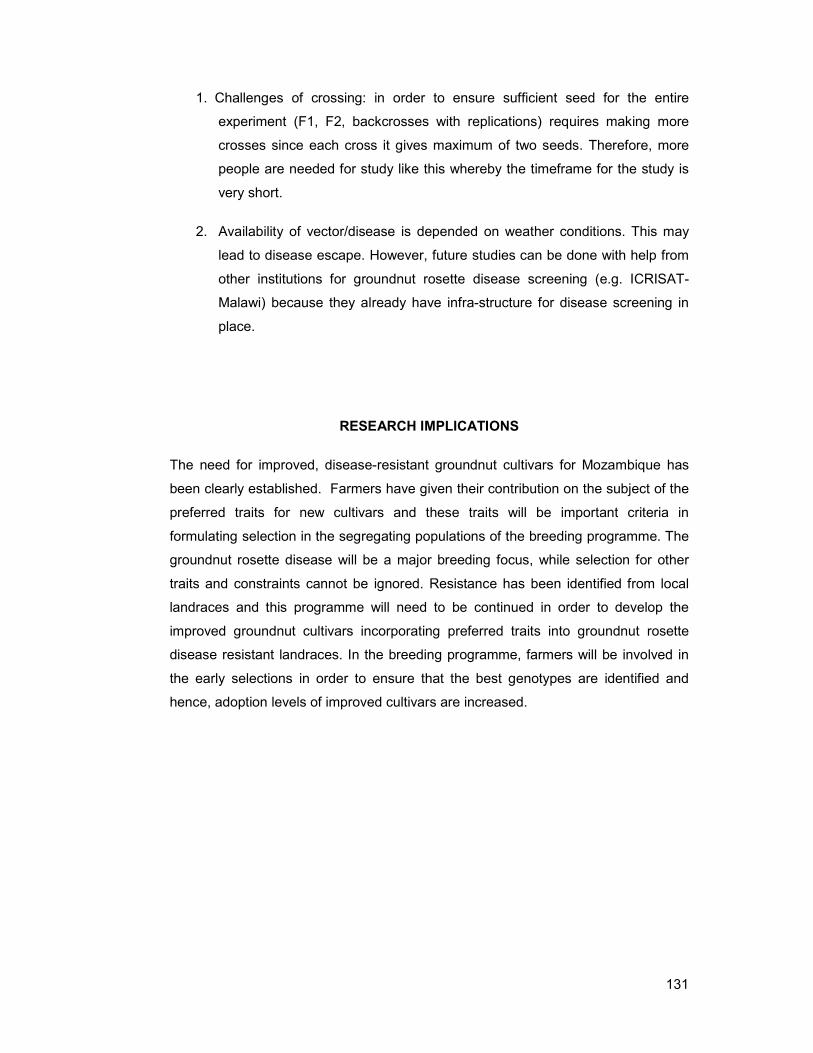
131
1. Challenges of crossing: in order to ensure sufficient seed for the entire
experiment (F1, F2, backcrosses with replications) requires making more
crosses since each cross it gives maximum of two seeds. Therefore, more
people are needed for study like this whereby the timeframe for the study is
very short.
2. Availability of vector/disease is depended on weather conditions. This may
lead to disease escape. However, future studies can be done with help from
other institutions for groundnut rosette disease screening (e.g. ICRISAT-
Malawi) because they already have infra-structure for disease screening in
place.
RESEARCH IMPLICATIONS
The need for improved, disease-resistant groundnut cultivars for Mozambique has
been clearly established. Farmers have given their contribution on the subject of the
preferred traits for new cultivars and these traits will be important criteria in
formulating selection in the segregating populations of the breeding programme. The
groundnut rosette disease will be a major breeding focus, while selection for other
traits and constraints cannot be ignored. Resistance has been identified from local
landraces and this programme will need to be continued in order to develop the
improved groundnut cultivars incorporating preferred traits into groundnut rosette
disease resistant landraces. In the breeding programme, farmers will be involved in
the early selections in order to ensure that the best genotypes are identified and
hence, adoption levels of improved cultivars are increased.

132
Appendix 1: Participatory rural appraisal questionnaire
Groundnut production problems and copping strategies
1. What range of crops do you grow? Which ones do you grow most frequently? Let the farmer specify.
2. What constraints do you face in your crop farming enterprises?– On the three most important crops.
3. For how many years have you grown groundnut?
4. Which cultivars have you grown in the past 2 years?
5. Rank the cultivars and list their good and bad characteristics
6. Rank the groundnut production constraints (Score: 1 = most important; 10 = least important)
7. Have you ever seen groundnut rosette disease on your field? YES/NO
8. If yes, what are the strategies of dealing with the disease?
9. Production and consumption figures (last year)
10. Estimate the quantity (kg) of groundnut that you produced
11. Estimate the quantity that you sold
12. Estimate the quantity that you consumed
13. What characteristics do you prefer from a new groundnut cultivar?
14. If developed, can you adopt the new cultivars? Yes/No
15. If yes, give your reasons.
16. If no, give your reasons.
17. What other characteristics do you expect in the new cultivars?

133
Details of the area Respondent Province District Village Soil texture: sand, loam, clay Rainfall: high, medium, and low Personal details of respondent
Name of household head Age Sex
Male Female
<30
31-40
41-50
51-60
60-70
>70
Household details
Household members
Number bellow 18 yr
Number 18 yr and above
Number providing farm labour
Number of hired labour
Male
Female
CROPPING SYSTEM What range of crops do you grow? Which ones do you grow most frequently? Let the farmer specify.
Crop Area planted (hectares; specify) Comment
2008 2009
Cassava
Groundnuts
Sorghum
Maize
Cowpea
Cotton
Bambara nut

134
What constraints do you face in your crop farming enterprises? (Tick the constraints against the crop) – On the three most important crops. Let the farmer specify
Constraint/Crop
cassava
Maize
Groundnut
Sorghum
Cowpea
Cotton
Bambara
Drought
Poor soil fertility
Diseases
Insect Pests
Seed availability
Poor cultivars
Market availability
Labour availability
Transport
For how many years have you grown groundnut? Which cultivars have you grown in the past 2 years?
Cultivar Name Source of the seed
Years planted to the cultivar
2008 2009
1
2
3
4
5
Rank the cultivars and list their good and bad characteristics (1=good; 5=bad Cultivar Name Rank Good Characteristics Bad characteristics
1
2
3
4
5

135
Rank the groundnut production constraints (Score: 1 = most important; 10 = least important) Constraint Rank Comment
Drought
Poor soil fertility
Diseases
Insect Pests
Seed availability
Poor cultivars
Market availability
Labour availability
Transport
Production and consumption figures Quantity (kg) produced Quantity (kg) consumed Quantity (kg) sold
Grain
Desired plant characteristics (tick the appropriate choice) Plant traits Tick the appropriate response
Growth habit Erect Bunch Prostrate
Plant size Short Medium Tall
Pod size small Medium Large
Grain size Small Medium Large
Grain colour Red Tan Brown
Grain taste Good bad Don’t care
Stem colour Green Purple Mixed
Maturity period Early Medium Late
Grain yield Low Medium High
Drought tolerance Low Medium High
Disease & pest tolerance Low Medium High
Oil content Low Medium High

136
Appendix 2: Morphological variation of local groundnut landraces
Appendix 2: Morphological variation in selected qualitative traits recorded in 58 groundnut landraces grown at PAN, Nampula, Mozambique
Genotype Seed colour Flower colour Leaflet shape Growth habit Pod size Pod
constriction Pod beak
Stem colour
1A Light purple Yellow-orange Obovate Decumbent-2 Medium Moderate Moderate Mixed 35B Light purple Yellow-orange Lanceolate Decumbent-3 Small Moderate Slight Mixed 41A Purple Yellow-orange Obovate Decumbent-1 Medium Moderate Moderate Green 75B Light purple Yellow-orange Lanceolate Decumbent-2 Medium Moderate Slight Purple Cuamba Lurio Eugenio Light purple Yellow-orange Wide-elliptic Decumbent-2 Medium Deep Moderate Green Erati Mercado Purple Yellow-orange Lanceolate Erect Small Deep Slight Green Erati Omar Purple Yellow-orange Wide-elliptic Decumbent-2 Medium Very deep Moderate Purple Erati Sede Light purple Yellow-orange Wide-elliptic Decumbent-1 Medium Moderate Moderate Green Gile-1 Light purple Yellow-orange Obovate Decumbent-2 Medium Moderate Moderate Green Gile-2 Purple Yellow-orange Lanceolate Decumbent-2 Medium Moderate Slight Green Gile-3 Light purple Yellow-orange Obovate Decumbent-2 Medium Moderate Moderate Green Gile-5 Light purple Yellow-orange Obovate Decumbent-3 Medium Moderate Slight Mixed Gile_4 Purple Yellow-orange Obovate Decumbent-2 Small Moderate Slight Green Ile-1 Purple Yellow-orange Lanceolate Decumbent-1 Small Moderate Slight Purple Ile-2 Light purple Yellow-orange Lanceolate Decumbent-2 Medium Deep Slight Purple Impong_1_Tom Light purple Yellow-orange Wide-elliptic Decumbent-3 Medium Moderate Slight Green Imponge-2A Light tan Yellow-orange Wide-elliptic Decumbent-3 Medium Moderate Moderate Purple Imponge-43 Two colours Yellow-orange Obovate Decumbent-1 Medium Moderate Moderate Purple Imponge_2 Light purple Yellow-orange Wide-elliptic Decumbent-3 Medium Slight Moderate Purple Imponge_3 Purple Yellow-orange Wide-elliptic Decumbent-2 Medium Moderate Moderate Purple
Imponge_4 Pale tan Yellow-orange Wide-elliptic Decumbent-2 Medium Very deep
Prominent
Green
Imponge_42 Two colours Yellow-orange Wide-elliptic Decumbent-2 Medium Moderate Slight Purple Imponge_5 Light tan Yellow-orange Oblong-elliptic Decumbent-2 Medium Moderate Slight Green Lurio Miguel Pale tan Yellow-orange Wide-elliptic Decumbent-1 Medium Moderate Moderate Green Metarica Joao Pale tan Yellow-orange Obovate Decumbent-2 Medium Slight Moderate Green Metarica Mutara Dark tan Yellow-orange Wide-elliptic Erect Small Moderate Slight Green Molocue-1 Pale tan Yellow-orange Obovate Decumbent-2 Big Moderate Slight Mixed Molocue-2 Dark tan Yellow-orange Obovate Decumbent-3 Medium None Moderate Purple Mualia Pale tan Yellow-orange Wide-elliptic Decumbent-2 Medium Moderate Moderate Green

137
Appendix 2: Continued
Genotype Seed colour Flower colour Leaflet shape Growth habit Pod size
Pod constriction
Pod beak Stem colour
Mualia-1 Pale tan Yellow-orange Wide-elliptic Decumbent-2 Medium Moderate Slight Green Mualia-2 Pale tan Yellow-orange Wide-elliptic Decumbent-2 Big Moderate Moderate Purple Mualia-3 Pale tan Yellow-orange Oblong-elliptic Decumbent-3 Medium Deep Moderate Purple Nacate Pale tan Yellow-orange Wide-elliptic Decumbent-2 Medium Moderate Prominent Green Nacate-1 Purple Yellow-orange Obovate Decumbent-2 Big Moderate Slight Green Nacate-2 Dark tan Yellow-orange Wide-elliptic Decumbent-1 Medium Moderate Moderate Green Nacate_3 Pale tan Yellow-orange Obovate Decumbent-3 Medium Moderate Prominent Mixed Namuno-1 Dark tan Yellow-orange Oblong-elliptic Decumbent-2 Small Moderate Moderate Green Ncoela Pale tan Yellow-orange Obovate Decumbent-2 Medium Moderate Moderate Mixed Ncoela-1 Dark tan Yellow-orange Wide-elliptic Decumbent-1 Medium Deep Slight Green Ncoela-2 Purple Yellow-orange Oblong-elliptic Decumbent-2 Big Moderate Moderate Purple Ncoela-3 Purple Yellow-orange Wide-elliptic Decumbent-2 Medium Moderate Moderate Green Ncoela-4 Dark tan Yellow-orange Wide-elliptic Decumbent-2 Medium Moderate Moderate Green Ncoela-5 Pale tan Yellow-orange Oblong-elliptic Decumbent-1 Medium Moderate Slight Purple Ncoela-6 Purple Yellow-orange Lanceolate Decumbent-2 Big Moderate Slight Green Pambara-1 Dark tan Yellow-orange Wide-elliptic Decumbent-2 Medium Moderate Slight Green Pambara-2 Purple Yellow-orange Wide-elliptic Decumbent-2 Medium None Slight Green Pambara-3 Purple Yellow-orange Oblong-elliptic Decumbent-3 Medium Moderate Slight Green Pambara-4 Purple Yellow-orange Obovate Decumbent-2 Medium Deep Moderate Green Pambara-5 Purple Yellow-orange Wide-elliptic Decumbent-1 Medium Moderate Moderate Purple Pambara-6 Purple Yellow-orange Oblong-elliptic Decumbent-2 Medium Moderate Moderate Purple Pambara-7 Purple Yellow-orange Lanceolate Decumbent-2 Medium Deep Moderate Green PAN-1 Purple Yellow-orange Lanceolate Decumbent-3 Medium Moderate Moderate Green PAN-2 Pale tan Yellow-orange Lanceolate Decumbent-3 Medium Deep Prominent Green PAN-3 Dark tan Yellow-orange Wide-elliptic Erect Small Moderate Moderate Green PAN-4 Pale tan Yellow-orange Wide-elliptic Erect Medium Moderate Slight Green PAN-5 Dark tan Yellow-orange Wide-elliptic Erect Medium Moderate Moderate Green JL-24 Pale tan Yellow-orange Oblong-elliptic Erect Medium Moderate Moderate Mixed Unhaphatenha Pale tan Yellow-orange Oblong-elliptic Decumbent-1 Medium Moderate Moderate Green
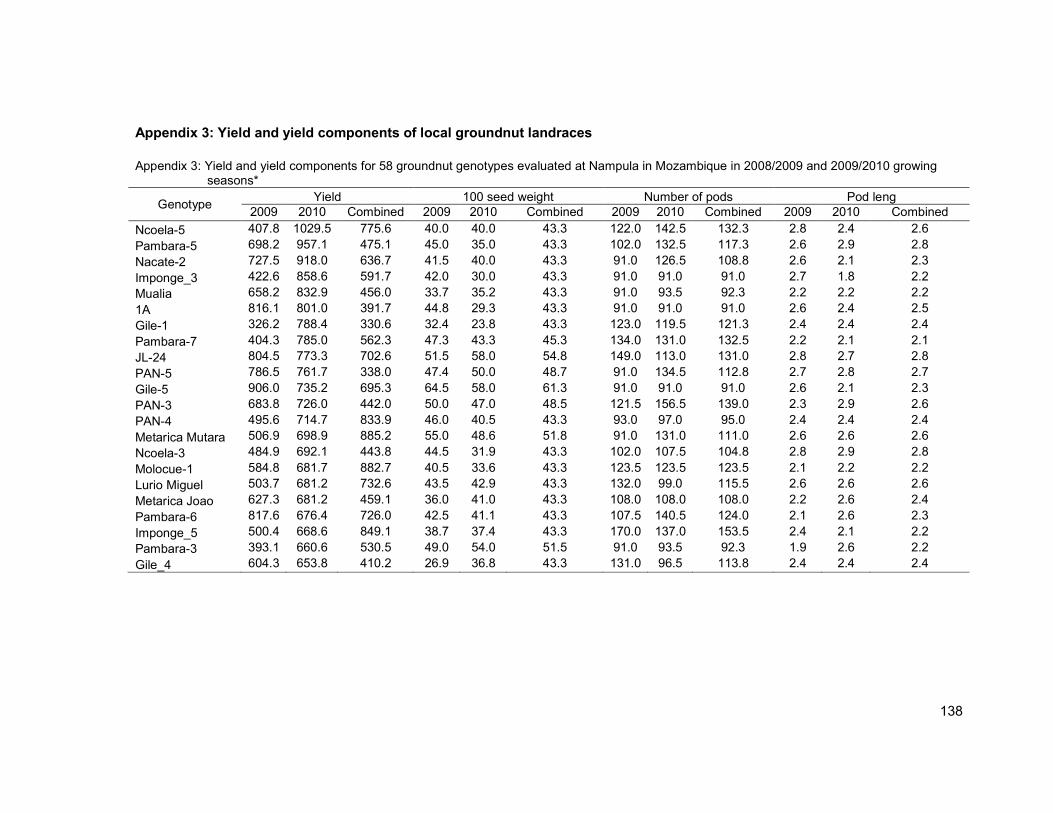
138
Appendix 3: Yield and yield components of local groundnut landraces
Appendix 3: Yield and yield components for 58 groundnut genotypes evaluated at Nampula in Mozambique in 2008/2009 and 2009/2010 growing
seasons*
Genotype Yield 100 seed weight Number of pods Pod leng
2009 2010 Combined 2009 2010 Combined 2009 2010 Combined 2009 2010 Combined
Ncoela-5 407.8 1029.5 775.6 40.0 40.0 43.3 122.0 142.5 132.3 2.8 2.4 2.6
Pambara-5 698.2 957.1 475.1 45.0 35.0 43.3 102.0 132.5 117.3 2.6 2.9 2.8
Nacate-2 727.5 918.0 636.7 41.5 40.0 43.3 91.0 126.5 108.8 2.6 2.1 2.3
Imponge_3 422.6 858.6 591.7 42.0 30.0 43.3 91.0 91.0 91.0 2.7 1.8 2.2
Mualia 658.2 832.9 456.0 33.7 35.2 43.3 91.0 93.5 92.3 2.2 2.2 2.2
1A 816.1 801.0 391.7 44.8 29.3 43.3 91.0 91.0 91.0 2.6 2.4 2.5
Gile-1 326.2 788.4 330.6 32.4 23.8 43.3 123.0 119.5 121.3 2.4 2.4 2.4
Pambara-7 404.3 785.0 562.3 47.3 43.3 45.3 134.0 131.0 132.5 2.2 2.1 2.1
JL-24 804.5 773.3 702.6 51.5 58.0 54.8 149.0 113.0 131.0 2.8 2.7 2.8
PAN-5 786.5 761.7 338.0 47.4 50.0 48.7 91.0 134.5 112.8 2.7 2.8 2.7
Gile-5 906.0 735.2 695.3 64.5 58.0 61.3 91.0 91.0 91.0 2.6 2.1 2.3
PAN-3 683.8 726.0 442.0 50.0 47.0 48.5 121.5 156.5 139.0 2.3 2.9 2.6
PAN-4 495.6 714.7 833.9 46.0 40.5 43.3 93.0 97.0 95.0 2.4 2.4 2.4
Metarica Mutara 506.9 698.9 885.2 55.0 48.6 51.8 91.0 131.0 111.0 2.6 2.6 2.6
Ncoela-3 484.9 692.1 443.8 44.5 31.9 43.3 102.0 107.5 104.8 2.8 2.9 2.8
Molocue-1 584.8 681.7 882.7 40.5 33.6 43.3 123.5 123.5 123.5 2.1 2.2 2.2
Lurio Miguel 503.7 681.2 732.6 43.5 42.9 43.3 132.0 99.0 115.5 2.6 2.6 2.6
Metarica Joao 627.3 681.2 459.1 36.0 41.0 43.3 108.0 108.0 108.0 2.2 2.6 2.4
Pambara-6 817.6 676.4 726.0 42.5 41.1 43.3 107.5 140.5 124.0 2.1 2.6 2.3
Imponge_5 500.4 668.6 849.1 38.7 37.4 43.3 170.0 137.0 153.5 2.4 2.1 2.2
Pambara-3 393.1 660.6 530.5 49.0 54.0 51.5 91.0 93.5 92.3 1.9 2.6 2.2
Gile_4 604.3 653.8 410.2 26.9 36.8 43.3 131.0 96.5 113.8 2.4 2.4 2.4

139
Appendix 3: Continued
Genotype Yield 100 seed weight Number of pods Pod length
2009 2010 Combined 2009 2010 Combined 2009 2010 Combined 2009 2010 Combined
Mualia-2 585.4 647.0 692.5 35.6 34.4 43.3 95.5 98.0 96.8 2.5 2.6 2.5
Unhaphatenha 464.2 646.5 742.8 41.3 37.6 43.3 91.0 127.0 109.0 2.7 2.9 2.8
Pambara-1 505.6 628.2 383.6 35.0 23.2 43.3 111.0 92.5 101.8 2.8 2.7 2.7
Ncoela 391.5 619.3 640.6 37.5 30.5 43.3 93.5 91.0 92.3 2.9 3.0 3.0
Nacate-1 482.5 606.2 576.9 37.5 28.9 43.3 95.5 113.0 104.3 2.4 2.1 2.2
Mualia-3 628.9 595.1 633.2 52.5 42.4 47.5 92.0 91.0 91.5 2.6 2.6 2.6
41A 692.4 593.4 395.4 42.5 48.6 45.5 91.0 97.5 94.3 3.1 2.5 2.8
Ncoela-2 451.0 581.7 602.0 53.0 49.7 51.4 126.5 100.0 113.3 2.6 2.3 2.4
Imponge_2 871.8 581.1 440.5 39.9 40.3 43.3 91.0 91.0 91.0 2.6 2.9 2.8
Nacate_3 657.0 560.6 642.1 43.8 46.5 45.1 91.0 92.0 91.5 2.6 2.6 2.6
Imponge-2A 363.8 546.1 548.7 40.3 47.6 43.9 97.5 105.0 101.3 2.0 2.3 2.1
PAN-1 548.8 545.9 551.9 41.0 39.3 43.3 99.5 97.0 98.3 2.6 2.6 2.6
Imponge_42 865.3 537.2 669.1 33.9 41.3 43.3 91.0 91.0 91.0 2.2 2.5 2.3
Erati Omar 214.1 510.8 575.5 41.3 45.4 43.3 98.0 117.0 107.5 2.1 3.0 2.5
Molocue-2 433.6 506.2 721.1 33.5 50.3 43.3 97.0 91.0 94.0 2.7 2.6 2.6
Ncoela-4 328.2 504.3 765.5 44.9 49.1 47.0 126.0 91.0 108.5 2.9 2.5 2.7
Ncoela-1 691.5 495.5 498.8 36.4 36.9 43.3 93.5 91.0 92.3 2.7 2.5 2.6
Imponge-43 789.9 477.4 485.2 38.0 31.1 43.3 134.5 91.0 112.8 2.7 2.7 2.7
Imponge_4 726.0 472.7 424.1 55.4 34.2 44.8 140.0 147.5 143.8 1.5 1.9 1.7
35B 505.9 468.4 377.7 39.8 38.4 43.3 101.5 91.0 96.3 2.7 1.8 2.2

140
Appendix 3: Continued
Genotype Yield 100 seed weight Number of pods Pod length
2009 2010 Combined 2009 2010 Combined 2009 2010 Combined 2009 2010 Combined
75B 646.3 456.6 487.3 45.5 47.6 46.5 110.0 91.0 100.5 3.0 2.1 2.5
Namuno-1 839.0 447.1 494.8 37.6 50.8 44.2 124.5 100.0 112.3 2.7 2.8 2.8
Pambara-4 874.4 444.2 429.2 41.6 52.9 47.2 111.5 91.0 101.3 2.3 2.8 2.5
Gile-3 406.5 438.8 505.9 35.3 40.5 43.3 108.5 91.0 99.8 2.6 2.6 2.6
Pambara-2 853.6 435.7 856.1 50.7 49.9 50.3 97.5 97.0 97.3 3.0 3.1 3.0
Erati Mercado 398.4 425.7 402.5 36.8 38.4 43.3 91.0 111.0 101.0 3.1 1.8 2.4
Ile-2 415.0 412.0 952.0 46.2 47.4 46.8 134.0 135.0 134.5 2.9 2.6 2.7
Nacate 475.5 397.3 568.5 37.7 28.2 43.3 91.0 91.0 91.0 2.6 2.6 2.6
Erati Sede 448.3 392.2 801.3 41.8 42.1 43.3 105.0 105.0 105.0 1.7 1.9 1.8
Ile-1 852.5 385.1 415.0 34.8 35.9 43.3 112.0 131.5 121.8 2.3 2.2 2.2
Mualia-1 514.5 366.5 604.7 43.5 44.1 43.8 91.0 91.0 91.0 2.8 2.1 2.5
PAN-2 582.4 357.2 600.8 43.3 38.2 43.3 125.5 144.5 135.0 2.4 2.8 2.6
Impong_1_Tom 808.3 349.8 614.9 30.3 31.5 43.3 99.5 112.5 106.0 2.7 2.5 2.6
Cuamba Lurio Eugenio 476.3 278.9 500.0 34.6 39.0 43.3 131.0 91.0 111.0 2.6 2.6 2.6
Ncoela-6 466.2 270.6 787.4 40.6 39.1 43.3 100.0 91.0 95.5 2.9 2.6 2.7
Gile-2 617.4 263.5 487.5 34.4 38.0 43.3 91.0 91.0 91.0 2.7 2.6 2.6
Mean 682.0 498.0 587.0 41.7 40.6 41.1 107.3 97.4 101.0 2.5 2.5 2.5
LSD(5%) 227.7 223.4 141.0 12.4 10.1 14.1 25.5 24.7 32.9 0.8 0.8 0.6
CV(%) 38.8 38.0 34.4 29.7 24.9 24.6 23.7 22.7 21.9 16.1 15.7 16.0

141
Appendix 4: Groundnut rosette disease incidence at 60 days after planting, yield and yield components of groundnut landraces grown at Nampula, in 2010/2011 growing season
Genotype Disease
incidence (%) Seed yield (kg ha-1)
100 seed weight (g)
Number of pods plant -1
Pod length (cm)
Nacate-1 48.8 844.7 45.4 81.5 2.3 1A 30.2 767.3 40.0 71.0 2.5 PAN-4 6.2 739.8 39.0 95.5 2.5 PAN-2 27.5 688.2 38.2 123.0 2.2 Impong_1_Tom 19.6 661.3 33.6 97.0 2.8 Imponge_2 63.1 656.7 42.9 78.5 2.8 JL-24 32.6 585.2 37.6 78.0 2.5 Metarica Mutara 51.7 585.0 28.9 82.0 2.1 Imponge_42 55.7 570.9 37.4 71.0 2.4 Pambara-6 12.9 565.3 42.1 71.0 2.3 Pambara-2 52.5 559.5 49.9 72.5 3.1 PAN-1 48.9 559.4 44.1 71.0 2.8 Erati Omar 50.0 539.5 23.8 141.5 2.2 PAN-5 42.3 537.9 39.1 72.0 2.7 Gile-2 25.9 535.7 30.5 74.5 1.7 Pambara-4 14.3 522.0 47.4 82.5 3.0 Ncoela 49.6 520.9 30.5 71.0 2.6 PAN-3 61.0 501.5 31.5 110.0 2.3 Mualia 31.3 498.0 49.7 71.0 3.1 Mualia-2 42.5 474.8 46.5 73.5 2.1 Nacate-2 55.0 469.5 50.3 83.5 2.1 Molocue-1 61.4 461.4 30.5 91.5 2.0 Ile-2 25.0 455.9 30.5 71.0 2.8 Mualia-3 36.8 449.4 47.6 91.5 2.3 Unhaphatenha 71.5 441.3 38.0 91.5 2.1 Gile-1 42.5 441.3 30.5 75.5 2.6 Metarica Joao 9.9 432.0 30.5 71.0 2.7 35B 29.8 425.3 32.8 107.0 2.4 Imponge_4 9.2 423.1 41.1 71.0 2.1 Imponge_5 40.7 408.1 54.0 71.0 2.5 Imponge-2A 41.3 406.2 36.8 104.0 2.1 Ncoela-6 33.6 381.9 43.8 112.0 2.9 Namuno-1 80.0 374.0 44.1 71.0 2.2 Nacate_3 62.4 342.0 30.5 76.0 2.6 Ncoela-5 70.9 341.9 50.8 103.5 2.2 Ile-1 40.0 341.3 30.5 71.0 2.4 75B 30.9 338.2 30.0 85.0 2.3 Pambara-1 23.9 337.5 40.5 103.0 2.6 Gile-3 57.3 334.1 30.5 71.0 2.5 Ncoela-4 53.9 333.2 47.6 82.5 2.4
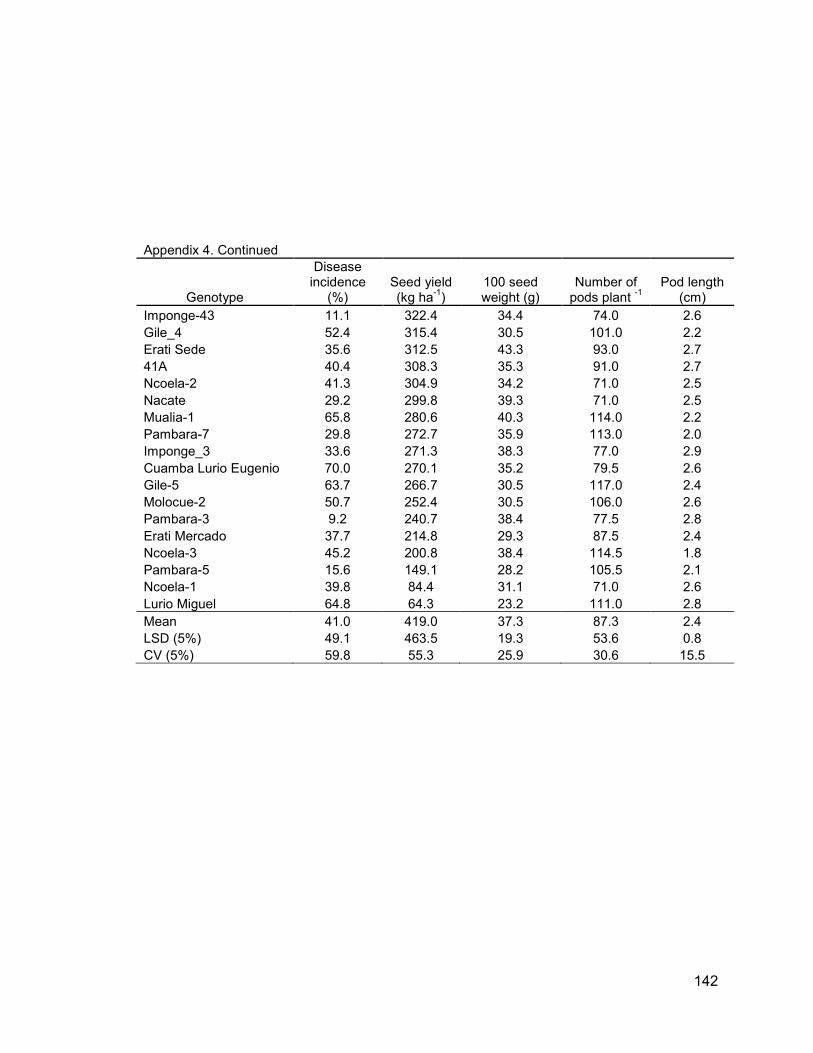
142
Appendix 4. Continued
Genotype
Disease incidence (%)
Seed yield (kg ha-1)
100 seed weight (g)
Number of pods plant -1
Pod length (cm)
Imponge-43 11.1 322.4 34.4 74.0 2.6 Gile_4 52.4 315.4 30.5 101.0 2.2 Erati Sede 35.6 312.5 43.3 93.0 2.7 41A 40.4 308.3 35.3 91.0 2.7 Ncoela-2 41.3 304.9 34.2 71.0 2.5 Nacate 29.2 299.8 39.3 71.0 2.5 Mualia-1 65.8 280.6 40.3 114.0 2.2 Pambara-7 29.8 272.7 35.9 113.0 2.0 Imponge_3 33.6 271.3 38.3 77.0 2.9 Cuamba Lurio Eugenio 70.0 270.1 35.2 79.5 2.6 Gile-5 63.7 266.7 30.5 117.0 2.4 Molocue-2 50.7 252.4 30.5 106.0 2.6 Pambara-3 9.2 240.7 38.4 77.5 2.8 Erati Mercado 37.7 214.8 29.3 87.5 2.4 Ncoela-3 45.2 200.8 38.4 114.5 1.8 Pambara-5 15.6 149.1 28.2 105.5 2.1 Ncoela-1 39.8 84.4 31.1 71.0 2.6 Lurio Miguel 64.8 64.3 23.2 111.0 2.8 Mean 41.0 419.0 37.3 87.3 2.4 LSD (5%) 49.1 463.5 19.3 53.6 0.8 CV (5%) 59.8 55.3 25.9 30.6 15.5

143
Appendix 5: Combined ANOVA for advanced groundnut lines
Source DF Mean Squares
rosette 1-2seed maturity 100 seed w seed yield
YEAR 1 11.07 1.17 5002.08*** 716.88*** 125907299.1*** ENV 2 2241.52*** 3.52 15006.25*** 602.9*** 13335503.2*** ENV x YEAR 2 12.85 1.17 5002.08*** 1228.52*** 44809843.4*** Rep(ENV x YEAR) 18 137.4*** 81.9 878.58** 194.88*** 15479953.5*** Cultivar 31 64.54** 3142.7*** 2670.02*** 268.67*** 1032106.8*** ENV x Cultivar 62 60.3*** 14 404.23 45.77*** 356516.5 YEAR x Cultivar 31 6.94 4.67 134.74 22.68 871316.5** ENVx YEAR x Cultivar 62 2.08 4.67 134.74 24.62 308893.1 Error 558 34.11 82.17 373.54 21.92 457365.6
Corrected Total 767