FARM STRUCTURE SURVEY 1999/2000 NATIONAL METHODOLOGICAL REPORT · Farm Structure Survey 1999/2000...
35
FARM STRUCTURE SURVEY 1999/2000 NATIONAL METHODOLOGICAL REPORT Member State: PORTUGAL
Transcript of FARM STRUCTURE SURVEY 1999/2000 NATIONAL METHODOLOGICAL REPORT · Farm Structure Survey 1999/2000...

�
FARM STRUCTURE SURVEY 1999/2000
NATIONAL METHODOLOGICAL REPORT Member State: PORTUGAL
FARM STRUCTURE SURVEY 1999/2000
NATIONAL METHODOGICAL REPORT – PORTUGAL
TABLE OF CONTENTS
SUMMARY.......................................................................................................4
1. INTRODUCTION .........................................................................................6 1.1. Why censuses are carried out ...............................................................6 1.2. History of censuses in Portugal .............................................................6
2. ORGANISATION .........................................................................................7 2.1. Agencies taking part ..............................................................................7 2.2. Human resources involved ..................................................................11
3. UPDATING THE LIST OF AGRICULTURAL HOLDINGS..........................11 3.1. Objective .............................................................................................11 3.2. Methodology for updating the list of agricultural holdings....................11 3.3. Timetable for implementation ..............................................................14
4. COMPILING THE QUESTIONNAIRE ........................................................14 4.1. User consultation.................................................................................14 4.2. Preliminary testing of the questionnaire...............................................15 4.3. Main constraints and policy when drawing up the questionnaire.........16
5. PILOT SURVEY.........................................................................................17 5.1. Objective .............................................................................................17 5.2. Pilot survey methodology and organisation .........................................17 5.3. Timetable for implementation ..............................................................19
6. ACTUAL OPERATION...............................................................................19 6.1. Training ...............................................................................................19 6.2. Organisation of field work – gathering and entering information..........21
7. PUBLICITY CAMPAIGN ............................................................................26
8. MONITORING DATA QUALITY.................................................................29 8.1. Monitoring data collection....................................................................29 8.2. Quality survey (QS) .............................................................................29
9. DISSEMINATION OF RESULTS ...............................................................32 9.1. Dissemination plan ..............................................................................33
2

10. ANNEXES................................................................................................34 10.1. Concepts ...........................................................................................34 10.2. RGA 99 questionnaire – matrix .........................................................35 10.3. Data collection monitoring sheet .......................................................35
3

� Farm Structure Survey 1999/2000 – National Methodological Report – PORTUGAL
SUMMARY
In Portugal, the agricultural census (RGA) took place in several stages: Organisation - establishing a proper, effective organisational structure for the RGA 99 was essential to achieve the objectives of obtaining high-quality, appropriate information from this statistical operation, which also needed to be organised in such a way as to make best use of existing resources. Update the list of holdings - the aim of the operation to update the list of holdings was to establish the most accurate baseline possible for the RGA, in order to facilitate the work of information gathering and enable the resources involved in the operation to be organised and distributed more effectively. Compiling the questionnaire - defining the characteristics of the questionnaire was one of the first stages in the 1999 General Census of Agriculture and, in mid-September 1997, around 50 users were asked to co-operate in identifying the primary requirements. On the basis of the contributions received, knowing that the structure and size of the questionnaire would depend to a large extent (around 80%) on the compulsory questions, a test version incorporating a wide range of the suggestions made was produced. The questions included in the questionnaire were designed to capture the specific features of Portuguese agriculture, in both national and regional terms, as well as meeting Community obligations. As a result of the tests, a well-structured questionnaire was obtained, from the point of view of both the framing and suitability of the questions and practical feasibility in terms of survey time. The final questionnaire is a compromise between the importance of the topics to be included and the implementation capacity and costs associated with the survey and all the work of entering and processing data. Pilot survey - the pilot survey on a reduced scale was implemented in a wholly similar manner to that planned for the RGA, since correct implementation and evaluation of its results would undoubtedly allow for very significant gains when carrying out the census itself. The survey was conducted by direct interviews on a sample set of agricultural holdings in sufficient numbers to obtain useful results. The pilot survey was evaluated in two stages. First, aspects relating to organisation were assessed, particularly as regards the performance of and linkage between the various agencies, evaluation of the training provided and evaluation of the questionnaire. In the second stage, the computer architecture and respective application model were assessed, while the questionnaire and organisational structure were reassessed. Publicity campaign - publicising the RGA operation amongst information providers and users was essential to inform all concerned and to ensure that they took part.
4
� Farm Structure Survey 1999/2000 – National Methodological Report – PORTUGAL
The publicity and promotion campaign for the RGA essentially designed to: - raise farmers’ awareness about implementation of the RGA, so as to
guarantee maximum receptiveness and rigour in the information provided
- promote the RGA amongst users of information and the general public
- promote the institutional image of the INE. Monitoring data quality - during information gathering, monitoring mechanisms were developed with a view to assessing the work undertaken and the quality of the information collected. Dissemination of the results - the dissemination products are available in various media:
- on paper - on CD or other electronic medium - on the Internet.
5

� Farm Structure Survey 1999/2000 – National Methodological Report – PORTUGAL
1. INTRODUCTION
1.1. Why censuses are carried out
Farm censuses fall within the framework of the global agricultural census programmes developed by the Food and Agriculture Organisation of the United Nations (FAO), which recommends that they be carried out every 10 years. At European Union level, too, Community legislation duly provides that farm censuses be carried out every 10 years, and aims to harmonise how these are implemented in each Member State. The principle of harmonisation in terms of methodology, concepts and variables to be collected is essential to an accurate assessment of the agricultural situation in the EU and each Member State. It also allows comparative studies of the different EU countries to be conducted. It should be noted that, at the same time as the general census of agriculture, Portugal proceeded to carry out a comprehensive survey of wine-growing areas, also governed by Community legislation (Council Regulation (EEC) No 357/79 of 5 February 1979). The decision to conduct the two statistical operations simultaneously was justified by the need to rationalise effort and financial resources, as well as by technicalities, particularly relating to convergence and consistency of results. Censuses of agriculture are a way of meeting international obligations and constitute an essential management tool for decision-making, particularly in connection with agricultural, regional and land-use policy. However, interest in the census is not confined to meeting Community and international obligations. Due to its comprehensive nature, this is the only statistical operation that allows results to be obtained for the various geographical levels down to the parish. Information broken down into smaller administrative units (municipality or parish) is amongst the most sought after by information users. This operation’s database constitutes the reference universe and the foundation of the whole statistical programme that goes on during the inter-census period. In fact, there is a vast array of specific surveys, most of them compulsory according to Community legislation, carried out using the census results data file as a sampling baseline for designing the operation.
1.2. History of censuses in Portugal
The first farm census conducted in Portugal dates back to 1952–54; it was carried out in three stages with the country divided into three regions, and was followed by the 1968 and 1979 censuses. The 1989 General Census of Agriculture, carried out simultaneously throughout the territory (mainland plus the Autonomous Regions of the Azores and Madeira), was the first occasion when Portugal conducted a census operation on agriculture that was harmonised with the countries making up
6

� Farm Structure Survey 1999/2000 – National Methodological Report – PORTUGAL
the then EEC. This harmonisation involved altering the definition of an agricultural holding, and Portugal adopted the Community definition. 1.3 – Legislation �� Community Council Regulation (EEC) No 571/88 Council Regulation (EEC) No 2467/96 Commission Decision (EC) 98/377 Commission Decision (EC) 2000/115
�� National At national level, Law No. 6/89 of 15 April 1989 on the National Statistical System (SEN) lays down the obligation to provide information and rules that each informant’s individual data are confidential.
2. ORGANISATION
2.1. Agencies taking part
On the mainland, within the scope of the powers delegated by the INE (National Statistics Institute) to the Regional Agriculture Departments of the Ministry of Agriculture, organising and carrying out the work of data collection and validation of information is a matter for the Regional Agriculture Departments (DRA), linking up with the Regional Statistics Departments (DRE) of the INE. In the Azores and Madeira, responsibility for organising the work fell upon the Regional Statistical Service of the Azores (SREA) and the Regional Statistics Department of Madeira (DREM). In view of the scale of the operation and the need for decentralised management with no loss of efficiency, two structures were set up in each of the Agricultural Regions, one with solely executive functions (Regional Coordination Unit) and the other with policy functions (Regional Commission). Both include staff from the Regional Agriculture Department and the Regional Statistics Department of the INE. With the aim of guiding and monitoring the work to prepare and develop the 1999 General Census of Agriculture (RGA 99) as well as assessing and approving the programme for publishing the results, the Supreme Statistics Council (CSE) resolved, on 28 November 1997, to set up an ad hoc section to monitor the RGA 99. That section was made up of:
- the National Statistics Institute (INE) - the Ministry of Agriculture, Rural Development and Fisheries - the Portuguese Farmers’ Confederation - the National Association of Town Councils - the Regional Governments of the Autonomous Regions - the General Union of Workers (UGT).
7
� Farm Structure Survey 1999/2000 – National Methodological Report – PORTUGAL
Establishing a proper, effective organisational structure for the RGA 99 was essential to achieve the objectives of obtaining high-quality, appropriate information from this statistical operation, which also needed to be organised in such a way as to make best use of existing resources. Consequently, the following structure was established:
Interviewers – The interviewers were responsible for gathering information through direct interviews with agricultural producers. On average, each interviewer administered 350 questionnaires during the period set aside for information gathering (November 1999 – March 2000).
Supervisors – The supervisors monitored interviewers (a maximum of seven) in the task of information gathering. Supervisors played a pivotal role in the organisation of the RGA, since they had to liaise with the higher echelon, providing information about all aspects connected with progress in information gathering through a weekly update. Their tasks were:
- organising and distributing work; - analysing, reviewing and returning questionnaires which had not
been filled in correctly; - assessing and resolving difficulties experienced by individual
interviewers.
Coordinators – Organising the gathering, input and validation of information was a matter for regional centres under the responsibility of the coordinator. The coordinators of each centre reported directly to the regional coordination unit and had responsibility for a geographical survey area, in respect of which they coordinated a team of supervisors (maximum four), interviewers and data input clerks (average of three) and were provided with the computer resources and materials required to carry out their general duties correctly, viz.:
- providing training for interviewers and supervisors - monitoring data collection and analysing the information gathered
that the supervisors passed on to them - monitoring data input - assessing regional difficulties encountered by the teams in their
charge - exporting validated data.
A decentralised structure of regional units with data input facilities allowed for better linkage between all participating agencies, improved monitoring in the field and enabled errors associated with data collection to be identified and corrected more rapidly.
Data input clerks – working at recording centres (54 in the country as a whole), these reported directly to the coordinators. Each clerk entered an average 800 questionnaires each month.
8
� Farm Structure Survey 1999/2000 – National Methodological Report – PORTUGAL
Regional coordination – Staff from the two lead agencies made up the regional coordination unit, which was responsible for the operation of the structure concerned with the gathering, input and validation of information, monitoring the work of the coordinators.
Regional Commission – taking responsibility for coordination and monitoring, the Regional Commission included staff from the two lead agencies, in order to establish a joint forum for coordination and linkage between them in terms of decision-making, making each of them more accountable and granting decision-making power in respect of problems arising in the course of the statistical operation. Its remit was as follows:
- to provide an opinion on organisation and development - to monitor and assess the various stages of implementation - to support and develop promotional and publishing work - to suggest the measures necessary for proper performance of the
operations.
Central Services of the INE Agriculture and Fisheries Section (DEAP) : These took responsibility for national coordination of the operation
9

� Farm Structure Survey 1999/2000 – National Methodological Report – PORTUGAL
ORGANISATION CHART
GENERAL CENSUS OF AGRICULTURE 1999
CO-ORDINATION AND MONITORING
REGIONAL COMMISSION
(Mainland only)
GATHERING/ENTERING/VALIDATING ANALYSING INFORMATION
INFORMATION
DRA / DREREGIONAL DRA DRE
CO-ORDINATION
CO-ORDINATORS
SREACENTRAL
SUPERVISORS SERVICESOF THE INE
DREM
10

� Farm Structure Survey 1999/2000 – National Methodological Report – PORTUGAL
2.2. Human resources involved
EDM TM BL BI RO ALE ALG Mainland Azores Madeira Portugal
Initial number of holdings 106 524 85 803 134 126 81 067 102 266 51 565 26 378 587 729 29 767 19 374 636 870Final number of holdings 67 546 70 006 79 806 48 313 61 615 35 906 18 971 382 163 19 280 14 526 415 969Number of interviewers 282 300 325 214 243 120 70 1 554 106 60 1 720Number of supervisors 41 40 50 32 42 24 12 241 9 22 272Number of co-ordinators 14 14 16 11 14 11 4 84 12 5 101Number of regional technicians 2 3 4 5 3 3 4 24 2 4 30Number of data entry clerks 22 22 28 14 27 13 7 133 11 6 150Total 361 379 423 276 329 171 97 2 036 140 97 2 273
EDM – Agricultural Region of Entre Douro e Minho RO – Agricultural Region of the Ribatejo e Oeste TM – Agricultural Region of Trás os Montes ALE – Agricultural Region of the Alentejo BL – Agricultural Region of Beira Litoral (Coast) ALG – Agricultural Region of the Algarve BI -– Agricultural Region of Beira Interior (Inland)
3. UPDATING THE LIST OF AGRICULTURAL HOLDINGS
3.1. Objective
The aim of the operation to update the list of holdings was to establish the most accurate baseline possible for the RGA 99, in order to facilitate the work of information gathering and enable the resources involved in the operation to be organised and distributed more effectively. The following were the main features of the work:
- confirming the existence of the agricultural holdings on the list, in line with the conditions set for inclusion in the census;
- confirming or amending producer identification data; - detecting duplicated, former or abandoned holdings; - recording new holdings not appearing on the list; - picking up the district/municipality/parish (DDCCFREG) codes for
holdings located in parishes which have changed since 1989; - recording changed DDCCFREG codes.
These procedures were carried out bearing in mind the concept of an agricultural holding and that of an abandoned or former holding (see Annex 10.1 – Concepts).
3.2. Methodology for updating the list of agricultural holdings
The work involved the following phases: - updating the list of holdings through a desk study; - updating the list of holdings in the field;
11

� Farm Structure Survey 1999/2000 – National Methodological Report – PORTUGAL
- evaluating the quality of the final data file.
The operation to update the list of agricultural holdings was carried out in all the agricultural regions of the mainland and the Autonomous Regions of the Azores and Madeira. 3.2.1. Updating through desk study
At central level, the Agricultural Sampling Base (BAA – made up of holdings from the RGA89, with 600 466 entries) was compared with and updated against the lists of agricultural producers obtained from other credible sources. Each of the previously described bases was standardised and converted to a common format to facilitate the process of eliminating duplication and incorporating all information in the end result. A single file was set up with 1 538 821 entries in respect of which the following procedures were adopted:
- auditing the quality and surveying the characteristics of the data; - standardisation and error correction; - data enrichment based on external information; - cross-checking and identification of duplicate entries.
Subsequently, a series of criteria were defined in order to improve the quality of the list of holdings, removing agricultural holdings that had been duplicated, were non-existent (former or abandoned holdings) or did not meet the conditions for consideration in terms of the minimum limits for inclusion in the surveys. After updating through desk study at central level, the number of entries on the list of agricultural holdings was around 634 802, i.e. 5.7% more than in the initial BAA.
Updating at regional level, taking as its starting point the list of agricultural holdings updated at central level, consisting of 634 802 holdings, more specific regional or local data files (e.g. on beekeepers, State-funded projects, etc.) were examined, along with information from municipal officers of the Regional Agriculture Departments on the appearance/existence or disappearance/abandonment of holdings of a certain size. After checking and recording all situations, a list drawn up solely for the fieldwork gave the numerical identification or name, address, post code, telephone number, parish and parish of residence for each holding. The final result of this work was a list of some 638 297 agricultural holdings, i.e. an increase of approximately 0.6% by comparison with the work undertaken at central level. 3.2.2. Updating in the field
Updating in the field consisted of updating the list of agricultural holdings deriving from the desk studies at central and regional level. Parish Committees of agricultural and parish experts chosen by the respective
12

� Farm Structure Survey 1999/2000 – National Methodological Report – PORTUGAL
presidents were set up to this end. These were able to update the list by correcting names and addresses, adding new holdings and removing others and checking the existence of at least one of the three conditions for inclusion in the census in particular. In the 4 130 parishes, this task was undertaken by interviewers whose brief was to contact the members of the Parish Committees. The alterations were then entered on computer by people especially contracted for the purpose. The final list resulting from updating in the field contained 636 870 agricultural holdings, representing an increase of 0.3% on the update at central level. 3.2.3. Evaluation of the quality of the final data file
The aim of the quality control operation was to assess the quality of the final list of agricultural holdings, i.e. the starting point for implementing the RGA 99. Evaluation was done by means of a quality control survey, carried out by sampling a series of holdings in sufficient numbers to obtain the desired results. The survey was conducted by direct interviews at the holdings in the sample in all the mainland agricultural regions and the Autonomous Regions of the Azores and Madeira. After field updating, a sample of around 7 000 agricultural holdings was selected. The quality assessment process yielded the following findings:
- The names and addresses of the agricultural producers appearing on the list were seriously out of date, sometimes in 60% of cases.
- The number of holdings appearing in the data file should be reduced by around 18% according to the list resulting from the fieldwork
- Updating of the lists of producers in the field stage was more efficient in predominantly rural parishes, as the committees in predominantly urban parishes did not know the majority of the producers appearing on the list
- In some regions, an excessive number of holdings appeared in the initial list, but there had been no equivalent process of removal.
13

� Farm Structure Survey 1999/2000 – National Methodological Report – PORTUGAL
The following graph shows changes in the number of agricultural holdings during the phases of the work.
Changes in the Number of Holdings on the List - RGA 99
0100000200000300000400000500000600000700000
Desk StudyUpdating(Central)
Desk StudyUpdating(Regional)
FieldUpdating
QualityControl
Prediction
Portugal
3.3. Timetable for implementation
Tasks Date completed Updating list of agricultural holdings, desk study at central level
8-01-99
Training DRE and DRA 29-01-99 Updating list of agricultural holdings, desk study at regional level
26-02-99
Updating list of agricultural holdings in the field 30-04-99 Analysing the data file 14-05-99 Assessing quality of the final data file 31-05-99
4. COMPILING THE QUESTIONNAIRE
4.1. User consultation
Defining the characteristics of the questionnaire was one of the first stages in the 1999 General Census of Agriculture and, in mid-September 1997, around 50 users were asked to co-operate in identifying the primary requirements. On the basis of the contributions received, knowing that the structure and size of the questionnaire would depend to a large extent (around 80%) on the compulsory questions, a test version incorporating a wide range of the suggestions made was produced.
14

� Farm Structure Survey 1999/2000 – National Methodological Report – PORTUGAL
The questions included in the questionnaire were designed to capture the specific features of Portuguese agriculture, in both national and regional terms, as well as meeting Community obligations.
4.2. Preliminary testing of the questionnaire
The tests carried out on the questionnaire that served as a basis for gathering information in the RGA 99 were intended to work out a recording system appropriate for information gathering, bearing in mind issues related to reliability of responses, survey time and proper administration of the questionnaire by the interviewers. Three versions of the RGA 99 questionnaire were tested across Portuguese territory in direct interviews. Data were collection in the field in three stages:
- 1st test: 20 to 24 April 1998; - 2nd test: 1 to 19 June 1998; - 3rd test: 14 to 22 July 1998.
The various test questionnaires were administered by coordinators from the Regional Agriculture Departments on a series of holdings representative of farming practices in the region. The tests were carried out on agricultural holdings which had as many features as possible in order to test the greatest number of questions and situations. Thus, the questions included in the first test questionnaire aimed to meet Community obligations and users' main requirements. Changes to the questions in the second and third test questionnaires were due to adaptation on a regional basis (developing a questionnaire per agricultural region in the case of the third test) and in terms of information gathering: reliability of responses, survey time and feasibility of administration by the interviewers. The various tests on the RGA 99 questionnaire proved to be extremely important, and enabled the questions to be made more appropriate by framing them better or even by removing some when a reliable response could not be guaranteed. As a result of the tests, a well-structured questionnaire was obtained, from the point of view of both the framing and suitability of the questions and practical feasibility in terms of survey time. It should be pointed out that a very extensive questionnaire, apart from becoming boring for interviewer and interviewee, with the harmful consequences that involves, makes the statistical operation more expensive. Furthermore, without challenging the relevance of a series of questions, which could possibly have been included, the final questionnaire is a compromise between the importance of the topics to be included and the implementation capacity and costs associated with the survey and all the work of entering and processing data.
15
� Farm Structure Survey 1999/2000 – National Methodological Report – PORTUGAL
4.3. Main constraints and policy when drawing up the questionnaire
Although the General Census of Agriculture is an opportune moment to put a series of questions of interest to users, not all of these could be included because the following points were taken into consideration in compiling the questionnaire: The scale of the questionnaire: Very extensive questionnaires imply very long interviews, which affect interviewees' willingness to respond and put pressure on interviewers not to take enough time in putting questions to obtain the best responses, thereby reducing the quality of the information collected. They also increase the number of concepts and definitions that the interviewers have to learn during training, which also makes for a greater number of survey errors. Reliability of responses: Questions involving a high degree of difficulty for farmers were eliminated. Questions which could provide insight into aspects connected with income, debts, etc. always presented a high degree of difficulty. In addition, the type of questions whose answers reflected an intention rather than a fact or past event also presented a high degree of difficulty. Don’t knows: Questions were deleted when the vast majority of farmers were unable to answer them and it was not possible to gather the information by indirect means. Continuity: The bulk of the questions put in earlier censuses were retained, enabling the user to analyse changes over time in a wide range of characteristics of Portuguese agriculture. Giving priority to structural questions: Where possible, questions of an economic nature were cut down, since the survey was mainly concerned with the structure of agricultural holdings and its results, going down to the geographical level of the parish, would constitute the sampling base for all subsequent surveys over the next ten years. Detailed census of wine-growing areas: Vineyards were examined at length (varieties and ages) as the survey of wine-growing areas was conducted at the same time. These questions were retained because it was compulsory to include them, but the quality of the data may not reach the desired standard. Concern with environmental questions and the multi-purpose role of farming: For the first time, a set of questions was included on these aspects, which have taken on particular importance in policy discussions about the future of farming. Concern with specific regional features: Nine questionnaires were drawn up, one for each Regional Agriculture Department and one for each Autonomous Region. This reflected the desire to identify the specific features of each region while not calling into question the need for overall information on a national basis and reducing the size of the questionnaire. Compulsory questions: These represent about 80% of the total questions in the questionnaire.
16
� Farm Structure Survey 1999/2000 – National Methodological Report – PORTUGAL
5. PILOT SURVEY
5.1. Objective
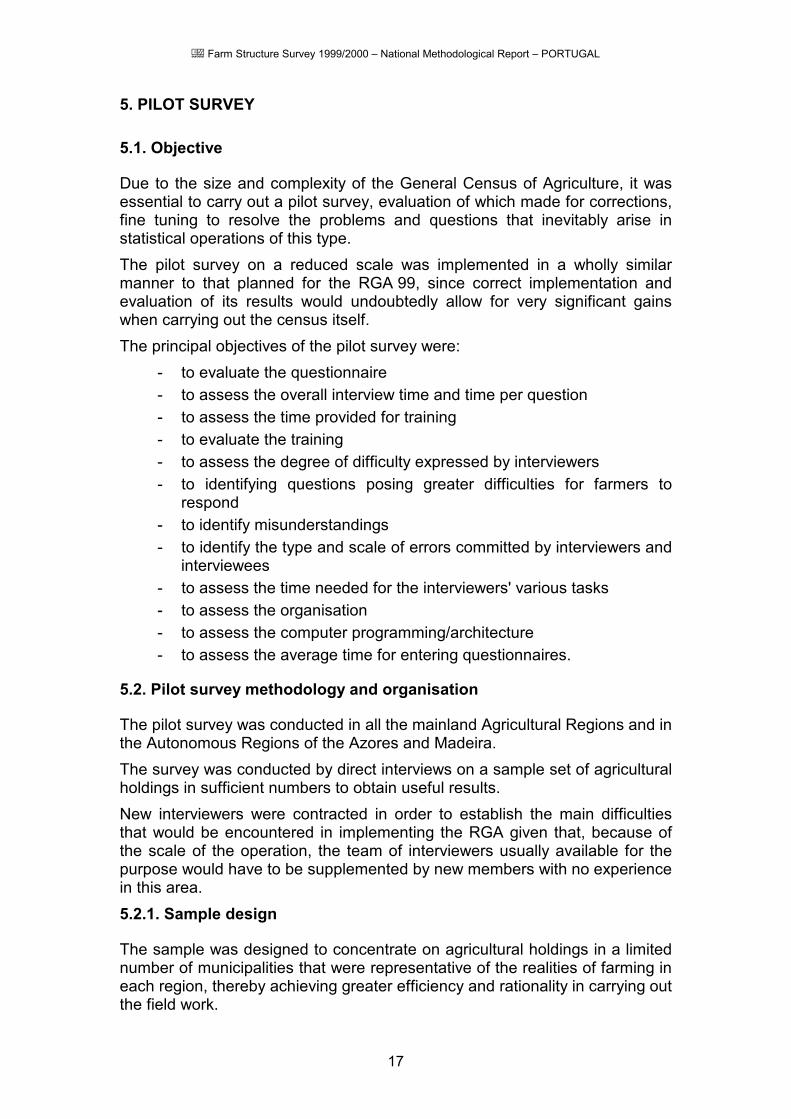
Due to the size and complexity of the General Census of Agriculture, it was essential to carry out a pilot survey, evaluation of which made for corrections, fine tuning to resolve the problems and questions that inevitably arise in statistical operations of this type. The pilot survey on a reduced scale was implemented in a wholly similar manner to that planned for the RGA 99, since correct implementation and evaluation of its results would undoubtedly allow for very significant gains when carrying out the census itself. The principal objectives of the pilot survey were:
- to evaluate the questionnaire - to assess the overall interview time and time per question - to assess the time provided for training - to evaluate the training - to assess the degree of difficulty expressed by interviewers - to identifying questions posing greater difficulties for farmers to
respond - to identify misunderstandings - to identify the type and scale of errors committed by interviewers and
interviewees - to assess the time needed for the interviewers' various tasks - to assess the organisation - to assess the computer programming/architecture - to assess the average time for entering questionnaires.
5.2. Pilot survey methodology and organisation
The pilot survey was conducted in all the mainland Agricultural Regions and in the Autonomous Regions of the Azores and Madeira. The survey was conducted by direct interviews on a sample set of agricultural holdings in sufficient numbers to obtain useful results. New interviewers were contracted in order to establish the main difficulties that would be encountered in implementing the RGA given that, because of the scale of the operation, the team of interviewers usually available for the purpose would have to be supplemented by new members with no experience in this area. 5.2.1. Sample design
The sample was designed to concentrate on agricultural holdings in a limited number of municipalities that were representative of the realities of farming in each region, thereby achieving greater efficiency and rationality in carrying out the field work.
17

� Farm Structure Survey 1999/2000 – National Methodological Report – PORTUGAL
The holdings in each municipality were selected on the basis of the type of farming (OTE) and gross margin variables. The sample was set at 100 holdings per municipality, with the exception of the Autonomous Region of the Azores where it was 50. Nationally, the sample was of 3 400 agricultural holdings. 5.2.2. Field work
One-half of the interviewers were recruited from the group who usually carry out agricultural surveys, and the remaining 50% had never done agricultural surveys. The field work took place during November 1998, following two days’ training. The field work was quite difficult due to the large number of holdings which had to be replaced because the sample was out of date, and many holdings had changed hands, others had incorrect addresses and others no longer existed. The letter advising producers that they would be receiving a visit from the interviewer had a positive influence on their receptiveness. 5.2.3. Evaluation of the pilot survey
The pilot survey was evaluated in two stages. First, aspects relating to organisation were assessed, particularly as regards the performance of and linkage between the various agencies, evaluation of the training provided and evaluation of the questionnaire. In the second stage, the computer architecture and respective application model were assessed, while the questionnaire and organisational structure were reassessed. The conclusions drawn were as follows:
�� The organisational structure proposed for the RGA 99, based on interviewers, supervisors and coordinators, is appropriate for operations of this type.
�� The pilot survey does, however, show that there could be difficulties with setting up a structure of this kind, particularly at the following levels:
- Administrative procedures All administrative procedures relating to the issue of credentials, contracts and payments need to be properly planned. There is also a need for proper planning of instruments such as monitoring sheets, allowing insight at the different levels into the progress and quality of the work (data collection, input and analysis).
- Training The pilot survey highlighted the need to improve and reinforce the amount of training provided at different levels and to adapt it to the duties of each individual. Reinforcement of the practical component as an integral part of training must not be overlooked, especially at the level of interviewers and supervisors.
18

� Farm Structure Survey 1999/2000 – National Methodological Report – PORTUGAL
The instruction manual must be able to resolve any doubts associated with the questionnaire.
- Questionnaire Assessment of the suitability of the questionnaire is undoubtedly one of the major objectives of the pilot survey. Identifying the degree of difficulty in responding, errors detected and survey time and the questionnaire design are essential aspects that need to be assessed because they have repercussions on the various components of the survey, i.e. the instruction manual, training, computer application, organisational structure, etc. The overall interview time during the pilot survey was 2–2½ hours.
5.3. Timetable for implementation
Tasks Date of completion Initial document August 1998 Questionnaire September 1998 Instruction manual October 1998 Sample design September 1998 Letter to inform farmers October 1998 Taking on new interviewers October 1998 Training October 1998 Administrative procedures September 1998 Gathering information November 1998 Evaluating the operation December 1998
6. ACTUAL OPERATION
6.1. Training
6.1.1. Objective
The objective of the training programme for the various RGA 99 operators was to provide qualified human resources who could correctly carry out the duties with which they were entrusted. Because of the scale and the specific features of the RGA 1999, the various operators had to be trained in succession, in view of their respective profiles and duties. Appropriate training was provided at each level, without ambiguities and with an equivalent degree of rigour all along the line, so that the entire team could reach a uniform level of preparation and competence. Aspects relating to the organisational structure, the programme and duration of training could not therefore be overlooked because it was essential that there should be a baseline of common objectives at national level, although the necessary adaptations would be made at regional level.
19

� Farm Structure Survey 1999/2000 – National Methodological Report – PORTUGAL
6.1.2. Developing the training programme
Training was intended to give technical staff skills geared to the following objectives:
- knowledge of the aims and purpose of the operation - mastery of the concepts, definitions, methodology and procedures
associated with the survey - mastery of the computer application underpinning the RGA 99 - mastery of aspects related to coordination/management of the
operation - leadership and team management skills - skills to back up training - improved ability to analyse information - familiarity with regional agriculture.
The training programme tackled the following aspects: - incorporation into the National Statistics System - incorporation into Eurostat; Community obligations; data transmission
system - notions about the operation in general and how it would work (chain
of command, levels of responsibility, etc.) - team leadership and coordination - interview techniques - guidance about training at the next level - introduction to the methodology for monitoring and managing the
information-gathering operation: documents were prepared at national level to be used by everyone; explanation of procedures and timetabling.
- the manual: every point referred to in the manual was covered, both technically and in terms of procedures for filling in the questionnaire. Although most of the people had technical mastery of all concepts, the training given was based on the lowest level of knowledge. Particular attention was paid to some changes in concepts.
- team leadership and coordination.
The length of training varied: - Technical staff – 8 days - Coordinators – 11 days - Supervisors – 13 days - Interviewers – 8 days.
The training had a substantial practical component (interviewing farmers and simulating practical cases), especially for supervisors and interviewers. The number of participants per session never exceeded 20.
20
� Farm Structure Survey 1999/2000 – National Methodological Report – PORTUGAL
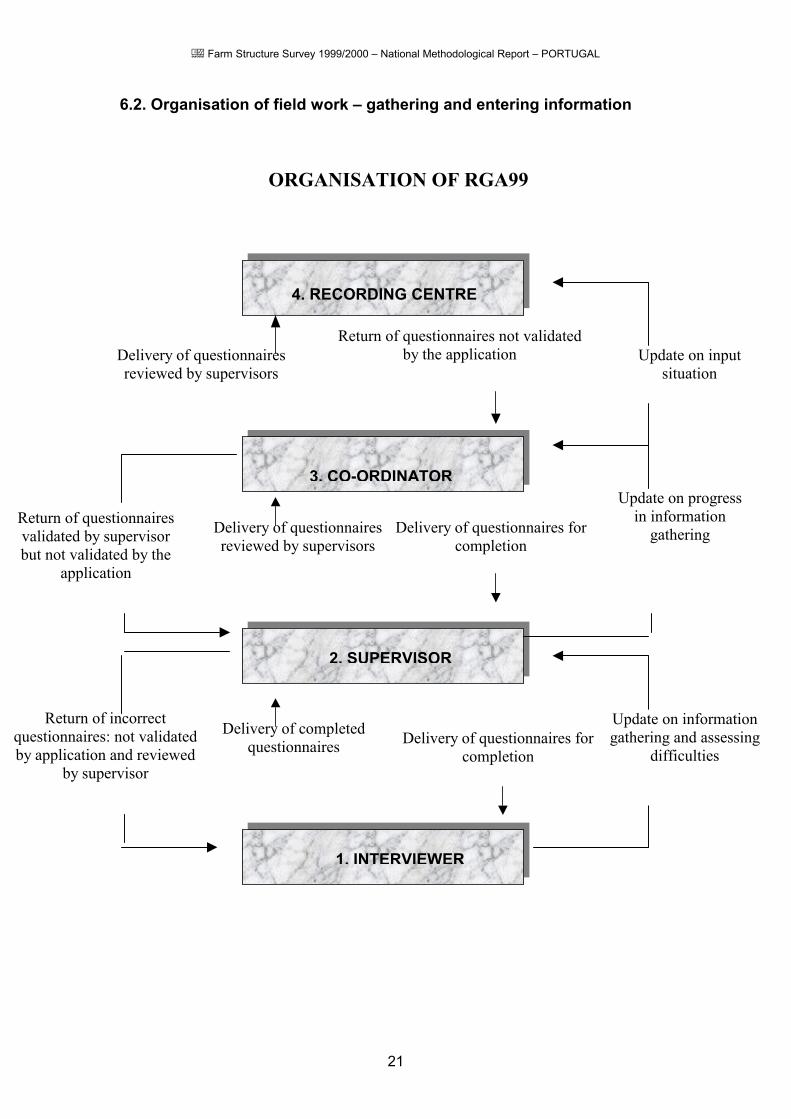
6.2. Organisation of field work – gathering and entering information
ORGANISATION OF RGA99
4. RECORDING CENTRE
Delivery of questionnaires reviewed by supervisors
Return of questionnaires not validated by the application Update on input
situation
3. CO-ORDINATOR
2. SUPERVISOR
1. INTERVIEWER
Update on information gathering and assessing
difficulties
Delivery of questionnaires for completion
Return of incorrect questionnaires: not validated by application and reviewed
by supervisor
Delivery of completed questionnaires
Update on progress in information
gathering
Delivery of questionnaires reviewed by supervisors
Delivery of questionnaires for completion
Return of questionnaires validated by supervisor but not validated by the
application
21

� Farm Structure Survey 1999/2000 – National Methodological Report – PORTUGAL
6.2.1 – Information gathering
Information was gathered in the field over five months from November 1999 to March 2000.
Operators’ profile Interviewers had complete a minimum of 11 years’ education. Supervisors had completed higher/intermediate training in the field of agricultural sciences, and were computer literate. The vast majority of coordinators had received higher/intermediate training in the field of agriculture, and had wide experience of carrying out agricultural surveys. Preference in selection was given to operators with experience in the agricultural field and who knew about local farming. 6.2.1. IT organisation
Because of the scale of the RGA 99, a large number of operators and institutional structures needed to take part. IT solutions for organising the RGA 99 therefore took into account the fact that the level of training and the resources available within each unit were not homogeneous. The following aspects were vital when designing the architecture and choosing options for data input and computer processing:
- the user-friendliness of the input and validation programme, so that it could be used easily by a wide range of non-specialist employees.
- the speed of input/validation: As far as possible, priority was given to options in terms of equipment and programming that allowed for significant gains, reducing the time taken to fill in a questionnaire in the field, to input, analyse and, if necessary, to correct it.
- data integration: It was necessary to arrange to have preliminary accumulators available at any stage of the operation. It was therefore important to ensure that all information was integrated up to national level.
The philosophy underlying the organisational arrangements for data collection and input was as follows:
- minimising the intervention of specialist IT personnel; - minimising the use of communications infrastructure; - standardising working methods at the various organisational levels in
order to optimise the application to be developed; - simplifying data consolidation; - making all information accessible as soon as possible;
22
� Farm Structure Survey 1999/2000 – National Methodological Report – PORTUGAL
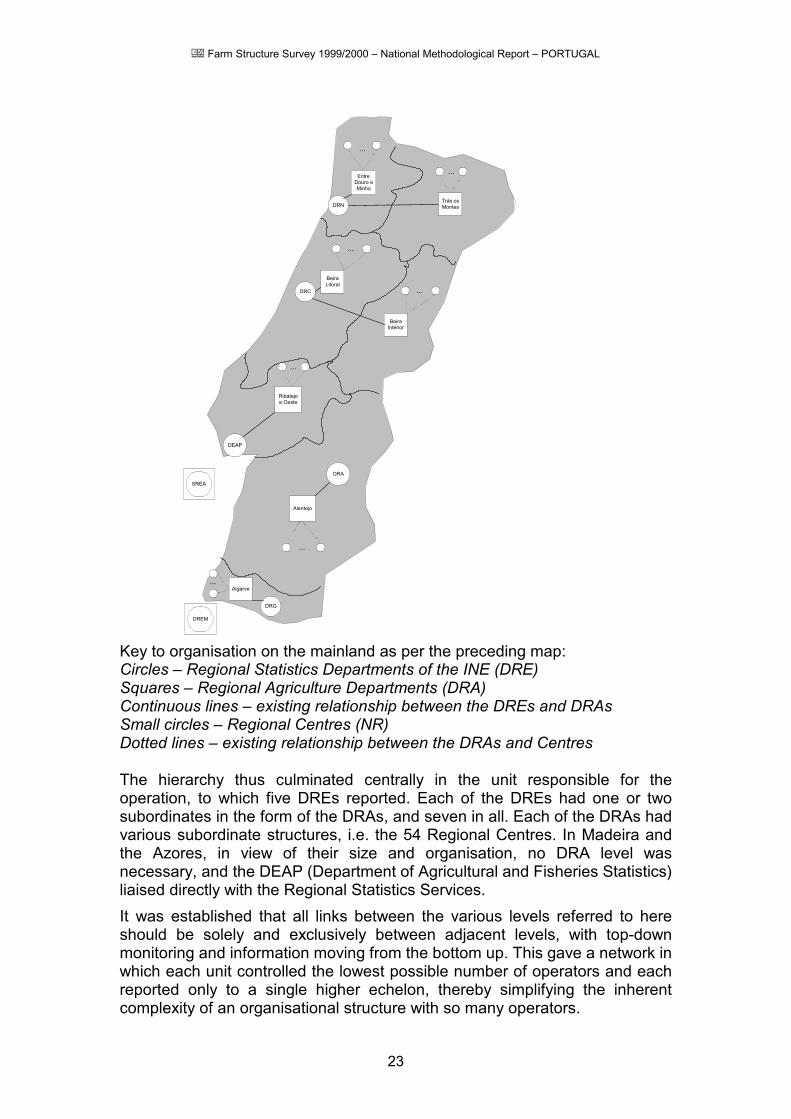
23
DRN
EntreDouro eMinho
Trás osMontes
DRC
BeiraLitoral
BeiraInterior
DEAP
Ribatejoe Oeste
DRA
Alentejo
DRG
Algarve
SREA
DREM
...
...
...
...
...
...
...
Key to organisation on the mainland as per the preceding map: Circles – Regional Statistics Departments of the INE (DRE) Squares – Regional Agriculture Departments (DRA) Continuous lines – existing relationship between the DREs and DRAs Small circles – Regional Centres (NR) Dotted lines – existing relationship between the DRAs and Centres The hierarchy thus culminated centrally in the unit responsible for the operation, to which five DREs reported. Each of the DREs had one or two subordinates in the form of the DRAs, and seven in all. Each of the DRAs had various subordinate structures, i.e. the 54 Regional Centres. In Madeira and the Azores, in view of their size and organisation, no DRA level was necessary, and the DEAP (Department of Agricultural and Fisheries Statistics) liaised directly with the Regional Statistics Services. It was established that all links between the various levels referred to here should be solely and exclusively between adjacent levels, with top-down monitoring and information moving from the bottom up. This gave a network in which each unit controlled the lowest possible number of operators and each reported only to a single higher echelon, thereby simplifying the inherent complexity of an organisational structure with so many operators.

� Farm Structure Survey 1999/2000 – National Methodological Report – PORTUGAL
With sole responsibility for the operation and for the entire organisational structure, the Department of Agricultural and Fisheries Statistics (DEAP) integrated and consolidated all information. The aim was to analyse all the information, enabling the DEAP to produce pre-defined analytical charts (e.g. accumulators) and some ad-hoc analytical charts. It was also necessary to produce preliminary results for dissemination (e.g. press releases). Using the Oracle Production Database Central Server, all information could be consolidated and ad-hoc consultation tools could be used. Using Oracle Production Database Regional Servers at DRE level, all information to be consolidated and ad-hoc consultation tools could be used. The INE's whole communications infrastructure allowed all DREs and the DEAP to communicate. The planned technological infrastructure was based on a network structure linked through a communication system which enabled information exchange by e-mail, along with a system of weekly updates, so that progress could be monitored on an ongoing basis. The data-input application triggered data validation during input (on-line). This validation could be triggered later, after input (batch processing), and a file summarising all the validation tests could be produced. This could be analysed on screen or printed out. The results of these validations could be analysed by the coordinator or, if necessary, by the coordinator in conjunction with the supervisor . The data-inputters made the necessary corrections. A further batch validation ensued and so on. Only after validation had been completed without errors were data considered to be correct.
24

� Farm Structure Survey 1999/2000 – National Methodological Report – PORTUGAL
Diagram of computer organisation
Interviewer Level -------------------------------------------------------------------------------------------------------
Supervisor Level -------------------------------------------------------------------------------------------------------
Coordinator Level -------------------------------------------------------------------------------------------------------
DRA Level -------------------------------------------------------------------------------------------------------
RGA-99Regional
Medium capacity server
DRE Level ------------------------------------------------------------------------------------------------------- Central Level
Central RGA-99database
Large capacity server
-------------------------------------------------------------------------------------------------------
25

� Farm Structure Survey 1999/2000 – National Methodological Report – PORTUGAL
Information processing Information from the RGA 99 underwent several processes. The initial process was to distribute the list of agricultural holdings to all agencies at each level of the pyramid for import into their computer equipment. Once this first stage was complete, each unit had the baseline universe for which it was responsible, in which each holding to be surveyed was duly identified. It should be noted that the information associated with each holding had not yet been entered. The working database allowed progress of the survey to be checked through monitoring responses and the acquisition of new information to be assessed. Entering holdings was another process, divided into two stages at base level only. In the first stage, information obtained from holdings in the baseline universe was keyed in. In the second, new holdings, i.e. any that were not considered within the baseline universe, were entered. This process also made provision for removing holdings from the baseline universe when it was ascertained that they no longer existed although they had been left on the initial list of holdings. Holdings in the baseline universe were identified by a number comprising 13 digits, two for the agricultural region, six for the district/municipality/parish code and [five?] for numbering 1 to n within each parish. The numbering of new holdings within a parish began with 5000, a number which far exceeded the existing maximum per parish. Data validation was the third process to be considered. The information on each holding was analysed automatically. If this was consistent according to the rules defined, the holding was counted as correct. If it was inconsistent, the holding was taken as wrongly entered. Consolidation was in two stages. The first was exporting information from one level to the higher echelon on holdings containing information considered to be valid. The second was importing information from the lower echelon.
7. PUBLICITY CAMPAIGN
Publicising the RGA 99 operation amongst information providers and users was essential to inform all concerned and to ensure that they took part. The advertising and publicity campaign was the only means of communication between the INE and the information providers, in this case the farmers, given that no circular giving information on the operation was sent in advance. Experience gained from earlier farm surveys had shown that farmers’ participation and receptiveness were greater when they were well informed. The publicity and promotion campaign for the RGA 99 was essentially designed to:
- raise farmers’ awareness about implementation of the RGA 99, so as to guarantee maximum receptiveness and rigour in the information provided
26
� Farm Structure Survey 1999/2000 – National Methodological Report – PORTUGAL
- promote the RGA 99 amongst users of information and the general public
- promote the institutional image of the INE.
The RGA 99 publicity campaign mainly covered the following aspects: - What is the purpose of the RGA 99? - To whom is the RGA 99 directed? - How is it implemented? By whom? - When is it carried out? - Safeguarding the confidentiality of individual information - Obligation to respond.
The publicity campaign was scheduled to coincide mainly with the following dates:
- from the second half of October to the beginning of December 1999 - January 2000 - March 2000.
The activities were:
�� Creating an image for the RGA 99 Creating an image to identify the operation was an essential means of publicising the operation. It was possible to come up with an evocative image identified with the theme of agriculture.
�� Creating a Web page Creating a Web page was a quick way of publicising this operation amongst the general population and users (press, researchers, decision-makers, etc.), but not an effective means of access to farmers. Apart from showing the image of the RGA 99 and communicating the message of the campaign, the page contained the following documents:
- concepts - contacts (to clarify doubts and make suggestions) - Frequently Asked Questions and relevant responses - an instruction manual - a support manual - an Interviewer’s Good Practice Guide - monitoring guidelines - a manual of procedures - back-up forms - the recording instrument - a back-up questionnaire - statistical classification - updates on progress of work - press cuttings referring to the topic
27

� Farm Structure Survey 1999/2000 – National Methodological Report – PORTUGAL
�� Creating media for publicising the operation Leaflets, posters and stickers were prepared for distribution and display in various places, so as to ensure widespread publicity for the operation.
�� Advertising campaign on TV, radio and press TV and radio would be the most effective ways of reaching the target audience, so it was immediately planned to arrange the following:
- Agency-prepared spots broadcast on national and local TV and radio - TV and radio interviews - interviews and advertising during TV programmes mainly directed at
the target audience - advertising in national newspapers and specialist magazines - Recognised experts in farming were approached to write short
articles about the RGA 99.
�� a national seminar to launch the operation The RGA 99 was presented to the media and a series of experts at an afternoon seminar. At the same time, the INE circulated a report to the media about the RGA 99 under the following title “Ten questions, ten responses. All there is to know about the 1999 General Census of Agriculture that starts today”.
�� Organising regional seminars Regional sessions were organised to present the RGA 99 to local representatives who could best contribute towards publicising the operation widely and effectively, viz.:
- farmer associations - farmer co-operatives - universities - Autonomous Administrations - parish councils.
�� Publicising the RGA 99 through other institutions The DEAP requested co-operation from various institutions in publicising the RGA 99 with a view to ensuring better distribution of the promotional material as well as providing any additional clarification.
�� Explanatory sessions On receiving the mailing about the RGA 99 with a request to publicise the operation, some associations/co-operatives stated their willingness to cooperate with the INE in explanatory sessions with their members provided that the INE took charge of the technical part of such sessions.
28
� Farm Structure Survey 1999/2000 – National Methodological Report – PORTUGAL
�� Secondary schools Some work to publicise the RGA 99 was undertaken in schools. Explanatory lessons use teaching materials available on the Web site for the RGA 99. The second publicity campaign was launched at the end of the information-gathering operation in March 2000, with the following objectives:
- to guarantee that census was exhaustive by targeting farmers who had not been contacted, were not on the initial list of holdings or had been difficult to contact or locate;
- to promote the RGA 99, the institutional image of the INE and the agencies involved;
- to thank farmers for their co-operation.
8. MONITORING DATA QUALITY
During information gathering, monitoring mechanisms were developed with a view to assessing the work undertaken and the quality of the information collected.
8.1. Monitoring data collection
The work of monitoring data collection consisted of selecting a set of holdings surveyed by each interviewer and carrying out another survey using a specific questionnaire for the purpose. This questionnaire was made up of questions which enabled the quality of the information gathered by the interviewer and the latter’s behaviour during contact with the farmer to be gauged. The coordinators and supervisors conducted more than 11 000 repeat surveys. This operation allowed systematic errors and cheating to be detected, giving greater quality and rigour to the work undertaken. (Annex 10.3 – data collection monitoring questionnaire)
8.2. Quality survey (QS)
The purpose of the RGA 99 quality survey was to determine and quantify errors in content. Errors in content are a fundamental component of the overall rating of the technical quality of the RGA 99. These are directly related to the characteristics of the agricultural holdings taking part in the census. Mainly, they are due to erroneous or inconsistent declarations for particular characteristics, poor performance by the interviewer or misinterpretation of the questionnaire. Errors were identified by comparing the data collected by the “RGA 99 interviewer” with those collected by the “QS interviewer” on the same statistical unit. Differences encountered are considered to be errors committed by the “RGA 99 interviewer”, starting from the principle that errors deriving from the production process are not attributed to the “QS interviewer”.
29
� Farm Structure Survey 1999/2000 – National Methodological Report – PORTUGAL
The time between the first and second interviews was as short as possible in order to avoid the influence of the factor of interviewees’ “forgetfulness”. 8.2.1. Sampling plan
The sample comprised 15 871 units, representing 2.36% of the universe of holdings on the list of agricultural holdings that constituted the starting point for the RGA 99 and 3.8% of the actual number of holdings at the end of the RGA 99. The sample was selected at random in order to:
- guarantee regional representativeness by proportional distribution of the sample;
- ensure coverage of all areas in which the interviewers operated.
8.2.2. Designing the questionnaire for the quality survey
The RGA 99 questionnaire was amended by removing regional questions and others of lesser significance, bearing in mind the size of the respective questionnaire and the possibility of assessing all variables. The date of the first interview was included to establish the time between the first and second interviews. 8.2.3. Field work
The structure of this operation was entirely independent of that for gathering the RGA 99 information, thereby guaranteeing complete lack of bias. The work was carried out by interviewers who gathered information from the agricultural holdings and by agents who carried out monitoring, analysis and input of the information on portable computers. The information-gathering period was substantially the same as that for gathering the RGA 99 information. Carrying out the operations simultaneously helped to eliminate problems arising from responses given by farmers at different times. 8.2.4. Analysis of the QS results
The process of evaluating errors in content was based on a matrix analysis model where the response patterns obtained in the RGA 99 were cross-referenced with those obtained in the QS for each variable. If there were no errors in content in the units which were resurveyed, the double-entry matrix would take all elements as nil except those on the main diagonal and, in this case, the overall index of consistency would be 100%. Overall Index of Consistency (OIC) – (percentage match between RGA 99 and QS responses for a given variable, i.e. 100% when all units are classified in the same way on both occasions).
30

� Farm Structure Survey 1999/2000 – National Methodological Report – PORTUGAL
Results of the quality survey – Overall Index of Consistency RGA 99 Variable OIC
(%) Total area (ha) 99.97 Woods and forests not under crops (ha) 99.94 Total poultry (No.) 99.92 Total number of hours [person] not employed directly by the producer 99.92 Total pigs (No. ) 99.80 Total dried fruit (ha) 99.70 Total vineyards (ha) 99.58 Utilised Agricultural Area (UAA) (ha) 99.58 Total temporary crops (ha) 99.50 Number of days’ casual work – men 99.47 Total cereals for grain (ha) 99.42 Total grassland and fodder crops (ha) 99.41 Total arable land (ha) 99.29 Total bovine animals (No. ) 99.27 Irrigable area (ha) 99.22 Total days’ casual work (No. ) 99.17 Number days’ casual work – women 99.00 Total permanent crops (ha) 98.94 Total arable land – under permanent crops (ha) 98.76 Total permanent farm workers, full time (No. ) 98.65 Total fresh fruits (ha) 98.64 Total arable land – successive crops (ha) 98.61 Total sheep (No. ) 98.27 Total permanent farm workers, working time >0 – <25% (No. ) 98.10 Unutilised agricultural area (ha) 98.08 Kitchen garden (ha) 97.40 Total citrus (ha) 97.20 Total goats (No. ) 96.35 Total permanent farm workers, working time 25 – < 50% (No. ) 95.92 Vocational training of producer (No. ) 95.09 Total parcels (No. ) 87.10 Location of holding (No. ) 87.00 Census condition (No. ) 85.50 Total permanent farm workers, working time 75 – < 100% (No. ) 84.62 Farm population, number of individuals 84.18 Aid/subsidies – diesel subsidy (No. ) 82.56 Professional situation of producer off-farm (No. ) 82.31 Aid/subsidies – sheep/goats (No. ) 80.23
31

� Farm Structure Survey 1999/2000 – National Methodological Report – PORTUGAL
Educational level of producer (No. ) 79.29 Aid/subsidies – arable crops and/or rice (No. ) 79.15 Aid/subsidies – suckling cows (No. ) 77.56 Total permanent farm workers, working time 50 – < 75% (No. ) 72.57 Source of income (No. ) 70.50 First off-farm income (No. ) 68.11 Producer with paid off-farm activity (major) (No. ) 62.43 Aid/subsidies – agri-environmental (No. ) 62.34 Producer with paid off-farm activity (subsidiary) (No. ) 57.78 Producer’s farm working time (No. ) 40.30 On the whole, the QS is a valuable tool for assessing the quality of the information gathered for the RGA 99. Nevertheless, any reading of the results depends to some extent conditioned by how the statistical indicators under analysis are calculated. It is therefore necessary to aim for an intermediate position amongst assessments produced by the different indicators. A profile of the agricultural producer explains why some OICs have relatively low values, i.e.:
- frequent illiteracy; - advanced age; - lack of records; - mistrust; - subsistence farming; - lack of entrepreneurial spirit; - the respondent may not know the information sought or questions
may elicit different responses at different times.
9. DISSEMINATION OF RESULTS
The statistical information gathered in a General Census of Agriculture is only of value insofar as it is disseminated. The dissemination process is therefore highly important. The products to be disseminated and the way they are disseminated have evolved since the last census, due to developments in the reality of agriculture itself, a more demanding public, hungry for information, and the technological progress now available to producers and users of information. Paper still has unquestionable value as a tool for disseminating data, and maintains its own advantages. As a result of advances in the field of information technology, however, users are turning increasingly to electronic media (disks, CD-ROM, Internet, automatic mapping, dissemination of information on request, etc.) as a means of accessing information.
32
� Farm Structure Survey 1999/2000 – National Methodological Report – PORTUGAL
Fast, easy access for internal and external users to information on the RGA 99, whether via pre-determined tables or in new investigative formats, was one of the aspects given most attention by comparison with previous operations. Progress made in databases (more user-friendly consultation processes) and hardware which make information processing faster was also given due consideration.
9.1. Dissemination plan
This envisaged the following: - initial results, i.e. a set of indicators allowing conclusions to be drawn
about developments, to be publicised after completion of data input. - a leaflet entitled “General Census of Agriculture 1999 –
Dissemination of Results”, highlighting the type of information, way of obtaining it, geographical breakdown, medium in which it is available and the release timetable.
- a CD-ROM – General Censuses of Agriculture – comparative data 1989–1999, with provision for exporting data to other software, preparing graphs and maps, simple forms of calculated data.
- Pre-determined analyses, with tables available at any geographical level. The idea was to ensure that general information, known to be most sought after by users, was available.
- Demand-led analyses, which required easy access to a user-friendly database.
- Nine publications with regional data and one with national data - Publications with comparative analyses of the 1989 and 1999
censuses - At various times during data analysis, information considered
relevant was disseminated in concise formats. - The data and the various dissemination products were presented in a
workshop entitled “Statistical Information and Agriculture”.
The dissemination products are available in various media: - on paper - on CD or other electronic medium - on the Internet.
All RGA 99 products incorporate procedures to protect statistical confidentiality. All dissemination products for the RGA 99 incorporate the same method of rounding up and calculation for the various geographical levels for every variable, with the exception of accumulators.
33
� Farm Structure Survey 1999/2000 – National Methodological Report – PORTUGAL
10. ANNEXES
10.1. Concepts
�� Agricultural holding: This is a technical and economic unit which uses its own labour and production factors and must fulfil four conditions, i.e. it must:
- produce agricultural products - reach or exceed a certain size - be subject to single management - be located in a specific, identifiable place.
Three conditions apply to the size of a holding. These are shown in descending order below, and at least one must be met:
Condition 1 A utilised agricultural area (UAA) equal to or exceeding 100 ares (10 000 m2). This includes arable land, kitchen gardens, permanent crops and permanent grasslands and meadow.
Condition 2 A utilised agricultural area of less than 100 ares, but with a minimum area of at least one of the following grown as a main crop within the following limits:
5 ares of: ornamental flowers and plants or greenhouses or nurseries or aromatic plants
10 ares of: intensive horticultural crops in terms of ground area or seeds of fodder crops or seeds and seedlings of non-woody crops
20 ares of: industrial crops or vineyards
50 ares of: olive plantation or potato or extensive horticultural crops 1 tonne of mushroom production
Condition 3 A stock on the day of the interviewer’s visit, or production in the preceding farming year of any of the following species within the limits indicated:
Stock 1 breeding bull or 1 cow or 2 bovines aged 2 years or more or 3 fattening pigs or 1 breeding sow or 6 ewes or 6 female goats or 10 breeding rabbits or 100 laying and/or breeding females of the poultry species considered or 10 beehives or 2 breeding ostriches or 500 laying quail
34
� Farm Structure Survey 1999/2000 – National Methodological Report – PORTUGAL
Production 5 bovine animals or 5 pigs or 250 geese or 250 turkeys or 250 guinea fowl or 500 broilers or 500 ducks or 15 ostriches or 10 000 quail.
The limits prescribed for the Autonomous Regions of the Azores and Madeira were slightly lower, bearing in mind particular regional features.
�� An abandoned holding means one which previously came within the survey limits, but which is not under production at the time of updating, although its capacity to resume agricultural activity is intact.
�� A former holding means one which has ceased to meet the minimum limits. Two situations are possible: a holding's agricultural area may have been put to another kind of use (e.g. woods and forests, civil engineering, roadways, etc.) or it may no longer qualify because it has ceased to produce a specialist crop, it may no longer have a specific number of animals or may have reduced its utilised agricultural area.
10.2. RGA 99 questionnaire – matrix
See enclosed file.
10.3. Data collection monitoring sheet
See enclosed file.
35