Impact of Internal Physical Environment on Academicians Productivity in Pakistan Higher Education In

-+-
--
~
ThePakistan Development Review
Vol. XVIII, No.1 (Spring 1979)
Farm Size and Land ProductivityRelationships in Pakistan
MAHMOOD HASAN KHAN'"
The study focuses on productivity differences due to farm size. Using farmsize data, it suggests that in Pakistan large farms are relatively more pro-ductive because of their greater use of .. non-traditional" inputs. Theinput intensity of large farms derives from market distortion induced bypublic policy. Agricultural policy should therefore Concentrate oneliminating market distortions, by measures like ceiling on land holdingsand a wider diffusion of farm extension services and credit.
Productivity differences by farm size have been observed in many under-developed countries. The most commonly stated proposition is that there isan inverse relationship between output per acre and farm size. Attemptshave been made to explain the apparently higher bmd productivity on smallfarms by positing the hypothesis that these farms make greater use of the vari-able inputs per acre [1,2]. Often it has been observed that small farms consumegreater amounts of "traditional" inputs, particularly of human and animallabour. It is to the relative intensity of the use of these inputs on small farmsthat their higher land productivity is attributed. Whether small farms are moreproductive than large farms is a question of central interest to policy makersbecause on an adequate answer to this question depends the quality of decisionsabQut land reform.
In Pakistan, following the relatively rapid adoption of new technologyassociated with the "Green Revolution" in the Sixties, questions have beenraised about the apparent differences in productivity levels and in access to
, income-earning opportunities between large and small farms. This studyanalyses the issue ofland productivity and farm size and relates it to the use ofinputs and their availability in Pakistan.
HYPOTHESES
In order to analyse the relationship of land productivity and farm inputsby farm size, the following hypotheses have been formulated:
.The author is a Professor of Economics at the Simon Fraser University, Burnaby. B.C.Canada. He thanks an anonymous referee and the Editor of The Pakistan DevelopmentReviewfor their comments. However, he alone is responsible for any errors or omissions in the article.

70 Mahmood Hasan Khan
1. "Large" farms have higher land productivity than "small" farms;or, the former ar~ more efficient than the latter.
2. The higher land productivity on large farms results from a greateruse of "non-traditional" inputs, which are more efficient than the"traditional" inputs.
3. A more intensive use of the "non-traditional" inputs on large farmreflects the influence of non-market forces (or market imperfections),which militate against the owners of small farms.
The first two hypotheses have been tested in this paper by using a Cobb-Douglas production function. Homogeneity tests have been performed oninputs to differentiate them with respect to their effect on the output per acre.The last hypothesis has been tested by using data on input subsidies, wages andcredit.
DATA AND METHODOLOGY
The data were collected by the author in 1974 from a randomly selected
sample of732 irrigated farms in the Indus basin [6]. The collected informationrelated to each crop and input separately for each farm. Farms have been
grouped into two sizes, namely (1) small (25.0 acres or less), and (2) large (over25.0 acres). This classification can be justified for at least two reasons. Firstly,the average size of the sample farms (whose area ranges between 5.00 acres and110.0 acres) is 34.0 acres. Secondly, small farms range from 4.0 acres to 24.0acres (with 14.0 acres as the average), and large farms vary from 27.0 acres to110.0 acres (with an average of 51.0 acres») It is realistic to assume that thetechnologies used on the farms within each of the two classes could not havebeen very dissimilar because the range of size is not very large in either of thegroups.
A Cobb-Douglas production function is used in this paper to depict thecrop production process. The (natural) log transformation of this function isestimated by the ordinary least-squares method. The estimating equation is:
InY=bo+bl In (X1)-J-bs In (X2/X1)-f-ba In (X1/XI)-!--b4In (X4/XI). .(1)
whereY = value of output of all crops in rupees;Xl "'" cropped area in acres;X2 = expenditure on chemical fertilizers in rupees;Xa = family and hired labour in mandays; andX' = expenditure on animal labour and (arm machinery in rupees.
Values of the specified variables have been derived from the information givenby the respondents for all crops. All inputs, except land, are expressed in per
lSec Khan [6, p. 9].
...,....
-.;~
~
--
Farm Size and Land Produc/iYi/y 71
:acre terms, so the coefficient for land minus unity provides a test for the returnsto scale [1, pp. 1375-77).
The Cobb-Douglas production function has been selected because of its.'Computational efficiency and its consistency with the theory of production.A word is in order on the choice of the variables and their aggregation in the-estimating equations. The selection of the value of the total crop production,Y, as the dependent variable implies the assumption that crop composition;across farms is identical. While this assumption doe~ not strictly hold for"Samplefarms, about 80 percent of the farm output is of wheat, rice, cotton andsugarcane. There is still the probability that some farms of a particular sizemay grow more of high-value crops, which may result in a biased estimation of~he returns to scale in that it may in fact be only a crop-composition effect.'This would suggest that either single crop functions should have been analysedor total production functions should have been estimated for mono-crop regions'[1, pp. 1374-75]. The choice of a total crop function is justified for (a) there isno significant correlation of farm size with high-value or low-value crops, and
.(b) the allocation of given inputs on any single activity (crop) on a farm is notmade in isolation from aJl other feasible or competitive activities (crops).Furthermore, this study seeks to analyse land productivity differences by farm
",ize and not inter-crop allocative efficiency.
Among the independent variables, land, Xl, is represented by the total.'Cropped area. A function with the net sown area (if taken alone) would have.affected the returns to scale as the cropping intensity was different from one.Also, since Y is the value of the total farm output, Xl should be the total cropped
:area.Inputs like irrigation water and farmyard manure have been excluded
'from the estimated equations because of the problem of multicollinearity.For instance, the correlation coefficient of watet with land exceeded 0.85."Secondly, no proper measure was available which could represent the flow-of water as an input in the function. Assuming a given relatioll between thenumber of irrigations (which each farmer reported) and the volume of the~rrigation water applied (which was assumed as a standard), the resulting measure
-'(acre-inches) would obviously be a poor proxy for the water input. Finally,I '$ince all farms in the sample are irrigated, economies of scale could not be
.explained by the exclusion of water as a separate variable.
The fertilizer variable, X~, aggregates nitrogenous and phosphatic ferti-'lizers, because the latter type is used in a very small quantity and performs a.<complementary function with the nitrogenous fertilizer.
The aggregation of hired labour with the family labour as Xa and of farm'machinery witb animal labour as X" is based on the assumption that they have:8 homogeneous efficiency effect on the output. However, since the test for land1productivity and the returns to scale indicates that large farms differ significantly:from small farms, these inputs have been disaggreJ:ated for a heterogeneity test
72 Mahmood Ha.ranKhanf
in equation (2). The aggregation of animal labour with farm machinery is.achievedby adding their expenses. .
RESULTS AND INTERPRETATION
The first hypothesis, viz. that large farms are more productive per acrethan small farms, has been tested by estimating equation (I). In Table 1,.Regressions I to IV show results for (a) all farms jointly, (b) large farms, (c)-small farms, and (d) pooled data for all farms, with the dummy variable taking'the value of one for large farms and of zero otherwise.
All coefficients have turned out to be highly significant, with the expectedsigns. A comparison of the intercept and regression coefficients on large andsmall farms by the covariance test on the pooled data in Regression IV hasrevealed that large farms have a higher intercept: the value of the dummyvariable, D, is 0.0888, and significant at the 0.01 level. This suggests that largefarms are about 9 percent more productive than small farms. Furthermore,.since all factors have been defined per acre, the land coefficient (bl) in Regres-sion I is the sum of all the factor elasticities. Its value (1.0947) clearly indicatesincreasing returns to scale. In a separate regression of the output per acre onacreage, the coefficient (0.0331) is positive and significant at the 0.01 level,indicating that the output per acre increases with the farm size.
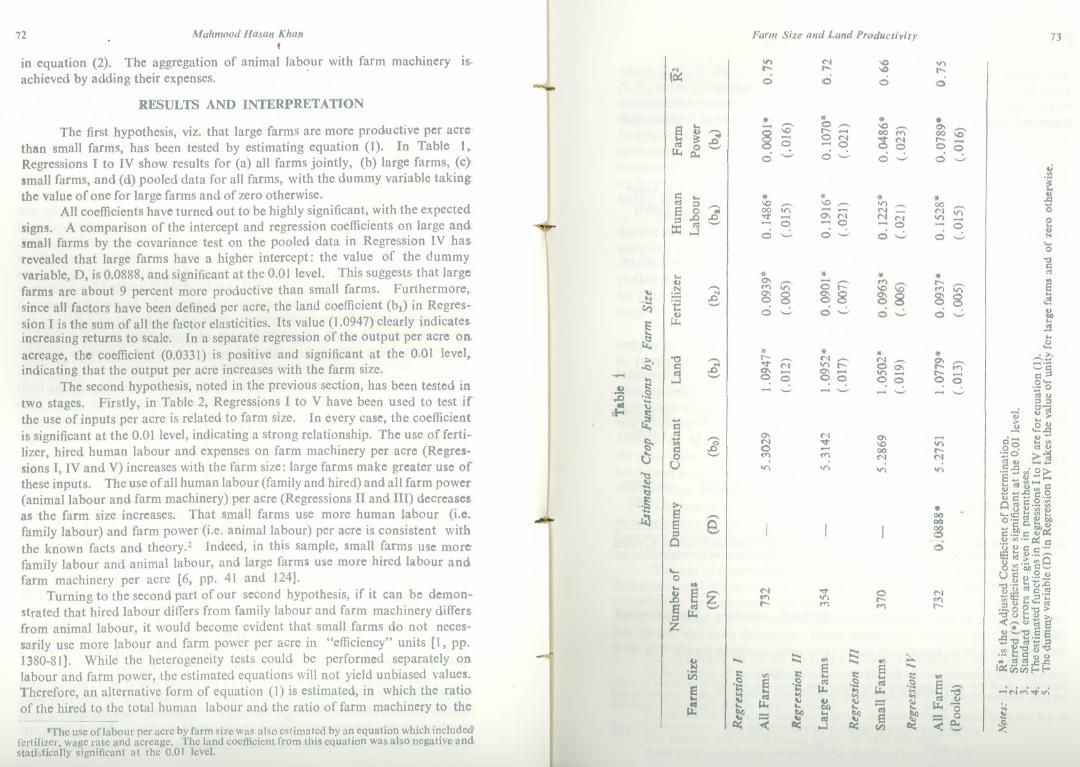
The second hypothesis, noted in the previous section, has been tested intwo stages. Firstly, in Table 2, Regressions I to V have been used to test ifthe use of inputs per acre is related to farm size. In every case, the coefficientis significant at the 0.01 level, indicating a strong relationship. The use of ferti-lizer, hired human labour and expenses on farm machinery per acre (Regres-sions I, IV and V) increases with the farm size: large farms make greater use ofthese inputs. The use of all human labour (family and hired) and all farm power(animal labour and farm machinery) per acre (Regressions II and III) decreasesas the farm size increases. That small farms use more human labour (i.e.family labour) and farm power (i.e. animal labour) per acre is consistent withthe known facts and theory.2 Indeed, in this sample, small farms use morefamily labour and animal labour, and large farms use more hired labour andfarm machinery per acre [6, pp. 41 and 124].
Turning to the second part of our second hypothesis, if it can be demon-strated that hired labour differs from family labour and farm machinery differs.from animal labour, it would become evident that small farms do not neces-sarily use more labour and farm power per acre in "efficiency" units [I, pp.1380-81]. While the heterogeneity tests could be performed separately onlabour and farm power, the estimated equations will not yield unbiased values~Therefore, an alternative form of equation (1) is estimated, in which the ratioof the hired to the total human labour and the ratio of farm machinery to the
-.-IThe use of labour per acre by farm size was also estimated by an equation which included'
fertilizer. wage rate and acreage. The land coefficient from this equation was also negative amistatistically significant at the 0.01 level.
--
.....
--u.-.,1:)
,f.
I...
I'~I
E!b~'"' ~ .0CIS0 -~~
d ....
CIS::3~E! 0 ,I:):::t.g -::c:~
"-!:!'t.-)
~~~..,I:::.9..."II:~~~]~
..s
.~
....0
~'f~
"0
dCIS~
....dCIS....<Itd0U
>.E!E!:::tt:1
.....0
C/O
~SZE! CIS-:::t~Z
~Ci3
a~
-.",I:)--...0-
'd6
01
8(f'}
VI
-VIr--C'IVI
C'I'<t'.......VI
0'1\Q00C'I
VI
, ,a.cococo<:>
0
C'I...r--
'<t'V)tf')
0r--...
N(f'}I"-
73
4.i'"
.~.CI15euN
.....0
~fa
~~~...!!...g. >.---~
~:§0"'":;:;0"'u~ ::I. 0'';;/- u>
~ "u~ .805
=0 ~ ~O. "'..101'';:0 >'""'u ...~
.S 05:i 2 ~5'Oi~,::§~ =05s.;;;,.., t<SI:J.- '""'o..~<>os~~~I:: CIJ"",= .~ I:: <>...u ",._~ I::'0 <>I:: 1::'-IE ~ ~.;;--e'" ",'- I::o~ COouU I::~._-<> ~ ~~.- o~o.g 1::.--"""'.E"~gl:) ~:a'o:::]»<---<>"'8<>~~ 8 8
..c: "'-;3:~.g~~'- .. I::u <>.. '" "'..c:..c:
I~ 00 ii5 E-<E-<
"':NM..t,,;
~~
FarmSize and LandProductivity
'" C'I '" \Or-- r-- '" I"-0 C 0 0
* * * ...... - 0- "'- 01G'§
'" I"- .... co ... co- OC'l C; r-- -0 -0 0 00 - 0"":- 0"":- 0 -* * * *\Q - \Q - VI- 00----00 VI -- C'I - C'I VI'<t' - OIC'I C'IC'I VI -- 0 -0 -0 .....00 - 0- 0"":- 0 '-'
* * * *01 - -- G' r---...VI 01"- ... \001 8 g8 ga g 800 - 0"":- 0"":- 0 '-'
* * * *'" - C'I,....,g 01 ,....,'<t' C'I VII"- r-- ........ 01- VI..... 1"--0 00 00 00- '-' -- -- .....'-'
.., "" :::.......S
....E! ....
'" II: a: .... r:: ..,S .9 CIS .9 .9
S:a-.
IJ...... CIS0" " u
o.... .... .... -;..... E! .....0< CIS .....'< '< rn I::t:: .-(-

74 Mahmood Hasan Kha n
Table 2
Estimated Equation
Relationship of Farm Size to Use of Inputs
Constant(bo)
Farm Size alld Land Productivity 75
Coefficient(bl)
where X/j/Xa is the proportion of the hired labour in the total labour andX6/X. is the proportion of farm machinery in the total farm power, and othervariables are defined as in equation (1). All coefficients are statistically signi-ficant at the O.Ollevel. Since b, and b, are significant, the heterogeneity of thehired from family labour and of farm machinery from animal labour is clearlyindicated. Fertilizer, hired labour and farm machinery are undoubtedly "non-traditional" inputs on Pakistani farms. Therefore, the higher land productivityon large farms results from the greater amounts of per acre "non-traditional"inputs used on those farms.3
The third hypothesis about the influence of the non-market forces andmarket imperfections on the use of inputs by farm size can be examined byanalysing subsidies on inputs and wages in Pakistan. Large farms use morechemical fertilizer per acre for at least two reasons, namely, (1) large farmers'greater access to cost-free information about fertilizer use, and (2) excess demandfor fertilizer at the ruling prices and the ability of the large farmers to obtain alarger proportion of the scarce facilities.
The use of hired labour on large farms can be explained, at least for thi.sample, by the fact that the marginal product of all labour, of the hired labourin particular, far exceeded the reported wage.. This phenomenon-whichincidentally counters the hypothesis of "surplus" labour-and the rapidly in-creasing number of workers who have fewer or no job opportunities outsideagriculture would encourage a greater use of hired labour. In Pakistan, therewas an impressive decline in the number of small farms during the period1960-1972. Most striking is the case of farms under 2.50 acres: their share inthe total number of farms fell from 33 percent to 14 percent and in thetotal farm area from 4 percent to 1 percent. During the same period, theshare of large farms increased significantly [8,9J.
The agricultural labour force, comprising family- and hired workers,increased sharply from 7.57 million in 1961 to 11.88 million in 1972.s Thesedata may provide one possible explanation of the low bargaining power of theagricultural workers and of their consequent "exploitation".'
The use of farm machinery on large farms has been encouraged by thefact that capital in general and imported capital in particular have been greatlysubsidized. For instance, one has only to look at the under-valuation offoreign exchange and concessional import policies for tractors etc., during thelate Sixties and early Seventies. Hired machinery, which is itself subsidized,from government outlets in many areas of the Punjab and Sind is also directed
. 3A comparison of the marginal products of the used inputs-computed from the elasti-cItiesin equation (1) at the geometri' mean levelof output and input-on large and smallfarmsshoweda highervaluefor eachinput on largefarms,reflecting,in yet anotherway,thedifference in the quality of the inputs.
'For thesamplefarms,thereportedwagefor the hired labour variedfromRs. 8.0 toRs.I0.0 per manday. Themarginalproductwasestimatedat Rs. 12.91.
'See, PakistanPopulationCensusreportsfor 1961and 1972.'Someotherexplanationsarediscussedby Bardhan[I, pp. 1382-83].
REGRESSION I: Fertilizer Expenses Per AcreIn (X2/X1) = bo + bl InXz
REGRESSION II:
1n (X./Xl)
REGRESSION Ill:
In (X./XI)
REGRESSION IV:
In (XI/X,)
REGRESSION V:
In (X6/X1)
2.3205
Family and Hired Labour Per Acre
= bo + bl InXt 3.2071
0.1890.(.033)
-0.4814*(.011)
-0.0945'"(.011)
0.4856*(.024)
0.2379*(.030)
Animal Labour and Farm MachineryExpensesPer Acre
= ba + bl InX] 3.4980
Notes: 1. All variables in Regressions Tto V are as defined in equation (1), except XI whicbis hired labour in mandays and XI isexpenseson farm machinery in rupees.
2. Starred (.) coefficientsare significant at the 0.01 level.3. Standard errors are given in parentheses.
Hired Labour Per Acre
= bo + b( InXI 1.2136
total farm power are introduced as additional variables. The estimatedequation is:
InY
Farm Machinery ExpenJn Per Acre
= bo + bl 1nXI 0.2342
- 5.47002+1.1102* In (X]) +0.0802* In (X2/X1)+(.012) (.005)
0.1699* In (X3/X1)+0. 0736* In (X4/XI)+(.015) (.016)
0.0613* In (X1/Xa)+0.OI82~ In (X6/X4),(.007) (.005)
(2)

76 Mahmood Hasan Khan
for use mainly on large farms. Further, the development of tube well technologycoupled with subsidized fuels, introduced a similar bias in use [10].
Finally, and perhaps most importantly, large farms in Pakistan haveenjoyed more favourable, if not exclusive, access to institutional credit for capitalexpenditure at rates of interest which do not reflect the opportunity cost of thefunds [4J. For instance, in this sample, all loans from the Agricultural Deve-lopment Bank of Pakistan (ADBP) were received by farms of over 25.00 acresand the rate of interest varied from 7 percent to 8 percent per year [6, pp. 104-7].Also, a significant proportion (35-50 percent) of the imported tractors have beenfinanced by the ADBP [10, p. 232]. The ADBP has also been a major financingsource for the installation of private tubewells in the Punjab.
LIMITATIONS OF THE ANALYSIS
The estimation results discussed in the previous section are not withoutlimitations. For one thing, the farm-level data are cross-sectional. Foranother, the use of a total crop function for farms which are not from a strictlymono-crop region may have biased the returns to scale. However, as has beenpointed out earlier, this should not have affected the results on land productivity.Again, the omission of "management" may have left out an explanatory variablewhich could account for the difference in the output per acre between farms[5, pp. 223-26]. The problem with management is that no appropriate measurecan be devised for its inclusion in the given data. However, the separation offarms into two classes by size and the covariance test performed in Table Ireflect a measure of the efficiency parameter.
CONCLUSIONS AND POLICY IMPLICATIONS
Three major conclusions emerge from the preceding analysis. Firstly,large farms are more efficient than small farms in that they have greater outputper acre and there are increasing returns to scale. Secondly, the per acre use ofthe "non-traditional" inputs like fertilizer, hired labour and farm machinery isgreater on large farms. Finally, there is some evidence that the use of capitali,nputs on large farms and their relatively favourable access to credit have beenencouraged by public policy.
It is by now well known that in Pakistan the subsidization of agriculturalinputs and credit has been an integral part of what some have called a "bimodal"strategy of agricultural development. It is also well known that the subsidiza-tion of inputs to encourage their use almost always introduces imperfections infactor markets, as indeed is true of most capital inputs in many underdevelopedcountries. Further, a subsidy can be an instrument of encouraging sociallydesirable transfers of income. However, as Pakistan's experience shows, thismay not have been the best way to achieve the intended goal of parity amongsectors or income groups. In view of the heavy reliance on subsidy on agricul-tural inputs in Pakistan and the fact that the access to these inputs has been
.....
.q...
I
~
..f1--
J.
Farm Size and Land Productivity 77
unequal between large and small farms, one wonders if the income transfershave not been from the weak to the strong!
The results of this study suggest that the greater use of non-traditionalinputs on large farm in Pakistan can be traced to market imperfections but-tressed by public policy. Therefore, the central thrust of the public policyshould shift to an elimination of such policy-induced distortions. More com-petitive markets for land, labour and capital can best be achieved by landreforms, which, among other things, introduce such measures as a ceiling onland-holdings, greater dispersion of extension services and greater availabilityof farm credit. Land reforms should be a means to reducing oligopolisticand oligopsonistic elements in the economy [7J.
Received September, 1978; final version received February. 1979
REFERENCES
1. Bardhan, P. K. "Size, Productivity and Returns to Scale: An Analysis ofFarm-Level Data in Indian Agriculture." Journal of Political Economy.November/December 1975.
2. Berry; R. A. and W. R. Cline. "Farm Size, Factor Productivity andTechnical Change in Developing Countries." June 1976.(Mimeographed).
3. Dalrymple, D. "Evaluating Fertilizer Subsidies in Developing Countries."A.l.D. Discussion Paper No. 30. Washington, D.C.: July 1975.
4. Griffin, K. The Political Economy of Agrarian Change: An Essay on theGreen Revolution. Cambridge, Mass.: Harvard University Press. 1974.
5. Heady, E. O. and J. L. DiIlon. Agricultural Production Functions.Ames: Iowa State University Press. 1961.
6. Khan, M. H. The Economics of the Green Revolution in Pakistan. NewYork: Praeger Publishers. 1975.
7. Koo, A.Y.C. "An Economic Justification for Land Reformism."
Economic Development and Cultural Change. April 1977.8. Pakistan. Agricultural Census Organization. Pakistan Census of Agri-
culture 1960. Vol. II. West Pakistan. Karachi. 1963.9. Agricultural Census Organization. Pakistan Census of
Agriculture 1972. Vol. I. AIl Pakistan Report. Lahore. 1976.10. Ministry of Food, Agriculture, Cooperatives, Under-
developed Areas and Land Reforms. Agricultural Statistics of Pakistan1975. Islamabad. 1975.