FARM OWNERSHIP AND TENANCY - USDA
94
FARM OWNERSHIP AND TENANCY By L. C. GRAY, CHABU;S L. STEWART, HOWARD A. TURNER, J. T. SANDEXS, and W. J. SPILLMAN, Bureau of Agricultural Economics. THE general attitude toward the subject of land ownership and tenancy in this country has been determined by our very recent emergence from the pioneer stage of agricultural development. In that stage farm land was superabundant and its ownership easily acquired. There was little necessity for farmers to obtain the use of land by renting it from others, and those who continued long as tenants were largely of the less efficient and enterprising class. As land in the older communities became scarce, the more enterprising of the younger generation who were unlikely to inherit land pushed on to new regions where farm ownership could be easily acquired. The competition of tlie newer areas of virgin soil prevented an abnor- mal increase in the value of land in the older regions and made it relatively easy to achieve land ownership. Largely as a result of these earlier conditions farm ownership by the farmer has come to be regarded as normal, and tenancy as abnor- mal. The increase of tenancy has been " viewed with alarm " by many people, and there has been a tendency to attribute in an indis- criminate manner to institutions of tenancy nearly all of the economic and social ills that manifest themselves in the rural community. Now that we have passed beyond the pioneer stage and have entered upon a more mature phase of national development, it is desirable to at- tempt to get a well-rounded conception of the significance of farm tenancy, wliich is by no means peculiar to the T''^nited States, but is found to some extent in all civilized nations, and particularly in English-speaking countries (fig. 1). Endeavoring, tlien, to ai)proacii the subject with an open mind, let us first take stock of the present extent and relative importance of the different classes of land tenure ^ and trace briefly the recent trends with reference to land ownership and tenancy as shown by census and farm-survey statistics. 1 Tenure In this country, tliough commonly referred to as allodial, is, in all eases, held subject to tlie paramount authority of the State. The classes referred to as tenure classes in this study are somewhat more inclusive than when defined lesally. One class, managers, is included here, although as such tliey can scarcely be said to hare tenure ^ith reference to land. 85813'—YBK 192 -33 + 84 507
Transcript of FARM OWNERSHIP AND TENANCY - USDA

FARM OWNERSHIP AND TENANCY
By L. C. GRAY, CHABU;S L. STEWART, HOWARD A. TURNER, J. T. SANDEXS, and W. J. SPILLMAN, Bureau of Agricultural Economics.
THE general attitude toward the subject of land ownership and tenancy in this country has been determined by our very recent emergence from the pioneer stage of agricultural development.
In that stage farm land was superabundant and its ownership easily acquired. There was little necessity for farmers to obtain the use of land by renting it from others, and those who continued long as tenants were largely of the less efficient and enterprising class. As land in the older communities became scarce, the more enterprising of the younger generation who were unlikely to inherit land pushed on to new regions where farm ownership could be easily acquired. The competition of tlie newer areas of virgin soil prevented an abnor- mal increase in the value of land in the older regions and made it relatively easy to achieve land ownership.
Largely as a result of these earlier conditions farm ownership by the farmer has come to be regarded as normal, and tenancy as abnor- mal. The increase of tenancy has been " viewed with alarm " by many people, and there has been a tendency to attribute in an indis- criminate manner to institutions of tenancy nearly all of the economic and social ills that manifest themselves in the rural community. Now that we have passed beyond the pioneer stage and have entered upon a more mature phase of national development, it is desirable to at- tempt to get a well-rounded conception of the significance of farm tenancy, wliich is by no means peculiar to the T''^nited States, but is found to some extent in all civilized nations, and particularly in English-speaking countries (fig. 1). Endeavoring, tlien, to ai)proacii the subject with an open mind, let us first take stock of the present extent and relative importance of the different classes of land tenure ^ and trace briefly the recent trends with reference to land ownership and tenancy as shown by census and farm-survey statistics.
1 Tenure In this country, tliough commonly referred to as allodial, is, in all eases, held subject to tlie paramount authority of the State. The classes referred to as tenure classes in this study are somewhat more inclusive than when defined lesally. One class, managers, is included here, although as such tliey can scarcely be said to hare tenure ^ith reference to land.
85813'—YBK 192 -33 + 84 507

508 Yearljool' of the Department of Agncidtiire. 192S,
PERCENTAGE OF FARMS AND FARM ACREAGE OPERATED BY TENANTS. SELECTED COUNTRIES; INCLUDING PART OWNERS IN UNITED STATES, FRANCE. CHINA, AND CANADA.
PER CENT
0 10 20 30 40 50 60 70 80 90 100
UNITED STATES 1920
ENGLAND--,..--. 1914-
AUSTRAUA 1917
* A NEW ZEAUVND..I9I7
B
BELGIUM 1910
ARGENTINA 1914
IRELAND- 1916
FRANCE- 1892
CHINA 1920
GERMANY 1907
CANADA 1921
JAPAN 1921
DENMARK 1918.
i PART OWN ERS (WH ERE REPORTED SEPARATELY) OTHER FARM OPERATORS
A = PERCENTAGE OF FARMS PERCENTTAGE OF FARM ACREAGE
« Crown Land accounied for ^6 percent in New Zea/and and 11 per cent in Australia [Exclusive of worker's tracts operated by owners. Percentage affarn* acreage rented by part {owners not separately reported.
FIG. 1.—Farming bv tenants and other lessees is less prevalent in the united States than in England, Australia, New Zealand, or Belgium ; is of about the same prevalence as in Japan, France, or China ; and is more prevalent than in Germanv, Canada, or Denmark from the standpoint of the proportion of farmers who are tenants and also from that of the proportion of acreage rented. The information shown is the latest available. In France and Canada the acreage shown as rented includes that of part owners as well as that of tenants. The percentages for the T'nited States include only land in farms. The proportion of the land operated by those farmers who do not own it is probably higher than shown above. (See pp. 521-522.)

Farm Ownership and Tenancy. 509
Relative Extent of Different Classes of Tenure—The United States as a Whole.
Land is either owned by the farmer or rented under one or more of the various methods of leasing used in this country. There is some variation in the different States as to the legal rights and privileges involved in ownership, but these differences are incidental rather than of basic economic significance. There are also some differences as to the legal status of tenancy. But for the most part, the great contrast in the forms of tenure in different parts of the United States are economic rather than legal.
Some farm operators own all of the land they operate (owner farmers), others own none of it (tenants or croppers), and still others own part and rent part (part owners or owners additional). Some- times farm operators employ managers to direct the business of
TENURE OF FARM REAL ESTATE MEASURED IN FOUR WAYS, UNITED STATES, CENSUS OF 1920.
NUMBER OF FARMS
VALUE OF LAND AND BUILDINGS
FIG. 2.—More than half the farms in the United States are operated by full owners, but somewhat less than half of the land or of the value of farm real estate. Although tenants who rent all the land they operate constitute over 38 per cent of all farmers, they operate less than 28 per cent of the farm land, only about 35 per cent of the improved land, and about 36 per cent of the value of farm real estate. Manager-operated farms average five times as large In total acreage as other farms, have about 2 i times as much improved land, and are valued, on the average, at nearly four times as much.
farming. Our census statistics classify farmers into these four groups, and in the census of 1920 croppers in the Southern States, who supply no work animals and in most cases are laborers paid by a part of the crop rather than in cash, were separated as a sub- group under tenants.
The relative importance of these four classes of farmers may be measured not only in terms of the proportion of farms operated by each class, but also from the standpoint of the proportion of the acreage of all farm land, of improved land, and of the valuation of farm real estate operated by each of these tenure classes. These four methods of measuring the relative importance of the four tenure classes give somewhat different results (fig. 2).
Relative Importance of the Tenure Classes at Present.
Although over half the farms in 1920 were operated by farmers who own all the land, less than half the farm land was in these full-owner farms, and an even smaller proportion of the improved
510 Yearbook of the Department of Agriculture^ 1923.
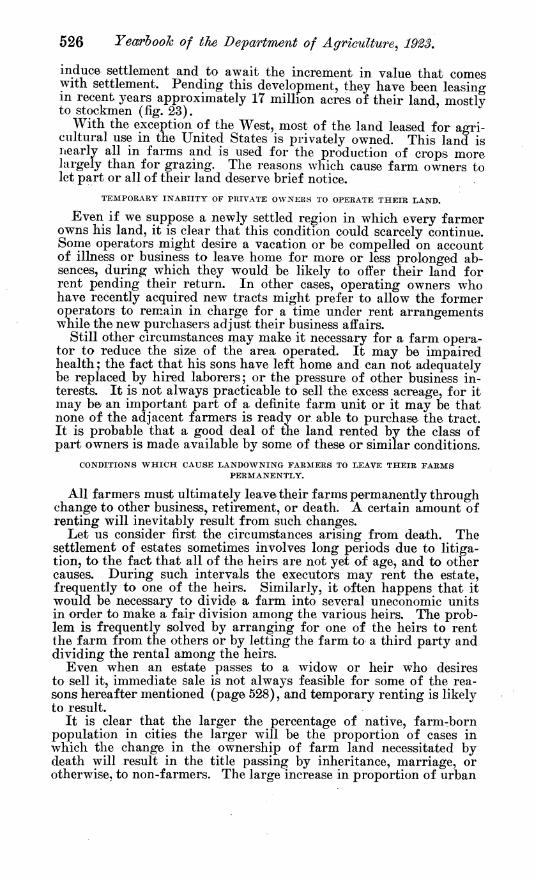
land and of the valuation of the farm real estate. But if part owners be included, whose farms are much larger than those of full owners^ the percentage of the total farm land operated by these two classes rises to 66.6, as compared with 60.8 per cent of the number of farms. On the other hand, tenants constituted over 38 per cent of
PERCENTAGE OF FARM HOMES RENTED COMPARED WITH OTHER HOMES, UNITED STATES, CENSUS OF 1920.
100
FIG. 8.—The proportion of the farm homes rented is only about two-thirds as large as the proportion of city and village homes rented. The proportion of farm homes free of mortgage encumbrance and occupied by the owners is also larger than in the case of other homes. Farm homes comprise the homes of persons engaged in farming and located on farms. Homes occu- pied by farm managers are included under farm homes rented.
the farmers of the United States, but operated less than 28 per cent of the improved land and of the valuation of farm real estate. As shown in Figure 3, the proportion of farm homes rented by the occupants is smaller than in the case of urban homes. Moreover, some of these farm tenants own other farms. While no census statis- tics bearing on this point are available, ' local surveys in 15 States indicate that about 10 per cent of the tenants owned farm land.
The relative importance of manager-operated farms, like those of part owners, is greater than their number would indicate, for such farms are not only larger in average area and valuation than other
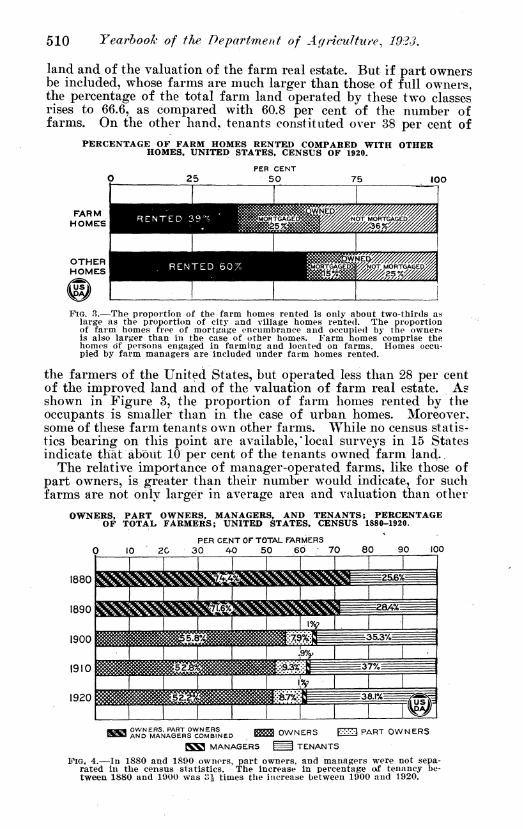
OWNERS, PART OWNERS, MANAGERS, AND TENANTS; PERCENTAGE OF TOTAL FARMERS; UNITED STATES. CENSUS 1880-1920.
10 2C PER CENT OF TOTAL FARMERS
30 ^0 50 60 70 80 90 100
OWNERS. PART OWNERS AND MANAGERS COMBINED
P^a MANAGERS
OWNERS EEÍÜ3 PART OWNERS
^M TENANTS
FIG* 4.—In 1880 and 1890 owners, part owners, and managers were not sepa- rated in the census statistics. The increase in percentage of tenancy be- tween 1880 and 1900 was ol times the increase between 1900 and 1920.

Farm Ownership and Tenancy, 511
classes of farms, but also in the South there are many plantations worked by croppers and tenants, under the close supervision and direction of a manager. Even though the entire plantation is so operated, each tenant or cropper holding would be reported in the census as a farm, but the estate as a whole would not be reported as operated by a manager.
The same condition tends to exaggerate the relative importance of tenant farming as compared with owner farming, for many of the plantations of the South, as well as a considerable number of large farms jn other parts of the country, although divided up into so- called farms worked by tenants and croppers, are actually under the close supervision and management of the owners. Excluding crop- pers classified in Southern States only, tenant farms in the country as a whole comprised only 32.2 per cent of the total number of farms in 1920 and white tenant farms only 28.7 per cent of the farms oper- ated by whites.^
The Trend in Relative Importance of the Tenure Classes.
In 1880, when census statistics of tenure first became available, about one-fourth of the farms in the United States were operated by
OWNER FARMERS, TENANTS, AND OTHER PERSONS (MOSTLY WAGE LABORERS); PERCENTAGE OF ALL PERSONS 10 YEARS OLD AND OVER ENGAGED IN AGRICULTURAL PURSUITS, UNITED STATES, 1880-1920.
(Computed from census statistics.)
25 PER CENT
50 75 100
JUNE 1.1880
JUNE 1.1890
JUNE IJ900
APRIL 15.1910
JANUARY 1,1920
1 . I^HQSHH^^ 13.4 ^^Ë ̂ E ̂ ffl ̂ ^^ 1 1 1 HHIHffl^^^^^= i 5.3= ̂ ^^^^M^^^^^^ m 1 \ \ HI^Bin^H^^^ iq.ñ= ̂ ^^^^ SH ̂ ^^ 1 ^^ 1 ^ ic»n ^^^^^M^^^ ̂ mi 1 ^^^ ^■MI^Lj^i^^^i^^
¡TENANT FARMERS I WORKERS WITHOUT TENURE
FIG. 5.—^On account of changes in the time of year of taking the census, the percentages shown above, particularly those showing the number of farm laborers, are not exactly comparable. The first three census enumerations were taken as of June 1, and indicate that the rapid increase in the per- centage of tenant farms was partly at the expense of the proportion of owner farmers and partly at the expense of farm-wage laborers. The census of 1920 was taken as of .January 1, and as a result a much smaller number .of laborers were reported than would have been reported if it had been taken June 1. On the other hand, the figures as of April 15, 1910, may have resulted in exaggerating the number of farm laborers.
tenants. The proportion has increased in each decade since that time, but the increase in the proportion of tenants from 1900 to 1910
2 No attempt was made by the Census Bureau to separate croppers from tenants before 1920. In that censius they were defined and enumerated as tenants to whom the work stock was furnished by the landlord. The tabulations, were made only for the South and showed 561,091 cro-ppers in tliat sectioni. Some farmers co-rresponding to the above description are to be found in other parts of the country, although relatively few in number.

512 Yearbook of the Department of Agnculture^ 192S,
was not marked, and from 1910 to 1920 was still smaller (fig. 4). Moreover, when the percentages are calculated on the basis of per- sons engaged in agriculture, instead of on the basis of number of farms operated, it appears that the increase in the percentage of tenant farms was not entirely at the expense of the proportion of owner farmers, but may have been partly at the expense of farm Avage laborers (fig. 5). *
The geographic distribution of this increase in percentage of ten- ant farmers is significant (fig. 6). In New England and the North Atlantic States tenants have decreased in relative numbers, \yhereas in the Cotton Belt States and the Corn Belt there has been a notable increase, particularly in the earlier decades. During the decade pre- ceding 1920 the greatest increase occurred in the Great Plains and Rocky Mountain States. As will be shown later, in newly developed regions such as these, it is to be expected that the proportion of ten- ants will rapidly increase as the pioneer farmers retire or pass away.
Figure 7 shows the counties in which the percentage tenants con- stituted of all farmers increased or decreased between 1910 and 1920. It is evident that the number of tenant farmers has, in general, ceased to increase in most of the longer-settled sections of the East, in much of the Cotton Belt outside the Coastal Plain, in Missouri, eastern Kansas and Oklahoma, and in many counties of California.
From 1910 to 1920 the relative importance of tenant farming in the United States as a whole increased somewhat more from the point of view of farm area, either total or improved, or valuation of real estate, than from the point of view of number of farms; and the relative importance of farming by full owners decreased correspondingly. The relative importance of farming by part owners decreased slightly when measured in terms of number of farms, acreage of improved land, and valuation of real estate, but from the standpoint of total area of land in farms there was a con- siderable increase in the relative importance of farming by this class, owing largely to the rapid increase of part-owner farms in the Great Plains region,' where the average area of farms is compara- tively large (fig. 14).
By adding the land rented by part owners to that rented by tenants it is possible to obtain as far back as 1900 approximate figures of the acreage of farm land and of improved land, and also of the valuation of farm real estate operated under rent contracts.^ The change in the proportion of the valuation of farm real estate oper- ated by the four tenure classes between 1910 and 1920 is shown in Figure 8. Between 1900 and 1920 the acreage of rented land in- creased from 34.2 per cent of all farm land (excluding land operated by managers) to 39.3 per cent, while the proportion of the improved land rented increased from 37.5 to 43.8 per cent and the proportion of the valuation of the rented real estate increased from 35.4 to 43.6 per cent of the total valuation of farm real estate (Table 1).
» In the census of 1920, the land owned by part owners was not enumerated separately from that rented. Tins' was done in 1000. In> 1910 the figures were not published, but they have been available for the present study. Estimates have been made for 1920 by assuming that the proportion of the two classes of land are the same as they were found to be in 1910.

FIG. 6.—In all the States north of North Carolina and east of Ohio and Kentucky, with the exceptions of New York and Pennsylvania, the percentages of farms operated by tenants were smaller in 1920 than in 1880. In most of these States the maximum percentages were attained about 1900. In Kentucky and Tennessee there was little change after 1900. In the other Southern States, except Louisiana, the increase in the percentage of farms operated by tenants continued up to 1910. In the next decade the Increase was less marked in some of the States of this group, while in others a decrease occurred. In most of the newly developed States of the West the increase of tenancy, which = normally has followed the early years of settlement, was still continuing in 1920. The increase has also been notable in the Corn Belt and the wheat regions.
5^
M CO

Jn^TÍÍn wncvÎf^ / ^^^ '? ^^'^ pprcentaffo of tonant farms occurred m the newly flevoloped lands of the Txreat Plains and of Idaho, eastein Washin^^ton, and Arizona. There was a notable increase in certain parts of the Corn Belt, especially northern Iowa There was also some increase in those parts ot the South where there has been a comparatively recent agricultural development In short the map indicates that the marked increase in the percentage of tenancy was maiiilv in reliions where the farming industrv has been expanding, or where such expansion is of comparatively recent occurrence. s • ny

Farm Ownership and Tenancy. 515
TABLE 1.—Percentages of total farm area, improved land, and valuation of farm real estate {excluding that controlled dp managers) operated under i^ent contracts, United States, 1920, 1910, and 1900^
Date.
Acreage. Value of
real estate. Total. Improved.
1920_- 39.3 35.6 34.2
43.8 41.0 37.5
43.6 1910 39.5 1900_- 35.4
1 Since it is not known what proportion of manager-operated land is owned by the person employing the manager and what proportion is rented by him, this class is excluded from the basis in calculating the above percentages. The figures for 1920 are based in part on estimates.
VALUE OF FARM REAL ESTATE CLASSIFIED BY TENURE, UNITED STATES, 1910 AND 1920.
PER CENT 50
I9!0
100
FIG. 8.—^The proportion of all farm real estate rented by tenants and part owners in 1920 was 42 per cent, and the proportion of all farm land, excepting that in farms of managers, was nearly 44 per cent. Less than half the farm real estate was owned by full owners in 1920, and but little more than half was owned by full owners and part owners combined. A marked increase of land renting between 1910 and 1920 is shown when the real estate is classified in terms of valuation. The ratio of rented land to all land in the farms of part owners is assumed to be the same in 1920 as in 1910.
Geographic Distribution of the Various Classes of Tenure.
Farms operated by tenants and croppers are most numerous, abso- lutely and relatively, in the Cotton Belt (fig. 9). Practically all of the cotton-producing region formerly operated by negro slaves under the plantation system is now occupied very largely by negro farmers classed as tenants or croppers (fig. 10). Adjacent to this old plantation region are certain extensions of the cotton-producing area, made for the most part since the close of the Civil War and now operated largely by white tenants and owners (figs. 11 and 13), with a considerable sprinkling of negro tenants and. owners (figs. 10 and 12). Taken altogether, the region of cotton production contains approximately half the tenant farmers in the United States.
There is no other large region in the United States where tenant farmers are in the majority, but there are certain counties in the Com Belt where this is the case. In the greater part of Iowa, north central Illinois, eastern South Dakota, and Nebraska, and central Kansas, tenant farmers are nearly half the total number of farmers. Outside the Cotton Belt, the Corn Belt, and the wheat areas of the eastern plains, tenant farmers constitute, in general, fewer than 25 per cent of the number of farmers (fig. 9). Where tenants are found, they commonly occupy land well adapted to crop production, and they are especially numerous in regions where the farming systems consist largely in the production of staple crops. In dairy-

UNITED STATES AVERAGE 38.1 PER CENT
teC3j¿7
PER CENT
UNOER \2'A
;;;;;;;! 25 TO37ä
37ÄT0 50
50 70 62;*
62)470 75
75 70 87)6
87)i AND OVER
census Of I920
Fir.. 0.—The percenfage of farms rented is highest in the Cotton Belt, where tenant farms constitute usually from one-half to nine-tenths of the number of all farms. In the Corn Belt and the eastern portions of the winter wheat and spring wheat regions tenant farms comprise from one-fourth to three-fourths of the number of farms. Measured by acreage, tenancy in these regions is relatively more important and in the South less important than when measured by number of farms. Outside'these areas tenants in «-enerai constitute less than one-fourth of all farmers, , • . & .

Farm Ownership and Tenancy, 517
^ARMS OPERATED BY COLORED TENANTS AND CROPPERS ^V^ NUMBER,JAN. I, 1920 ^^ '^^
s.c. Ala. Ark. Tex.
STATENUMBER STATENUMBER Miss. /37.843 N.C. 53,917 Ga. ¡13,938 La. 50,981
86.068 Tenn. 28.289 77S74. ya. 16,640 56.814- Other 36.961 SS'"' as. 714.44-1
FIG. 10.—The Negro tenant and cropper farms or holdings are located mostly in the Yazoo-Mississippi Delta, in the Black Prairie of Alabama, and in the upper Coastal Plain and Piedmont of Georgia and the Carolinas—districts having the richest soils in the old South. Many of these " farms " are merely allotments to croppers on plantations, the owner of the plantation furnishing the cropper with his mule, his farm implements, and sometimes even with food until the crop is " made " in the fall áM the proceeds divided between them. The dots shown in California represent mostly Japanese and Chinese tenant farmers,
ing and other forms of livestock husbandry, tenant farming is rela- tively less prevalent. ^ •
Owner farmers (compare fig. 9 with figs. 12 and 13) predommate (1) in New England; (2) in areas of dairy farming, notably in New York and in the southern portions of the Lake. States; (3) in rough lands of the Appalachian and Ozark Mountain regions, where a relatively small proportion of the land is in crops; (4) in many areas of cut-over land, particularly in the northern Lake States, where land settlement has been recent; (5) in certain areas where farming is characterized by specialty products requiring a high
FIG. 11.—The regions of greatest density for farms operated by white tenants are the upper Piedmont of the Carolinas, Georgia, and Alabama, and the Black Waxy Prairie of Texas. In these districts negroes are less numerous than to the south and east, and the cotton is grown mostly by white farmers. A large number of white tenants are shown in Kentucky and western Ohio, especially in the tobacco districts and throughout the Corn Belt.

518 Yearbooh of the Depai^tment of Agriculture^ 1923.
FIG 12.—The regions of greatest density for farms operated by Negro owners are eastern Virginia, southeastern South Carolina, and northeastern Texas— all of them areas of cheap land. In Virginia there are almost twice as many farms operated by Negro owners as by Negro tenants, and in Florida the numbers are about equal : but in the Cotton Belt tenants greatly exceed owners in number (see fig. 10). There are very few Negro farmers in the Northern States, but nearly three-fourths of these farmers own their farms. as compared with one-fourth in the South. This high percentage of owner- ship is striking proof of the tenure progress of the Negro race in the past half century. The dots in the Western States represent mostly farms owned and operated by Indians, Chinese, and Japanese.
degree of skill in production and marketing, such as the fruit regions of the Pacific States and Florida, and trucking districts in various parts of the United States; (6) on much of the cheap sandy lands of the Atlantic and Gulf coastal plains; (7) in the rolling and less fertile parts of Tennessee and Kentucky, and southern portions of Ohio, Indiana, and Illinois; (8) in the marginal portions of the
)5^->,,^^^^ FARMS OPERATED BY WHITE OWNERS r^ i# i'^^???r^~-' N U M B ER, JAN. 1.1920
/êy^^^' I' '•'.}-: •■•^Si^^SÄ??!^^ L¿. Pi .)rrf—''^''^'i-^ ■''•'••'\':^^^^ ¿^öi
p-\ / ■^ly~e^^!W^^^^^^^ßm w p
PART OWNERS srAT¿: NO. STATE NO. \ :{r^miie^tí^^^$^^p^ Mo. /83,386 Pa. IS3^37 V f^^ . v:-VC^-^'-V^^'-^^*v;»<^' V--\ Tejr. 17 7.67 f N.Y 151.288 ^^ \ ••••:•.-: ¿^ , ^*^ t-.-.-.A Ohio 176.933 Tenn. I3Q.ZÍ-2 \ ¡'•jl'^,-.-„ rv/^-r DroorcrKrr« ^•. Ku. 174:008 Ind. 136^04. \ '4 EACH DOT REPRESEr«fTS V ms. IS8.982 Other2082374. V-.4 500 FARMS X M/Ch 158.843 U.S. 3691.868 ^ >
INCLUDED
FIG. lo.—The regions of greatest density for farms operated by white owners are those occupied bv the Germans of southeastern Pennsylvania and eastern Wisconsin, the mountaineers of western Pennsylvania, eastern Tennessee, and western North Carolina, by the farmers of Kentucky, Indiana, Ohio, and southern Michigan, and by the pioneers in the West. The fewer number of owner farmers in the prairie portion of the Corn Belt, as compared with the originally forested portion, is noteworthy. This is due, in part, to the larger, consequently fewer, farms, and in part to the larger proportion of tenants (see fig. 9). The thinner distribution in northern New England, the upper Lakes region, and the West is owing to fewer farms and not t« a smaller proportion of farms operated by owners.

Farm Ownership and Tenancy. 519
UNITED STATES TOTAL 550,580 FARMS
FIG. 14.—More than a half million farms were operated by part owners in 1920. They were most numerous in the States of the Middle West, espe- cially in the marginal portions of the Corn Belt and in the wheat-growing areas of the eastern plains.
Corn Belt; (9) in the spring wheat and winter wheat areas of the plains, but with a strong tendency to decrease in relative importance in these areas (fig. 6), and (10) throughout the livestock ranching regions of the West.
Part owners are farm owners who rent additional land. Their farms are usually larger than those of owners who rent no additional land. The regions of greatest density for farms of part owners in- clude Indiana and adjacent portions of Ohio, southern Michigan, and southern Illinois, as well as northern and western Missouri and east- ern Kansas. Part owners farm a much larger proportion of the land in the West than in the East, especially in the Great Plains region, where, owing largely to failure to adapt the homestead policy to
ACREAGE OPERATED BY PART OWNERS PERCENTAGE OF ALL FARM ACREAGE
1920 ^^
UNITED STATES AVERAGE 16.4 PER CENT
FIG. 15.—The relative importance of part owners in the western half of the country, expressed in terms of farm acreage, is much greater than is shown in Figure 14. In the Western States part owners operate from a sixth to nearly two-fifths of the farm area ; in the eastern and central Corn Belt from a sixth to a tenth ; and in the Eastern and Southern States less than one-tenth.

520 Yearbook of the Department of Agriculture^ 1923,
UNITED STATES TOTAL 68,4A9
FIG. 1G.—In New England and some of the Middle Atlantic States a good many of the farms operated by managers are country estates of wealthy men in the cities. Others are lart'e truck farms, flower farms, and fruit farms.
the semiarid lands of this region, the farms as taken up were too small and many farmers have had to rent additional land (fig. 15).
Managers operate mostly large farms, notably large estates in the East and livestock ranches in the West. These farms are most numerous along the Atlantic coast from Massachusetts to Maryland, in the Corn Belt, and in California (fig. 16). However, the percent- age of the total farm acreage operated by managers is largest in the Southwest where such farms comprise from one-eighth to one-thinl of the total farm area (fig. 17).
Statistics of land ownership and tenancy require special interpre- tation in the western half of the country. In this area much of the improved land is in irrigated districts, and in these districts tenancy
ACREAGE OPERATED BY MANAGERS ERCENTAGE OF ALL FARM ACREAGE
UNITED STATES AVERAGE 2.0 PEIR CENT
FIG. 17.—In nearly all parts of the country the percentage of the farm acreage operated by managers is much larger than the percentage of tho number of farms so operated, because manager-operated farms are larger than other farms. This is especially the case in some of the New England and Middle Atlantic States : in Florida. Louisiana, and Texas ; and in most of the Mountain and Pacific States. In fact, the relative importance of manager-operated farms in the West is probably greater than the map indi- cates because of the inclusion of land not reported in the census. (See pp. 521-522.)

Farm Ownership and Trruincy. 521
has developed with notable rapidity during the last few years. How- ever, most of the rented land in this section is unimproved grazing land.
In the Rocky Mountain and Pacific States, part owners in 1920 rented about 1 acre of improved land to every 3 acres rented by tenants. Part owners operated under lease almost as much improved land as did full tenants in Montana, Wyoming, and Utah. Part owners and tenants rented over half the improved acreage in Wash- ington and over a third in California, Oregon, and Colorado. These two classes of operators rented over 95 million acres of unimproved land in farms in the 17 Western States, and in 10 of these States part owners rented more than did tenants (fig. 18). Managers op- erated about 7 per cent of the improved land in the two western divisions referred to, but the area of both improved and unimproved farm land operated by managers in 1920 was 11 per cent of the re-
Fio. 18,—Over two-thirds of the unimproved farm acreage under lease is in the^ 17 Western States, the 6 stretching from North Dakota to Texas con- taining two-fifths of all such land. In the half of the United States lying west of meridian 100 nearly all of the unimproved farm land under lease is used for grazing. In the North Central States unimproved land is rented in about the same percentage as improved land. In the Southern States, however, the proportion of unimproved acreage that is under lease is much less than the corresponding proportion for improved land. It should be noted that the rented acreage includes that rented by part owners.
ported area of farm land and was as high as one-third of the total farm area in Nevada (fig. 17).
The tenure of unimproved land in the West is not shown adequately by census reports. The census definition of a farm appears to have been so applied as to leave out of account much of the land leased for gracing by Indians under the guardianship of the United States Government, by State governments and institutions, and probably by railways and other large owners (figs. 21, 22, and 23). Statistics from other than census sources as to the amount of land leased by Indians, railways, and States indicate in at least one State an acre- age over three times that which the census classifies as leased farm land.
When allowance is made for these factors in the land tenure of the Western States, for upwards of 150 million acres of Federal public land used as free range, and for large areas of national and State

522 Yearbook of the Department of Agriculture^ 1923.
forests used under permit systems or otherwise (figs. 19 and 20), it is apparent that the proportion of farm and ranch land in the West- ern States which is owned by the operators is much smaller than is indicated by census statistics.
North Dakota, South Dakota, Nebraska, and Kansas are semiarid in their western portions and humid in their eastern portions. Ten-
FEDERAL LANDS UNAPPROPRIATED AND UNRESERVED JULY I, 1923
Nev. S2.690.6<^S Utah 2S,Z42,338 Wuo. 18,717,183 , Calif. /e,09l,/87 N.Dak. N. Mex. / 6,^-91,56^ Ok la. ■ Ariz. /¿f,9Sl,860 Nebr. Oreg. /3,677,Sd3 /Cans. Idaho /0,0^0,91 Z Other Colo.
STATE ACRES Mont S,908.fS6
7,753./Z9 '
Wash. ij8^,saa S.Dak. 193,023
■ ~ ■ /12,936 36,9<^ 29,685
2,8^2 808,701
EACH DOT REPRESENTS 10.000 ACRE3
/as,933.272
FIG 19.—About 186,000,000 acres of unappropriated aud unreserved land remained in the Federal public domain on July 1. 1923. Over 185,000,000 acres were in the States shown above. In some counties of W.vomini;. Nevada, and Oregon over 60 per cent of the land area is still in the Federal domain and open to homesteadins:. However, there is but little remaining land in the public domain that is suitable for crop production. The greater part iá used for grazing, though without the regulation exercised in the national forests. Owing to this lack of control the land is overgrazed and the carrying capacity is deteriorating rapidly. In Texas all public lands were reserved to the State at the time of its admission to the Union.
ure conditions in the western counties of these States are not widely different from those existing in the semiarid portions of the Rocky Mountain and Pacific regions.
Causes of the Development of Tenant Farming—L The Condi- tions That Cause Land to be Owned by Landlords.
The amount of farm land rented at any time is a result of condi- tions in what we may call the rent market. Our problem is to ex- plain why land is offered in this market for rent, and why men, either

Farm Otrnership and Tenancy. 523
^'V>CJTK}¿'^O^" OF ANIMAL UNITS GRAZED UNDER PLñUn^''^^
FIG 20.—Out of 150.000,000 acres in national forests, about 110,000,000 acres, practically all in the Western States, is included in the grazing allowances. On this acreage nearly one-fourth of the livestock, excluding work stock, in the West is grazed during the pasture season. The percentage of grazed land is lowest whei-e the forests are densest. The map does not take account of the animals grazed free, which are 10 per cent as numerous as the animal units paid for and shown here. Permits issued by the Forest Service for grazing livestock on national forest lands do not grant the per- mittees a tenure in the land. They aljow many farmers, Tiowever, to extend their grazing operations in much the same way as if owning or renting this land.
INDIAN LANDS LEASED FOR CULTIVATION AND GRAZING
1920
EACH DOT REPRESENTS 100.000 ACRES
FIG oi In 1920 approximately 17,000,000 acres of Indian land, mainly in the"" western half of the country, were leased for cultivation and grazing under the auspices of the Federal Government. The amount of sucn land reported for the year ended June 30, 1923, was about lo.OOO,pOO acres. Of the area thus under lease in 1923 about 60 per cent consisted of unallotted or tribal lands.. Seven-eighths or more of the total area leased was used for grazing. Practically all of the leases were for cash. This information is made available through the courtesy of the Commissioner of Indian Affairs.
85813''—YBK 1923 34

524 Yearbook of the Department of Agriculture^ 1923.
through necessity or from preference, are willing to rent land for the purpose of farming it. Briefly, who are the landlords * and who are the tenants? What conditions determine the supply of land oifered for rent in the rent market and the extent of the demand for such land?
\^jLAND BELONGING TO STATESAND STATE INSTITUTIONS \ >:^ LEASED FOR CULTIVATION AND GRAZING
>%—-~--7-^ '^^^ , -^f^^^---^ \Bi^:3-^-y.r\ /^ Í \_,j¿:¿^£a-- ^ > . J ^
/ ^^ • % - \ ^ / ' • V •••• :'
' :-—-—"' " \ 1 ■—r^i. ' =^-^-^ ___t7Tk- / \ 1
\\ \ 53,015 X _ \ ACRES X r^
' 100.625 ••ACRES . ^^jj^LX
^^\\¿B\ 1 X .. "^xfS^ ^p 1
\ / • ■ «» ^ 9,60't.OOO 1 A 5 : -^-Jk -^^ ACRES J
tACH DOT REPRESENTS ^"^^^ \^ JT
5.000 ACRES /^^^ ^V Jf
I'iG. 22.—Practically all of the State-owned lands leased for cultivation and grazing are in the 17 Western States, amounting to about 30,000,000 acres. In Texas, New Mexico, and California the available information does not admit of the location of the land by counties. In Texas the 2,000,000 acres shown belong to the State university. The information shown in the map was obtained partly from published reports and partly through the courtesy of State officials.
Public Ownership and Leasing of Land.
A good deal of leased land in the United States is owned by public agencies. Broadly speaking, it has not been the policy of the Federal Government to lease its land to the users. At present practically all of the public land suitable for farming has been disposed of, but there still remains an area of about 186 million acres, largely consist- ing of arid land in the Southwest and Inter-Mountain regions, most of which is used free of rent as a grazing commons by cattle and sheep graziers ^ (fig. 19). The privilege of grazing livestock on ap- proximately 110 million acres in the national forests is granted to
* The terms *' landlords " and " landlordism " are not used in an invidious sense. Land- lordism is. employed merely as a convenient expresision to designate the system of letting land to those who will use It. The term landlords is used to indicate individuals or corporations who let land to others, whether on a large or a small scale.
5 It is believed that this promiscuous and unregulated use should be replaced by a sys- tem of regulated grazing. (See pp. 404, 405, and 505.)

Farm Ownership and Tenancy, 525
private individuals under the permit system (fig. 20). Since the per- mit technically is not a lease, these lands naturally do not appear in our census statistics of rented land.^
As trustee for its Indian wards the Federal Government also acts as landlord for a large number of tenant farmers. Land in the West- ern States administered by the United States in behalf of Indians amounted in 1923 to 15 million acres leased for agricultural and graz- ing purposes (fig. 21).
RAILROAD LANDS LEASED FOR CULTIVATION AND GRAZING. 1923
EXCEPT ARIZ.AND N.MEX. = 19I9
17 WESTERN STATES MOST IMPORTANT LANDOWNING RAILROADS ONLY
EACH DOT REPRESENTS 5.000 ACRES
FIG. 23.—Approximately 17,000,000 acres of land leased for cultivation and irrazin« is owned by the principal landowning railroads in the 17 \\ este m States^ Nearly all of this area is leased for grazing. The information was made available through the courtesy of the officials íl^J^e railroads con- cerned. Outside of the area shown above it.is ^^'^^^^l^^ P'.^lJ^f.^'^^^^ 8,000,000 acres is leased for cultivation or grazing by other railroads in tbc United States. For location see Farmers' Bulletin ^o. 1271, page 4¿í.
The states, particularly those in the western part of the country, as noted above, are large landlords, renting approximately 30 million acres (fig. 22). West of meridian 100 these lands are leased mostly for grazing and haying purposes.
Private Ownership and Leasing of Land.
Some of the railroads, particularly in the western half of the coun- try, are also large landed proprietors, principally as a result of rail- way land grants. It has been their policy to use their holdings to
«The grant does not involve the exclusive orr assured use of a specific ar^»J>^* ^^nly the right to S-aze a certain number of stock under carefully drawn regulations and for a cer- tain charge per head. This right is revocable.
526 Yewrbooh of the Department of Agriculture^ 1923.
induce settlement and to await the increment in value that comes with settlement. Pending this development, they have been leasing m recent years approximately 17 million acres of their land, mostlv to stockmen (fig. 23). ? ^
With the exception of the West, most of the land leased for agri- cultural use in the United States is privately owned. This land is nearly all in farms and is used for the production of crops more largely than for grazing. The reasons which cause farm owners to let part or all of their land deserve brief notice.
TEMPORARY INABIIÏY OF PRIVATE OWNERS TO OPERATE THEIR LAND.
Even if we suppose a newly settled region in which every farmer owns his land, it is clear that this condition could scarcely continue. Some operators might desire a vacation or be compelled on account of illness or business to leave home for more or less prolonged ab- sences, during which they would be likely to offer their land for rent pending their return. In other cases, operating owners who have recently acquired new tracts might prefer to allow the former operators to remain in charge for a time under rent arrangements while the new purchasers adjust their business affairs.
Still other circumstances may make it necessary for a farm opera- tor to reduce the size of the area operated. It may be impaired health; the fact that his sons have left home and can not adequately be replaced by hired laborers; or the pressure of other business in- terests. It is not always practicable to sell the excess acreage, for it may be an important part of a definite farm unit or it may be that none of the adjacent farmers is ready or able to purchase the tract. It is probable that a good deal of the land rented by the class of part owners is made available by some of these or similar conditions.
CONDITIONS WHICH CAUSE LANDOWNING FARMERS TO LEAVE THEIR FARMS PERMANENTLY.
All farmers must ultimately leave their farms permanently through change to other business, retirement, or death. A certain amount of renting will inevitably result from such changes.
Let us consider first the circumstances arising from death. The settlement of estates sometimes involves long periods due to litiga- tion, to the fact that all of the heirs are not yet of age, and to other causes. During such intervals the executors may rent the estate, frequently to one of the heirs. Similarly, it often happens that it would be necessary to divide a farm into several uneconomic units in order to make a fair division among the various heirs. The prob- lem is frequently solved by arranging for one of the heirs to rent the farm from the others or by letting the farm to a third party and dividing the rental among the heirs.
Even when an estate passes to a widow or heir who desires to sell it, immediate sale is not always feasible for some of the rea- sons hereafter mentioned (page 528), and temporary renting is likely to result.
It is clear that the larger the percentage of native, farm-born population in cities the larger will be the proportion of cases in which the change in the ownership of farm land necessitated by death will result in the title passing by inheritance, marriage, or otherwise, to non-farmers. The large increase in proportion of urban

Farm Oivnership and Tenancy, 527
population in the United States has greatly increased the chances that the heirs of deceased farm owners will be persons engaged in non-farming occupations, and this probably has been intensified by the movement of the children of farmers into other occupations.
In periods of agricultural depression considerable areas of farm land pass into the ownership of creditors. The laws of many States give the debtor a privilege of redemption lasting from four months to two years, and during this interval of uncertainty the land is, likely to be offered for rent, even though the ultimate purpose of the creditor is to dispose of it by sale.
Many farmers retire more or less from active farming in later life (fig. 24). Sometimes the severance from active connection with farming is sudden and complete, but more generally it is gradual, and justifies the expression, " the retreat from the land." With the approach of age or infirmity the experienced farmer is likely to rent part or all of his land to a tenant, retaining supervision over the
AGE OP MORTGAGE-FREE OWNER FARMERS; UNITED STATES, 1920; AND AGE AT WHICH LANDLORDS 40 YEARS OLD AND OVER IN 1920 RE- TIRED FROM FARMING, CENSUS OF 1920.
PER CENT OF MORTGAGE-FREE OWNER FARMERS WHO WERE IN EACH AOEGROUP
50 40 30 20 10 0
AGE PE^R CENT OF RETIRED FARMER LANDLORDS WHO RETIRED AT THEAGE INDICATED
0 10 20 30 40 50
FIG. 24.—Death and retirement combined reduce the proportion of owner- farmers in age groups above 55 years. The number of farmers retiring increases with eacli successive age group. The left-hand portion of the graph is based on the 1920 census, while the right-hand portion is based on reports from 7.588 landlords received by the Bureau of Agricultural Eco- nomics, Division of Land Economics.
details of the business. If his holdings are large he is likely to cease direct operation gradually by increasing from time to time the area rented. This is suggested by Figure 25, which indicates that in the regions where tlie process of gradual retirement is charac- teristic the percentage of farms operated by men of 55 years and over decreases with the increase in the size of farms. This kind of landlordism is a very large factor in most of the important farm- ing regions of the United States where tenancy is prevalent. (Fig. 34).
Frequently retiring farmers rent their farms to sons or other rela- tives who will ultimately inherit all or part of the property. This method of associating a prospective heir with the original owner of the business under the nominal and temporary status of a tenant accounts for a good deal of renting of farm land in some sections of the country. In a recent study of nearly 57,000 tenants widely dis- tributed throughout the country it was found that 23 per cent were

528 Yearbook of the Department of Agriculture^ 1923,
related to landlords, the percentage ranging from 12 in nine South- ern States to 36 in five States of the North Central group. (Fig. 26),
CONDITIONS WHICH CAUSE OWNEKS OF LAND Ï0 RETAIN OWNERSHIP WHEN THEY DO NOT OPERATE IT.
It is important to determine why owners of farms, when they cease to be active operators, retain the ownership of their land and let it to tenants rather than sell it. Closely related to this is the
AGE OF FARMERS IN RELATION TO SIZE OF FARMS OPERATED, SELrECTED STATES, CENSUS OF 1910.
PER CENT OF ALL FARMS 20 30 40
UNDER 50 WM///yy/////y/ZPP7\
SOTOIOO f^^^fßp^
100 TO 175 ^j^^9^^^^^9^i99¡mzo^ii^zmzm¡m¡
I 75 AND OVER 'i6i¡&^íi^íym¡íi^^^^zi^z>¡i¡izíz^^
I Farmers 35 to ^S tfears I of age
Farmers S S years of a<je and o\^er
FIG. 25.—Men who are not beyond middle age usually prefer the larger-sized farms, and rent such farms if they can not buy. Elderly farmers who own the larger farms find it possible to retire and live on the rent which younger farmers are willing to pay for the use of the larger farms. A phase of the retreat of elderly farmers from the land is their more general occupancy of the smaller farms, these farms making less demand on their bodily vigor than farms of the larger sizes.
explanation of why others buy farm land which they do not intend to operate.
In the first place, it is not always possible to sell land immediately on favorable terms. The land market may be sluggish. In many rural communities opportunities for sa;le at satisfactory prices are infrequent. In parts of the South the land market is rather narrowly restricted to the landlord class, for most of the tenant farmers have neither the means nor the credit to purchase a farm.
There are also motives which may cause the farmer or his heirs to retain ownership from preference. These motives may be senti-

Farm, Ownership and Tenancy. 529
OTHER RELATIVES ^ NON-RELATIVES
mental, as, for instance, attachment to an old homestead and to the associations of the community ; they may be social, as, for instance, the desire to acquire the social prestige attached to land ownership: they may be economic or financial : or there may be some combination of the several classes of motives. In this country economic motives are by far the most important, and later will require more detailed consideration.
TENANTS WHO RENTED FARMS OWNED BY RELATIVES; PERCENTAGE OF ALL TENANTS ON 56,845 FARMS IN 24 STATES, 1920.
UNITED STATES 24- STATES
NORTH EASTERN 5 STATES
GREAT PLAINS 4- STATES
NORTH CENTRAL 5 STATES
SOUTHERN 9 STATES
RENTED FROM FATHER OR FATHER-IN-UKW
FIG. 26.—Twenty-three thousand landlords reported their degree of relatedness to approximately 57,000 tenants. For the United States as a whole about 28 per cent of the tenants were related by blood or marriage to the land- lord, most of them being sons or sons-in-law. The proportion is lowest in the South and highest in the North Central States, in some of which it is as much as 40 per cent.
Concentration of Land Ownership.
The concentration of land ownership in large holdings is favorable to landlordism and tenancy. It is true, the owner may operate the entire farm by means of hired labor, but such operation has many economic disadvantages. The most important of these are the un- certainty of the labor supply; the large element of risk involved in incurring heavy wage expenditures in anticipation of a "return so precarious and uncertain ag that from farming; and the difficulties of directing adequately a large labor force in an industry so ill adapted to standardization and routine.
The landlord may solve the problem by finding tenants capable of supplying the operating capital and the ability to conduct farm operations without supervision. However, if the tenants are unable to supply the necessary capital or direction, it will be necessary for the landlord or some other agency to furnish one or both of these important factors; and, very generally, if operating capital or means of subsistence must be advanced, the advancer considers it desirable to maintain more or less supervision over the business.
CONCENTRATION OF OWNERSHIP OF FARM LAND IN THE SOUTH.
The conditions just described prevailed in the former plantation regions of the South at the close of the War between the States. The land was owned in holdings considerably larger than would be

530 Yearbook of the Dej)artinent of Agriculture^ 1923,
THE PLANTATION REGION OF THE UNITED STATES.
FIG. 27.—For the most part the plantation area of the South is identical in location with the area of the antebellum plantation system. The plantation system occupies the regions of more fertile soils. The typical plantation is operated as a comparatively large farming unit, mostly by means of hired laborers and croppers under close supervision. However, not infrequently share tenants proper, standing renters, and cash renters, under more or less supervision, are found on plantations. In the alluvial lauds of the Missis- sippi River the plantation units are, in general, larger than in other parts of the South, and are also characterized by the most intensive supervision. The regular decennial census does not recognize plantations as statistical units, but a special census in 1910, on which the above map is largely based, showed 39,073 plantation organizations.
needed for a " family farm." The newlj^ emancipated laborers not only lacked operating capital but even the means of livelihood while growing the crop. Furthermore, they were without experience and unaccustomed to self-direction. There was no banking system to supply the needed capital and many of the planters were lacking in
PERCENTAGE OF RENTED FARMS OWNED BY LANDLORDS HOLDING TITLE TO SPECIFIED NUMBERS OF RENTED FARMS; UNITED STATES, SOUTHERN STATES, AND NORTH CENTRAL STATES, CENSUS OF 1900.
FARMS PER
LANDLORD
PERCENT OF ALL RENTED FARMS 20 40 60 80 100
UNITED STATES
SOUTHERN 3 STATES
NORTH CENTRAL 5 STAT-ES 10
FIG. 28.—In the above graph concentration of ownership is shown in terms of number of farms, with evidence of heavier concentration in the Southern States, due to the plantation system. The concentration of ownership measured by acreage and valuation was less than when measured by number of farms. The census of 1000 affords the only complete information for the country as a whole concerning the concentration of ownership of rented farms.

Farm Ownership and Tenancy, 531
LANDLORDS OWNING TWO OR MORE RENTED FARMS; PERCENTAGE OF ALL LANDLORDS. AND PERCENTAGE OF ALL RENTED FARMS OWEND BY THEM, 1920.
PER CENT 0 10 20 30 40 50 60 70 80 90 - 100
LANDLORDS
RENTED FARMS
... 1 1 1 1 1 1 1 >=..
m ■ «a» rr 1 ___L 1 1 1 1
^^ 1 ̂ ^M ̂ ^^P m>^ I—T"^-T^-\ I 1 1 1 1
FIG. 29.—Landlords owning two or more rented ifarms each comprised a fifth of all landlords, but owned a little over half of all the rented farms in 1920. The graph is based on a special study of 275,000 rented farms in selected counties of 24 States made by the Bureau of Agricultural Econom- ics, Division of Land Economics^ In the case of this figure and the four figures immediately following, the word " farms " is used in place of the words " ownership* parcels." As shown by a study of 106,000 of the above parcels, all but 7 per cent are in themselves complete farms.
money capital, making it difficult to set up a wage system. The system of marketing had largely developed to serve the needs of large plantations rather than small farms. Moreover, the freedmen were restless and unstable as hired laborers.
The large landoAvners resorted to the policy of giving the laborers a share of the crop instead of a fixed money wage, supplying operat- ing capital, the means of livelihood during the making of the crop, and a degree of supervision almost as close as that which they had formerly exercised over the slaves. When the landowner was unable, to supply operating and subsistence capital, this function was as- sumed by local merchants, who also supplied supervision through hired managers or riding bosses. This post-bellum plantation sys- tem has continued in most of the old plantation regions until the present (fig. 27). Each decennial census has shown a decrease in the average size of Southern farms, owing in part to the division of large plantations into groups of cropper or tenant farms, frequently with- out any change in the actual operation of the. whole; and, corre- spondingly, each decade up to 1910 has showm a large increase of so- called tenant farms. The results of the census of 1920 seem to indi- cate that these tremendous changes have either reached their approxi- mate completion or else have temporarily been suspended.
LANDLORDS OWNING FIVE OR MORE RENTED FARMS, PERCENTAGE OF ALL LANDLORDS, AND PERCENTAGE OF RENTED FARMS OWNED BY THEM, 1920. ^^^ ^^^^
O 10 20 30 40 50 60 70 80 90 «00
LANDLORDS
RENTED FARMS
I I I I LANDLORDS WHO OWN I FIVE OR MORE RENTED FARMS
1 RENTED FARMS OWNED BY LANDLORDS WHO OWN FIVE OR MORE RENTED FARMS
FIG. 30.—The special study of the ownership of 275,000 rented farms, men- tioned in Fijtiuro 20. showed tliat in 1920 a little more than one-fourth ot all the rented farms were owned by a little less than one-thirtieth of the landlords. Most of this concentration of ownership was in the southern plantation region.

532 Yearbook of the Department of Agriculture^ 192S.
In certain respects these changes have tended to emphasize unduly the national problem of tenancy. One result has been the numbering as tenants of over a half million persons who are not independent farm operators and to class as their landlords persons who are the actual operators of the so-called tenant farms. Furthermore, the nominal increase in the number of tenants really represents what in many respects comprises a higher status for the so-called tenants under the plantation system than they formerly occupied as hired laborers, and in still earlier times as slaves.
PROPORTION OF RENTED FARMS OWNED BY LANDLORDS HOLDING FIVE OR MORE RENTED FARMS; AREAS IN NORTHERN AND SOUTH- ERN STATES COMPARED, 1920.
COASTAL BELT PA. 9 SOUTHEASTERN COUNTIES 2.5
DEL, ALL3 COUNTJES 7.4
VA. ■^TOBACCOaS EAST-SHORE COUNTIES 21.0
N.C. 5 TOBACCO a 4COTTON COUNTIES 28.1
S.C. 2NORTHERN COTTON COUNTIES 4-4.2
GA. 6N0RTH CENTRAL COUNTIES ---- 36.2
ALA. 3BLACK PRAIRIE COUNTIES 7|.6
MISS. 5 DELTA PLANTATION COUNTIES 81.2
INTERIOR BELT N.DAK. 10 SPRING WHEAT COUNTIES ----3.6
WIS. 6 SOUTHERN DAIRY COUNTIES--- -Q.l
IOWA 18 CORN BELT COUNTIES --3.5
ILL. 21 CORN BELT COUNTIES 4. 8
KANS. 10 WINTER WWEAT COUNTIES-- --5. I
OKLA. 9 COTTON a GENl FARMING COS I 2,6
TEX. 4- BLACK PRAIRIE COUNTIES- -20.3
0 PERCENTAGE: OF ALL RENTED TARMS
20 -ChO 60 80- 100
1
.
"" 1
1
™ ™ ^ ^^
1
FlG. 31.—Outside of the South, rarely more than 5 per cent of the rented farms belong to landlords who own five or more rented farms each. In the South the concentration of ownership is much greater, ranging as high as 80 per cent in the Yazoo Delta. The source of the information is the same as for Figure 29.
The plantation system in the South is largely responsible for the concentration in ownership of farm land for the nation as a whole (figs. 28 and 31).
TKEND IN CONCENTRATION OF OWNERSHIP.
There has been no census report showing the concentration of farm ownership since 1900. However, a study of the ownership of 275,000 farm parcels, based on reports from tenants listed in the census schedules for 1920, affords more recent information for selected re- gions where tenancy is prevalent. In general, a comparative study of the 1900 and 1920 statistics does not indicate any great change in the degree of concentration for the nation as a whole. (Compare fig. 28 with figs. 29 and 30.) In both periods about half the rented farms were owned by landlords owning only one farm. In 1900 nearly 15 per cent of the total rented farm acreage and 22 per cent of the farms were owned by landlords who held title to five or more rented farms. In 1920 about 25 per cent of the farms in selected re- gions studied were thus owned.
There are several reasons why there has been no pronounced trend toward increased concentration of farm-land ownership. The rapid development of American industrialism has tended to attract large capitalists to the cities and to prevent them from acquiring large

Farm OicnersMp and Te^mncy. 533
farming estates for investment. The laws of inheritance in American States are based on the principle of equal partition among children, as in France, subject to the rights of the widow; and the practice of bequests appears to have been strongly influenced by the laws of inheritance. Up to the present time there has been no widespread tendency for farm land to be excessively subdivided, as in France, because of the practice of probate courts in this country to effect va- rious kinds of settlements that pass property to successors in units suitable for economic operation. On the other hand, as available farm land becomes scarcer and the demand for it more intense these inheritance laws might tend toward excessive subdivision, as in France. To be sure, other forces might give rise to increased con- centration.
CONCENTKATION OF OWNERSHIP OF LAND NOT IN FARMS.
The greatest concentration of lai^d ownership in the United States occurs in the case of land not in farms and consists of large hold- ings by railways, acquired through earlier grants in aid of construc- tion, and the large holdings of timber and mining companies. Most of these lands are not greatly in demand for farming. Except for the tendency, already noted, to rent temporarily to stockmen for grazing purposes, the policy of these large holders, for the most part, is to hold their lands for ultimate sale in small tracts to set- tlers, or to other concerns which intend to market the land to small purchasers.
KESIDENCE OF LANDLORDS.
To what extent do American landlords live sufficiently near their farms to exercise adequate control over the property? For the country as a whole information on this point is available only for 1900. At that time 78.8 per cent of rented farms were owned by landlords who resided in the same county in which the rented
PROPORTIONS OF RENTED FARMS OWNED BY LANDLORDS RESmiNG IN THE SAME COUNTY, AN ADJOINING COUNTY, OR MORE REMOTE LOCATIONS, 1920.
PER CENT 0 10 20 30 40 50 60 70 80 90 100
■\ ^■:■■; SAME-: COU NTY:>8Q%:;:■:;:■:Ï:;:■:'^^ 1 ■ ® MO =íER'E
1 :MOTEJ
PIG. 32.—Only 9 per cent of 275,000 tenant farms in 24 States were owned by landlords who resided neither in the same county nor in an adjoining; county. It is probable that this 9 per cent measures approximately what we may call absentee landlordism ; that is, the cases where the owner's residence is too remote to permit frequent visits to the property, although in some Qif these cases the owner is adequately represented by a resident manager or local agent. Source of data is the same as for Figure 29.
farms were located.^ In the special study of 275,000 tenant farms in 1920, previously mentioned, it was found that 80 per cent of the rented farms were owned by landlords who resided in the same county, and an additional 11 per cent by landlords residing in
^ The census shows that 75.2 per cent of all tenant farms were owned by landlords definitely reported to reside in the county where the farms were located. However, 4.5 per cent were owned by landlords of unreported residence. By prorating this 4.5 per cent, the total percentage is changed to 76.8.

534 Yearbook of the Department of Agriculture^ 192S.
counties adjoining the one in which their farms were located. This leaves only 9 per cent of the rented farms owned by landlords living at greater distances (fig. 32).
The proportion of cases in which landlords were remote from their farms is found to be considerably greater in the North and
PLACE OF RESIDENCE OF LANDLORDS OF RENTED FARMS.
OWNERS O F NORTHERN FARMS C NORTH OF POTOMAC. OHIO AND RED RIVERS )
OWNERS OF SOUTHERN FARMS
I ON FARMS I TOWNS OF 2500 OR LESS ' POPULATION I POPULATION
FIG. 33.—In the Northern States more than a third of the landlords reside on farms, while in the South the proportion is more than two-thirds. > In the North about half of the landlords living in cities and villages are retired farmers (fig. 34). The graph is based on returns from 28,000 landlords in 24 States to a special inquiry made by the Bureau of Agricultural Eco- nomics, Division of Land Economics.
West than in the South. For instance, in a group of counties in Illinois 25 per cent of the rented farms were owned by landlords who lived outside of the same counties, while 10 per cent were owned by landlords who lived outside of the same or adjoining counties,
OCCUPATIONS OF LANDLORDS OF RENTED FARMS.
OWNERS OF NORTHERN FARMS C NORTH OF POTOMAC. OHIO AND REP RIVERS )
OWNERS OFSOUTKERN FARMS
LEGEND FARMING ^ OTHER AGRICULTURAL OCCUPATIONS
I—I NON-AGRICULTURAL OCCUPATIONS ^ RETIRED OR IDLE
PIG, 34.—The proportion of landlords still classed as farmers is much larger in the South than in the North, but if retired farmers, many of whom exercise supervision over their rented farms, are considered farmers, the difference is not so great. About a third of the farm landlords of the two regions appear to be engaged in nonagricultural occupations. This figure is based on reports from 23,000 landlords, mentioned in Figure 33.

Farm Ownership and Tenancy, 535
whereas in the Yazoo Delta the corresponding percentages were 12 and 5. Furthermore, the percentage of cases in which landlords were remote from their farms is higher in some of the more re- cently developed farming regions than in some of the older farm- ing regions. Thus, in eastern North Dakota 40 per cent of the tenant farms were owned by landlords not residing in the same county, and the proportion is nearly as large in central Kansas and in Oklahoma. In the Middle Atlantic States the percentages for six groups of counties varied from 13 to 26 ; in southern Wisconsin, the percentage was 19 ; in western Ohio, 21 ; in Illinois, 25 ; and in Iowa 28.
The larger proportion of landlords remote from their farms in the newly developed regions of the West is related to the Federal land policy in the distribution of the public domain and explains in part why States so recently settled quickly develop high per- centages of tenancy. The throwing open of large tracts of farm land to homesteading attracted many people whose principal con- cern was to acquire a valuable farm property but with no inten- tion of permanent residence on the farm. For instance, Oklahoma was settled by homesteaders little more than two decades ago, yet, in 1910 and 1920, tenant farms were over 50 per cent of the total number of farms.^ . In the North and West a much larger proportion of the landlords reside in cities and villages, nearly two-thirds in fact, whereas in the South about two-thirds of the landlords live on farms (fig. 33).
OCCUPATIONS OF LANDLORDS.
The proportion of landlords who reported farming as their regu- lar occupation was smaller than the proportion residing on farms (fig. 34). The proportion actively engaged in farming was more than twice as large in the South as in the North, emphasizing the conclusion that in the South landlordism is largely a phase t)f plan- tation operation, while in the North it is more largely a phase of retirement or retreat from the land. Among northern landlords considerable' différence is indicated between those in the Corn Belt and Middle Atlantic States and those in the Dakotas and Kansas. In the latter areas the landlords are engaged in farming operations in a larger proportion of cases than in the States farther east.
FARMING EXPERIENCE OF LANDLORDS.
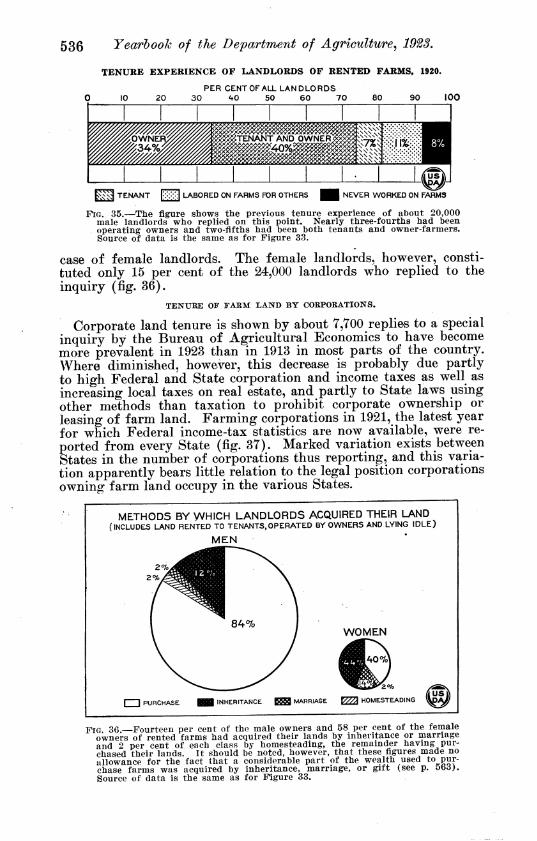
To what extent are landlords men of farming experience? In- quiry on this point from upwards of 20,000 male landlords revealed the fact that only 8 per cent of them had never been engaged in any kind of farming occupation (fig. 35).
METHODS BY WHICH LANDLORDS ACQUIRED THE OWNERSHIP OF THEIR FARMS.
Apparently, the great majority of landlords acquired the owner- ship of their farms by purchase. Direct acquisition by inheritance or by marriage was responsible for only 14 per cent of the acreage acquired by the male landlords (page 536). but for 38 per cent in the
» It should also be noted that in this region no small part of the number of tenant farmers is accounted for by the renting of State lands and Indian lands.
536 Yearbook of the Department of Agriculture^ 1923,
TENURE EXPERIENCE OF LANDLORDS OF RENTED FARMS, 1920.
PER CENT OF ALL LANDLORDS
TENANT Ij:;:;:;:! LABORED ON FARMS FDR OTHERS ^ NEVER WORKED ON FARMS
FIG. 35.—The figure shows the previous tenure experience of about 20,000 male landlords who replied on this point. Nearly three-fourths had been operating owners and two-fifths had been both tenants and owner-farmers. Source of data is the same as for Figure 33.
case of female landlords. The female landlords, however, consti- tuted only 15 per cent of the 24,000 landlords who replied to the inquiry (fig. 36).
TENURE OF F ASM LAND BY CORPORATIONS.
Corporate land tenure is shown by about 7,700 replies to a special inquiry by the Bureau of Agricultural Economics to have become more prevalent in 1923 than in 1913 in most parts of the country. Where diminished, however, this decrease is probably due partly to high Federal and State corporation and income taxes as well as increasing local taxes on real estate, and partly to State laws using other methods than taxation to prohibit corporate ownership or leasing of farm land. Farming corporations in 1921, the latest year for which Federal income-tax statistics are now available, were re- ported from every State (fig. 37). Marked variation exists between States in the number of corporations thus reporting, and this varia- tion apparently bears little relation to the legal position corporations owning farm land occupy in the various States.
METHODS BY WHICH LANDLORDS ACQUIRED THEIR LAND (INCLUDES LAND RENTED TO TENANTS.OPERATED BY OWNERS AND LYING IDLE)
MEN
WOMEN
I I PURCHASE INHERITANCE I MARRJAGE J777\ HOMESTEADING
FIG 36 —Fourteen per cent of the male owners and 58 per cent of the female owners of rented farms had acquired their lands by Inheritance or marriage and 2 per cent of each class by homesteading, the reinainder having pur- chased their lands. It should be noted, however, that these figures made no allowance for the fact that a considerable part of the wealth used to pur- chase farms was acquired by inheritance, marriage, or gift (see p. 56d). Source of data is the same as for Figure 33.

Farm Oicnevship and Tenancy, 537
A certain amount of farm real estate is held by corporations whose agricultural activities are incidental to their operations, as in the case of canneries, refineries, or manufactories of other kinds.
There are numerous corporations having a temporary tenure rela- tionship to particular areas of farm land. These include lumber companies, land development companies, and money-lending cor- porations. Institutions of the last-mentioned variety have appar-
FiG. 37.—A classification of 1,G80 of the 7.428 farminj; corporations is as follows : Cottoü farming, 11, or 0.7 per cent ; grain farming, 23, or 1.4 per ment; stock farming, 711, or 42.1 per cent; and fruit farming, 944, or 55.0 per cent. Of the 7,428 farming corporations, 2,684 reported net income, the aggregate being $34.266,175, and 4,744 reported net deficits in an aggre- gate of $63,334,248 for the year 1921. However, this year was less pro- ductive of income for farmers than the years immediately preceding. Cor- porations are distributed among the States according to the location of the internal revenue offices in which their income tax returns are filed. Cor- f>orations reporting from New Jersey, for example, may have owned or eased property located in several States, and in some cases may have
owned or leased no property in that State except to maintain an office,
ently increased their holdings in some sections, presumably because of taking farm land in satisfaction of debt.
OWNERSHIP OF LAND BY PERSONS OF FOREIGN BIRTH.
Under the common law aliens are not permitted to own land. However, this rule has been modified by statutory^ enactments in all of the States. In 18 States aliens are given the unrestricted right to the ownership of land. In others the right is limited. In a number of States aliens are permitted to acquire landownership by inheritance, but are compelled to dispose of the title within a speci- fied number of years. In some States the restrictions are made to turn on the question of residence or nonresidence. By treaties with certain countries the Federal Government has accorded the rights of ownership to their nationals for limited periods and purposes. Through its definition of citizenship and determination of re- quirements for naturalization, the Federal Government has also ex- erted an ini^ireçt influence, which, by existing legislation in a num- ber of States, has been directed against the tenure of land by certain

538 Yearbook of the Department of Agriculture^ 1923,
classes of aliens. This has been a factor of large importance on the Pacific coast.
According to the census of 1900, there were only 699 nonresident aliens owning rented farms in the united States. They owned 1,093 farms. No more recent statistics are available for the United States as a whole concerning the ownership of land by nonresident aliens. In 1920, however, 10.6 per cent of all white farm operators in the United States were of foreign birth, including those naturalized and unnaturalized. Of these foreign-born operators, 79.9 per cent were either owners or part owners, while only 65.6 per cent of the native- born operators were owners and part owners.
SUMMARY OF THE CHARACTERISTICS OF LANDLORDISM IN THE UNITED STATES.
We may now summarize the characteristics of farm landlordism in America. All but a small proportion of the landlords have grown up from the soil and possess direct experience with farming. More than a third are engaged in agricultural occupations, nearly another third are retired farmers, and the remaining third are in nonagri- cultural occupations, mostly country bankers, merchants, and pro- fessional men in the country towns and villages who have either come into farm ownership through inheritance or marriage, or have purchased farms for purposes of investment or speculation. Fifteen per cent of the owners of rented farms are women, for the most part widows or daughters of deceased farmers. Corporations do not comprise an important class of landlords. Probably not more than 10 per cent of the rented farms are ownesd by absentee landlords, and apparently there has been little change in this regard since 1900. Ther^ is but little concentration of ownership, except in the planta- tion region of the South, and apparently for the country as a whole there has been no increase in concentration. However, there is enough both of absenteeism and concentration of ownership to justify real concern. There is comparatively little ownership of farm land by nonresident aliens.
Causes of the Development of Tenant Farming—II. Conditions Which Determine That Persons Will Become Tenants.
TEMPORARY CONDITIONS CAUSING MEN TO PREFER-TO RENT RATHER THAN TO OWN THE LAND THEY OPERATE.
Under certain conditions men prefer to rent temporarily rather than to own the land they operate. For instance, the farm owner expecting shortly to retire from farming or to engage in another business may have a favorable opportunity to sell the farm he owns before he is quite ready to quit farming, and may prefer to rent a farm rather than to purchase for the short remaining period. Others who propose to buy farms, especially in new regions, may desire to become acquainted with the neighborhood and its oppor- tunities or to acquire more experience as farm operators before venturing to purchase. This latter motive for renting operates par- ticularly in the case of sons or sons-in-law who will ultimately inherit the ownership of the farms.

Fœnn Ownership and Tenancy. 539
While some farmers remain tenants deliberately, even though they have suiBcient capital to purchase a farm, the great majority become tenants and many continue as tenants because they do not command sufficient capital and credit to purchase a farm and provide the requisite operating capital. Therefore, tenancy is closely connected with the valuation of farm real estate.
Relation of Tenancy to the Valuation of Farm Real Estate.
It has sometimes been said that tenancy and high farm real estate valuation " go together," with the suggestion that the latter is largely responsible for the former, but the matter is not quite so simple as this. It is true that a high percentage of tenancy is fre- quently associated with high land valuations, but the exceptions are quite numerous (compare figs. 9 and 38). A mathematical coefficient of correlation calculated for each of the States of the Union on the basis of the relationship of percentage of tenancy to average value of farm real estate per acre, by counties, shows that in at least a score of States the coefficient is either negative or too low to indi- cate a significant correlation. In only about a dozen States is the relationship well marked.
One assumption that sometimes underlies the idea that high farm real estate valuations are likely to result in a high percentage of tenancy is that it must be harder, or else take longer, to pay for a farm consisting of high-valued land than for one consisting of low- valued land. If the farm is to be paid for out of the earnings attributable to the farm real estate, however, and if these earnings are proportionate to the valuation of the land, it should not be more difficult to pay for a f^rm in a section where valuations and earnings are high than in a section where both are low. The valua- tion of farm real estate does not always vary in exact proportion to income attributable to it, as will be shown later, but that the relationship is very close is indicated by the results of more than a score of local farm surveys. Moreover, a study of the average number of years spent as farm wage earners and as tenants by those who passed through both stages before becoming farm owners in- dicates that the period is not longer in the sections of high land valuations than in those of low land valuations.
In general, the greatest difficulty in acquiring a farm is in secur- ing a sum sufficient for the initial payment, and it is sometimes argued that the higher valuation of farm real estate compels the farmer to accumulate a larger sum for initial payment, thus forc- ing him to remain a longer time as a tenant before attempting to buy a farm and also to command a larger volume of credit in order to finance the remaining indebtedness. There is a considerable de- gree of truth in this, but it is possible to give the point exaggerated importance. As between different periods the change in the valua- tion of farm real estate measured in terms of the current purchasing power of money may reflect largely a change in the value of the money itself. Temporarily, this may or may not increase the period of waiting before buying, depending on a number of circumstances, such as the effect of the change in the value of money on the power of tenants and other prospective owners to accumulate and on the am.ount and value of their savings. As between areas of high-
85813'»—YBK 1923 35 + 36

^F
AVERAGE STATE VALUE Iowa $39,9^1 S.Dak. 3 7,635 Nebr. 33,771 Ney. 31,576 Calif. 29,158 III. 28,10 6
AVERAGE STATE VALUE Ariz. ^23,A.ia N.Dak. 22,651 WUO. 21,2.35 Minn. 21,221 other 6,536
12,084 70.^ 1^.7 ^.e 10.3
FIG. O8.—The average valuation of farms, including buildiniis, machinery, and livestock, in the prairie portion of the Corn Belt and the southern part of the sprinj? wheat region was about $40,000 in 1920. The high valuations shown in western Texas and northern Nevada are mostly of cattle ranches, which are few in number and large in area, often including thousands of acres of arid range and hundreds of cattle. In central and southern California, on the other liand, many of the hi¿li-priced farms are small, but con- sist of expensive orchards or of bean or sugar-beet land. The very low-priced farms shown in the eastern (\)tton r>elt are' in large part, small cropper or tenant holdings in plantations. The light areas in Kentucky and Tennessee represent poor mountain farms Tn most parts of the Fnited States there has been a marked decrease since 1920 in the pric(^s of farms and equipuK^t. especially of land. .

Farm Oicnership and Tenancy. 541
valued and those of low-valued real estate, high valuations are frequently associated with high net w^orth on the part of tenants. Thus, an Iowa survey in 1918 showed the average net worth of farm tenants in a selected region of high land valuation to be $9,552, which was more than the average total farm capital of owner farmers in many other parts of the United States. While the census since 1900 has not classified farms in accordance with their valuation, except mortgaged farms of owner farmers in 1920, the relative diver- sity of valuations, when livestock, implements and machinery are included with land and buildings, is indicated in Table 2, derived from the census of 1920.
TABLE 2.—Classification of counties hy average valuation of farm property, including real estate, livestock, implements, and macMnery, 1920}
Range of average total valu- ation of farm property per farm, by counties.
Under $5,000 $5,000 to $9,999._.. $10,000 to $14,999.. $15,000 to $19,999.. $20,000 to $24,999.. $25,000 to $29,999.. $30,000 to $34,999..
Number and per- centage of counties.
Number. ^ Per cent. 821 i 26.7 747 ' 24.3 435 : 14. 2 329 10.7 193' 6.3 162 5.3 102 3.3
Range of average total valu- ation of farm property per farm, by counties.
$35,000 to $39,999- $40,000 to $44,999. $45,000 to $49,999.. $50,000 to $54,999.. $55,000 and over..
Total.
Number and per- centage of counties.
Number. 80 56 51 35 60
Per cent. 2.6 1.8 1.7 1.9 1.2
100.0
^ Based on census statistics.
Although it is possible to give exaggerated importance to real estate valuations as an influence toward the development of tenancy, there are a number of regions in the United States of very low land valuations where tenancy is conspicuous for its absence, as for in- stance, in some of the sandy lands of the Atlantic and Gulf coastal plains and in the Appalachian and Ozark plateaus. Frequently, the high percentage of landowning farmers in these regions is an ex- pression of the fact that agriculture still continues more or less in the self-sufficing stage, yielding too small a money income to permit the farm owner to retire and lease the farm to another.
Influence of the Ratio of the Income to the Capital Valuation of Farm Real Estate.
It appears probable that a marked increase in the valuation of farm real estate is a more significant influence than the high farm real estate valuations themselves, and that where high real estate valua- tions and a high percentage of tenancy are associated, this associa- tion is largely due to the influence of the increases in valuation more than to the high valuations in themselves.
The rapid increase in the valuation of farm real estate since 1850 is shown in Figure 39. How large a factor this increase has been from the standpoint of an investor may be more clearly shown by expressing the increase in investment terms. Thus, the average in- crease in the valuation per acre of farm real estate in the United States from 1900 to 1920 (fig. 40) is equivalent to an annual interest rate of 6.47 per cent compounded annually on the average valuation in 1900, and this is in addition to the annual rental earned by the property during the interval. In the case of Iowa, the in- crement from 1850 to 1920 is equivalent to an interest rate of 5.31 per cent compounded annually, while the increment from 1900 to

542 Yearhoolc of the Department of Agriculture^ 1923,
CHANGES IN THE AVERAGE VALUATION OF FARM REAL ESTATE PER ACRE AND PER FARM, AND OF AVERAGE ACREAGE PER FARM; UNITED STATES, IOWA, PENNSYLVANIA, AND GEORGIA, CENSUS 1850-1920.
VALUE PER ACRE DOLLARS
UNITED 0 50 ]oo 150 200 250 STATES /aso 11
VALUE PER FARM THOUSANDS OF DOLLARS
SIZE OF FARM ACRES
100 200 300 400 500
PENNSYLVANIA" /850 27 '
/8 6 O 39
f8 7O 46
/eeO 49
/eso 50
/9 OO 46
/9/0 56
/920 75
GEORGIA /eso /eso /evo /880 /890 /900 /9/0 /9 20 ?
1,850
2^331 1,061
807
889
816
1,647
3663
1 i 1 441 pfe^^^^ä^^ ^ ^ 430 ^^^^^ ̂
1 1
sJi
338 ̂ ^^^^ W '
ir
188
147
118
93
82 m
3
FiG. 89.—Por the United States as a whole the average valuation of farm real estate increased from $11 an acre in 1850 to $20 an acre in 1900, but in the next 20 years it increased to $69. During these two decades the increase in the valuation of land was closely related to the upward move- ment of general prices, which characterized the period and which was greatly accelerated in the last few years by the inflation that developed during the World War. Since 1920 land valuations have declined in most parts of the United States.

FIG. 40.—The percentage of increase in the census valuation of farm, real estate per acre between 1900 and 1910 was large in the Great Plains region and in many of the irrigated areas of the West. In the East the greatest percentage increases in valuation were in the South Atlantic and Gulf coastal plain, but the greatest absolute increases in valuation were in the Corn Belt. Only 16 counties out of nearly 3,000 in the United States showed a decrease in valuation. The increase in the New England and Middle Atlantic States, however, was small as well as in many counties of the Lake States and of Kentucky, Tennessee, and eastern Texas. The average increase in valuation for the United States as a whole was 100 per cent. The percentage of increase exceeded that in the wholesale price of all commodities (Bureau of Labor statistics), and consequently it represented an increase in the purchasing power of farm real estate. For corresponding map showing changes from 1910 to 1920, see page 119 (fig. 16 in The Wheat Situation).
?
I
ü1
CO

544 Yearbook of the Dejmrtment of Agriculture^ 1923,
1920 is equivalent to an interest rate of 8.64 per cent compounded annually.
Part of the increment in valuation was due to improvements made by the owners, such as buildings, clearing and drainage of land, and contributions indirectly through taxation toward the building of roads and other community improvements. Even allowing for all this, the increment was large in many parts of the country.
With the exception of a few scattered grazing areas of the West, increases in the valuation per acre of farm real estate occurred in practically all parts of the United States from 1910 to 1920. In the greater part of the general farming region of the North and Northeast the increase w^as less than the increase in the general price level of commodities during the same period, excejDt in a region centering in the corner where the boundaries of Iowa, Minnesota, and South Dakota meet. In portions of the South, particularly where the boll weevil infestation was either not serious or became serious late in the period, there were percentages of increase greater than those for commodity prices. The decreases in the West are notable and are tO' be explained in part, at least, by the expansion of the farm area to include large amounts of low-priced semiarid lands. For the United States as a whole the valuation of farm land, as measured by the purchasing power of money, was less in 1920 than in 1910.
This rapid increase in the valuation of* farm real estate per acre, based largely on anticipation of increasing income from the real estate, has disturbed to a marked extent the relationship between the present income from real estate and its valuation in some parts of the United States. When a man buys a farm, whether for purposes of renting it to others or of operating it himself, it is because he ex- pects it to yield him income. The price he is willing to pay depends on the expected income and on the percentage of return which he in willing to take on an investment of this character. If the income does not remain constant but is expected to increase for some time, many buyers will undoubtedly take this expected increment into account and will be willing to pay more accordingly. As a result, present income frequently will be a smaller percentage of the average valuation of farm real estate than the percentages of return ordi- narily obtained from alternative investments having reasonable security.
Eecent studies have shown that this condition developed in some of the most important farming sections of the United States, as indicated by the IOAV ratios of cash rent to real estate valuations '^^ (%41).
10 Por the purpose of measuring^ the relationship between income from farm real estate and its valuation cash rent proves mo-re serviceable. than share rent, because? the former represents more nearly payment for the use of the farm real estate as distinguished from some of the other elements which enter into share rent, such as payment for a larger amount of risk assumed by the landlord, for supervision contributed by Mm, and fre- (Hicntly a participation- in some of the expenses of production. It is true, cash rent is not exactly identical with the net income received from ihe real estate by the landlord, for taxes are yet to be deducted and certain minor expenses, including repairs and depre- ciation oi buildings. However, it is tlie best statistical measure available.

RATIO OF CASH RENT TO FARM REAL ESTATE VALUE ELECTED CASH TENANT FARMS OF TEN ACRES AND OVER
JAN.1,1920
PER CENT n LESS THAN 2,5 v-m 2.5 TO as
3.5 TO 4.& mn 4.5 TO 5.5
5.5 TO 6.5 ■n 6.5 TO 8.5 RB 8.5 TO 10.5 n 10.5 AND OVER
CENSUS OF ¡92O
FIG. 41.—In many counties in the Corn Belt cash rents averaged about 3 per cent of the valuation of farm real estate on January 1, 1920. In most of the remainder of that region, as well as in parts of the winter wheat and spring wheat regions, it was under 4.5 per cent. The return was 6 to 8 per cent in much of New England, eastern New York, and the South. It reached the highest ratio, 10 per cent and over, in the Yazoo Delta and adjacent bottom lands of Arkansas. On the Pacific coast cash rents returned in general from 3 to 6 per cent. Out of these cash rents taxes and repairs had to be paid. The map is based on a special study made by the Bureau of Agricultural Economics, Division of Land Economics, based on the census schedules oif tenant farms of 10 acres or more rented for cash in the counties shown.

546 Yearbook of the Defartment of Agriculture^ 1923.
When allowance is made for taxes and costs of repairs and depre- ciation the ratios of net cash rent to the valuations of farm real estate are found to be considerably lower than the corresponding ratios for gross cash rents. Special studies to determine the net ratios, made by areas as numbered in Figure 41, gave the results shown in Table 3.
TABLE 3.—Ratios of net cash rent to farm real estate valuations for selected cash-rented farms in groups of counties as shown in Figure Jß.
Area number. Ratio. Area number. Ratio. Area number. Ratio.
7 Per cent.
3.4 2.8 2.4
14. 25. 26.
Per cent. 2.2 2.6 4.7
37. 42. 46-
Per cent. 6.5
9 3.8 10 5.9
In so far as net cash rent may be regarded as measuring the net earning power of the real estate for the farmer of average mana- gerial ability, it will be apparent that buying farm real estate by borrowing money at regular interest rates with the purpose of pay- ing for the real estate out of the earnings must be difficult for the tenant farmer of average resources and ability in regions where net returns from the real estate average only 3 to 4 per cent. It is true, if the expected increments in incomes materialize, they will tend
AVERAGE CASH RENT PER ACRE; SELECTED AREAS IN NORTH CENTRAL STATES, 1905-1920.
DOLLARS PER ACRE
undoubtedly cash rents have declined in the Past three yeais Although rents advanced continuously and in several areas doubled in the 16 year^ shown, land valuations increased even more rapidly. The graph is based on reports from landlords in the States named to the Bureau of Agricultural Economics, Division of Land Economics.

Farm Ownership and Tenancy. 547
1
^ 5^' 1.
Cosh ren Ratio ot 1 1 !
ts to 1900 Land Va/ue ^ x^
\ y^ ^
*^ ..^ —
s*^
•*> .«i %^
» — . ■Ml •^* .— [---j— • ••« ■*,
■ WTi m^'
,, .^^^ 1 1 1 /^at/o of 1 1 U " Cosh rents to Current Land \/aluày
RATIO OF CASH RENT TO FARM REAL ESTATE VALUATION, OHIO, 1900-1920.
PER CENT
18
16
14
12
10
8
6
4
1900'01 '02 '03 '04 '05 '06 '07 '08 '09 '10 'II '12 M3 '14 '15 '16 '17 '18 '19 1920
FIG. 43.—A ratio high to begin with and markedly advancing is shown for gross cash rents in relation to the valuation of real estate that prevailed in 1900. A ratio high to begin with but persistently declining is shown when these rents are measured against very rapidly rising real estate valuations. Persons buying farm real estate early enough in the present century to get the advantage of both rising rents and rising valuations were in a much more favorable position than those buying after the valuations had not only reached high absolute figures but figures especially high in relation to the rents.
to ease the situation for the purchaser, but it is obviously a very uncertain foundation on which to build a business if the farmer must depend in large part on borrowed money (figs. 42 and 43). Many a tenant, of course, was bold enough to take the plunge, and after surviving the difficulties of the earlier years, was carried upward by the tide of increments in incomes and valuations to a secure finan- cial position. But many others, especially those of poor credit rat- ings or conservative dispositions, were undoubtedly deterred from embarking on a venture involving so large an element of speculation. In fact, local studies have revealed many cases of tenants with suffi- cient capital to buy land who rented land from preference. Still other tenants ventured too late, and were wiped out in the decline of prices which began in 1920.
An increase in the valuation of farm real estate may also tend to increase tenancy by hastening the process of retirement of land- owning farmers, enabling them to retire earlier than would have been possible if the increase had not occurred. The rising valuation of farm real estate has probably also tended to encourage the hold- ing of this form of property by those who came into possession by inheritance, marriage, or foreclosure, and who are not in a position to operate it.
In short, for a number of reasons it is probable that the increase in realty valuations and the passing of large areas out of the stage of pioneer development, which have been especially notable during the last three decades, have been conditions favorable to the increase of tenancy.
The Tenure Ladder.
It has been found convenient to regard working as a wage-earner, as a tenant, and as an owner farmer as successive rungs on a ladder

548 Yearbook of the Department of Agriculture. 1923,
oi individual progress in agriculture. The comparison is useful in some regards, for it suggests a movement from stage to stage which constitutes an important fact in the economic life of the farming classes.
We may recognize at least the following important steps, arranged in the usual order of progress: (1) farm wage laborers; (2) crop- pers, especially in the South; (3) tenants other than croppers; (4) part owners, mortgaged; (5) part owners, free of mortgage; (6) owner farmers, mortgaged; (7) owner farmers, free of mortgage.
In applying the analogy of a ladder to such an artificial scheme, there must be a number of reservations. In the first place, the various successive stages may not always represent progress. It is probable that • the various stages do represent some progress in independence of control, although not always, for an owner under heavy mortgage may be less independent than a tenant who is out of debt. Moreover, progress in independence does not always mean progress in well-being. Many a tenant who is subject to the super- vision of a capable and honest landlord may be better off than a farm owner who has not sufficient experience or capital to operate his farm efficiently.
Wealth of Persons in the Tenure Stages.
Those who employ the ladder analogy frequently have in mind that each succeeding step indicates higher financial standing, or net worth. It is obvious, however, that a mortgaged owner farmer may have a smaller equity in the farm capital than a tenant or part owner free of mortgage. Moreover, a tenant in some parts of the United States possesses more property on the average than an owner in other parts. For instance, in Iowa the average valuation per farm of machinery and livestock (usually owned by the tenant) was $4,212 in 1920, which is more than the average value of land, buildings, implements, and livestock for farms operated by their owners in certain other States (fig. 44).
However, in a given area the average net worth of the individual is likely to approximate the order of stages in the tenure ladder. An estimate of the per capita net worth of persons actively engaged in farming in the United States, as of January 1, 1920, showed the following division of wealth between four of the classes mentioned above ^-: Croppers, $354; tenants (other than croppers), $4,315 ; part owners, 12,829 ; owner farmers, $13,476.
AGE OF PERSONS IN THE TENURE STAGES.
Each of the different stages of the agricultural ladder has its peculiar age distribution. Owner farmers, for instance, show an age grouping more advanced than that of tenants (fig. 45). The relation of the several stages to age is shown in Table 4.
^^ Gray, L. C. " Accumulation of Wealth by Farmers," Proceedings of American Eco- nomic Association, March, 1928. The estimate, thoujih made with care, is considered a rough one because of numerous gaps In available statistics.

Farm Ownership and Tenancy. 549
AVERAGE VALUATION PER FARM OF LAND AND BUILDINGS AND OF MACHINERY AND LIVESTOCK; UNITED STATES AND SELECTED STATES, CENSUS OF 1920.
UNITED I'°''5^ STATES " "" 9,690
NEW YORK- 6,371
8.972
OHIO-
LAND AND BUILDINGS
$l0,0OO $ 2 O.OOO
MACHINERY
V^N'^^ LIVE'^STOCK $30.ooo ^■»O.OOODQLLARSQ $iopoo
I OWNERS
I TENANTS
8.834|
JLLINOIS-
lOWA-
J 20,304
NORTH DAKOTA-
KANSAS
IDAHO
CALIFORNIA
TEXAS
GEORGIA
Í 4,222 NORTH CAROLINA
[ 3,523
1,974
1,3 83
y 2,341
2,869
l,54Z ||
1,962
2,630
2,997
4,373
4,212 m
3,568
3,121
3,032
2,519
3,150
2,627
2,583
3.434
2,247 ■
1,018 3
1,069 I
495 ¡
762 I
473 I
PiQ. 44.—The average investment in machinery and livestock per farm re- quired to become a tenant in Iowa is larger than the valuation of the entire farm in much of the South and in parts of New England and the upper Lakes region (fig. 38). The valuation of machinery and livestock per farm, much of which is usually supplied by the tenant, ranged from $2,000 to $4,000 in 1920 in the Northern and Western States and from $500 to $1,000 in the Southern States. The valuation of the land and buildings owned by the landlord is five to ten times as large. In the North and West the tenant farms usually have higher average valuations than those farmed by their owners, but in the South, where many of the so-called tenant farms are merely cropper holdings, the reverse is true.

550 Yearhook of the Depo.rtment of Agrienlturf, 192S,
TABLE 4.—Percentage of farmers in each age group, hy tenure, united ^tate-'^, J920. (Figures in heavy type represent the age group in each tenure clas^^ which show s the highest percentage)}
Age group.
Share Cash and and
share- unspeci- cash fied ten-
tenants. ants.
Part owners.
Under 25 years 25 to 34 years.. 35 to 44 years.. 45 to 54 years.. 55 to 64 years.. 05 and over
63.4 12.4 5.0 42.7 13.8 8.9 28.7 11. 1 10.5 21.1 9.0 9.8 14.2 (3.5 Í. 1
JO. 8 ••). i 4.7
Full owners mort- gaged.
Full owners
not mort- gaged.
7.6 17.1 •22.0 21.6 19.7 14. 1
10.2 16.2 26.6 37.6 51.2 «4.1
Total (exclud- ing man-
agers) .
98.6 98. 7 98.9 99.1 99.3 99. 4
1 Based on census statistics.
Table 4 tends to exaggerate somewhat the impression of move- ment from group to group. For instance, the steady increase in the percentage of each age group found in the chiss of full owners not mortgaged is by no means due entirely to the rise of farmers from preceding tenure stages. It is undoubtedly due in considerable part to the fact that heirs who have been working on their fathers' farms without wages or as hired laborers have become full owners free from mortgage directly, without passing through the other stages. These accessions to the numbers in this class from outside classes tend to reduce the percentages of the farmers in corresponding age groups in the other tenure classes even if the actual numbers in each group were not diminished. However, in spite of these limitations the table does indicate strongly {a) that the attainment of farm ownership is connected with relatively advanced age, and (5) that from age group to age group there is a movement which follows somewhat the order of stages from left to right in the table, although particular individuals need not necessarily pass through all the tenure stages consecutively.
It is interesting to note that in the case of colored farm tenants the percentage in each age group does not diminish from the 25-35 age group onward, as with white tenants, but reaches a maximum in the 35-45 age group, and that each older age group is relatively larger than with white tenants (fig. 46).
KKT.ATION OF THE TKNIHE .STACKS TO AVAILABT.E CAPITAL.
The preceding indication of a connection between progress in wealth and progress up the tenure ladder, on the one hand, and advancing age, on the other hand, suggests two tentative interpre- tations: (1) The several stages represent economic adjustment to the farmer's equipment in wealth and experience; and (2) since ex- perience can be acquired in a comparatively short period, movement up the tenure ladder is largely dependent on progress in wealth. Each of these two interpretations requires further consideration.
Obviously, farm workers who have no capital must usually remain either as laborers or as croppers until a sufficient amount has been accumulated or otherwise acquired to enable them to purchase the livestock, implements, and other materials necessary to become ten- ants. As already noted, the average requirement may vary from a
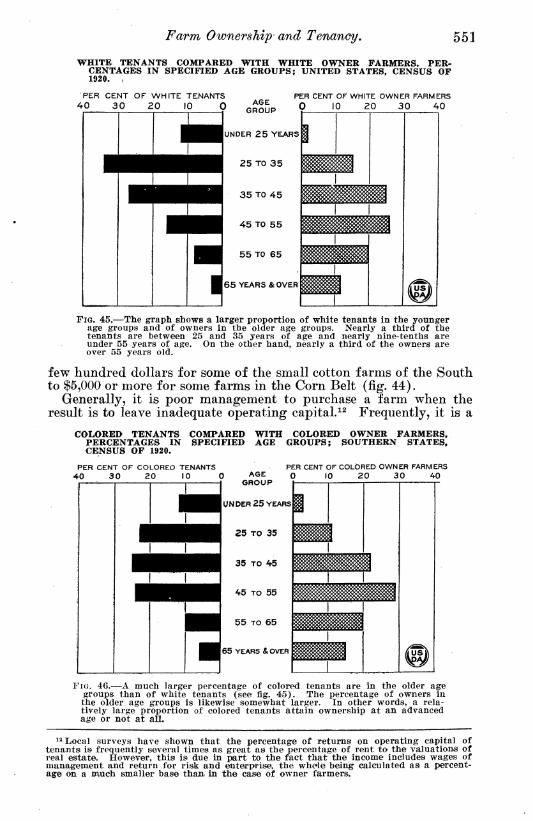
Farm Ownership and. Tenancy, 551
WHITE TENANTS COMPARED WITH WHITE OWNER FARMERS, PER- CENTAGES IN SPECIFIED AGE GROUPS; UNITED STATES, CENSUS OF 1920. ,
PER CENT OF WHITE TENANTS 40 30 20 10 0 AGE
I CENT OF WHITE OWNER FARMERS 10 20 30 40
UNDER 25 YEARS
25 TO 35
35 TO 45
45 TO 55
55 TO 65
65 YEARS & OVER
FIG. 45.—The graph shows a larger proportion of white tenants in the younger age groups and of owners in the older age groups. Nearly a third of the tenants are between 25 and 35 years of age and nearly nine-tenths are under 55 years of age. On the other hand, nearly a third of the owners are over 55 years old.
few hundred dollars for some of the small cotton farms of the South to $5,000 or more for some farms in the Corn Belt (fig. 44).
Generally, it is poor management to purchase a farm when the result is to leave inadequate operating capital.^^ Frequently, it is a
COLORED TENANTS COMPARED WITH COLORED OWNER FARMERS, PERCENTAGES IN SPECIFIED AGE GROUPS; SOUTHERN STATES, CENSUS OF 1920.
PER CENT OF COLORED TENANTS 40 3 0 20 10 0
PER CENT OF COLORED OWNER FARMERS 0 10 20 30 40
FIG. 46.—A much larger percentage of colored tenants are in the older age groups than of white tenants (see fig. 45). The percentage of owners in the older age groups is likewise somewhat larger. In other words, a rela- tively large proportion of colored tenants attain ownership at an advanced age or not at all.
12 Local surveys have shown that the percentage of returns on operating capital of tenants is frequently several times as great as the percentage of rent to the valuations of real estate. However, this is due in part to the fact that the income includes wages of management and return for risk and enterprise, the whcle being calculated as a percent- age on a much sm;aller base than, in the case of owner farmers.

552 Yearhook of the Department of Agriculture^ 1923,
mistake for a farmer to buy a farm when he must assume a heavy hurden of indebtedness, farming is a business involving many risks, and a mortgage may prove a millstone around the farmer's neck. Furthermore, the farmer has less freedom of movement if he has bought a farm than if he is a tenant.
TENANT FARMERS CLASSIFIED BY PREVIOUS FARMING EXPERIENCE AS REPORTED IN THE CENSUS OF 1920.
10 PER CENT OF FARM TENANTS
20 30 AO 50 60 70 80
UNITED STATES
NEW ENGLAND
NEW YORK
OHIO
ILLINOIS
IOWA
N.DAKOTA
KANSAS
IDAHO
CALIFORNIA
TEXAS
GEORGIA
N.CAROLINA
I OWNER I FARMERS
100
NEITHER WAGE HANDS NOR OWNER FARMERS
Fio. 47.—Nearly half of the tenant farmers (including croppers) in the United States have never had experience either as farm-wai^e laborers or as furm owners, althouj'h they may have worked without waj^es on their par(>nts' farms. The class who become tenants directly without previous farm ex- perience is especially larj^e in the South because of the larj»e number of farmers who are croppers or who i-ent land involving but small contribu- tions of capital.

Farm Ownership and Tenancy. 553
FIG. 48.—Forty-six per cent of the farmers who became tenants from 1915 to 1920 had previously been farm-waire hands. The percentage was much lower in the South thafn in the North and West, largely because of the small amounts of capital required in many parts of the "^South to become tenants or croppers, making it comparatively easy in that section to become a tenant without previously working as a hired laborer.
It may also be a mistake to purchase a farm when, because of limited capital, the farmer buys a farm too small for economical operation. If, however, there is rentable land adjacent, part owner- ship may be an alternative, and therefore, a definite stage in the progress of the farmer toward full ownership of an adequate farm.
EXTENT OF MOVEMENT FROM STAGE TO STAGE OF THE TENURE LADDER.
According to the 1920 census, 47 per cent of the tenant farmers in the United States had had no farm experience as wage hands or
^^5^ AVERAGE AGE AT WHICH FARM LABORERS ^^^^^5„^ BECAME FARM TENANTS j^^^^^^^^^^^^^^^^l9l5 -1920
AGE [.■::;::|26TO29
[íí%^29T032
^1 327035
^35TO38
^^^^^m 1^ \ ' "i^Œ^^ j^^^^^^^^^ ̂ ^^^^^ ̂ \ ^^^^^^^^m ̂ ^^^^™ ^ / ^^W ,-^^^P ^^H ̂ ^K f \ ̂ ^^^B ^m ^B ■ \ ^^^^^H H 1 ^ -
í¿¿ím¿¿¿:^^^
^
UNITED STATES AVERAGE 28.6 YEARS \¿\ fus^
FIG. 49.—The average age at which farmers who were tenants in January, 1920, and who had been farm-wage earners during the preceding five years, became tenant farmers shows a range of about 1Ö years in the State aver- ages. The averages for the States in the East and in the West are higher than for the States more centrally located. The inclusion of croppers as tenants in the South and the small amount of capital required to become a tenant apparently account in some considerable measure for the low figures in those States.

554 Yearhooh of the Department of Agriculture. 1923,
owner farmers (fig. 47). The proportion varied from ¿5 to 55 per cent in the different States. Another large proportion of tenant farmers, varying from 40 to 70 per cent in the several States, had previously worked on farms for wages (fig. 48). The average age of becoming tenants for those farmers who made the transition from the status of farm laborer to that of tenant belt ween 1915 and 1920 was about 29 years for the country as a whole, but varied widely be- tween the various sections (fig. 49). A small part of this group, ranging from 2 to 20 per cent of the total number of farmers, had been both wage hands and ow^ner farmers before becoming tenants : while a similar proportion reported that they had had previous farm experience only as owner farmers.
In the United States as a whole 11 per cent of the farm tenants had once been owner farmers. For various States the proportion ranges from as low as one-twentieth to as high as one-third of all tenants.
YiG, 50.—Although some of this group af tenants are persons who have been compelled through inefficiency or misfortune to revert to the tenant class, the heavv concentration in the West suggests that some are men who have sold their farms elsewhere and on migrating have become tenants for a season until they are better acquainted with the new conditions. The small proportion in the South reflects the fact that tenancy is a less important stage in the progress of farmers to farm ownership than in the North and West.
This class of tenants includes, of course, a considerable number of persons who have attempted to rise into the class of owners, but who on account of inefficiency or misfortune have been forced to revert again to the tenant class. However, a. study of the geographic dis- tribution of this class indicates at once that other important factors are involved (fig. 50).
In i\\ç^ United St.ates as a whole, 42 per cent of the owner farmers reported no previous farm experience as wage hands or tenants (fig. 51). Probably the great majority of these were sons or sons-in- law of farm owners and most of them had worked on their parents' farms without w^ages ^^, The percentage is high in New England, wehere tenancy is an unimportant step in the tenure ladder, and is also
^3 Census officials have expressed the opinion that a considerable number of farmers failed to report previous farm experience as laborei*s or as tenants,, and this failure tends to exaggerate unduly the proportion who became ownei-s without previous farming experi- ence. The results of a number of local surveys appear to confirm this conclusion.

Farm Ownership and Tenancy, 000
high in the South, where few owner farmers have worked as wage hands, owing, doubtless, in large part to the plantation system.
In the United States as a whole, only 14 per cent of the owner farmers reported farm experience as wage hands only. In the South-
OWNER FARMERS CLASSIFIED BY PREVIOUS FARMING EXPERIENCE AS REPORTED IN THE CENSUS OF 1920.
PER CENT OF OWNER FARMERS 30 40 50 60 70 80 100
UNITED STATES
NEW ENGLAND
NEW YORK
OHIO
IOWA
N.DAKOTA-
KANSAS-
IDAHO
CALIFORNIA
TEXAS
GEORGIA
N.CAROLINA
g PREVIOUSLY 3TENANTS
■=yypi NEITHER WAGE HANDS JNOR TENANTS
FIG. 51.—A large proportion of owner farmers became owners direct without having worked previously as farm-wage laborers or as tenants. Probably the maiority of this group had w^orked without wages on parents tarms. Only a fifth' of the farmers in the United States passed through both stages. The proportion is somewhat higher in some of the North Central States and lower in the New England States and the South. In New England many have stepped directly from wage hand to ownership, but in the South very
SoSlS*"—YBK 192.S 36

556 Yearbook of the Department of Agriculture, 1923,
em States the* percentage belonging* to- this group falls as low as 5 or 6; on the other hand, it is well above the naitional average in New England, the Middle Atlantic States, and most of the States in the western half of the country.
About a fouifth of the owner farmers in the United States reported farm experience as tenants only, and a fifth reported farm experience both as tenants and as laborers, making about 45 per cent altogether who had passed through the tenant stage. Outside the South, the
FIG. 52.—The percentage of owner farmers who had once been farm tenants is lowest in New England, only 15 per cent, and reaches a maximum, about 75 per cent, in the tier of States from South Dakota to Texas, inclusive, and in Iowa and Arkansas. In practically all the other States of the Middle West, as well as in the South, half or more of the owner farmers had once been tenants. Probably migration of tenant farmers to regions where farms were to be obtained at comparatively low prices has been a factor in causing high percentages in the tier of States from the Dakotas to Texas.
States of high average farm real estate valuations were those in which a large percentage of owner operators reported previous tenant farm experience (fig. 52).
RATE OF MOVEMENT ON THE TENURE LADDER.
It is probable that the group of owner farmers who have previ- ously been both farm wage laborers and farm tenants will most closely approximate a group of persons who, starting with little or no capital, have succeeded in acquiring the ownership of one or more farms ; for the acquisition of wealth from inheritance, gift, or mar- riage is undoubtedly of less significance in this group than in the groups of farm owners without previous farm experience or with experience as farm tenants only.
The average number of years spent in each stage by persons who became farm owners between 1915 and 1920 is shown for several States in Figure 58. In the United States as a whole, owner farmers who had previously been both farm wage laborers and tenants had spent an average of 5.8 years in the first stage, and 8.9 years in the second, a total of nearly 15 years. The average age at which farmers who had been both farm laborers and tenants became owners is shown by States in Figure 54. The earlier age in the northwestern

Farm Ownership and Tenancy, 557
portion of the country is doubtless due in part to the migration of young farmers into this region (fig. 55).
The mere increase in the percentage of farmers who are tenants does not in itself demonstrate that the rate of progress to farm ownership has become lower or attended with greater difficulty. It might be due to a number of other causes which have little relation to the economic difficulty involved in acquiring the ownership of a farm. Thus, it has been noted that a large percentage of tenants in the United States are persons who make no effort to climb to farm ownership, and that their number has increased through the process of converting farm laborers into croppers. Again, it has been noted that tenancy is closely related to the process of retirement or retreat jDf owner farmers from the land, a trend which might increase the percentage of tenancy without implying necessarily that the acquisition of farm ownership had increased in difficulty. Furthermore, the last three decades have witnessed the settlement of large areas of new farm land. On the one hand, this process may tend to reduce the percentage of tenancy in the Nation as a wliole, but it has been noted that after the pioneer period of operation by owners there is almost certain to be a trend toward an increase of tenancy in a newly developed region.
Indeed, even if it could be shown that the farmers who start w^itli little or no capital and achieve unmortgaged ownership require
TIME SPENT IN VARIOUS STAGES BY FARMERS WHO, HAVING HAD FARM EXPERIENCE BOTH AS TENANTS AND AS WAGE EARNERS, BECAME OWNER FARMERS BETWEEN 1915 AND 1920, CENSUS OF 1920.
UNITED STATES
aCHILDHOOD AND YLARS JNOT EARNING OR FARMING
FARM WAGE- EARNER
I TENANT I FARMER □ OWNER
FARMER
FIG. 53.—The average age of attaining ownership is shown to be 38 years, preceded by an average farm experience of about 15 vears as wage laborer and tenant, but varying in different States. It should be noted that the years spent in childhood or nonagricultural work included in most cases work on parents' farms Without wages.

558 Yearbook of the Department of Agriculture^ 1923.
FIG. 54.—The map shows no wide range of difference in the averages for the several States, the lowest being 32 years for Utah and the highest 43 for Rhode Island. The average age of acquisition ¿ends to be lowest in the group of States in the northwestern third of the United States. That this is partly due to the influence of migration of joung farmers toward the Northwest is indicated by Figure 55.
a longer period than formerly, one might still be in doubt as to the significance of this fact, because of changes in the amount of wealth represented by the average farm. If an average of 15 years were required to rise to full ownership when the average price of a farm is $10,000, and an average of 20 years were similarly required when the average price has increased to $20,000, the change would not necessarily imply retrogression in the opportunity for individual financial progress in the farming industry.
Attempts have been made to determine whether the rate of progress up the tenure ladder is changing by comparing the age grouping of ow^ner farmers or of tenants in different census years. This is ilkistrated by Figure 56. Apparently the decrease from 1890
FIG. 55.—The influence of migration from the old-established regions of the Northeast to the newer regions of the Northwest is suggested in this map. In the South the practice of classing croppers as tenants and the small amount of capital required to become a tenant in many parts of the region are responsible for the large proportion of farmers under 35 years of age.

Farm Oicnership and Tenancy, 559
to 1920 for the first three age groups, and particularly for the youngest group, was relatively much greater than for the two oldest age groups. However, this might be due to a large relative increase in the number of tenants in the younger age groups through the
PERCENTAGE OF OWNER FARMERS IN SPECIFIED AGE GROUPS; UNITED STATES, CENSUS 1890-1920.
PER AGE OF CENT 0
FARMERS
UNDER 2 5
25TC3A
55T044
45T0 5A
55 A OVER
12.-5
70,7
723
efc.9
62 2
81.4
80.6
60.2
I r
PERCENTAGE WHO WERE FARM OWNERS
20 30 4-0 50 60 70 80
Ú
I .■ I
1 1 1 1 1 1 1 1,
/fu^
1 1 1 ' ! 1 1 1 1 1
w//////////////////y////^^^^^^^
^^à^^^^^^^M^^^^^^^^^Mi
III 1 FIG. 50.—Apparently for every age group the percentage of owner farmers was
less In 1920 than in nnv preceding decade. However, when it is recalled that tlie percentage of owner farmers (including part owners and those opernting through managers) declined from 71.6 in 1890 to 61.9 in 1920, it is clear that the tendency indicated was due largely to the fact tnat tue declining percentage of ownership is distributed throughout every age group in successive decades. It should be noted that in the first two census enumerations the percentages are for farm homes, while for the last two decades they are for farms.

560 Yearbook of the Dejyartment of Agriculture^ 192S,
process of converting laborers into tenants, especially in the South. Again, it might reflect a retardation in the rate of retirement of the owner farmers in the older age groups.
Other attempts have been made to show the changes at different periods in the average length of time required to attain ownership,
ILLUSTRATION OF EFFECTS OF DOUBLE CLASSIFICATION OF FARM- EXPERIENCE STATISTICS WITHOUT ALLOWANCE FOR REMOVAL BY DEATH, CHANGE TO OTHER INDUSTRIES, OR RETIREMENT. BASED ON SURVEY REPORTS FOR 269 OWNER FARMERS IN KENTUCKY, TENNESSEE, AND TEXAS, 1919.
AVERAGE. YEARS
REQUIRED TO ATTAIN
OWNERSHIP
15
10
CLASSIFIED BY DECADES IN WHICH
THEY BECAME OWNERS
(Apparently increasing) ^^B
c
6.8 12.1 14.9 17.2 BEFORE 1890 1900 1910
1890 1900 1910 1920
CLASSIFIED BY DECADES IN WHICH THEY BEGAN THEIR EARNING .LIFE
si
p
^^H (Apparently decreasing)
Il ■ ® III ■ 19.0 13.7 9.6 A.6
BEFORE 1890 1900 1910 1890 1900 1910 1920
FIG. 57.—The graph shows that because of ignoring the influence of mortality, change to other occupations, and retirement, exactly opposite conclusions are obtained according as one groups the farmers in the order of the decades when ownership was acquired or in the order of the decades when they began the upward climb to ownership. The first system of grouping makes it appear that the period of acquiring ownership has increased nearly three- fold. This is due largely to the fact that of those who became owner farmers several decades ago all who required a long time to acquire owner- ship have died or retired, while those who have recently acquired ownership include a much larger proportion of the slow climbers. On the other hand, when the farmers are grouped in the order of the dates of beginning their earning life, it is made to appear that the average period needed to acquire ownership has steadily decreased. This is due to the fact that in the case of those who began the climb to ownership at an early date the slow, as well as the fast, climbers have had time to achieve ownership, while in the case of those who have recently begun their climb to ownership only the rapid climbers are included in the group, for only these have had time to achieve ownership. Only owner farmers who had received no gratuitous assistance by inheritance, gift, or marriage are included in the graph.
by classifying the owner farmers who have formerly been farm wage laborers and tenants in accordance with the length of time they have been owners and by determining the length of time spent in the preownership stages (fig. 57). However, unless allowance be made for mortality, and change to other industries or retirement, the
'method is inconclusive. Figure 58 illustrates a: possible method of allowing for the in-
fluence of mortality. However, the method employed and any other method which involves allowance for mortality only is necessarily defective because it makes no allowance for retirement or change to other occupations. Theoretically, retirement tends to warp the figures in the same direction as does mortality, namely, by eliminating

F cum OinnevHhip and Tenancy, 561
the slow climbers, leaving a larger proportion of fast climbers among tlie siirvivors.^^
SOMi] FACTOKS THAT ]XFT.rE?sCE THE RATE OF PROGEESS IN CLIMBING TO FARM OWNERSHIP.
Studies in methods of acquiring farm ownership have usually accounted only for the direct acquisition of farms by purchase, in- heritance, gift, or marriage. The results of a number of such studies are summarized in Table 5. The surveys show a good deal of varia- tion in results. The most extensive survey was that of 24,000 land- lords in 24 States. This showed that 79 per cent of the acquired acre- age owned Avas by purchase, 15.3 per cent by inheritance, 3.3 per cent by marriage, and 2.4 per cent in other ways, principally by iiomesteading. In all the surveys, except the middle western, the per- centages of acquisition by inheritance range from 9 to 15.3, but in tliis survey both inheritance and marriage are relatively more impor- tant. Omitting the cases of acquisition by homestead, which were of ^considerable importance in Nebraska, the farms acquired by owners through inheritance, gift, or marriage range from about 12 to 19
AVERAGE YEARS OF FARM EXPERIENCE AS WAGE EARNERS AND TENANTS REPORTED IN 1920 BY OWNER FARMERS IN KENTUCKY, TENNESSEE, AND TEXAS, CLASSIFIED BY NUMBER OF YEARS THEY HAD BEEN OWNER FARMERS BEFORE 1920, WITH CORRECTION FOR REMOVAL BY DEATH AND REPLACEMENT BY YOUNGER FARMERS.
YEARS
1^
12
\0
8
6
2
.>^í¿!¿!¿^ c p ^ f 1- WA ÇOF -^^^m\ ^ /Mm ^m 1 ^1
— w> /^^m ^1 El E p R E c ^M
IIH E . O T D -1- \ HI — |ms^
15 10 I ^5 AO 35 30 25 20 AND TO TO TO TO TO
OVER 45 40 35 30 25 20 15 10 5 OWNER FARMERS CLASSIFIED BY YEARS THEY HAVE BEEN OWNER FARMERS
FIG. 58.—The black portion oif the column is based on census statistics of the amount of preownership farm experience of owner farmers who before attaining- tliis stage had been both farm-wage earners and farm tenants. Those who had become owner farmers in recent years reported longer terms of preownership farm experience than those who had become owner farmers several decades before. From this fact it might seem that there had been an extension of the apprentice period ordinarily required of those becoming owner farmers. Such a conclusion can not be drawn with confidence from reports given in at any single date, however, because the reports come only from survivors whose experience is less typical of their fellows of past decades the more remote the point of time for which it is sought to make a statistical showing. Allowance must be made for removals and replace- ments associated with retirements from the occupation, migrations from areas surveyed, and deaths. The probable effect is shown here only for the mortality factor. To allow for this, differences between slow, rapid, and fast climbers, and the proportion of owner farmers in each group were ascertained for at least one survey area in each of the three States and standard mortality statistics applied to the several groups.
'^* This difficulty also applies to the otherwise interesting calculations in the Census •nograph entitled " Farm Tenancy in the United States," 1924.

562 Yearbook of the Department of Agriculture^ 1923,
per cent, except for the five North Central States (No. VII), where 33.2 per cent of the farms were reported as acquired by inheritance or marriage. In general, from two-thirds to five-sixths of the farms are shown to have been purchased.
TABLE 5.—Method of acquisition of farm land as reported in various local surveys.
Bases of computa- tion.
Per cent acquired by-
Survey or source. Pur-
chase. Inheri- tance. Gift. Mar-
riage.
Other ways, prin-
cipally home- stead- ing.
I. Wisconsin 1- .- 2,051 farms-.. 8,122,828 acres
71,495 acres 17,999 acres 710 land transfers.
60 farms _ .
80.6 79.0
8L2 96.8 73.2
6^:- 9 82.6
88.2 91.6 64.5
9.0 15.3
12.3 2.7
22.8
12.3 11.4
5.7 7.7
24.8
3.5
0.6 0 2.5
0 3.4
0 0 0
1.4 3.3
5.9 0.5 1.4
3.5 0.8
6.1 0.7 8.4
5.5 II. 24 States, 23,963 landlords 2 _ 2.4
III. Kentucky and Tennessee: * 1. Owners, 845 transactions 2. Tenants, 123 transactions
IV. Massachusetts^
0 0 0
V. Nebraska: « 1. Owned by tenant farmers 2. Rented farms owned by owner
farmers. VI. Texas: 7
1. 109 owners - - _ -
19.3 384 farms 1.8
18,544 acres 2,867 acres
0 2. 29 tenants 0
VII. Five Nortl' Central States » Reports of 2,112 farmers.
2.1
1 First farm acquired; questionnaires sent to owner farmers. U. S. Bureau of Agricultural Economics, Division Land Economics, and Wisconsin Agricultural Experiment Station cooperating, 1922; data unpub- lished.
2 From questionnaires answered by farm landlords, about three-fourths in the Northern States. Bureau of Agricultural Economics, Division Land Economics, 1920; data unpublished.
3 Included under "Inheritance." 4 Local surveys by Bureau of Agricultural Economics, Division Land Economics, m cooperation with
agricultural experiment stations in respective States, 1919 and 1920; data unpublished. 5 Local surveys by Massachusetts Agricultural College. Results published in Journal of Farm
Economics, Vol. 5, No. 4, October, 1923. . T^ , ^. 6 Local surveys by Bureau of Agricultural Economics, Divisions Land Economics and h arm Population,
and Nebraska Agricultural Experiment Station cooperating, 1923; data unpublished. 7 Local survey by United States Department of Agriculture, 1919. See Department Bulletin 1068,
Farm Ownership and Tenancy in the Black Prairie of Texas. . -^ • r. • 8 Local surveys by United States Department of Agriculture, summarized in American Economic Jieview,
Vol. IX, No. 1, December, 1918.
Since many of the farms reported as acquired by inheritance, gift, or marriage were encumbered with debt, the actual equities acquired by the farmers were considerably less. Averages for 10 local surveys in various parts of the United States ^^ indicate that the actual equities in farm real estate obtained directly by inheritance, gift, or marriage were about 12 per cent of the net worth of owner farmers, and 8 per cent of the net worth of tenants. By far the largest source of gratuitously acquired w^ealth was increase of land valuations, which amounted to 43 per cent for owner farm_^rs and 11 per cent for tenants. Operating owners had " earned " 45 per cent of their net worth and tenants, 76 per cent.
These figures take into account only the proportion of the farms or of the net worth of the farmers represented by the equities in farms owned at the time of the surveys. Such a cross-section does not give a complete history of the farmers' financial progress. In
^5 These surveys are as fellows : One each in Illinois and Indiaiia by the Interchurch World Movement; a survey in Iowa, in Missouri, and in Georj,àa, by the Bureau of Agri- cultural Economics, Division of Farm Population ; surveys in Texas, Nebraska (nine localities), Kentucky, and in Tennessee (two localities) by the Bureau of Agricultural Economics, Division of Land Economics. State universities cooperated m. the Nebraska, Kentucky, and Tennessee surveys.

Farm Ownership and Tenancy, 563
local survey's made in Texas, Tennessee, and Kentucky, figures were obtained concerning every farm that had ever been acquired by the farmers interviewed and concerning all wealth gratuitously acquired by them and the extent to which this wealth had contributed to farm ownership.
Of the 968 acquisitions of farm land, much of which had been resold, only 15.7 per cent of the total acreage was reported as acquired directly by inheritance, gift, or marriage; but of the total valuation of the 968 farms at the time they were acquired, 32.5 per cent was wealth received by inheritance, gift, or marriage. However, many of these farms were obtained l3y means of wealth gratuitously ac- quired, the land having been held for a time and then sold at a large advance in price, and the original amount plus its net increase again invested in land. The original amount of wealth gratuitously ac- quired, plus its net increase when used for purchasing land, amounted to 47.1 per cent of the total acquisition valuation of these 968 f arms.^^ This is approximately three times the percentage of acreage shown to be directly acquired by inheritance, gift, or marriage.
The receipt of wealth gratuitously also enhances the individual's power of accumulation. The studies in Texas, Tennessee, and Ken- tucky show that 64 per cent of the farmers succeeded in acquiring the ownership of their first farms without the assistance of wealth acquired gratuitously. There were 141 farmers who received gra- tuitous assistance and who at the time of beginning as owner farm- ers controlled an average wealth of $8,050. They had obtained an average of $3,847 gratuitously and had borrowed $2,180, leaving $2,023 which is to be accounted for by accumulation. There were
. 255 farmers who climbed to ownership without gratuitous assistance and who at the time of beginning as owner farmers controlled an average wealth of $4,311. These had borrowed an average of $2,049 and had accumulated an average of $2,262. But the first group had been 10 years in the process, while the latter group had required nearly 15 years« Stated in another way, the receipt of the gratuitous wealth increased the rate of accumulation 31 per cent.
The Possibilities of Acquiring Farms Out of the Income from Farming.
By analyzing the incomes of farmers, as indicated by local surveys, some students of the subject have reached the conclusion that climb- ing to farm ownership without the aid of wealth gratuitously ac- quired has become a protracted and difficult process.^^ Table 6 summarizes the results of a large number of local surveys. The surveys cover a period of about eight years, but it is probable that taken as a whole they indicate the nature of the financial problem of acquiring a farm in the United States.^^ The table shows the average amount of initial payment that would be necessary in order that the entire valuation of the farm may be amortized in given periods of time, allowing for interest on indebtedness at the rate prevailing on farm mortgages in the particular regions, and deducting certain amounts for family living expenses.
^^ The importance of these aids to farm ownership would, of course, be different during a time when land valuations were net rapidly rising^.
^" See article by George Stewart, *' Can Farms Pay for Themselves? " Journal of Farm Economics, Vol. Ill, Xo. 8.
^^ 111 so far as the difference in years makes a difference in the valuation of the farms, there is a tendency toward corresponding changes in income.

TABLE 6.—Size of initial payment that would he necessary at time of purchase in order to amortize debt on farm in 10, family uses $300 or $600 annually from farm income for expenses}
or 30 yearSy when
Regions studied.
New Hampshire, Tlillsborough County_ _. New York, Tompkins County New Jersey, Monmouth County Pennsylvania, Chester County Maryland, Frederick County Ohio, Washington County
Do _ Indiana:
Clinton and Tipton Counties Clinton County
Illinois: Case and Menard Counties Kane County
Iowa: Green and Guthrie Counties Tama, Blackhawk, and Grundy Counties...]!
Nebraska, Madison, Platte, Merrick, and Richardson Counties Kentucky, Blue Grass Counties Missouri, Monett Countv Michigan, Lenawee County... ""'" Wisconsin, Green County Minnesota, Rice County Georgia, Sumter County
Do //."...'."... Georgia, Brooks County. South C arolina, Anderson C ounty Florida:
Hillsborough County Polk County
Texas, Ellis County Montana:
Gallatin Valley. __. , Billings area _._
Utah, Provo area.. Arizona, Salt River Valley Oregon, Willamette Valley Washington and Idaho, Palouse area :
Date of survey.
1918 1911 1916 1916 1919
1912-1916 1920
1914 1918
1914 1918
1914 1918 1916 1917 1918 1918 1918 1907 1917 1918 1918 1918
1921 1921 1918
1914 1915 1918 1918 1918 1920
Average capital
per farm.
$8,054 5,5^7 19,165 10,486 27, 885 5,652 11,049
17, 535 25,958
51,091 H7, 896
23,193 63, 926 26, 646 37, 793 9,033
11, 756 31, 036 14, 636 15, 781 27,118 8,992 5,529
7,475 44,813 16,019
27,173 14,904 11, 688 20, 706 22, 699 45, 978
Farm income.
757 1,699 1,313 3,049
443 778
1,187 1,856
3,176 2,766
1,450 4,578 1,717 2,576
822 1,068 1,940 1,170 1,712 3,711
952 404
1,221 5,845 1,457
2,185 1,653 1,312 2,370 1,322 1,766
Mort- gage
interest rate (per
cent).
5.5 5.6 5.8 5.8 6.0 6.1 6.1
6.2 6.2
6.0 6.0
5.9 7.5 7.1 7.1 6.8 6.6 5.8 6.8 8.7 8.7 8.7 8.4
9.0 9.0 9.0
10.0 10.0 9.0 9.4 8.0 8.0
Initial payments required to amortize debt in the following number of years with the indicated annual allowance for expenses.
10 years.
$300
2,115 8,774 2,964 7,652 4,607 7, 546
11,233 14,612
29,918 19, 747
1,562 9,214 8,596
16, 205 6,590 5,196 7,647
15, 842 36,141
$5,951 4,365 11,003 5,193 9,860
9, 745
13,419 15,799
32,126 21,955
16,904 36, 621 18,846 23,988 7,461 8,468 21,077 10, 593 8,555 6,889 6,703 (2)
3,488 11,140 10, 521
18,048 8,433 7,121 9,593 17,855 38,154
20 years.
$300
$1,134 107
2,856 0 0
4,027 5,611
7, 535 8,398
18,100 9,578
9,897 18,957 11, 781 13,902 3,429 3,374
11,924 5,288 2,619
0 2,917 4,535
0 0
5,472
11,120 3,385 2,453 2,270
12, 667 31, 684
$600
$4, 720 3,661 6,253 2,180
0 (2) 9,024
10,919 11,783
21,542 13,019
13, 366 23, 350 14,931 17, 052 6,653 6,650
15, 421 8, 512 5,415
0 5,713 (2)
1,806 0
13,674 5,939 5,354 4,931
15, 613 34, 529
30 years.
$300
$1,092 0 0 0 0
3,716 4, 539
5, 588 4,990
11,493 3, 950
7,192 13,400 9,283 9,884 2,427 1,845 7,999 3,640 946
0 2,038 4,402
0 0
4,208
9,554 2,151 1,348 315
11,190 29,473
$600
3,275 3,712 605
0
8,625
9,627 9,032
15,623 -^;
11,364 18, 277 12,961 13, 562 6,218 5, 716
12, 217 7,432 4,097
0 5,190
1,095 0
7,273
12, 395 4,979 4,413 3, 270 14,567 32, 850
1 This table is reprinted from Farmers' Bulletin 1385, " Buying a Farm in an Undeveloped Region.' 2 These farms yield less than $600 annual income,

Farm Oicnership and Tenancy, 565
In a sense, the deduction of a fixed amount of income for family living places some of the low-valued farms at a disadvantage as com- pared with high-valued farms. This is shown by comparing the Illinois farms averaging $51,091 with the South Carolina farms averaging $5,529. In the first case, $600 is less than one-fifth of the total farm income, while in the second case $600 a year is really more than the average farm can afford, being larger than the average farm income.
In none of the survey areas, except the Pennsylvania area, is it possible, on the average, to employ $600 for living expense and to pay for the farm in 10 years without a much larger initial payment than usually is possible. Farmers in the two Georgia areas could probably pay out in 10 years by initial payments of approximately 50 per cent, if the interest on indebtedness were, say, 6 per cent in- stead of approximately 9 per cent.
In the Illinois areas an initial payment amounting to only a third of the purchase price would be required in order to pay out in 20 years, but even so, the initial payment is very large, amounting to $21,542. On the other hand, in the Nebraska area, an initial pay- ment of more than 50 per cent would be required (partly due to the somewhat higher interest rate), but because of the lower price of the real estate the initial payment would amount to only $14,931. Various other surveys in the northern portions of the Middle West indicate that, on the average, farms could be paid for in 20 years by making initial payments varying from 35 to 60 per cent of the pur- chase price and in amounts varying from $7,000 to $15,000. In some portions of the South and West employment of the lower rates made possible by the land banks of the Federal farm loan system should make a more favorable showing.
It is true that the above figures assume a deduction of only $600 for family expenses, but in practically all of the cases this would be in addition to the living furnished by the farm. Furthermore, the value of labor of members of the farm family other than the oper- ator was deducted as an expense in arriving at farm income. This amount would be available either to increase the allowance for family living or to augment accumulations.
It must be noted also that the figures given in Table 6 are averages. Undoubtedly many farmers, more efficient than the aver- age, were capable of paying for a farm more rapidly than the rate shown in the table. Others below the average in efficiency probably were unable to make more than living expenses.
The figures in Table 6 may arouse either optimism or pessimism according to the point of view. On the one hand, it may be a good showing that in most of the districts surveyed it is possible to accu- mulate from two-fifths to four-fifths of the valuation of a farm within a period of 20 years, provided one has the remaining frac- tion of the purchase price to deposit as an initial payment. But it should be noted that for the man who starts without capital there is also to be added the long period required to accumulate the initial payment ; and the rate of accumulation in this period is neces- sarily much slower than it is after the initial payment has been accumulated.
The largest and most difficult step in the land tenure ladder has been that from tenant to mortgaged ow^ner (fig. 59). After two

566 Tearbooh of the Department of Agriculture^ 1923.
OWNERSHIP OF CAPITAL OF FARMS CLASSIFIED BY TENURE, TWO IOWA COUNTIES, 1918.
183 WARREN COUr^+TY FARMERS THOUSANDS OF DOLLARS
70 60 50 4-0 30 20 10
209 TAMA COUNTY FARMERS THOUSANDS OF DOLLARS
60
SHARE TENANTS
CASH TENANTS
PART OWNERS IN DEBT
PART OWNERS OUT OF DEBT
FULL OWNERS IN DEBT
FULL OWNERS OUT OF DEBT
I FARM CAPITAL OWNED BY THE! FARMER FARM CARTAL RENTED OR BORROWED
FIG. 59.—In both counties there is an. increase in the average amount of operator's equity in farm capital in each successive stage of the tenure ladder with the exception that the equity of full owners in debt is no larger than that of part owners out of debt. The large difference between the average equity of tenants and that of owner farmers suggests the magni- tude of the problem of accumulation of wealth prior to the attainment of farm ownership. Statistics are from a survey in 1918 made by United States Department of Agriculture (Office of Farm Management and Farm Eco- nomics) cooperating with the Iowa Agricultural Experiment Station.
decades or more of rising prices of farm products and real estate it is not surprising, however, that in 1920 many farmers were owners of farms which they had purchased under encumbrance (figs. 60 and 61). Let us assume that tenants earn the average farm incomes shown in Table 6 and start without capital, but agree to pay rentals at the same rates as the mortgage rates of interests shown in Table
FIG. 60.—In 1920 about 40 per cent of the farms of full owners reporting were mortgaged. The mortgage indebtedness averaged $3,856, or 29.1 per cent of the average valuation of these mortgaged farms. Mortgage indebtedness may be an indication either of adversity or of activity in climbing to owner- ship, in improving farm real estate, and in acquiring more efficient forms of operating capital. The greatest percentages in 1920 are found in newer sections or in sections where the valuation of farm real estate had increased rapidly.

FarTïh Oicnership and Tenancy. 567
6 for the respective districts. How long a period would be required to accumulate the initial payment necessary to make it possible to pay for the remainder of the farm capital in 20 years ? An analysis of the figures shows that in only one district, the Pennsylvania area, would it have been possible under these assumptions to accu- mulate anything at all. In all the other districts there would be deficits averaging from $13 to $1,132 per annum, after deducting the mortgage rate of interest on the total farm capital and $600 Eer year for family living. In five of the districts the deficit would
e more than $600; in the others, less, indicating the possibility in the latter districts of making something toward family living after deducting interest on the farm capital, but not deducting as much as $600 per year.
It may be alleged that tenants do not have to pay rental rates as high as the prevailing rates on martgage indebtedness. This is true
FIG. 01.—In 1920 about half of all part owners reporting were operating farms of which the parts owned by them were mortgaged. No information is available in the census as to the mortgages on the rented portion of such farms or concerning mortgages on farms operated b^' tenants. A comparison of the above map with Figure 61 shows that the regions where mortgages are most prevalent are much the same for part-owner farms as for farms oper- ated by full owners.
of cash rentals in some of the regions. Fi-gure 41 indicates that in most of the North Central districts the ratios of cash rents to real estate valuations average only about half or less than half the mort- gage rates shown for the same districts in Table 6. Although the figures on average cash rents are not available for the precisé areas covered in the above surveys, average cash rents in the North Atlantic States, the South, and the Western States do not appear to be much, if any, lower than the mortgage rates shown for the correspondin.o- districts. Furthermore, it is probable that even in the Corn Belt average ratios of share rents to real estate valuations are at least as high as the mortgage rates of interest shown in the table.
The above facts seem to point to the following conclusions. If tenants are to accumulate enough to make the initial payment on a farm under the conditions shown in Table 6, they must do so by one or more of the following means: (1) Make their farms earn higher incomes than the averages shown in Table 6," (2) obtain the use of

568 Yearbook of the Department of Agriculture^ 192S,
tlie farm real estate at rental rates lower than the mortgage rates of interest prevailing in the respective regions; (3) own part or all of their operating capital when they become tenants—a condition char- acteristic of the majority of tenants; (4) live on less than $600 per year in addition to what the farm supplies in kind;^^ (5) reduce the expenses of production below those given in Table 6 by employing the labor of members of the family without wages. This last is a possibility of considerable importance, for, as noted, the farm in- comes shown in the table were calculated by deducting an estimated wage for the unpaid labor of the farm family (not including that of the operator) as an expense of production. Studies of the labor contributed by members of the families show that over a series of years such labor had an average annual valuation of $211 on a group of 60 Wisconsin farms. This is 21 per cent of the expenses on these farms. On a group of 25 Ohio farms the average was $96, or 20 per cent of all expenses, and on a group of 100 Indiana farms it was $81, or 9 per cent of all expenses.
That by some of the above means tenants in large numbers have succeeded without gratuitous assistance in accumulating the neces- sary funds for making the initial payments required for the pur- chase of farms is shown abundantly by the statistics as to progress on the agricultural ladder. On the other hand, the analysis of the income figures have demonstrated that under average conditions the process has become one of no small difficulty in many parts of the United States. In fact, there is reason to believe that increase in the valuation of land has been a large factor in enabling purchasers of farms to refund or repay the indebtedness incurred, even though it may have tended to discourage many from attempting to buy and to increase the difficulty of the purchaser in the early stages of repayment.
Summary of Classes of Tenants in the United States.
The preceding discussion has indicated that the farm tenants of the United States include a number of quite different classes :
1. Persons who are statistically classed as tenants, but who gener- ally are not tenants at all in law and who from an economic point of view are probably more logically considered as laborers than as tenants. This class (croj)pers) comprised in 1920 nearly 23 per cent of all so-called tenants.
2. A large group of farmers, including probably the majority of the croppers, who may never rise to ownership largely because of personal limitations, such as lack of adequate education and training, thriftlessness, inertia, instability, and unwillingness to assume risks.
3. A large group for whom tenancy is either an initial or an inter- mediate step toward ownership.
4. A smaller group who, having become operating owners, have reverted to tenancy through inability to maintain the position of owners.
5. A comparatively small group, who, although financially able to purchase farms, prefer to be tenants either because of certain tern-
ie It should be noted that most of the sfurreys. do not reflect the decrease in the value of the dollar which resulted from the World War. Probably, the $600 represented a larger amount of purchasing power at the time the surveys were taken than it would represent at present.

Farm Ownership and Tenancy, 569
porary circumstances mentioned above or because they prefer other forms of investment for their capital.
Relation of Types of Tenure to Efliciency in Farm Operations.
In considering the financial problem which confronts the tenant farmer in accumulating the means of paying for a farm, it was as- sumed for illustrative purposes that, on a given class of farms, tenants could earn, on the average, as large a farm income, that is, income from both the owned and rented capital as owner farmers earn on the corresponding capital. This raises a question on which a certain amount of information is available. At the outset we are confronted by the fact that in certain parts of the country the kinds of farms operated by the various tenure classes differ considerably.
Differences in Acreage.
First, there are differences in size of farms operated by tenants In the South, the average size as compared with owners (fig. 62)
AVERAGE IMPROVED AND UNIMPROVED ACREAGE OF FARMS, OWNERS. PART OWNERS, AND TENANTS; THE SOUTH COMPARED WITH THE NORTH AND WEST, CENSUS OF 1920.
PER CENT OF ACREAGE IMPROVED
I 0 SOUTH \
FULL OWNER 42
PART OWNER 34
100
ACRES PER FARM
200 300 400
TENANT- •60
NORTH AND WEST
FULL OWNER 57
PART OWNER 48
TENANT 71
¡ACRES IMPROVED ACRES UNIMPROVED
FIG. 62.—The largor averngc acreage botJi of improved and of unimproved land op(^rated by owners in the South as compared with tenants is partly due to the practice of counting as farms the various subdivisions of plantations worked by croppers and partly to the continuance in the South of large farms and plantations worked by hired laborers. In the North and West the larger acreage, both total and improved, operated by tenants and part owners is owing partly to the fact that they need less capital to increase the acreage farmed than do full owners and partly to the fact that the larger farms provide the larg(M- incomes. The unusually large average size of part- owner farms is also due partly to the prevalence of such farms in subhumid I'ogions and other regions where the average size of all classes of farms is larger than for the country as a whole.
of tenant farms is much smaller than that of owner farms, while the opposite condition generally prevails in the North and West. The census of 1920 showed that in 20 States the average size of tenant farms was less than that of farms operated by full owners. Fifteen of these were Southern States, three were in New England, and the other two were Missouri and Utah. On the basis of the average improved acreage j)er farm the tenant farms were smaller only in the South and in Maine.

570 Yearbook of the Department of Agriculture^ 1923,
The average size of so-called tenant farms in the South is to be traced in part to the anomalous statistical results occasioned by the plantation system. Thus, if a Southern planter operates a thousand acres by wage labor—and there are many such large units in the South—the entire area is counted a single farm; but if the planter operates the same thousand acres by means of 30 croppers, even though he controls and directs the management of the whole as before, the entire unit is counted as 30 farms. If the assumed plantation is composed of 400 acres of crop land and 600 acres in timber or siiitable only for grazing or crops other than cotton, the planter is likely to let only the cotton land to croppers and tenants, retaining the remainder under direct operation. In short, the great contrast between North and South in size of farms operated by owners and tenants is owing in large part to the practice of counting as separate farms small tracts of crop land which are integral parts of large cotton plantations or tobacco farms.
In the North the tendency for tenant farms and those operated by part owners to be larger, on the average, than those of owning operators reflects several factors. In the first place, a larger pro- portion of owner farmers are old men who are gradually retiring from farming and reducing the size of their holdings or selling out and buying smaller farms. AlsOc, many owners have been prevented, from lack of capital or through inertia, from acquiring by purchase holdings as large as they could operate effectively. On the other hand, the fact that a man rents additional land shows that he is attempting to expand his holding to a more efficient size, and in renting land both tenants and part owners are less hampered by lack of capital in expanding their holdings than are owner farmers.
Figure 62 also indicates the tendency, characteristic of all but 3 of the 48 States, for tenant farms to contain a larger proportion of improved land than those of other classes of operators. This re- flects the fact that a combination of circumstances causes tenancy to predominate in sections of the country where a large proportion of the land is adapted to crop production. However, in a number of good farming regions of the North, as shown by local surveys, the difl'erence between tenants and owner farmers in this regard is not important.
DifFerences in Importance of Livestock.
Livestock is a smaller factor in the organization of tenant farms than in that of farms operated by owners. This difference is the occasion for a great deal of the concern with which tenancy is viewed in this country. In 1920 for the United States as a whole the valua- tion of livestock on tenant farms per acre of improved land was only 79 per cent of the corresponding figure for farms operated by owners, while the valuation of livestock on tenant farms per $100 worth of farm real estate was only 74 per cent of the corresponding figure for owner farms. Viewing the matter by States the same tendencies generally prevail. The valuation of livestock per acre of improved land was notably greater for tenant farms only in some of the New England States where tenant farms are but a small proportion of the total number. However, in several of the Middle Atlantic States, and in Ohio, Kentucky, Michigan, and Wisconsin, the two classes

VALUE OF LIVESTOCK EXCLUDING WORK STOCK VALUE OF ALL LIVESTOCK ül PER ACRE OF FARM LAND AND IMPROVED LAND ¿^ PER ACRE OF FARM LAND AND IMPROVED LAND r--
1920 1920
f 1 0|» I '--^JX^ ^7 "---yJ-^ CO
CO
I 0
0?
+ -ClFv -L. ^]° —àr!r4^ f^^^ ^ rVk r~ ^ i_jfî '"^Vá;! ,^CH / VALUE IN DOLLARS rx?
1 1—: ^-:7-^ta r^
^ L-i r J^-4—^ y^ E IN DOLLARS ^^hf& ?È^/-
\ U. V ^ / VALU
T |B \ 'P >J^OWNERS = O ( / TENANTS=T
?^
) 10 20 30
?^
\Z/ ^ ) 10 2030
Sll \^OWNERS=0 7 TENANTS=T ^
ri HD VALU E PER ACRE OF "A^*"**^ .r>v n ta-h IMPROVED LAND / Wiii»-^' 0 ¿--1 IMPROVED LAND
'^'^ > ̂-*—«._». Y? Vr L \ ■■ VALUE PER ACRE OF >'^ ^ ,i-,_^ «r* ^-«^ H3 \ ■ VALUE PER ACRE OF
\ ^ ^^SAPS> l^ \ FARMLAND \ ^ *s*!4. ^ \ FARM LAND \ v^ 4) \ /4Ä<?Ke- /«>• CM/^r IS \ J^ ¿ ̂ \ ABOVE HEY CHART IS
M \\— M |us|j ^ \ /UNITED STATES AVEFiAGE.
^ ^^ CSNSUS OK/9¿t> 7 ^^ ^^ ccNsys or mo
FIG. 63.—Eleven Western States are excluded from tins graph because a large acreage of the pasture land is not in farms and is conse- quently not reported by the census. In the States shown here it is apparent that while owner farmers usually show higher average valua- tions of livestock per acre than do tenants, a few of the State averages show the reverse. Excluding work stock reduces the rela- tive favorableness of the tenant showing. Much of the apparent disadvantage under which tenants stand in State averages used in comparisons of this sort lies in the fact that tenants are more prevalent in those parts of the States in which neither tenants nor owner farms engage in livestock production than in those parts where livestock is an important factor in farm, economy.

572 Yearhooh of the Department of Agriculture^ 1923.
are nearly equal in the valuation of livestock per acre of improved land. In most of the other Northern States east of the Rocky Mountains the valuation of livestock per acre of improved land on tenant farms ranges from 80 to 90 per cent of the corresponding figure for the farms of operating owners. In some of the Southern
PROPORTION OF TOTAL FARM INVESTMENT IN LIVESTOCK OTHER THAN WORK STOCK, OWNER FARMERS COMPARED WITH TENANTS; FOUR FARM SURVEY AREAS.
JVIBC.
It NUMBER
PENNA. CHESTER CO.,I9I2 OWNERS. -.378
TENANTS Cash 53
3fock Share 7/
iOWA BLACKHAWK, TAMA, a GRUNDY CO*S.,I9I8 OWNERS
FuH 83
Part 29
TENANTS Cash 76
S h are Cash 16
Share 7
GEORGIA SUMTER CO.,I9I8 OWNERS
White 280
Colored ^iS
STANDING RENTERS White ^0
Colored 160
TEXAS ELLIS C0.,I9I^ OWNERS
(Without Croppers).j37
With Croppers) 16
TENANTS Share 2^
^^7are Cash 28
FIG, 64.—The relative place occupied by dairy cattle and meat animals is not always smaller in the case of farms operated by tenants than for farms operated by owners in the same localities. Moreover, tenants in some locai des employ such livestock much more extensively than do owner farmers in other localities. The results shown are for a single year in each survey.

Farm Ownership and Tenancy» 573
States and the western range States the valuation of all livestock per acre on tenant farms is less than on farms operated by owners (fig. 63). When work animals are deducted, the tendency in some States for the valuation of livestock per acre to be greater on tenant farms than on farms operated by owners is less evident. Results of a number of surveys also show that in some of the districts surveyed the proportion of total farm capital invested in livestock other than work animals is larger for the tenant farms, or at least for certain classes of tenant farms than for farms operated by owners (fig. 64).
The statistics by States reflect the disproportionate distribution of owners and tenants in parts of the country where livestock are numerous in proportion to the acreage of improved land. Thus, tenants are a comparatively small percentage of farm operators in the great range areas of the West, in the pasture lands of the Ap- palachian and Ozark regions, and in the dairy regions of New Eng- land, New York, and Lake States. The predominance of farming by owners in regions of livestock production tends to weight the average valuation of live stock per acre of improved land unduly in favor of this class of farms. When the two tenure classes are com- pared in regions where livestock husbandry prevails, as, for instance, in the dairy States, the disparity indicated above is not necessarily shown. In the South, so-called tenant farming is frequently an ar- rangement by which a plantation operator employs croppers to work the crop land under the planter's direction, while he maintains the livestock by employing wage laborers. In short, the fact that men rent land instead of owning it is not in itself a fundamental reason why they can not engage extensively in livestock husbandry. In Eng- land, for instance, a country where livestock is a large factor in farm economy, nearly 90 per cent of the farms are operated by tenants.
Differences in Diversification of Crops.
It is frequently assumed that tenant farming results in less diversi- fication of crops than does farming by owners. Averages for the united States as a whole or for particular sections appear to sus- tain such a conclusion. However, this is largely due to the fact that tenant farms predominate in regions where the so-called one-crop system of farming prevails and to the tendency on Southern planta- tions to work the cotton or tobacco land by means of croppers and tenants. In the general farming regions of the North local surveys do not indicate that tenant farmers uniformly practice less crop diversification than is practiced by owner farmers in the same locali- ties (fig. 65).
Differences in Yields per Acre.
The comparative efficiency of tenants and owners may be partly reflected in yield per acre of crop land. It is clear that general comparisons for large statistical units such as States may result in misleading conclusions for the reason already mentioned, namely, the unequal distribution of the tenants and owners on land of dif- ferent character and quality. Even for local surveys it is not always clear that the two classes of farmers occupy farm land of the same average quality. However, comparisons of yield per acre for a number of surveys do not point to definite conclusions. In some surveys tenant farms show a higher average yield, while in other

574 Yearbooh of the Department of Agriculture^ 1923,
surveys the advantage is with owner farmers (fig. 66). In short, it appears that the question w^iether tenants or owner farmers are the
CROP DIVERSITY AS INDICATED BY PERCENTAGE OP CROP LAND IN DIFFERENT CROPS, OWNERS COMPARED WITH TENANTS; FIVE FARM SURVEY AREAS.
FARMS PENNSYLVANIA NUMBER PERCENTAGE OF CROP LAND (Chester Co.,/S/2) \ 0 20
1Î OWNERS, Full 378
TENANTS, Cosh. 53
TENANTS, Stock-Share 7/
IOWA (Blackhawk Tama and Grundy Cos^ t9I8)
OWNERS,ru/L &3
OWNERS,Part. 29
TEN AN TS, Cash.. 75
TENANTS,Share /5
IDAHO &WASR (Pa/ouse Area.,f3 IS)
OWNERS,Eu/L /03
OWNERS,Part. S3
TENANTS, Cash. /2
TENANTS, Share S8
SO. CARO LINA, (Anderson Co.J9ly
OWNERS, '^ti';?p%%.: 27
OWNERS, ^i-'Sppers-
TENANTS,Cash .,
TENANTS, Share
^ TEXAS , (afis eo„ 191^)
.36
.21
— 7
OWNERS,]^t%frs 37
OWNERS, ^^^pers — ^^
TENANTS,Share 2^
TENANTS, Share-Cash 18
100
^SMALL GRAINS
FIG. 65.—In the Pennsylvania and Iowa surveys no important differences are shown in crop selection as between tenants and owner farmers, except that cash tenants place a little more emphasis on corn than do other classes of operators. In the three regions characteriaed by the one-crop system—that is, wheat in the Palonee area and cotton in the two Southern areas—there is slightly more concentration by tenants on the principal money crop. In the South this frequently represents a deliberate division of enterprises on plantations operated as units, the croppers and tenants being employed in the production Of cotton, while the plantation operator carries on by hired labor such crop diversification, as well as livestock production, as he con- siders economically desirable from the standpoint of the plantation as a whole. The results shown are only for a single year in each survey.

Farm Owner ship and Tenancy, 575
more efficient as measured by crop production per acre can not be conclusively answered except with reference to the particular locality under consideration.
YIELD PER ACRE OF CORN, OATS, HAY, AND COTTON, OWNER FARMERS COMPARED WITH TENANTS; FIVE FARM SURVEY AREAS.
PENNSYLVANIA
(Chester Co., /9I2) \
OWNERS.Full. 378
TENANTS. Cash 53
TENANTS, Stock-Share 7 /
IOWA (B/ackhawk.
Tama and G rund y CosJ9l8)
OWNERS 63
TENANTS, Cash 75
TENANTS, Share. /5
TENA NTS. Share - Cash 7
GEORGIA
(SumterCo., 1918}
OWNERS. White 280
OWNERS. Colored A8
NUMBCP YIELD PER ACRE OF BUSHELS OF CORN BUSHELS OF OATS TONS OF HAY COTTON
FARMS BALES
20 AO 60 0 20 40 0 I 2 0 I
STANDING RENTERS STANDING RENTERS
White. .^O
Colored.. ./60
SO. CAROLINA
(Anderson Co., 191-4)
OWNERS ^'thWageHands....63
OWNERS ^'^^ Croppers.... 36
TENANTS, Cash.. .2/
TEXAS
(Ellis Co., 191^)
OWNERS. Without Croppers...37
OWNERS. With Croppers....U6
TENANTS,Share 2^
TENANTS, Share-Cash. /Ö
FIG. 66.—This graph shows the danger of generalizing as to yields per acre on rented as compared with owner-operated land even within the same locali- ties. Just as tenants usually occupy a proportion of the highly productive land in a State or geographic division that is larger than their numbers alone might indicate, so also they often lease a disproportionately large amount of the more productive land in local areas. When showing higher average yields than owners, little proof is afforded that the tenants tbem- selves are better farmers than the owner farmers. The reverse holds in like manner.* The results shown are only for a single year in each survey.

576 Yearbook of the Department of Agrieulture^ 1923,
Differences in Farm Income. The relative eiSciency of the several classes of farmers may also
be compared in terms of ability to make the farm yield farm income, that is, net income for the business as a whole without reference to its distribution in the form of rent and interest among the several classes who furnish the farm capital or in the form of wages for the farmer's time. In order to allow for possible differences in the size of the business as between the several classes, farm income is expressed as a percentage of farm capital (fig. 67). The results of the surveys shown in this graph, as well as the results of other sur- veys, indicate that in the northern areas tenants are not notably inferior to owner farmers in their ability to make their farms yield farm income, and in a number of surveys are shown to be slightly superior. In the southern surveys tenants earned larger average farm incomes than did owner farmers employing croppers, and share or share-cash tenants earned farm incomes approximately equal to or exceeding those of owner farmers operating without croppers.
In general, the available statistics indicate that efficiency is less a matter of the class of tenure than it is of the personal qualities of the farmer, the character of the land, and the adequacy of farm equipment and operating capital.
Interrelation of Form of Tenure With Progress in Accumula- tion, Education, and Standard of Living.
Various local tenure surveys have supplied a steadily increasing body of statistics which show contrasts in the educational advan- tages, and standard of living of tenants as compared with owner farmers.
Comparative Educational Advantages. The interdependence of success in accumulating wealth with the
educational advantages of various classes of farm operators and their children is shown in Table 7. TABLE 7.—The relation of education to tenure and ahility to accumulate wealth
from earnings, 1,066 farm operators and their families^ in Texas, Tennessee, and Kentucky, 1919-1920 \
Farmers classified by tenure and by rank as accumulators of wealth.2
Average grade in school attained by
farmers.
Average grade in school attained by wives of farmers.
Average grade in school attained by children above 21
years.
Number. Average grade. Number. Average
grade. Number. Average grade.
Croppers : Poorest 70
76 76
132 128 132
151 152 149
3.3 3.6 4.6
5.0 5.0 6.2
5.7 6.3 7,4
63 75 68
126 122 120
137 143 139
4.2 4.9 5.2
5.6 5.4 7.1
6.4 7.0 8.0
79 40 18
79 77 41
178 170 110
5.6 Medium _ - 4.1 Best 4.3
Tenants: Poorest - ---- 6.7 Medium > 7.1 Best 8.1
Owners: Poorest 7.9 Medium -- 8.3 Best 10.7
iThe survey in Texas was made in a number of Black Prairie counties. See United States Department of Agriculture Bulletin 1068. The surveys in middle and west Tennessee and the bluegrass district of Ken- tucky were made by the Bureau of Agricultural Economics, Division of Land Economics, in cooperation with the Experiment Stations of the respective States. . ,,
2 This distinction is based on the average annual wealth saved, after excludmg wealth received from inheritance, gift, and marriage, and wealth secured by net increases in the valuation ollandjvhich had been owned by operators. The average annual accumulation for each farmer was also divided by the average index number of prices for the years during which thesavii« was made, thus partly, atl east, elim- inating the effects of changes in purchasing power of the dollar as affecting accumulations made at diflerent I)eriodsoftime.
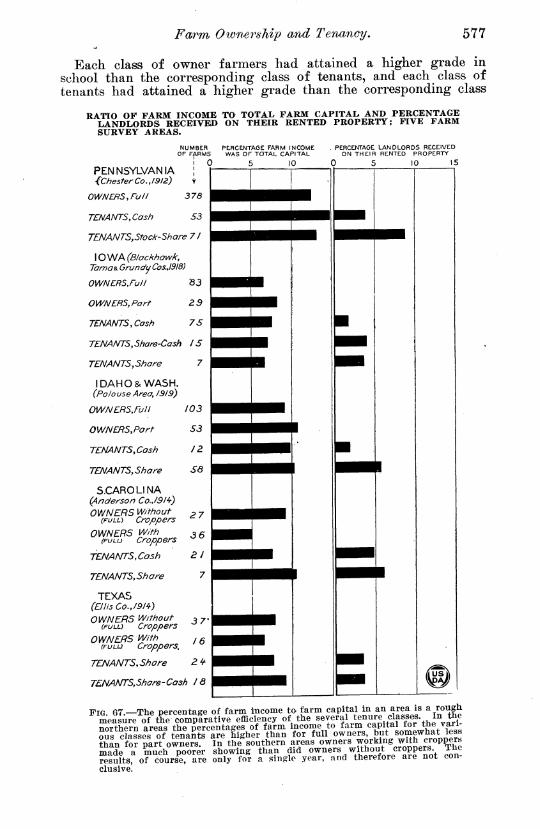
Farm Ownership and Tenancy, 577
Each class of owner farmers had attained a higher grade in school than the corresponding class of tenants, and each class of tenants had attained a higher grade than the corresponding class
RATIO OF FARM INCOME TO TOTAL FARM CAPITAL AND PERCENTAGE LANDLORDS RECEIVED ON THEIR RENTED PROPERTY; FIVE FARM SURVEY AREAS.
NUMBER ■ FARMS
! 0
PLRCENTAGE FARM INCOME WAS OF TOTAL CAPITAL
5 10
. PERCENTAGE. LANDLORDS RECEIVED ON THEIR RENTED PROPERTY
0 5 10 IS PENNSYLVANIA {Chester Co.,/9/2)
OWNERS, Ful I
TENANTS,Cash 53
TENANTS,5tock-5hare 71
\Q\Nk(Blockhawk, Tama 6^ Grundig CosJ9l8)
OWN ERS,Fu// 03
OWN ERS, Parr 29
TENANTS,Cash 7 S
TENANTS,Share-Cash ¡5
TENANTS,Share 7
IDAHO&WASH. (Polouse Area, /9/9)
OWNERS,Full
OWNERS,Port
TENANTS,Cosh
TENANTS,Share
S.CAROLINA (Anderson Co.,/9/^)
OWNERS Without (FULL) Croppers
OWNERS With (FULu Croppers
TENANTS,Cosh
TEN ANTS,Sha re
TEXAS (ElFIS Co.,/91^)
OWNERS Without (FULL) Croppers
OWNERS i^'th (FULU Croppers.
TENANTS,Share
TENANTS,Share'Cash JÔ
FIG. 67.—The percentage of farm income to farm capital in an area is a rough measure Of the complrative efficiency of the several tenure classes. In tbe nnrthprn areas the nercentages of farm income to farm capital tor tne van- oSs classe^'of tenaSts'Iïe'^iigher than for full owners but somewhat less than for part owners. In the southern areas owners working with croppers made a much poorer showing than did owners without croppers The Sts, of ^ours^e^are only for a single year, and therefore are not con- elusive.

578 Yearbook of the Department of Agrimdture^ 1923,
of croppers. Within each tenure class the average school grade reached was found to be directly related to efficiency in accumulation, the best accumulators having previously attained the highest grade; the medium accumulators the next highest ; and the poorest accumu- lators the lowest. However, progress in accumulation may be due in part to the superior educational advantages, and in part to the greater facility of accumulation made possible by gratuitous receipt of wealth. Moreover, the results shown may reflect to some extent a selective process which causes the more intelligent to profit by the opportunity for education afforded by progress in accumulation, while the latter is in a sense a result of superior intelligence. The school advantages of the wives of the various members of the groups paralleled those of the husbands. Moreover, for each accumulator group, the children over 21 years of age of owner farmers had at- tained a higher grade in school than was the case for the correspond- ing group of tenants, and the children of 21 years of age and over belonging to tenant families had enjoyed greater school advantages than the corresponding group of croppers. One hopeful indication is the fact that the children, except those of the best and medium croppers, had attained a higher average grade in school than their parents.
The comparative educational advantages of various classes of farm operators and of their children are shown from a somewhat different point of view for both southern and other areas in Table 8.
TABLE 8.—Percentage of farmers and farmers' children, excluding children still in school, who reported high school or college education, 1919 \
Total.
Owners. Tenants.
Crop- pers.
Hired men.
Man- agers.
Full. Part. Re- lated.
Unre- lated.
Farmers: Southern areas (5) 13.0
22.8
25.6 47.0
20.0 20.2
40.8 48.5
13.9 34,6
31.8 51.5
27.8 37.0
43.3 35.7
9.5 14.8
19.5 43.7
11.1
10.0
4.5 31.3
5.6 33.3
50.0 other areas (9) 92.3
Farmers' children who had left school: Southern areas (5) other areas (9). 66.7
^Surveys in 3 areas (Georgia, Iowa, and Missouri) by Bureau of Agricultural Economics, Division of Farm Population; and in 11 areas (California, Illinois, Indiana, Maryland, Missouri, Nebraska, New Jersey, New York, Oklahoma, Pennsylvania, and Wisconsin) by Inter-Church World Movement.
As shown in Table 8, the proportion of farmers having high school or college education is 13 per cent in the southern areas and 23 per cent in areas in the States of the North and West. In the southern areas a larger proportion of the full-owner farmers (20 per cent) reported high school and college education than of the part-owner farmers (14 per cent) ; but in the other areas the reverse was the case, part owners reporting high school and college educa- tion more generally than did full owners (35 per cent, as compared with 20 per cent). In both the southern areas and the other areas a larger proportion of the tenants who were related to their land- lords reported high school and college education (28 and 37 per cent, respectively) than of tenants not so related (9 and 15 per cent, respectively). Croppers, found only in the southern areas, re- ported high school and college education in 11 per cent of the cases,

Foïïmi Ownershij) and Tenancy. 579
thereby exceeding the corresponding percentages for hired men in southern areas (4 per cent) but not for hired men in other areas (31 per cent).
Excluding children still in school, the proportion of children hav- ing high school or college education is shown in Table 8 to be 26 per cent in southern areas and 47 per cent in areas in the States of the North and West; or almost exactly twice as high in the case of each group of areas as shown for the farmers themselves. The proportion of children with completed schooling who had high school and college education was above average in both groups of areas in the case of children of both full owners and part owners and children of related tenants in southern areas. The proportion in the case of unrelated tenants in areas in the North and West (44 per cent) was over twice the corresponding proportion (20 per cent) in the case of unrelated tenants in southern areas, and exceeded the proportions shown for hired men in both groups of areas (33 per cent in northern and western areas and 5.6 per cent in southern areas).
Magazines and Newspapers.
Somewhat similar contrasts are revealed by statistics concerning periodicals and newspapers taken by various classes of farm opera- tors, as shown in Table 9. The percentage for owner farmers is higher than for tenants in the case of every class of periodicals. The differences are much greater in the southern than in the north- ern surveys.
TABLE 9.—Percentages of owner farmers and of tenant fanners taking various classes of periodicals; 10 surveys,
WHITE OWNER FARMERS,
[ See end of table for footnotes ]
Survey and date.» Number of farm- ers in
survey.
Percentage of all farmers taking-
Dailies. Agricul-
tural papers.
Week- lies. 2
Maga- zines, Others.
Southwestern Ohio, 1912.... North Carolina, 1922 Nebraska, 1920
Texas, 1919 Kentucky, 1919 Madison County, Tenn., 1919 Montgomery County, Tenn., 1920 . Williamson County, Tenn., 1919 _.
Total or average..
273
436
406
106 122 63 87
100
3 94.9 40.1 84.0
8 67.9 91.8 74.6 59.8 70.0
57.9 45.6 77.8 59.0 61.5 69.8 57.5 66.0
3 13.2 69.0 38.9 62.1 57.4 47.6 36.8 72.0
1,593 70.8 60.9 ¡9.8
<27. 1 6 13.6
48. 1 4 21.7 5 18. 2
53.3 41.8 38.1 42.5 37.0
43.2
«14.3 7 2.8 73.2
5.7
NEGRO OWNER FARMERS.
Morth Carolina 1922 54 149
1.9 8 16.8
37.0 69.8
31.5 5.6 2.0
'3.7 \rWtAn\a 1091 W U^'X^^Ur, *.,-*
Tnt.al nr «vftraffP. 12.8 61.1 31.5 3.0 3.7 .
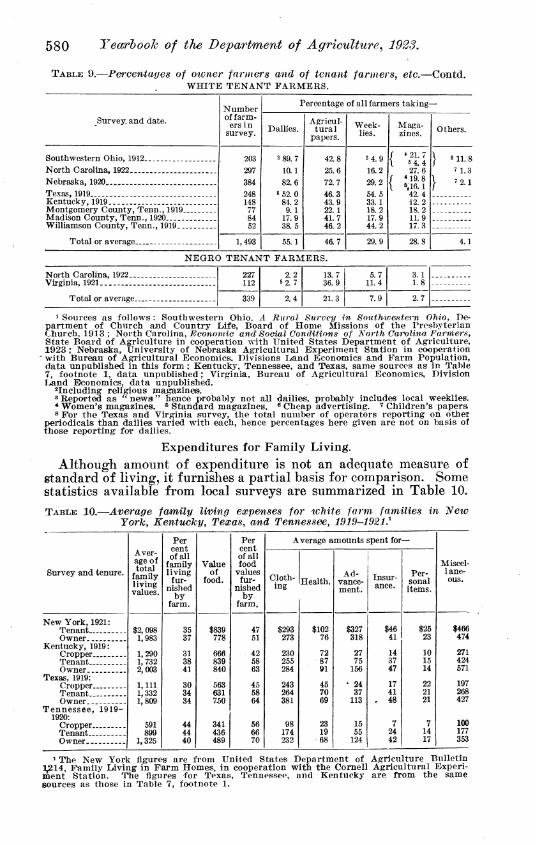
580 Yearbook of the Department of Agriculture^ 1923.
TABLE 9.—Percentages of oioner farmers and of tenant farmers, etc.—Contd. WHITE TENANT FARMERS.
Survey, and date. Number of farm-
ers in survey.
Percentage of all farmers taking-
Dallies. Agricul- tural
pajjers. Week-
lies. Maga- zines. Others.
Southwestern Ohio, 1912.. North C arolina, 1922 Nebraska, 1920 Texas, 1919.. _ Kentucky, 1919 Montgomery County, Tenn., 1919.. Madison County, Tenn., 1920 Williamson County, Tenn., 1919...
203 297 384 248 148
77 84 62
3 89.7 10.1 82.6
S52. 0 84.2 9.1
17.9 38.5
42.8 25.6 72.7 46.3 43.9 22.1 41.7 46.2
3 4.9 16.2 29.2 54.5 33.1 18.2 17.9 44.2
<21. 7 5 4.4 27.6
M9.8 5,16.1
42.4 12.2 18.2 11.9 17.3
6 11.8 7 1,3 7 2.1
Total or average.. 55.1 46.7 29.9 28.8
NEGRO TENANT FARMERS.
North Carolina, 1922 _ 227 112
2.2 8 2.7
13.7 36.9
5.7 11.4
3. 1 1.8 Virmnia. 1921
Total or average 339 2.4 21.3 7.9 2.7
* Sources as follows : Southwestern Ohio, A Rural Survey in Southiceastern Ohio, De- partment of Church and Country Life, Board of Home Missions of the Presbyterian Church, 1913 ; North Carolina,-E7cot?,omic and Social Conditions of No7'th Carolina Farmers, State Board of Agriculture in cooperation with United State« Department of Agriculture, 1923 ; Nebraska, University of Nebraska Agricultural Experiment Station in cooperation
' with Bureau of Agricultural Economics, Divisions Dand Economics and Farm Population, data unpublished in this form ; Kentucky, Tennessee, and Texas, same sources as in Table 7, footnote 1, data unpublished ; Virginia, Bureau of Agricultural Economics, Division I^nd Economics, data unpublished.
^Including religious magazines. » Reported as ** news " hence probably not all dailies, probably includes local weeklies. * Women's magazines. ^ Standard magazines. <* Cheap advertising, ^ Children's papers. 8 For the Texas and Virginia survey, the total number of operators reporting on otlier
periodicals than dailies varied with each, hence percentages here given are not on basis of those reporting for dailies.
Expenditures for Family Living. Although amount of expenditure is not an adequate measure of
standard of living, it furnishes a partial basis for comparison. Some statistics available from local surveys a;re summarized in Table 10.
TABLE 10.—Average family living expenses for white farm families in New York, Kentucky, Texas, and Tennessee, 1919^-1921.^
Aver- age of total
family living values.
Per cent of all
family living
fur- nished
by farm.
Value of
food.
Per cent of all food
values fur-
nished by
farm.
Average amounts spent for—
Survey and tenure. Cloth- ing Health.
Ad- vance- ment.
Insur- ance.
Per- sonal iteins.
Miscel- 1 ane- ous.
New York, 1921: Tenant _ $2,098
1,983
1,290 1,732 2,003
1,111 1,332 1,809
591 899
1,325
35 37
31 38 41
30 34 34
44 44 40
$839 778
666 839 840
563 631 750
341 436 489
47 51
42 58 63
45 58 64
56 66 70
$293 273
230 255 284
243 264 381
98 174 232
$102 76
72 87 91
45 70 69
23 19 68
$327 318
27 75
156
• 24 37
113
15 55
124
$46 41
14 37 47
17 41
. 48
7 24 42
$25 23
10 15 14
22 21 21
7 14 17
$466 Owner 474
Kentucky, 1919: Cropper 271 Tenant 424 Owner 571
Texas, 1919: Cropper 197 Tenant 268 Owner 427
Tennessee, 1919- 1920:
Cropper 100 Tenant 177 Owner 353
^ The New York figures are from United States Department of Agriculture Bulletin 1^14, Family Living in Farm Homes, in cooperation witJi the Cornell Agricultural Experi- ment Station. The figures for Texas, Tennessee, and Kentucky are from the same sources as those in Table 7, footnote 1.

Farm Ownership and Tenancy, 581
In the southern districts the total average living expenses of tenant families are considerably less than those of owners. In the New York surveys the expenses of tenants exceed those of owners by more than $100 per year. In the New York and Kentucky surveys the proportion of the family living furnished by the farm is higher for owner farmers than for tenants, and in the Texas survey the proportions are equal. The proportions of the total expenditures used for food and for clothing are somewhat greater for croppers and tenants than for owners, but the actual expenditure is less, except in New York. In the southern districts the proportions de- voted to advancement expenditures (books, magazines, music, educa- tion, social life, etc.) are much larger for owners than for croppers and tenants. The proportions devoted to the personal expenditures of the operator (mainly tobacco) are much the same in New York and Texas.
Housing Conditions and Home Conveniences.
As would be expected, housing facilities for tenants are generally less adequate than for owner farmers. The average valuation of dwellings of owner farmers in Texas, Tennessee, Kentucky, and Nebraska was found to be nearly twice that for tenants,^^
Eeports from several thousand owner farmers and tenants in various parts of the United States indicate that owners occupy houses that are somewhat older than those occupied by tenants. Information on the state of repair of houses derived from surveys in three Southern States previously referred to, indicate that 69 per cent of the houses occupied by owners were in good repair, 22.6 per cent in medium repair, and 8.4 per cent in poor repair; while of the tenant houses 37.5 per cent were in good repair, 31.8 per cent in medium repair, and 30.7 per cent in poor repair.
On the basis of averages from a considerable number of surveys (Table 11) it does not appear that overcrowding is, in general, a serious evil either for owners or for tenants. The average number of rooms for owner farmers was found to be 6.3 and for tenants 5.6. However, in certain parts of the areas surveyed as well as in other parts of the country, it is known that there is not enough room in farm tenant houses. As shown in Table 11 small percentages of tenants, and from a fifth to a tenth of the owner farmers, enjoy the conveniences that are taken for granted even in the poorer class of city houses.
Various surveys made between 1919 and 1921 show that in the North an average of about 70 per cent of the owner farmers and about two-thirds of the tenants had telephones. In the South con- ditions were more variable. In the Black Prairie of Texas and the bluegrass region of Kentucky about two-thirds of the owner farm- ers and from a third to two-fifths of the tenants had telephones. On the other hand, among white farmers of North Carolina only 14 per cent of the owner farmers and less than 2 per cent of the tenants had telephones. Similarly low percentages for tenants were ob-
20 For 971 owner farmers and 1,065 tenants. For sources of statistics for first three States, see Table 7, footnote 1. The Nebraska data are from sources cited in Table 9, footnote 1.

582 Yearbook of the Department of Agriculture^ 1923,
tained in surveys made in the tobacco and cotton-producing sections of Tennessee. Of 112 negro tenants included in a Virginia survey not 1 had a telephone.
TABLE Il.^-Percen4ages of honve^ of owner farmers and of tenants provided with certain eo'tweniences^
Kinds of conveniences. 1,973
tenant farmers.
Running water in houses. Bathrooms IndoOT toilets Electric or gas lighting systems. Central heating systems Refrigerators O il stoves for cooking Vacuum cleaners
7.4 5.7 4.4 8.0 4.1 6.7
28.8 6.7
1 Surveys in Tennessee, North Carolina, Nebraska, Iowa, and various local studies made under the auspices of the Inter-Church World Movement. (Citations given under Table 8.) . The bases of the per- centages are not the same for all the items, as not all of the posons surveyed reported on every item.
The various contrasts in educational advantages and standard of living that have been considered above appear generally, though not invariably, unfavorable to tenants. However, such contrasts can not be adequately explained as due merely to difference in form of tenure. If tenants as a class are characterized by less literacy, are less adequately housed, read fewer books and magazines, have poorer sanitary facilities, and enjoy fewer household conveniences, as compared with owner farmers in a given region, it is not merely because they are tenants.
Generally, the disabilities and disadvantages which, on the average, characterize the class of tenants to a greater extent than the owner farmers grow out of the fact that tenants as a class are financially less advanced than owner farmers, partly because they include a large percentage of young men who will ultimately acquire more ade- quate financial resources, partly because a smaller proportion of tenants have benefited by receipt of wealth through inheritance, gift, or marriage, and partly because in the processes of economic and social selection the group contains a larger proportion of those who through various forms of personal inadequacy or misfortune, either fail to rise into ownership or to maintain their position as owners.
Principal Kinds of Contracts Between Landlords and Tenants.
Up to this point we have generally spoken of tenancy as if it were a uniform system of land tenure. As a matter of fact, there are a number of kinds of tenancy involving numerous differences in detail.
Relative Statistical Prevalence of Different Kinds of Tenant Contracts.
For statistical purposes the different types of tenancy are divided into two great groups, share tenancy and cash tenancy. However, a number of statistical subgroups have come to be distinguished, which,

-In 1920 share tenancy was the principal form of tenancy in four-fifths of the counties and five-sixths of the States. Cash tenancy predominated in New England, western Pennsylvania, and the northern parts of the Lake States, but in none of these areas was there a large percentage of tenants, and therefore cash tenants were not numerous. Three of the most important regions of cash tenancy were Iowa, southwestern Alabama, and the Pacific coast. Croppers are more numerous than other tenants in southeastern Arkansas, northeastern Louisiana, and western Mississippi, in southeastern Alabama, and southern Georgia. In several counties of Georgia and South Carolina standing renters are first in number. 00
05

'^W
CROPPER
SHARE TENANT
SHARE-CASH TENANT
STANDING RENTER
V^^ißM CASH TENANT
METHOD SECOND IN FREQUENCY USED ON LESS THAN 10 PER CENT OF THE RENTED FARMS,
C£Nau3 or i9io
FIG. 69.—'Cash tenancy is the system second in importance in New York, much of Pennsylvania, and in most portions of tlie North Central States, where It is not first in importance (see fij?. 60). In parts of Illinois, Iowa, tho Dakotas, Nebraska, and Kansas share-cash renting either predominates or is second in importance. In the Rocky Mountain and Pacific States cash renting is second where it is not first, and is relatively an important system in this part of the country. In the South cropper farms, where not first are generally second in number.

Farm Ownership and Tenancy, 585
to designate them by the terms applied to the persons renting, include share-cash tenants, standing renters, and croppers {?^g^. 68 and 69).
In 1920, three-fourths of the farm tenants (73.6 per cent of all and 75.5 per cent of those of known status) worked their land on shares, including share-cash tenants and croppers (fig. 70). Though outnumbered by share tenants in each census report from 1880 to 1920, the proportion of casli tenants increased from 1880 to 1900. Since 1900 the proportion has decreased.^^
In some of our States there are considerable numbers of tenants who pay as rent a stated amount of farm commodities, usually cotton. The payment of standing rent, to use the census term, is especially prevalent in Georgia and South Carolina, largely because all classes of share tenants in those States are legally held to be
FIG. 70.—Only in five New England States and in Iowa, California, and Nevada are share tenants (includini? croppers) less than half of all tenants. In many States thoy arc over three-fourths of all tenants, and they are also slightly over three-fourths for the Nation as a whole.
laborers and are not accorded the legal rights of tenants; but in none of the other States are standing renters as important relatively as cash tenants paying a money rent.
Farms rented partly on shares and partly for cash (share-cash) comprise one of the important subclasses included statistically under share tenancy, and are most prevalent in parts of the North Central States. Where cash rent is paid on farms partly rented on shares, the acreage leased for money rent is usually pasture and hay land, the sharing basis being applied generally to the grain land.
Sharing by croppers is sufficiently different from other types of sharing to justify special consideration. As pointed out previously, croppers are ordinarily quite destitute of capital, owning neither land, buildings, work animals, nor farming tools, and must be fur- nished with these requisites and usually with subsistence for the
21 Although 37.1 per cent were reported in the group of "cash and unspecified in 1900, the unspecified were such a proportion of the whole (4.8 per cent in 1910) t^hat it is unsafe to say that more than a third of the tenants were on a cash basis in 1900.

586 Yearbook of the Departraent of Agriculture^ 1023.
family during the months preceding harvest.^^ The majority of croppers work under the close supervision of the plantation operators. Furnishing only human labor and sometimes a share of the fertilizer and seed, they commonly receive half of the cotton or tobacco, but in some districts the share is only one-third.
Conditions Influencing the Kind of Tenant Contract Employed.
The form of the tenant contract is determined largely by the ability or willingness of the respective parties to supply capital, provide supervision, or assume risks. When tenants are able to pay cash in advance or can be trusted for subsequent payment of cash, landlords are more likely to be willing to rent for cash than when the opposite conditions prevail. When the element of risk is large and the tenant is inexperienced or incompetent as a manager, share renting is likely to prove to the interest of both parties, especially if the landlord is able to provide advice or supervision. This is particularly the case when the tenant has but little capital or credit. Under such conditions when crops are poor or prices low, the land- lord might be unable to collect a cash rent, but in favorable periods would find his rent limited to the stipulated amount. Under a share system the landlord's risk with such a tenant is no greater in un- favorable periods than under a system of cash renting, but in favor- able periods he enjoys a share of the increased returns. Moreover, if the landlord is compelled to supply the more perishable forms of operating capital, such as machinery and livestock, he will usually find it necessary to maintain close supervision and control. If this is the case he is not likely to be willing to accept a fixed cash rent. In general, landlords who rent on shares live near their farms and keep a watchful eye on the methods of farming and also on the amount and division of the crops.
Other things equal, the relations of landlords to tenants may be classified by the relative amount of risk assumed by the respective parties under the various classes of renting contracts. Viewing the matter from the standpoint of the landlord, cash renting involves the least amount of risk. In the North, the cash tenant usually has sufficient capital and credit so that the landlord does not ordinarily incur great risk of not receiving his rent, even in unfavorable years (fig. 71). In fact, in a number of States the landlord's rent is le- gally protected by provision giving him a statutory lien on the crops. Similar rights are sometimes provided for in the case of livestock and other personal property. Somewhat greater risk for the land- lord is involved in standing rent, for, although the amount of the crop to be received is fixed in the agreement, he is subject to the variations in the price received for his part. In the ordinary crop- share lease, when the landlord supplies only the land and buildings but does not furnish any of the working capital, he is subject to the variations in yield and prices as reflected in the fractional share of the crop agreed upon as rent. In the case of the cropper arrange-
22 In a mimber of Southern States they are legally classified as laborers rather than as tenants and, therefore, are adjudged to have no rights of ownership jn the implements and work stock advanced for their use, nor in the crop itself until after division by the plantation operator.

Fiü. 71.—Cash tenants are relatively though not absolutely numerous in New Englandl and eastern New York, in the cut-over areas of the Lake States, in western Pennsylvania and West Virginia, and in much of the West, especially along the Pacific coast These are areas in which dairying or cattle ranching are generally predominant. Cash tenants are both relatively and absolutely numerous in Iowa, northern Illinois, and northeastern Nebraska ; also in the south Atlantic and Gulf coastal plain, especiallv in Florida and southern Alabama. t- , f j o.
00 -a

588 Yearhook of the Department of Agriculture^ 1923,
ment, the landlord's risk is very much greater, for, in addition to furnishing the real estate, he incurs heavy expenses for supplying and maintaining the operating equipment, furnishing part of the -seed and fertilizer, and supervision. Indeed, the risk of the land- lord is scarcely less than if he were operating the farm with liired labor, for he must advance the croppers their living while making the crop.
Returns to Landlord in Different Forms of Tenancy.
Inasmuch as the risk and responsibility of the landlord vary so greatly under the different systems mentioned above, it is inevitable that the terms will be such normally as to make the return cor- respond more or less closely with the landlord's risk and responsi- bility. Theoretically, the landlord should receive a higher percent- age of return in share renting than in cash renting, and a higher percentage of return from croppers than for other forms of share tenancy. Local surveys generally confirm these conclusions (see the right-hand part of Figure 67).
To some extent landlords supply not only the use of the real estate but also part or all of the operating capital. As already noted, under the cropper system the landlord furnishes the working capital as well as the land, with occasional exceptions in the case of fertilizing and ginning expense. In the North the tenant, who may be a son or other relative of the landlord, may. arrange to buy the operating equipment largely on credit from the landlord. In other cases, the tenant may agree to pay the landlord a correspondingly larger share, commonly two-thirds of the crop, for the use of operat- ing equipment as well as the real estate. There are also systems of tenancy, especially prevalent where livestock husbandry is an im- portant element in the system of farming, which involve the land- lord in a large share of responsibility for operating capital, current expenses, and supervision. Very frequently such arrangements, commonly known as " stock share " or " crop and livestock share " leases, provide for a half-and-half division of all receipts, and an equal division of all expenses, except for land and labor.
To a considerable extent in the North, and to a large extent in the South, the landlord furnishes little, if any, capital, other than the real estate. Under these circumstances the share paid as rent is largely determined by custom in the community, but differs in accordance with the kind of crop which constitutes the principal basis of farming. Very intensive crops, like cotton and tobacco, for example, involve usually a smaller share rent than less intensive crops, such as corn and small grain.
In regions where corn and small grain predominate as the prin- cipal basis of the farming system, it is customary in most districts for the tenant furnishing labor and work stock to pay from one- third to one-half of the grain. The share depends not only on such considerations as the location of the farm, the quality of the land, the character of the improvements, and the amount of pasture and hay land available, but also on the arrangements with respect to furnishing seed, threshing expense, binder twine, and other items.

Farm Ownership and Tenancy. 589
If the landlord pays half of the threshing bill and contributes the seed it is not uncommon for him to receive half the grain. In some sections a rent share of two-fifths is customary. Where land is poor or rainfall scanty, the landlord's share may be" asi little as one-fourth, if he does not furnish the seed grain.
Although hay is one of the most important crops in the United States, it is commonly not a money crop in most of the important general-farming regions. Where other crops and livestock are the main sources of money income, especially in the region east of the Appalachians, the share tenant may not be required to share the hay unless he sells it. As already noted, however, especially in the Corn Belt, it is frequently customary to pay cash for the hay land while sharing the grain crops. In sections where hay is an important money crop, as in the irrigated districts of the West, a share of the hay up to one-half or more may be paid as rent.
In considerable areas of the Middle Atlantic States the farming system is extremely diversified, involving not only the production of grain and hay and the keeping of livestock, but also the raising of specialty crops such as beans, potatoes, tomatoes, sweet corn, peas, and considerable fruit, as well as dairy and poultry products. Not infrequently the renting contract is expressed in terms of a single fractional share of certain specified crops, such as half, but there is the utmost diversity in the contributions of landlord and tenant with regard to fertilizers, spraying materials, twine, threshing bills, the use of hay and pasture, the landlord's receipt of milk, eggs, vegetables, and many other items.
In fact, various local studies have shown that there is much greater flexibility in share systems of renting than the uniformity of the fractional share customary over wide areas might suggest. This is illustrated by the analysis of the respective contributions of landlords and tenants in the case of 30 farms in Clinton County, Indiana, nearly all rented in 1918 for a half share of the receipts (Table 12). This flexibility is involved in some of the. items of expense or special privileges, and not infrequently is the basis for the free play of bargaining. However, when all allowance is made, custom has undoubtedly prevented that precision of adjustment in the rental contract which is justified by differences in quality of land, proportion of land improved, kind of buildings and other im- provements, the experience and ability of the tenant and other factors.
Relation of Tenure to the Shifting of Farm Operators From Farm to Farm.
Most of the evils attributed to tenancy in the United States are connected in one way and another with the instability of tenant farmers or with their insecurity of tenure.
Extent of Shifting.
It is estimated that in the United States 27 per cent of the tenant farms and 6 per cent of the farms operated by owners changed occupante in 1922 (figs. 72 and 73). The average for all farms

590 Tearhook of the Department of Agriculture, IMS,
FIG. í2.—It is estimated that during the year ended December 1, 1922, 27 per cent ot the tenant farms had changed tenants. It will be noted that th(i proportion was much larger in the South than in the North and was smallest in New England and the W(>st. The proportion may have been somewhat higher than normal in the North (\^ntral and some of the Western States because of the agricultural depression. The map is based on information supplied by about 11,000 crop reporters of the Bureau of Agricultural Economics.
was 19 per cent. The nine States in which more than a fourth of the farms, inchiding those both of owners and tenants, were op- erated by new occupants are all in the South, and the six States in which fewer than 10 per cent of the farms had new occupants are those of the New England group. In most of the Corn Belt and Western States the percentages fall between 10 and 15. Much the same sectional contrasts are reflected in the census statistics of 1910 showing period of occupancy and those of 1920 showing period of operation (figs. 74 and 75).
Fiu. 7H.—In the year ended December 1, 1922, less than one-fourth as many farms changed owners as changed tenants. Undoubtedly the agricultural depression, especially in the northern plains and Rocky Mountain States, caused more sales of farms than usual. Based on reports from about 11,000 crop reporters of the Bureau of Agricultural Economics.

Farm Ownership and Tenancy. 591
TABLE 12.—Variations of the landlorC-tenant contracts on farms rented on shares {mostly half-share crop leases), SO farms, Clinton County, Ind., 1918.
Products or sources of income. Number of cases in which tenants kept ^
None. ttod. ^^o-^t- Ä. ^11.
Crops __ Livestock:
Hogs Horses Cattle Dairy products. Hides Breeding fees. -. Poultry Eggs
3 1
Sheep. Wool-.
Items of capital furnished.
Number of cases in which tenants furnished ^
None. One- third. One-half. Two-
thirds. All.
Real estate: Land Silos Other buildings-
Machinery Livestock:
Hogs Horses-
Work- Other-
Cattle Poultry..
Feed and supplies.__ Cash
30
Number of cases in which tenants paid i •
Costs other than unpaid labor. None. One-
third. One-half. Two- thirds. All.
Taxes: 30 1
Personalty __ 30 Insurance i
19 28
9 1 2 13 Repairs:
Buildings _ _ - Fences Machinery 1 29 Tractor 1
Hired processes requiring power machinery: Baling 1 2
2 4
Clover hulling - 1 3 Corn shreddinc 2
2 3 5
2
7 SÜ0 filling --_ - — 1 1
1
1 Threshing -- - 22
Livestock fees, etc.: Breeding 1 7 Shoeing - 26 Transfer 1
6 Veterinary - ■ 1 1 18 Materials:
Crates, etc - 1 Feed 1
1 1 6
7 11
1 16
5 10 12 Fprtili/ers Fuel for farm __- 4
6 23
Seed . 2 Snrav materials 1
1 3
1
25 Labor:
Machine work _ - , ñ 25
1 Where the proportion is between none and half, it is recorded in the colimin headed " One-third," and where it is between half and all it is recorded in the column headed " Two-thirds." See subsequent foot- notes for details of these cases, , , ^ ,^ ÍX1,
2 One tenant kept one-third of the clover and one-half of other crops; another tenant kept half of the corn and one-third of the hay; and the third tenant kept one-third of all crops.
3 Tenant kept half the corn and three-fifths of the other crops. * Tenant furnished half the feeders and all of the other livestock designated. 5 Some tenants furnished half of the feed raised and all of the purchased feed and some other tenants
ternishecl half of the small grain fed but more than half of the corn.
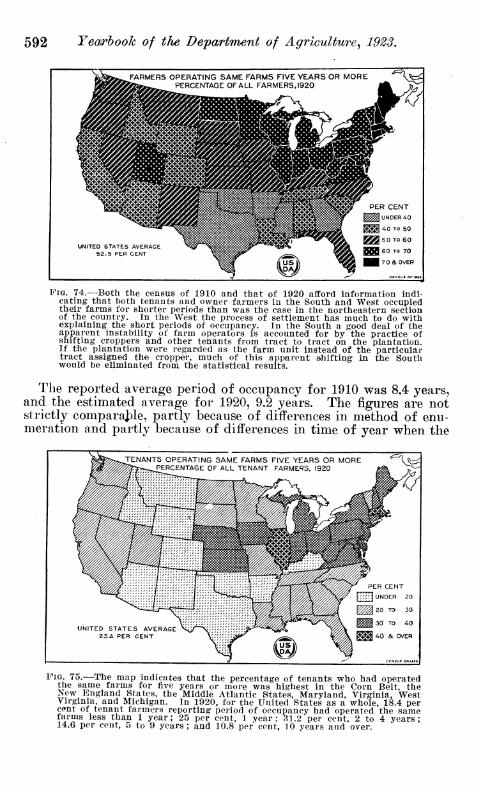
592 Yearbook of the Department of Agriculture^ 192S,
FARMERS OPERATING SAME FARMS FIVE YEARS OR MORE "s^^ PERCENTAGE OF ALL FARMERS, 1920 «^ ^^^
UNITED STATES AVERAGE 52.5 PER CENT
PER CENT
UNDER 40
40 TO 50
5 0 TO 60
60 TO 70
70 a OVER
FIG. 74.—Both the census of 1910 and that of 1920 afford information indi- cating that both tenants and owner farmers in the South and West occupied their farms for shorter periods than was the case in the northeastern section of the country. In the West the process of settlement has much to do with explaining the short periods of occupancy. In the South a good deal of the apparent instability of farm operators is accounted for by the practice of shifting croppers and other tenants from tract to tract on the plantation. If the plantation were regarded as the farm unit instead of the particular tract assigned the cropper, much of this apparent shifting in the South would be eliminated from the statistical results.
The reported average period of occupancy for 1910 was 8.4 years, and the estimated average for 1920, 9.2 years. The figures are not strictly comparaJ:)le, partly because of differences in method of enu- meration and partly because of differences in time of year when the
TENANTS OPERATING SAME FARMS FIVE YEARS OR MORE PERCENTAGE OF ALL TENANT FARMERS. 1920
^
UNITED STATES AVERAGE ESA PER CENT
FIG. 75.—Tlie map indicates that the percentage of tenants who had operated the same farms for five years or more was highest in the Corn Belt, the New England States, the Middle Atlantic States, Maryland, Virginia, West Virginia, and Michigan. In 1920, for the United States as a whole, 18.4 per cent of tenant farmers reporting period of occupancy had operated the same farms less than 1 year; 25 per cent, 1 year; 81.2 per cent, 2 to 4 years; 14.6 per cent, 5 to 9 years; and 10.8 per cent, 10 years and over.

Farm Ownership and Tenancy. 593
respective enumerations were made.^^ In spite of these difficulties of measurement, the conclusion appears to be justified that the average period of occupancy was longer in 1920 than in 1910.
The averages in the preceding discussion refer only to periods of occupancy or operation up to the time the census was taken. Op- erators were due to continue their occupancy for periods ranging from days to decades. The uncompleted periods of occupancy re- ported in the census may have accounted for less than half of the full period of occupancy for the operators in the short-occupancy groups, but probably exceeded half of the full period for operators reporting in the longer-occupancy groups. Owing to the predomi- nance of the latter in the aggregates and averages, it is probable that complete periods of both past and future occupancy were less than twice the terms reported in the census. The estimates of the full average period of occupancy in 1920 might thus be placed between 12 and 14 years instead of 9.2 years.^*
The average number of years of occupancy by farmers reported when the census of 1910 was taken varied widely between tenure classes. The averages for the five tenure classes reported are as follows : Owners free of mortgage, 14 years ; mortgaged owners, 9.2 ; part owners, 8.6; managers, 4.4; cash tenants, 3.8; and share tenants, 2.6. The variations in period of occupancy in different parts of the United States are shown in Figure 76.
Relation of Color to Shifting of Farm Operators.
In 1910, except in the case of owners free of mortgage debt, col- ored farmers had periods of past occupancy exceeding those of white farmers for corresponding tenure classes from a third of a year to a year and a half.^^ Although averages are not available for 1920, approximately similar conclusions are indicated. While the differ- ences in methods of enumeration and in time of year when the enu- meration is made render it very difficult to ascertain whether colored farmers had been in occupancy longer in 1920 than in 1910, the sta- tistics strongly point in that direction in the case of tenants, and less conclusively in the case of owner farmers. The distribution of croppers by periods of occupancy shows a larger proportion in the short periods and a much smaller proportion in the long periods than is the case with other classes of colored share tenants. How- ever, the white croppers reported much shorter average periods of occupancy than the colored croppers.
Causes and Significance of Shifting.
Some of the conditions responsible for the relatively short periods of occupancy of all classes of farmers in the United States, as com-
23 In 1910 the census did not enumerate as farm occupants persons operating farms but not living on them. In 1920 this group, estimated at about 4 per cent of the total number of farm operators, was included. The census of 1910 was taken as of April 15, while the census of 1920 was taken as of January 1, a time when a large proportion of tenants are shifting or just have shifted. The effect was to decrease the proportion of operators in 1920 classed in the group on farms less than one year and to increase the group who had been on their farms for longer periods.
^ In the following references to differences between classes of operators and sections of the country, only the statistics of past occupancy are used.
26 In the case of owners free of mortgage debt it is probable that the relatively shorter period of occupancy for colored farmers is due in part to the large percentage of negro owner farmers who had recently succeeded in achieving farm ownership shortly before the census of 1910.

594 Yearbook of the Department of Agriculture^ 1923,
pared with those of European countries,^^ also account in part for the comparatively short periods of occupancy by tenant farmers in this country. The general causes are given on the following page.
AVERAGE YEARS OF FARM OCCUPANCY, TENANTS COMPARED WITH OWNER FARMERS, CENSUS OF 1910.
TENANT FARMERS gggggga CASH RENTERS V////yA SHARE RENTERS YEARS OF OCCUPANCY
20 15 10 5 0
3.8
2.6
4.7
4.3
AREAS
UNITED STATES
NEW ENGLAND
OWNER FARMERS ■■■i/^/?£'£' OWNERS \tS/^Î^Ê^ MORTGAGED OWNERS
YEARS OF OCCUPANCY 0 5 10 15 20
"^•^ MIDDLE ATLANTIC '^^ 4 3 STATES
^^ EAST NORTH CENTRAL '^^^ 37 STATES 9.9
3.0 WEST NORTH CENTRAL '3^ STATES /^^^^^^^
3 0
Z.9 PACIFIC STATES
6.8 I
MOUNTAIN STATES 1.9 6.6 I
3 9 SOUTHERN STATES '^^ 2 3 WHITE AND COLORED QQ
2 8 SOUTHERN STATES '^'^ 2.0 WHITE 7.6
"^ ® SOUTHERN STATES '^^ o 7 COLORED 102
AVERAGE YEARS TENANTS HAD BEEN ON THE FARMS THEY OCCUPIED
AVERAGE YEARS OWNER .FARMERS WERE ON FARMS THEY OCCUPIED
APRIL 15,19IO
TIG. 76.—In the United States as a whole and in each of the 48 States the average period of occupancy for owner farmers is higher than for tenants. The period for cash tenants is longer than for share tenants, but the differ- ences outside of the South are not very great. The period of occupancy of both owners and tenants is longer in the Northern and Eastern States.than in the West.
26 In some of the countries of central and eastern Europe recent extensive agrarian changes have probably altered considerably the average periods of occupancy.

Farm OwnersMp and Tenancy. 595
(1) The attractiveness of new areas of virgin agricultural land successively made available for development and the habits of migra- tion formed in the process of expansion of an agricultural area across the continent. In some regions these tendencies have been connected with farming practices resulting in soil depletion, thus intensifying the tendency toward migration to regions of virgin soil.
(2) The greater extent to which farm land has been an object of purchase and sale for speculative and investment motives as com- pared with European countries where social and traditional con- siderations and the habits formed by centuries of relatively unchang- ing conditions have caused farms to be looked upon as permanently attached to particular families, whether of large landlords or of peasants.
(3) The rapid industrialization of different parts of the United States, resulting not only in a steady movement of farm population into other industries, but also in constant changes in market oppor- tunities and, therefore, in necessary readjustment in systems of farming and size of farms.
(4) The greater extent to which different tenure groups in this country represent stages in an agricultural ladder than is the case in many European countries.
In short, the great fluidity of American economic and social life is largely responsible for the relative instability of our tenure classes. It should also be noted that this greater fluidity tends to create conditions favorable to its continuance. As contrasted with farmers in European countries where shifts are comparatively infrequent, a farmer in this country who is dissatisfied with the farm he oc- cupies or with the community need not be deterred from moving because of uncertainty of finding another farm available for occu- pancy. Moreover, the shifts themselves may lead to other shifts. The movement of relatives and friends to a district neighborhood may constitute a reason why a particular family will wish to follow them in order to maintain long-established social relations.
Consequently, while some of the shifting in this country is more or less aimless, and some of it largely habitual, much of the fluidity of American farm life represents desirable economic and social read- justments.
Reasons Assigned for Shifts.
The fact that shifting represents economic and social readjust- ments is reflected in the reasons for shifting given by operators themselves, as obtained in certain local surveys made in the South. The number of operators included was 1,093, of whom 882, or 80.7 per cent, had changed farm locations at some time since they began to earn money for themselves. The total number of shifts made was 3,360. The number of reasons reported was 3,528.^^ Some of the classes of reasons given are not mutually exclusive, and some—as, for instance, migration from another section—are not reasons at all. However, the classification of reasons has considerable significance. In thé first place, an overwhelming predominance of economic mo- tives is indicated. In the case of tenants and croppers, progress up the tenure ladder is indicated as a primary reason in nearly 20 per
^^ Local tenure surveys in Kentucky, Tennessee, and Texas, referred to previously.

596 Yearhooh of the Department of Agriculture^ 1923.
cent of the cases. A combination of several classes of replies in- dicates that either partial or complete failure was responsible for moves in at least 14 per cent of the cases for croppers, 9 per cent for tenants,'and 12 per cent for owner farmers. To obtain a farm which was better adapted in size, quality of land, or character of improvements to the requirements of the farmer was a very pre- valent class of reasons, amounting to 25 per cent of the reasons for moves of croppers, 31 per cent for tenants, and 40 per cent for owner farmers.
The greater instability of tenants as compared with owner farmers may be explained as follows:
(1) Since tenancy is an intermediate stage for farmers climbing the ladder, the tenant class is composed partly of laborers or young farmers who have just entered that stage, while tenants are con- stantly terminating their occupancy as tenants in order to ascend into the class of owner farmers.
(2) In the tenant class is included a large proportion of the in- competent, the thriftless, the restless and migratory elements, who are unable to climb to farm ownership or to maintain themselves in that status. Naturally, such elements are characterized by in- stability.
(3) In the case of tenancy two parties have to be satisfied, the tenant and the landowner. The probability that there will be dis- satisfaction on the part of at least one of the parties, and conse- quently termination of the period of occupancy is naturally greater than in the case of owner farmers.
(4) Having a smaller stake in the land, it is easier for tenants than for owner farmers to change to other industries or farms.
Social and Economic Consequences of Shifting.
The evil consequences commonly attributed to the short period of occupancy of tenant farmers are partly social and partly economic. As to the first, it is alleged that tenants remain in the community so short a time that they fail to identify themselves with its social activities and institutions. It should be noted, however, that a ma- jority of the moves made by farmers are from farm to farm within the community and do not necessarily involve breaking their social connections (fig. 77). On the whole, it is probable that to a consider- able extent the shorter periods of occupancy of tenants reduce some- what the degree of social integration in communities where tenants are a large proportion of the farm population.
It is not clear to what extent the relatively more frequent shifts by* tenants are responsible tor undesirable economic consequences. It is observable that in many parts of the country tenant farming is ineflicient and characterized by methods which impair fertility of the soil. Without doubt, where such conditions prevail a large part of the responsibility is attributable to the short periods of occupancy, the uncertainty of the tenant as to his period of occupancy, and the lack of interest which he has in the maintenance of soil fertility. In England, where nearly 90 per cent of all farm operators are tenants, as well as in other European cou^itries, the systems of tenant farming are characterized by a considerable degree of efficiency and perma- nence.

FaTTïi Ownership and Tencmcy, 597
Even the insecurity and short duration of tenant occupancy in America can not be blamed with all the undesirable consequences sometimes associated with tenant farming. Sometimes, inefficient and wasteful systems of farming are characteristic of owner farmers, as well as of tenants, and represent exploitative methods or habits of farming which have grown up by reason of the earlier abundance of virgin land. The fault lies sometimes with the tenant himself and not with the system of tenure; that is, sometimes the tenant is the kind of man who would employ inefficient methods under any system of tenure.
Such conditions can not be removed in great degree by legislation and will be eliminated only through gradual changes in basic eco- nomic conditions and gradual progress in intelligence on the part of
PERCENTAGES OF CASES IN WHICH ESTABLISHED COMMUNITY RELA- TIONSHIPS WERE BROKEN AS A RESULT OF REMOVALS TO OTHER FARMS BY TENANTS AND OWNER FARMERS; SELECTED AREAS IN KENTUCKY AND TENNESSEE, 1919-1920.
PERCENT OF SHIFTS RESULTING INf A CHANGE
70 60 50 A-0 30 20 10
PER CENT OF SHIFTS NOT RESULTING INA CHANGE 10 20 30 4C 50 60 70
TRADING CENTER V/////A3^^////////\//^^^^^
SCHOOL
m
v/////////.w////,^ y///mmm//////^^^^^
CHURCH v///////////H<^y/i^ZL w////A^(i^///////////////////^^^^
_L T Y/////A TENANTS OWNERS
FIG. 77.—From 56 to 67 per cent of the moves made by farmers in the dis- tricts surveyed were within the same community. Owners appear to shift more widely than do tenants, and therefore a larger percentage of the moves by owners result in breaking their established community relations.
certain classes. One of the basic difficulties, the great fluidity of American farm life, is likely to be gradually reduced with the pas- sage of time.
Conclusions.
The preceding discussion has not been directed to the purpose of indicating that tenancy is a superior form of tenure. If this should appear to be the case, it is owing to the necessity of submitting facts to disprove the all too general assumption that tenancy is always, in itself, an inferior and undesirable form, and to attribute to it a great many evil conditions which are really due to other causes. These conditions include unequal distribution of wealth, habits of land exploitation and instability of occupancy largely the outgrowth of the comparative abundance of land resources in our recent past, the persistence in certain sections of a one-crop system of farming, and the personal illiteracy, inexperience, thriftlessness, and inertia

598 Yearbook of the Department of Agriculture^ 1923,
of certain individuals. To assume that some artificial plan for con- verting tenants into landowning farmers would remove all of these conditions is to follow an illusion.
Farm tenancy, considered as a method of acquiring the use of land, is adapted to the special circumstances of a large proportion of farmers, because of their lack of experience and available capital. However, this point of view does not imply that all existing forms of tenancy in this country are ideal, or that a do-nothing policy is justified. In fact, there is need for the development of a positive and constructive policy with respect to American land tenure, a policy that would necessarily involve the cooperation of the Federal Government and the States. Such a policy would not consist of any single panacea, but would involve a number of coordinated measures, which can here be considered only in brief outline.
Facilitating Progress to Farm Ownership.
It would be unfortunate to make the road to farm ownership so easy that farm ownership could be achieved by those who are un- ready. However, it is widely recognized that it would be good public policy to remove unnecessary obstacles to the achievement of ownership by employing methods such as the following:
CREDIT FACILITIES FOR TENANTS.
By reason of its low rate of interest and arrangements for amor- tization the Federal farm loan system is unquestionably of material assistance in facilitating the progress to ownership by tenants and other persons, especially in certain parts of the country. However, there is need for a measure more specifically adapted to the special requirements of tenants in purchasing land. A few States have gone somewhat farther than the Federal Government, but it is probable that comprehensive measures providing for the extension of credit to tenants purchasing farms would be an important phase of a constructive policy for land tenure.
A POLICY OF LAND SETTLEMENT.
Because of the future necessity of expansion in our crop area, a constructive policy of land settlement would go far toward smooth- ing the road to ownership for those attempting to establish them- selves in new regions. Such a policy would involve suitable guid- ance and direction by public authorities and protection against un- wise and ill-considered projects on the part of private land-settle- ment agencies. A constructive policy of land settlement might well involve also measures for the reorganization of agriculture in re- gions where changed economic conditions emphasize the need for extensive readjustments in size of farms, the farming personnel, and the system of farm organization.
STANDARDIZATION OF LAND TITLE^S.
About 19 or 20 States have passed sî)ecial measures for simplify- ing and standardizing land titles and insuring their validity. An extension of such measures to other parts of the country would ren-

Farm Ownership and Tenancy, 599
der somewhat easier the purchase of farm land, especially in the case of small tracts or land of low value.
IMPROVED METHODS OF LAND VALUATION.
No small part of the hazard in purchasing land, or in lending money on land as security, consists in the inadequacy of existing sys- tems of land valuation. Much is still obscure as to the forces that determine the price of farm real estate, but progress is being made through systematic research. In Great Britain and other Euro- pean countries the valuation of farm real estate has become an es- tablished profession for which extensive training of a specialized character is required. The increasing complexity of agricultural economic relations in this country will justify similar measures for standardizing methods and facilities for the valuation of farm real estate.
MODIFYING THE SPECULATIVE ELEMENT IN FABM LAND VALUATIONS.
From time to time there spring up periods of frenzied specula- tion in farm land which are a serious detriment to the agricultural industry. It has been suggested that in part at least a tax on re- sales within a short period after purchase might prevent such mani- festations.
It may also be noted that the practice of making the property tax one of the variable elements in State and local finance serves to in- crease the uncertainty of the purchase of farm land. It has been suggested that if the land tax were transformed into a fixed or cadas- tral levy, with certain special exceptions, and other sources of reve- nue were employed to give elasticity to the fiscal system, the hazards of the farming industry and of farm ownership would be somewhat diminished.
Improvement of the Tenant Contract and the Relations of Landlord and Tenant.
As already indicated, in many parts of the country the prevalence of customary methods of renting has prevented the precision of adjustment in landlord-tenant relations that is desirable under modern competitive conditions. Individual farms and farmers in the same community may differ so greatly that there is need for modifications in existing renting agreements. Careful study of the operations of renting agreements by means of accounting is im- portant, and in some states this is being promoted by experiment stations and extension agencies.
ORGANIZATIONS OF LANDLORDS AND OF TENANTS.
It is probable also that under proper conditions organizations of landlords and of tenants may be beneficial. In the rece.it past a considerable number of such organiz;ations varying widely in char- acter have sprung up in different parts of the United States. These include such widely different types as the following: (1) Local or- ganizations of tenants aiming to compel a reduction of rent by em- ploying the methods of labor unions; (2) counter organizations of landlords; (3) organizations catering to small farmers, especially

600 Farm Ownership and Tenancy.
tenant farmers, and attempting to influence legislation under the impulse of ideals that would be classed as radical; (4) temporary organizations to promote a single piece of legislation; (5) land- lord-tenant conferences for improving the tenant contract.^^
The first four kinds are largety class-conscious in character. The fifth class has been developed mainly in the Corn Belt under the leadership of county agricultural agents. Separate meetings of land- lords and of tenants are held to consider and formulate the points of view of the respective groups. Then one or more joint meetings are held. The general tone of these meetings is that of rational discussion for mutual understanding. It is too early to judge of their merits, but in so far as they can be made to operate in a spirit of mutual fairness, cooperating with public extension agencies in the effort to attain a better understanding of local renting arrange- ments, they may help to focus local public opinion on the problem of improving landlord-tenant relations, particularly in the interest of better systems of farming.
LEGISLATIVE METHODS OF STANDARDIZING AND IMPROVING THE TENANT CONTRACT.
As noted above, the Federal Government, the States and quasi- public institutions are large landlords and the responsibility rests upon them for developing model leasing arrangements for the land they control. However, it may be found desirable to establish by legislation arrangements for guaranteeing to tenants reimbursement for improvements made by them, and for insuring landlords against dilapidations by tenants. It may also be desirable to provide for protecting tenants against arbitrary and unwarranted disturbance as well as to compensate landlords for unwarranted desertion by tenants.
28 The following number of county landlord-tenant conferences were held in the period, 1921-1923 : Illinois, 4 ; Iowa, 20 ; North Dakota, 1 ; Ohio, 1 ; and South Dakota, 4.