Farm Business Survey - Statistical...
38
1 Farm Business Survey - Statistical information Sample representation and design The sample structure of the FBS was re-designed starting from the 2010/11 accounting year. The coverage of the survey is now restricted to those farms which have at least 25,000 Euros of output. The population of farms covered by the survey is stratified for sample selection purposes into 14 farm types and 7 regions. The FBS is based on a uniform sampling rate within each stratum. However, minimum publication thresholds are applied and some farm types are sampled at a higher rate to ensure adequate coverage for analysis. Farms are retained in the sample for several years and only 10% of the sample is replenished each year. Currently, this is achieved by releasing farms when they have been in the survey for 15 years. This, together with natural wastage, generates the required 10% vacancy per year. However, this procedure results in an age bias and is currently under review. For the 2004/05 to 2009/10 accounting years, rather than being defined by standard output, the minimum size for entry to the survey was defined by standard labour requirements. The FBS covered part time and full time farms - it did not cover spare-time farms (<0.5 SLR) or farms with negligible economic activity. For 2003/04 and earlier years the FBS covered all farms that had a minimum size threshold of 8 European size units (ESU) 1 . 1 A European Size Unit (ESU) is a measure of the economic size of a farm business based on the gross margin imputed from standard coefficients for each commodity on the farm. The application of these standard coefficients results in the Standard Gross Margin (SGM) for a farm or group of farms. 1 ESU = 1200 SGM. UK Data Archive Study Number 6967 - Farm Business Survey, 2010-2011
Transcript of Farm Business Survey - Statistical...

1
Farm Business Survey - Statistical information Sample representation and design The sample structure of the FBS was re-designed starting from the 2010/11 accounting year. The coverage of the survey is now restricted to those farms which have at least 25,000 Euros of output. The population of farms covered by the survey is stratified for sample selection purposes into 14 farm types and 7 regions. The FBS is based on a uniform sampling rate within each stratum. However, minimum publication thresholds are applied and some farm types are sampled at a higher rate to ensure adequate coverage for analysis. Farms are retained in the sample for several years and only 10% of the sample is replenished each year. Currently, this is achieved by releasing farms when they have been in the survey for 15 years. This, together with natural wastage, generates the required 10% vacancy per year. However, this procedure results in an age bias and is currently under review. For the 2004/05 to 2009/10 accounting years, rather than being defined by standard output, the minimum size for entry to the survey was defined by standard labour requirements. The FBS covered part time and full time farms - it did not cover spare-time farms (<0.5 SLR) or farms with negligible economic activity. For 2003/04 and earlier years the FBS covered all farms that had a minimum size threshold of 8 European size units (ESU)1.
1 A European Size Unit (ESU) is a measure of the economic size of a farm business based on the gross margin
imputed from standard coefficients for each commodity on the farm. The application of these standard coefficients results in the Standard Gross Margin (SGM) for a farm or group of farms. 1 ESU = 1200 SGM.
UK Data Archive Study Number 6967 - Farm Business Survey, 2010-2011

2
Sample Size From 2010/11, the sample size for the England FBS is 1954 farms.
Farm Type (Standard Output Classification
From 2010/11
Cereals 210
General cropping 168
Specialist fruit 36
Specialist glasshouse 85
Specialist hardy nursery stock 35
Other horticulture 35
Dairy (LFA) 51
Dairy (Lowland) 206
Grazing Livestock (SDA) 168
Grazing Livestock (DA) 56
Grazing Livestock (Lowland) 253
Mixed 162
Specialist Pigs 65
Specialist Poultry 81
EU regional Supplement 260
National Reserve 83
Total 1954
Government Office Region From 2010/11
North East, Yorkshire & the Humber 178
North West 163
East Midlands 163
East of England 182
London & South East 130
West Midlands 122
South West 229
EU regional Supplement 260
National Reserve 83
Total 15102
2The sample numbers for horticulture (specialist fruit, specialist glasshouse, specialist hardy nursery stock and
other horticulture), Dairy (LFA), specialist pigs and specialist poultry are not collected on a regional basis.
Once recruited, farms may stay in the sample for several years (up to 15 years in some cases), so turnover is slow. About 90% of farms remain in the sample each year. So, about 60% of the current sample will have been in the sample for 5 years.

3
Sampling and Recruitment Around 10% of the FBS sample is replaced each year due to the operation of the 15 year rule and natural turnover of the sample. Replacements are selected at random with uniform probability within each design stratum. Replacement addresses are obtained from the June Survey. Although the June Survey register is a register of holdings, these are amalgamated into businesses prior to selecting FBS replacements, using information from the Single Payment Scheme and other sources. The business addresses are then sorted into random order within each design stratum before being despatched to FBS Research Centres. FBS Research Centres recruit replacement farms by systematically working down the address list in the order given. Sampling Errors Results from every sample survey will have a degree of sampling error because only part of the population is being used to estimate the value of a variable. The sampling error is the difference between the estimate derived from a sample survey and the 'true' value that would result if a census of the whole population were taken under the same conditions. Different samples will yield differing estimates for the same observation variable. Sampling error is quite separate from measurement and processing errors and biases due to non-random selection or response. It is a random error arising from random selection of part of the population. It is not meaningful to consider the magnitude of the sampling error for an estimate in the case of a single individual sample, simply because the sample is the result of a random process and hence the sampling error is a random quantity. However, it is possible to know more about the distribution of sampling errors for the totality of possible samples of a given size (the sampling distribution), and hence how increasing or decreasing the sample size for a survey affects the sampling errors. What follows relates to this sampling distribution. For most random sampling methods, the mean of the sampling errors for all possible samples of a given size is zero, which is why it is distinguished from the non-sampling errors referred to above which, in general, have non-zero mean. However, the range of the distribution of sampling errors can be estimated, and it tends to be narrower for larger samples than for smaller ones. In the limiting case, if the sample size is equal to that of the whole population, the sampling error will be zero. The ‘average’ absolute magnitude of sampling errors (across all possible samples of a given size) is generally expressed not in terms of the mean absolute but as the ‘root mean square’ (RMS). The measurement expressed in this form is known as the ‘standard error’ of the observation variable. The general adoption of this measure is due to a curious statistical fact: for large populations, whatever the underlying distribution of the observation variable, the standard error is a simple function S_ √n of just two things the variance (S2) of the observation variable in the population the sample size (n) This formula for the standard error can be estimated (approximately) from sample data. For the FBS the standard errors are calculated using a Taylor Series approximation.

4
Survey results are sometimes presented with estimates of standard errors, or alternatively in terms of confidence intervals. Farm Business Surveys results are presented with 95% confidence intervals. This represents the range of values that may apply to the figures. They mean that we are 95% confident that the true value lies within this range either side of the estimate. They are based on the Standard Errors (SE) multiplied by 1.96 to give the 95% confidence interval (95% CI). In addition confidence indicators may be provided alongside results which are based on the Relative Standard Errors (Standard Error/Estimate). Non Sampling Errors Non-sampling error may be subdivided as follows (see Statistics Canada Power from Data!): Coverage errors Non-response errors Response errors Processing errors Estimation errors Analysis errors Any coverage errors in the FBS must be due mainly to imperfections in the sampling frame (June Survey). Coverage of particular sectors in the sampling frame is a problem, for example potato growers. Minimising response (measurement) errors is the strongest area of quality management for the FBS. Processing errors are regarded as low-risk because of the self-checking nature of much of the farm management account and the high proportion of farms for which between-year checks can be applied. Non Response Although the FBS is designed to impose as little burden as possible on participating farmers, it is seeking sensitive data which some farmers might find intrusive. Before letting anyone trawl through the business accounts and other documents, a farmer needs to be convinced that he/she is getting sufficient in return. The refusal rate is high; around 90% of those approached who are in scope. The potential population of non-respondents may have significantly different characteristics from the potential population of respondents, leading to bias in the estimates of the full population. Calibration weighting (see below) is used to reduce this bias, but is unlikely to completely remove it. A project examining non-response in the FBS is going to be conducted throughout 2012 and early 2013 to examine the characteristics of the non-responders and the responders of the FBS. The outcome of this project will provide a greater understanding of the non-response, which will help inform the weighting model used for the FBS
5
Implementing new farm typology The FBS has adopted a new classification of farm type based on Standard outputs for the 2010/11 accounting years. Please see the UK farm classification document for further information Weighting of the FBS results The weighting of the FBS results is a two stage process with firstly an initial weight being produced and then this initial weight being adjusted via a calibration procedure. The weights are based on population data from the June business register (see section on Sampling and Recruitment) and are calculated for each design stratum. The Initial weights for the FBS are based on the inverse sampling fraction. Suppose for example there were 250 Cereal farms in the population and of these 50 were sampled then these 50 sampled farms would be given an initial sample weight of 5 (250/50). These weights are then adjusted (Calibration Weighting) so that they produce correct population totals for a series of calibration variables for which accurate population values are known from other sources. This ensures that the weights produce precise estimates of other variables, with little bias, despite the inevitable imperfections of the sampling strategy. FBS methodological Review 2010 A statistical review of the FBS was undertaken by Dr James Brown at the University of Southampton in 2010. The review covered 9 topics: sub-sampling, smaller panel, non-response bias, 15 year rule, publication thresholds, year on year comparisons, stratification of survey, calibration weighting and outliers. A report detailing the outcomes and suggested areas of work was produced.
Farm Classification in the United Kingdom Why are farms classified? Farms are classified to allow analysis of the sector. Grouping together similar farms allows comparisons between results for different groups of farms. Classification systems are designed so that the farms in the same group are as similar as possible and farms in different groups are as different as possible. Because it is not practical to examine each farm individually it would be impossible to carry out meaningful analysis of questions like the following without classification:
Is the number of small farms shrinking? How many pig farms are there in the UK? How will small cattle farms be affected by new government policy? Are large farms more profitable?
There are a variety of users who may want to classify farms in order to present results of research or surveys. However, there are two primary users of the UK farm classification system.
The June Agricultural and Horticultural Survey The June Survey collects a snapshot of data on agricultural activity by recording the area of different types of crop and numbers of different types of livestock in June of each year. The farm classification system is then used to present results (published, for example, in Agriculture in the United Kingdom).
The Farm Business Survey (England, Wales and Northern Ireland) and
the Farm Accounts Survey (Scotland) The FBS/FAS collects data on costs, outputs, subsidies and investment from a sample of individual farms across the financial year. The farm classification system is used both to present results and to make sure that the sample is representative of the whole industry and not biased toward a particular type or size of farm.
How does the UK farm classification system work? Two different kinds of classification need to be considered.
A. Classification of Farm Businesses by Type B. This follows the EU algorithm for classifying farm types, further details
of which can be found here. However a slightly different list of farm types is used to reflect UK agriculture (Annex 2)
C. Classification of Farm Businesses by Size This is based on the amount of labour used and is calculated byapplying labour coefficients to enterprises. The EU approach is based on size categories according to standard outputs.
UK Farm Classification Document

A. Classification of Farm Businesses by Type Classification of Farm Businesses by type is a relatively simple process when only one agricultural enterprise type is present on a farm. However, when more than one enterprise type is present (for example both pigs and poultry), a system is needed for deciding how to classify the resulting Farm Business. This means that a system is needed for weighting the relative contributions of different crop or livestock types to the Farm Business as a whole. The UK system is based on weighting contributions by the output associated with them. Standard Outputs (SOs) are calculated per hectare of crops and per head of livestock and used to calculate the standard output associated with each part of the Farm Business. What are SOs and how are they calculated? SOs are representative of the level of output that could be expected on the average farm under “normal” conditions (i.e. no disease outbreaks or adverse weather). Different SOs are calculated for North England, East England, West England, Wales, Scotland and Northern Ireland to allow for the differences in output in different areas. Standard outputs measure the total value of output of any one enterprise - per head for livestock and per hectare for crops. For crops this will be the main product (e.g. wheat, barley, peas) plus any by-product that is sold, for example straw. For livestock it will be the value of the main product (milk, eggs, lamb, pork) plus the value of any secondary product (calf, wool) minus the cost of replacement. Up until 2010, standard gross margins were used for the classification of farms. The difference between standard outputs and standard gross margins is that no variable costs are deducted in the derivation of standard outputs. A Defra note looking at the effects on the population by farm type as a result of the change from SGM’s to SO’s is available here. The SOs now in use are based on a five-year average centred on 2007. SO’s are based on a five-year average in order to lessen the impact of yearly fluctuations on calculated SOs. The 2007 SO’s for England can be seen in Annex 1. Some special rules apply to the use of SOs for particular enterprise types; for England and Wales these rules are also shown in Annex 1.
UK Farm Classification Document

How are Farm Businesses classified into different types? Once the numbers of livestock and hectares of crops have been multiplied by the relevant SOs, a farm is allocated to a type according to where most of its total SO come from. A farm is allocated to a particular type when the contribution of a crop or livestock type (or set of crop and livestock types) comprises more than two-thirds of its total SOs. There are several levels of detail provided for in the classification system; at the simplest and most commonly used level, farms are divided into 10 “robust types” for analysis:
1. Cereals 2. General cropping 3. Horticulture 4. Specialist Pigs 5. Specialist Poultry 6. Dairy 7. LFA Grazing Livestock 8. Lowland Grazing Livestock 9. Mixed 10. Other (including Non-classifiable)
SOs
CATTLE DAIRY
Robust Type: Dairy (>2/3 SOs come from dairy)
PIGS CEREALS
Robust Type: Mixed (neither accounts for >2/3 SOs)
POULTRY SHEEP CATTLE
Robust Type: Lowland Grazing Livestock (Cattle + Sheep > 2/3 SOs) The different Farm Business Types and their characteristics are listed in Annex 2.
UK Farm Classification Document

B. Classification of Farm Businesses by Size For the purpose of classifying Farm Businesses according to size, a different system of combining different enterprise types is used. Enterprise types are added together according to how much labour they use. This means that Farm Business are classified according to whether they are e.g. a one-person Farm Business or a three-person Farm Business. Standard Labour Requirements (SLRs) are calculated for different livestock and crop types, and used to find the total amount of standard labour used on the farm. What are SLRs and how are they calculated? Information on individual labour usage by enterprise on each farm is not always available and could vary across farms, for example depending on the extent to which the farmer chose to substitute machinery for labour. Standard figures for the labour requirements associated with different livestock and crop types are therefore used, on an hours per-head or per-hectare basis. SLRs are representative of labour requirements under typical conditions for enterprises of average size and performance. SLRs are generally standard across the UK, but are 50% higher for field enterprises in Northern Ireland to reflect smaller field size. The SLRs for different enterprise types can be seen in Annex 3. How are Farm Businesses classified into different sizes? Once the total annual SLR figure for an Farm Business has been calculated (by multiplying the numbers of different livestock or numbers of hectares of different crops by the relevant SLR coefficients and then adding the results together), the number of hours can be converted to an equivalent number of full-time workers (on the basis that a full-time worker works a 39 hour week and so 1900 hours a year1). This leads to the classification of farms by number of full-time equivalent (FTE) workers as follows: Very small <0.5 FTE
0.5 < 1 FTE Spare time Part time
Small 1 < 2 FTE Full time Medium 2 < 3 FTE Full time Large 3 < 5 FTE Full time Very large >= 5 FTE Full time The Very Small category is further classified into Spare Time Farm Businesses (<0.5 FTE) and Part Time Farm Businesses (0.5 to <1 FTE). All
1 Taken from the rounded average of the basic hours as laid down by the UK Agricultural Wages Boards.
UK Farm Classification Document

the larger classifications represent various sizes of Full Time Farm Businesses. The UK system for classifying Farm Businesses by size using SLRs provides a more intuitive description of farm size, particularly the difference between Full and Part Time Farm Businesses, than the Eurostat system, which uses a method based on SOs.
UK Farm Classification Document

Annex 1: 2007 SOs for England1
EC Structure Survey Heading
England June 2010 Survey
of Agriculture Form Items
Farm Business Survey Form Items North East West
B_1_1_1 Common wheat and spelt A1 C(1 to 3) 1216.73 1187.16 1166.63
B_1_1_2 Durum wheat Included in A1 C(4) 0.00 0.00 0.00 B_1_1_3 Rye A6 C(31) 825.38 825.38 825.38 B_1_1_4 Barley A2 C(11 to 13) 941.85 864.23 922.13 B_1_1_5 Oats A4 C(21 to 23) 912.84 823.61 892.29
B_1_1_6 Grain maize Included in A5, A7 C(52) 0.00 0.00 0.00
B_1_1_99 Other cereals A5, A7 C(5+41) 889.41 889.41 889.41
B_1_2_1 Peas, field beans and sweet lupines
A21, A22 C(61 to 66) 677.89 753.76 594.27
B_1_3 Potatoes A10, A11 C(71 to 74) 5083.96 7297.11 6494.06 B_1_4 Sugar beet A12 C(81) 2105.44 2250.20 2239.32
B_1_5 Fodder roots and brassicas A19 C(400) 258.17 258.17 258.17
B_1_6_2 Hops A28 C(101) 7758.77 7758.77 7758.77 B_1_6_4 Rape and turnip A24, A25 C(91+95 to 97) 976.47 958.78 939.86 B_1_6_5 Sunflower (a) - C(90+92) 482.89 482.89 482.89
B_1_6_7 Linseed (oil flax) A27 C(94) 525.96 525.96 525.96
B_1_6_8 Other oil seed crops A20 C(98) 525.96 525.96 525.96
B_1_6_9 Flax - C(93) 525.96 525.96 525.96 B_1_6_10 Hemp (b) - C(100) 926.32 926.32 926.32
B_1_6_12 Aromatic, medicinal and culinary plants
A35, B15 C(103) 688.77 688.77 688.77
B_1_6_99 Industrial plants not mentioned elsewhere
A34 C(99+107+89) {Types 1 to 4+6} 589.74 589.74 589.74
B_1_7_1_1
Fresh vegetables, melons, strawberries - outdoor - open field (c)
B5+B14+B21+C5 C(131 to 181+217 to 218+231+233 to 235+250 to 264) {Types 1 to 3+6}
2829.37 3699.21 7253.62
B_1_7_1_2
Fresh vegetables, melons, strawberries - outdoor - market gardening (c)
B5+B14+B21+C5 C(109) {Types 4} 8927.81 10902.74 15125.75
B_1_7_2
Fresh vegetables, melons, strawberries - under glass
F1 C(109) {Types 5} 177234.26 177234.26 177234.26
B_1_8_1 Flowers - outdoor D8, D13 C(110+265) {Types 1 to
4+6} 41348.50 41348.50 41348.50
UK Farm Classification Document

B_1_8_2 Flowers - under glass
F2 (If D8+D13 > 0 else goes into B_4_5)
C(110) {Types 5} 404399.83 404399.83 404399.83
B_1_9_1 Forage plants - temporary grass Included in G2 C(402) 153.97 153.97 153.97
B_1_9_2_1
Forage plants - other green fodder - green maize
A23 C(415) 329.86 329.86 329.86
B_1_9_2_2
Forage plants - other green fodder - leguminous plants
A14, A18 - 258.17 258.17 258.17
B_1_9_2_99 Forage plants - other green fodder
- C(400+416+417) 258.17 258.17 258.17
B_1_10 Seeds and seedlings R3 C(104+125+127) 1284.62 1284.62 1284.62
B_1_11 Other arable land crops A31 (C(89+106+107)+C(409)) 688.77 688.77 688.77
B_1_12_1 Fallow land without subsidies
A32 - 0.00 0.00 0.00
B_1_12_2
Fallow land subject to payment of subsidies with no economic use
- C(422 - 421) 0.00 0.00 0.00
B_3_1
Permanent grassland and meadow - pasture and meadow
G1, G2 C(403) 152.04 152.04 152.04
B_3_2
Permanent grassland and meadow - rough grazings
G5 C(404) 1.34 1.34 1.34
B_4_1_1_1 Fruit species of temperate climate zones
C1, C2, C7, C11
C(190 to 205+222+230+236 to 242+246 to 247) {Types 1 to 4}
8795.32 8795.32 8795.32
B_4_1_2 Berry species C5, C6 C(214+219+220+232+244) 22595.63 22595.63 22595.63
B_4_4 Vineyards - total - C(223+245) {Types 1 to 4+6} 6485.86 6485.86 6485.86
B_4_4_2 Vineyards - other wines C10 - 6485.86 6485.86 6485.86
B_4_5 Nurseries D6, D10,and F2/10000 (If D8+D13 = 0)
C(108) {Types 1 to 6} 98617.27 98617.27 98617.27
B_4_7 Permanent crops under glass -
C(190 to 216+219 to 223+230+232+236 to 247) {Types 5}
B_6_1 Mushrooms (d) F11 - 54113.27 54113.27 54113.27 B_6_1_1 Mushrooms (d) - C(126)[22] 7018.65 7018.65 7018.65 C_1 Equidae P90 E(65+84 to 86) 406.55 406.55 406.55
UK Farm Classification Document

C_2_1 Bovine under one year old - total
K201 to K203 E(20+21) 428.70 401.96 400.61
C_2_2 Bovine under 2 years - males K204 E(18) 502.61 426.36 388.09
C_2_3 Bovine under 2 years - females K205, K206 E(19) 485.90 448.77 423.04
C_2_4 Bovine 2 years and older - males
K207 E(3+10+16) 535.46 456.83 387.89
C_2_5 Heifers, 2 years and older K208, K209 E(13+14+17) 479.43 451.58 425.77
C_2_6 Dairy cows K211 E(4) 2285.51 2533.23 2351.05
C_2_99 Bovine 2 years old and over - other cows
K210 E(12) 333.42 320.40 372.51
C_3_1_1 Sheep - breeding females M1, M4, M7 E(29+75) 69.63 80.01 84.06
C_3_1_99 Sheep – others M9, M13, M14, M17 E(28+32+34 to 35) 2.17 2.44 2.01
C_3_2 Goats P91 E(68) 269.78 269.78 269.78
C_3_2_1 Goats - breeding females - E(69) 375.88 375.88 375.88
C_3_2_99 Goats - others - E(71)) 43.32 43.32 43.32
C_4_1 Pigs - piglets under 20 kg L14 E(47) 1.86 1.86 1.86
C_4_2 Pigs - breeding sows over 50 kg L1, L2, L3, L5 E(43+50 to 51) 838.63 727.21 719.65
C_4_99 Pigs - others L4, L9 E(42+44+46) 157.89 157.35 157.38
C_5_1 Poultry – broilers (e) N10 E(57 to 58) 985.68 985.68 985.68
C_5_2 Laying hens (e) N2, N3, N5, N6, N7 E(54 to 55) 1431.91 1390.35 1457.49
C_5_3 Poultry – others (e) N13 to N16 E(59 to 60) 6614.91 6893.21 6368.05
Deer (f) P10 E(67) 269.78 269.78 269.78 The total SO for each farm is calculated by multiplying its crop areas and livestock numbers by the appropriate SO coefficients (given above) and then summing the result for all enterprises on the farm. SO coefficients are expressed in Euros per hectare of crop and per head of livestock with the following exceptions and special rules which are applied in England and Wales: (a) Sunflower In the June Survey this is included in B_1_11. (b) Hemp In the June Survey this is included in B_1_11.
UK Farm Classification Document

(c) Vegetables: B_1_7_1
In the June Survey vegetable crops grown in the open (Survey items B5, B14, B21 and C5) should be divided between headings B_1_7_1_1 (field scale vegetables) and B_1_7_1_2 (market garden scale vegetables) in accordance with the following rules:
(i) Where vegetable crops are grown on a holding with other field crops (defined as crops in regrouping code P1*) they should all be allocated to B_1_7_1_1 (ii) Otherwise they should be allocated to B_1_7_1_2
(d) Mushrooms: B_6_1
The coefficients for mushrooms are applied per area (100 square metres). Care needs to be taken in their application because the areas to which they are applied are recorded in hectares for both the Structure Survey and the FBS. Note also that data for mushrooms are not collected in the June Survey but in the Mushroom Production Survey. This records the annual weight of compost used and the production system employed. These data are then converted in a production area in hectares for Structure Survey purposes using conversion factors, to which the SO for heading B_6_1 is applied. The production area represents the effective growing surface area (beds, trays, bags, blocks or similar) which is/will be used during the year. If it is used more than once the area is still counted once only. In contrast the FBS records the total area of all successive crops (i.e. the basic area multiplied by the number of complete harvests) in square metres to which the SO for heading B_6_1_1 is applied.
(e) Fowls and other poultry: C_5_1, C_5_2 and C_5_3
The coefficients for fowls and other poultry (Survey items N2, N3, N5, N6, N7, N10 and N13 to N16) are applied per 100 birds.
(f) Deer
Deer (Survey item P10) do not form part of the EU typology but for UK purposes are included in regrouping code P4*.
* Regrouping code: see the consolidated version of Commission Decision 85/377/EEC including amendments introduced in Commission Decisions 94/376/EC, 96/393/EC and 99/725/EC, Annex II part C I Codes regrouping several characteristics included in the 1999/2000 Farm Structure Survey.
UK Farm Classification Document
Annex 2: Agricultural Business types Robust Types:
1. Cereals Holdings on which cereals, combinable crops and set aside account for more than two thirds of the total SO and where set aside alone does not account for more than two thirds of the total SO. (Holdings where set aside accounts for more than two thirds of total SO are specialist set aside and are included in “other” below.)
2. General cropping Holdings on which arable crops (including field scale vegetables) account for more than two thirds of their total SO excluding holdings classified as cereals; holdings on which a mixture of arable and horticultural crops account for more than two thirds of their total SO excluding holdings classified as horticulture and holdings on which arable crops account for more than one third of their total SO and no other grouping accounts for more than one third. 3. Horticulture Holdings on which fruit (including vineyards), hardy nursery stock, glasshouse flowers and vegetables, market garden scale vegetables, outdoor bulbs and flowers, and mushrooms account for more than two thirds of their total SO. 4. Specialist Pigs Holdings on which pigs account for more than two thirds of their total SO. 5. Specialist Poultry Holdings on which Poultry account for more than two thirds of their total SO. 6. Dairy Holdings on which dairy cows account for more than two thirds of their total SO.
7. LFA2 Grazing Livestock Holdings on which cattle, sheep and other grazing livestock account for more than two thirds of their total SO except holdings classified as dairy. A holding is classified as a Less Favoured Area (LFA) holding if 50 per cent or more of its total area is in the LFA. Of holdings classified as LFA, those whose LFA land is wholly or mainly (50 per cent or more) in the Severely Disadvantaged Area (SDA) are classified as SDA; those
2 In the European Union, less-favoured area (LFA) is a term used to describe an area with natural handicaps (lack of water, climate, short crop season and tendencies of depopulation), or that is mountainous or hilly, as defined by its altitude and slope.
UK Farm Classification Document

UK Farm Classification Document
whose LFA land is wholly or mainly (more than 50 per cent) in the Disadvantaged Area (DA) are classified as DA.
8. Lowland Grazing Livestock Holdings on which cattle, sheep and other grazing livestock account for more than two thirds of their total SO except holdings classified as dairy. A holding is classified as lowland if less than 50 per cent of its total area is in the LFA. 9. Mixed Holdings in which none of the above categories is responsible for more than 2/3 of SOs. This category includes mixed pigs and poultry farms as well as farms with a mixture of crops and livestock (where neither accounts for more than 2/3 of SOs).
10. Non-classifiable Holdings that fit into none of the above categories. Non classifiable holdings are holdings consisting of fallow or buildings and other areas only, for which no SO coefficients are calculated.

How the robust types break down into main types and EC types
Robust types Main types Constituent EC types
1. Cereals 1 Cereals 151 2. General Cropping 2 General Cropping 161, 162, 163, 166, 613, 614, 615 3. Horticulture 3 Specialist fruit 361 4 Specialist glass 211,212, 213 5 Specialist Hardy Nursery Stock 232,
6 Other horticulture 221, 222, 223, 231, 233, 351, 352, 353, 354, 362, 363, 364, 365, 380, 611, 612, 616
4. Specialist Pigs 7 Specialist pigs 511, 512, 513 5. Specialist Poultry 8 Specialist poultry 521, 522, 523 6. Dairy 9 Dairy (LFA) 450 (LFA) 10 Dairy (lowland) 450 (non-LFA) 7. LFA Grazing Livestock 11 Specialist sheep (SDA) 481 (SDA) 12 Specialist beef (SDA) 460 (SDA) 13 Mixed Grazing Livestock(SDA) 470, 482, 483, 484 (SDA) 14 Various Grazing Livestock (DA) 460, 470, 481, 482, 483, 484 (DA) 8. Lowland Grazing Livestock 15 Various Grazing Livestock (lowland) 460, 470, 481, 482, 483, 484 (Lowland) 9. Mixed 16 Cropping and dairy 831, 832, 17 Cropping, cattle and sheep 833, 834 18 Cropping, pigs and poultry 841 19 Cropping and mixed livestock 842, 843, 844 20 Mixed livestock 530, 731, 732, 741, 742 10. Non Classifiable 25 Non-classifiable holdings 900
UK Farm Classification Document
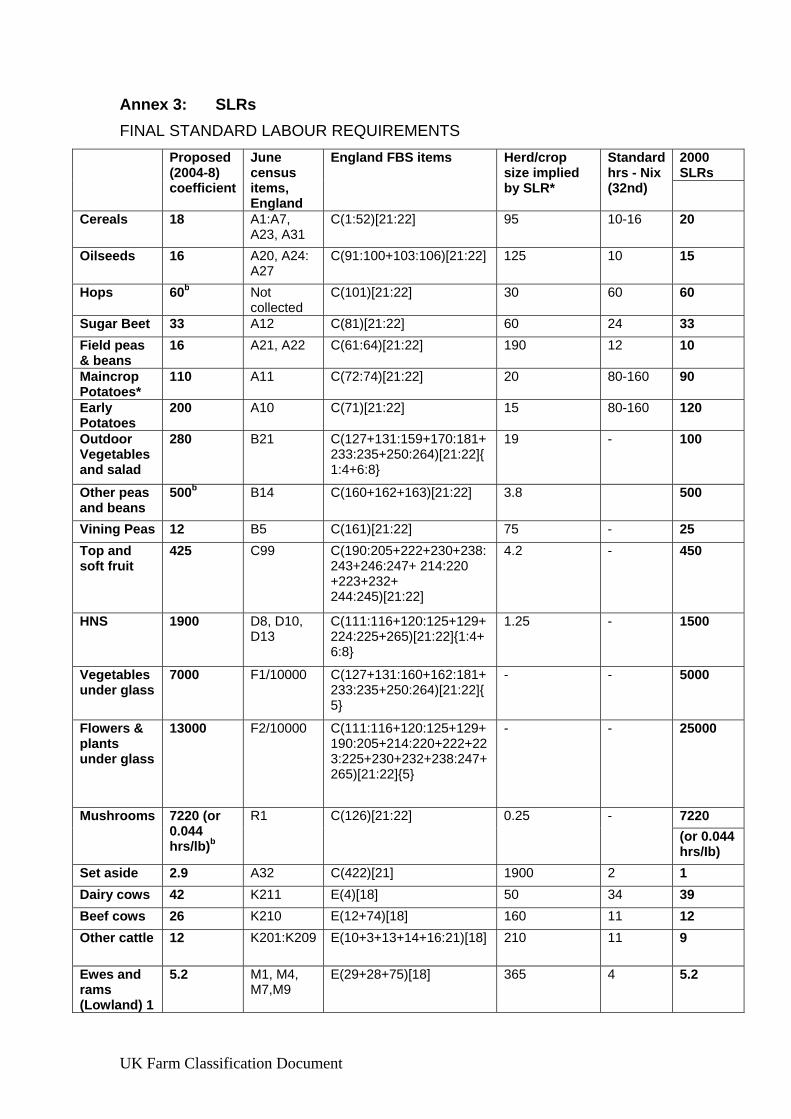
Annex 3: SLRs FINAL STANDARD LABOUR REQUIREMENTS
Proposed (2004-8) coefficient
June census items, England
England FBS items Herd/crop size implied by SLR*
Standard hrs - Nix (32nd)
2000 SLRs
Cereals 18 A1:A7, A23, A31
C(1:52)[21:22] 95 10-16 20
Oilseeds 16 A20, A24: A27
C(91:100+103:106)[21:22] 125 10 15
Hops 60b Not collected
C(101)[21:22] 30 60 60
Sugar Beet 33 A12 C(81)[21:22] 60 24 33 Field peas & beans
16 A21, A22 C(61:64)[21:22] 190 12 10
Maincrop Potatoes*
110 A11 C(72:74)[21:22] 20 80-160 90
Early Potatoes
200 A10 C(71)[21:22] 15 80-160 120
Outdoor Vegetables and salad
280 B21 C(127+131:159+170:181+233:235+250:264)[21:22]{1:4+6:8}
19 - 100
Other peas and beans
500b B14 C(160+162+163)[21:22] 3.8 500
Vining Peas 12 B5 C(161)[21:22] 75 - 25 Top and soft fruit
425 C99 C(190:205+222+230+238:243+246:247+ 214:220 +223+232+ 244:245)[21:22]
4.2 - 450
HNS 1900 D8, D10, D13
C(111:116+120:125+129+224:225+265)[21:22]{1:4+6:8}
1.25 - 1500
Vegetables under glass
7000 F1/10000 C(127+131:160+162:181+233:235+250:264)[21:22]{5}
- - 5000
Flowers & plants under glass
13000 F2/10000 C(111:116+120:125+129+190:205+214:220+222+223:225+230+232+238:247+265)[21:22]{5}
- - 25000
Mushrooms 7220 (or 0.044 hrs/lb)b
R1 C(126)[21:22] 0.25 - 7220 (or 0.044 hrs/Ib)
Set aside 2.9 A32 C(422)[21] 1900 2 1 Dairy cows 42 K211 E(4)[18] 50 34 39 Beef cows 26 K210 E(12+74)[18] 160 11 12 Other cattle 12 K201:K209 E(10+3+13+14+16:21)[18] 210 11 9
Ewes and rams (Lowland) 1
5.2 M1, M4, M7,M9
E(29+28+75)[18] 365 4 5.2
UK Farm Classification Document

UK Farm Classification Document
Ewes and rams (lfa)1
3.7 M1, M4, M7,M9
E(29+28+75)[18] 450 3.2 4.2
Other sheep (Lowland)1
2.9 M13, M14, M17
E(32:36)[18] 575 2.4 3.3
Other sheep (lfa)1
3.1 M13, M14, M17
E(32:36)[18] 730 2.4 2.6
Sows 28 L1:L5 E(43+44)[18] 136 24 14 Finishing & rearing pigs
2.3 L9 E(42+45+46+50+51)[18] 1000 2.4 1.9
Piglets (<20kg)
0.2c L14 E(47)[18} 9500 0.2
Table fowl 0.09 N10 E(57:59)[18] 47500 0.016 0.04 Laying hens
0.36 N3 (N31, N32, N33)
E(54)[18] 11175 0.14-0.48 0.17
Growing pullets
0.24d N5, N6, N7, N2
E(55)[18] 15800 0.04 0.12
Other Poultry
0.10d N13:N16 E(60)[18] 42000 0.045
Fodder crops
6a,b A14, A18, A19
C(400+415:417)[21:22] 315 7 6
Horse 40 P90 E(65)[18] 13 150 Goats 12 P91 (P7,
P12) E(69+71)[18] 95 20
Deer 15b P10 E(67)[18] 125 15 Grassland 3.1a G1, G2 C(402:403+409)[21:22] 475 4 4
Rough grazing
1.5b G5 C(404:407)[21:22] 1265 1.6 1.5
COEFFICIENTS ARE PER HEAD or PER HECTARE PER YEAR *Working year = 1900 hrs. 1 Based on farm type classification – e.g. for LFA Cattle & Sheep farms
the LFA coefficients are applied to all relevant livestock on the farm.
(a) Figure from NIX (b) Based upon previous coefficient (c) Calibrated from previous estimate on the basis of change in Finishing and Rearing Pigs (d) Calibrated from previous estimate on the basis of change in Table Fowl

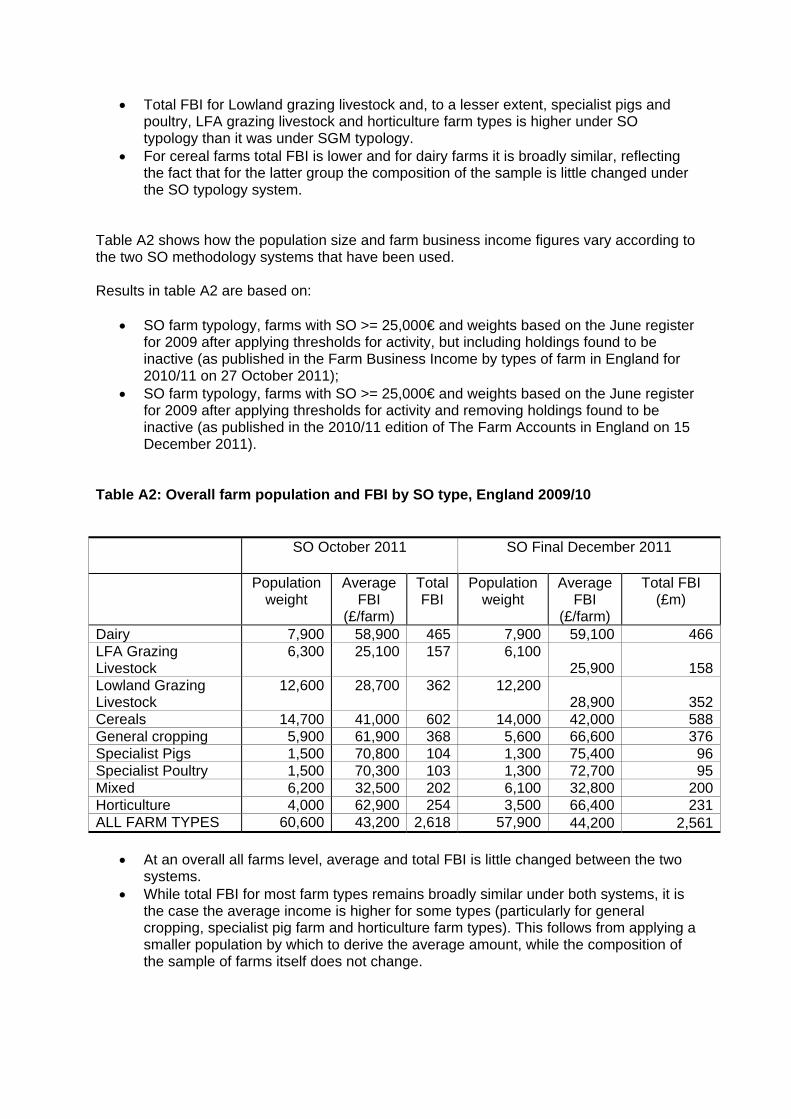
Note on the Revised Classification of Farm Types: Effects on Farm Business Income by farm type results Farm Business Survey, England 2009/10 Background The classification of farms has been revised this year moving from typology based on standard gross margins (SGM) to one based on standard outputs (SO)1 (to bring classification of farms in England in line with the guidelines from Eurostat). In addition, the June Survey for 2010 was carried out on a census basis (the first in 10 years) and prompted a register cleaning exercise that removed holdings found to be inactive. Thresholds for farm activity were also introduced to exclude the smallest farms. Weights used to gross Farm Business Survey (FBS) results up to national level take account of the latest June survey population and the new thresholds that are applied to it, as well as the changes to the classification system, such that results for 2009/10 in the December 2011 edition of Farm Accounts in England (FAE) will not be directly comparable with those published in earlier statistical notices. The revised classification has been backdated for 2009/10 data only, as information for the cleaned register is not available prior to that year. Key points Looking at results according to the final SO typology and weights for 2009 compared to the 2009 SGM typology:
• At an overall all farms level, average and total FBI is slightly higher under the final SO system (Table 1);
• Total FBI for Lowland grazing livestock and, to a lesser extent, specialist pigs and poultry and LFA grazing livestock is higher under this SO typology than it was under SGM typology, as there are more lowland grazing livestock farms under SO typology (Table 1);
• For cereal farms total FBI is lower and for dairy farms it is broadly similar, reflecting the fact that for the latter group the composition of the sample is little changed under the SO typology system (Table 1);
• Looking at unweighted values for total FBI shows that only a small proportion of the FBI accounted for by farms in the FBS is out of scope under the SO typology system (Table 2).
Overview This note looks at the effect on published levels of Farm Business Income (FBI) by farm type for farms taking part in the FBS of:
• implementing the EC’s new methodology for the classification of farm types – using standard outputs (SO) instead of standard gross margins (SGM);
• adopting a threshold of a SO greater than or equal to 25,000 Euros instead of the existing 0.5 Standard Labour Requirement (SLR – half a full-time equivalent);
• recalculating the weights to take account of the above changes to typology and FBS scope; and
• using the latest June Survey population for calculating FBS weights.
1 See UK Farm Classification document found on - http://www.defra.gov.uk/statistics/foodfarm/farmmanage/fbs/aboutfbs/datacollection/

While analysis presented in this note summarises the effect of these changes, caution should be taken in comparing figures by farm type produced according to SGM and SO classifications as it is very difficult to separate the effects of the change in typology, FBS sample composition and weights2. Results The following three tables show the impact of the change in typology that has been used in constructing results for FBS data in 2009/10. Table 1 shows how the population size and farm business income figures vary in 2009/10 depending on the use of SGM and SO methodology. The SO results published in Table 1 are the final results for 2009/10, and can be found in the 2010/11 edition of The Farm Accounts in England (FAE) as published on 15 December 20113. SGM results are those published in FAE 2009/10. Results in table 1 are based on:
• SGM farm typology, farms with SLR >= 0.5 and weights based on the June register for 2009 without removing holdings found to be inactive or applying thresholds for activity;
• SO farm typology, farms with SO >= 25,000€ and weights based on the June register for 2009 after applying thresholds for activity and removing holdings found to be inactive.
Table 1: Overall farm population and FBI by SGM and SO type, England 2009/10
SGM SO
Population weight
Average FBI
(£/farm)
Total FBI
Population weight
Average FBI
(£/farm)
Total FBI (£m)
Dairy 8,300 56,100 468 7,900 59,100 466LFA Grazing Livestock
5,900 22,200 130 6,100 25,900 158
Lowland Grazing Livestock
9,900 22,000 217 12,200 28,900 352
Cereals 13,800 46,000 635 14,000 42,000 588General cropping 6,000 66,000 397 5,600 66,600 376Specialist Pigs 1,000 72,000 70 1,300 75,400 96Specialist Poultry 900 66,400 63 1,300 72,700 95Mixed 5,900 40,100 236 6,100 32,800 200Horticulture 4,500 49,300 220 3,500 66,400 231ALL FARM TYPES 56,100 43,400 2,435 57,900 44,200 2,561
2 An earlier note on the EC’s new methodology and its effect on the farm type classification of agriculture holdings in the June Survey population and farm businesses in FBS in 2009 in England has been published already and is available at - http://www.defra.gov.uk/statistics/foodfarm/landuselivestock/junesurvey/junesurveyresults/ 3 http://www.defra.gov.uk/statistics/foodfarm/farmmanage/fbs/publications/farmaccounts/farm-accounts-2011/

• At an overall all farms level, average and total FBI is slightly higher under this SO system.
• Total FBI for Lowland grazing livestock and, to a lesser extent, specialist pigs and poultry and LFA grazing livestock is higher under this SO typology than it was under SGM typology. As shown in Table C and Chart C in the earlier note on the EC’s new methodology there are more lowland grazing livestock farms under SO typology.
• For cereal farms total FBI is lower and for dairy farms it is broadly similar, reflecting the fact that for the latter group the composition of the sample is little changed under the SO typology system
Table 2 shows total FBI without applying weights under:
• SGM scope (i.e. farms with SLR>=0.5); • SO scope (i.e. farms with SO>=25,000€); • Outside the scope for SGM (i.e. farms with SLR<0.5) and; • Outside scope for SO (i.e. farms with SO<25,000€).
Table 2: Total FBI (unweighted) by stated scope, England 2009/10
Total FBI
SGM scope (i.e. farms with SLR>=0.5)
SO scope (i.e. farms with SO>=25,000€)
Outside SGM scope (i.e. farms with SLR<0.5)
Outside SO scope (i.e. farms with SO<25,000€)
112.9 112.6 0.3 0.6
• Looking at unweighted values for total FBI shows that only a small proportion of the FBI accounted for by farms in the FBS is out of scope under the SO typology system.
Table 3 complements Table C and Chart C in the earlier note on the new methodology for classifying farms (see footnote 2), which showed the distribution of farms in the FBS according to their SGM and SO classification. Table 3 takes this a stage further and shows the distribution of FBI according to SGM and SO typology.

Table 3: Total FBI (£000) by SO and SGM farm type classifications, unweighted, England 2009/10
Standard Output Farm Type Classification Standard Gross Margin Farm Type Classification
Cereals
Dairy
General
cropping
Horticulture
LFA
Grazing
Livestock
Lowland
Grazing
Livestock
Mixed
Specialist
Pigs
Specialist
Poultry
Non FBS types (e.g. specialist horse farms) - - - -
26
698 - - -
Cereals
19,029 -
673 - - -
2,180
39 -
Dairy -
17,771 - -
746
166 - - - General cropping
702 -
15,310
871 -
20
1,845
14 -
Horticulture - - -
18,627 - -
82 - - LFA Grazing Livestock - - - -
7,938 - - - -
Lowland Grazing Livestock - - - - -
6,466
42 - -
Mixed -
916 - -
375
2,455
3,602
1,274
928
Specialist Pigs - - - - - -
14
5,518 - Specialist Poultry - - - - - - - -
4,946
• Looking at unweighted proportions of FBI under SGM typology moving into other
farm types: o For cereal farms around 10% of total FBI has moved into mixed farm types
and around 3% into general cropping; o For general cropping 10% of total FBI has moved into mixed farm types and
4% into cereals; o For mixed farm types 26% of total FBI has moved into lowland grazing
livestock, 13% into specialist pigs and 10% into specialist poultry; o The change in sample composition for other types is less significant, although
it should be noted that some farms previously classified as specialist horse are now found under grazing livestock types.

Appendix: Analysis examining the impact of an intermediate stage to the change to typology The following two tables show the impact of an intermediate stage to the change in typology. Weights used to produce the SO results that were published in the statistical notice on Farm Business Income by types of farm in England for 2010/11 (on 27 October 20114) were based on a different June survey population to the final results found in FAE 2010/11. These weights included the holdings found to be inactive at the June Survey of 2010 (which was carried out on a census basis). As results under the SGM system for 2009/10 were produced before the register clean exercise, this intermediate stage enables some breakdown of the effects of the register cleaning and the effects of the changes to typology and thresholds. Table A1 shows how the population size and farm business income figures vary in 2009/10 depending on the use of SGM and the SO methodology that was applied to the results for the statistical notice on Farm Business Income by types of farm in England for 2010/11. Results in table A1 are based on:
• SGM farm typology, farms with SLR >= 0.5 and weights based on the June register for 2009 without removing holdings found to be inactive or applying thresholds for activity;
• SO farm typology, farms with SO >= 25,000€ and weights based on the June register for 2009 after applying thresholds for activity, but including holdings found to be inactive in the June survey 2010
Table A1: Overall farm population and FBI by SGM and SO type, England 2009/10
SGM SO October 2011
Population weight
Average FBI
(£/farm)
Total FBI (£m)
Population weight
Average FBI
(£/farm)
Total FBI (£m)
Dairy 8,300 56,100 468 7,900 58,900 465LFA Grazing Livestock
5,900 22,200 130 6,300 25,100 157
Lowland Grazing Livestock
9,900 22,000 217 12,600 28,700 362
Cereals 13,800 46,000 635 14,700 41,000 602General cropping 6,000 66,000 397 5,900 61,900 368Specialist Pigs 1,000 72,000 70 1,500 70,800 104Specialist Poultry 900 66,400 63 1,500 70,300 103Mixed 5,900 40,100 236 6,200 32,500 202Horticulture 4,500 49,300 220 4,000 62,900 254ALL FARM TYPES 56,100 43,400 2,435 60,600 43,200 2,618
• At an overall all farms level, average FBI is little changed between the two systems. However, with more farms coming into scope under SO typology and a greater weight applied, total FBI increases by around £180m.
4 http://www.defra.gov.uk/statistics/foodfarm/farmmanage/fbs/publications/fbsincomes/
• Total FBI for Lowland grazing livestock and, to a lesser extent, specialist pigs and poultry, LFA grazing livestock and horticulture farm types is higher under SO typology than it was under SGM typology.
• For cereal farms total FBI is lower and for dairy farms it is broadly similar, reflecting the fact that for the latter group the composition of the sample is little changed under the SO typology system.
Table A2 shows how the population size and farm business income figures vary according to the two SO methodology systems that have been used. Results in table A2 are based on:
• SO farm typology, farms with SO >= 25,000€ and weights based on the June register for 2009 after applying thresholds for activity, but including holdings found to be inactive (as published in the Farm Business Income by types of farm in England for 2010/11 on 27 October 2011);
• SO farm typology, farms with SO >= 25,000€ and weights based on the June register for 2009 after applying thresholds for activity and removing holdings found to be inactive (as published in the 2010/11 edition of The Farm Accounts in England on 15 December 2011).
Table A2: Overall farm population and FBI by SO type, England 2009/10
SO October 2011 SO Final December 2011
Population weight
Average FBI
(£/farm)
Total FBI
Population weight
Average FBI
(£/farm)
Total FBI (£m)
Dairy 7,900 58,900 465 7,900 59,100 466LFA Grazing Livestock
6,300 25,100 157 6,100 25,900 158
Lowland Grazing Livestock
12,600 28,700 362 12,200 28,900 352
Cereals 14,700 41,000 602 14,000 42,000 588General cropping 5,900 61,900 368 5,600 66,600 376Specialist Pigs 1,500 70,800 104 1,300 75,400 96Specialist Poultry 1,500 70,300 103 1,300 72,700 95Mixed 6,200 32,500 202 6,100 32,800 200Horticulture 4,000 62,900 254 3,500 66,400 231ALL FARM TYPES 60,600 43,200 2,618 57,900 44,200 2,561
• At an overall all farms level, average and total FBI is little changed between the two systems.
• While total FBI for most farm types remains broadly similar under both systems, it is the case the average income is higher for some types (particularly for general cropping, specialist pig farm and horticulture farm types). This follows from applying a smaller population by which to derive the average amount, while the composition of the sample of farms itself does not change.

1
Farming Statistics Note on the Revised EC Classification of Farm Types: Effects on the June Survey Population and Farm Business Survey Sample in England Background This document looks at the EC’s new methodology on the classification of farm types using standard outputs (SO) instead of standard gross margins (SGM). It summarises the effect on the farm type classification of agriculture holdings in the June Survey population and farm businesses in the Farm Business Survey (FBS) in 2009 in England. Since 1985, the farm typology of agricultural businesses has been based on SGMs that are calculated taking into account the gross output and the subsidies, as well as certain deductible specific costs. The common agricultural policy has drastically changed over time and the majority of the direct payments have been decoupled. The result of this is that an SGM without subsidies could be negative and therefore cannot be used as a farm type classification criterion. EC Commission Document RI/CC 1500 rev. 2 establishes a new typology for the classification of farm types to be adopted by all member states that provide farm accountancy data to the EC Farm Accountancy Data Network (FADN). Apart from the changes to the coefficients the algorithm for determining the final typology of any given farm has also been modified. Therefore the presentation of results from the June Survey and FBS based on the EC’s standard output typology will reflect different sample’s within the farm types when compared with the SGM typology. This typology will be implemented for the 2010 June Survey of Agriculture and the results of the 2010/11 Farm Business Survey. The devolved UK administrations of Northern Ireland, Scotland and Wales will also adopt the EC’s revised standard output typology in the classification of their census agricultural holdings. Detail The SGM is a financial measure based on the concept of the gross margin for farming enterprises. The gross margin of an enterprise is its total output less the variable costs which are directly attributable to it. Because information on gross margins is not available for each farm, coefficients (standards or norms) are calculated as the average for five years for all of the major enterprises for the three European Community (EC) regions of England (North, East and West) and for Wales, Scotland and Northern Ireland. The total SGM for each farm is calculated by multiplying its crop areas and livestock numbers by the appropriate SGM coefficients and then summing the result for all enterprises on the farm. In the UK, the constant set of 2000 centred SGMs had been used to classify June censuses and the FBS. The 2000 SGMs are an average for the years 1998-2002. Standard outputs measure the total value of the output of any one enterprise – per head for livestock and per hectare for crops. The difference between standard outputs and

2
SGMs is that no input costs are deducted in the derivation of standard outputs. This means that both the absolute and relative values of the coefficients for different enterprises are quite different under standard output typology compared to standard gross margins. In the UK, a constant set of 2007 centred standard outputs will be used to classify farms. The 2007 standard outputs are an average for the years 2005-09. Results from the June Survey and FBS for 2010/11 accounts onwards will be based on standard output typology using 2007 coefficients. As the basis for defining and calculating the type of farm will change from SGM typology to SO typology, it means changes to numbers of farms within farm type categories will invariably occur. This is in addition to any changes in cropping and livestock patterns. With this break in continuity of the typology, any longitudinal analysis covering the 2010/11 transition to SO typology should make note of the change. Main differences in typology algorithms The main differences between the SO typology and SGM typology as implemented in the June Survey of Agriculture Holdings and FBS typologies are: i) The inclusion of “forage and grassland” products in the calculation of the total
standard output; whereas in the SGM typology “forage and grassland” products were excluded in the calculation of the total SGM. In the standard output typology, where a farm business/holding does not have any grazing livestock, forage is considered as being “for sale” and grouped amongst general cropping products. Where a farm business/holding does have grazing livestock, the forage is considered as being “for grazing livestock” and grouped amongst grazing livestock products.
ii) Revised method for the classification of specialist grazing livestock farms under
the SO typology. In particular, the classification of the specialist dairying and specialist cattle farm types has been revised.
iii) The inclusion of specialist horse types amongst the grazing livestock category. This is in accordance with the EC’s farm type classification system for both SGM and standard output typologies. For the June Survey and FBS, specialist horse farms are considered as not being typical of an agricultural enterprise and are excluded from both sources of results. Their inclusion in the grazing livestock classification category is as an obligation to meet the purpose of providing England agricultural holdings and FBS data, as defined by the EC typologies, to the EC commission’s statistic units.
iv) Specialist hardy nursery stock products are re-grouped from permanent crops in
the EC’s SGM typology to horticulture crops in the EC’s standard output typology.
Main outcomes of the SGM and SO typologies

3
Comparative farm type results of the SGM and SO typologies applied to the 2009 June Survey Agricultural Holdings and Farm Business Survey are detailed in the tables and charts that follow. The charts compare the number of farms for each of the typologies for the robust types and main types. Note that these are for illustration only using 2004 standard output coefficients rather than the final 2007 values. The tables show the number of farms under SGM typology listed vertically in bold and the number of farms under SO typology listed horizontally in bold. Thus the change in farm types between the two typologies can be seen in the resulting matrix. 2009 June Survey Agricultural Holdings
Chart A. Comparison of SGM and SO Typology Commercial Holding Numbers by Robust Types
Table A. Robust Farm Type Matrix of the SGM Classification to Standard Output Classification
Chart B. Comparison of SGM and SO Typology Commercial Holding Numbers by Main Types
2216
0
7275
5172
1462
2860
9196
1126
0
2470
2
7397
2711
1
1545
4
2181
1
5250
1742 22
59
8477
1343
9
3618
7
9026
4950
0
5000
10000
15000
20000
25000
30000
35000
40000
Cereals GeneralCropping
Horticulture Specialist Pigs SpecialistPoultry
Dairy LFA GrazingLivestock
LowlandGrazing
Livestock
Mixed Other
Robust Farm Types
No. o
f ho
ldin
gs
SGM Farm TypeClassifications
Standard OutputFarm TypeClassifications
CerealsGeneral
Cropping HorticultureSpecialist
PigsSpecialist
Poultry DairyLFA Grazing
Livestock
Lowland Grazing
Livestock Mixed
Non classifiable
(Other)No. of Holdings 15454 21811 5250 1742 2259 8477 13439 36187 9026 4950
Robut Farm Type No. of Holdings Cereals 22160 15446 2749 22 48 10 0 14 270 3433 168General Cropping 7275 6 5750 541 25 3 0 4 13 932 1Horticulture 5172 1 113 4679 2 1 0 1 17 331 27Specialist Pigs 1462 0 47 0 1292 0 0 2 5 116 0Specialist Poultry 2860 0 566 0 0 2009 0 7 38 240 0Dairy 9196 0 0 0 0 0 8120 362 697 17 0LFA Grazing Livestock 11260 0 8 0 1 0 3 11191 0 57 0Lowland Grazing Livestock 24702 1 37 0 3 0 59 0 24339 263 0Mixed 7397 0 8 8 371 236 295 316 2529 3634 0Other 27111 0 12533 0 0 0 0 1542 8279 3 4754
SGM Farm Type Classifications
Standard Output Farm Type Classifications

4
Table B. Main Farm Type Matrix of the SGM Classification to Standard Output Classification
2216
0
1301
761
748
2362
1462 28
60
1855
7341
3249
1370 22
37
4404
2470
2
536
4291
552
414 16
04
1254
0
9824
232
4515
2181
1
1271
735 1189 20
55
1742 22
59
1500
6977
3113
1383
3358
5585
362
5245
719
902 17
98
0 0 0
4950
7275
1545
4
3618
7
0
5000
10000
15000
20000
25000
30000
35000
40000
Cereals
Genera
l Crop
ping
Specia
list Frui
t
Specia
list G
lass
Specia
list H
ardy N
ursery
Stock
Other H
orticu
lture
Specia
list Pigs
Specia
list Pou
ltry
Dairy (L
FA)
Dairy (L
owlan
d)
Specia
list She
ep (S
DA)
Specia
list Bee
f (SDA)
Mixed G
razing L
ivesto
ck (S
DA)
Variou
s Graz
ing Li
vesto
ck (D
A)
Variou
s Graz
ing Li
vesto
ck (L
owland)
Croppin
g and
Dair
y
Croppin
g, Cattle
and S
hep
Croppin
g, Pigs
and P
oultry
Croppin
g and
Mixe
d Live
stock
Mixed Live
stock
Specia
list G
rass a
nd Fora
ge
Specia
list H
orses
Non Clas
sifiable
: Fall
ow
Non Clas
sifiable
: Othe
r
Main Farm Types
No.
of h
oldi
ngs
SGM Farm TypeClassifications
Standard OutputFarm TypeClassifications
CerealsGeneral
CroppingSpecialist
FruitSpecialist Glass
Specialist Hardy
Nursery Stock
Other Horticulture
Specialist Pigs
Specialist Poultry
Dairy (LFA)
Dairy (Lowland)
Specialist Sheep (SDA)
Specialist Beef (SDA)
Mixed Grazing Livestock
(SDA)
Various Grazing
Livestock (DA)
Various Grazing
Livestock (Lowland)
Cropping and Dairy
Cropping, Cattle and
Sheep
Cropping, Pigs and Poultry
Cropping and Mixed Livestock
Mixed Livestock Unclassifiable
No. of Holdings 15454 21811 1271 735 1189 2055 1742 2259 1500 6977 3113 1383 3358 5585 36187 362 5245 719 902 1798 4950
Main Farm Type No. of Holdings
Cereals 22160 15446 2749 1 0 0 21 48 10 0 0 1 0 3 10 270 84 2977 232 114 26 168General Cropping 7275 6 5750 57 2 16 466 25 3 0 0 1 0 0 3 13 31 514 180 109 98 1Specialist Fruit 1301 0 75 1147 0 0 14 0 0 0 0 0 0 0 0 1 0 0 0 63 1 0Specialist Glass 761 0 0 0 720 0 29 0 0 0 0 0 0 0 0 0 0 0 0 12 0 0Specialist Hardy Nursery Stock 748 0 2 11 0 680 33 0 0 0 0 0 0 0 0 0 0 0 0 22 0 0Other Horticulture 2362 1 36 50 13 493 1489 2 1 0 0 0 0 1 0 16 0 0 0 223 10 27Specialist Pigs 1462 0 47 0 0 0 0 1292 0 0 0 1 0 0 1 5 0 0 31 0 85 0Specialist Poultry 2860 0 566 0 0 0 0 0 2009 0 0 1 0 4 2 38 0 0 172 1 67 0Dairy (LFA) 1855 0 0 0 0 0 0 0 0 1492 0 0 0 167 195 0 0 0 0 0 1 0Dairy (Lowland) 7341 0 0 0 0 0 0 0 0 0 6628 0 0 0 0 697 0 0 0 0 16 0Specialist Sheep (SDA) 3249 0 0 0 0 0 0 0 0 0 0 3019 0 215 0 0 0 0 0 0 15 0Specialist Beef (SDA) 1370 0 0 0 0 0 0 0 0 0 0 0 1283 85 0 0 0 0 0 0 2 0Mixed Grazing Livestock (SDA) 2237 0 4 0 0 0 0 1 0 0 0 57 66 2094 0 0 0 0 0 0 15 0Various Grazing Livestock (DA) 4404 0 4 0 0 0 0 0 0 3 0 0 0 0 4372 0 0 0 0 0 25 0Various Grazing Livestock (Lowland) 24702 1 37 0 0 0 0 3 0 0 59 0 0 0 0 24339 0 0 1 6 256 0Cropping and Dairy 536 0 0 0 0 0 0 0 0 5 278 0 0 1 1 55 181 0 0 4 11 0Cropping, Cattle and Shep 4291 0 0 0 0 0 0 0 0 0 0 23 30 33 154 2065 66 1754 0 40 126 0Cropping, Pigs and Poultry 552 0 2 0 0 0 0 238 130 0 0 0 0 0 0 0 0 0 95 0 87 0Cropping and Mixed Livestock 414 0 1 5 0 0 3 3 2 0 2 1 1 2 8 97 0 0 0 257 32 0Mixed Livestock 1604 0 5 0 0 0 0 130 104 0 10 9 3 18 32 312 0 0 8 51 922 0Specialist Grass and Forage 12540 0 12533 0 0 0 0 0 0 0 0 0 0 0 0 0 0 0 0 0 0 7Specialist Horses 9824 0 0 0 0 0 0 0 0 0 0 0 0 735 807 8279 0 0 0 0 3 0Non Classifiable: Fallow 232 0 0 0 0 0 0 0 0 0 0 0 0 0 0 0 0 0 0 0 0 232Non Classifiable: Other 4515 0 0 0 0 0 0 0 0 0 0 0 0 0 0 0 0 0 0 0 0 4515
Standard Output Farm Type Classifications
SGM Farm Type Classifications
5
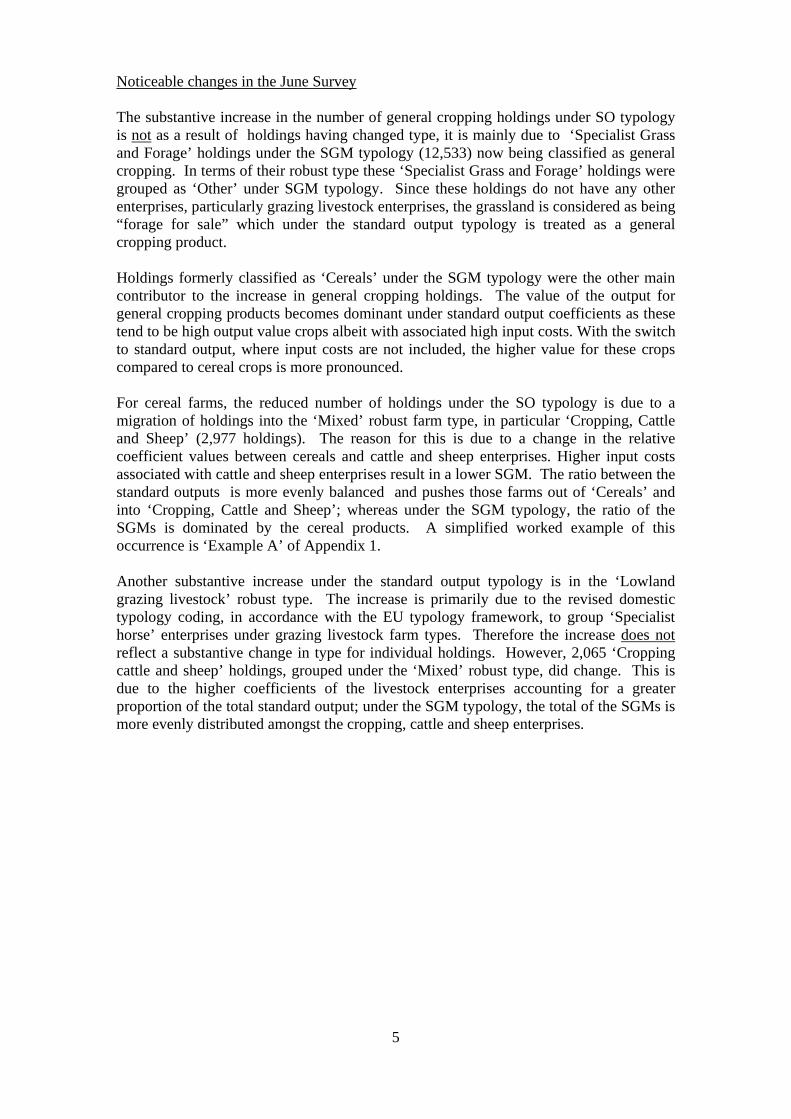
Noticeable changes in the June Survey The substantive increase in the number of general cropping holdings under SO typology is not as a result of holdings having changed type, it is mainly due to ‘Specialist Grass and Forage’ holdings under the SGM typology (12,533) now being classified as general cropping. In terms of their robust type these ‘Specialist Grass and Forage’ holdings were grouped as ‘Other’ under SGM typology. Since these holdings do not have any other enterprises, particularly grazing livestock enterprises, the grassland is considered as being “forage for sale” which under the standard output typology is treated as a general cropping product. Holdings formerly classified as ‘Cereals’ under the SGM typology were the other main contributor to the increase in general cropping holdings. The value of the output for general cropping products becomes dominant under standard output coefficients as these tend to be high output value crops albeit with associated high input costs. With the switch to standard output, where input costs are not included, the higher value for these crops compared to cereal crops is more pronounced. For cereal farms, the reduced number of holdings under the SO typology is due to a migration of holdings into the ‘Mixed’ robust farm type, in particular ‘Cropping, Cattle and Sheep’ (2,977 holdings). The reason for this is due to a change in the relative coefficient values between cereals and cattle and sheep enterprises. Higher input costs associated with cattle and sheep enterprises result in a lower SGM. The ratio between the standard outputs is more evenly balanced and pushes those farms out of ‘Cereals’ and into ‘Cropping, Cattle and Sheep’; whereas under the SGM typology, the ratio of the SGMs is dominated by the cereal products. A simplified worked example of this occurrence is ‘Example A’ of Appendix 1. Another substantive increase under the standard output typology is in the ‘Lowland grazing livestock’ robust type. The increase is primarily due to the revised domestic typology coding, in accordance with the EU typology framework, to group ‘Specialist horse’ enterprises under grazing livestock farm types. Therefore the increase does not reflect a substantive change in type for individual holdings. However, 2,065 ‘Cropping cattle and sheep’ holdings, grouped under the ‘Mixed’ robust type, did change. This is due to the higher coefficients of the livestock enterprises accounting for a greater proportion of the total standard output; under the SGM typology, the total of the SGMs is more evenly distributed amongst the cropping, cattle and sheep enterprises.

6
2009/10 Farm Business Survey
Chart C. Comparison of SGM and SO Typology Farm Numbers by Robust Types Table C. Robust Farm Type Matrix of the SGM Classification (All SLR's) to Standard Output Classification (All SO thresholds)
367
209 21
4
62
72
330
241
235
190
34
259
190
227
7782
328
262
335
194
00
50
100
150
200
250
300
350
400
Cereals General Cropping Horticulture Specialist Pigs Specialist Poultry Dairy LFA GrazingLivestock
Lowland GrazingLivestock
Mixed Other
Robust Types
No.
of f
arm
s
SGM Farm TypeClassifications (AllSLR's)
Standard OutputFarm TypeClassifications (AllSO Thresholds)

7
Chart D. Comparison of SGM and SO Typology Farm Numbers by Main Types
Table D. Main Farm Type Matrix of the SGM Classification (All SLR's) to Standard Output Classification (All SO thresholds)
367
209
42
94
43
35
62
72 76
254
58
34
86
63
235
25
125
20
1
19
0
34
0 0
259
190
44
95
44 44
77 82
64
264
60
38
96
68
11
131
21
7
24
0
335
0
50
100
150
200
250
300
350
400
Cereals
Genera
l Crop
ping
Specia
list Frui
t
Specia
list G
lass
Specia
list H
ardy N
ursery
Stock
Other H
orticu
lture
Specia
list Pigs
Specia
list Pou
ltry
Dairy (L
FA)
Dairy (L
owlan
d)
Specia
list She
ep (S
DA)
Specia
list Bee
f (SDA)
Mixed G
razing L
ivesto
ck (S
DA)
Variou
s Graz
ing Li
vesto
ck (D
A)
Variou
s Graz
ing Li
vesto
ck (L
owland)
Croppin
g and
Dair
y
Croppin
g, Cattle
and S
hep
Croppin
g, Pigs
and P
oultry
Croppin
g and
Mixe
d Live
stock
Mixed Live
stock
Specia
list G
rass a
nd Fora
ge
Specia
list H
orses
Non Clas
sifiable
: Fall
ow
Non Clas
sifiable
: Othe
r
Main Farm Types
No. o
f far
ms
SGM Farm TypeClassifications (AllSLR's)
Standard OutputFarm TypeClassifications (AllSO Thresholds)

8
Noticeable changes in the Farm Business Survey (FBS) The overall trend in the FBS is similar to that seen in the June Survey, although with the FBS comprising a much smaller sample, certain differences do arise. Most notable is the opposite trend in the number of ‘General cropping’ farms as there are no specialist forage farms in the FBS sample. The increase in specialist poultry farms in the standard output typology (82 businesses) compared to the 72 farm businesses in the SGM typology comes mainly from farm businesses that were classified as ‘Cropping, Pigs and Poultry’ (7 businesses). With higher standard output coefficients relative to the cropping enterprises, poultry account for the greater proportion of the total standard output of the farm business which subsequently pushes them into the ‘Specialist Poultry’ farm type classification. Conclusion The main reason for changes occurring to the farm type classification of certain holdings is due to the application of standard outputs, whereby input costs are not deducted, and the relative value of outputs is more pronounced. A full list of the 2004 centred SGMs and 2004 centred standard outputs can be seen in Annex 2. The application of the EC standard output typology results in noticeable changes in sample numbers for cereals, general cropping and grazing livestock categories. For the June Survey, a noticeable reduction is evident in the number of holdings classified as cereals under the standard output typology, with a noticeable migration of cereal holdings into general cropping and mixed. The allocation of a standard output value to grassland and forage has a significant impact, with the most noticeable of increases on the number of holdings classified as general cropping. For the FBS, the opposite is to be seen for the number of general cropping farms, with a decrease in the numbers due to there being no specialist forage farms in the FBS sample coupled with a migration to mainly mixed farms. Despite noticeable changes for certain farm type sample numbers, the majority of holdings remain unchanged when classified under standard output typology, even at the more detailed main farm type level.
Farm Business Survey Farming Statistics Food and Farming Group Defra
9
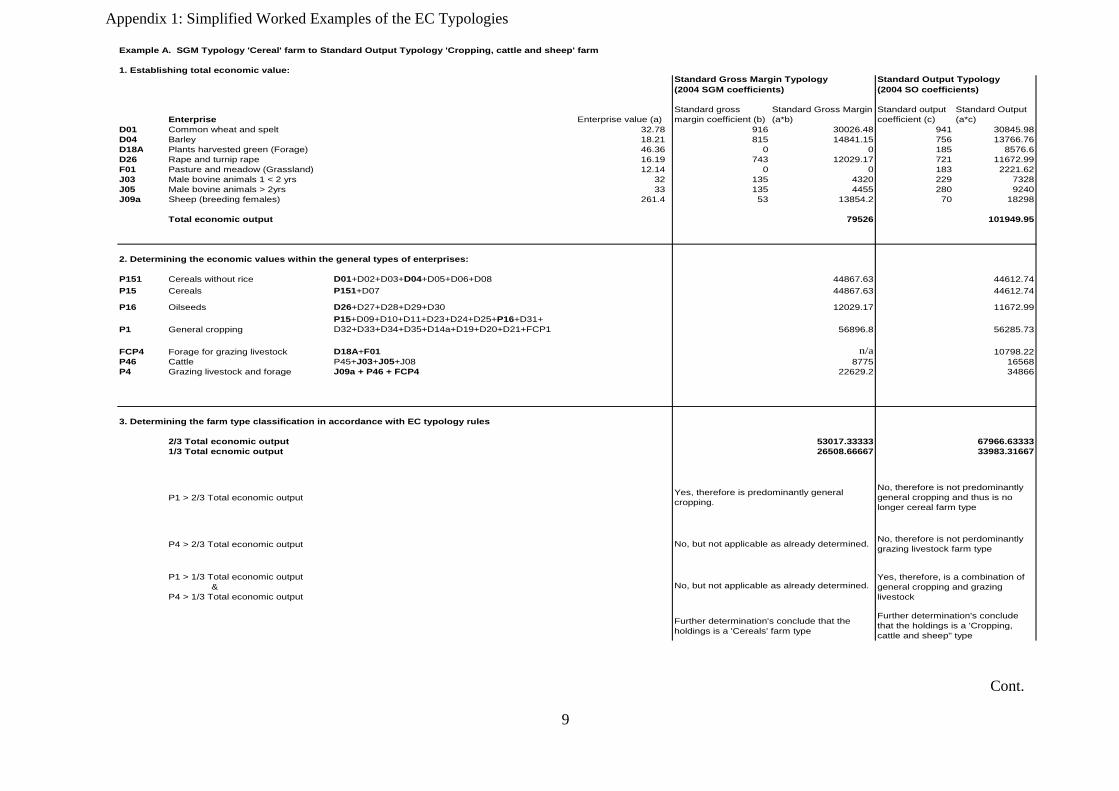
Appendix 1: Simplified Worked Examples of the EC Typologies
Cont.
Example A. SGM Typology 'Cereal' farm to Standard Output Typology 'Cropping, cattle and sheep' farm
1. Establishing total economic value:
Enterprise Enterprise value (a)Standard gross margin coefficient (b)
Standard Gross Margin (a*b)
Standard output coefficient (c)
Standard Output (a*c)
D01 Common wheat and spelt 32.78 916 30026.48 941 30845.98D04 Barley 18.21 815 14841.15 756 13766.76D18A Plants harvested green (Forage) 46.36 0 0 185 8576.6D26 Rape and turnip rape 16.19 743 12029.17 721 11672.99F01 Pasture and meadow (Grassland) 12.14 0 0 183 2221.62J03 Male bovine animals 1 < 2 yrs 32 135 4320 229 7328J05 Male bovine animals > 2yrs 33 135 4455 280 9240J09a Sheep (breeding females) 261.4 53 13854.2 70 18298
Total economic output 79526 101949.95
2. Determining the economic values within the general types of enterprises:
P151 Cereals without rice D01+D02+D03+D04+D05+D06+D08 44867.63 44612.74P15 Cereals P151+D07 44867.63 44612.74
P16 Oilseeds D26+D27+D28+D29+D30 12029.17 11672.99
P1 General croppingP15+D09+D10+D11+D23+D24+D25+P16+D31+D32+D33+D34+D35+D14a+D19+D20+D21+FCP1 56896.8 56285.73
FCP4 Forage for grazing livestock D18A+F01 n/a 10798.22P46 Cattle P45+J03+J05+J08 8775 16568P4 Grazing livestock and forage J09a + P46 + FCP4 22629.2 34866
3. Determining the farm type classification in accordance with EC typology rules
2/3 Total economic output 53017.33333 67966.633331/3 Total ecnomic output 26508.66667 33983.31667
P1 > 2/3 Total economic output
P4 > 2/3 Total economic output
P1 > 1/3 Total economic output &P4 > 1/3 Total economic output
Yes, therefore, is a combination of general cropping and grazing livestock
Further determination's conclude that the holdings is a 'Cropping, cattle and sheep" type
Further determination's conclude that the holdings is a 'Cereals' farm type
Yes, therefore is predominantly general cropping.
No, but not applicable as already determined.
No, but not applicable as already determined.
Standard Output Typology(2004 SO coefficients)
Standard Gross Margin Typology(2004 SGM coefficients)
No, therefore is not predominantly general cropping and thus is no longer cereal farm type
No, therefore is not perdominantly grazing livestock farm type

10
Appendix 1: Simplified Worked Examples of the EC Typologies
Example B. SGM Typology 'Dairy (Lowland)' farm to Standard Output Typology 'Various Grazing Livestock (Lowland)' farm
1. Establishing total economic value:
Enterprise Enterprise value (a)Standard gross margin coefficient (b)
Standard Gross Margin (a*b)
Standard output coefficient (c) Standard Output (a*c)
D04 Barley 14.6 815 11899 756 11037.6D18A Plants harvested green (Forage) 82.63 0 0 185 15286.55F01 Pasture and meadow (Grassland) 24.28 0 0 183 4443.24F02 Rough grazings 28.33 0 0 1 28.33F03 Permanent grassland 12.14 0 0 1 12.14J03 Male bovine animals 1 < 2 yrs 8 135 1080 229 1832J04 Female bovine animals 1 < 2 yrs 8 103 824 250 2000J05 Male bovine animals >= 2yrs 2 135 270 280 560J06 Heiffers >=2yrs 37 129 4773 236 8732J07 Dairy cows 101 1080 109080 1780 179780J08 Other cows 7 321 2247 510 3570J09a Sheep (breeding females) 784 53 41552 70 54880
Total economic output 171725 282161.86
2. Determining the economic values within the general types of enterprises:
P151 Cereals without rice D01+D02+D03+D04+D05+D06+D08 11899 11037.6P15 Cereals P151+D07 11899 11037.6
P1 General croppingP15+D09+D10+D11+D23+D24+D25+P16+D31+D32+D33+D34+D35+D14a+D19+D20+D21+FCP1 11899 11037.6
FCP4 Forage for grazing livestock D18A+F01 n/a 19729.79P45 Cattle (Dairying) J02+J04+J06+J07 114677 190512P46 Cattle P45+J03+J05+J08 118274 196474GL Grazing livestock J01 +P46 +J09a + J09b + J10a + J10b 159826 251354P4 Grazing livestock and forage J09a + P46 + FCP4 159826 271083.79
3. Determining the farm type classification in accordance with EC typology rules
2/3 Total economic output 114483.3333 188107.90671/3 Total ecnomic output 57241.66667 94053.953332/3 Grazing livestock 106550.6667 167569.33333/4 Grazing livestock 119869.5 188515.51/10 Grazing livestock 15982.6 25135.42/3 P46 78849.33333 130982.66671/3 P4 53275.33333 90361.26333
P1 > 2/3 Total economic output
P4 > 2/3 Total economic output
i) P46 > 2/3 Total economic output and J07 > 2/3 P46
ii) J07 > 3/4 Grazing livestock andGrazing livestock > 1/3 P4
P46 > 2/3 Grazing livestock and J07 <= 1/10 Grazing livestock andGrazing livestock > 1/3 P4
No, therefore is not predominantly general cropping.No, therefore is not predominantly general cropping.
Yes, therefore is perdominantly grazing livestock farm type
Yes, therefore is perdominantly grazing livestock farm type
P46 > 2/3 Grazing livestock and J07 > 1/10 Grazing livestock andGrazing livestock > 1/3 P4
In this determination there is a difference in the two typologies that affects the farm type classification:'i) is the SGM determination; ii) is the standard output determination
Standard Gross Margin Typology(2004 SGM coefficients)
Standard Output Typology(2004 SO coefficients)
The outcome of this determination is false as the second test is not met, therefore this is neither a specialist cattle nor dairying farm type.
i) The outcome of this determination is true, therefore this is predominantly specialist dairying.
ii) The outcome of this determination is false as the first test is not met, therefore this is not predominantly specialist dairying
The outcome of this determination is true as all conditions are met, therefore this is determined as being a combination of dairying, rearing and fattening cattle and is grouped amongst the 'Various grazing livestock' farm type.

11
Appendix 2: 2004 SGM and Standard Output Coefficients
Cont.
North 2004 SGM (Euros) 2004 Standard Output (Euros)D01 ha Common wheat and spelt 916 941D02 ha Durum wheat 0 0D03 ha Rye 726 679D04 ha Barley 815 756D05 ha Oats 932 834D06 ha Grain maize 0 0D07 ha Rice 0 0D08 ha Other cereals for the production of grain 981 893D09 ha Protein crops for the production of grain (including seed and mixtures of cereals and pulses) 799 613D09E_1 ha Peas, field beans and sweet lupines 799 613D09F ha Lentils, chick peas and vetches 0 0D09G ha Other protein crops harvested dry 799 613D10 ha Potatoes (including early potatoes and seed potatoes) 4059 5730D11 ha Sugar beet (excluding seeds) 1365 2069D12 ha Fodder roots and brassicas (excluding seeds) 0 220D14A ha Open field 3256 4899D14B ha Market gardening 6013 8865D15 ha Under glass or other (accessible) protective cover 256804 423246D16 ha Outdoor or under low (not accessible) protective cover 5172 7388D17 ha Under glass or other (accessible) protective cover 357140 680011D18 ha Forage plants : 0 0D18A ha Temporary grass 0 185D18B ha Other green fodder 0 0D18B1 ha Green maize (maize for silage) 0 307D18B2_3 ha Other forage plants 0 220D19 ha Arable land seeds and seedlings (excluding cereals, dried vegetables, potatoes and oil-seed plants) 1100 1385D20 ha Other arable land crops 640 908D21 ha Fallow land without any subsidies 0 0D22 ha Fallow land subject to set-aside incentive schemes with no economic use 333 4D23 ha Tobacco 0 0D24 ha Hops 4444 6624D25 ha Cotton 0 0D26 ha Rape and turnip rape 743 721D27 ha Sunflower 447 432D28 ha Soya 0 0D29 ha Linseed (oil flax) 542 439D30 ha Other oil seed crops 0 0D31 ha Flax 542 439D32 ha Hemp 0 0D33 ha Other textile crops 0 0D34 ha Aromatic plants, medicinal and culinary plants 0 908D35 ha Industrial plants, not mentioned elsewhere 0 0E ha Kitchen gardens 0 0F01 ha Pasture and meadow, excluding rough grazings 0 183F02 ha Rough grazings 0 1F03 ha Permanent grassland and meadows no longer used for production purposes and eligible for the payment of su 0 1G01 ha Fruit and berry plantations 0 10939G01A ha Fresh fruit and berry species of temperate climate zones( ) 7756 10939G01B ha Fruit and berry species of subtropical climate zones 0 0G01C ha Nuts 0 0G02 ha Citrus plantations 0 0G03 ha Olive plantations 0 0G03A ha Normally producing table olives 0 0G03B ha Normally producing olives for oil production 0 0G04 ha Vineyards 2244 3611G04A ha Quality wine 0 0G04B ha Other wines 2244 0G04C ha Table grapes 0 0G04D ha Raisins 0 0G05 ha Nurseries 47190 72600G06 ha Other permanent crops 0 0G07 ha Permanent crops under glass 0 0I02 100 m2 Mushrooms 27612 45192R139 harvest/100m2 Mushrooms 3581 5861J01 head Equidae 332 1366J02 head Bovine animals, under one year old, male and female 116 226J03 head Male bovine animals , one but less than two years old 135 229J04 head Female bovine animals , one but less than two years old 103 250J05 head Male bovine animals , two years old and over 135 280J06 head Heifers , two years old and over 129 236J07 head Dairy cows 1080 1780J08 head Other cows 380 (non LFA); 321 (LFA) 510J09 head Sheep (all ages) 0 0J09A head Sheep, breeding females 64 (non LFA); 53 (LFA) 70J09B head Other sheep 1 2J10 head Goats (all ages) 102 224J10A head Goats, breeding females 166 381J10B head Other goats 34 54J11 head Piglets having a live weight of under 20 Kilograms 0 3J12 head Breeding sows weighing 50 Kilograms and over 300 631J13 head Other pigs 44 141J14 100 heads Broilers 177 838J15 100 heads Laying hens 577 1371J16 100 heads Other poultry 2555 5071J16A 100 heads Turkeys 2555 5071J16B 100 heads Ducks 2555 5071J16C 100 heads Geese 0 5071J16D 100 heads Other poultry, not mentioned elsewhere 0 5071J17 head Rabbits, breeding females 0 0J18 hive Bees 0 0

12
Appendix 2: 2004 SGM and Standard Output Coefficients
Cont.
East 2004 SGM (Euros) 2004 Standard Output (Euros)D01 ha Common wheat and spelt 927 940D02 ha Durum wheat 0 0D03 ha Rye 726 679D04 ha Barley 784 719D05 ha Oats 864 762D06 ha Grain maize 0 0D07 ha Rice 0 0D08 ha Other cereals for the production of grain 981 893D09 ha Protein crops for the production of grain (including seed and mixtures of cereals and pulses) 773 588D09E_1 ha Peas, field beans and sweet lupines 773 588D09F ha Lentils, chick peas and vetches 0 0D09G ha Other protein crops harvested dry 773 588D10 ha Potatoes (including early potatoes and seed potatoes) 5956 8003D11 ha Sugar beet (excluding seeds) 1695 2344D12 ha Fodder roots and brassicas (excluding seeds) 0 220D14A ha Open field 3250 5097D14B ha Market gardening 5768 8718D15 ha Under glass or other (accessible) protective cover 256804 423246D16 ha Outdoor or under low (not accessible) protective cover 5172 7388D17 ha Under glass or other (accessible) protective cover 357140 680011D18 ha Forage plants : 0 0D18A ha Temporary grass 0 185D18B ha Other green fodder 0 0D18B1 ha Green maize (maize for silage) 0 307D18B2_3 ha Other forage plants 0 220D19 ha Arable land seeds and seedlings (excluding cereals, dried vegetables, potatoes and oil-seed plants) 1100 1385D20 ha Other arable land crops 640 908D21 ha Fallow land without any subsidies 0 0D22 ha Fallow land subject to set-aside incentive schemes with no economic use 337 4D23 ha Tobacco 0 0D24 ha Hops 4444 6624D25 ha Cotton 0 0D26 ha Rape and turnip rape 745 720D27 ha Sunflower 447 432D28 ha Soya 0 0D29 ha Linseed (oil flax) 566 448D30 ha Other oil seed crops 0 0D31 ha Flax 566 448D32 ha Hemp 0 0D33 ha Other textile crops 0 0D34 ha Aromatic plants, medicinal and culinary plants 0 908D35 ha Industrial plants, not mentioned elsewhere 0 0E ha Kitchen gardens 0 0F01 ha Pasture and meadow, excluding rough grazings 0 183F02 ha Rough grazings 0 1F03 ha Permanent grassland and meadows no longer used for production purposes and eligible for the payment of su 0 1G01 ha Fruit and berry plantations 0 9587G01A ha Fresh fruit and berry species of temperate climate zones( ) 5954 9587G01B ha Fruit and berry species of subtropical climate zones 0 0G01C ha Nuts 0 0G02 ha Citrus plantations 0 0G03 ha Olive plantations 0 0G03A ha Normally producing table olives 0 0G03B ha Normally producing olives for oil production 0 0G04 ha Vineyards 2244 3611G04A ha Quality wine 0 0G04B ha Other wines 2244 0G04C ha Table grapes 0 0G04D ha Raisins 0 0G05 ha Nurseries 47190 72600G06 ha Other permanent crops 0 0G07 ha Permanent crops under glass 0 0I02 100 m2 Mushrooms 27612 45192R139 harvest/100m2 Mushrooms 3581 5861J01 head Equidae 332 1366J02 head Bovine animals, under one year old, male and female 117 228J03 head Male bovine animals , one but less than two years old 135 229J04 head Female bovine animals , one but less than two years old 104 218J05 head Male bovine animals , two years old and over 141 224J06 head Heifers , two years old and over 127 203J07 head Dairy cows 1186 1981J08 head Other cows 380 (non LFA); 321 (LFA) 534J09 head Sheep (all ages) 0 0J09A head Sheep, breeding females 62 (non LFA); 53 (LFA) 82J09B head Other sheep 1 2J10 head Goats (all ages) 102 224J10A head Goats, breeding females 166 381J10B head Other goats 34 54J11 head Piglets having a live weight of under 20 Kilograms 0 3J12 head Breeding sows weighing 50 Kilograms and over 312 640J13 head Other pigs 44 141J14 100 heads Broilers 177 838J15 100 heads Laying hens 555 1381J16 100 heads Other poultry 2962 5409J16A 100 heads Turkeys 2962 5409J16B 100 heads Ducks 2962 5409J16C 100 heads Geese 0 5409J16D 100 heads Other poultry, not mentioned elsewhere 0 5409J17 head Rabbits, breeding females 0 0J18 hive Bees 0 0

13
Appendix 2: 2004 SGM and Standard Output Coefficients
West 2004 SGM (Euros) 2004 Standard Output (Euros)D01 ha Common wheat and spelt 885 908D02 ha Durum wheat 0 0D03 ha Rye 726 679D04 ha Barley 776 722D05 ha Oats 874 800D06 ha Grain maize 0 0D07 ha Rice 0 0D08 ha Other cereals for the production of grain 981 893D09 ha Protein crops for the production of grain (including seed and mixtures of cereals and pulses) 738 569D09E_1 ha Peas, field beans and sweet lupines 738 569D09F ha Lentils, chick peas and vetches 0 0D09G ha Other protein crops harvested dry 738 569D10 ha Potatoes (including early potatoes and seed potatoes) 4473 6442D11 ha Sugar beet (excluding seeds) 1202 1896D12 ha Fodder roots and brassicas (excluding seeds) 0 220D14A ha Open field 5538 8448D14B ha Market gardening 7064 10383D15 ha Under glass or other (accessible) protective cover 256804 423246D16 ha Outdoor or under low (not accessible) protective cover 5172 7388D17 ha Under glass or other (accessible) protective cover 357140 680011D18 ha Forage plants : 0 0D18A ha Temporary grass 0 185D18B ha Other green fodder 0 0D18B1 ha Green maize (maize for silage) 0 307D18B2_3 ha Other forage plants 0 220D19 ha Arable land seeds and seedlings (excluding cereals, dried vegetables, potatoes and oil-seed plants) 1100 1385D20 ha Other arable land crops 640 908D21 ha Fallow land without any subsidies 0 0D22 ha Fallow land subject to set-aside incentive schemes with no economic use 332 4D23 ha Tobacco 0 0D24 ha Hops 4444 6624D25 ha Cotton 0 0D26 ha Rape and turnip rape 691 660D27 ha Sunflower 447 432D28 ha Soya 0 0D29 ha Linseed (oil flax) 559 448D30 ha Other oil seed crops 0 0D31 ha Flax 559 448D32 ha Hemp 0 0D33 ha Other textile crops 0 0D34 ha Aromatic plants, medicinal and culinary plants 0 908D35 ha Industrial plants, not mentioned elsewhere 0 0E ha Kitchen gardens 0 0F01 ha Pasture and meadow, excluding rough grazings 0 183F02 ha Rough grazings 0 1F03 ha Permanent grassland and meadows no longer used for production purposes and eligible for the payment of su 0 1G01 ha Fruit and berry plantations 0 8445G01A ha Fresh fruit and berry species of temperate climate zones( ) 5200 8445G01B ha Fruit and berry species of subtropical climate zones 0 0G01C ha Nuts 0 0G02 ha Citrus plantations 0 0G03 ha Olive plantations 0 0G03A ha Normally producing table olives 0 0G03B ha Normally producing olives for oil production 0 0G04 ha Vineyards 224 (non LFA); 0 (LFA) 3611G04A ha Quality wine 0 0G04B ha Other wines 2244 0G04C ha Table grapes 0 0G04D ha Raisins 0 0G05 ha Nurseries 47190 72600G06 ha Other permanent crops 0 0G07 ha Permanent crops under glass 0 0I02 100 m2 Mushrooms 27612 45192R139 harvest/100m2 Mushrooms 3581 5861J01 head Equidae 332 1366J02 head Bovine animals, under one year old, male and female 115 224J03 head Male bovine animals , one but less than two years old 135 229J04 head Female bovine animals , one but less than two years old 103 218J05 head Male bovine animals , two years old and over 142 225J06 head Heifers , two years old and over 127 203J07 head Dairy cows 1191 1885J08 head Other cows 380 (non LFA); 321 (LFA) 524J09 head Sheep (all ages) 0 0J09A head Sheep, breeding females 62 (non LFA); 51 (LFA) 78J09B head Other sheep 1 2J10 head Goats (all ages) 102 224J10A head Goats, breeding females 166 381J10B head Other goats 34 54J11 head Piglets having a live weight of under 20 Kilograms 0 3J12 head Breeding sows weighing 50 Kilograms and over 304 634J13 head Other pigs 43 140J14 100 heads Broilers 177 838J15 100 heads Laying hens 620 1390J16 100 heads Other poultry 2080 4654J16A 100 heads Turkeys 2080 4654J16B 100 heads Ducks 2080 4654J16C 100 heads Geese 0 4654J16D 100 heads Other poultry, not mentioned elsewhere 0 4654J17 head Rabbits, breeding females 0 0J18 hive Bees 0 0