Farm and Non-farm Sector Linkages and Future of Agriculture
23
Ind. Jn. of Agri. Econ. Vol.73, No.1, Jan.-March 2018 Farm and Non-farm Sector Linkages and Future of Agriculture* S. Mahendra Dev † I INTRODUCTION Agriculture development is crucial for raising incomes of population dependent on agriculture and for growth of non-agriculture. There are significant linkages between farm and non-farm sectors. The concept of ‘sectoral linkages’ was first introduced by Hirschman’s (1958) theory of ‘unbalanced growth’. He argued that the expansion of sectors with larger linkage measures can increase growth faster through their interdependence with other sectors than by alternative means. It is also pointed out that agriculture could not become a leading sector due to its weak backward linkages. In contrast to Hirschman’s views, Kalecki (1960) and Kuznets (1968) emphasise that agricultural development is essential for improving industrialisation. Lewis (1954) discusses the role of terms of trade in the context of agriculture- industrial linkages. According to him, increase in terms of trade in agriculture would reduce profits for industry. In contrast, Kaldor (1967) emphasises that rise in terms of trade for agriculture would improve demand for industrialisation. Johsnston and Mellor (1961) and Mellor (1976) discuss the importance of agriculture on non- agricultural sector. Later, studies by Mellor (1976), Liedholm and Kilby (1989), Ranis and Stewart (1993) stressed the importance of rural non-farm sector. Recent book by McMillan et al. (2017) examined structural change and focused on change in terms of shifting from low productive to high productive sectors and change in terms of raising human capital. In the above context, this paper examines farm and non-farm linkages and future of agriculture. The paper is organised as follows. Section II analyses the linkages between farm and non-farm sectors while Section III examines factors determining the linkages and focuses on diversification. Future of agriculture is discussed in Section IV. The Last section lists the issues for further research on farm and non-farm linkages. *Keynote paper presented at the 77th Annual Conference of the Indian Society of Agricultural Economics in College of Post Graduate Studies, Central Agricultural University, Barapani, Meghalaya during October 12-14, 2017. †Direcor and Vice Chancellor, Indira Gandhi Institute of Development Research, Mumbai-400 065.
Transcript of Farm and Non-farm Sector Linkages and Future of Agriculture
Ind. Jn. of Agri. Econ. Vol.73, No.1, Jan.-March 2018
Farm and Non-farm Sector Linkages and Future of Agriculture* S. Mahendra Dev†
I
INTRODUCTION
Agriculture development is crucial for raising incomes of population dependent on agriculture and for growth of non-agriculture. There are significant linkages between farm and non-farm sectors. The concept of ‘sectoral linkages’ was first introduced by Hirschman’s (1958) theory of ‘unbalanced growth’. He argued that the expansion of sectors with larger linkage measures can increase growth faster through their interdependence with other sectors than by alternative means. It is also pointed out that agriculture could not become a leading sector due to its weak backward linkages. In contrast to Hirschman’s views, Kalecki (1960) and Kuznets (1968) emphasise that agricultural development is essential for improving industrialisation. Lewis (1954) discusses the role of terms of trade in the context of agriculture-industrial linkages. According to him, increase in terms of trade in agriculture would reduce profits for industry. In contrast, Kaldor (1967) emphasises that rise in terms of trade for agriculture would improve demand for industrialisation. Johsnston and Mellor (1961) and Mellor (1976) discuss the importance of agriculture on non-agricultural sector. Later, studies by Mellor (1976), Liedholm and Kilby (1989), Ranis and Stewart (1993) stressed the importance of rural non-farm sector. Recent book by McMillan et al. (2017) examined structural change and focused on change in terms of shifting from low productive to high productive sectors and change in terms of raising human capital.
In the above context, this paper examines farm and non-farm linkages and future of agriculture. The paper is organised as follows. Section II analyses the linkages between farm and non-farm sectors while Section III examines factors determining the linkages and focuses on diversification. Future of agriculture is discussed in Section IV. The Last section lists the issues for further research on farm and non-farm linkages.
*Keynote paper presented at the 77th Annual Conference of the Indian Society of Agricultural Economics in College of Post Graduate Studies, Central Agricultural University, Barapani, Meghalaya during October 12-14, 2017.
†Direcor and Vice Chancellor, Indira Gandhi Institute of Development Research, Mumbai-400 065.

FARM AND NON-FARM SECTOR LINKAGES AND FUTURE OF AGRICULTURE 55
II
FARM AND NON-FARM LINKAGES
There are forward and backward linkages between farm and non-farm sectors. Linkages are also divided into production and consumption or supply and demand linkages. In India, there have been several studies which examined linkages between agriculture and non-agriculture including rural non-farm economy. Studies in the 1980s and 1990s reported a weakening linkage of agriculture with the rest of the sectors (Mythili and Harak, 2013). For example, Rangarajan (1982) reported weak demand linkages. Bhattacharya and Rao (1986) showed weak supply linkages. Sastry et al. (2003) revealed that while forward linkages had been declining, backward linkages had become stronger during 1981-82 to 1999-2000. The diversification in agriculture and shift in consumption demand patterns among households triggered a new interest in sectoral linkages. It is known that the service sector’s contribution to overall growth has increased significantly in the last three decades. It would be interesting to note the changes in linkages over time with the increasing role of services.
The growth rates of GDP in different sectors show that agriculture sector recorded a growth rate of 2.2 per cent to 2.8 per cent per annum during the period 1968-69 to 2004-05. Agriculture showed the highest growth rate during the sub-period 2004-05 to 2014-15. Industry and services also registered the highest growth rates during this sub-period. Although there is no perfect correlation between the growth rates of agriculture and non-agriculture, the last sub-period showed that high agriculture growth is associated with high growth rates in industry and services.
TABLE 1. GROWTH RATES OF GDP BY SECTORS
(per cent) Growth rates of GDP Periods (1)
Agriculture (2)
Industry (3)
Services (4)
1960-61 to 68-69 1.04 5.05 5.03 1968-69 to 75-76 2.24 3.92 3.37 1975-76 to 88-89 2.47 5.53 5.40 1988-89 to 95-96 2.76 5.90 6.15 1995-96 to 2004-05 2.28 4.87 7.86 2004-05 to 2014-15 3.72 8.44 8.96
Source: Committee on Doubling Farm Incomes, Government of India (2017).
Generally there are four techniques used for estimating farm and non-farm linkages. These are: (a) input –output method; (b) SAM (social accounting matrix) approach; (c) Computable general equilibrium model; (d) the econometric approach.
Mythili and Harak (2013) examine the linkages using SAM for three periods 1997-98, 2003-04 and 2006-07. Their results show that agriculture is the most influential sector in generating output and income in other sectors and in household income. A unit of exogenous expenditure in the industry and service sectors

INDIAN JOURNAL OF AGRICULTURAL ECONOMICS 56
respectively generated a paltry 0.25 and 0.30 multipliers in the agricultural sector. On the other hand, a unit generated in agricultural sector generated a significant multipliers 0.77 and 0.79 respectively in industry and services. Thus agricultural growth could affect the overall growth inspite of decline in its share in GDP. However, multipliers have declined over time from 1997-98 to 2006-07. It indicates that the economy particularly agriculture, could not take full advantage of the service sector boom.
An RBI study by Kaur et al. (2009) examines inter-sectoral linkages for the period 1968-69 to 2003-04. The estimates are based on input-output tables. The study shows that the use of industrial inputs in agriculture has increased. Over the years, demand for industrial goods arising from agricultural sector has increased more than five folds from 0.087 in 1968-69 to 0.466 in 2003-04. Similarly, a rise in agricultural income has increased the demand for services sector by more than three-folds from 0.035 in 1968-69 to 0.123 in 2003-04.
Parikh et al. (2013) using computable general equilibrium model examine the role of agricultural development in an inclusive and sustainable way at a double digit rate for three decades up to 2039.Their analysis suggests that at least a 4 per cent growth rate of agricultural GDP is needed to support GDP growth rate in excess of 8 per cent. This can be obtained with a slightly optimistic agricultural total factor productivity growth (TFPG) rate of 2 per cent along with development of irrigation potential to 90 million hectares. Raising TFP in agriculture to 3 per cent similar to China level, raises agricultural growth to more than 5 per cent and allows a GDP growth of 10 per cent. Therefore, a double digit growth of GDP requires high agricultural growth. 2.1. Roles of Agriculture and Non-Agriculture in Reducing Poverty
Recently there have been debates on the roles of agriculture and non-agriculture. Some studies showed that non-agriculture and urban growth were important for poverty reduction. Some other studies indicated that agriculture and rural growth were responsible. Recent paper by Datt et al. (2016) showed that during pre-991-period, rural growth was the driver of poverty reduction. However, in the post-1991 period, rural growth though still important, has been displaced by urban growth as the most important contributor to the rapid reduction in poverty even in rural areas. Datt et al.’s study says in the pre 1991 period, two-fifth reduction in poverty was due to agriculture. In the post-1991 period, agriculture contributed only 10 per cent while services 60 per cent and manufacturing 30 per cent contributed for poverty reduction. Dercon (2016) challenged the very notion that agricultural research or agricultural growth reduces poverty. He says poverty did not decline during green revolution time in India. Later decline was due to non-agriculture. On the other hand, World Bank (2008) says that the poverty reducing impact of agriculture is twice to that of non-agriculture. Recently, Gaiha and others examined separate effects of agriculture, rural

FARM AND NON-FARM SECTOR LINKAGES AND FUTURE OF AGRICULTURE 57
non-agricultural, small towns and metropolitan cities (Gaiha, 2016).They found that contrary to the conclusion of Datt et al., agriculture’s contribution to poverty reduction is five times more than the metropolitan cities. This is in contrast to the dominant view that urbanisation is the key to growth and elimination of extreme poverty. This study shows that there is a case for drastic shift away from rural–urban migration and urbanisation as main drivers of elimination of extreme poverty and move towards revival of agriculture in the policy discourse. Parikh et al. (2013) also show that just high GDP growth will not reduce poverty. According to them, inclusive growth scenario with high agricultural growth reduces poverty.
We thus have two views. Some studies say non-agriculture and urban growth are important for reduction in poverty. Some other studies indicate agriculture and rural growth are important. Our view is that we should have a balanced approach towards agriculture, rural non-farm sector and urban growth for raising employment and reducing poverty. But, focusing on agriculture is still important for reduction in poverty as it is the biggest provider of livelihoods and has forward and backward linkages with other sectors. Another linkage is food prices. Low food prices help non-agriculture and urban consumers.
The structure of employment shows some shift to non-agriculture. But, still large numbers are in agriculture. Census 2011 data shows that number of cultivators declined while number of agricultural labourers increased. But overall number of agricultural workers did not decline. Still 54 per cent are in agriculture with absolute number around 263 millions.
III
FACTORS DETERMINING LINKAGES IN AGRICULTURE AND NON-AGRICULTURE
Some of the factors that determine sectoral inter-dependence are agricultural diversification, agro-based industry and retail trade, rural non-farm sector, urbanisation, technological change and globalisation. Issues in each of these factors are examined below.
3.1. Agricultural Diversification
There has been significant diversification in agriculture in both area and value of production. In terms of area, the share of nutri-cereals declined significantly over time (Table 2). The shares of paddy and wheat, oilseeds, fruits and vegetables increased substantially in the last two decades. Diversification in value of production occurred towards fruits and vegetables, livestock and fisheries (Table 3). However, there are significant regional disparities in agricultural diversification.

INDIAN JOURNAL OF AGRICULTURAL ECONOMICS 58
TABLE 2. CROP DIVERSIFICATION (per cent)
Area of share of crops to gross cropped area Crops (1)
1960-61 to 1968-69 (2)
1988-89 to 1995-96 (3)
2004-05 to 2014-15 (4)
Paddy and wheat 31.3 36.1 37.3 Nutri-cereals 25.5 15.3 12.7 Pulses 14.7 12.2 12.2 Oilseeds 9.5 13.4 13.9 Sugar 1.5 1.8 2.3 Cotton and Jute 5.8 4.7 5.9 Condiments and spices 1.0 1.4 1.5 Fruits and vegetables 1.9 3.7 6.5 Other crops 8.8 11.2 8.0
Source: Government of India (2017).
TABLE 3. SHARE IN VALUE OF PRODUCTION (2004-05 PRICES) (per cent)
Crops (1)
1960-61 to 1968-69 (2)
1988-89 to 1995-96 (3)
2004-05 to 2014-15 (4)
Paddy and wheat 18.2 21.8 17.9 Nutri-cereals 6.9 3.9 2.7 Pulses 7.3 4.1 3.0 Oilseeds 7.1 7.8 6.7 Sugar 4.5 4.2 4.5 Cotton and Jute 2.9 2.6 3.3 Condiments and spices 1.7 1.9 2.6 Fruits and vegetables 10.6 14.1 18.8 Floriculture 0.3 0.4 0.9 All crops 77.1 72.2 69.6 Livestock 20.1 23.7 25.8 Fisheries 2.9 4.1 4.6
Source: Government of India (2017).
There has been diversification of Indian diets away from foodgrains to high value products like milk and meat products and vegetables and fruits. The increasing middle-class due to rapid urbanisation, increasing per capita income, increased participation of women in urban jobs and impact of globalisation has been largely responsible for the diet diversification in India. High value products have caught the fancy of the expanding middle class and the result is visible in the growing demand for hi-value processed products. There is growing demand for non-foodgrain items in India. The expenditure elasticity for non-cereal food items is still quite high. It is thrice as high when compared to cereals in the rural areas and over ten times as high in urban areas. Per capita consumption of fruits and vegetables showed the highest growth followed by edible oils. Diversification to high value crops and allied activities is one of the important sources for raising agricultural growth. Since risk is high for diversification, necessary support in infrastructure and marketing are needed. Price policy should also encourage diversification.
The Government wants to have second ‘green revolution’ by diversifying agriculture in crop sector and allied activities. Diversification is unlikely to be a feasible strategy all over the country if it is restricted only to agriculture related

FARM AND NON-FARM SECTOR LINKAGES AND FUTURE OF AGRICULTURE 59
activities like shift from cereals to horticulture crops. The true benefit of diversification will come if more emphasis is given on allied activities like animal husbandry and fisheries. In the triennium ending in 2014-15, the shares in value of output shows that crop sector’s share was 61.3 per cent while livestock’s ‘share was 26.8 per cent. Fisheries and forestry have the shares respectively 4.5 per cent and 7.4 per cent. Value of milk group is more compared to paddy and wheat. Rural women play a significant role in animal husbandry and are directly involved in major operations like feeding, breeding, management and health care. As the ownership of livestock is more evenly distributed with landless labourers, and marginal farmers, the progress in this sector will result in a more balanced development of the rural economy, particularly in the reduction of poverty ratio.
Small farmers have difficulties to access inputs, credit and extension or to market their output. Many institutional innovations are coming up to link small farmers to high value agriculture and help increasing their productivity and marketing. ICT revolution in India is also helping small farmers with information, input supplies and marketing. There is a need to focus on Farmer producer organisation. Integrated farming system approach can cover both farm and non-farm sectors. 3.2. Rural Non-farm Sector
The rural non-farm sector is being increasingly seen as an important sector in development literature. The role of rural non-farm sector is crucial both in generating productive employment and alleviating poverty in rural areas because of the limited capacity of the urban sector and near saturation of employment in agriculture sector. The remarkable success of rural industries in China and other East Asian countries has provided strong evidence of the positive role that this sector can play in generating employment and increasing income levels in rural areas. Therefore, rural non-farm sector needs to be given due importance in development strategy in general and the policies relating to rural development, employment generation, and poverty alleviation.
On rural non-farm sector, we will cover on dimensions, determinants and policies relating to rural non-farm sector and employment.1 Dimensions: All India and States
At the all India level, the share of non-farm sector in rural areas increased from around 19 per cent in 1983 to 36 per cent in 2011-12. The largest increase occurred between 2004-05 and 2011-12. The share of rural non-farm for males in 2011-12 was 40 per cent while for females it was 25 per cent. It means still 75 per cent of females in rural areas are in agriculture. First time there was absolute decline in the number of agricultural workers after 2004-05. The entire growth of employment in rural areas

INDIAN JOURNAL OF AGRICULTURAL ECONOMICS 60
during 2004-05 and 2011-12 was due to non-farm employment. This was an important structural break since 2004-05.
Which sub-sector benefited in the rural non-farm sector? It may be noted that only few sectors benefited in the rural areas. Growth of non-farm sector particularly since 2004-05 concentrated in construction, transport and communications. The share of construction in rural employment increased from 2 per cent in 1983 to 11 per cent in 2011-12. By 2011-12, construction was the largest employer of males and the second largest employer of females in rural non-farm sector after manufacturing. There was only marginal increase in the share of manufacturing for both males and females.
What is the quality of employment in rural non-farm sector? Construction, transport and communication have low productivity. Another way of looking at quality is to look at the shares of casual, self employed and regular workers. The shares show that the share of casual workers increased while those of self employed declined. It is understandable because most of the construction workers are casual labourers. The share of casual workers in the total increased from 23 per cent in 1983 to 27 per cent in 2004-05 but increased sharply to 37 per cent in 2011-12. The share of regular employment declined marginally while self employed share declined sharply.
The trends clearly show that the acceleration in rural non-farm employment growth after 2004-05 was also accompanied by deterioration in the quality because of increasing casualisation. But, still wages in casual workers in non-farm construction may be higher than agricultural workers. This is one of the reasons for faster reduction in poverty.
We all know that new dynamics in rural labour happened with the introduction of MGNREGA. It had positive impact on rural labour relations. They had better bargaining power and rural markets tightened. Rural wages have increased. The construction boom coincided with MGNREGA. There is a debate whether the share of construction in total employment increased sharply due to MGNREGA or due overall growth of 8 to 9 per cent during that time. The employment share of MGNREGA in casual employment is not very high. Therefore, normal growth process could have triggered construction even in rural areas.
Another one is the share of income of rural non-farm sector in total rural income. We do not have estimates from NSS data. NCAER data shows that the share of non-farm sector in total rural income is around 48 per cent. Income share of rural non-farm sector is higher than the share in employment.
Evidence at state level shows that in the early 1990s, states such as Haryana, Punjab, Kerala, Tamil Nadu and West Bengal had high shares in rural non-farm sector. They have benefited from green revolution. On the other hand, low agricultural productivity states such as Madhya Pradesh, Uttar Pradesh, Chhattisgarh, Maharashtra and Karnataka had low shares. But, between 2004-05 and 2011-12, share of non-farm sector increased for most of the states including poorer and low

FARM AND NON-FARM SECTOR LINKAGES AND FUTURE OF AGRICULTURE 61
agricultural productivity states (Himanshu, 2014). This was clearly evident not only in states like Bihar, Assam, Rajasthan but also in Karnataka, Madhya Pradesh, Uttar Pradesh and Jharkhand. In terms of levels in 2011-12, high shares of rural non-farm sector are in Kerala with 71 per cent, Tamil Nadu 52 per cent, West Bengal 48 per cent. Bihar has 34 per cent while Orissa level is 39 per cent. Lowest share is in Chattisgarh at 16 per cent. Even Gujarat had only 26 per cent share of rural non-farm employment. Overall, there seems to be some convergence in the share of non-farm employment across states. Most of the increase in non-farm employment in poorer states could be attributed to casual employment in the absence of agricultural employment opportunities and could be residual in nature. The growth in non-farm diversification in rural India in the last two and half decades has been mainly in the form of casual non-farm employment and in lower developed states. Therefore, one has to worry about the quality of employment generated in this sector.
Social Groups: Among the social groups, who is moving towards non-farm sector? Historically, the disadvantaged sections like SCs/STs have not been able to move away from agriculture. But, in recent years, the rural non-farm sector seems given upward mobility particularly to SCs. There was a 12 percentage point shift away from agricultural labour to casual labour for SCs. Village Studies based on Primary Data2
There are a number of longitudinal village surveys. A recent book by Himanshu et al. (2016b) provides lots of insights on changes in village India. This volume includes village studies from different regions of India. A number of village surveys in Tamil Nadu show increasing importance of rural non-farm employment. For example, three villages in the Kaveri delta show that 69 per cent of agrarian households had at least one member working in the non-farm sector (Himanshu, 2014). They work in construction, garment industry, stone quarrying, gem polishing and trade and services. Most studies suggest a greater degree of mobility among the marginalised communities such as Scheduled Castes (SC).
The story of non-farm diversification in Palanpur, a village in western U.P. is also similar with acceleration in non-farm diversification. Himanshu et al. (2016a) provide an analysis of non-farm income, inequality and mobility in Palanpur. The nature of non-farm diversification has largely been in the casual and self employed category with very little improvement in regular employment. Major sectors that have emerged as the source of employment are marble polishing, small shops and petty trade and construction. Palanpur studies also report the emergence of small towns around the village as major sources of demand for non-agricultural employment. The study also suggests that the non-farm sector appears to be breaking down long standing barriers to mobility among the poorer segments of rural village like Palanpur. However, inequalities in the village have increased over time. Richer

INDIAN JOURNAL OF AGRICULTURAL ECONOMICS 62
houeseholds have also diversified taking advantage of the growing consumer base in neighbouring urban areas.
Village studies by Rodgers et al. (2016) also indicate considerable increase in rural non-farm employment in Bihar villages. Migration also increased significantly in Bihar.
It is true that pattern of non-farm varies across village studies. However, some generalisations can be made (Himanshu, 2014). First, share of non-farm employment and income in villages has increased. Second, most of the rural non-employment created was in self employment and casual. Most of the jobs are in small trade, services and construction with poor working conditions and low productivity. Third, disadvantaged sections like SCs have benefited from the growth in the non-farm sector. Lastly, most of the village studies also showed declining role of agriculture in both income and employment. The growth of non-farm opportunities in nearby towns and cities has been one of the drivers of non-farm activities. Increasing communication and connectivity also led to access of non-farm employment outside village.
Binswanger (2012) also examines agriculture and rural non-farm sector linkages. The new growing rural non-farm dynamic sector has led to a revision of the standard model of structural transformation that equates non-agriculture with urban areas. But, it is a stunted one. Rural non-farm generates few jobs at high wages with job security and benefits. However, rural wages have increased. Rural non-farm self employment has become dynamic with farm households diversifying.
A study by Ritadhi and Gautam (2017) examines the role of agricultural growth in the process of structural transformation. It uses data from 273 districts in India over a 25 year period. The results show that agricultural productivity has a positive and significant impact on the share of rural workers employed in the manufacturing sector for both males and females. The non-farm employment generated is located in unskilled activities, particularly in the food and textiles sectors. Regarding policy implications, the study’s results highlight the poverty alleviating aspect of agricultural productivity. The impact on non-farm employment is restricted to rural workers with low levels of education, highlighting accessibility to a broad range of rural workers. Sustained growth in agricultural productivity can offer an effective pathway for lagging regions to catch up with those which have proceeded to a higher threshold of development. Agriculture productivity thus can lead to convergence across districts for creating rural non-farm employment.
Determinants of Rural Non-Farm Employment
Earlier studies have identified several factors that determine growth in rural non-farm employment. These are: Agricultural growth, commercialisation of agriculture, urbanisation, real wages, and public expenditure.3

FARM AND NON-FARM SECTOR LINKAGES AND FUTURE OF AGRICULTURE 63
There has been a debate whether the diversification has been due to ‘pull factors’ or ‘push factors.’ It is generally believed that if the diversification is due to higher agricultural growth, the pull factors may be operating in the economy.
Mellor (1976) has argued that agricultural growth and consequent commercialisation of agriculture are supposed to generate more non-farm employment through forward and backward linkages between agriculture and non-agriculture.4 We also found, across states, agricultural productivity has positive relationship with rural non-farm employment (Dev, 1993).
On the other hand, if it is distress related diversification, the push factors seem to be more important in explaining the diversification. Vaidyanathan (1986) forwarded the idea of ‘residual sector’ hypothesis. His study has shown a significant relationship between rural non-agricultural sector and unemployment rate across states in India. Due to this result, it was hypothesised that rural non-farm sector may be acting as a residual absorber. But, in a later study, Vaidyanathan (1994) refuted this residual sector argument because real wages were rising in the 1980s in rural areas. Also it has been noted that non-agricultural wages are higher than that for agricultural workers in rural areas (Papola, 1991).
Sen (1998) indicated that public expenditure in rural areas was an important determinant of rural non-farm sector. IFPRI study also showed that investment in infrastructure led to reduction in poverty (Fan and Thorat, 1999).
Most important factors seem to be agricultural productivity and public expenditure even in the post-2004-05 non-farm diversification. The growth of non-farm employment as a response to increasing demand of non-farm goods and services in the fast growing agricultural states is consistent with the changing consumption patterns as incomes rise. Higher growth of real wages, increase in terms of trade for agriculture enhanced incomes in rural areas. Around 4 per cent agricultural growth during 11th Plan and large public expenditure in rural areas created more non-farm sector employment.
Access to Land: Sahu and Verick (2016) show that access to land is an important determinant of diversification to rural non-farm sector. They show inverse relationship between the percentage of rural cultivating households not cultivating any land and proportion of rural non-farm workers across Indian states.
The acceleration in rural non-farm sector employment seems to be driven by factors outside the rural economy. But now there is growing evidence that urban economic growth and the increase in demand for construction and other activities led to creation of jobs in non-farm sector.
We have noted that casualisation has increased in rural non-farm sector. Quality of employment is low. In spite of this, rural poverty declined faster during 2004-05 to 2011-12. What are the reasons for the decline in poverty? One reason is that disadvantaged sections like SCs with high poverty ratios benefited from expansion of non-farm sector. Although SCs and other poor got more casual employment, the wages are generally higher in non-farm casual than agricultural casual labour. There

INDIAN JOURNAL OF AGRICULTURAL ECONOMICS 64
are also indirect effects like tightening of labour market. This led to significant increase real wages and reduction in poverty.
Village studies also show increasing incomes, falling poverty and increasing mobility. However, it also showed increased inequality du to expansion of rural non-farm sector. For example Palanpur study showed increasing inequality between 1983-84 and 2008-09. The increasing inequality was 62 per cent due to non-farm income and 28 per cent due to agricultural income. Inequality increased despite poverty reduction. Policies for Promoting Rural Non-Farm Employment
Rural non-farm sector is heterogeneous. There can’t be one policy package for the entire rural non-farm sector. How to increase pull factors and raise productive employment is an issue
In general, development of manufacturing sector is important for absorbing labour productively. Right now many workers are absorbed in low productive services sector. Encouragement to women and training and improvement in skills would enhance employment opportunities.
Agricultural Growth: Growth in agriculture is important for rural non-farm sector because of forward and backward linkages. Agricultural growth of 4 per cent during 11th Five year plan period improved non-farm employment. Within agriculture and allied activities, there seems to be some diversification towards non-cereal crops. However, risk and uncertainty is associated with diversification. Technology, infrastructure and market have to be improved in order to shift the farmers to non-foodgrain crops. By any standards the unutilised potential of food processing in India is enormous. An expansion of this sector is an ideal way of bringing industry to rural areas, expanding the value chain of agricultural production, providing assured markets for farmers enabling them to diversify into higher value horticultural crops and expanding employment by creating high quality non-agricultural work opportunities in rural areas
Infrastructure Development: Although there is lot of progress, almost all indicators score poorly if one looks at India’s infrastructure particularly compared with countries like China. For example, power shortage is perennial in India. This is one of the single biggest constraints for our growth. Meeting the energy requirements for growth of this magnitude in a sustainable manner presents a major challenge. It is not surprising that the index of infrastructure across states is highly correlated with per capita income and level of poverty.
Taking Advantage of Demographic Dividend: It is known that with demographic dividend, there will be large numbers joining labour force. There has been sluggish progress in education and skill levels of workers. Young population is an asset only if it is educated, skilled and finds productive employment. During the Twelfth Five Year Plan (2012–17), 50 million non-farm employment opportunities are proposed to
FARM AND NON-FARM SECTOR LINKAGES AND FUTURE OF AGRICULTURE 65
be created and at least equivalent number of people would be provided skill certification. There are huge challenges in raising education and skills of workers and population.
In India, education and skills of workers is low although it has been rising over time. in 2011-12, around 78 per cent of rural female, 56 per cent of rural males, are either illiterate or have been educated up to primary level. Only about 5 per cent of rural females and 13 per cent of rural males have education higher secondary and above. Regarding skill development, only 10 per cent of the workforce in the age group of 15-59 years received some form of vocational training in 2009-10.
Reduction in Inequalities: Inequalities in consumption, income and wealth are high in India. Existing inequalities can derail growth and poverty reduction in rural areas. Productive employment for majority can reduce inequalities.
Gender Inequalities: Gender discrimination is another form of labour segmentation. As is well known, the wages of women workers are lower than those of men across most employment categories and locations. There are distinct conventionally earmarked spheres of work for women and the entry of women into most male-dominated occupations is constrained. Conventional women’s work is characterised by lower wages and earnings and limited upward mobility.
Participation rates of women are low and declined in India. Work participation rate for women in India is only 22 per cent compared to 54 per cent for males. In fact in urban areas, only 15 pr cent of women’s participation in work compared to 55 per cent for men. Recently IMF Chief Christine Lagarde said increase in women’s participation rates would increase 40 per cent GDP in India. It is true that increase in women’s participation is important to reduce gender inequalities.
But, women’s ‘work’ and ‘non-work’ may be misleading. Time use surveys indicate women’s unpaid work as home makers and care givers is quite high. Some estimates show that if we monetize unpaid work of women, it amounts to around 16 lakh crores per annum (Nandi and Hensman, 2015).
Both secondary data and village level studies show that the share of rural non-farm sector in total employment has increased significantly while the share of agriculture declined. Disadvantaged sections like SCs benefited from the growth in non-farm sector. Development of communications and transport also facilitated better urban linkages with rural areas. However, the quality of employment generated in rural non-farm sector is a concern as most of the jobs created are casual or self- employed. 3.3 Globalisation and Urbanisation
Globalisation would lead to more specialisation and global price signals as one of the determinants. Foreign investment in agro-processing and retailing would lead to higher incomes and employment. Urbanisation is going to increase significantly. The changing consumption patterns in favour of high value farm output are creating

INDIAN JOURNAL OF AGRICULTURAL ECONOMICS 66
demand in agriculture. The share of high value agriculture is high in peri-urban and urban areas. Urbanisation also led to rise in rural non-farm sectors. 3.4. Technology
With technological change and mechanisation of agriculture, the farm and non-farm linkages may be strengthened. Also usage of modern inputs like HYV seeds, biotechnology, farm chemicals, farm implements, drip and sprinkler irrigation would improve linkages with technology improvement. Significant changes in storage, transportation, communication, trading services would raise inter-sectoral linkages. It would reduce transaction costs in the agricultural supply chain. Information technology also can strengthen the linkages. 3.5. Agro-Processing and Retail Trade
Food and agro processing sector has huge potential for strengthening linkages between farm and non-farm. In India we process only 10 per cent of fruits and vegetables while in many other countries they process 40 to 70 per cent. Several changes have been occurring in value chains in the segments of food processing, cold chains, wholesalers, and logistics and they impact the linkages. Similarly promotion of retail trade and foreign direct investment in this sector will also help promoting linkages. The major change in food value chain is emergence of supermarkets. Rao et al., (2017) examines the impact of supermarket procurement in a semi-arid region from a study of 254 vegetables growers that sell to both super markets and traditional markets. Using different methods to control selection bias showed that there has been a significant and positive impact of participating in super market procurement on income. Small farmers also benefited from the super markets.
3.6. Agricultural Trade, Employment and Linkages with Non-Agriculture
Agriculture and non-agricultural trade have significant links with employment. Veeramani and Dhir, 2017) has done a study on exports and employment. The official input output tables (IOT) are available for selected years – the latest official IOT is available only for the year 2007-08. Using supply use tables of Central Statistical Organisation (CSO), the study estimates for 112 sectors covering agriculture, manufacturing and services during the period 1999-2000 to 2012-13.
Table 4 shows that total employment created by exports increased from 34 million in 1999-00 to 63 million in 2012-13. The direct employment stagnated since 2004-05. Indirect employment increased significantly over time and equalled the direct employment by 2012-13 (Figure 1).

Year (1) 1999-002000-012001-022002-032003-042004-052005-062006-072007-082008-092009-102010-112011-122012-13
Sour
SourFigur
The
employemployfrom 4
Thesectorstotal di
FARM AND
TABLE 4. JOB
0 1 2 3 4 5 6 7 8 9 0 1 2 3 rce: Veeramani an
rce: Veeramani anre1. Number o
e growth ratyment (Tableyment growth0 per cent in ere are inters (Table 6). Tirect export l
D NON-FARM SE
BS SUPPORTED B
Total (2)
34.0 37.9 41.2 43.5 43.6 52.1 53.5 53.5 49.0 54.1 44.5 49.3 58.0 62.6
nd Dhir (2017).
nd Dhir (2017). of Jobs Suppo
th
tes of jobs de 5). Indirech. The share o1999-00 to arresting conclhe manufactulinked jobs. I
ECTOR LINKAGE
BY INDIA’S MER
Export SupportedDirect
(3) 19.9 23.0 25.7 26.8 27.5 32.6 32.6 33.0 30.6 31.1 23.2 23.6 29.0 31.4
orted by Expohe Country (p
due to expoct employmenof indirect emround 50 per lusions on during sector an contrast, th
ES AND FUTURE
RCHANDISE PLU
d Jobs Indire
(4)14.114.915.416.716.119.620.820.518.523.021.325.728.931.2
orts as a Sharper cent).
rts is much nt growth is
mployment incent in 2012-
direct and inaccounts for 7he share of in
E OF AGRICULT
US SERVICE EXP
Totaect
9 4 7
6 8 5 5 0 3 7 9 2
re of Total Em
higher thans much highen total export j-13.
ndirect emplo73 per cent to ndirect emplo
URE 6
PORTS (in million
al Employment in India (5)
368.2 369.1 417.1 396.1 393.5 408.3 402.9 405.2 407.5 403.8 400.0 410.2 420.5 430.7
mployment in
n that of totaer than direcjobs increase
oyment acros85 per cent o
oyment is hig
67
ns)
al ct ed
ss of gh

INDIAN JOURNAL OF AGRICULTURAL ECONOMICS 68
for both agriculture and services. Agriculture total export jobs have 20 per cent direct employment and 80 per cent indirect employment which is due to manufacturing linkages. Services total export jobs have 48 per cent direct employment and 52 per cent indirect employment which has linkages with manufacturing.
TABLE 5. GROWTH RATES OF EXPORT JOBS AND TOTAL EMPLOYMENT
(per cent) Jobs supported by exports (growth rates) Total Employment Period (1)
Total (2)
Direct (3)
Indirect (4)
in the country (6)
Dollar value of (7)
1999-00 to 2012-13 3.4 1.6 5.8 0.8 20.1 1999-00 to 2005-06 7.6 8.4 6.5 1.5 20.5 2006-07 to 2012-13 2.6 -1.9 8.4 0.9 14.5
Source: Veeramani and Dhir (2017).
TABLE 6. JOBS SUPPORTED BY INDIAN EXPORTS (million)
Year Agri &Allied and Mining Manufacturing Services (1) Direct
(2) Indirect
(3) Total (4)
Direct (5)
Indirect (6)
Total (7)
Direct (8)
Indirect (9)
Total (10)
1999-00 8.0 7.9 16.0 7.0 1.9 8.9 4.8 4.3 9.1 2000-01 8.8 8.1 16.9 9.0 2.2 11.2 5.3 4.6 9.8 2001-02 10.4 8.6 19.0 10.1 2.0 12.1 5.2 4.8 10.0 2002-03 10.6 9.0 19.6 10.4 2.3 12.7 5.8 5.4 11.3 2003-04 11.6 7.7 19.3 10.2 2.9 13.0 5.8 5.5 11.2 2004-05 13.3 10.2 23.6 11.3 2.7 14.0 7.9 6.7 14.6 2005-06 14.0 10.4 24.5 8.3 2.7 11.0 10.3 7.7 18.0 2006-07 13.2 9.9 23.0 7.4 2.7 10.1 12.5 8.0 20.4 2007-08 11.3 8.4 19.6 5.9 2.6 8.6 13.4 7.5 20.9 2008-09 10.9 11.8 22.7 7.8 2.7 10.6 12.4 8.5 20.9 2009-10 7.2 11.9 19.1 7.9 2.4 10.3 8.2 7.0 15.1 2010-11 5.8 16.4 22.2 11.2 2.7 13.9 6.5 6.6 13.2 2011-12 4.2 19.9 24.1 19.2 3.4 22.6 5.6 5.7 11.4 2012-13 5.4 21.2 26.6 20.3 3.9 24.1 5.7 6.1 11.9
Source: Veeramani and Dhir (2017).
IV
FUTURE OF INDIAN AGRICULTURE
Agriculture in India is going to be more diversified and links with non-agriculture sectors could be much higher in future.
The government is planning to double the income of farmers by 2022. It is a good idea to focus on incomes rather than production. Estimates on changes in farmers’ income show that it tripled in nominal terms during the period 2003 to 2013. But, in real terms, the total income increased only 32 per cent in 10 years (Table 7). Income from cultivation and farming of animals together rose by 49 per cent. However, the increase in income of agricultural households differs across states. Income doubled in Odisha state but Bihar and West Bengal recorded absolute decline in incomes of farmers.

FARM AND NON-FARM SECTOR LINKAGES AND FUTURE OF AGRICULTURE 69
TABLE 7. RATIO OF MONTHLY INCOME OF AGRICULTURAL HOUSEHOLDS IN 2013 OVER 2003 States (1)
Wages (2)
Cultivation (3)
Animals (4)
Non-farm (5)
Total income (6)
Punjab 1.56 1.80 2.39 0.68 1.67 Haryana 1.20 1.85 -- 0.57 1.93 Uttar Pradesh 1.00 1.38 3.76 0.99 1.31 Bihar 1.28 0.80 0.44 0.55 0.83 West Bengal 1.18 0.62 1.44 0.76 0.91 Odisha 1.41 1.79 33.35 1.54 2.08 Chhattisgarh 1.25 2.05 1.58 0.00 1.57 Madhya Pradesh 1.17 1.48 -- 0.59 1.75 Gujarat 1.34 1.18 1.84 1.30 1.36 Maharashtra 1.29 1.54 1.82 1.49 1.47 Andhra Pradesh 1.59 1.56 3.61 1.07 1.64 Karnataka 1.27 1.66 1.92 1.49 1.52 Kerala 1.21 1.43 1.58 1.62 1.36 Tamil Nadu 1.24 1.16 3.93 2.43 1.48 All India 1.22 1.32 3.21 1.00 1.34
Source: Chandrasekhar and Mehrotra (2016).
Incomes by land size shows that it doubled for large farmers above 10 hectates but rose only 10 per cent to 13 per cent for the marginal farmers upto 0.4 hectares (Table 8). The ratio of real income of 2013 over 2003 rises with the size of land. The ratio increased by 38 per cent for the size class 0.41 to 1.0 hectares while it rose 85 per cent for the size class 4 to 10 hectares. TABLE 8. RATIO OF REAL MONTHLY INCOME OF AGRICULTURAL HOUSEHOLDS IN 2013 OVER 2003
BY LAND SIZE
Land size (ha.) (1)
Cultivation income
(2)
Animals income
(3)
Wage income (4)
Non-farm business
(5)
Total income
(6) <0.01 0.34 3.40 1.01 0.63 1.13 0.01-0.4 1.09 2.78 1.07 0.67 1.10 0.41-1.0 1.40 2.61 1.26 1.08 1.38 1.01-2.0 1.50 3.31 1.23 1.61 1.52 2.01-4.0 1.54 5.39 1.26 1.23 1.59 4.01-10.0 1.76 7.88 1.81 1.33 1.85 >10.00 2.06 3.58 1.23 1.32 2.02 All classes 1.32 3.21 1.22 1.00 1.34
Source: Chandrasekhar and Mehrotra (2016).
Table 9 shows that the income of the marginal and small farmers from all sources is only around 1/10th of those of large farmers. The income from agriculture is very low for small farmers. Even if we add the other sources of income, it is not enough to take care of daily consumption and they have to borrow to survive (Figure 2). Small holding farmers have to get part of income from rural non-farm activities. Therefore, promotion of rural non-farm sector is essential for generating incomes for small farmers. Simultaneously, we have to improve the viability of small holdings.

INDIAN JOURNAL OF AGRICULTURAL ECONOMICS 70
TABLE 9. MONTHLY INCOME AND CONSUMPTION OF AGRICULTURAL HOUSEHOLDS: 2013 (Rs.)
Land size (ha.) (1)
Cultivate income
(2)
Animals income
(3)
Wage income
(4)
Non-farm business
(5)
Total income
(6)
Total consumption
(7) <0.01 31 1223 3019 469 4742 5139 0.01-0.40 712 645 2557 482 4396 5402 0.41-1.00 2177 645 2072 477 5371 5979 1.01-2.00 4237 825 1744 599 7405 6430 2.01-4.00 7433 1180 1681 556 10849 7798 4.01-10.00 15547 1501 2067 880 19995 10115 >10.00 35713 2616 1311 1771 41412 14445 All Classes 3194 784 2146 528 6653 6229
Source: NSS Situation Assessment Survey 2013.
Source: NSS Situation Assessment Survey 2013. Figure 2. Monthly Income and Consumption of Farm Households by Size Class of
Land.
The report of the Committee on doubling farm income says that average income of farmers should double from Rs.96,703 in 2015-16 to Rs.1,93,406 in 2022-23 at 2015-16 prices. The assumptions are that private investment should increase by 6.62 per cent per annum and public investment for agriculture should increase by 6.92 per cent per annum. Cumulative private investment of Rs. 463 billion (at 2004-05 prices) and public investment of 1023 billion (at 2004-05 prices) are needed. The requirement of investments varies from state to state.
According to Ashok Dalwal Committee (Government of India, 2017), major sources of growth for doubling farm income are: (1) Improvement in crop productivity; (2) Improvement in livestock productivity; (3) Resource use efficiency or saving in cost of production; (4) Increase in cropping intensity; (5) Diversification
FARM AND NON-FARM SECTOR LINKAGES AND FUTURE OF AGRICULTURE 71
towards high value crops; (6) Improvement real prices received by farmers; (7) Shift from farm to non-farm occupations. These measures will improve farm-non-farm linkages.
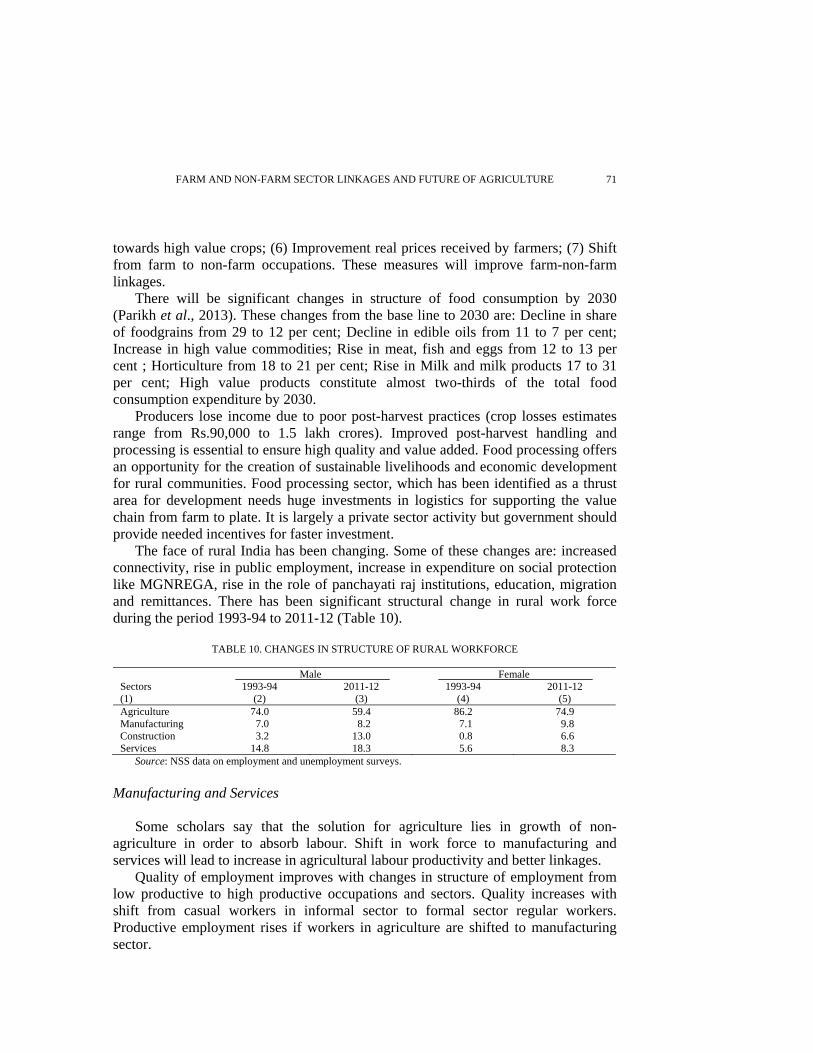
There will be significant changes in structure of food consumption by 2030 (Parikh et al., 2013). These changes from the base line to 2030 are: Decline in share of foodgrains from 29 to 12 per cent; Decline in edible oils from 11 to 7 per cent; Increase in high value commodities; Rise in meat, fish and eggs from 12 to 13 per cent ; Horticulture from 18 to 21 per cent; Rise in Milk and milk products 17 to 31 per cent; High value products constitute almost two-thirds of the total food consumption expenditure by 2030.
Producers lose income due to poor post-harvest practices (crop losses estimates range from Rs.90,000 to 1.5 lakh crores). Improved post-harvest handling and processing is essential to ensure high quality and value added. Food processing offers an opportunity for the creation of sustainable livelihoods and economic development for rural communities. Food processing sector, which has been identified as a thrust area for development needs huge investments in logistics for supporting the value chain from farm to plate. It is largely a private sector activity but government should provide needed incentives for faster investment.
The face of rural India has been changing. Some of these changes are: increased connectivity, rise in public employment, increase in expenditure on social protection like MGNREGA, rise in the role of panchayati raj institutions, education, migration and remittances. There has been significant structural change in rural work force during the period 1993-94 to 2011-12 (Table 10).
TABLE 10. CHANGES IN STRUCTURE OF RURAL WORKFORCE
Male Female Sectors (1)
1993-94 (2)
2011-12 (3)
1993-94 (4)
2011-12 (5)
Agriculture 74.0 59.4 86.2 74.9 Manufacturing 7.0 8.2 7.1 9.8 Construction 3.2 13.0 0.8 6.6 Services 14.8 18.3 5.6 8.3
Source: NSS data on employment and unemployment surveys. Manufacturing and Services
Some scholars say that the solution for agriculture lies in growth of non-agriculture in order to absorb labour. Shift in work force to manufacturing and services will lead to increase in agricultural labour productivity and better linkages.
Quality of employment improves with changes in structure of employment from low productive to high productive occupations and sectors. Quality increases with shift from casual workers in informal sector to formal sector regular workers. Productive employment rises if workers in agriculture are shifted to manufacturing sector.

INDIAN JOURNAL OF AGRICULTURAL ECONOMICS 72
In this context, ‘Make in India’ campaign is in the right direction. The aim is to create 100 million jobs by 2022. As shown by Ghose, (2016) labour intensive manufacturing is important for quality job creation particularly increase in organised sector.5 However, there are two related issues: (a) Can employment rise with manufacturing GDP growth? (b) What about services with 60 per cent share in GDP?
It is important to examine the prospects of manufacturing particularly in job creation in the light of East Asian experience and in the present context of global stagnation. It is argued here that one has to include services also in ‘Make in India’ programme for creation of employment.
Historical experience shows that countries follow agriculture-industry-service sequence in order to obtain higher growth and productive employment. Many East Asian countries including China could increase their manufacturing share in GDP (Table 11).
TABLE 11. MANUFACTURING IN GDP AND EMPLOYMENT
Peak share per cent in manufacturing Countries (1)
Period (2)
GDP (3)
Employment (4)
Japan 1970 36.0 27.0 South Korea 2000 29.0 23.3 Taiwan 1990 33.3 32.0 China 2005 32.5 15.9 Indonesia 2004 28.1 11.8 Thailand 2007 35.6 15.1 India 2011-12 15.7 12.8
Source: NSS for India; Ghose (2015), for rest of the countries.
Japan peaked share in manufacturing in GDP (36 per cent) and employment (27 per cent) by 1970. In the case of China, the share of manufacturing in GDP is around 33 per cent now but its share in employment is only 16 per cent.
What are the reasons for low manufacturing share in employment in China? Early industrialising countries like Japan, Korea, Taiwan could improve the share in employment. But late industrialisation in China, Indonesia and Thailand resulted rise in share of manufacturing in GDP but not employment. Employment in manufacturing today is not quite comparable to employment in manufacturing in earlier times. The reason is that manufacturing enterprises used to directly employ staff for a variety of services required but now they outsource them from service enterprises (Ghose, 2015).
Table 12 provides the share of services in East Asia and India. Countries like Japan, Korea and Taiwan have 60 to 80 per cent share of services in both GDP and employment. On the other hand, China, Indonesia and Thailand have around 35 to 45 per cent share of services in both GDP and employment. In all these East Asian countries, the share of services in both GDP and employment are more or less similar. India is an exception to this trend (Table). India’s share of services in employment is only 26.4 per cent compared to 58.4 per cent share of services in

FARM AND NON-FARM SECTOR LINKAGES AND FUTURE OF AGRICULTURE 73
GDP. At the same time, manufacturing sector has low share in GDP (17 per cent) and employment (12.8 per cent). Therefore, the challenges are to raise both GDP and employment growth for manufacturing and employment growth in services.
TABLE 12. SERVICES IN GDP AND EMPLOYMENT, 2013
Countries (1)
Per cent share in GDP (2)
Per cent share in employment (3)
USA 78.6 81.2 Germany 68.4 70.2 France 78.5 74.9 U.K. 79.2 78.9 Brazil 69.4 62.7 China 46.1 35.7 Japan 72.4 69.7 South Korea 59.1 76.4 India 58.4 26.7
Source: Economic Survey 2014-15, Government of India.
In its three year action plan (Niti Aayog, 2017) also indicates that India has the advantage of walking on two legs: manufacturing and services. It offers specific proposals for jumpstarting some of the key manufacturing and services sectors, including apparel, electronics, gems and jewellery, financial services, tourism and cultural industries and real estate. Among other things, it recommends the creation of a handful of Coastal Employment Zones, which may attract multinational firms in labour-intensive sectors from China to India.
For shifting labour force from agriculture to non-agriculture, skill development is a constraint in India. Some estimates show that only 2.3 per cent of India’s workforce has undergone formal skill training compared to United Kingdom’s (U.K.) 68 per cent, Germany’s 75 per cent, USA’s 52 per cent, Japan’s 80 per cent and South Korea’s 96 per cent (Niti Aayog, 2017). In order to have structural change from agriculture to non-agriculture and from unorganised to organised, education and skill improvement are needed. Government initiatives on skill development have so far yielded in slow progress. More innovative methods may be required to improve skills faster. It may be noted that general education is equally important.6
V
SOME ISSUES FOR FURTHER RESEARCH
The following are some of the issues on farm and non-farm linkages for further research. 1. The farm and non-farm linkages with the recent data are needed. What is
happening to farm and non-farm linkages in recent years whether it is input-output or other methods?
2. Backward linkages of agricultural sector to other sectors seem to be in the right direction. How to improve the forward linkages of farm sector?

INDIAN JOURNAL OF AGRICULTURAL ECONOMICS 74
3. More research on factors that determine the linkages in terms of both supply and demand side has to be undertaken.
4. Generally one looks at only agricultural policies for farm growth and linkages. More research has to be done on the role of macro economic policies like trade, monetary and fiscal policies and their impact on farm-non-farm linkages.
5. Further work has to be undertaken on diversification particularly on the crucial role of livestock sector.
6. In developing countries like India, we have ‘missing middle’ in marketing. Value chain runs from production, procurement, storage, wholesale, retail sale, packaging, distribution and processing. What should be done to improve the ‘missing middle’?
7. Post-harvest management including technology is another area for research. The focus has to shift from production to post-harvest operations.
8. Related one is prices and markets. How do we maintain price stability during both bad years and good years?
9. What are the new institutions needed? How to strengthen the current institutions to strengthen linkages?
10. How to improve incomes of small holder farms through inter-sectoral linkages? 11. More studies may be needed on linkages across regions. How to diversify
agriculture in Eastern India and strengthen farm and non-farm linkages? Eastern India where poverty is the highest may need special focus.
12. Climate change is real and will have implications across sectors. What is the impact of climate change on farm and non-farm linkages?
NOTES
1. For a review of rural non-farm employment, see Himanshu (2014). 2. Based on Himanshu (2014) and Himanshu et al. (2016a). 3. On determinants see Nayyar and Sharma (2005). 4. Also see Rao (2005) for the linkages between agriculture, food security and poverty. 5. On manufacturing in South Asia, see Verick (2015). 6. See Ghose (2016).
REFERENCES
Bhattacharya, B.B. and C.H.H. Rao (1986), “Agriculture-Industry Interrelations: Issues of Relative
Prices and Growth in the Context of Public Investment”, Theme 18, Eighth World Economic Congress of the International Economic Association, New Delhi.
Chandrasekhar, S. and N. Mehrotra (2016), “Doubling Farmers’ Incomes by 2022”, Economic and Political Weekly, Vol.51, No.18, 30 April.
Datt, Gaurav, Martin Ravallion, Rinku Murgai (2016), Growth, Urbanization, and Poverty Reduction in India. Policy Research Working Paper; No. WPS 7568. World Bank Group, Washington, D.C., U.S.A.
Dercon, Stephan (2016), “Does Agricultural Research Reduce Poverty”, https://www.slideshare.net/ISPC-CGIAR/does-agricultural-research-reduce-poverty, accessed on 8th November, 2017.

FARM AND NON-FARM SECTOR LINKAGES AND FUTURE OF AGRICULTURE 75
Dev, Mahendra S. (1993), “Non-Agricultural Employment in Rural India: Evidence at a Disaggregate level”, in P. Visaria and R. Basant (Eds) (1993), Non-Agricultural Employment in India: Trends and Prospects, Sage Publications India Pvt. Ltd., New Delhi.
Fan, S., P. Hazell and S. Thorat (1999), Linkages between Government Spending, Growth and Poverty in Rural India, Research Report No110, International Food Policy Research Institute, Washington, D.C., U.S.A.
Gaiha, R. (2016), “The Overrated Urban Spin-Off”, Indian Express, November 2, 2016. Government of India (2017), Strategy for Doubling Farmers’ Income by 2022, Report of the Expert
Committee Vol.1, New Delhi. Ghose, A.K. (2015), “Services-Led Growth and Employment in India”, in Ramaswamy, K. (Ed.) (2015),
Labour, Employment and Economic Growth in India, Cambridge University Press, New Delhi. Ghose, A.K. (2016), India Employment Report 2016, Oxford University Press, New Delhi. Himanshu (2014), Rural Non-Farm Employment in India: Trends, Patterns and Regional Dimensions,
India Rural Development Report 2013/14, Orient Black Swan. Himanshu, Praveen Jha and Gerry Rodgers (2016a), The Changing Village in India: Insights from
Longitudinal Research, Oxford University Press. Joshi, Himanshu B. and Peter Lanjouw (2016b), “Non-farm Diversification, Inequality and Mobility in
Palanpur”, Economic and Political Weekly, Vol.51, Nos 26-27, 25 June. Johnston, F. Bruce and John W. Mellor (1961), “Role of Agriculture in Economic Development”,
American Economic Review, Vol.51, No.4. Kaldor, N. (1967), Strategic Factors in Economic Development, Cornell University Press, Ithaca. Kalecki, M. (1960), “Unemployment in Underdeveloped Countries”, Indian Journal of Labour
Economics Vol.3, No.2, pp.59–61. Kaur, G., S. Bordoloi and R. Rajesh (2009), “An Empirical Investigation of the Inter-Sectoral Linkages
in India”, Reserve Bank of India Occasional Papers, Vol.30, No.1. Kuznets, S. (1968), Toward a Theory of Economic Growth with Reflections on the Economic Growth of
Nations, Norton, New York. Lewis, W.A. (1954), “Economic Development with Unlimited Supplies of Labour”, The Manchester
School, Vo.22, No.2, pp.139–91. Liedholm C. and Kilby P. (1989), “The Role of Non-farm Activities in the Rural Economy”, in
Williamson J.G., Panchamukhi V.R. (Eds.) (1989), The Balance between Industry and Agriculture in Economic Development, International Economic Association Series. Palgrave Macmillan, London.
Mcmillan, M., C. Sepulveda and Rodrik Dani (Eds.) (2017), Structural Change, Fundamentals and Growth: A Framework and Case Studies, International Food Policy Research Institute, Washington, D.C., U.S.A.
Mellor, J.W. (1976), The New Economic Growth: A Strategy for India and the Developing World, Cornell University Press, Ithaca, U.S.A.
Mythili, G. and Harak (2013), “Sectoral Linkages, Multipliers, and the Role of Agriculture”, in S. Mahendra Dev (Ed.) (2013), India Development Report 2012/13, Oxford University Press. New Delhi.
Nandy, Amrita and Rohini Hensman (2015), “The Work Women Do”, Indian Express, November 7, 2015.
Nayyar, R. and Alakh Sharma (2005), Rural Transformation in India: The Role of Non-Farm Sector, Institute for Human Development, New Delhi.
Niti Aayog (2017), “India Three Year Action Agenda 2017-18 to 2019-20”, Government of India. Papola, T.S. (1991), ‘Rural Non-Farm Employment : An Assessment of Recent Trends’, Monograph,
Planning Commission, New Delhi. Parikh, K.S., P.P. Ghosh and Hans Binswanger-Mkhize (2013), “Double-Digit Inclusive Growth, Not
without Robust Agricultural Growth”, Economic and Political Weekly, Vol.48, No.51, 21 December.

INDIAN JOURNAL OF AGRICULTURAL ECONOMICS 76
Rangarajan, C. (1982), Agricultural Growth and Industrial Performance in India, Research Report 33, International Food Policy Research Institute, October.
Ranis, Gustav and Francis Stewart (1993), “Rural Non-Agricultural Activities in Development: Theory and Application”, Journal of Development Economics, Vol. 40, No.1.
Rao, Chandrasekhara N., R. Sutradhar and T. Reardon (2017), “Disruptive Innovations in Food Value Chains and Small Farmers in India”, Indian Journal of Agricultural Economics, Vol. 72, No.1, January-March, pp.24-48.
Rao, C.H.H. (2005), Agriculture, Food Security, Poverty and Environment, Oxford University Press, New Delhi.
Rodgers, Gerry, S.K.Mishra and Alakh N. Sharma (2016), “Four Decades of Village Studies and Surveys in Bihar” in Himanshu, Praveen Jha and Gerry Rodgers (Eds.) (2016), The Changing Village in India: Insights from Longitudinal Research, Oxford University Press, New Delhi.
Ritadhi, S.K. and Madhur Gautam (2017), Agricultural Productivity Growth and Non-Farm Employment: Evidence from India, University of California, Berkeley, U.S.A., (mimeo.).
Sahu, P. and Sher Verick (2016), “State of Rural Labour Markets in India”, Paper presented at National Seminar on ‘Dynamics of Rural Labour Relations in India”, 10-12 March, 2016, organised by S.R. Shankaran Chair, National Institute of Rural Development, Hyderabad.
Sastry, D.V.S., B. Singh, K. Bhattacharya, and N.K. Unnikrishnan (2003), ‘Sectoral Linkages and Growth Prospects: Reflections on the Indian Economy’, Economic and Political Weekly, Vol. 38, No.24, 14 June.
Sen, Abhijit (1998), “Rural Labour Markets and Poverty”, in Radhakrishna and A.N. Sharma, (Eds.) (1998), Empowering Rural Labour in India, Market, State and Mobilization in India, Institute for Human Development, New Delhi.
Vaidyanathan, A. (1986), ‘Labour Use in India : A Study of Spatial and Temporal variations’, Economic and Political Weekly, Vol.29, No.50, 10 December.
Vaidyanathan, A. (1994), “Employment Situation, Some Emerging Perspectives”, Economic and Political Weekly, Vol. 29, No.50, 10 December.
Veeramani, C. and Garima Dhir, (2017) "Reaping Gains from Global Production Sharing: Domestic Value Addition and Job Creation by Indian Exports", Paper to be presented at "IARIW-ICRIER Conference on Experiences and Challenges in Measuring Income, Inequality, and Poverty in South Asia,”, November 23-25, 2017, New Delhi.
Verick, Sher S. (2015), “Manufacturing and Jobs: Is India Different?” Keynote Paper, 57th Annual Conference of the Indian Society of Labour Economics, Srinagar, 10-12 October, 2015.
World Bank (2008), World Development Report 2008: Agriculture for Development, Washington D.C., U.S.A.