Far North PWA - waterconnect.sa.gov.au · 2015 Far North PWA GAB (J-K) aquifer groundwater status...
8
Far North PWA GAB (J-K) aquifer 2015 Groundwater level and salinity status report
Transcript of Far North PWA - waterconnect.sa.gov.au · 2015 Far North PWA GAB (J-K) aquifer groundwater status...

Far North PWA
GAB (J-K) aquifer 2015 Groundwater level and salinity status report

Department of Environment, Water and Natural Resources
GPO Box 1047, Adelaide SA 5001
Telephone National (08) 8463 6946
International +61 8 8463 6946
Fax National (08) 8463 6999
International +61 8 8463 6999
Website www.environment.sa.gov.au
Disclaimer
The Department of Environment, Water and Natural Resources and its employees do not warrant or make any representation
regarding the use, or results of the use, of the information contained herein as regards to its correctness, accuracy, reliability,
currency or otherwise. The Department of Environment, Water and Natural Resources and its employees expressly disclaims all
liability or responsibility to any person using the information or advice. Information contained in this document is correct at the
time of writing.
This work is licensed under the Creative Commons Attribution 4.0 International License.
To view a copy of this license, visit http://creativecommons.org/licenses/by/4.0/
© Crown in right of the State of South Australia, through the Department of Environment, Water and Natural Resources 2016
ISBN 978-1-925510-14-0
Preferred way to cite this publication
DEWNR, 2016, Far North PWA GAB (J-K) aquifer 2015 Groundwater level and salinity status report, Government of South Australia,
through the Department of Environment, Water and Natural Resources, Adelaide
Download this document at www.waterconnect.sa.gov.au

2015 Far North PWA GAB (J-K) aquifer groundwater status report 1
2015 Summary The Far North Prescribed Wells Area (PWA) is located in the South Australian
Arid Lands NRM Region and is bounded in the north and east by the State’s
shared borders with New South Wales, Queensland and the Northern Territory.
The Far North PWA covers approximately 315 000 km2 (~32% of the state) and
is prescribed under South Australia’s Natural Resources Management Act 2004.
A water allocation plan (WAP) provides for the sustainable use of the
groundwater resources.
Groundwater in the Far North PWA is sourced predominately from the Cadna-
owie Formation and Algebuckina Sandstone (and equivalents), which as a
single aquifer unit is described as the Jurassic-Cretaceous (J-K) aquifer, and
represents the Great Artesian Basin (GAB) at a regional scale—herein referred
to as the GAB (J-K) aquifer, and the focus of this report. Depth to the GAB (J-K)
aquifer is as much as 2400 m below ground level in the state’s north-east, but
this decreases towards the basin margins, with the aquifer cropping out along the western and southern margins. The GAB (J-K)
aquifer ranges from less than 50 m thickness around the basin’s western margin to greater than 500 m thickness near the
Poolowanna Trough (Fig. 1).
Recent research has shown that much of the groundwater contained in GAB (J-K) sediments in South Australia was recharged more
than 10 000 years ago, under different climatic conditions to those that are observed today. Present-day recharge along the western
margin of the GAB in South Australia, which is in natural decline, is low and although active recharge to the GAB from flooding of
ephemeral rivers in Northern Territory does occur, the rates of recharge are relatively low compared to rates of discharge. Upward
leakage from the underlying Cooper Basin is also thought to contribute recharge to the GAB aquifer, but the size of this flux has
not yet been estimated.
The Far North PWA WAP cites estimated groundwater extraction from the GAB (J-K) aquifer to be in the order of 90 ML/d for stock
and domestic use and 4 ML/d for town water supply. Recent water-use savings have been achieved via the Great Artesian Basin
Sustainability Initiative (GABSI) that has included replacing bore drains with piping and rehabilitating free-flowing wells. Across the
total areal extent of the GAB, these measures have resulted in an estimated saving of 545 ML/d (199 000 ML/y)1. Estimated total
groundwater discharge from naturally-occurring springs is around 66 ML/d, but this has not yet been validated because of the
difficulties in measuring actual flows. Petroleum operations have a current allocation volume of 60 ML/d for water co-produced
during the extraction of oil and gas. Various mining operations currently have a total allocation volume of 44.6 ML/d. In addition to
this volume, BHP Billiton’s Olympic Dam mine has been granted a special water licence to extract water from the GAB (J-K) aquifer.
This licence was issued under the Roxby Downs (Indenture Ratification) Act 1982 and permits BHP Billiton to extract up to 42 ML/d
from the GAB (J-K) aquifer. While the mine itself is located outside of the Far North PWA, the wellfields are located within the PWA.
As local rainfall has no influence on pressure levels or rates of groundwater extraction from the GAB, rainfall analysis is not presented
in this report.
Over the past 20 years in the Far North PWA, the groundwater pressure levels and salinity of the GAB (J-K) aquifer have remained
generally stable. In the five years to 2015, and from a total of 19 wells, nine monitoring wells (47%) show a trend of rising
groundwater pressure levels and three wells (15%) show stable pressure levels. Rises in pressure levels ranged between 0.04–0.9 m/y,
with a median of 0.19 m/y. These wells are located around the Oodnadatta region (Fig. 1). The remaining seven monitoring wells
(38%) show a trend of declining groundwater pressure levels; and these wells are mainly located in the William Creek and Howard
Springs region (Fig. 1). It should be noted that 10% of all available monitoring wells display their lowest level on record in 2015.
In addition, data extracted from the BHP Billiton’s Olympic Dam mine monitoring network (referred to as the Wellfield B extraction
area), are showing a declining trend in groundwater pressure levels.2
1 Additional information related to the Great Artesian Basin Sustainabilty Initative (GABSI) can be found online at http://olr.npi.gov.au/water/policy-programs/gabsi/index.html or https://www.dnrm.qld.gov.au/water/catchments-planning/catchments/great-artesian-basin/gabsi 2 BHP Billiton’s Olympic Dam mine monitoring network data is not yet available via DEWNR’s EnviroData portal, but can be found online at http://minerals.statedevelopment.sa.gov.au/mining/mines_and_quarries/olympic_dam
2015 Far North PWA GAB (J-K) aquifer groundwater status report 2
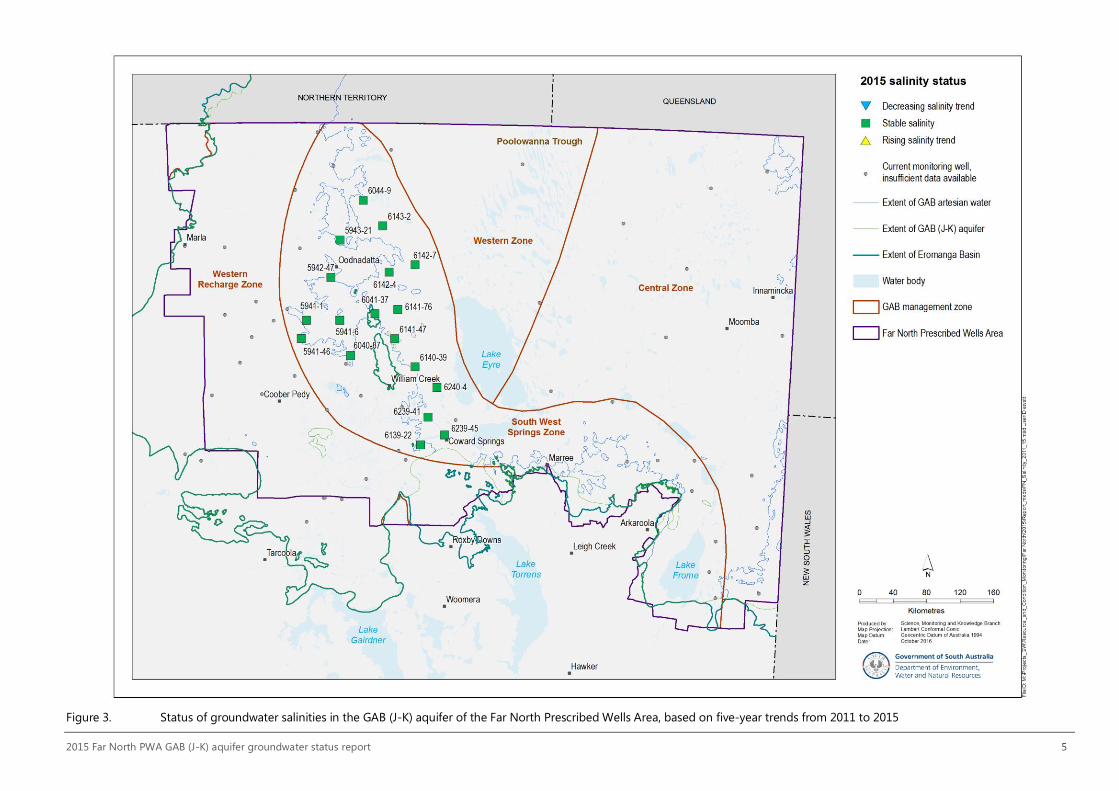
In 2015, salinities range between 300 and 7000 mg/L (from 64 salinity monitoring wells), with 23% of these wells showing a salinity
of less than 1500 mg/L and 42% between 1500 and 3000 mg/L (Fig. 2). Good-quality groundwater (<1000 mg/L) is typically found
within the Central Groundwater Management Zone. In the five years to 2015, all monitoring wells show stable salinities (Fig. 3),
although data extracted from the Heathgate Resources mine monitoring network, south-east of Arkaroola, show increases in
groundwater salinity3.
To determine the status of the GAB (J-K) aquifer for 2015, the trends in groundwater pressure levels and salinities over the past five
years (2011 to 2015, inclusive) were analysed. This is a new approach, in contrast to the year-to-year assessments that have been
used in past Groundwater level and salinity status reports. Please visit the Frequently Asked Questions on the Water Resource
Assessments page on WaterConnect for more detail on the current method of evaluating the status of groundwater resources.
While a standardised method for determining trends has been used for all Groundwater Status Reports, pressure readings taken in
the artesian zones of the GAB (J-K) aquifer can vary depending on a number of factors including atmospheric pressure, temperature
of water on shut-in, and the length of time that the well has been shut in.
The GAB (J-K) aquifer in the Far North PWA has been assigned a green status for 2015:
2015 Status
Positive trends have been observed over the past five years
The 2015 status for the GAB (J-K) aquifer is based on:
most monitoring wells (63%) showing a five-year trend of rising or stable groundwater pressure levels
all monitoring wells showing a five-year trend of stable groundwater salinity.
It should be noted that the majority of these available monitoring wells are concentrated in the south-western part of the PWA, and
are related to J-K aquifer of the GAB. Therefore, the assigned status to the PWA cannot be extended to the whole of the Great
Artesian Basin.
Although a green status has been assigned to the J-K aquifer of the GAB, steady declines in groundwater pressure levels, registered
within the BHP Billiton’s Olympic Dam (Wellfield B) monitoring network and salinities increases shown by the Heathgate Resources
monitoring network are acknowledged.
To view descriptions for all status symbols, please visit the Water Resource Assessments page on WaterConnect.
To view the Far North PWA Groundwater Level and Salinity Status Report 2011, which includes background information on
hydrogeology, rainfall and relevant groundwater-dependent ecosystems, please visit WaterConnect.
To view or download groundwater level and salinity data from monitoring wells within the Far North PWA, please visit Groundwater
Data on WaterConnect.
For further information about the Far North PWA, please see the Water Allocation Plan for the Far North Prescribed Wells Area on
the Natural Resources South Australian Arid Lands website.
3 Heathgate Resources mine monitoring network data is not yet available via DEWNR’s EnviroData portal, but can be found online at http://minerals.statedevelopment.sa.gov.au/mining/mines_and_quarries/beverley_and_beverley_north_mines.

2015 Far North PWA GAB (J-K) aquifer groundwater status report 3
Figure 1. 2015 status of the groundwater levels in the GAB (J-K) aquifer of the Far North Prescribed Wells Area, based on five-year trends from 2011 to 2015

2015 Far North PWA GAB (J-K) aquifer groundwater status report 4
Figure 2. 2015 groundwater salinity of the GAB (J-K) aquifer of the Far North Prescribed Wells Area
2015 Far North PWA GAB (J-K) aquifer groundwater status report 5
Figure 3. Status of groundwater salinities in the GAB (J-K) aquifer of the Far North Prescribed Wells Area, based on five-year trends from 2011 to 2015

2015 Far North PWA GAB (J-K) aquifer groundwater status report
6