Non-Lethal Airburst Munition(s) for Objective Individual ...
PLPL
ANET
ARY DEFENSE INTEGRATED
PRO
DU
CT TEAM
Michael J. AftosmisApplied Modeling and Simulation BranchNASA Advanced Supercomputing DivisionNASA Ames Research Center
7-9 July, 2015
Far-Field Propagation of Airburst Events Using a Cartesian Method
1
1st International Workshop on Potentially Hazardous Asteroids Characterization, Atmospheric Entry and Risk Assessment

Acknowledgements
• NASA Advanced Supercomputing Division – Task 3 & 4 teams" Marian Nemec Donovan Mathias
Jonathan Chiew George Anderson Chris Mattenberger Darrel Robertson
Lorien Wheeler
• Entry Systems Division – Task 2 team" " Dinesh Prabhu Ethiraj Venkatapathy
• New York University" " Marsha Berger
2

ARC Planetary Defense IPT
• “Task 3” of the PD IPT
• Focus on ground effects modeling• Airburst & atmospheric propagation
• Surface overpressure & wind prediction
• Ground damage
• Tsunami propagation
“Task 3”
• Inputs come from entry and airburst modeling in Task 2
• Outputs of atmospheric propagation feed tsunami modeling
• Outputs of atmospheric & tsunami modeling feed physics-based risk models in Task 4
3
Ground & Water Effects

ARC Planetary Defense IPT Cart3D
510152025303540
Altit
ude
(km)
5
10
15
20
25
30
35
40
Altit
ude
(km)
510152025303540
Altit
ude
(km)
Mach contours
Mach contours
Elapsed time = 5 sec
time = 35 sec
time = 95 sec
Figure 2. Simulation results for Chelyabinsk meteor using deposition profile from Brown et al.3 18� entryangle, with peak brightness at 29.5 km altitude. Total Energy = 520 kt.
4 of 9
American Institute of Aeronautics and Astronautics
4
• Far-field atmospheric propagation drives
• Ground footprint and land damage prediction
• Atmospheric forcing for tsunami modeling
• Focus
• Perform detailed reconstruction of specific events
• Perform parametric studies to develop surface footprint models for PRA
• Goal is to do thousands of such simulations – need to control computational expense
Goal of atmospheric propagation is prediction of surface footprint
Current work focuses on airburst only, no ground impact
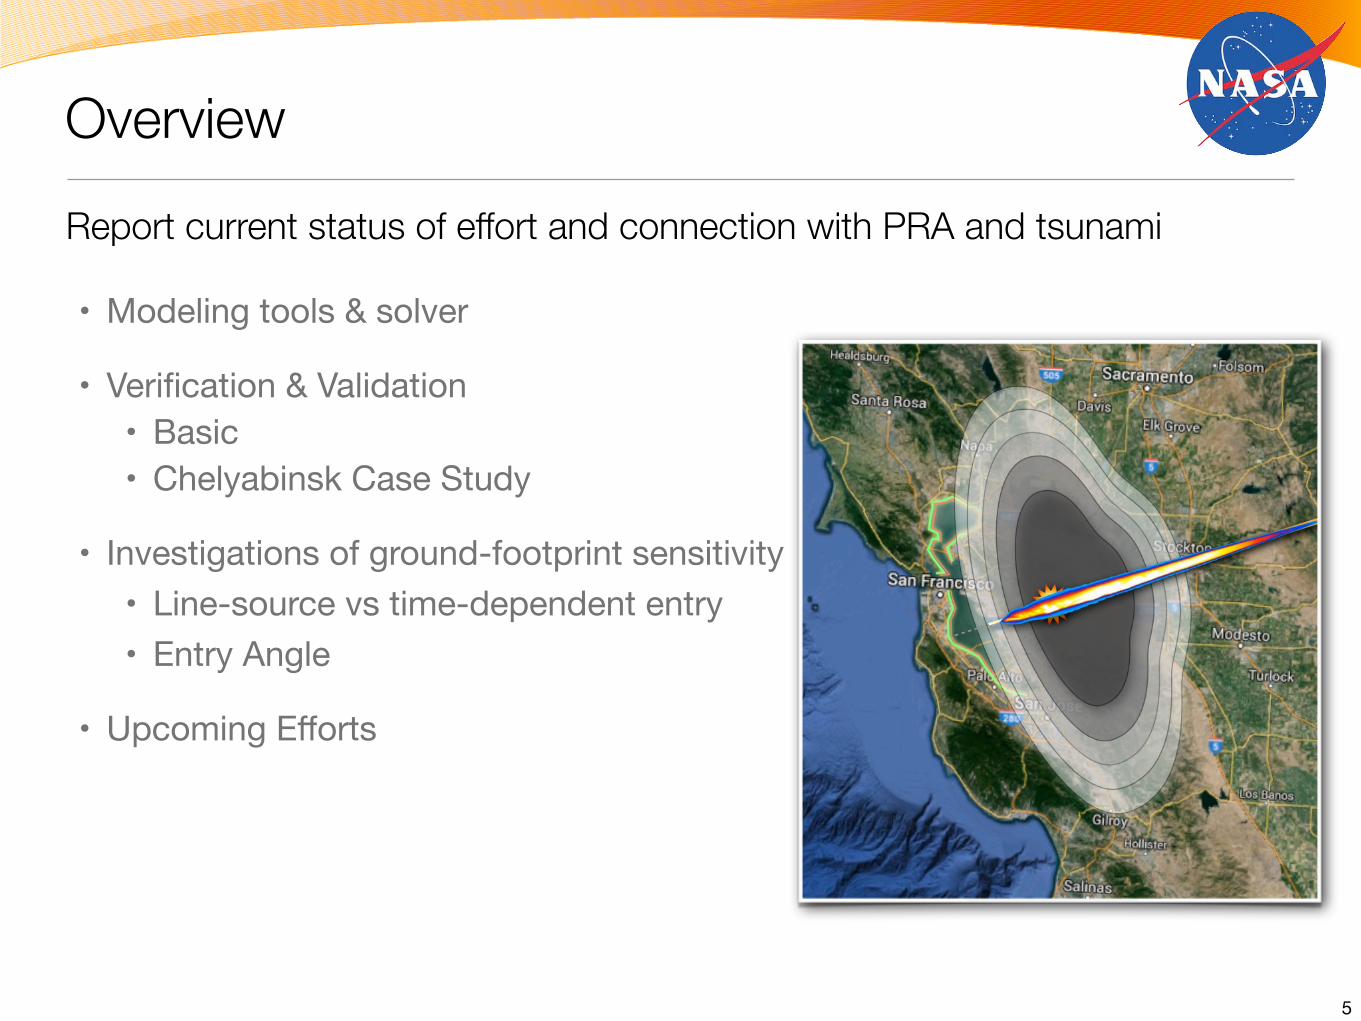
Overview
• Modeling tools & solver
• Verification & Validation• Basic• Chelyabinsk Case Study
• Investigations of ground-footprint sensitivity• Line-source vs time-dependent entry• Entry Angle
• Upcoming Efforts
Report current status of effort and connection with PRA and tsunami
5

Overview
• Modeling tools & solver
• Verification & Validation• Basic• Chelyabinsk Case Study
• Investigations of ground-footprint sensitivity• Line-source vs time-dependent entry• Entry Angle
• Upcoming Efforts
Report current status of effort and connection with PRA and tsunami
6
• Atmosphere model
• Governing equations
• Solver and simulation methodology
• Model for deposition of mass, momentum & energy

ModelingInviscid scale-height atmosphere model
Geo
met
ric A
ltitu
de (k
m)
Temperature (K)
Pressure (kN/m2)
0
10
20
30
40
50
60
70
80
900 50 100 150
300K2001000
Temperature (K)
Geo
met
ric A
ltitu
de (k
m)
Temperature (K)
Pressure (kN/m2)
0
10
20
30
40
50
60
70
80
900 50 100 150
300K2001000
Temperature (K)
ISO 2533:1975 Isothermal• Atmosphere model based on 1976 Standard Atmosphere (ISO 2533:1975)
• Isothermal approximation for scale-height description
• Use H = 8, and initialize simulations with atmosphere in hydrostatic equilibrium
P (z) = P�e�z/H
⇢(z) =P (z)
RT
7

ModelingInviscid scale-height atmosphere model
Geo
met
ric A
ltitu
de (k
m)
Temperature (K)
Pressure (kN/m2)
0
10
20
30
40
50
60
70
80
900 50 100 150
300K2001000
Temperature (K)
Geo
met
ric A
ltitu
de (k
m)
Temperature (K)
Pressure (kN/m2)
0
10
20
30
40
50
60
70
80
900 50 100 150
300K2001000
Temperature (K)
ISO 2533:1975 Isothermal• Atmosphere model based on 1976 Standard Atmosphere (ISO 2533:1975)
• Isothermal approximation for scale-height description
• Use H = 8, and initialize simulations with atmosphere in hydrostatic equilibrium
P (z) = P�e�z/H
⇢(z) =P (z)
RT
8
Density Contours Temperature Contourst = 0
t = 100
t = 200
t = 300
t = 0
t = 100
t = 200
t = 300
Simple Buoyancy Test
TemperatureDensity

• Use 3D Euler eqs. in strong conservation law form, including body force due to gravity
ModelingInviscid scale-height atmosphere model in hydrostatic equilibrium
U = (⇢, ⇢u, ⇢v, ⇢w, ⇢E)T
S =
0
BBBB@
000
�⇢g�⇢wg
1
CCCCA
d
dt
Z
⌦U dV +
I
@⌦(F · n) dS =
Z
⌦S dV
F =
0
BBBB@
⇢u ⇢v ⇢w⇢u2 + p ⇢uv ⇢uw⇢uv ⇢v2 + p ⇢vw⇢uw ⇢vw ⇢w2 + p
u(⇢E + p) v(⇢E + p) w(⇢E + p)
1
CCCCA
• The state vector of conserved variables is
• Flux density tensor and gravitational body force term are
9

• Original development 1998-2002
• Fully-automated mesh generation for complex geometry
• Unstructured Cartesian cells
• Fully-conservative finite-volume method
• Multigrid accelerated 2nd-order upwind scheme
• Excellent scalability through domain decomposition
• Broad use throughout NASA, US Government and industry• Over 500 users in aerospace community• One of NASAs most heavily used
production solvers, large validation database
Solver: Cart3D OverviewProduction solver based on cut-cell Cartesian mesh method
10
Cart3D

• Original development 1998-2002
• Fully-automated mesh generation from watertight geometry
• Unstructured Cartesian cells
• Fully-conservative finite-volume method
• Multigrid accelerated 2nd-order upwind scheme
• Excellent scalability through domain decomposition
• Broad use throughout NASA, US Government and industry• Over 500 users in aerospace community• One of NASAs most heavily used
production solvers, large validation database
Solver: Cart3D OverviewProduction solver based on cut-cell Cartesian mesh method
16 32 64 128 256 512 1024 2048Number of Cores
4
8
16
32
64
128
256
512
1024
Runt
ime
(sec
onds
)
Distributed Memory (MPI) NAS Pleiades systemShared memory (baseline): NAS Endeavour systemIdeal
2014/01/3057M cell mesh, LM-1021
11

Deposition of Mass, Momentum & Energy
• Focus on ground footprint, not near-field physics
• Abstract entry physics as simply sources of mass, momentum & energy
• Drive simulations via deposition profile taken from:• Models (e.g. ReVelle, Ceplecha, H&G, Shuvalov)• Simulations (Task 2, CTH, ALE3D, Shuvalov, Boslough)• Light-curve derived profiles (Jenniskins, Popova)• Infrasound based energy deposition (Brown, ReVelle)
12
Goal is accurate prediction of surface effects from energy deposition inputs
• Need to derive source terms from deposition profiles

• Release energy, mass and momentum into a corridor of known radius, r
• Over each time step, ∆t, themeteor travels a distance d
• Given: energy deposition profile as a function of altitude
• From modeling
• From simulation
• From observational data
Deposition of Mass, Momentum & EnergyDerive source terms through conservation analysis
dr
13
LETTERdoi:10.1038/nature12741
A 500-kiloton airburst over Chelyabinsk and anenhanced hazard from small impactorsP. G. Brown1,2, J. D. Assink3, L. Astiz4, R. Blaauw5, M. B. Boslough6, J. Borovicka7, N. Brachet3, D. Brown8, M. Campbell-Brown1,L. Ceranna9, W. Cooke10, C. de Groot-Hedlin4, D. P. Drob11, W. Edwards12, L. G. Evers13,14, M. Garces15, J. Gill1, M. Hedlin4,A. Kingery16, G. Laske4, A. Le Pichon3, P. Mialle8, D. E. Moser5, A. Saffer10, E. Silber1, P. Smets13,14, R. E. Spalding6, P. Spurny7,E. Tagliaferri17, D. Uren1, R. J. Weryk1, R. Whitaker18 & Z. Krzeminski1
Most large (over a kilometre in diameter) near-Earth asteroids arenow known, but recognition that airbursts (or fireballs result-ing from nuclear-weapon-sized detonations of meteoroids in theatmosphere) have the potential to do greater damage1 than prev-iously thought has shifted an increasing portion of the residualimpact risk (the risk of impact from an unknown object) to smallerobjects2. Above the threshold size of impactor at which the atmo-sphere absorbs sufficient energy to prevent a ground impact, most ofthe damage is thought to be caused by the airburst shock wave3, butowing to lack of observations this is uncertain4,5. Here we report ananalysis of the damage from the airburst of an asteroid about19 metres (17 to 20 metres) in diameter southeast of Chelyabinsk,Russia, on 15 February 2013, estimated to have an energy equivalentof approximately 500 (6100) kilotons of trinitrotoluene (TNT,where 1 kiloton of TNT 54.18531012 joules). We show that a widely
referenced technique4–6 of estimating airburst damage does notreproduce the observations, and that the mathematical relations7
based on the effects of nuclear weapons—almost always used withthis technique—overestimate blast damage. This suggests that earl-ier damage estimates5,6 near the threshold impactor size are toohigh. We performed a global survey of airbursts of a kiloton or more(including Chelyabinsk), and find that the number of impactorswith diameters of tens of metres may be an order of magnitudehigher than estimates based on other techniques8,9. This suggestsa non-equilibrium (if the population were in a long-term collisionalsteady state the size-frequency distribution would either follow asingle power law or there must be a size-dependent bias in othersurveys) in the near-Earth asteroid population for objects 10 to50 metres in diameter, and shifts more of the residual impact riskto these sizes.
1Department of Physics and Astronomy, University of Western Ontario, London, Ontario N6A 3K7, Canada. 2Centre for Planetary Science and Exploration, University of Western Ontario, London, OntarioN6A 5B7, Canada. 3Commissariat a l’Energie Atomique,DepartementAnalyseSurveillanceEnvironnement (CEA/DAM/DIF), Bruyeres-le-Chatel, 91297 ArpajonCedex, France. 4Laboratory for AtmosphericAcoustics, Institute of Geophysics and Planetary Physics, University of California, San Diego, La Jolla, California 92093-0225, USA. 5Marshall Information Technology Services (MITS)/Dynetics TechnicalServices, NASA Marshall Space Flight Center, Huntsville, Alabama 35812, USA. 6Sandia National Laboratories, PO Box 5800, Albuquerque, New Mexico 87185, USA. 7Astronomical Institute, Academy ofSciences of the Czech Republic, CZ 251 65 Ondrejov, Czech Republic. 8International Data Center, Provisional Technical Secretariat, Comprehensive Test Ban Treaty Organization, PO Box 1200, A-1400Vienna, Austria. 9Bundesanstalt fur Geowissenschaften und Rohstoffe, Stilleweg 2, 30655 Hannover, Germany. 10Meteoroid Environments Office, EV44, Space Environment Team, Marshall Space FlightCenter, Huntsville, Alabama 35812, USA. 11Space Science Division, Naval Research Laboratory, 4555 Overlook Avenue, Washington DC 20375, USA. 12Natural Resources Canada, Canadian HazardInformation Service, 7 Observatory Crescent, Ottawa, Ontario K1A 0Y3, Canada. 13Seismology Division, Royal Netherlands Meteorological Institute, Wilhelminalaan 10, 3732 GK De Bilt, The Netherlands.14Department of Geoscience and Engineering, Faculty of Civil Engineering and Geosciences, Delft University of Technology, Stevinweg 1, 2628 CN Delft, The Netherlands. 15Infrasound Laboratory,University of Hawaii, Manoa 73-4460 Queen Kaahumanu Highway, 119 Kailua-Kona, Hawaii 96740-2638, USA. 16ERC Incorporated/Jacobs ESSSA Group, NASA Marshall Space Flight Center, Huntsville,Alabama 35812, USA. 17ET Space Systems, 5990 Worth Way, Camarillo, California 93012, USA. 18Los Alamos National Laboratory, EES-17 MS F665, PO Box 1663 Los Alamos, New Mexico 87545, USA.
Time (s)–3.0 –2.0 –1.0 0.0 1.0 2.0 3.0
Abs
olut
e br
ight
ness
(mag
nitu
de)
–28
–26
–24
–22
–20
–18
a
Height (km)20253035404550
Ener
gy d
epos
ition
per
uni
t hei
ght
(kt k
m–1
)
0
20
40
60
80
100b
Figure 1 | Light curve of the Chelyabinsk airburst. a, The brightness profilefor the Chelyabinsk airburst, based on indirect illumination measured fromvideo records. The brightness is an average derived from indirect scattered skybrightness from six videos proximal to the airburst, corrected for the sensorgamma setting, autogain, range and airmass extinction, following theprocedure used for other airburst light curves generated from video24,25. Thelight curve has been normalized using the US government sensor data peakbrightness value of 2.7 3 1013 W sr21, corresponding to an absoluteastronomical magnitude of 228 in the silicon bandpass. The individual videolight curves deviate by less than one magnitude between times 22 and 11.5with larger deviations outside this interval. Time zero corresponds to03:20:32.2 UTC on 15 February 2013. b, The energy deposition per unit height
for the Chelyabinsk airburst, based on video data. The conversion to absoluteenergy deposition per unit path length assumes a blackbody emission of6,000 K and bolometric efficiency of 17%, the same as the assumptions usedto convert earlier US government sensor information to energy26. The heightsare computed using the calibrated trajectory10 and features of the lightcurves common to different video sites, resulting in a height accuracy ofabout 1 km. The total energy of the airburst found by integrating under thecurve exceeds 470 kt. The half-energy-deposition height range is 33–27 km;these are the heights at which energy deposition falls below half thepeak value of approximately 80 kt per kilometre of height, which is reachedat an altitude near 29.5 km.
2 3 8 | N A T U R E | V O L 5 0 3 | 1 4 N O V E M B E R 2 0 1 3
Macmillan Publishers Limited. All rights reserved©2013
Etot
Brown et al., Nature, November 2013

Deposition of Mass, Momentum & EnergyConservation of energy
LETTERdoi:10.1038/nature12741
A 500-kiloton airburst over Chelyabinsk and anenhanced hazard from small impactorsP. G. Brown1,2, J. D. Assink3, L. Astiz4, R. Blaauw5, M. B. Boslough6, J. Borovicka7, N. Brachet3, D. Brown8, M. Campbell-Brown1,L. Ceranna9, W. Cooke10, C. de Groot-Hedlin4, D. P. Drob11, W. Edwards12, L. G. Evers13,14, M. Garces15, J. Gill1, M. Hedlin4,A. Kingery16, G. Laske4, A. Le Pichon3, P. Mialle8, D. E. Moser5, A. Saffer10, E. Silber1, P. Smets13,14, R. E. Spalding6, P. Spurny7,E. Tagliaferri17, D. Uren1, R. J. Weryk1, R. Whitaker18 & Z. Krzeminski1
Most large (over a kilometre in diameter) near-Earth asteroids arenow known, but recognition that airbursts (or fireballs result-ing from nuclear-weapon-sized detonations of meteoroids in theatmosphere) have the potential to do greater damage1 than prev-iously thought has shifted an increasing portion of the residualimpact risk (the risk of impact from an unknown object) to smallerobjects2. Above the threshold size of impactor at which the atmo-sphere absorbs sufficient energy to prevent a ground impact, most ofthe damage is thought to be caused by the airburst shock wave3, butowing to lack of observations this is uncertain4,5. Here we report ananalysis of the damage from the airburst of an asteroid about19 metres (17 to 20 metres) in diameter southeast of Chelyabinsk,Russia, on 15 February 2013, estimated to have an energy equivalentof approximately 500 (6100) kilotons of trinitrotoluene (TNT,where 1 kiloton of TNT 54.18531012 joules). We show that a widely
referenced technique4–6 of estimating airburst damage does notreproduce the observations, and that the mathematical relations7
based on the effects of nuclear weapons—almost always used withthis technique—overestimate blast damage. This suggests that earl-ier damage estimates5,6 near the threshold impactor size are toohigh. We performed a global survey of airbursts of a kiloton or more(including Chelyabinsk), and find that the number of impactorswith diameters of tens of metres may be an order of magnitudehigher than estimates based on other techniques8,9. This suggestsa non-equilibrium (if the population were in a long-term collisionalsteady state the size-frequency distribution would either follow asingle power law or there must be a size-dependent bias in othersurveys) in the near-Earth asteroid population for objects 10 to50 metres in diameter, and shifts more of the residual impact riskto these sizes.
1Department of Physics and Astronomy, University of Western Ontario, London, Ontario N6A 3K7, Canada. 2Centre for Planetary Science and Exploration, University of Western Ontario, London, OntarioN6A 5B7, Canada. 3Commissariat a l’Energie Atomique,DepartementAnalyseSurveillanceEnvironnement (CEA/DAM/DIF), Bruyeres-le-Chatel, 91297 ArpajonCedex, France. 4Laboratory for AtmosphericAcoustics, Institute of Geophysics and Planetary Physics, University of California, San Diego, La Jolla, California 92093-0225, USA. 5Marshall Information Technology Services (MITS)/Dynetics TechnicalServices, NASA Marshall Space Flight Center, Huntsville, Alabama 35812, USA. 6Sandia National Laboratories, PO Box 5800, Albuquerque, New Mexico 87185, USA. 7Astronomical Institute, Academy ofSciences of the Czech Republic, CZ 251 65 Ondrejov, Czech Republic. 8International Data Center, Provisional Technical Secretariat, Comprehensive Test Ban Treaty Organization, PO Box 1200, A-1400Vienna, Austria. 9Bundesanstalt fur Geowissenschaften und Rohstoffe, Stilleweg 2, 30655 Hannover, Germany. 10Meteoroid Environments Office, EV44, Space Environment Team, Marshall Space FlightCenter, Huntsville, Alabama 35812, USA. 11Space Science Division, Naval Research Laboratory, 4555 Overlook Avenue, Washington DC 20375, USA. 12Natural Resources Canada, Canadian HazardInformation Service, 7 Observatory Crescent, Ottawa, Ontario K1A 0Y3, Canada. 13Seismology Division, Royal Netherlands Meteorological Institute, Wilhelminalaan 10, 3732 GK De Bilt, The Netherlands.14Department of Geoscience and Engineering, Faculty of Civil Engineering and Geosciences, Delft University of Technology, Stevinweg 1, 2628 CN Delft, The Netherlands. 15Infrasound Laboratory,University of Hawaii, Manoa 73-4460 Queen Kaahumanu Highway, 119 Kailua-Kona, Hawaii 96740-2638, USA. 16ERC Incorporated/Jacobs ESSSA Group, NASA Marshall Space Flight Center, Huntsville,Alabama 35812, USA. 17ET Space Systems, 5990 Worth Way, Camarillo, California 93012, USA. 18Los Alamos National Laboratory, EES-17 MS F665, PO Box 1663 Los Alamos, New Mexico 87545, USA.
Time (s)–3.0 –2.0 –1.0 0.0 1.0 2.0 3.0
Abs
olut
e br
ight
ness
(mag
nitu
de)
–28
–26
–24
–22
–20
–18
a
Height (km)20253035404550
Ener
gy d
epos
ition
per
uni
t hei
ght
(kt k
m–1
)
0
20
40
60
80
100b
Figure 1 | Light curve of the Chelyabinsk airburst. a, The brightness profilefor the Chelyabinsk airburst, based on indirect illumination measured fromvideo records. The brightness is an average derived from indirect scattered skybrightness from six videos proximal to the airburst, corrected for the sensorgamma setting, autogain, range and airmass extinction, following theprocedure used for other airburst light curves generated from video24,25. Thelight curve has been normalized using the US government sensor data peakbrightness value of 2.7 3 1013 W sr21, corresponding to an absoluteastronomical magnitude of 228 in the silicon bandpass. The individual videolight curves deviate by less than one magnitude between times 22 and 11.5with larger deviations outside this interval. Time zero corresponds to03:20:32.2 UTC on 15 February 2013. b, The energy deposition per unit height
for the Chelyabinsk airburst, based on video data. The conversion to absoluteenergy deposition per unit path length assumes a blackbody emission of6,000 K and bolometric efficiency of 17%, the same as the assumptions usedto convert earlier US government sensor information to energy26. The heightsare computed using the calibrated trajectory10 and features of the lightcurves common to different video sites, resulting in a height accuracy ofabout 1 km. The total energy of the airburst found by integrating under thecurve exceeds 470 kt. The half-energy-deposition height range is 33–27 km;these are the heights at which energy deposition falls below half thepeak value of approximately 80 kt per kilometre of height, which is reachedat an altitude near 29.5 km.
2 3 8 | N A T U R E | V O L 5 0 3 | 1 4 N O V E M B E R 2 0 1 3
Macmillan Publishers Limited. All rights reserved©2013
• Given energy deposition we know the total energy released is area under profile
Etot
=
ZdE
dhdh ( + radiation )
area = Etot
14

020406080100Trajectory Distance (km)
20
40
60
80
100
Ener
gy D
epos
ition
(kt
/km
)
Deposition of Mass, Momentum & EnergyConservation of energy
LETTERdoi:10.1038/nature12741
A 500-kiloton airburst over Chelyabinsk and anenhanced hazard from small impactorsP. G. Brown1,2, J. D. Assink3, L. Astiz4, R. Blaauw5, M. B. Boslough6, J. Borovicka7, N. Brachet3, D. Brown8, M. Campbell-Brown1,L. Ceranna9, W. Cooke10, C. de Groot-Hedlin4, D. P. Drob11, W. Edwards12, L. G. Evers13,14, M. Garces15, J. Gill1, M. Hedlin4,A. Kingery16, G. Laske4, A. Le Pichon3, P. Mialle8, D. E. Moser5, A. Saffer10, E. Silber1, P. Smets13,14, R. E. Spalding6, P. Spurny7,E. Tagliaferri17, D. Uren1, R. J. Weryk1, R. Whitaker18 & Z. Krzeminski1
Most large (over a kilometre in diameter) near-Earth asteroids arenow known, but recognition that airbursts (or fireballs result-ing from nuclear-weapon-sized detonations of meteoroids in theatmosphere) have the potential to do greater damage1 than prev-iously thought has shifted an increasing portion of the residualimpact risk (the risk of impact from an unknown object) to smallerobjects2. Above the threshold size of impactor at which the atmo-sphere absorbs sufficient energy to prevent a ground impact, most ofthe damage is thought to be caused by the airburst shock wave3, butowing to lack of observations this is uncertain4,5. Here we report ananalysis of the damage from the airburst of an asteroid about19 metres (17 to 20 metres) in diameter southeast of Chelyabinsk,Russia, on 15 February 2013, estimated to have an energy equivalentof approximately 500 (6100) kilotons of trinitrotoluene (TNT,where 1 kiloton of TNT 54.18531012 joules). We show that a widely
referenced technique4–6 of estimating airburst damage does notreproduce the observations, and that the mathematical relations7
based on the effects of nuclear weapons—almost always used withthis technique—overestimate blast damage. This suggests that earl-ier damage estimates5,6 near the threshold impactor size are toohigh. We performed a global survey of airbursts of a kiloton or more(including Chelyabinsk), and find that the number of impactorswith diameters of tens of metres may be an order of magnitudehigher than estimates based on other techniques8,9. This suggestsa non-equilibrium (if the population were in a long-term collisionalsteady state the size-frequency distribution would either follow asingle power law or there must be a size-dependent bias in othersurveys) in the near-Earth asteroid population for objects 10 to50 metres in diameter, and shifts more of the residual impact riskto these sizes.
1Department of Physics and Astronomy, University of Western Ontario, London, Ontario N6A 3K7, Canada. 2Centre for Planetary Science and Exploration, University of Western Ontario, London, OntarioN6A 5B7, Canada. 3Commissariat a l’Energie Atomique,DepartementAnalyseSurveillanceEnvironnement (CEA/DAM/DIF), Bruyeres-le-Chatel, 91297 ArpajonCedex, France. 4Laboratory for AtmosphericAcoustics, Institute of Geophysics and Planetary Physics, University of California, San Diego, La Jolla, California 92093-0225, USA. 5Marshall Information Technology Services (MITS)/Dynetics TechnicalServices, NASA Marshall Space Flight Center, Huntsville, Alabama 35812, USA. 6Sandia National Laboratories, PO Box 5800, Albuquerque, New Mexico 87185, USA. 7Astronomical Institute, Academy ofSciences of the Czech Republic, CZ 251 65 Ondrejov, Czech Republic. 8International Data Center, Provisional Technical Secretariat, Comprehensive Test Ban Treaty Organization, PO Box 1200, A-1400Vienna, Austria. 9Bundesanstalt fur Geowissenschaften und Rohstoffe, Stilleweg 2, 30655 Hannover, Germany. 10Meteoroid Environments Office, EV44, Space Environment Team, Marshall Space FlightCenter, Huntsville, Alabama 35812, USA. 11Space Science Division, Naval Research Laboratory, 4555 Overlook Avenue, Washington DC 20375, USA. 12Natural Resources Canada, Canadian HazardInformation Service, 7 Observatory Crescent, Ottawa, Ontario K1A 0Y3, Canada. 13Seismology Division, Royal Netherlands Meteorological Institute, Wilhelminalaan 10, 3732 GK De Bilt, The Netherlands.14Department of Geoscience and Engineering, Faculty of Civil Engineering and Geosciences, Delft University of Technology, Stevinweg 1, 2628 CN Delft, The Netherlands. 15Infrasound Laboratory,University of Hawaii, Manoa 73-4460 Queen Kaahumanu Highway, 119 Kailua-Kona, Hawaii 96740-2638, USA. 16ERC Incorporated/Jacobs ESSSA Group, NASA Marshall Space Flight Center, Huntsville,Alabama 35812, USA. 17ET Space Systems, 5990 Worth Way, Camarillo, California 93012, USA. 18Los Alamos National Laboratory, EES-17 MS F665, PO Box 1663 Los Alamos, New Mexico 87545, USA.
Time (s)–3.0 –2.0 –1.0 0.0 1.0 2.0 3.0
Abs
olut
e br
ight
ness
(mag
nitu
de)
–28
–26
–24
–22
–20
–18
a
Height (km)20253035404550
Ener
gy d
epos
ition
per
uni
t hei
ght
(kt k
m–1
)
0
20
40
60
80
100b
Figure 1 | Light curve of the Chelyabinsk airburst. a, The brightness profilefor the Chelyabinsk airburst, based on indirect illumination measured fromvideo records. The brightness is an average derived from indirect scattered skybrightness from six videos proximal to the airburst, corrected for the sensorgamma setting, autogain, range and airmass extinction, following theprocedure used for other airburst light curves generated from video24,25. Thelight curve has been normalized using the US government sensor data peakbrightness value of 2.7 3 1013 W sr21, corresponding to an absoluteastronomical magnitude of 228 in the silicon bandpass. The individual videolight curves deviate by less than one magnitude between times 22 and 11.5with larger deviations outside this interval. Time zero corresponds to03:20:32.2 UTC on 15 February 2013. b, The energy deposition per unit height
for the Chelyabinsk airburst, based on video data. The conversion to absoluteenergy deposition per unit path length assumes a blackbody emission of6,000 K and bolometric efficiency of 17%, the same as the assumptions usedto convert earlier US government sensor information to energy26. The heightsare computed using the calibrated trajectory10 and features of the lightcurves common to different video sites, resulting in a height accuracy ofabout 1 km. The total energy of the airburst found by integrating under thecurve exceeds 470 kt. The half-energy-deposition height range is 33–27 km;these are the heights at which energy deposition falls below half thepeak value of approximately 80 kt per kilometre of height, which is reachedat an altitude near 29.5 km.
2 3 8 | N A T U R E | V O L 5 0 3 | 1 4 N O V E M B E R 2 0 1 3
Macmillan Publishers Limited. All rights reserved©2013
• Given energy deposition we know the total energy released is area under profile
• For known entry angle, can rescale profile to be energy released along trajectory, x
Etot
=
ZdE
dhdh ( + radiation )
E
tot
=
ZdE
dx
dx
Etot
area = Etot
15

020406080100Trajectory Distance (km)
20
40
60
80
100
Ener
gy D
epos
ition
(kt
/km
)
Deposition of Mass, Momentum & EnergyConservation of energy• Given energy deposition we know the total
energy released is area under profile
• For known entry angle, can rescale profile to be energy released along trajectory, x
Etot
=
ZdE
dhdh ( + radiation )
E
tot
=
ZdE
dx
dx
16
x
z ∆t
• This energy gets released into the mesh cells which intersect the tube surrounding the meteor at each time step, ∆t
Etot
energy deposited in ∆t

020406080100Trajectory Distance (km)
20
40
60
80
100
Ener
gy D
epos
ition
(kt
/km
)
Deposition of Mass, Momentum & EnergyConservation of energy• Given energy deposition we know the total
energy released is area under profile
• For known entry angle, can rescale profile to be energy released along trajectory, x
Etot
=
ZdE
dhdh ( + radiation )
E
tot
=
ZdE
dx
dx
Etot
17
LETTERdoi:10.1038/nature12741
A 500-kiloton airburst over Chelyabinsk and anenhanced hazard from small impactorsP. G. Brown1,2, J. D. Assink3, L. Astiz4, R. Blaauw5, M. B. Boslough6, J. Borovicka7, N. Brachet3, D. Brown8, M. Campbell-Brown1,L. Ceranna9, W. Cooke10, C. de Groot-Hedlin4, D. P. Drob11, W. Edwards12, L. G. Evers13,14, M. Garces15, J. Gill1, M. Hedlin4,A. Kingery16, G. Laske4, A. Le Pichon3, P. Mialle8, D. E. Moser5, A. Saffer10, E. Silber1, P. Smets13,14, R. E. Spalding6, P. Spurny7,E. Tagliaferri17, D. Uren1, R. J. Weryk1, R. Whitaker18 & Z. Krzeminski1
Most large (over a kilometre in diameter) near-Earth asteroids arenow known, but recognition that airbursts (or fireballs result-ing from nuclear-weapon-sized detonations of meteoroids in theatmosphere) have the potential to do greater damage1 than prev-iously thought has shifted an increasing portion of the residualimpact risk (the risk of impact from an unknown object) to smallerobjects2. Above the threshold size of impactor at which the atmo-sphere absorbs sufficient energy to prevent a ground impact, most ofthe damage is thought to be caused by the airburst shock wave3, butowing to lack of observations this is uncertain4,5. Here we report ananalysis of the damage from the airburst of an asteroid about19 metres (17 to 20 metres) in diameter southeast of Chelyabinsk,Russia, on 15 February 2013, estimated to have an energy equivalentof approximately 500 (6100) kilotons of trinitrotoluene (TNT,where 1 kiloton of TNT 54.18531012 joules). We show that a widely
referenced technique4–6 of estimating airburst damage does notreproduce the observations, and that the mathematical relations7
based on the effects of nuclear weapons—almost always used withthis technique—overestimate blast damage. This suggests that earl-ier damage estimates5,6 near the threshold impactor size are toohigh. We performed a global survey of airbursts of a kiloton or more(including Chelyabinsk), and find that the number of impactorswith diameters of tens of metres may be an order of magnitudehigher than estimates based on other techniques8,9. This suggestsa non-equilibrium (if the population were in a long-term collisionalsteady state the size-frequency distribution would either follow asingle power law or there must be a size-dependent bias in othersurveys) in the near-Earth asteroid population for objects 10 to50 metres in diameter, and shifts more of the residual impact riskto these sizes.
1Department of Physics and Astronomy, University of Western Ontario, London, Ontario N6A 3K7, Canada. 2Centre for Planetary Science and Exploration, University of Western Ontario, London, OntarioN6A 5B7, Canada. 3Commissariat a l’Energie Atomique,DepartementAnalyseSurveillanceEnvironnement (CEA/DAM/DIF), Bruyeres-le-Chatel, 91297 ArpajonCedex, France. 4Laboratory for AtmosphericAcoustics, Institute of Geophysics and Planetary Physics, University of California, San Diego, La Jolla, California 92093-0225, USA. 5Marshall Information Technology Services (MITS)/Dynetics TechnicalServices, NASA Marshall Space Flight Center, Huntsville, Alabama 35812, USA. 6Sandia National Laboratories, PO Box 5800, Albuquerque, New Mexico 87185, USA. 7Astronomical Institute, Academy ofSciences of the Czech Republic, CZ 251 65 Ondrejov, Czech Republic. 8International Data Center, Provisional Technical Secretariat, Comprehensive Test Ban Treaty Organization, PO Box 1200, A-1400Vienna, Austria. 9Bundesanstalt fur Geowissenschaften und Rohstoffe, Stilleweg 2, 30655 Hannover, Germany. 10Meteoroid Environments Office, EV44, Space Environment Team, Marshall Space FlightCenter, Huntsville, Alabama 35812, USA. 11Space Science Division, Naval Research Laboratory, 4555 Overlook Avenue, Washington DC 20375, USA. 12Natural Resources Canada, Canadian HazardInformation Service, 7 Observatory Crescent, Ottawa, Ontario K1A 0Y3, Canada. 13Seismology Division, Royal Netherlands Meteorological Institute, Wilhelminalaan 10, 3732 GK De Bilt, The Netherlands.14Department of Geoscience and Engineering, Faculty of Civil Engineering and Geosciences, Delft University of Technology, Stevinweg 1, 2628 CN Delft, The Netherlands. 15Infrasound Laboratory,University of Hawaii, Manoa 73-4460 Queen Kaahumanu Highway, 119 Kailua-Kona, Hawaii 96740-2638, USA. 16ERC Incorporated/Jacobs ESSSA Group, NASA Marshall Space Flight Center, Huntsville,Alabama 35812, USA. 17ET Space Systems, 5990 Worth Way, Camarillo, California 93012, USA. 18Los Alamos National Laboratory, EES-17 MS F665, PO Box 1663 Los Alamos, New Mexico 87545, USA.
Time (s)–3.0 –2.0 –1.0 0.0 1.0 2.0 3.0
Abs
olut
e br
ight
ness
(mag
nitu
de)
–28
–26
–24
–22
–20
–18
a
Height (km)20253035404550
Ener
gy d
epos
ition
per
uni
t hei
ght
(kt k
m–1
)
0
20
40
60
80
100b
Figure 1 | Light curve of the Chelyabinsk airburst. a, The brightness profilefor the Chelyabinsk airburst, based on indirect illumination measured fromvideo records. The brightness is an average derived from indirect scattered skybrightness from six videos proximal to the airburst, corrected for the sensorgamma setting, autogain, range and airmass extinction, following theprocedure used for other airburst light curves generated from video24,25. Thelight curve has been normalized using the US government sensor data peakbrightness value of 2.7 3 1013 W sr21, corresponding to an absoluteastronomical magnitude of 228 in the silicon bandpass. The individual videolight curves deviate by less than one magnitude between times 22 and 11.5with larger deviations outside this interval. Time zero corresponds to03:20:32.2 UTC on 15 February 2013. b, The energy deposition per unit height
for the Chelyabinsk airburst, based on video data. The conversion to absoluteenergy deposition per unit path length assumes a blackbody emission of6,000 K and bolometric efficiency of 17%, the same as the assumptions usedto convert earlier US government sensor information to energy26. The heightsare computed using the calibrated trajectory10 and features of the lightcurves common to different video sites, resulting in a height accuracy ofabout 1 km. The total energy of the airburst found by integrating under thecurve exceeds 470 kt. The half-energy-deposition height range is 33–27 km;these are the heights at which energy deposition falls below half thepeak value of approximately 80 kt per kilometre of height, which is reachedat an altitude near 29.5 km.
2 3 8 | N A T U R E | V O L 5 0 3 | 1 4 N O V E M B E R 2 0 1 3
Macmillan Publishers Limited. All rights reserved©2013
area = Etot

020406080100Trajectory Distance (km)
20
40
60
80
100
Ener
gy D
epos
ition
(kt
/km
)
Deposition of Mass, Momentum & EnergyConservation of energy• Given energy deposition we know the total
energy released is area under profile
• For known entry angle, can rescale profile to be energy released along trajectory, x
• Since work = (force x distance), and aerodynamic drag is doing all the work, this profile is identically drag along the trajectory
Etot
=
ZdE
dhdh ( + radiation )
E
tot
=
ZdE
dx
dx
E
tot
=
ZdE
dx
dx =
ZD(x) dx A
erod
ynam
ic D
rag
(kt/k
m) Local value of
Drag, D (x )
18
LETTERdoi:10.1038/nature12741
A 500-kiloton airburst over Chelyabinsk and anenhanced hazard from small impactorsP. G. Brown1,2, J. D. Assink3, L. Astiz4, R. Blaauw5, M. B. Boslough6, J. Borovicka7, N. Brachet3, D. Brown8, M. Campbell-Brown1,L. Ceranna9, W. Cooke10, C. de Groot-Hedlin4, D. P. Drob11, W. Edwards12, L. G. Evers13,14, M. Garces15, J. Gill1, M. Hedlin4,A. Kingery16, G. Laske4, A. Le Pichon3, P. Mialle8, D. E. Moser5, A. Saffer10, E. Silber1, P. Smets13,14, R. E. Spalding6, P. Spurny7,E. Tagliaferri17, D. Uren1, R. J. Weryk1, R. Whitaker18 & Z. Krzeminski1
Most large (over a kilometre in diameter) near-Earth asteroids arenow known, but recognition that airbursts (or fireballs result-ing from nuclear-weapon-sized detonations of meteoroids in theatmosphere) have the potential to do greater damage1 than prev-iously thought has shifted an increasing portion of the residualimpact risk (the risk of impact from an unknown object) to smallerobjects2. Above the threshold size of impactor at which the atmo-sphere absorbs sufficient energy to prevent a ground impact, most ofthe damage is thought to be caused by the airburst shock wave3, butowing to lack of observations this is uncertain4,5. Here we report ananalysis of the damage from the airburst of an asteroid about19 metres (17 to 20 metres) in diameter southeast of Chelyabinsk,Russia, on 15 February 2013, estimated to have an energy equivalentof approximately 500 (6100) kilotons of trinitrotoluene (TNT,where 1 kiloton of TNT 54.18531012 joules). We show that a widely
referenced technique4–6 of estimating airburst damage does notreproduce the observations, and that the mathematical relations7
based on the effects of nuclear weapons—almost always used withthis technique—overestimate blast damage. This suggests that earl-ier damage estimates5,6 near the threshold impactor size are toohigh. We performed a global survey of airbursts of a kiloton or more(including Chelyabinsk), and find that the number of impactorswith diameters of tens of metres may be an order of magnitudehigher than estimates based on other techniques8,9. This suggestsa non-equilibrium (if the population were in a long-term collisionalsteady state the size-frequency distribution would either follow asingle power law or there must be a size-dependent bias in othersurveys) in the near-Earth asteroid population for objects 10 to50 metres in diameter, and shifts more of the residual impact riskto these sizes.
1Department of Physics and Astronomy, University of Western Ontario, London, Ontario N6A 3K7, Canada. 2Centre for Planetary Science and Exploration, University of Western Ontario, London, OntarioN6A 5B7, Canada. 3Commissariat a l’Energie Atomique,DepartementAnalyseSurveillanceEnvironnement (CEA/DAM/DIF), Bruyeres-le-Chatel, 91297 ArpajonCedex, France. 4Laboratory for AtmosphericAcoustics, Institute of Geophysics and Planetary Physics, University of California, San Diego, La Jolla, California 92093-0225, USA. 5Marshall Information Technology Services (MITS)/Dynetics TechnicalServices, NASA Marshall Space Flight Center, Huntsville, Alabama 35812, USA. 6Sandia National Laboratories, PO Box 5800, Albuquerque, New Mexico 87185, USA. 7Astronomical Institute, Academy ofSciences of the Czech Republic, CZ 251 65 Ondrejov, Czech Republic. 8International Data Center, Provisional Technical Secretariat, Comprehensive Test Ban Treaty Organization, PO Box 1200, A-1400Vienna, Austria. 9Bundesanstalt fur Geowissenschaften und Rohstoffe, Stilleweg 2, 30655 Hannover, Germany. 10Meteoroid Environments Office, EV44, Space Environment Team, Marshall Space FlightCenter, Huntsville, Alabama 35812, USA. 11Space Science Division, Naval Research Laboratory, 4555 Overlook Avenue, Washington DC 20375, USA. 12Natural Resources Canada, Canadian HazardInformation Service, 7 Observatory Crescent, Ottawa, Ontario K1A 0Y3, Canada. 13Seismology Division, Royal Netherlands Meteorological Institute, Wilhelminalaan 10, 3732 GK De Bilt, The Netherlands.14Department of Geoscience and Engineering, Faculty of Civil Engineering and Geosciences, Delft University of Technology, Stevinweg 1, 2628 CN Delft, The Netherlands. 15Infrasound Laboratory,University of Hawaii, Manoa 73-4460 Queen Kaahumanu Highway, 119 Kailua-Kona, Hawaii 96740-2638, USA. 16ERC Incorporated/Jacobs ESSSA Group, NASA Marshall Space Flight Center, Huntsville,Alabama 35812, USA. 17ET Space Systems, 5990 Worth Way, Camarillo, California 93012, USA. 18Los Alamos National Laboratory, EES-17 MS F665, PO Box 1663 Los Alamos, New Mexico 87545, USA.
Time (s)–3.0 –2.0 –1.0 0.0 1.0 2.0 3.0
Abs
olut
e br
ight
ness
(mag
nitu
de)
–28
–26
–24
–22
–20
–18
a
Height (km)20253035404550
Ener
gy d
epos
ition
per
uni
t hei
ght
(kt k
m–1
)
0
20
40
60
80
100b
Figure 1 | Light curve of the Chelyabinsk airburst. a, The brightness profilefor the Chelyabinsk airburst, based on indirect illumination measured fromvideo records. The brightness is an average derived from indirect scattered skybrightness from six videos proximal to the airburst, corrected for the sensorgamma setting, autogain, range and airmass extinction, following theprocedure used for other airburst light curves generated from video24,25. Thelight curve has been normalized using the US government sensor data peakbrightness value of 2.7 3 1013 W sr21, corresponding to an absoluteastronomical magnitude of 228 in the silicon bandpass. The individual videolight curves deviate by less than one magnitude between times 22 and 11.5with larger deviations outside this interval. Time zero corresponds to03:20:32.2 UTC on 15 February 2013. b, The energy deposition per unit height
for the Chelyabinsk airburst, based on video data. The conversion to absoluteenergy deposition per unit path length assumes a blackbody emission of6,000 K and bolometric efficiency of 17%, the same as the assumptions usedto convert earlier US government sensor information to energy26. The heightsare computed using the calibrated trajectory10 and features of the lightcurves common to different video sites, resulting in a height accuracy ofabout 1 km. The total energy of the airburst found by integrating under thecurve exceeds 470 kt. The half-energy-deposition height range is 33–27 km;these are the heights at which energy deposition falls below half thepeak value of approximately 80 kt per kilometre of height, which is reachedat an altitude near 29.5 km.
2 3 8 | N A T U R E | V O L 5 0 3 | 1 4 N O V E M B E R 2 0 1 3
Macmillan Publishers Limited. All rights reserved©2013
area = Etot

• Mass loss equation
• Recall that aerodynamic drag is
• So mass loss is simply
Deposition of Mass, Momentum & Energy
dr
Conservation of mass & momentumdM
dt= ��CDSm
1
2⇢airU
3m
020406080100Trajectory Distance (km)
20
40
60
80
100
Ener
gy D
epos
ition
(kt
/km
)M
ass D
epos
ition
(kg/
km)
Local mass deposition
rate
19
dM
dt= ��DUm
D = CDSmq1 q1 =1
2⇢airU
2mwith
area = Total mass deposited

• Mass loss equation
• Recall that aerodynamic drag is
• So mass loss is simply
• Assuming constant Um and σ, local deposition of mass scales directly with Drag
Deposition of Mass, Momentum & Energy
dr
Conservation of mass & momentumdM
dt= ��CDSm
1
2⇢airU
3m
020406080100Trajectory Distance (km)
20
40
60
80
100
Ener
gy D
epos
ition
(kt
/km
)M
ass D
epos
ition
(kg/
km)
Local mass deposition
rate
20
dM
dt= ��DUm
D = CDSmq1 with
area = Total mass deposited
q1 =1
2⇢airU
2m

• Mass loss equation
• Recall that aerodynamic drag is
• So mass loss is simply
• Assuming constant Um and σ, local deposition of mass scales directly with Drag
• Area under profile is total mass deposited (Mentry – MGroundFragments)
• From mass deposition and velocity, we also know momentum deposition
Deposition of Mass, Momentum & Energy
dr
Conservation of mass & momentumdM
dt= ��CDSm
1
2⇢airU
3m
020406080100Trajectory Distance (km)
20
40
60
80
100
Ener
gy D
epos
ition
(kt
/km
)M
ass D
epos
ition
(kg/
km)
21
dM
dt= ��DUm
D = CDSmq1 with
area = Total mass deposited
Local mass deposition
rate
q1 =1
2⇢airU
2m

Overview
• Modeling tools & solver
• Verification & Validation• Basic – Spherical charge examples• Chelyabinsk Case Study
• Investigations of ground-footprint sensitivity• Line-source vs time-dependent entry• Entry Angle
• Upcoming Efforts
Report current status of effort and connection with PRA and tsunami
22

Basic Verification & ValidationBlast from a spherical charge
• Static spherical charge with• No buoyancy• Etot = 520 kt, • Initial radius, ri = 1km
• Classical refs.• Brode, H. L.,Blast wave from a
spherical charge, J. Phys. Fluids. (1959) • D. L. Jones. Intermediate strength blast
wave. Physics of Fluids (1968)
2 4 6 8 10 12Distance (km)
-0.5
0
0.5
1
1.5
Ove
rpre
ssur
e (a
tm)
3.25 sec 6.46 sec10.24 sec14.03 sec19.85 sec
xri
Overpressure Evolution with Distance
ri = 1kmEtot = 520
Setup
23

Basic Verification & ValidationBlast from a spherical charge
Space-time overpressure evolution
• Etot = 520 kt, Initial radius, ri = 1km, no buoyancy
24

Basic Verification & ValidationBlasts over ground plane
• Numerous examples static and moving blasts over ground plane with buoyancy
• Static airburst with buoyancy
• Moving airburst
3DCart3DCart
t+100 t+200 t+500 t+1600
25

Basic Verification & ValidationBlasts over ground plane
• Numerous examples static and moving blasts over ground plane with buoyancy
• Static airburst with buoyancy
• Moving airburst
3DCart3DCart
t+100 t+200 t+500 t+1600
25

Basic Verification & ValidationBlasts over ground plane
• Numerous examples static and moving blasts over ground plane with buoyancy
• Static airburst with buoyancy
• Moving airburst
3DCart3DCart
t+100 t+200 t+500 t+1600
26

Basic Verification & ValidationBlasts over ground plane
• Numerous examples static and moving blasts over ground plane with buoyancy
• Static airburst with buoyancy
• Moving airburst
3DCart3DCart
t+100 t+200 t+500 t+1600
26

Basic Verification & ValidationBlasts over ground plane
• Numerous examples static and moving blasts over ground plane with buoyancy
• Static airburst with buoyancy
• Moving airburst
3DCart3DCart
t+100 t+200 t+500 t+1600
26

Basic Verification & ValidationBlasts over ground plane
3DCart3DCart
t+100 t+200 t+500 t+1600
• Numerous examples static and moving blasts over ground plane with buoyancy
• Static airburst with buoyancy
• Moving airburst
27

Basic Verification & ValidationBlasts over ground plane
3DCart3DCart
t+100 t+200 t+500 t+1600
• Numerous examples static and moving blasts over ground plane with buoyancy
• Static airburst with buoyancy
• Moving airburst
27

Validation: Chelyabinsk MeteorFebruary 15, 2013
LETTERdoi:10.1038/nature12741
A 500-kiloton airburst over Chelyabinsk and anenhanced hazard from small impactorsP. G. Brown1,2, J. D. Assink3, L. Astiz4, R. Blaauw5, M. B. Boslough6, J. Borovicka7, N. Brachet3, D. Brown8, M. Campbell-Brown1,L. Ceranna9, W. Cooke10, C. de Groot-Hedlin4, D. P. Drob11, W. Edwards12, L. G. Evers13,14, M. Garces15, J. Gill1, M. Hedlin4,A. Kingery16, G. Laske4, A. Le Pichon3, P. Mialle8, D. E. Moser5, A. Saffer10, E. Silber1, P. Smets13,14, R. E. Spalding6, P. Spurny7,E. Tagliaferri17, D. Uren1, R. J. Weryk1, R. Whitaker18 & Z. Krzeminski1
Most large (over a kilometre in diameter) near-Earth asteroids arenow known, but recognition that airbursts (or fireballs result-ing from nuclear-weapon-sized detonations of meteoroids in theatmosphere) have the potential to do greater damage1 than prev-iously thought has shifted an increasing portion of the residualimpact risk (the risk of impact from an unknown object) to smallerobjects2. Above the threshold size of impactor at which the atmo-sphere absorbs sufficient energy to prevent a ground impact, most ofthe damage is thought to be caused by the airburst shock wave3, butowing to lack of observations this is uncertain4,5. Here we report ananalysis of the damage from the airburst of an asteroid about19 metres (17 to 20 metres) in diameter southeast of Chelyabinsk,Russia, on 15 February 2013, estimated to have an energy equivalentof approximately 500 (6100) kilotons of trinitrotoluene (TNT,where 1 kiloton of TNT 54.18531012 joules). We show that a widely
referenced technique4–6 of estimating airburst damage does notreproduce the observations, and that the mathematical relations7
based on the effects of nuclear weapons—almost always used withthis technique—overestimate blast damage. This suggests that earl-ier damage estimates5,6 near the threshold impactor size are toohigh. We performed a global survey of airbursts of a kiloton or more(including Chelyabinsk), and find that the number of impactorswith diameters of tens of metres may be an order of magnitudehigher than estimates based on other techniques8,9. This suggestsa non-equilibrium (if the population were in a long-term collisionalsteady state the size-frequency distribution would either follow asingle power law or there must be a size-dependent bias in othersurveys) in the near-Earth asteroid population for objects 10 to50 metres in diameter, and shifts more of the residual impact riskto these sizes.
1Department of Physics and Astronomy, University of Western Ontario, London, Ontario N6A 3K7, Canada. 2Centre for Planetary Science and Exploration, University of Western Ontario, London, OntarioN6A 5B7, Canada. 3Commissariat a l’Energie Atomique,DepartementAnalyseSurveillanceEnvironnement (CEA/DAM/DIF), Bruyeres-le-Chatel, 91297 ArpajonCedex, France. 4Laboratory for AtmosphericAcoustics, Institute of Geophysics and Planetary Physics, University of California, San Diego, La Jolla, California 92093-0225, USA. 5Marshall Information Technology Services (MITS)/Dynetics TechnicalServices, NASA Marshall Space Flight Center, Huntsville, Alabama 35812, USA. 6Sandia National Laboratories, PO Box 5800, Albuquerque, New Mexico 87185, USA. 7Astronomical Institute, Academy ofSciences of the Czech Republic, CZ 251 65 Ondrejov, Czech Republic. 8International Data Center, Provisional Technical Secretariat, Comprehensive Test Ban Treaty Organization, PO Box 1200, A-1400Vienna, Austria. 9Bundesanstalt fur Geowissenschaften und Rohstoffe, Stilleweg 2, 30655 Hannover, Germany. 10Meteoroid Environments Office, EV44, Space Environment Team, Marshall Space FlightCenter, Huntsville, Alabama 35812, USA. 11Space Science Division, Naval Research Laboratory, 4555 Overlook Avenue, Washington DC 20375, USA. 12Natural Resources Canada, Canadian HazardInformation Service, 7 Observatory Crescent, Ottawa, Ontario K1A 0Y3, Canada. 13Seismology Division, Royal Netherlands Meteorological Institute, Wilhelminalaan 10, 3732 GK De Bilt, The Netherlands.14Department of Geoscience and Engineering, Faculty of Civil Engineering and Geosciences, Delft University of Technology, Stevinweg 1, 2628 CN Delft, The Netherlands. 15Infrasound Laboratory,University of Hawaii, Manoa 73-4460 Queen Kaahumanu Highway, 119 Kailua-Kona, Hawaii 96740-2638, USA. 16ERC Incorporated/Jacobs ESSSA Group, NASA Marshall Space Flight Center, Huntsville,Alabama 35812, USA. 17ET Space Systems, 5990 Worth Way, Camarillo, California 93012, USA. 18Los Alamos National Laboratory, EES-17 MS F665, PO Box 1663 Los Alamos, New Mexico 87545, USA.
Time (s)–3.0 –2.0 –1.0 0.0 1.0 2.0 3.0
Abs
olut
e br
ight
ness
(mag
nitu
de)
–28
–26
–24
–22
–20
–18
a
Height (km)20253035404550
Ener
gy d
epos
ition
per
uni
t hei
ght
(kt k
m–1
)
0
20
40
60
80
100b
Figure 1 | Light curve of the Chelyabinsk airburst. a, The brightness profilefor the Chelyabinsk airburst, based on indirect illumination measured fromvideo records. The brightness is an average derived from indirect scattered skybrightness from six videos proximal to the airburst, corrected for the sensorgamma setting, autogain, range and airmass extinction, following theprocedure used for other airburst light curves generated from video24,25. Thelight curve has been normalized using the US government sensor data peakbrightness value of 2.7 3 1013 W sr21, corresponding to an absoluteastronomical magnitude of 228 in the silicon bandpass. The individual videolight curves deviate by less than one magnitude between times 22 and 11.5with larger deviations outside this interval. Time zero corresponds to03:20:32.2 UTC on 15 February 2013. b, The energy deposition per unit height
for the Chelyabinsk airburst, based on video data. The conversion to absoluteenergy deposition per unit path length assumes a blackbody emission of6,000 K and bolometric efficiency of 17%, the same as the assumptions usedto convert earlier US government sensor information to energy26. The heightsare computed using the calibrated trajectory10 and features of the lightcurves common to different video sites, resulting in a height accuracy ofabout 1 km. The total energy of the airburst found by integrating under thecurve exceeds 470 kt. The half-energy-deposition height range is 33–27 km;these are the heights at which energy deposition falls below half thepeak value of approximately 80 kt per kilometre of height, which is reachedat an altitude near 29.5 km.
2 3 8 | N A T U R E | V O L 5 0 3 | 1 4 N O V E M B E R 2 0 1 3
Macmillan Publishers Limited. All rights reserved©2013
Energy Deposition
LETTERdoi:10.1038/nature12741
A 500-kiloton airburst over Chelyabinsk and anenhanced hazard from small impactorsP. G. Brown1,2, J. D. Assink3, L. Astiz4, R. Blaauw5, M. B. Boslough6, J. Borovicka7, N. Brachet3, D. Brown8, M. Campbell-Brown1,L. Ceranna9, W. Cooke10, C. de Groot-Hedlin4, D. P. Drob11, W. Edwards12, L. G. Evers13,14, M. Garces15, J. Gill1, M. Hedlin4,A. Kingery16, G. Laske4, A. Le Pichon3, P. Mialle8, D. E. Moser5, A. Saffer10, E. Silber1, P. Smets13,14, R. E. Spalding6, P. Spurny7,E. Tagliaferri17, D. Uren1, R. J. Weryk1, R. Whitaker18 & Z. Krzeminski1
Most large (over a kilometre in diameter) near-Earth asteroids arenow known, but recognition that airbursts (or fireballs result-ing from nuclear-weapon-sized detonations of meteoroids in theatmosphere) have the potential to do greater damage1 than prev-iously thought has shifted an increasing portion of the residualimpact risk (the risk of impact from an unknown object) to smallerobjects2. Above the threshold size of impactor at which the atmo-sphere absorbs sufficient energy to prevent a ground impact, most ofthe damage is thought to be caused by the airburst shock wave3, butowing to lack of observations this is uncertain4,5. Here we report ananalysis of the damage from the airburst of an asteroid about19 metres (17 to 20 metres) in diameter southeast of Chelyabinsk,Russia, on 15 February 2013, estimated to have an energy equivalentof approximately 500 (6100) kilotons of trinitrotoluene (TNT,where 1 kiloton of TNT 54.18531012 joules). We show that a widely
referenced technique4–6 of estimating airburst damage does notreproduce the observations, and that the mathematical relations7
based on the effects of nuclear weapons—almost always used withthis technique—overestimate blast damage. This suggests that earl-ier damage estimates5,6 near the threshold impactor size are toohigh. We performed a global survey of airbursts of a kiloton or more(including Chelyabinsk), and find that the number of impactorswith diameters of tens of metres may be an order of magnitudehigher than estimates based on other techniques8,9. This suggestsa non-equilibrium (if the population were in a long-term collisionalsteady state the size-frequency distribution would either follow asingle power law or there must be a size-dependent bias in othersurveys) in the near-Earth asteroid population for objects 10 to50 metres in diameter, and shifts more of the residual impact riskto these sizes.
1Department of Physics and Astronomy, University of Western Ontario, London, Ontario N6A 3K7, Canada. 2Centre for Planetary Science and Exploration, University of Western Ontario, London, OntarioN6A 5B7, Canada. 3Commissariat a l’Energie Atomique,DepartementAnalyseSurveillanceEnvironnement (CEA/DAM/DIF), Bruyeres-le-Chatel, 91297 ArpajonCedex, France. 4Laboratory for AtmosphericAcoustics, Institute of Geophysics and Planetary Physics, University of California, San Diego, La Jolla, California 92093-0225, USA. 5Marshall Information Technology Services (MITS)/Dynetics TechnicalServices, NASA Marshall Space Flight Center, Huntsville, Alabama 35812, USA. 6Sandia National Laboratories, PO Box 5800, Albuquerque, New Mexico 87185, USA. 7Astronomical Institute, Academy ofSciences of the Czech Republic, CZ 251 65 Ondrejov, Czech Republic. 8International Data Center, Provisional Technical Secretariat, Comprehensive Test Ban Treaty Organization, PO Box 1200, A-1400Vienna, Austria. 9Bundesanstalt fur Geowissenschaften und Rohstoffe, Stilleweg 2, 30655 Hannover, Germany. 10Meteoroid Environments Office, EV44, Space Environment Team, Marshall Space FlightCenter, Huntsville, Alabama 35812, USA. 11Space Science Division, Naval Research Laboratory, 4555 Overlook Avenue, Washington DC 20375, USA. 12Natural Resources Canada, Canadian HazardInformation Service, 7 Observatory Crescent, Ottawa, Ontario K1A 0Y3, Canada. 13Seismology Division, Royal Netherlands Meteorological Institute, Wilhelminalaan 10, 3732 GK De Bilt, The Netherlands.14Department of Geoscience and Engineering, Faculty of Civil Engineering and Geosciences, Delft University of Technology, Stevinweg 1, 2628 CN Delft, The Netherlands. 15Infrasound Laboratory,University of Hawaii, Manoa 73-4460 Queen Kaahumanu Highway, 119 Kailua-Kona, Hawaii 96740-2638, USA. 16ERC Incorporated/Jacobs ESSSA Group, NASA Marshall Space Flight Center, Huntsville,Alabama 35812, USA. 17ET Space Systems, 5990 Worth Way, Camarillo, California 93012, USA. 18Los Alamos National Laboratory, EES-17 MS F665, PO Box 1663 Los Alamos, New Mexico 87545, USA.
Time (s)–3.0 –2.0 –1.0 0.0 1.0 2.0 3.0
Abs
olut
e br
ight
ness
(mag
nitu
de)
–28
–26
–24
–22
–20
–18
a
Height (km)20253035404550
Ener
gy d
epos
ition
per
uni
t hei
ght
(kt k
m–1
)
0
20
40
60
80
100b
Figure 1 | Light curve of the Chelyabinsk airburst. a, The brightness profilefor the Chelyabinsk airburst, based on indirect illumination measured fromvideo records. The brightness is an average derived from indirect scattered skybrightness from six videos proximal to the airburst, corrected for the sensorgamma setting, autogain, range and airmass extinction, following theprocedure used for other airburst light curves generated from video24,25. Thelight curve has been normalized using the US government sensor data peakbrightness value of 2.7 3 1013 W sr21, corresponding to an absoluteastronomical magnitude of 228 in the silicon bandpass. The individual videolight curves deviate by less than one magnitude between times 22 and 11.5with larger deviations outside this interval. Time zero corresponds to03:20:32.2 UTC on 15 February 2013. b, The energy deposition per unit height
for the Chelyabinsk airburst, based on video data. The conversion to absoluteenergy deposition per unit path length assumes a blackbody emission of6,000 K and bolometric efficiency of 17%, the same as the assumptions usedto convert earlier US government sensor information to energy26. The heightsare computed using the calibrated trajectory10 and features of the lightcurves common to different video sites, resulting in a height accuracy ofabout 1 km. The total energy of the airburst found by integrating under thecurve exceeds 470 kt. The half-energy-deposition height range is 33–27 km;these are the heights at which energy deposition falls below half thepeak value of approximately 80 kt per kilometre of height, which is reachedat an altitude near 29.5 km.
2 3 8 | N A T U R E | V O L 5 0 3 | 1 4 N O V E M B E R 2 0 1 3
Macmillan Publishers Limited. All rights reserved©2013
Brightness
Very well studied event, simulations of virtually all aspects of entry, breakup, analysis of composition, blast propagation, ground damage, etc.
Brown et.al, Nature, 2013
• 12,500 metric tons, 19.8 m diameter
• Trajectory: • 18.6 km/sec, (~Mach 61.7)• 18° entry angle
• Data• Ground Damage (glass breakage data)• Shock arrival times• Light curve reconstruction• Energy deposition from infrasound measurements
28

Validation: Chelyabinsk MeteorFebruary 15, 2013• 12,500 metric tons, 19.8 m diameter
• Trajectory: • 18.6 km/sec, (~Mach 61.7)• 18° entry angle
• Data• Ground Damage (glass breakage data)• Shock arrival times• Light curve reconstruction• Energy deposition from infrasound measurements
LETTERdoi:10.1038/nature12741
A 500-kiloton airburst over Chelyabinsk and anenhanced hazard from small impactorsP. G. Brown1,2, J. D. Assink3, L. Astiz4, R. Blaauw5, M. B. Boslough6, J. Borovicka7, N. Brachet3, D. Brown8, M. Campbell-Brown1,L. Ceranna9, W. Cooke10, C. de Groot-Hedlin4, D. P. Drob11, W. Edwards12, L. G. Evers13,14, M. Garces15, J. Gill1, M. Hedlin4,A. Kingery16, G. Laske4, A. Le Pichon3, P. Mialle8, D. E. Moser5, A. Saffer10, E. Silber1, P. Smets13,14, R. E. Spalding6, P. Spurny7,E. Tagliaferri17, D. Uren1, R. J. Weryk1, R. Whitaker18 & Z. Krzeminski1
Most large (over a kilometre in diameter) near-Earth asteroids arenow known, but recognition that airbursts (or fireballs result-ing from nuclear-weapon-sized detonations of meteoroids in theatmosphere) have the potential to do greater damage1 than prev-iously thought has shifted an increasing portion of the residualimpact risk (the risk of impact from an unknown object) to smallerobjects2. Above the threshold size of impactor at which the atmo-sphere absorbs sufficient energy to prevent a ground impact, most ofthe damage is thought to be caused by the airburst shock wave3, butowing to lack of observations this is uncertain4,5. Here we report ananalysis of the damage from the airburst of an asteroid about19 metres (17 to 20 metres) in diameter southeast of Chelyabinsk,Russia, on 15 February 2013, estimated to have an energy equivalentof approximately 500 (6100) kilotons of trinitrotoluene (TNT,where 1 kiloton of TNT 54.18531012 joules). We show that a widely
referenced technique4–6 of estimating airburst damage does notreproduce the observations, and that the mathematical relations7
based on the effects of nuclear weapons—almost always used withthis technique—overestimate blast damage. This suggests that earl-ier damage estimates5,6 near the threshold impactor size are toohigh. We performed a global survey of airbursts of a kiloton or more(including Chelyabinsk), and find that the number of impactorswith diameters of tens of metres may be an order of magnitudehigher than estimates based on other techniques8,9. This suggestsa non-equilibrium (if the population were in a long-term collisionalsteady state the size-frequency distribution would either follow asingle power law or there must be a size-dependent bias in othersurveys) in the near-Earth asteroid population for objects 10 to50 metres in diameter, and shifts more of the residual impact riskto these sizes.
1Department of Physics and Astronomy, University of Western Ontario, London, Ontario N6A 3K7, Canada. 2Centre for Planetary Science and Exploration, University of Western Ontario, London, OntarioN6A 5B7, Canada. 3Commissariat a l’Energie Atomique,DepartementAnalyseSurveillanceEnvironnement (CEA/DAM/DIF), Bruyeres-le-Chatel, 91297 ArpajonCedex, France. 4Laboratory for AtmosphericAcoustics, Institute of Geophysics and Planetary Physics, University of California, San Diego, La Jolla, California 92093-0225, USA. 5Marshall Information Technology Services (MITS)/Dynetics TechnicalServices, NASA Marshall Space Flight Center, Huntsville, Alabama 35812, USA. 6Sandia National Laboratories, PO Box 5800, Albuquerque, New Mexico 87185, USA. 7Astronomical Institute, Academy ofSciences of the Czech Republic, CZ 251 65 Ondrejov, Czech Republic. 8International Data Center, Provisional Technical Secretariat, Comprehensive Test Ban Treaty Organization, PO Box 1200, A-1400Vienna, Austria. 9Bundesanstalt fur Geowissenschaften und Rohstoffe, Stilleweg 2, 30655 Hannover, Germany. 10Meteoroid Environments Office, EV44, Space Environment Team, Marshall Space FlightCenter, Huntsville, Alabama 35812, USA. 11Space Science Division, Naval Research Laboratory, 4555 Overlook Avenue, Washington DC 20375, USA. 12Natural Resources Canada, Canadian HazardInformation Service, 7 Observatory Crescent, Ottawa, Ontario K1A 0Y3, Canada. 13Seismology Division, Royal Netherlands Meteorological Institute, Wilhelminalaan 10, 3732 GK De Bilt, The Netherlands.14Department of Geoscience and Engineering, Faculty of Civil Engineering and Geosciences, Delft University of Technology, Stevinweg 1, 2628 CN Delft, The Netherlands. 15Infrasound Laboratory,University of Hawaii, Manoa 73-4460 Queen Kaahumanu Highway, 119 Kailua-Kona, Hawaii 96740-2638, USA. 16ERC Incorporated/Jacobs ESSSA Group, NASA Marshall Space Flight Center, Huntsville,Alabama 35812, USA. 17ET Space Systems, 5990 Worth Way, Camarillo, California 93012, USA. 18Los Alamos National Laboratory, EES-17 MS F665, PO Box 1663 Los Alamos, New Mexico 87545, USA.
Time (s)–3.0 –2.0 –1.0 0.0 1.0 2.0 3.0
Abs
olut
e br
ight
ness
(mag
nitu
de)
–28
–26
–24
–22
–20
–18
a
Height (km)20253035404550
Ener
gy d
epos
ition
per
uni
t hei
ght
(kt k
m–1
)
0
20
40
60
80
100b
Figure 1 | Light curve of the Chelyabinsk airburst. a, The brightness profilefor the Chelyabinsk airburst, based on indirect illumination measured fromvideo records. The brightness is an average derived from indirect scattered skybrightness from six videos proximal to the airburst, corrected for the sensorgamma setting, autogain, range and airmass extinction, following theprocedure used for other airburst light curves generated from video24,25. Thelight curve has been normalized using the US government sensor data peakbrightness value of 2.7 3 1013 W sr21, corresponding to an absoluteastronomical magnitude of 228 in the silicon bandpass. The individual videolight curves deviate by less than one magnitude between times 22 and 11.5with larger deviations outside this interval. Time zero corresponds to03:20:32.2 UTC on 15 February 2013. b, The energy deposition per unit height
for the Chelyabinsk airburst, based on video data. The conversion to absoluteenergy deposition per unit path length assumes a blackbody emission of6,000 K and bolometric efficiency of 17%, the same as the assumptions usedto convert earlier US government sensor information to energy26. The heightsare computed using the calibrated trajectory10 and features of the lightcurves common to different video sites, resulting in a height accuracy ofabout 1 km. The total energy of the airburst found by integrating under thecurve exceeds 470 kt. The half-energy-deposition height range is 33–27 km;these are the heights at which energy deposition falls below half thepeak value of approximately 80 kt per kilometre of height, which is reachedat an altitude near 29.5 km.
2 3 8 | N A T U R E | V O L 5 0 3 | 1 4 N O V E M B E R 2 0 1 3
Macmillan Publishers Limited. All rights reserved©2013
Energy Deposition
LETTERdoi:10.1038/nature12741
A 500-kiloton airburst over Chelyabinsk and anenhanced hazard from small impactorsP. G. Brown1,2, J. D. Assink3, L. Astiz4, R. Blaauw5, M. B. Boslough6, J. Borovicka7, N. Brachet3, D. Brown8, M. Campbell-Brown1,L. Ceranna9, W. Cooke10, C. de Groot-Hedlin4, D. P. Drob11, W. Edwards12, L. G. Evers13,14, M. Garces15, J. Gill1, M. Hedlin4,A. Kingery16, G. Laske4, A. Le Pichon3, P. Mialle8, D. E. Moser5, A. Saffer10, E. Silber1, P. Smets13,14, R. E. Spalding6, P. Spurny7,E. Tagliaferri17, D. Uren1, R. J. Weryk1, R. Whitaker18 & Z. Krzeminski1
Most large (over a kilometre in diameter) near-Earth asteroids arenow known, but recognition that airbursts (or fireballs result-ing from nuclear-weapon-sized detonations of meteoroids in theatmosphere) have the potential to do greater damage1 than prev-iously thought has shifted an increasing portion of the residualimpact risk (the risk of impact from an unknown object) to smallerobjects2. Above the threshold size of impactor at which the atmo-sphere absorbs sufficient energy to prevent a ground impact, most ofthe damage is thought to be caused by the airburst shock wave3, butowing to lack of observations this is uncertain4,5. Here we report ananalysis of the damage from the airburst of an asteroid about19 metres (17 to 20 metres) in diameter southeast of Chelyabinsk,Russia, on 15 February 2013, estimated to have an energy equivalentof approximately 500 (6100) kilotons of trinitrotoluene (TNT,where 1 kiloton of TNT 54.18531012 joules). We show that a widely
referenced technique4–6 of estimating airburst damage does notreproduce the observations, and that the mathematical relations7
based on the effects of nuclear weapons—almost always used withthis technique—overestimate blast damage. This suggests that earl-ier damage estimates5,6 near the threshold impactor size are toohigh. We performed a global survey of airbursts of a kiloton or more(including Chelyabinsk), and find that the number of impactorswith diameters of tens of metres may be an order of magnitudehigher than estimates based on other techniques8,9. This suggestsa non-equilibrium (if the population were in a long-term collisionalsteady state the size-frequency distribution would either follow asingle power law or there must be a size-dependent bias in othersurveys) in the near-Earth asteroid population for objects 10 to50 metres in diameter, and shifts more of the residual impact riskto these sizes.
1Department of Physics and Astronomy, University of Western Ontario, London, Ontario N6A 3K7, Canada. 2Centre for Planetary Science and Exploration, University of Western Ontario, London, OntarioN6A 5B7, Canada. 3Commissariat a l’Energie Atomique,DepartementAnalyseSurveillanceEnvironnement (CEA/DAM/DIF), Bruyeres-le-Chatel, 91297 ArpajonCedex, France. 4Laboratory for AtmosphericAcoustics, Institute of Geophysics and Planetary Physics, University of California, San Diego, La Jolla, California 92093-0225, USA. 5Marshall Information Technology Services (MITS)/Dynetics TechnicalServices, NASA Marshall Space Flight Center, Huntsville, Alabama 35812, USA. 6Sandia National Laboratories, PO Box 5800, Albuquerque, New Mexico 87185, USA. 7Astronomical Institute, Academy ofSciences of the Czech Republic, CZ 251 65 Ondrejov, Czech Republic. 8International Data Center, Provisional Technical Secretariat, Comprehensive Test Ban Treaty Organization, PO Box 1200, A-1400Vienna, Austria. 9Bundesanstalt fur Geowissenschaften und Rohstoffe, Stilleweg 2, 30655 Hannover, Germany. 10Meteoroid Environments Office, EV44, Space Environment Team, Marshall Space FlightCenter, Huntsville, Alabama 35812, USA. 11Space Science Division, Naval Research Laboratory, 4555 Overlook Avenue, Washington DC 20375, USA. 12Natural Resources Canada, Canadian HazardInformation Service, 7 Observatory Crescent, Ottawa, Ontario K1A 0Y3, Canada. 13Seismology Division, Royal Netherlands Meteorological Institute, Wilhelminalaan 10, 3732 GK De Bilt, The Netherlands.14Department of Geoscience and Engineering, Faculty of Civil Engineering and Geosciences, Delft University of Technology, Stevinweg 1, 2628 CN Delft, The Netherlands. 15Infrasound Laboratory,University of Hawaii, Manoa 73-4460 Queen Kaahumanu Highway, 119 Kailua-Kona, Hawaii 96740-2638, USA. 16ERC Incorporated/Jacobs ESSSA Group, NASA Marshall Space Flight Center, Huntsville,Alabama 35812, USA. 17ET Space Systems, 5990 Worth Way, Camarillo, California 93012, USA. 18Los Alamos National Laboratory, EES-17 MS F665, PO Box 1663 Los Alamos, New Mexico 87545, USA.
Time (s)–3.0 –2.0 –1.0 0.0 1.0 2.0 3.0
Abs
olut
e br
ight
ness
(mag
nitu
de)
–28
–26
–24
–22
–20
–18
a
Height (km)20253035404550
Ener
gy d
epos
ition
per
uni
t hei
ght
(kt k
m–1
)
0
20
40
60
80
100b
Figure 1 | Light curve of the Chelyabinsk airburst. a, The brightness profilefor the Chelyabinsk airburst, based on indirect illumination measured fromvideo records. The brightness is an average derived from indirect scattered skybrightness from six videos proximal to the airburst, corrected for the sensorgamma setting, autogain, range and airmass extinction, following theprocedure used for other airburst light curves generated from video24,25. Thelight curve has been normalized using the US government sensor data peakbrightness value of 2.7 3 1013 W sr21, corresponding to an absoluteastronomical magnitude of 228 in the silicon bandpass. The individual videolight curves deviate by less than one magnitude between times 22 and 11.5with larger deviations outside this interval. Time zero corresponds to03:20:32.2 UTC on 15 February 2013. b, The energy deposition per unit height
for the Chelyabinsk airburst, based on video data. The conversion to absoluteenergy deposition per unit path length assumes a blackbody emission of6,000 K and bolometric efficiency of 17%, the same as the assumptions usedto convert earlier US government sensor information to energy26. The heightsare computed using the calibrated trajectory10 and features of the lightcurves common to different video sites, resulting in a height accuracy ofabout 1 km. The total energy of the airburst found by integrating under thecurve exceeds 470 kt. The half-energy-deposition height range is 33–27 km;these are the heights at which energy deposition falls below half thepeak value of approximately 80 kt per kilometre of height, which is reachedat an altitude near 29.5 km.
2 3 8 | N A T U R E | V O L 5 0 3 | 1 4 N O V E M B E R 2 0 1 3
Macmillan Publishers Limited. All rights reserved©2013
Brightness
Brown et al, Nature, 2013• Primary references used• Popova & Jenniskens et al., Science Express, November 2013• Brown et al., Nature, November 2013• Chelyabinsk Airburst Consortium, + various other media
29
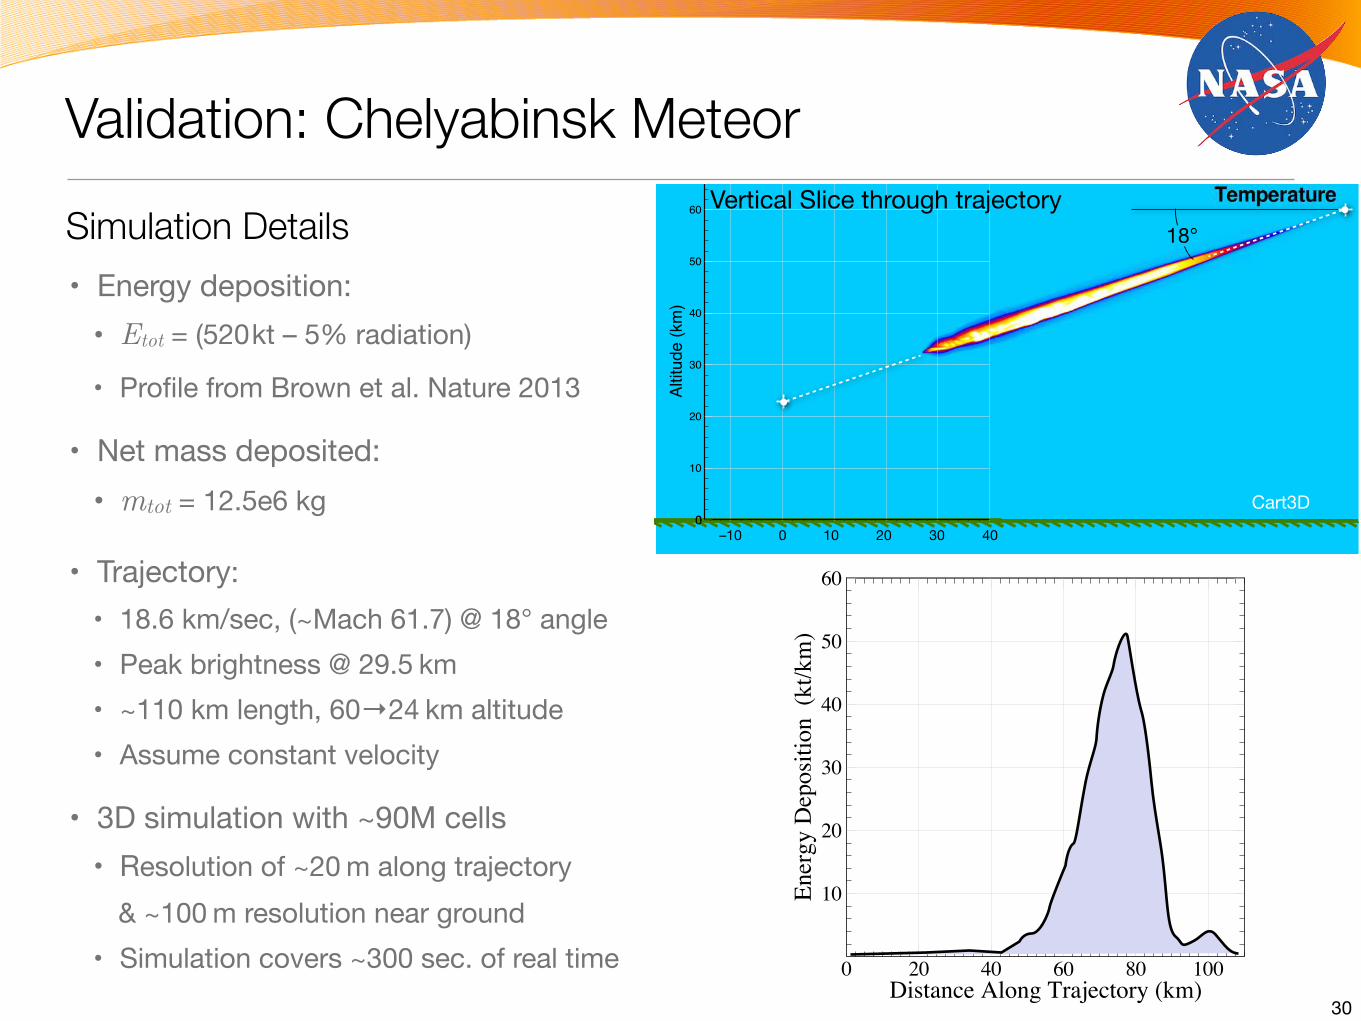
0 20 40 60 80 100Distance Along Trajectory (km)
10
20
30
40
50
60
Ener
gy D
epos
ition
(kt
/km
)
Validation: Chelyabinsk MeteorSimulation Details
New Time-Dependent chelyabinsk520kt
Cart3D
520 kt Chelyabinsk case with mass and momentum deposition
01020304050Distance (km)
0
10
20
30
40
50
60
Altit
ude
(km
)
0 10 20 30 40–100
18°
• Energy deposition:• Etot = (520 kt – 5% radiation)
• Profile from Brown et al. Nature 2013
• Net mass deposited: • mtot = 12.5e6 kg
• Trajectory: • 18.6 km/sec, (~Mach 61.7) @ 18° angle• Peak brightness @ 29.5 km• ~110 km length, 60→24 km altitude• Assume constant velocity
• 3D simulation with ~90M cells• Resolution of ~20 m along trajectory
& ~100 m resolution near ground• Simulation covers ~300 sec. of real time
Vertical Slice through trajectory
30

-40-30-20-100102030Distance (km)
0
10
20
30
40Al
titud
e (k
m)
-40-30-20-100102030Distance (km)
0
10
20
30
40
Altit
ude
(km
)-40-30-20-100102030
Distance (km)
0
10
20
30
40
Altit
ude
(km
)
-40-30-20-100102030Distance (km)
0
10
20
30
40
Altit
ude
(km
)
-40-30-20-100102030Distance (km)
0
10
20
30
40
Altit
ude
(km
)
-40-30-20-100102030Distance (km)
0
10
20
30
40Al
titud
e (k
m)
t = 6.6 sec t = 6.6 sec
t = 30.3 sec t = 30.3 sec
t = 93.7 sec t = 93.7 sec
ln(P )� ln(P1)
ln(P1)
Local Mach Number Local Overpressure
31

Validation: Chelyabinsk Meteor
32

-30 -20 -10 0 10 20 30 40Downrange Distance, X, (km)
-30
-20
-10
0
10
20
30
Cros
sran
ge d
istan
ce, Y
, (km
)
Validation: Chelyabinsk MeteorGround footprint
• Goal is prediction of pressure & velocity on the ground
• Blast first contacts ground at t = ~82.7 sec elapsed time (~78 sec. after peak brightness)
• Excellent agreement with earliest data on blast arrival time data (76 – 90 sec) (Popova et al.)
-40-30-20-100102030Distance (km)
0
10
20
30
40
Altit
ude
(km
)
t = 93.7 sec
Vertical Slice through trajectory
Instantaneous Ground Pressure
t = 93.7 sec
33

Validation: Chelyabinsk MeteorGround footprint evolution
A’A
B’
B
A’A
B’B
t = 160 sec
Instantaneous Downrange Profile
Instantaneous Crossrange ProfilePeak Recorded Overpressure (so far...)
Instantaneous Pressure Profile
(inc. =1%)
34

Validation: Chelyabinsk MeteorGround footprint evolution
Instantaneous Downrange Profile
Instantaneous Crossrange ProfilePeak Recorded Overpressure (%)
Instantaneous Pressure Profile
(inc. =1%)
35

Validation: Chelyabinsk MeteorPeak Ground Overpressures
36
1%
2%
5%
6%
4%
3%

Validation: Chelyabinsk MeteorPeak Ground Overpressures
36
1%
2%
5%
6%
4%
3%
Glass Damage Data Comparison
61
Fig S38. Glass damage. Red data points were collected during the field survey, purple data were provided by the
Emergency Department. Open circles indicate that no glass damage occurred.
The most damaged settlements according to official data are shown by purple symbols in Fig.
S38. The damage area has an extent of about 180 km from north to south and 80 km from east to
west, but is shaped along a curved arc centered on Yemanzelinsk, extending from the northern
parts of Chelyabinsk as far south as Troitsk.
Red data points in Figure S38 are collected during the field survey, purple data points are
villages that reported damage through the Ministry of Emergencies at Chelyabinsk. Open circles
are sites where no damage occurred. The red points include many villages that had only a few
windows damaged (usually in school buildings). Hence, the inner contour of the purple points
may represent a higher overpressure than the outer contour of the red sites.
The value of overpressure, Δp, needed to break window glass is dependent on the glass
thickness and surface area. These values are not different between windows in Russia (most
affected buildings being from the 20th century) and other locations in the world. Glasstone and
Dolan [84] estimated the overpressure which caused essential glass damage at about Δp~3,500-
5,000 Pa. According to Mannan and Lees [87], an overpressure of about Δp~700 Pa is able to
Chelyabinsk 1%
2%3%
Y D
ista
nce
(km
)
X Distance (km)

Validation: Chelyabinsk MeteorPeak Ground Overpressures
• Glass damage data collected by the Chelyabinsk Airburst Consortium• Statistical correlation (Mannan & Lees) show 700 Pa (0.69%) shatters ~5% of
typical windows, 6% overpressure breaks roughly 90%.• Footprint similar to those in Popova et al. (ScienceExpress)• Breakage data estimate overpressure at chelyabinsk ~2-4% (P. Brown)
37
1%
2%
5%
6%
4%
3%
61
Fig S38. Glass damage. Red data points were collected during the field survey, purple data were provided by the
Emergency Department. Open circles indicate that no glass damage occurred.
The most damaged settlements according to official data are shown by purple symbols in Fig.
S38. The damage area has an extent of about 180 km from north to south and 80 km from east to
west, but is shaped along a curved arc centered on Yemanzelinsk, extending from the northern
parts of Chelyabinsk as far south as Troitsk.
Red data points in Figure S38 are collected during the field survey, purple data points are
villages that reported damage through the Ministry of Emergencies at Chelyabinsk. Open circles
are sites where no damage occurred. The red points include many villages that had only a few
windows damaged (usually in school buildings). Hence, the inner contour of the purple points
may represent a higher overpressure than the outer contour of the red sites.
The value of overpressure, Δp, needed to break window glass is dependent on the glass
thickness and surface area. These values are not different between windows in Russia (most
affected buildings being from the 20th century) and other locations in the world. Glasstone and
Dolan [84] estimated the overpressure which caused essential glass damage at about Δp~3,500-
5,000 Pa. According to Mannan and Lees [87], an overpressure of about Δp~700 Pa is able to
Chelyabinsk 1%
2%3%
Y D
ista
nce
(km
)X Distance (km)

Validation: Chelyabinsk Meteor
38
Shock Arrival Time
Arrival time
t = 160 sec

Validation: Chelyabinsk MeteorShock Arrival Time
• Peak brightness at ~4 sec. elapsed time• First arrival at ~78 sec after peak brightness, • Predict ~90 sec (from peak brightness) at Korkino and Yemanzhelinsk• Arrival in vicinity of Chelyabinsk at 140 - 145 seconds• Neglected local wind, temperature and other effects of the real atmosphere• Overall very good agreement with data & best predictions in literature
39
contour ∆t = 33.2 secPredicted Shock Arrival Time (seconds)
282.1
83.1149
.4
215.8
61
Fig S38. Glass damage. Red data points were collected during the field survey, purple data were provided by the
Emergency Department. Open circles indicate that no glass damage occurred.
The most damaged settlements according to official data are shown by purple symbols in Fig.
S38. The damage area has an extent of about 180 km from north to south and 80 km from east to
west, but is shaped along a curved arc centered on Yemanzelinsk, extending from the northern
parts of Chelyabinsk as far south as Troitsk.
Red data points in Figure S38 are collected during the field survey, purple data points are
villages that reported damage through the Ministry of Emergencies at Chelyabinsk. Open circles
are sites where no damage occurred. The red points include many villages that had only a few
windows damaged (usually in school buildings). Hence, the inner contour of the purple points
may represent a higher overpressure than the outer contour of the red sites.
The value of overpressure, Δp, needed to break window glass is dependent on the glass
thickness and surface area. These values are not different between windows in Russia (most
affected buildings being from the 20th century) and other locations in the world. Glasstone and
Dolan [84] estimated the overpressure which caused essential glass damage at about Δp~3,500-
5,000 Pa. According to Mannan and Lees [87], an overpressure of about Δp~700 Pa is able to
Chelyabinsk
contour ∆t = 33.2 sec
Shock Arrival Time (seconds)
282.1
83.1 149.4
215.8
Elapsed Time (sec) from 64km altitude

Overview
• Modeling & Solver
• Verification & Validation• Basic• Chelyabinsk Case Study
• Investigations of ground-footprint sensitivity• Line-source vs time-dependent entry• Entry Angle
• Upcoming Efforts
Report current status of effort and connection with PRA and tsunami
40

Overview
• Modeling & Solver
• Verification & Validation• Basic• Chelyabinsk Case Study
• Investigations of ground-footprint sensitivity• Line-source vs time-dependent entry• Entry Angle
• Upcoming Efforts
Report current status of effort and connection with PRA and tsunami
• Sensitivity to entry modeling
• Time-dependent compared to simple line source
• Entry angle / Spherical charge investigation
40

Sensitivity - Entry ModelingTime-Dependent modeling vs simple line source
• Entry only lasts for seconds, blast propagates for minutes
• Detailed entry modeling requires very fine time-scales (∆t ≈ 1.e-4)
• Cost: 90M cell simulation: (1000 cores x 8-12 hrs) - Under 1% of NAS Pleiades
• Line Source for mass, momentum and energy can reduce cost by 50%
• When is line source modeling appropriate?
41
LETTERdoi:10.1038/nature12741
A 500-kiloton airburst over Chelyabinsk and anenhanced hazard from small impactorsP. G. Brown1,2, J. D. Assink3, L. Astiz4, R. Blaauw5, M. B. Boslough6, J. Borovicka7, N. Brachet3, D. Brown8, M. Campbell-Brown1,L. Ceranna9, W. Cooke10, C. de Groot-Hedlin4, D. P. Drob11, W. Edwards12, L. G. Evers13,14, M. Garces15, J. Gill1, M. Hedlin4,A. Kingery16, G. Laske4, A. Le Pichon3, P. Mialle8, D. E. Moser5, A. Saffer10, E. Silber1, P. Smets13,14, R. E. Spalding6, P. Spurny7,E. Tagliaferri17, D. Uren1, R. J. Weryk1, R. Whitaker18 & Z. Krzeminski1
Most large (over a kilometre in diameter) near-Earth asteroids arenow known, but recognition that airbursts (or fireballs result-ing from nuclear-weapon-sized detonations of meteoroids in theatmosphere) have the potential to do greater damage1 than prev-iously thought has shifted an increasing portion of the residualimpact risk (the risk of impact from an unknown object) to smallerobjects2. Above the threshold size of impactor at which the atmo-sphere absorbs sufficient energy to prevent a ground impact, most ofthe damage is thought to be caused by the airburst shock wave3, butowing to lack of observations this is uncertain4,5. Here we report ananalysis of the damage from the airburst of an asteroid about19 metres (17 to 20 metres) in diameter southeast of Chelyabinsk,Russia, on 15 February 2013, estimated to have an energy equivalentof approximately 500 (6100) kilotons of trinitrotoluene (TNT,where 1 kiloton of TNT 54.18531012 joules). We show that a widely
referenced technique4–6 of estimating airburst damage does notreproduce the observations, and that the mathematical relations7
based on the effects of nuclear weapons—almost always used withthis technique—overestimate blast damage. This suggests that earl-ier damage estimates5,6 near the threshold impactor size are toohigh. We performed a global survey of airbursts of a kiloton or more(including Chelyabinsk), and find that the number of impactorswith diameters of tens of metres may be an order of magnitudehigher than estimates based on other techniques8,9. This suggestsa non-equilibrium (if the population were in a long-term collisionalsteady state the size-frequency distribution would either follow asingle power law or there must be a size-dependent bias in othersurveys) in the near-Earth asteroid population for objects 10 to50 metres in diameter, and shifts more of the residual impact riskto these sizes.
1Department of Physics and Astronomy, University of Western Ontario, London, Ontario N6A 3K7, Canada. 2Centre for Planetary Science and Exploration, University of Western Ontario, London, OntarioN6A 5B7, Canada. 3Commissariat a l’Energie Atomique,DepartementAnalyseSurveillanceEnvironnement (CEA/DAM/DIF), Bruyeres-le-Chatel, 91297 ArpajonCedex, France. 4Laboratory for AtmosphericAcoustics, Institute of Geophysics and Planetary Physics, University of California, San Diego, La Jolla, California 92093-0225, USA. 5Marshall Information Technology Services (MITS)/Dynetics TechnicalServices, NASA Marshall Space Flight Center, Huntsville, Alabama 35812, USA. 6Sandia National Laboratories, PO Box 5800, Albuquerque, New Mexico 87185, USA. 7Astronomical Institute, Academy ofSciences of the Czech Republic, CZ 251 65 Ondrejov, Czech Republic. 8International Data Center, Provisional Technical Secretariat, Comprehensive Test Ban Treaty Organization, PO Box 1200, A-1400Vienna, Austria. 9Bundesanstalt fur Geowissenschaften und Rohstoffe, Stilleweg 2, 30655 Hannover, Germany. 10Meteoroid Environments Office, EV44, Space Environment Team, Marshall Space FlightCenter, Huntsville, Alabama 35812, USA. 11Space Science Division, Naval Research Laboratory, 4555 Overlook Avenue, Washington DC 20375, USA. 12Natural Resources Canada, Canadian HazardInformation Service, 7 Observatory Crescent, Ottawa, Ontario K1A 0Y3, Canada. 13Seismology Division, Royal Netherlands Meteorological Institute, Wilhelminalaan 10, 3732 GK De Bilt, The Netherlands.14Department of Geoscience and Engineering, Faculty of Civil Engineering and Geosciences, Delft University of Technology, Stevinweg 1, 2628 CN Delft, The Netherlands. 15Infrasound Laboratory,University of Hawaii, Manoa 73-4460 Queen Kaahumanu Highway, 119 Kailua-Kona, Hawaii 96740-2638, USA. 16ERC Incorporated/Jacobs ESSSA Group, NASA Marshall Space Flight Center, Huntsville,Alabama 35812, USA. 17ET Space Systems, 5990 Worth Way, Camarillo, California 93012, USA. 18Los Alamos National Laboratory, EES-17 MS F665, PO Box 1663 Los Alamos, New Mexico 87545, USA.
Time (s)–3.0 –2.0 –1.0 0.0 1.0 2.0 3.0
Abs
olut
e br
ight
ness
(mag
nitu
de)
–28
–26
–24
–22
–20
–18
a
Height (km)20253035404550
Ener
gy d
epos
ition
per
uni
t hei
ght
(kt k
m–1
)
0
20
40
60
80
100b
Figure 1 | Light curve of the Chelyabinsk airburst. a, The brightness profilefor the Chelyabinsk airburst, based on indirect illumination measured fromvideo records. The brightness is an average derived from indirect scattered skybrightness from six videos proximal to the airburst, corrected for the sensorgamma setting, autogain, range and airmass extinction, following theprocedure used for other airburst light curves generated from video24,25. Thelight curve has been normalized using the US government sensor data peakbrightness value of 2.7 3 1013 W sr21, corresponding to an absoluteastronomical magnitude of 228 in the silicon bandpass. The individual videolight curves deviate by less than one magnitude between times 22 and 11.5with larger deviations outside this interval. Time zero corresponds to03:20:32.2 UTC on 15 February 2013. b, The energy deposition per unit height
for the Chelyabinsk airburst, based on video data. The conversion to absoluteenergy deposition per unit path length assumes a blackbody emission of6,000 K and bolometric efficiency of 17%, the same as the assumptions usedto convert earlier US government sensor information to energy26. The heightsare computed using the calibrated trajectory10 and features of the lightcurves common to different video sites, resulting in a height accuracy ofabout 1 km. The total energy of the airburst found by integrating under thecurve exceeds 470 kt. The half-energy-deposition height range is 33–27 km;these are the heights at which energy deposition falls below half thepeak value of approximately 80 kt per kilometre of height, which is reachedat an altitude near 29.5 km.
2 3 8 | N A T U R E | V O L 5 0 3 | 1 4 N O V E M B E R 2 0 1 3
Macmillan Publishers Limited. All rights reserved©2013
Isobars
Line source along trajectory
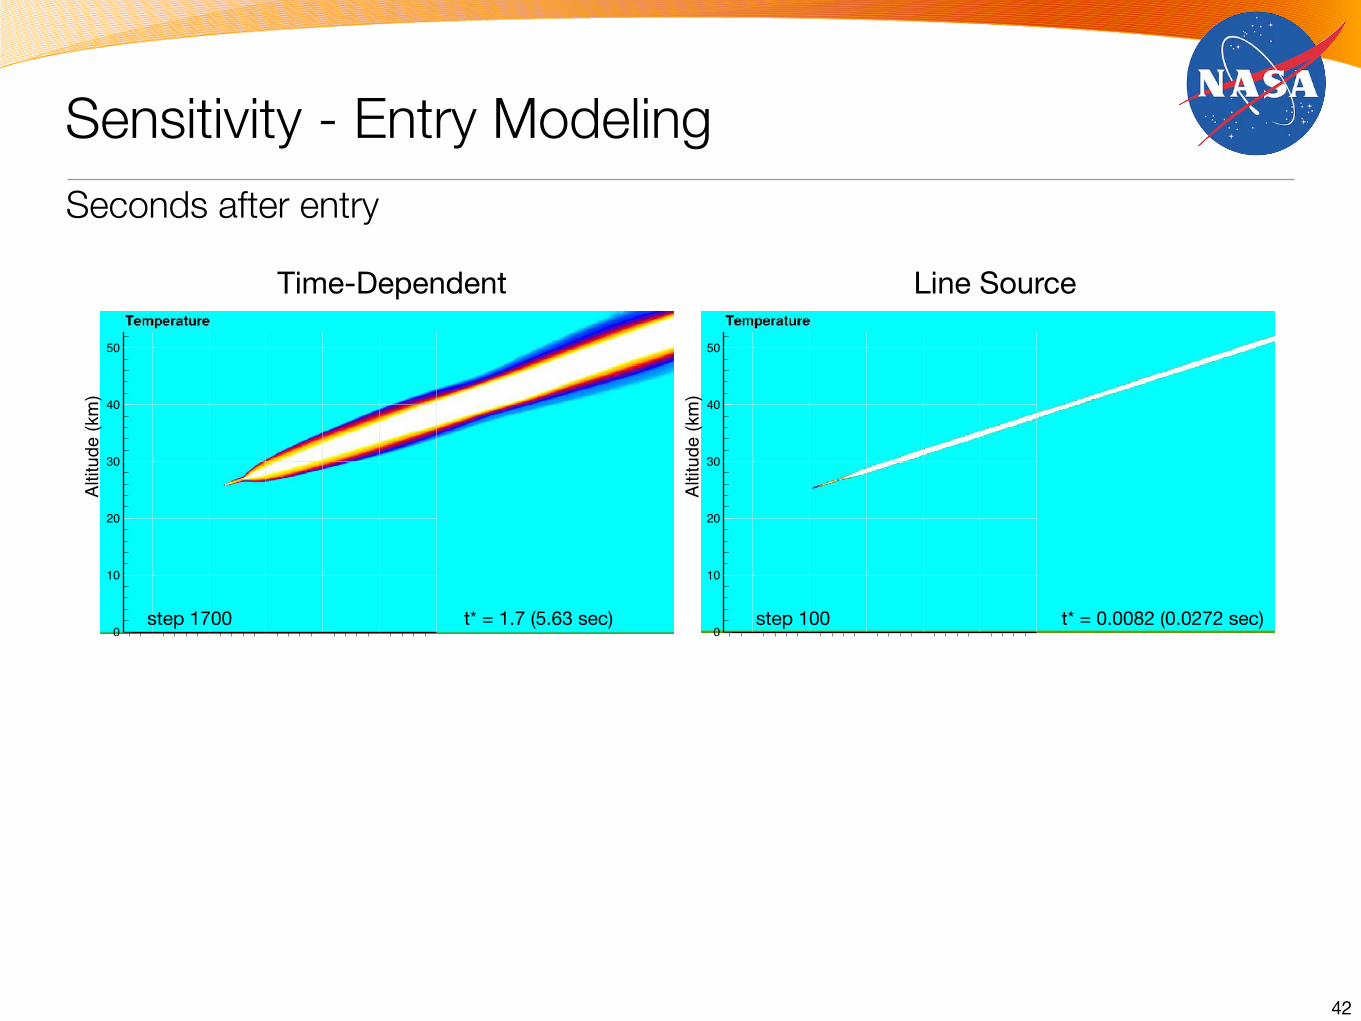
Sensitivity - Entry Modeling
Time-Dependent
t* = 0.5482 (1.752 sec)
t* = 0.0082 (0.0272 sec)
t* = 2.0 (6.634 sec)
t* = 1.7 (5.63 sec)01020304050
Distance (km)
0
10
20
30
40
50
60
Altit
ude
(km
)
step 10001020304050
Distance (km)
0
10
20
30
40
50
60
Altit
ude
(km
)
step 1700
01020304050Distance (km)
0
10
20
30
40
50
60
Altit
ude
(km
)
01020304050Distance (km)
0
10
20
30
40
50
60
Altit
ude
(km
)
step 1000, ∆t = 0.001step 2000, ∆t = 0.001
Line Source
Seconds after entry
42

Sensitivity - Entry Modeling
Time-Dependent
t* = 0.5482 (1.752 sec)
t* = 0.0082 (0.0272 sec)
t* = 2.0 (6.634 sec)
t* = 1.7 (5.63 sec)01020304050
Distance (km)
0
10
20
30
40
50
60
Altit
ude
(km
)
step 10001020304050
Distance (km)
0
10
20
30
40
50
60
Altit
ude
(km
)
step 1700
01020304050Distance (km)
0
10
20
30
40
50
60
Altit
ude
(km
)
01020304050Distance (km)
0
10
20
30
40
50
60
Altit
ude
(km
)
step 1000, ∆t = 0.001step 2000, ∆t = 0.001
Line Source
Seconds after entry
43
+ 1 sec + 1.7 sec

-40-30-20-100102030Distance (km)
0
10
20
30
40
Altit
ude
(km
)
-40-30-20-100102030Distance (km)
0
10
20
30
40
Altit
ude
(km
)
-40-30-20-100102030Distance (km)
0
10
20
30
40Al
titud
e (k
m)
-40-30-20-100102030Distance (km)
0
10
20
30
40
Altit
ude
(km
)
step 5520
step 7860 t* = 23.65 (78.45 sec)
t* = 10.15 (33.7 sec)step 7340
step 9670 t* = 24.938 (82.7 sec)
t* = 11.44 (37.9 sec)
Time-Dependent Line SourceMinutes after entry
44
Sensitivity - Entry Modeling

Ground Footprint
• Some differences in highest overpressures (~1%) at earliest arrival time• Closer agreements at later time • Good agreement for location of peak ground pressure• Good agreement of arrival time from peak brightness• Geometry dictates that low-entry trajectories will show most discrepancy
45
Time-Dependent Line Source
Sensitivity - Entry Modeling

Sensitivity - 90° Entry vs Spherical Charge
46
• Very cheap spherical charge models exist.
• Various handbook methods for damage estimation use spherical charge data
•Can these be used in risk assessment?• Where are these appropriate?• Perform quantitative assessment
• Investigate ground footprint• Accuracy of overpressure• Extent/strength of footprint• Details of impulse of blast on ground
How good is a static spherical charge model?

Sensitivity - 90° Entry vs Spherical Charge
47
Spherical ChargeLine-Source at 90°
• Etot = 520 kt, mtot = 12.5e6 kg
• Spherical charge @ 29.5km altitude, ri = 1km
• Line Source, 90° trajectory with same energy deposition as before
• Can also compare line source with 18° case for insight into entry angle sensitivity
LETTERdoi:10.1038/nature12741
A 500-kiloton airburst over Chelyabinsk and anenhanced hazard from small impactorsP. G. Brown1,2, J. D. Assink3, L. Astiz4, R. Blaauw5, M. B. Boslough6, J. Borovicka7, N. Brachet3, D. Brown8, M. Campbell-Brown1,L. Ceranna9, W. Cooke10, C. de Groot-Hedlin4, D. P. Drob11, W. Edwards12, L. G. Evers13,14, M. Garces15, J. Gill1, M. Hedlin4,A. Kingery16, G. Laske4, A. Le Pichon3, P. Mialle8, D. E. Moser5, A. Saffer10, E. Silber1, P. Smets13,14, R. E. Spalding6, P. Spurny7,E. Tagliaferri17, D. Uren1, R. J. Weryk1, R. Whitaker18 & Z. Krzeminski1
Most large (over a kilometre in diameter) near-Earth asteroids arenow known, but recognition that airbursts (or fireballs result-ing from nuclear-weapon-sized detonations of meteoroids in theatmosphere) have the potential to do greater damage1 than prev-iously thought has shifted an increasing portion of the residualimpact risk (the risk of impact from an unknown object) to smallerobjects2. Above the threshold size of impactor at which the atmo-sphere absorbs sufficient energy to prevent a ground impact, most ofthe damage is thought to be caused by the airburst shock wave3, butowing to lack of observations this is uncertain4,5. Here we report ananalysis of the damage from the airburst of an asteroid about19 metres (17 to 20 metres) in diameter southeast of Chelyabinsk,Russia, on 15 February 2013, estimated to have an energy equivalentof approximately 500 (6100) kilotons of trinitrotoluene (TNT,where 1 kiloton of TNT 54.18531012 joules). We show that a widely
referenced technique4–6 of estimating airburst damage does notreproduce the observations, and that the mathematical relations7
based on the effects of nuclear weapons—almost always used withthis technique—overestimate blast damage. This suggests that earl-ier damage estimates5,6 near the threshold impactor size are toohigh. We performed a global survey of airbursts of a kiloton or more(including Chelyabinsk), and find that the number of impactorswith diameters of tens of metres may be an order of magnitudehigher than estimates based on other techniques8,9. This suggestsa non-equilibrium (if the population were in a long-term collisionalsteady state the size-frequency distribution would either follow asingle power law or there must be a size-dependent bias in othersurveys) in the near-Earth asteroid population for objects 10 to50 metres in diameter, and shifts more of the residual impact riskto these sizes.
1Department of Physics and Astronomy, University of Western Ontario, London, Ontario N6A 3K7, Canada. 2Centre for Planetary Science and Exploration, University of Western Ontario, London, OntarioN6A 5B7, Canada. 3Commissariat a l’Energie Atomique,DepartementAnalyseSurveillanceEnvironnement (CEA/DAM/DIF), Bruyeres-le-Chatel, 91297 ArpajonCedex, France. 4Laboratory for AtmosphericAcoustics, Institute of Geophysics and Planetary Physics, University of California, San Diego, La Jolla, California 92093-0225, USA. 5Marshall Information Technology Services (MITS)/Dynetics TechnicalServices, NASA Marshall Space Flight Center, Huntsville, Alabama 35812, USA. 6Sandia National Laboratories, PO Box 5800, Albuquerque, New Mexico 87185, USA. 7Astronomical Institute, Academy ofSciences of the Czech Republic, CZ 251 65 Ondrejov, Czech Republic. 8International Data Center, Provisional Technical Secretariat, Comprehensive Test Ban Treaty Organization, PO Box 1200, A-1400Vienna, Austria. 9Bundesanstalt fur Geowissenschaften und Rohstoffe, Stilleweg 2, 30655 Hannover, Germany. 10Meteoroid Environments Office, EV44, Space Environment Team, Marshall Space FlightCenter, Huntsville, Alabama 35812, USA. 11Space Science Division, Naval Research Laboratory, 4555 Overlook Avenue, Washington DC 20375, USA. 12Natural Resources Canada, Canadian HazardInformation Service, 7 Observatory Crescent, Ottawa, Ontario K1A 0Y3, Canada. 13Seismology Division, Royal Netherlands Meteorological Institute, Wilhelminalaan 10, 3732 GK De Bilt, The Netherlands.14Department of Geoscience and Engineering, Faculty of Civil Engineering and Geosciences, Delft University of Technology, Stevinweg 1, 2628 CN Delft, The Netherlands. 15Infrasound Laboratory,University of Hawaii, Manoa 73-4460 Queen Kaahumanu Highway, 119 Kailua-Kona, Hawaii 96740-2638, USA. 16ERC Incorporated/Jacobs ESSSA Group, NASA Marshall Space Flight Center, Huntsville,Alabama 35812, USA. 17ET Space Systems, 5990 Worth Way, Camarillo, California 93012, USA. 18Los Alamos National Laboratory, EES-17 MS F665, PO Box 1663 Los Alamos, New Mexico 87545, USA.
Time (s)–3.0 –2.0 –1.0 0.0 1.0 2.0 3.0
Abs
olut
e br
ight
ness
(mag
nitu
de)
–28
–26
–24
–22
–20
–18
a
Height (km)20253035404550
Ener
gy d
epos
ition
per
uni
t hei
ght
(kt k
m–1
)
0
20
40
60
80
100b
Figure 1 | Light curve of the Chelyabinsk airburst. a, The brightness profilefor the Chelyabinsk airburst, based on indirect illumination measured fromvideo records. The brightness is an average derived from indirect scattered skybrightness from six videos proximal to the airburst, corrected for the sensorgamma setting, autogain, range and airmass extinction, following theprocedure used for other airburst light curves generated from video24,25. Thelight curve has been normalized using the US government sensor data peakbrightness value of 2.7 3 1013 W sr21, corresponding to an absoluteastronomical magnitude of 228 in the silicon bandpass. The individual videolight curves deviate by less than one magnitude between times 22 and 11.5with larger deviations outside this interval. Time zero corresponds to03:20:32.2 UTC on 15 February 2013. b, The energy deposition per unit height
for the Chelyabinsk airburst, based on video data. The conversion to absoluteenergy deposition per unit path length assumes a blackbody emission of6,000 K and bolometric efficiency of 17%, the same as the assumptions usedto convert earlier US government sensor information to energy26. The heightsare computed using the calibrated trajectory10 and features of the lightcurves common to different video sites, resulting in a height accuracy ofabout 1 km. The total energy of the airburst found by integrating under thecurve exceeds 470 kt. The half-energy-deposition height range is 33–27 km;these are the heights at which energy deposition falls below half thepeak value of approximately 80 kt per kilometre of height, which is reachedat an altitude near 29.5 km.
2 3 8 | N A T U R E | V O L 5 0 3 | 1 4 N O V E M B E R 2 0 1 3
Macmillan Publishers Limited. All rights reserved©2013
How good is a static spherical charge model?

Sensitivity - 90° entry vs Spherical ChargeTime evolution
01020304050Distance (km)
0
10
20
30
40
50
60
Altit
ude
(km
)01020304050
Distance (km)
0
10
20
30
40
50
60
Altit
ude
(km
)
t = 10.4 sec t = 10.2 sec
Line Source Spherical Charge
48
t = 10 sec

Sensitivity - 90° entry vs Spherical Charge
t = 19.6 sec0102030
Distance (km)
0
10
20
30
40
Altit
ude
(km
)
Line Source
t = 19.6 sec0102030
Distance (km)
0
10
20
30
40
Altit
ude
(km
)
Spherical ChargeMach contours
49
t = 19.6 sec
Time evolution

Sensitivity - 90° entry vs Spherical Charge
t = 19.6 sec0102030
Distance (km)
0
10
20
30
40
Altit
ude
(km
)
Line Source
t = 19.6 sec0102030
Distance (km)
0
10
20
30
40
Altit
ude
(km
)
Spherical ChargeMach contours
49
LETTERdoi:10.1038/nature12741
A 500-kiloton airburst over Chelyabinsk and anenhanced hazard from small impactorsP. G. Brown1,2, J. D. Assink3, L. Astiz4, R. Blaauw5, M. B. Boslough6, J. Borovicka7, N. Brachet3, D. Brown8, M. Campbell-Brown1,L. Ceranna9, W. Cooke10, C. de Groot-Hedlin4, D. P. Drob11, W. Edwards12, L. G. Evers13,14, M. Garces15, J. Gill1, M. Hedlin4,A. Kingery16, G. Laske4, A. Le Pichon3, P. Mialle8, D. E. Moser5, A. Saffer10, E. Silber1, P. Smets13,14, R. E. Spalding6, P. Spurny7,E. Tagliaferri17, D. Uren1, R. J. Weryk1, R. Whitaker18 & Z. Krzeminski1
Most large (over a kilometre in diameter) near-Earth asteroids arenow known, but recognition that airbursts (or fireballs result-ing from nuclear-weapon-sized detonations of meteoroids in theatmosphere) have the potential to do greater damage1 than prev-iously thought has shifted an increasing portion of the residualimpact risk (the risk of impact from an unknown object) to smallerobjects2. Above the threshold size of impactor at which the atmo-sphere absorbs sufficient energy to prevent a ground impact, most ofthe damage is thought to be caused by the airburst shock wave3, butowing to lack of observations this is uncertain4,5. Here we report ananalysis of the damage from the airburst of an asteroid about19 metres (17 to 20 metres) in diameter southeast of Chelyabinsk,Russia, on 15 February 2013, estimated to have an energy equivalentof approximately 500 (6100) kilotons of trinitrotoluene (TNT,where 1 kiloton of TNT 54.18531012 joules). We show that a widely
referenced technique4–6 of estimating airburst damage does notreproduce the observations, and that the mathematical relations7
based on the effects of nuclear weapons—almost always used withthis technique—overestimate blast damage. This suggests that earl-ier damage estimates5,6 near the threshold impactor size are toohigh. We performed a global survey of airbursts of a kiloton or more(including Chelyabinsk), and find that the number of impactorswith diameters of tens of metres may be an order of magnitudehigher than estimates based on other techniques8,9. This suggestsa non-equilibrium (if the population were in a long-term collisionalsteady state the size-frequency distribution would either follow asingle power law or there must be a size-dependent bias in othersurveys) in the near-Earth asteroid population for objects 10 to50 metres in diameter, and shifts more of the residual impact riskto these sizes.
1Department of Physics and Astronomy, University of Western Ontario, London, Ontario N6A 3K7, Canada. 2Centre for Planetary Science and Exploration, University of Western Ontario, London, OntarioN6A 5B7, Canada. 3Commissariat a l’Energie Atomique,DepartementAnalyseSurveillanceEnvironnement (CEA/DAM/DIF), Bruyeres-le-Chatel, 91297 ArpajonCedex, France. 4Laboratory for AtmosphericAcoustics, Institute of Geophysics and Planetary Physics, University of California, San Diego, La Jolla, California 92093-0225, USA. 5Marshall Information Technology Services (MITS)/Dynetics TechnicalServices, NASA Marshall Space Flight Center, Huntsville, Alabama 35812, USA. 6Sandia National Laboratories, PO Box 5800, Albuquerque, New Mexico 87185, USA. 7Astronomical Institute, Academy ofSciences of the Czech Republic, CZ 251 65 Ondrejov, Czech Republic. 8International Data Center, Provisional Technical Secretariat, Comprehensive Test Ban Treaty Organization, PO Box 1200, A-1400Vienna, Austria. 9Bundesanstalt fur Geowissenschaften und Rohstoffe, Stilleweg 2, 30655 Hannover, Germany. 10Meteoroid Environments Office, EV44, Space Environment Team, Marshall Space FlightCenter, Huntsville, Alabama 35812, USA. 11Space Science Division, Naval Research Laboratory, 4555 Overlook Avenue, Washington DC 20375, USA. 12Natural Resources Canada, Canadian HazardInformation Service, 7 Observatory Crescent, Ottawa, Ontario K1A 0Y3, Canada. 13Seismology Division, Royal Netherlands Meteorological Institute, Wilhelminalaan 10, 3732 GK De Bilt, The Netherlands.14Department of Geoscience and Engineering, Faculty of Civil Engineering and Geosciences, Delft University of Technology, Stevinweg 1, 2628 CN Delft, The Netherlands. 15Infrasound Laboratory,University of Hawaii, Manoa 73-4460 Queen Kaahumanu Highway, 119 Kailua-Kona, Hawaii 96740-2638, USA. 16ERC Incorporated/Jacobs ESSSA Group, NASA Marshall Space Flight Center, Huntsville,Alabama 35812, USA. 17ET Space Systems, 5990 Worth Way, Camarillo, California 93012, USA. 18Los Alamos National Laboratory, EES-17 MS F665, PO Box 1663 Los Alamos, New Mexico 87545, USA.
Time (s)–3.0 –2.0 –1.0 0.0 1.0 2.0 3.0
Abs
olut
e br
ight
ness
(mag
nitu
de)
–28
–26
–24
–22
–20
–18
a
Height (km)20253035404550
Ener
gy d
epos
ition
per
uni
t hei
ght
(kt k
m–1
)
0
20
40
60
80
100b
Figure 1 | Light curve of the Chelyabinsk airburst. a, The brightness profilefor the Chelyabinsk airburst, based on indirect illumination measured fromvideo records. The brightness is an average derived from indirect scattered skybrightness from six videos proximal to the airburst, corrected for the sensorgamma setting, autogain, range and airmass extinction, following theprocedure used for other airburst light curves generated from video24,25. Thelight curve has been normalized using the US government sensor data peakbrightness value of 2.7 3 1013 W sr21, corresponding to an absoluteastronomical magnitude of 228 in the silicon bandpass. The individual videolight curves deviate by less than one magnitude between times 22 and 11.5with larger deviations outside this interval. Time zero corresponds to03:20:32.2 UTC on 15 February 2013. b, The energy deposition per unit height
for the Chelyabinsk airburst, based on video data. The conversion to absoluteenergy deposition per unit path length assumes a blackbody emission of6,000 K and bolometric efficiency of 17%, the same as the assumptions usedto convert earlier US government sensor information to energy26. The heightsare computed using the calibrated trajectory10 and features of the lightcurves common to different video sites, resulting in a height accuracy ofabout 1 km. The total energy of the airburst found by integrating under thecurve exceeds 470 kt. The half-energy-deposition height range is 33–27 km;these are the heights at which energy deposition falls below half thepeak value of approximately 80 kt per kilometre of height, which is reachedat an altitude near 29.5 km.
2 3 8 | N A T U R E | V O L 5 0 3 | 1 4 N O V E M B E R 2 0 1 3
Macmillan Publishers Limited. All rights reserved©2013
t = 19.6 sec
Time evolution

Sensitivity - 90° entry vs Spherical Charge
t = 44.5 sec0102030
Distance (km)
0
10
20
30
40
Altit
ude
(km
)
Line Source
0102030Distance (km)
0
10
20
30
40
Altit
ude
(km
)
Spherical Charge
t = 44.5 sec
50
t = 44.5 sec
Time evolution

Sensitivity - 90° entry vs Spherical Charge
t = 118 sec0102030
Distance (km)
0
10
20
30
40
Altit
ude
(km
)
Line Source
t = 118 sec0102030
Distance (km)
0
10
20
30
40
Altit
ude
(km
)
Spherical ChargeMach
contours
51
t = 118 sec
Time evolution

Sensitivity - 90° entry vs Spherical ChargeGround footprint comparison
-100 -80 -60 -40 -20 0 20 40 60 80 100Distance (km)
-4
-2
0
2
4
6
8
10
Ove
rpre
ssur
e (%
)
Line SourceSpherical ChargeEnvelope (Spherical Charge)
(overpressure)
(underpressure)
Envelope of Max and Min Ground PressuresSpherical ChargeLine Source
LETTERdoi:10.1038/nature12741
A 500-kiloton airburst over Chelyabinsk and anenhanced hazard from small impactorsP. G. Brown1,2, J. D. Assink3, L. Astiz4, R. Blaauw5, M. B. Boslough6, J. Borovicka7, N. Brachet3, D. Brown8, M. Campbell-Brown1,L. Ceranna9, W. Cooke10, C. de Groot-Hedlin4, D. P. Drob11, W. Edwards12, L. G. Evers13,14, M. Garces15, J. Gill1, M. Hedlin4,A. Kingery16, G. Laske4, A. Le Pichon3, P. Mialle8, D. E. Moser5, A. Saffer10, E. Silber1, P. Smets13,14, R. E. Spalding6, P. Spurny7,E. Tagliaferri17, D. Uren1, R. J. Weryk1, R. Whitaker18 & Z. Krzeminski1
Most large (over a kilometre in diameter) near-Earth asteroids arenow known, but recognition that airbursts (or fireballs result-ing from nuclear-weapon-sized detonations of meteoroids in theatmosphere) have the potential to do greater damage1 than prev-iously thought has shifted an increasing portion of the residualimpact risk (the risk of impact from an unknown object) to smallerobjects2. Above the threshold size of impactor at which the atmo-sphere absorbs sufficient energy to prevent a ground impact, most ofthe damage is thought to be caused by the airburst shock wave3, butowing to lack of observations this is uncertain4,5. Here we report ananalysis of the damage from the airburst of an asteroid about19 metres (17 to 20 metres) in diameter southeast of Chelyabinsk,Russia, on 15 February 2013, estimated to have an energy equivalentof approximately 500 (6100) kilotons of trinitrotoluene (TNT,where 1 kiloton of TNT 54.18531012 joules). We show that a widely
referenced technique4–6 of estimating airburst damage does notreproduce the observations, and that the mathematical relations7
based on the effects of nuclear weapons—almost always used withthis technique—overestimate blast damage. This suggests that earl-ier damage estimates5,6 near the threshold impactor size are toohigh. We performed a global survey of airbursts of a kiloton or more(including Chelyabinsk), and find that the number of impactorswith diameters of tens of metres may be an order of magnitudehigher than estimates based on other techniques8,9. This suggestsa non-equilibrium (if the population were in a long-term collisionalsteady state the size-frequency distribution would either follow asingle power law or there must be a size-dependent bias in othersurveys) in the near-Earth asteroid population for objects 10 to50 metres in diameter, and shifts more of the residual impact riskto these sizes.
1Department of Physics and Astronomy, University of Western Ontario, London, Ontario N6A 3K7, Canada. 2Centre for Planetary Science and Exploration, University of Western Ontario, London, OntarioN6A 5B7, Canada. 3Commissariat a l’Energie Atomique,DepartementAnalyseSurveillanceEnvironnement (CEA/DAM/DIF), Bruyeres-le-Chatel, 91297 ArpajonCedex, France. 4Laboratory for AtmosphericAcoustics, Institute of Geophysics and Planetary Physics, University of California, San Diego, La Jolla, California 92093-0225, USA. 5Marshall Information Technology Services (MITS)/Dynetics TechnicalServices, NASA Marshall Space Flight Center, Huntsville, Alabama 35812, USA. 6Sandia National Laboratories, PO Box 5800, Albuquerque, New Mexico 87185, USA. 7Astronomical Institute, Academy ofSciences of the Czech Republic, CZ 251 65 Ondrejov, Czech Republic. 8International Data Center, Provisional Technical Secretariat, Comprehensive Test Ban Treaty Organization, PO Box 1200, A-1400Vienna, Austria. 9Bundesanstalt fur Geowissenschaften und Rohstoffe, Stilleweg 2, 30655 Hannover, Germany. 10Meteoroid Environments Office, EV44, Space Environment Team, Marshall Space FlightCenter, Huntsville, Alabama 35812, USA. 11Space Science Division, Naval Research Laboratory, 4555 Overlook Avenue, Washington DC 20375, USA. 12Natural Resources Canada, Canadian HazardInformation Service, 7 Observatory Crescent, Ottawa, Ontario K1A 0Y3, Canada. 13Seismology Division, Royal Netherlands Meteorological Institute, Wilhelminalaan 10, 3732 GK De Bilt, The Netherlands.14Department of Geoscience and Engineering, Faculty of Civil Engineering and Geosciences, Delft University of Technology, Stevinweg 1, 2628 CN Delft, The Netherlands. 15Infrasound Laboratory,University of Hawaii, Manoa 73-4460 Queen Kaahumanu Highway, 119 Kailua-Kona, Hawaii 96740-2638, USA. 16ERC Incorporated/Jacobs ESSSA Group, NASA Marshall Space Flight Center, Huntsville,Alabama 35812, USA. 17ET Space Systems, 5990 Worth Way, Camarillo, California 93012, USA. 18Los Alamos National Laboratory, EES-17 MS F665, PO Box 1663 Los Alamos, New Mexico 87545, USA.
Time (s)–3.0 –2.0 –1.0 0.0 1.0 2.0 3.0
Abs
olut
e br
ight
ness
(mag
nitu
de)
–28
–26
–24
–22
–20
–18
a
Height (km)20253035404550
Ener
gy d
epos
ition
per
uni
t hei
ght
(kt k
m–1
)
0
20
40
60
80
100b
Figure 1 | Light curve of the Chelyabinsk airburst. a, The brightness profilefor the Chelyabinsk airburst, based on indirect illumination measured fromvideo records. The brightness is an average derived from indirect scattered skybrightness from six videos proximal to the airburst, corrected for the sensorgamma setting, autogain, range and airmass extinction, following theprocedure used for other airburst light curves generated from video24,25. Thelight curve has been normalized using the US government sensor data peakbrightness value of 2.7 3 1013 W sr21, corresponding to an absoluteastronomical magnitude of 228 in the silicon bandpass. The individual videolight curves deviate by less than one magnitude between times 22 and 11.5with larger deviations outside this interval. Time zero corresponds to03:20:32.2 UTC on 15 February 2013. b, The energy deposition per unit height
for the Chelyabinsk airburst, based on video data. The conversion to absoluteenergy deposition per unit path length assumes a blackbody emission of6,000 K and bolometric efficiency of 17%, the same as the assumptions usedto convert earlier US government sensor information to energy26. The heightsare computed using the calibrated trajectory10 and features of the lightcurves common to different video sites, resulting in a height accuracy ofabout 1 km. The total energy of the airburst found by integrating under thecurve exceeds 470 kt. The half-energy-deposition height range is 33–27 km;these are the heights at which energy deposition falls below half thepeak value of approximately 80 kt per kilometre of height, which is reachedat an altitude near 29.5 km.
2 3 8 | N A T U R E | V O L 5 0 3 | 1 4 N O V E M B E R 2 0 1 3
Macmillan Publishers Limited. All rights reserved©2013
52
• Very similar envelopes - modulo details of energy deposition profile chosen.
• Both show lower peak overpressure than 18° trajectory

Sensitivity - 90° entry vs Spherical Charge
-100 -80 -60 -40 -20 0 20 40 60 80 100Distance (km)
-4
-2
0
2
4
6
8
10
Ove
rpre
ssur
e (%
)
Line SourceSpherical ChargeEnvelope (Spherical Charge)
(overpressure)
(underpressure)
Envelope of Max and Min Ground Pressures
Spherical Charge
Line Source
Surface Pressures @ t = 139 sec.
Surface Pressures @ t = 139 sec.
53
• Detailed pressure impulse shows similar instantaneous profiles as blast evolves
• Blast arrival times agree to within 2-3 seconds
Ground footprint comparison

Summary
• Outlined modeling for far-field propagation of airburst events using a Cartesian finite-volume method
• Showed basic verification and validation• Good prediction for model problems• Good prediction of footprint and arrival time data for Chelyabinsk meteor
• Showed envelopes and time-evolution of ground footprints for damage prediction and atmospheric-driven tsunami simulations
• Preliminary sensitivity investigations• Line source vs full time-dependent entry• Effects of Entry angle & comparison with specific spherical blast
54
Full paper for modeling and V&V planned at AIAA SciTech 2016 in San Diego (Jan 2016)
Atmospheric propagation and ground effects modeling

Next Steps...
• Parametric drivers• Vary entry angle, size and strength of asteroid• Parametric modification of energy deposition curve• Precompute parametric studies -- feed results to PRA
• Cratering & splashing
• Terrain and structures• Refine particular when scenario arises (e.g. PDC 15)
• Update models being output to Physics-Based Risk Analysis
• Update models being input from entry and breakup modeling
55
Atmospheric propagation and ground effects modeling

Thank You!• NASA Advanced Supercomputing Division – Task 3 & 4 teams
" Marian Nemec Donovan Mathias Jonathan Chiew George Anderson Chris Mattenberger Darrel Robertson
Lorien Wheeler
• Entry Systems Division – Task 2 team" " Dinesh Prabhu Ethiraj Venkatapathy
• New York University" " Marsha Berger
• NASA PD IPT" " James Arnold Craig Burkhard Jessie Dotson David Morrison Derek Sears
• IPT Seminar Speakers" " Peter Jenniskens Peter Brown Olga Popova Jay Melosh Paul Chodas
• NASA NEO Office" " Lindley Johnson
56