FAQs for Evaluating the Soil-to-Groundwater Pathway
31
LAND PROTECTION BRANCH Hazardous Waste Corrective Action Program Hazardous Waste Management Program Response and Remediation Program 2 Martin Luther King, Jr. Dr. SE Suite 1054 East Tower Atlanta, Georgia 30334 Frequently Asked Questions for Evaluating the Soil-to- Groundwater Migration Pathway October 18, 2019 Technical Guidance Document
Transcript of FAQs for Evaluating the Soil-to-Groundwater Pathway

LAND PROTECTION BRANCH Hazardous Waste Corrective Action Program
Hazardous Waste Management Program
Response and Remediation Program
2 Martin Luther King, Jr. Dr. SE
Suite 1054 East Tower
Atlanta, Georgia 30334
Frequently Asked Questions for
Evaluating the Soil-to-
Groundwater Migration Pathway
October 18, 2019
Technical Guidance Document

FAQs for Evaluating the
Soil-to-Groundwater Migration Pathway October 18, 2019
Page ii
Acknowledgement
The following staff of the EPD Land Protection Branch participated in the development of this
document:
• Heather Clark (Hazardous Waste Management, DoD Unit)
• Jill Clark (Risk Assessment Program)
• Gary Davis, P.G. (Response & Remediation, Brownfield Unit)
• David Hayes (Response & Remediation, Voluntary Remediation Unit)
• Allan Nix, P.G. (Response & Remediation, Response Development Unit 1)
• Allison Keefer, P.G. (Hazardous Waste Corrective Action, Remedial Sites 1 Unit)
Additional EPD staff and management provided technical review of this document.

FAQs for Evaluating the
Soil-to-Groundwater Migration Pathway October 18, 2019
Page iii
Guidelines for Applicability and Use of this Guidance Document
This document provides technical guidance for evaluating the soil-to-groundwater migration
pathway when such an evaluation is required under the applicable Georgia statutes and regulations
administered by the following programs of the Land Protection Branch:
• Hazardous Waste Corrective Action Program
• Hazardous Waste Management Program
• Response and Remediation Program
This guidance document is intended for use by environmental professionals who have experience
in the investigation and remediation of subsurface contamination. The guidance provided within
this document includes methods and recommendations that can be used to meet the pathway
evaluation requirements of statutes and regulations; however, this document is not a statute or a
regulation. This document may be revised in the future based on comments and/or new
information. Using the methods and recommendations in this guidance document will provide for
streamlined EPD review of soil-to-groundwater migration pathway evaluations. Other approaches
can be accepted if they meet the requirements of applicable statutes and regulations. If another
approach is being considered, EPD recommends discussing the approach with EPD staff involved
with the project prior to implementation. The use of trade names does not constitute endorsement
by EPD.

FAQs for Evaluating the
Soil-to-Groundwater Migration Pathway October 18, 2019
Page iv
Contents
Acknowledgement .......................................................................................................................... ii
Guidelines for Applicability and Use of this Guidance Document ............................................... iii
Acronyms ....................................................................................................................................... vi
Key Terms ..................................................................................................................................... vii
Purpose ............................................................................................................................................ 1
Frequently Asked Questions (FAQs) .............................................................................................. 1
1. What is the soil-to-groundwater migration pathway?.............................................................1
2. How do I evaluate the soil-to-groundwater migration pathway? ...........................................2
3. How do I use the Soil-Water Partition Equation to evaluate the soil-to-groundwater migration
pathway? .................................................................................................................................2
3.1 Introduction to the Soil-Water Partition Equation .........................................................3
3.2 Steps to Using the Soil-Water Partition Equation..........................................................5
4. What laboratory leaching tests are acceptable for evaluating the soil-to-groundwater
migration pathway?.................................................................................................................6
5. What are the sample collection and reporting recommendations associated with the SPLP
and TCLP tests? ......................................................................................................................7
5.1 Sample Collection Recommendations ...........................................................................7
5.2 Reporting Recommendations .........................................................................................8
6. I performed SPLP or TCLP tests to evaluate the soil-to-groundwater migration pathway.
How do I analyze the test results? ..........................................................................................9
7. What fate and transport models are acceptable for evaluating the soil-to-groundwater
migration pathway?...............................................................................................................13
8. How are measured soil concentrations compared to calculated soil concentrations protective
of the soil-to-groundwater migration pathway to demonstrate compliance? .......................14
9. What additional lines of evidence can be used to support an evaluation of the soil-to-
groundwater migration pathway? .........................................................................................15
References ..................................................................................................................................... 16
Appendix ....................................................................................................................................... 18

FAQs for Evaluating the
Soil-to-Groundwater Migration Pathway October 18, 2019
Page v
A.1 Determining the Target Soil Leachate Concentration .......................................................18
A.1.1 Case 1: The Contaminant is Not Present in Upgradient Groundwater ..................18
A.1.2 Case 2: The Contaminant is Present in Upgradient Groundwater .........................19
A.2 Determining Groundwater Recharge Rates .......................................................................20
A.3 Determining the Soil-Water Partition Coefficient, Kd .......................................................20
A.3.1 Determining Kd for Organics Using Literature Values..........................................20
A.3.2 Determining Kd for Inorganics Using Literature Values .......................................21
A.3.3 Determining a Site-Specific Kd ..............................................................................22
A.4 Determining the Fraction Organic Carbon in Soil, foc .......................................................23
A.4.1 Sample Collection Recommendations ...................................................................23
A.4.2 Analytical Methods ................................................................................................23
A.4.3 Reporting Recommendations .................................................................................23
FAQs for Evaluating the
Soil-to-Groundwater Migration Pathway October 18, 2019
Page vi
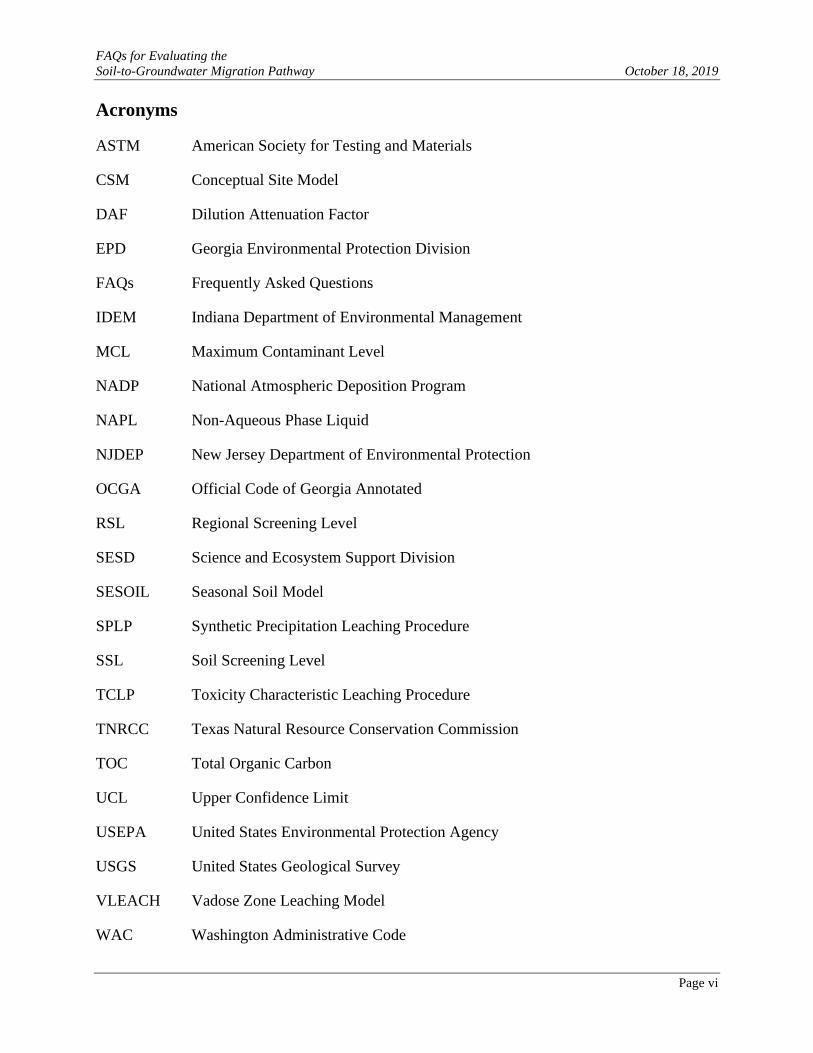
Acronyms
ASTM American Society for Testing and Materials
CSM Conceptual Site Model
DAF Dilution Attenuation Factor
EPD Georgia Environmental Protection Division
FAQs Frequently Asked Questions
IDEM Indiana Department of Environmental Management
MCL Maximum Contaminant Level
NADP National Atmospheric Deposition Program
NAPL Non-Aqueous Phase Liquid
NJDEP New Jersey Department of Environmental Protection
OCGA Official Code of Georgia Annotated
RSL Regional Screening Level
SESD Science and Ecosystem Support Division
SESOIL Seasonal Soil Model
SPLP Synthetic Precipitation Leaching Procedure
SSL Soil Screening Level
TCLP Toxicity Characteristic Leaching Procedure
TNRCC Texas Natural Resource Conservation Commission
TOC Total Organic Carbon
UCL Upper Confidence Limit
USEPA United States Environmental Protection Agency
USGS United States Geological Survey
VLEACH Vadose Zone Leaching Model
WAC Washington Administrative Code
FAQs for Evaluating the
Soil-to-Groundwater Migration Pathway October 18, 2019
Page vii
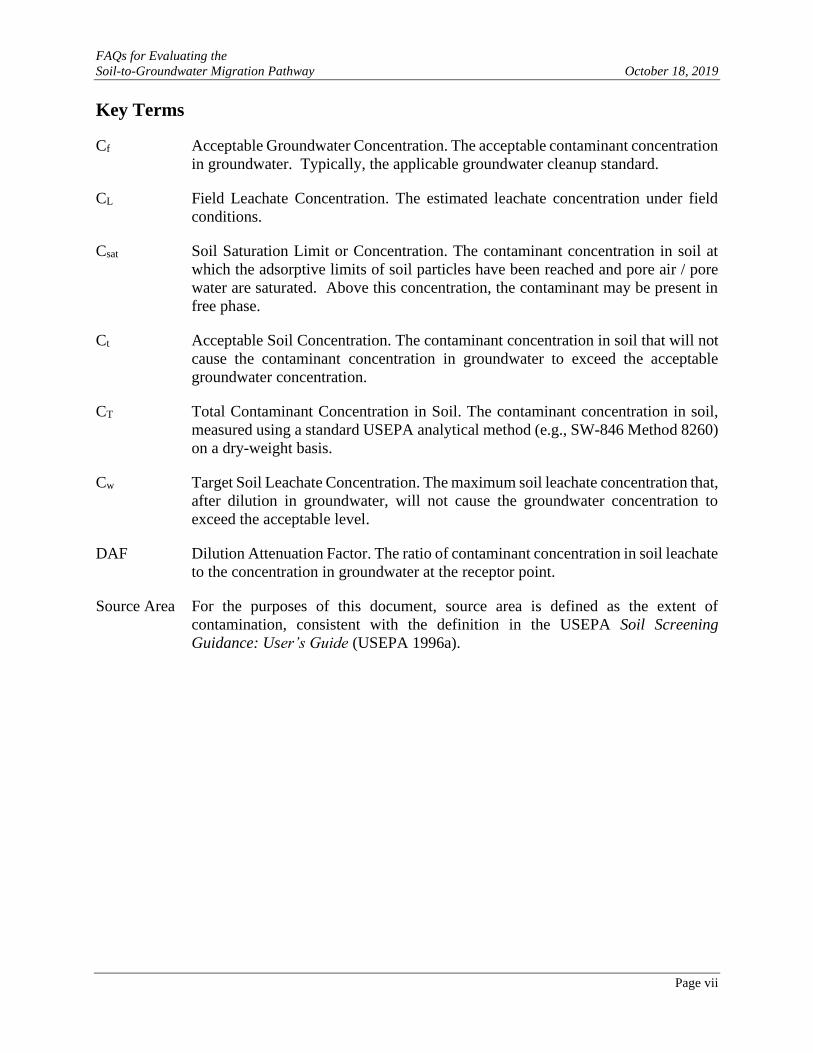
Key Terms
Cf Acceptable Groundwater Concentration. The acceptable contaminant concentration
in groundwater. Typically, the applicable groundwater cleanup standard.
CL Field Leachate Concentration. The estimated leachate concentration under field
conditions.
Csat Soil Saturation Limit or Concentration. The contaminant concentration in soil at
which the adsorptive limits of soil particles have been reached and pore air / pore
water are saturated. Above this concentration, the contaminant may be present in
free phase.
Ct Acceptable Soil Concentration. The contaminant concentration in soil that will not
cause the contaminant concentration in groundwater to exceed the acceptable
groundwater concentration.
CT Total Contaminant Concentration in Soil. The contaminant concentration in soil,
measured using a standard USEPA analytical method (e.g., SW-846 Method 8260)
on a dry-weight basis.
Cw Target Soil Leachate Concentration. The maximum soil leachate concentration that,
after dilution in groundwater, will not cause the groundwater concentration to
exceed the acceptable level.
DAF Dilution Attenuation Factor. The ratio of contaminant concentration in soil leachate
to the concentration in groundwater at the receptor point.
Source Area For the purposes of this document, source area is defined as the extent of
contamination, consistent with the definition in the USEPA Soil Screening
Guidance: User’s Guide (USEPA 1996a).

FAQs for Evaluating the
Soil-to-Groundwater Migration Pathway October 18, 2019
Page 1
Purpose
The purpose of this document is to provide guidance for evaluating the soil-to-groundwater
migration pathway at regulated sites in Georgia in a convenient question-and-answer format. This
document is intended for use with sites that are subject to regulation by the Georgia Environmental
Protection Division (EPD) under the following Georgia statutes and regulations:
Statutes:
• Hazardous Site Response Act (OCGA 12-8-90)
• Brownfield Act (OCGA 12-8-200)
• Hazardous Waste Management Act (OCGA 12-8-60)
• Voluntary Remediation Program Act (OCGA 12-8-100)
Regulations:
• Rules for Hazardous Site Response (Chapter 391-3-19)
• Rules for Hazardous Waste Management (Chapter 391-3-11)
Programs within the EPD Land Protection Branch administer regulatory oversight of these statutes
and regulations. These programs and their contact information are shown in Table 1. For more
information about Land Protection Branch programs, click here.
Table 1: Contact Information for Relevant EPD Regulatory Programs.
EPD Regulatory Program Phone
Hazardous Waste Management Program 404.656.2833
Hazardous Waste Corrective Action Program 404.656.7802
Response and Remediation Program 404.657.8600
Frequently Asked Questions (FAQs)
1. What is the soil-to-groundwater migration pathway?
The soil-to-groundwater migration pathway is the pathway along which contaminants migrate
from the vadose, or unsaturated, zone (soil) to the saturated zone (groundwater) by a process
known as "leaching." During leaching, soil contaminants are released into the pore-waters of the
soil, forming "leachate", which then percolates down into the underlying groundwater. If
contaminants are present in free phase, they may migrate independently of pore water movement.
The purpose of evaluating the soil-to-groundwater migration pathway is to determine acceptable
contaminant concentrations in soil that will not cause contaminant concentrations in groundwater

FAQs for Evaluating the
Soil-to-Groundwater Migration Pathway October 18, 2019
Page 2
to exceed acceptable levels at a regulatory point of compliance1. A conceptual model of the soil-
to-groundwater migration pathway is shown in Figure 1. In this example, a receptor well is located
a distance “x” downgradient from the source of contamination. Note that other receptors to
contaminated groundwater could include surface water and building occupants via vapor intrusion.
Figure 1: Conceptual model of the soil-to-groundwater migration pathway. Source: Adapted from USEPA
1996b.
2. How do I evaluate the soil-to-groundwater migration pathway?
The soil-to-groundwater migration pathway may be evaluated using a laboratory leaching test
and/or a fate and transport model approved by EPD. Laboratory tests may also be used to obtain
site-specific parameters for input in fate and transport models. In cases where the soil release
occurred many years ago and groundwater has not been impacted, a multiple lines of evidence
approach can also be considered (see Question 9).
EPD recommends beginning the evaluation of the soil-to-groundwater migration pathway with
Equation 10 of the United States Environmental Protection Agency (USEPA) Soil Screening
Guidance: User’s Guide (USEPA 1996a). In this document, the equation is referred to as the
“Soil-Water Partition Equation” and it is presented as Equation 1. The Soil-Water Partition
Equation is a conservative screening level model that can often be used with limited site-specific
data. If desired, a more site-specific evaluation can then be performed by incorporating site-
specific parameters in the Soil-Water Partition Equation, by using laboratory leaching tests, or by
using a more advanced fate and transport model with site-specific input parameters.
Note: When using a model to develop acceptable soil concentrations, the assumptions of the model
should be clearly stated, and the selection/determination of any input parameters should be
justified and documented.
3. How do I use the Soil-Water Partition Equation to evaluate the soil-to-groundwater
migration pathway?
This section discusses the use of the Soil-Water Partition Equation to develop soil screening
criteria for evaluating the soil-to-groundwater migration pathway. Note that the USEPA Regional
1 The determination of acceptable groundwater concentrations and the regulatory point of compliance are not
addressed in this guidance document.
Zone of Leaching

FAQs for Evaluating the
Soil-to-Groundwater Migration Pathway October 18, 2019
Page 3
Screening Level (RSL) Calculator can be used to calculate results of the Soil-Water Partition
Equation:
https://epa-prgs.ornl.gov/cgi-bin/chemicals/csl_search
Also note that, in addition to screening levels for direct exposure to soils (i.e., the Residential and
Industrial Regional Screening Levels), the USEPA Regional Screening Levels for Chemical
Contaminants at Superfund Sites provides tabulated “Protection of Groundwater” soil screening
levels (SSLs) that are calculated using the Soil-Water Partition Equation:
https://www.epa.gov/risk/regional-screening-levels-rsls-generic-tables
When using the RSL Calculator or the tabulated Protection of Groundwater SSLs, it is important
to ensure that the input values used in the Soil-Water Partition Equation calculation, such as the
dilution attenuation factor (DAF) and the acceptable groundwater concentration, are appropriate
for use at the site. For example, the tabulated Protection of Groundwater SSLs are generated using
a DAF of 1 and acceptable groundwater concentrations of either the MCLs or risk-based drinking
water concentrations at a cancer risk of 1E-6 and hazard quotients of 0.1 or 1. These values may
or may not be appropriate for use at your site.
3.1 Introduction to the Soil-Water Partition Equation
The Soil-Water Partition Equation is presented as (USEPA 1996a):
(Equation 1)
Table 2: Parameters for Equation 1 (continued on next page).
Parameter Definition Units Default Comment
Ct
soil screening level
concentration (may be
used as an acceptable
soil concentration)
mg/kg --- ---
Cw target soil leachate
concentration mg/L --- see Step 2 (Section 3.2)
Kd soil-water partition
coefficient L/kg
chemical-
specific
see Step 3 (Section 3.2)
default for organics:
Kd = Koc x foc
default for inorganics:
EPA RSL Tables
Koc
soil organic carbon-
water partition
coefficient
L/kg chemical-
specific see Step 3 (Section 3.2)
foc fraction organic
carbon in soil kg/kg 0.002 see Step 4 (Section 3.2)
++=
b
awdwt
HKCC
'

FAQs for Evaluating the
Soil-to-Groundwater Migration Pathway October 18, 2019
Page 4
Parameter Definition Units Default Comment
θw water-filled soil
porosity Lwater/Lsoil 0.3 ---
θa air-filled soil porosity Lair/Lsoil 0.13 a = − w
ɳ total soil porosity Lpore/Lsoil 0.43 = 1 − bs
b dry soil bulk density kg/L 1.5 ---
s soil particle density kg/L 2.65 ---
H′ dimensionless
Henry's Law Constant unitless
chemical-
specific see Step 4 (Section 3.2)
The Soil-Water Partition Equation is a screening level model used to determine an acceptable
contaminant concentration in soil based on the acceptable contaminant concentration in
groundwater. The acceptable groundwater concentration is typically the groundwater cleanup
standard for the site. Two fundamental processes are accounted for in the Soil-Water Partition
Equation: 1) partitioning of the contaminant between soil particles, pore air, and pore water
(leachate) and 2) leachate dilution in groundwater. The acceptable groundwater concentration is
used to determine the target soil leachate concentration (Cw). The target soil leachate concentration
is the maximum leachate concentration that, after dilution in groundwater, will not cause the
groundwater concentration to exceed the acceptable level. The target soil leachate concentration
is then used in the Soil-Water Partition Equation to determine the associated soil concentration
due to soil-water partitioning.
When using the Soil-Water Partition Equation, the assumptions upon which the equation is based
should be considered to determine if they are appropriate for site conditions. The following
assumptions used in the Soil-Water Partition Equation are presented in the Soil Screening
Guidance: Technical Background Document (USEPA 1996b):
• The source is infinite (i.e., steady-state concentrations will be maintained in groundwater
over the exposure period of interest).
• Contaminants are uniformly distributed throughout the zone of contamination.
• Soil contamination extends from the surface to the water table (i.e., adsorption sites are
filled in the unsaturated zone beneath the area of contamination).
• There is no chemical or biological degradation in the unsaturated zone.
• Equilibrium soil/water partitioning is instantaneous and linear in the contaminated soil.
• The receptor well is at the edge of the source (i.e., there is no dilution from recharge
downgradient of the site) and is screened in the plume.
• The aquifer is unconsolidated and unconfined (surficial).
• Aquifer properties are homogeneous and isotropic.
• There is no attenuation (i.e. adsorption or degradation) of contaminants in the aquifer.
• Non-aqueous phase liquids (NAPLs) are not present at the site.

FAQs for Evaluating the
Soil-to-Groundwater Migration Pathway October 18, 2019
Page 5
It is highly recommended that users of the Soil-Water Partition Equation review relevant sections
of the Soil Screening Guidance, which includes the User’s Guide, the Technical Background
Document, and the Supplemental Guidance for Developing Soil Screening Levels at Superfund
Sites (USEPA 1996a, 1996b, 2002). These documents are available at the following website:
https://www.epa.gov/superfund/superfund-soil-screening-guidance
3.2 Steps to Using the Soil-Water Partition Equation
The following methodology is recommended for using the Soil-Water Partition Equation to
evaluate the soil-to-groundwater migration pathway:
1. Delineate the source area
The source area (i.e., extent of contamination) is generally delineated based on program-
specific criteria. Delineation criteria may include background concentrations, practical
quantitation limits, residential Risk Reduction Standards, or other values approved by EPD.
Contact the regulatory program overseeing the site investigation for information on
applicable delineation criteria.
2. Determine the target soil leachate concentration, Cw
Determination of the target soil leachate concentration is discussed in Section A.1 of the
Appendix.
3. Determine the soil-water partition coefficient, Kd
Literature values or site-specific values may be used for Kd. Section A.3 of the Appendix
discusses the determination of literature-based and site-specific Kd values for both organic
and inorganic compounds. For organic compounds, see Sections A.3.1 and A.3.3 of the
Appendix. For inorganic compounds, see Sections A.3.2 and A.3.3 of the Appendix.
4. Determine other parameters
a. Fraction organic carbon in soil, foc
The default foc value for use in the Soil-Water Partition Equation is 0.002 kg/kg. A
site-specific value may also be used. Determination of a site-specific value for foc is
discussed in Section A.4 of the Appendix.
b. Dimensionless Henry’s Law Constant, H′
Values for the dimensionless Henry’s Law Constant should be taken from the most
recent version of the USEPA Regional Screening Levels for Chemical Contaminants
at Superfund Sites, Chemical Specific Parameters Table, which is available at:
https://www.epa.gov/risk/regional-screening-levels-rsls-generic-tables
The dimensionless Henry’s Law Constant should not be confused with the Henry’s
Law Constant, which has units of atm·m3/mol. Note that when the dimensionless
Henry’s Law Constant is not available, as is the case for most inorganics, H' should be
set to zero.

FAQs for Evaluating the
Soil-to-Groundwater Migration Pathway October 18, 2019
Page 6
c. Porosity [total (ɳ), water-filled (θw), and air-filled (θa)]
The default values for total, water-filled, and air-filled porosity are 0.43, 0.3, and 0.13,
respectively. These values may be adjusted based on site-specific geotechnical data.
d. Dry soil bulk density, ρb
The default value for dry soil bulk density is 1.5 kg/L. This value may be adjusted
based on site-specific geotechnical data.
5. Calculate the acceptable soil concentration, Ct
Once values for all parameters have been identified, the Soil-Water Partition Equation
(refer to Equation 1) is used to calculate the acceptable soil concentration, which is
considered a conservative estimate of the maximum contaminant concentration in soil that
will not result in an exceedance of the acceptable groundwater concentration.
Note that the acceptable soil concentration determined using this or other methods in this
document should not exceed the soil saturation limit (Csat). Contaminants may be present
in free phase when concentrations exceed Csat. Default values for Csat are listed in the
USEPA RSL Tables and values may also be calculated. For more information, see Section
2.5.2 of the USEPA Soil Screening Guidance: User’s Guide (USEPA 1996a).
4. What laboratory leaching tests are acceptable for evaluating the soil-to-groundwater
migration pathway?
Two USEPA laboratory tests, the Toxicity Characteristic Leaching Procedure (TCLP, SW-846
Method 1311) and the Synthetic Precipitation Leaching Procedure (SPLP, SW-846 Method 1312),
are generally accepted as stand-alone tests for evaluating the soil-to-groundwater migration
pathway. These tests simulate leaching in soil samples, allowing a correlation to be made between
the total contaminant concentration in a soil sample and the resulting leachate concentration.
These tests are similar, but they use different extraction fluids to simulate different types of
environmental conditions. The TCLP test was developed as a waste characterization test to assess
the leaching of contaminants in a municipal solid waste landfill (USEPA 1996a). To simulate the
conditions present in a municipal solid waste landfill, the TCLP test employs a buffered organic
acid as the extraction fluid (TNRCC 1998).
The SPLP test employs a non-buffered inorganic extraction fluid that is intended to simulate
leaching in typical soil, where pore water is present due to infiltration from precipitation (TNRCC
1998). For evaluating the soil-to-groundwater migration pathway, the use of the TCLP test should
be limited to sites where conditions reflect those of a municipal solid waste landfill. The TCLP
test remains the sole test for evaluating the toxicity characteristic for waste determination (i.e.,
solid vs. hazardous waste) purposes. The SPLP test better simulates the field conditions at most
regulated sites (other than municipal solid waste landfills), and therefore is the preferred
laboratory leaching test for evaluating the soil-to-groundwater migration pathway. Where
allowable under applicable statutes and regulations, the SPLP Extraction Fluid #2 for “west of the
Mississippi River” (pH = 5) may be used based on recent trends in the pH of Georgia precipitation
(NADP 2019). Contact EPD prior to deviating from the SW-846 approved method Other leaching
tests may be considered on a site-specific basis.

FAQs for Evaluating the
Soil-to-Groundwater Migration Pathway October 18, 2019
Page 7
5. What are the sample collection and reporting recommendations associated with the
SPLP and TCLP tests?
5.1 Sample Collection Recommendations
1. For general soil sampling information, refer to the most recent version of the USEPA
Region 4 Science and Ecosystem Support Division (SESD) Soil Sampling Operating
Procedure, which is available at:
https://www.epa.gov/quality/soil-sampling
2. The number of samples needed to adequately support the estimation of soil leaching
thresholds using laboratory leaching tests will depend on the size and complexity of the
site, as well as the method selected to evaluate the leaching test data.
Generally, sites with larger source areas and/or a greater degree of subsurface heterogeneity
will require more samples to remain adequately representative of spatial contaminant
concentration variability and differences in leaching potential due to soil properties where
more than one major soil type is present.
In order to generate a data set that is more likely to support the requirements of the methods
presented in this guidance, EPD generally recommends that a minimum of ten (10) samples
be collected and analyzed per source area. However, depending on site-specific factors
such as the size of the source area, fewer samples may be acceptable to EPD. If more
rigorous statistical methods or models are used to evaluate leaching test results, the number
of samples collected should be commensurate with the requirements of the model, at the
desired level of confidence. Contact the EPD regulatory program overseeing the site
investigation with questions regarding the number of samples needed at a particular site.
3. Each soil sample collected for leaching analysis should comprise one (1) aliquot for total
concentration analysis and one (1) aliquot for the leaching procedure. An additional aliquot
should be collected for the purpose of pH measurement for samples that are to be analyzed
for inorganics or ionizing organics.
4. Soil samples should be collected across the range of contaminant concentrations (including
higher, mid-range, and lower concentrations) found throughout the volume of soil within
the source area to increase the likelihood of bracketing the target soil leachate
concentration. Bracketing the target soil leachate concentration is necessary for
determining the acceptable soil concentration, as further discussed in Question 6.
5. Soil samples should be collected from each major soil type and/or soil horizon found in the
source area to assess differences in leaching potential due to soil properties.
6. Sampling Considerations for Inorganics and Semi-volatiles:
a. Samples collected for inorganics or semi-volatiles analysis should be thoroughly
homogenized to ensure that the aliquot used for totals analysis and the aliquot used for
the leachate procedure are representative of the same sample matrix.

FAQs for Evaluating the
Soil-to-Groundwater Migration Pathway October 18, 2019
Page 8
b. At least one duplicate totals aliquot should be collected and analyzed. The totals aliquot
and the duplicate totals aliquot should be taken from the same homogenized soil
sample. For more information regarding quality control sampling, see the most recent
version of the USEPA Region 4 SESD Field Sampling Quality Control Operating
Procedure, which is available at:
https://www.epa.gov/quality/field-sampling-quality-control
7. Sampling Consideration for Volatiles:
a. Soil samples for volatiles analysis should not be homogenized due to the potential for
volatile loss. Since the individual aliquots must be collected and containerized
separately (See SESD soil sampling protocol), care should be taken to collect the
aliquot for totals analysis as close to the aliquot for the leaching procedure as
practicable, so that they are as representative of similar soil conditions as possible.
b. Field chemical preservatives should not be used when collecting the aliquot to be used
for the leaching procedure. These preservatives can cause contaminants to leach from
soil, which can lead to inaccurate laboratory leaching test results. The leaching test
aliquot should be collected in a laboratory-approved container (e.g., En Core®
sampler). Care should be taken to minimize voids and completely fill the container
(zero headspace). For consistency, it is recommended that the aliquots for totals
analysis also be collected using methods that do not require field chemical
preservatives.
c. At least one duplicate totals aliquot should be collected and analyzed. The duplicate
totals aliquot should be collected as close as possible to the location of the totals aliquot
of the original sample. As indicated above, additional information regarding sampling
quality control can be found at:
https://www.epa.gov/quality/field-sampling-quality-control
5.2 Reporting Recommendations
The following should be reported when using SPLP or TCLP tests to evaluate the soil-to-
groundwater migration pathway:
1. A narrative description of sampling and test methods
2. Laboratory analytical data
3. A site map (with scale), showing the location of each soil sample
4. A table, listing the following information for each soil sample:
a. Sample identification;
b. Depth of the soil sample;
c. Soil classification (i.e. silty sand, clay, etc.);
d. Soil pH (only needed for inorganics and ionizing organics);
e. Total contaminant concentration in soil (dry-weight basis) (mg/kg);
f. Leachate concentration (mg/L);

FAQs for Evaluating the
Soil-to-Groundwater Migration Pathway October 18, 2019
Page 9
g. Volume of leachate (L);
h. Dry weight of soil used for leaching test (kg); and
i. Leachate pH.
Note: Consider consulting with the laboratory prior to submitting soil samples for analysis to
ensure that the desired information will be reported.
6. I performed SPLP or TCLP tests to evaluate the soil-to-groundwater migration pathway.
How do I analyze the test results?
The following methodology is recommended for analyzing SPLP or TCLP results to evaluate the
soil-to-groundwater migration pathway. This methodology has been adapted from the New Jersey
Department of Environmental Protection (NJDEP) document, Development of Site-Specific Impact
to Ground Water Soil Remediation Standards Using the Synthetic Precipitation Leaching
Procedure (NJDEP 2013):
1. Delineate the source area: Source area delineation is discussed in Section 3.2.
2. Determine the target soil leachate concentration: Determination of the target soil leachate
concentration is discussed in Section A.1 of the Appendix.
3. Calculate the soil-water partition coefficient, Kd, for each leaching test: The lowest Kd
value can generally be used as a conservative estimate of Kd. The calculation of Kd for a
leaching test, and the methods of determining the final Kd value, are discussed in Section
A.3.3.2 of the Appendix.
4. Estimate the field leachate concentration for each leaching test: The field leachate
concentration can be estimated using the following equation:
b
aw
d
TL H
K
CC
'++
= (Equation 2)
Table 3: Parameters for Equation 2 (continued on next page).
Parameter Definition Units Default
CL field leachate concentration mg/L ---
CT total contaminant concentration in
soil mg/kg ---
Kd soil-water partition coefficient L/kg chemical-specific,
Kd = Koc x foc (organics)
Koc soil organic carbon-water partition
coefficient L/kg chemical-specific
foc fraction organic carbon in soil kg/kg 0.002
θw water-filled soil porosity Lwater/Lsoil 0.3
θa air-filled soil porosity Lair/Lsoil 0.13
b dry soil bulk density kg/L 1.5

FAQs for Evaluating the
Soil-to-Groundwater Migration Pathway October 18, 2019
Page 10
Parameter Definition Units Default
H′ dimensionless Henry's Law
Constant unitless chemical-specific
5. Determine the acceptable soil concentration
Three methods are presented that allow for the determination of the acceptable soil
concentration. Methods 1 and 2 can be used to directly determine the acceptable soil
concentration. Method 3 involves using a site-specific soil-water partition coefficient, Kd,
in a fate and transport model to determine the acceptable soil concentration. Any of these
methods may be used, provided that consideration is given to the individual method
recommendations.
a. Method 1: Determine an Acceptable Soil Concentration by Direct Comparison
This method allows for the determination of an acceptable soil concentration by direct
comparison of field leachate concentrations to the target soil leachate concentration.
This method is described as follows:
i. Prepare a table of total soil concentrations in ascending order with the
corresponding field leachate concentration and the target soil leachate
concentration.
ii. If none of the field leachate concentrations exceed the target soil leachate
concentration, the highest total soil concentration may be used as the acceptable
soil leaching concentration. In these cases, EPD may request additional sampling
to confirm the leaching test results.
iii. If some, but not all, of the field leachate concentrations exceed the target soil
leachate concentration, the highest total soil concentration for which no lower field
leachate concentration exceeds the target soil leachate concentration may be used
as the acceptable soil concentration.
iv. If all of the field leachate concentrations exceed the target soil leachate
concentration, none of the soil concentrations should be used and additional
sampling is recommended.
The use of Method 1 is illustrated in the following example:
Table 4: Example of Method 1 (continued on next page).
sample
identification
total contaminant
concentration in soil
(mg/kg)
field leachate
concentration
(mg/L)
target soil leachate
concentration
(mg/L)
Sample 1 0.5 0.04 0.1
Sample 2 0.8 0.04 0.1
Sample 3 2 0.002 0.1
Sample 4 12 0.03 0.1
Sample 5 30 0.09 0.1
Sample 6 75 0.3 0.1
Sample 7 120 0.2 0.1
Sample 8 150 0.08 0.1

FAQs for Evaluating the
Soil-to-Groundwater Migration Pathway October 18, 2019
Page 11
sample
identification
total contaminant
concentration in soil
(mg/kg)
field leachate
concentration
(mg/L)
target soil leachate
concentration
(mg/L)
Sample 9 180 0.5 0.1
Sample 10 300 2 0.1
In this example, the acceptable soil concentration would be 30 mg/kg because the field
leachate concentrations of this and all lower total soil concentrations are below the
target soil leachate concentration. Note that even though the field leachate
concentration of Sample 8 is below the target soil leachate concentration, the field
leachate concentrations of Samples 6 and 7 (with lower soil concentrations) exceed the
target soil leachate concentration. Therefore, the total soil concentration of Sample 8
should not be used as the acceptable soil concentration.
b. Method 2: Determine an Acceptable Soil Concentration using Linear Regression
This method allows for the determination of an acceptable soil concentration by linear
regression analysis of the leaching test results. This method is described as follows:
i. Determine if the data qualify for this method:
1. At least half of the total soil concentration data points should be at or above the
midpoint of the range of total soil concentration values.
2. The target soil leachate concentration should be within the range of field
leachate concentrations.
ii. Prepare a scatterplot of total contaminant concentration in soil (y-axis) versus field
leachate concentration (x-axis) using a computer program such as Microsoft
Excel®. Apply a linear trend line to the data and display the trend line equation and
the coefficient of determination (R2) value on the graph, which measures how close
the data are fitted to the trend line. If the R2 value is 0.7 or greater, continue to the
next step. If the R2 value is less than 0.7, a different method such as Method 1, is
recommended to determine the acceptable soil concentration.
iii. The acceptable soil concentration may be determined using the following equation:
(Equation 3)
Table 5: Parameters for Equation 3.
Parameter Definition Units
Ct acceptable soil concentration mg/kg
Cw target soil leachate concentration mg/L
b y-intercept of the linear trend line mg/kg
m slope of the linear trend line L/kg
The use of Method 2 is illustrated in the following example:
( ) bCmC wt +=

FAQs for Evaluating the
Soil-to-Groundwater Migration Pathway October 18, 2019
Page 12
Table 6: Example data for Method 2.
sample
identification
total contaminant
concentration in soil
(mg/kg)
field leachate
concentration
(mg/L)
target soil
leachate
concentration
(mg/L)
Sample 1 20 0.01 0.2
Sample 2 40 0.02 0.2
Sample 3 75 0.12 0.2
Sample 4 100 0.06 0.2
Sample 5 120 0.23 0.2
Sample 6 170 0.2 0.2
Sample 7 215 0.45 0.2
Sample 8 185 0.28 0.2
Sample 9 250 0.35 0.2
Sample 10 300 0.5 0.2
Note that half of the total soil concentrations are above the midpoint of the range of
soil concentrations (160 mg/kg) and the target soil leachate concentration is within the
range of field leachate concentrations. These are recommended conditions to proceed
to the next step. The data are placed on a scatterplot, a linear trend line is applied, and
the trend line equation and the R2 value are displayed on the graph:
Figure 2: Example scatterplot for Method 2.
y = 500.81x + 36.32R² = 0.8938
0
50
100
150
200
250
300
350
0 0.1 0.2 0.3 0.4 0.5 0.6
tota
l co
nta
min
ant
con
cen
trat
ion
in s
oil
(mg/
kg)
field leachate concentration (mg/L)

FAQs for Evaluating the
Soil-to-Groundwater Migration Pathway October 18, 2019
Page 13
The R2 value is greater than 0.7, so we can proceed to the next step. Plugging in the
appropriate values to Equation 3 gives:
𝐶𝑡 = 500.81(0.2) + 36.32 = 136.48𝑚𝑔
𝑘𝑔
In this example, the acceptable soil concentration would be 136.48 mg/kg.
c. Method 3: Use a Site-Specific Kd in a Fate and Transport Model
Determination of a site-specific Kd from SPLP or TCLP results is discussed in Section
A.3.3.2 of the Appendix. The use of other leaching tests to determine Kd may be
considered. A site-specific Kd can be used as an input parameter in the Soil-Water
Partition Equation (Equation 1) or in a more advanced fate and transport model.
7. What fate and transport models are acceptable for evaluating the soil-to-groundwater
migration pathway?
Fate and transport models capable of evaluating the soil-to-groundwater migration pathway range
from simple, such as the Soil-Water Partition Equation, to more advanced computer programs.
Advantages of more advanced models include the ability to more accurately model site conditions,
such as contaminant distribution and soil property variability, and the ability to consider more
complex fate and transport processes, such as contaminant attenuation and degradation. EPD
generally accepts models that are accepted or supported by the USEPA or the USGS and using the
most probable representative values for model parameters. Other models may be accepted on a
case-by-case basis. EPD encourages the use of public domain models that have been subject to
extensive peer review. Some examples of public domain vadose zone models include SESOIL,
VLEACH, and VS2DT.
The USEPA Mass Limit Equation accounts for more site-specific factors (e.g., depth of soil
contamination) than the Soil-Water Partition Equation but does not require the use of a more
advanced computer program. The USEPA Mass Limit Equation is presented as Equation 14 of
the USEPA Soil Screening Guidance: User’s Guide (USEPA 1996a). As with the Soil-Water
Partition Equation, results of the Mass Limit Equation can be calculated using the USEPA RSL
Calculator.
When using a fate and transport model to evaluate the soil-to-groundwater migration pathway, at
a minimum, a vadose zone model should be used to show that leachate concentrations reaching
groundwater will not exceed the acceptable groundwater concentration. Vadose zone models may
be used in conjunction with groundwater models to account for contaminant dilution and
attenuation in groundwater. Some cases may require the use of both vadose zone and groundwater
models, such as when the potential for contaminant migration to a particular receptor well is being
assessed.
Conservative parameters should be used in cases where reliable site-specific parameters are not
available. EPD may require calibration of model parameters and field validation of model
projections.

FAQs for Evaluating the
Soil-to-Groundwater Migration Pathway October 18, 2019
Page 14
8. How are measured soil concentrations compared to calculated soil concentrations
protective of the soil-to-groundwater migration pathway to demonstrate compliance?
The typical approach is to compare the maximum measured soil concentration from discrete soil
samples to a calculated value that is protective of the soil-to-groundwater migration pathway (i.e.,
an acceptable soil concentration). If the maximum concentration is less than or equal to the
calculated value, the soil would be considered protective of the soil-to-groundwater migration
pathway.
The USEPA Supplemental Guidance for Developing Soil Screening Levels for Superfund Sites
(USEPA 2002) describes two other methods for comparing measured site soil concentrations to
calculated concentrations that are protective of the soil-to-groundwater migration pathway. These
methods should be discussed with EPD prior to implementation, as they involve additional
considerations such as source area definition and greater focus on Data Quality Objectives:
a. Using the mean concentration in soil borings:
When sufficient discrete soil sample results are available from multiple depths within a
borehole, the mean concentration of each contaminant of concern from the extent of
contamination within the borehole may be compared to calculated values protective of the
soil-to-groundwater migration pathway. It is recommended that USEPA Data Quality
Objectives for subsurface soils, as presented in Section 2.3.3 of the Soil Screening
Guidance: User’s Guide, be reviewed to ensure that sufficient data is available to use this
method. USEPA (1996a) states that “source areas” are the decision units for subsurface
soils, and that a source area is defined by the horizontal and vertical extent of
contamination. Therefore, soil samples used to calculate the mean should be collected
from within the extent of contamination. Contamination delineation criteria may include
background concentrations, practical quantitation limits, residential Risk Reduction
Standards, or other values approved by EPD. Contact the EPD regulatory program
overseeing the site investigation for information on applicable delineation criteria and data
to be used to represent the “source area.” This method should be discussed with EPD prior
to implementation.
b. Using a 95% upper confidence limit (UCL) of the mean:
If sufficient data is available, a 95% UCL of the mean contaminant soil concentration
within the source area may be compared to a calculated value protective of the soil-to-
groundwater migration pathway. As with averaging within soil borings, samples collected
outside the source area should not be included in the calculation of the 95% UCL of the
mean. USEPA (2002) notes that the standard Data Quality Objectives sampling approach
will not yield sufficient data for calculating a 95% UCL of the mean concentration in
subsurface soil. This method should be discussed with EPD prior to implementation.

FAQs for Evaluating the
Soil-to-Groundwater Migration Pathway October 18, 2019
Page 15
9. What additional lines of evidence can be used to support an evaluation of the soil-to-
groundwater migration pathway?
Users of this guidance are generally expected to evaluate the potential for soil leaching based on a
comparison of measured contaminant concentrations in site soils to calculated soil concentrations
protective of the soil-to-groundwater migration pathway developed consistent with USEPA
guidance or an EPD-approved method. However, EPD recognizes that these quantitative methods
may not account for all factors with the potential to influence the soil-to-groundwater migration
pathway at a particular site. In cases where the soil release occurred many years ago and
groundwater has not been impacted by soil leaching to groundwater, EPD may consider the use of
these and other lines of evidence to demonstrate that the existing soil concentrations are protective
of groundwater on a case-by-case basis. These lines of evidence may include, but are not limited
to:
• Contaminant fate and transport characteristics (e.g., mobility)
• Age of the release: The age of the soil release should be on the order of decades old (since
the last active release), such that the effect of any expected leaching to groundwater would
be observable in downgradient groundwater. This is a critical line of evidence for using
this method.
• Groundwater concentration trends: Sufficient groundwater data should demonstrate that
groundwater has not been impacted by leaching. This is a critical line of evidence for using
this method. In some cases, ongoing groundwater monitoring may be appropriate to
confirm that the soil concentrations remain protective of groundwater.
• Magnitude of the release: consideration of the magnitude of soil contaminant
concentrations that exceed calculated soil concentrations protective of the soil-to-
groundwater migration pathway
• Horizontal and vertical extent of the release: consideration of the extent of the soil release,
including the frequency of soil contaminant concentrations that exceed calculated soil
concentrations protective of the soil-to-groundwater migration pathway
• Depth of groundwater: consideration of the depth of groundwater in relation to soil
contamination
• Ground cover: consideration of how past ground cover (e.g., paved surface) may have
influenced past leaching and how current/future soil cover may influence future leaching
• Area groundwater uses: consideration of groundwater uses in the surrounding area

FAQs for Evaluating the
Soil-to-Groundwater Migration Pathway October 18, 2019
Page 16
References
Indiana Department of Environmental Management (IDEM). 2007. Determining the Fraction of
Organic Carbon. OLQ-General ID-0119. September.
https://semspub.epa.gov/work/05/424375.pdf
National Atmospheric Deposition Program (NADP). 2019. National Trends Network, Animated
pH Maps. Accessed August 1, 2019. http://nadp.slh.wisc.edu/maplib/ani/pH_ani.pdf
NJDEP. 2013. Development of Site-Specific Impact to Ground Water Soil Remediation
Standards Using the Synthetic Precipitation Leaching Procedure. Version 3.0. November.
http://www.nj.gov/dep/srp/guidance/rs/splp_guidance.pdf
Ohio EPA. 2008a. Voluntary Action Program Derived Leach-Based Soil Values. Technical
Guidance Document. Revision 3. October.
http://www.epa.state.oh.us/portals/30/vap/docs/sec-g-att.pdf
Ohio EPA. 2008b. Voluntary Action Program Derived Leach-Based Soil Values. Appendix
Technical Support Document. October. Revision 3.
http://www.epa.state.oh.us/portals/30/vap/docs/sec-g-attapp.pdf
Texas Natural Resource Conservation Commission (TNRCC). 1998. When to use Toxicity
Characteristic Leaching Procedure (TCLP) Test or Synthetic Precipitation Leaching Procedure
(SPLP) Test to demonstrate the leaching potential of contaminants. Interoffice Memorandum.
October. https://www.tceq.texas.gov/assets/public/remediation/trrp/tclpsplp.pdf
USEPA. 1987. DRASTIC: A Standardized System for Evaluating Groundwater Pollution
Potential Using Hydrogeologic Settings. USEPA Publication 600287035.
http://nepis.epa.gov/Simple.html
USEPA. 1996a. Soil Screening Guidance: User’s Guide. USEPA Publication 9355.4-23. July.
https://www.epa.gov/superfund/superfund-soil-screening-guidance
USEPA. 1996b. Soil Screening Guidance: Technical Background Document. USEPA
Publication EPA/540/R95/128. May.
https://www.epa.gov/superfund/superfund-soil-screening-guidance
USEPA. 2002. Supplemental Guidance for Developing Soil Screening Levels at Superfund Sites.
OSWER 9355.4-24. December.
https://www.epa.gov/superfund/superfund-soil-screening-guidance
USEPA. Field Sampling Quality Control Operating Procedure. Region 4 Science and Ecosystem
Support Division. As Amended.
https://www.epa.gov/quality/field-sampling-quality-control
FAQs for Evaluating the
Soil-to-Groundwater Migration Pathway October 18, 2019
Page 17
USEPA. Soil Sampling Operating Procedure. Region 4 Science and Ecosystem Support
Division. As Amended.
https://www.epa.gov/quality/soil-sampling
USEPA. Regional Screening Levels for Chemical Contaminants at Superfund Sites. Generic
Tables. As Amended. https://www.epa.gov/risk/regional-screening-levels-rsls-generic-tables
USEPA. Regional Screening Levels for Chemical Contaminants at Superfund Sites. User’s
Guide. As Amended. https://www.epa.gov/risk/regional-screening-levels-rsls-users-guide
Washington Administrative Code (WAC). 2018. Deriving soil concentrations for groundwater
protection. Section 173-340-747. http://apps.leg.wa.gov/wac/default.aspx?cite=173-340-747

FAQs for Evaluating the
Soil-to-Groundwater Migration Pathway October 18, 2019
Page 18
Appendix
A.1 Determining the Target Soil Leachate Concentration
There are two cases to consider when determining the target soil leachate concentration:
1. The contaminant is not present in groundwater upgradient of the source area, and
2. The contaminant is present in groundwater upgradient of the source area.
In both cases, the target soil leachate concentration should not exceed the water solubility of the
contaminant.
A.1.1 Case 1: The Contaminant is Not Present in Upgradient Groundwater
If groundwater upgradient of the source area has not been impacted by the contaminant, the target
soil leachate concentration is calculated by multiplying the acceptable groundwater concentration
by the dilution attenuation factor (“DAF”) (USEPA 1996a):
(Equation 4)
Table 7: Parameters for Equation 4.
Parameter Definition Units
Cw target soil leachate concentration mg/L
Cf acceptable groundwater concentration mg/L
DAF dilution attenuation factor unitless
A.1.1.1 Determining DAF Values
The DAF is defined as “the ratio of contaminant concentration in soil leachate to the concentration
in groundwater at the receptor point” (USEPA 1996b). The DAF quantifies the reduction in the
contaminant concentration from soil leachate to the receptor point due to physical, chemical, and
biological processes (USEPA 1996a). DAF values may be determined using either default values
or by calculating a site-specific value.
A.1.1.1.1 Default DAF Values
A default DAF of 20 may be used in most cases when the source area is 0.5 acre or less and
upgradient groundwater has not been impacted. However, EPD may not approve the use of a
default DAF of 20 if site conditions indicate that it is not appropriate. Conditions where a default
DAF of 20 may not be appropriate include fractured bedrock and karst aquifers (USEPA 1996b).
For soil source areas greater than 0.5 acre, a default DAF of 1 may be used, or a site-specific DAF
may be calculated.
DAFCC fw =
FAQs for Evaluating the
Soil-to-Groundwater Migration Pathway October 18, 2019
Page 19
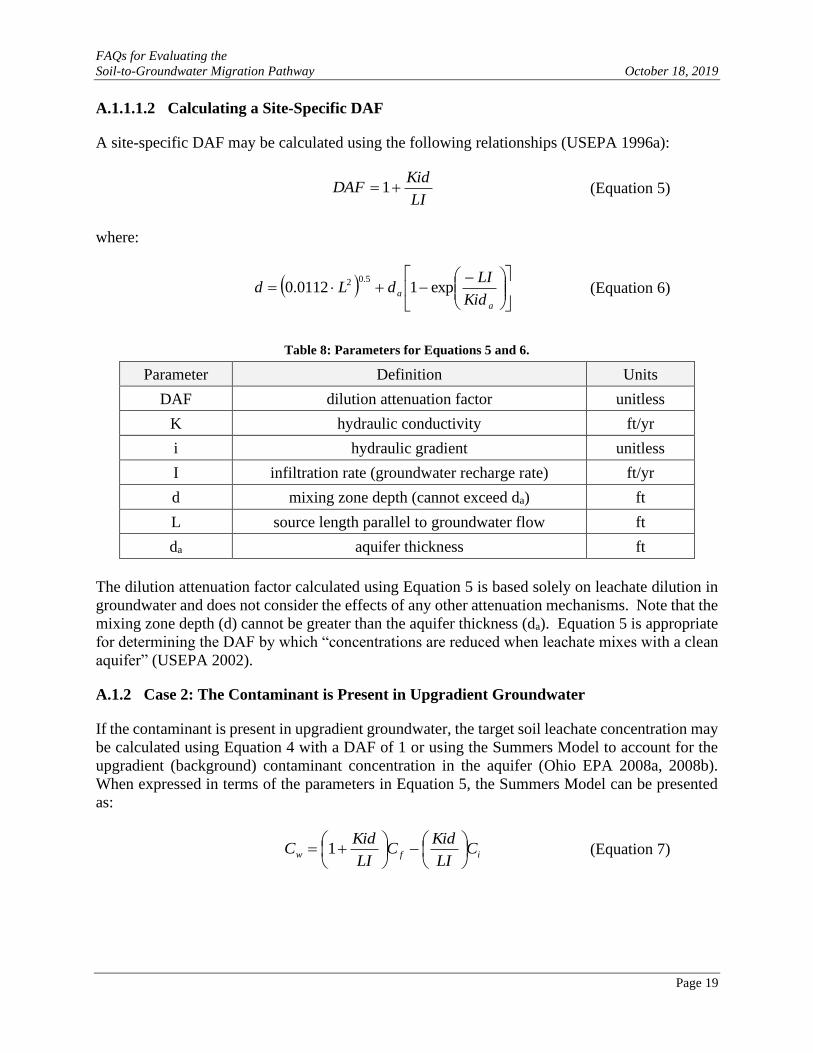
A.1.1.1.2 Calculating a Site-Specific DAF
A site-specific DAF may be calculated using the following relationships (USEPA 1996a):
(Equation 5)
where:
(Equation 6)
Table 8: Parameters for Equations 5 and 6.
Parameter Definition Units
DAF dilution attenuation factor unitless
K hydraulic conductivity ft/yr
i hydraulic gradient unitless
I infiltration rate (groundwater recharge rate) ft/yr
d mixing zone depth (cannot exceed da) ft
L source length parallel to groundwater flow ft
da aquifer thickness ft
The dilution attenuation factor calculated using Equation 5 is based solely on leachate dilution in
groundwater and does not consider the effects of any other attenuation mechanisms. Note that the
mixing zone depth (d) cannot be greater than the aquifer thickness (da). Equation 5 is appropriate
for determining the DAF by which “concentrations are reduced when leachate mixes with a clean
aquifer” (USEPA 2002).
A.1.2 Case 2: The Contaminant is Present in Upgradient Groundwater
If the contaminant is present in upgradient groundwater, the target soil leachate concentration may
be calculated using Equation 4 with a DAF of 1 or using the Summers Model to account for the
upgradient (background) contaminant concentration in the aquifer (Ohio EPA 2008a, 2008b).
When expressed in terms of the parameters in Equation 5, the Summers Model can be presented
as:
(Equation 7)
LI
KidDAF += 1
( )
−−+=
a
aKid
LIdLd exp10112.0
5.02
ifw CLI
KidC
LI
KidC
−
+= 1

FAQs for Evaluating the
Soil-to-Groundwater Migration Pathway October 18, 2019
Page 20
Table 9: Parameters for Equation 7.
Parameter Definition Units
Cw target soil leachate concentration mg/L
Cf acceptable groundwater concentration mg/L
Ci upgradient groundwater concentration mg/L
K hydraulic conductivity ft/yr
i hydraulic gradient unitless
I infiltration rate (groundwater recharge rate) ft/yr
d mixing zone depth (see Equation 6) ft
L source length parallel to groundwater flow ft
Note that when the upgradient groundwater concentration is zero, Equation 7 is equivalent to
Equation 5.
A.2 Determining Groundwater Recharge Rates
Groundwater recharge rates may be estimated according to hydrogeologic setting using values
from the USEPA publication, DRASTIC: A Standardized System for Evaluating Groundwater
Pollution Potential Using Hydrogeologic Settings (USEPA 1987). When a range of groundwater
recharge rates is presented for a hydrogeologic setting, the maximum rate should be used to
calculate a site-specific DAF. Note that the DRASTIC publication presents groundwater recharge
rates in units of inches per year, which requires conversion to units of feet per year for use in
Equations 5 - 7. Other methods to determine the groundwater recharge rate may also be
considered.
A.3 Determining the Soil-Water Partition Coefficient, Kd
A.3.1 Determining Kd for Organics Using Literature Values
For organics only, Kd may be determined using the following relationship (USEPA 1996b):
(Equation 8)
Table 10: Parameters for Equation 8.
Parameter Definition Units Default
Kd soil - water partition coefficient L/kg chemical-
specific
Koc soil organic carbon - water partition
coefficient L/kg
chemical-
specific
foc fraction organic carbon in soil kg/kg 0.002
ococd fKK =

FAQs for Evaluating the
Soil-to-Groundwater Migration Pathway October 18, 2019
Page 21
Literature values of Koc may be used in Equation 8 along with the default foc value of 0.002 to
determine a literature-based value for Kd. It is recommended that literature values of Koc be taken
from the most recent version of the USEPA Regional Screening Levels for Chemical Contaminants
at Superfund Sites, Chemical Specific Parameters Table, as the values provided therein are readily
accessible and are updated regularly. The referenced table is available at:
https://www.epa.gov/risk/regional-screening-levels-rsls-generic-tables
Koc values from other sources may be considered if sufficient justification can be provided for their
use.
It should be noted that Koc values have been shown to vary as a function of pH for a class of
organics known as ionizing organics. Ionizing organics include benzoic acid, 2-chlorophenol, 2,3-
dichlorophenoxyacetic acid, 2,4-dichlorophenol, 2,4-dinitrophenol, pentachlorophenol, 2,3,4,5-
tetrachlorophenol, 2,4,6-tetrachlorophenol, 2,4,5-trichlorophenol, and 2,4,6-trichlorophenol.
Values of Koc as a function of pH for ionizing organics are presented in Exhibit C-2 of the
Supplemental Guidance for Developing Soil Screening Levels at Superfund Sites (USEPA 2002),
which is available at:
https://semspub.epa.gov/work/HQ/174067.pdf
A.3.2 Determining Kd for Inorganics Using Literature Values
Literature values of Kd for selected inorganics are listed in the “Soil to Groundwater” section of
the USEPA Regional Screening Levels User’s Guide, which is available at:
https://www.epa.gov/risk/regional-screening-levels-rsls-users-guide
These values should be used as defaults when relevant site-specific information (pH, SPLP data,
etc.) is not available.
Literature values of Kd as a function of pH for selected inorganics are listed in Exhibit C-4 of the
Supplemental Guidance for Developing Soil Screening Levels at Superfund Sites (USEPA 2002):
https://semspub.epa.gov/work/HQ/174067.pdf
The Kd value for inorganics can be affected by a variety of factors, including “pH, oxidation-
reduction conditions, iron oxide content, soil organic matter content, cation exchange capacity,
and major ion chemistry” (USEPA 1996b). Therefore, it is recommended that laboratory leaching
tests be used when possible to evaluate the soil-to-groundwater migration pathway for inorganics,
as described in Question 6, particularly when the subsurface pH has been altered by the properties
of the chemical released (e.g., reduced pH caused by the release of an acid).

FAQs for Evaluating the
Soil-to-Groundwater Migration Pathway October 18, 2019
Page 22
A.3.3 Determining a Site-Specific Kd
A.3.3.1 Determining a Site-Specific Kd for Organics Based on the Fraction Organic Carbon
in Soil, foc
For organics, a site-specific Kd may be determined by multiplying a literature-based Koc and a site-
specific value for foc in Equation 8. Determination of a site-specific foc value is discussed in
Section A.4 of the Appendix. A site-specific Kd value for organics may also be determined using
a laboratory leaching test, as discussed in the following section (Section A.3.3.2).
A.3.3.2 Determining a Site-Specific Kd Using a Laboratory Leaching Test
A site-specific Kd for both organics and inorganics can be determined using a laboratory leaching
test. For a description of laboratory leaching tests, sampling and reporting recommendations, and
recommended data reduction, see Questions 4, 5, and 6.
This method allows for the determination of a site-specific soil-water partition coefficient, Kd,
using leaching test results. The soil-water partition coefficient can be used in a fate and transport
model such as the Soil-Water Partition Equation to determine an acceptable soil concentration.
When linear partitioning is assumed, Kd is defined as (NJDEP 2013):
(Equation 9)
Table 11: Parameters for Equation 9.
Parameter Definition Units
Kd soil - water partition coefficient L/kg
CS equilibrium contaminant concentration sorbed to soil mg/kg
CL equilibrium contaminant concentration in leachate mg/L
Using the results of a leaching test, a sample-specific Kd can be calculated using the following
relationship (NJDEP 2013):
SPLPS
LSPLPSTd
CM
VCMCK
−= (Equation 10)
Table 12: Parameters for Equation 10.
Parameter Definition Units
Kd soil - water partition coefficient L/kg
CSPLP SPLP or TCLP leachate concentration mg/L
VL volume of leachate L
CT total contaminant soil concentration (prior to leaching
test) mg/kg
MS dry weight of soil used for leaching test kg
L
Sd
C
CK =

FAQs for Evaluating the
Soil-to-Groundwater Migration Pathway October 18, 2019
Page 23
The lowest calculated Kd value can generally be used as a conservative estimate of Kd for the
source area. If statistical methods are considered to determine a representative Kd, it is
recommended that consideration be given to the population distribution, the variance of the
observed values, and the limitations of using small numbers of observations to conduct statistical
analysis.
A.4 Determining the Fraction Organic Carbon in Soil, foc
The default value for foc is 0.002 kg/kg, or 0.2%. However, a site-specific foc may also be
determined by measuring site-specific soil organic carbon. Sample collection, analytical methods,
and reporting recommendations for soil organic carbon measurement are discussed in the
following sections.
A.4.1 Sample Collection Recommendations
1. A minimum of ten (10) discrete soil samples should be collected. The total number of
samples needed and the horizontal and vertical distribution of sample locations are
dependent on the heterogeneity of the subsurface and should be evaluated on a site-specific
basis.
2. When possible, samples should be collected at least two (2) feet below the ground surface
(i.e., below the root zone) in uncontaminated soil that is representative of soil through
which contaminants are likely to migrate (WAC 2018). Totals analysis, using the
appropriate analytical method, for organic constituents of concern should be used to show
that the soil used for organic carbon measurement has not been impacted by organic
contaminants. Soil samples collected from surficial soils (where the greatest amount of
organic carbon is typically located) or from soil impacted with organic contaminants may
result in an overestimation of the ability of subsurface soil to adsorb contaminants.
A.4.2 Analytical Methods
The Modified Walkley-Black Method (dichromate oxidation) is the recommended method for
measuring total organic carbon (TOC) in soil. Other methods may be considered on a site-specific
basis. Note that ASTM D2974 provides a measurement of soil organic matter as opposed to soil
organic carbon. For more information, see the Indiana Department of Environmental Management
(IDEM) guidance document, Determining the Fraction of Organic Carbon (IDEM 2007).
A.4.3 Reporting Recommendations
1. A site map (with scale), showing the location of each soil sample
2. Laboratory analytical data
3. A narrative describing the sampling methods used
4. A table, listing the following information for each sample:
a. Sample identification;
b. Depth of the soil sample;

FAQs for Evaluating the
Soil-to-Groundwater Migration Pathway October 18, 2019
Page 24
c. Total soil contaminant concentration (mg/kg);
d. Soil classification (i.e. silty sand, clay, etc.); and
e. Total organic carbon in soil (dry weight basis) (mg/kg).
When soil TOC is reported in units of mg/kg, the fraction of organic carbon (kg/kg) is calculated
using the following conversion:
(Equation 11)
Table 13: Parameters for Equation 11.
Parameter Definition Units
foc fraction organic carbon in soil kg/kg
TOC total organic carbon in soil mg/kg
The lowest calculated foc value can generally be used as a conservative estimate of foc for the source
area. However, if a sufficient number of samples have been collected, then the average foc value
(e.g., 95% UCL of the mean) could also be used. If statistical methods are considered to determine
a representative foc, it is recommended that consideration be given to the population distribution,
the variance of the observed values, and the limitations of using small numbers of observations to
conduct statistical analysis.
610
TOCfoc =