FAO/GIEWS Food Availability and Market Assessment Mission ... · FAO/GIEWS FOOD AVAILABILITY AND...
32
S P E C I A L R E P O R T FAO/GIEWS FOOD AVAILABILITY AND MARKET ASSESSMENT MISSION TO HAITI 23 May 2016
Transcript of FAO/GIEWS Food Availability and Market Assessment Mission ... · FAO/GIEWS FOOD AVAILABILITY AND...

S P E C I A L R E P O R T
FAO/GIEWS FOOD AVAILABILITY AND MARKET ASSESSMENT MISSION TO HAITI
23 May 2016

This report has been prepared by Felix Baquedano (FAO) under the responsibility of the FAO Secretariat with information from official and other sources. Since conditions may change rapidly, please contact the undersigned for further information if required: Paul Racionzer Economist/Team Leader, EST/GIEWS Trade and Markets Division, FAO
E-mail: [email protected]
Please note that this Special Report is also available on the Internet as part of the FAO World Wide Web
www.fao.org at the following URL address: http://www.fao.org/giews/ and http://www.wfp.org/food-security/reports/CFSAM. The Special Alerts/Reports can also be received automatically by E-mail as soon as they are published, by subscribing to the GIEWS/Alerts report ListServ. To do so, please send an E-mail to the FAO-Mail-Server at the
following address: [email protected], leaving the subject blank, with the following message:
subscribe GIEWSAlertsWorld-L
To be deleted from the list, send the message:
unsubscribe GIEWSAlertsWorld-L Please note that it is possible to subscribe to regional lists to only receive Special Reports/Alerts by region: Africa, Asia, Europe or Latin America (GIEWSAlertsAfrica-L, GIEWSAlertsAsia-L, GIEWSAlertsEurope-L and GIEWSAlertsLA-L). These lists can be subscribed to in the same way as the worldwide list. Acknowledgements The author would like to thank the authorities of the Ministry of Agriculture, Natural Resources and Rural Development of Haiti and in particular the Sub-structure for Agricultural Statistics and Informatics as well as the National Coordination of Food Security for their assistance and collaboration in the drafting of this report. The author would also like to acknowledge the contributions made by the WFP and FEWSNET to the Mission and report.

S P E C I A L R E P O R T
FAO/GIEWS FOOD AVAILABILITY AND MARKET ASSESSMENT MISSION TO HAITI
23 May 2016
FOOD AND AGRICULTURE ORGANIZATION OF THE UNITED NATIONS Rome, 2016

The designations employed and the presentation of material in this information product do not imply the expression of any opinion whatsoever on the part of the Food and Agriculture Organization of the United Nations (FAO) concerning the legal or development status of any country, territory, city or area or of its authorities, or concerning the delimitation of its frontiers or boundaries. The mention of specific companies or products of manufacturers, whether or not these have been patented, does not imply that these have been endorsed or recommended by FAO in preference to others of a similar nature that are not mentioned. The views expressed in this information product are those of the author(s) and do not necessarily reflect the views or policies of FAO. © FAO, 2016 FAO encourages the use, reproduction and dissemination of material in this information product. Except where otherwise indicated, material may be copied, downloaded and printed for private study, research and teaching purposes, or for use in non-commercial products or services, provided that appropriate acknowledgement of FAO as the source and copyright holder is given and that FAO’s endorsement of users’ views, products or services is not implied in any way. All requests for translation and adaptation rights, and for resale and other commercial use rights should be made via www.fao.org/contact-us/licence-request or addressed to [email protected]. FAO information products are available on the FAO website (www.fao.org/publications) and can be purchased through [email protected]. Cover page photographs by: Felix Baquedano.

- 5 -
Table of contents
Page
Acronyms .................................................................................................................................. 6 Highlights .................................................................................................................................. 7 1. OVERVIEW ..................................................................................................................... 7 2. BACKGROUND .............................................................................................................. 8 3. SOCIO-ECONOMIC ENVIRONMENT ............................................................................. 8 4. AGRICULTURAL PRODUCTION ................................................................................. 13 5. FOOD AVAILABILITY ................................................................................................... 20 6. MARKET CONDITIONS AND PRICES ......................................................................... 22 7. EL NIÑO PHENOMENON AND EARLY OUTLOOK FOR MAIN 2016 SPRING CROP SEASON ..................................................................................... 27 8. CONCLUSIONS AND RECOMMENDATIONS .............................................................. 29 9. REFERENCES .............................................................................................................. 30 ANNEX CNSA Maize Equivalent Tonnes (MET) Conversion Factors ............................. 31

- 6 -
Acronyms
CCBS Country Commodity Balance Sheet CIA Central Intelligence Agency CNSA National Coordination of Food Security of the Ministry of Agriculture, Natural Resources
and Rural Development DOP Dominican Peso EFSA Emergency and Food Security Assessment of the WFP ENEPA National Survey of Agricultural Production Estimates ENSO El Niño Southern Oscillation FAI Food and Agricultural Imports FAO Food and Agriculture Organization of the United Nations FEWSNET Famine Early Warning Systems Network GDP Gross Domestic Product GIEWS Global Information and Early Warning System on Food and Agriculture HTG Gourde IADB Inter-American Development Bank IMF International Monetary Fund IRI International Research Institute for Climate and Society of Columbia University MARNDR Ministry of Agriculture, Natural Resources and Rural Development MEF Ministry of Economy and Finance NDVI Normalized Difference Vegetation Index OANDA Canadian-based foreign exchange company OCHA Office for the Coordination of Humanitarian Affairs of the United Nations SECM Single Equation Error Correction Model SSSAI Sub-structure for Agricultural Statistics and Informatics of the Ministry of Agriculture,
Natural Resources and Rural Development TCI Temperature Condition Index UAL Usable Agricultural Land UN United Nations UNDP United Nations Development Programme USD United States Dollar USDA United States Department of Agriculture VHI Vegetation Health Index VCI Vegetation Condition Index WFP World Food Programme

- 7 -
Highlights
Cereals and starchy roots production in 2015 dropped to its lowest level in 12 years, after two consecutive years of drought.
Food availability in 2015/16 is being sustained by imports and a drawdown of stocks.
Prices at the beginning of 2016 were at near record levels for maize and at record levels for black beans.
To increase food availability and reduce the high level of food prices in the near to medium term, assistance to the agricultural sector should be broad and not limited to the most affected areas of the country.
1. OVERVIEW FAO fielded a Food Availability and Market Assessment Mission to Haiti between 14 February and 2 March 2016 to evaluate the state of food availability and the stability of markets at the national level. The Mission was composed of FAO, the National Coordination for Food Security of Haiti (CNSA) and the Sub-structure for Agricultural Statistics and Informatics (SSSAI), both agencies of the Ministry of Agriculture, Natural Resources and Rural Development of Haiti (MARNDR). The World Food Programme (WFP) and the Famine Early Warning Systems Network (FEWSNET) also collaborated closely with the Mission. The main spring agricultural season (April/August), accounting for between 50 and 60 percent of the national cereal output, was affected in 2015 by severe and prolonged dry weather, related to the 2015/16 El Niño episode, for a second consecutive year. As a result 2015 outputs of cereals, pulses and starchy roots have been estimated to have declined by 28, 18 and 16 percent, respectively, from the previous year’s already drought-reduced level. Recent assessments have estimated the number of severely food insecure people due to the drought at 1.5 million. With domestic production of food crops sharply down in 2015, food availability is being sustained by higher levels of imports, particularly rice and wheat, and a significant draw down of food reserves. The weak macro-economic environment, including a strong depreciation of the Haitian gourde, high rates of inflation and higher-than-anticipated budget deficits could make it more difficult to sustain current levels of imports in 2016. Food prices remain high and at near-record levels for important staples such as maize meal and beans. However, low international prices for rice have limited significant increases in local prices for this commodity, somewhat offsetting the impact of the strong depreciation of the gourde. The high prices have adversely affected food access by households most affected by the drought, with food purchases representing close to two-thirds of household expenditure. To cope with high prices, local populations are substituting these commodities with starchy roots and tubers, reducing purchases and/or increasing purchases on credit. The impact the persisting El Niño episode could have on the next main spring agriculture season is uncertain. Although the latest consensus forecast predicts a 76 percent probability that the El Niño Southern Oscillation (ENSO) will reach neutral conditions during the May-July period, with the bulk of the 2016 spring season planting occurring between late March and early June, it is likely that precipitation levels for the season may again be affected by ENSO. However, according to data obtained from remote sensing in the first 80 days of 2016, vegetative development was significantly improved compared to the same period in 2015, despite erratic and below-average rainfall levels predominating. Sustaining the purchasing power of households at average historical levels and support to agricultural activities are two strategies to consider to mitigate the effects of the drought and to allow for the resumption of normal agricultural activities. Rural households that have been decapitalized after two consecutive years of drought, have to consider using their limited resources to either buy food or agricultural inputs. Sustaining households’ purchasing power, therefore, would facilitate the normal resumption of agricultural activities by providing the necessary resources to purchase both food and seeds.

- 8 -
To increase food availability and reduce the high level of food prices in the near to medium term, assistance to the agricultural sector should not be limited to the most affected areas of the country. The areas that were most affected by the drought conditions in 2014 and 2015, tend to also have the lowest level of agricultural productivity. In the most affected areas, assistance to increase the resilience of agricultural activities to drought and other climate-related events should be followed, while in the more productive areas, assistance should focus on strengthening or rebuilding agricultural productive capacity. 2. BACKGROUND To ascertain a more comprehensive understanding of the food access situation, following the drought-reduced 2015 harvest, FAO fielded a Mission to the country between 14 February and 2 March 2016 to assess the state of food availability and the stability of markets at the national level. The Mission was composed of FAO, CNSA and SSSAI, both agencies of MARNDR. WFP and Famine Early Warning Systems Network also collaborated closely with the Mission. The Mission reviewed existing information, in particular the results of the National Survey for Estimation of Agricultural Production (ENEPA), produced since 2014 by SSSAI/MARNDR, with assistance from the National Agricultural Statistic Service of the United States Department of Agriculture (USDA), and price data collected by CNSA. Furthermore, the Mission filled important information gaps by visiting several locations around the country that had not been included in any recent assessments. 3. SOCIO-ECONOMIC ENVIRONMENT A growing urban population, high rural poverty and significant income inequality Haiti is located between the Caribbean Sea and the North Atlantic Ocean and comprises one-third of the land mass of the Island of Hispaniola, which it shares with the Dominican Republic along a border that is 376 km long. Administratively, Haiti is divided into ten departments, 41 arrondissements and 133 communes (Figure 1).
Figure 1: Haiti - Administrative divisions
Source: Ministry of Agriculture of Haiti.
Latest available UN population estimates show that in 2015 approximately 10.7 million people inhabited the country (Table 1). Over 60 percent of the population is concentrated in three departments: Ouest, Artibonite and Nord (Table 1). The Capital, Port au Prince, located in the Ouest Department, is the most populous city of the country. The country’s population is young, with almost 55 percent under the age of 24 and is also becoming increasingly urban, with the urban population representing 57 percent of the total 2014 (CIA World Factbook, 2016 and World Bank, 2016). This represents a growth of 47 percent in the share of the urban population from 2000. In terms of the distribution of the land surface, the Ouest and Artibonite departments represent 36 percent of the total area of Haiti, and also account for the largest share of agricultural land.

- 9 -
Table 1: Haiti - Distribution of population and land mass by Department
Department Population (‘000) Area (km2)
Ouest 3 956 4 827
Artibonite 1 696 4 984
Nord 1 048 2 106
Sud 761 2 794
Centre 733 3 675
Nord-Ouest 715 2 176
Sud-Est 621 2 023
Grande-Anse 460 1 912
Nord-Est 387 1 805
Nippes 336 1 267
Total 10 711 27 569 Source: FAO, using UNDP data.
Poverty has decreased in the 2000s, with the poverty headcount ratio as a percent of the total population declining from 77 percent in 2001 to 58.5 percent in 2012. However, in rural areas, the poverty rate decreased much less, from 88 percent in 2001 to 74.9 percent in 2012. Despite the progress made in reducing poverty, incomes remain low and highly skewed. Close to 71 percent of the population lives on USD 3.10 per day (World Bank, 2016). Moreover, the richest decile of the population captured 48 percent of the total national income in 2012. By contrast, the poorest decile had 0.55 percent of the national income in 2012, a decline of 14 percent from 2001 (World Bank, 2016). Despite recent economic growth, a weak macroeconomic environment threatens further progress According to the Ministry of Economy and Finance, Haiti faces three main economic challenges in 2016: i) continued instability from an unfinished electoral process and the economic losses due to the drought; ii) a continued weakening of the local currency against the USD; iii) the reduction in funds raised through the Petrocaribe Agreement with Venezuela due to the low international
prices of oil (MEF, 2016). Under the Petrocaribe Agreement, the country can keep half of the proceeds from the sales of oil in the domestic market as a loan to be paid in 25 years at a rate of 2 percent to finance its regular budget and, in particular, capital investments.
Real GDP growth in the last five years has averaged 3.4 percent, mostly reflecting strong infrastructure investments after the earthquake and capital investments financed through the Petrocaribe Agreement (MEF, 2016). However, in fiscal years 2014 and 2015, real GDP growth decreased to 2.7 percent and 1.7 percent, respectively, as a result of the weak performance of the agricultural sector (Table 2). Agricultural GDP growth declined sharply in 2014 and then again in 2015 from its strong growth in 2013. The growth of the construction sector has also declined sharply, shrinking from almost 8 percent in 2014 to 2 percent in 2015. However, manufacturing, and of apparel in particular, more than doubled its growth rate from 2.2 percent in 2013 and 2014, to 5 percent in 2015. Similar to construction, this sector tends to employ a significant proportion of low-skilled labour.

- 10 -
Table 2: Haiti - Real GDP growth by sector and by fiscal year (October/September)
2013 2014 2015
(estimate) (percent)
Real GDP growth 4.3 2.7 1.7
Agriculture 4.5 -1.5 -3.5
Industry 5.9 5.3 3.4
Manufacturing 2.2 2.2 5.0
Construction 9.3 7.9 2.3
Services 3.7 3.6 3.5 Source: Ministry of Economy and Finance of Haiti, Institute of Statistics and Informatics of Haiti, IMF and the World Bank.
According to revised forecasts from MEF, the outlook for the country’s fiscal situation in 2016 is worse than earlier expected, due to the drought, higher expenses on goods and services because of increased price inflation and a depreciating currency (Table 3). Even though domestic revenues in 2015 increased, in nominal terms, and are still projected to grow in 2016, this growth is less than earlier anticipated. Including grants, it is anticipated that the fiscal deficit will shrink by some 3 percent, but if the forecast grants do not to materialize, this deficit will increase by 5 percent. This highlights the importance of maintaining grant levels, which as of now are also projected at lower levels than originally anticipated for 2016 although still higher than in 2015. One element of expenditures expected to decline significantly, by 86 percent in 2016, is that related to capital expenditures financed by the Petrocaribe Agreement (Table 3). This decline mainly reflects falling oil prices, which determine the level of financing the country receives from the Petrocaribe Agreement. The overall fiscal balance is anticipated to remain relatively unchanged in 2016 from 2015, at -3.6 percent of the GDP. Table 3: Haiti - Fiscal accounts (HTG million)
2014
(actual) 2015
(actual) 2016
(forecast)
2016 (revised forecast)
Total revenues 74 191 81 516 103 151 90 662
Domestic revenues 49 061 58 846 77 205 65 332
Grants 25 130 22 670 25 946 25 330
Total expenditures 98 764 98 577 116 029 107 210
Current expenditures 48 914 57 102 58 332 63 333
Salaries and wages 22 625 27 632 32 571 31 500
Goods and services 13 175 14 922 16 624 16 563
Interest payments 1 861 1 291 2 293 3 338
Subsidies and transfers 11 253 13 257 6 844 11 931
Capital expenditures 49 850 41 475 57 697 44 120
o/w Treasury 10 467 6 220 15 687 10 090
o/w Petrocaribe Agreement 14 596 12 301 6 648 5 200
o/w Project grants 20 928 20 247 36 067 25 330
Overall balance -24 573 -17 061 -12 878 -16 548
(excluding grants) -49 703 -39 731 -38 824 -41 878
Nominal GDP (Gourdes) 391 635 431 064 491 509 464 320
Overall fiscal balance, % of GDP -6.3 -4.0 -2.6 -3.6 Source: Ministry of Economy and Finance of Haiti, Bank of the Republic of Haiti, IMF and World Bank staff calculations.

- 11 -
The rapid depreciation of the gourde (HTG) against the US dollar (USD) and the Dominican Peso (DOP), both important currencies for the country’s food imports, and the high rates of inflation have strained the situation further. The HTG began to rapidly depreciate in July 2015 against the currencies of the main food trading partners and has continued to do so through 2016. The USD began to appreciate in 2015 as a result of increased economic growth and an increase in the benchmark interest rate used by the Federal Reserve of the United States of America in December 2015, triggering almost immediate responses of the HTG and DOP values against the USD. In 2014, the HTG depreciated by 7 and 4 percent against the USD and the DOP, respectively (Figure 2). In 2015, the rate of depreciation accelerated to 19.7 percent against the USD and 17.5 percent against the DOP. From January to the first week of March 2016, the HTG depreciated further by 6 percent against the USD and the DOP.
Figure 2: Haiti – End-of-period deprecation of the Gourde to the US Dollar and the Dominican Peso
Source: FAO calculations from weekly inter-bank exchange rates. 1/ End of period is defined as the change in the exchange rate between the month of January to December of the corresponding year, with the exception of 2016 which reflects the change in the corresponding exchange rate from January to the first week of March.
The impact of the devaluation of the HTG is apparent in the difference between the value of Food and Agricultural Imports (FAI) denominated in USD terms and in local currency terms. FAIs declined by 1.4 percent in 2014 and by almost 13 percent in 2015 (Table 4). The value in USD terms of non-US FAIs declined the most in 2015, some 18 percent. By contrast import values in USD terms of FAIs from the United States of America declined moderately. Latin America and the Caribbean was the region from which the largest decline in the value of FAIs in USD terms was recorded, declining by 29 percent in 2015. However, in HTG terms the total value of FAIs has increased, although moderately, over the last two years. This could be due to the low export quotations of imported rice, mainly from the United States of America. Rice imports represent the most important food commodity, capturing almost one-quarter of the total value of FAIs and more than 90 percent is sourced from the United States of America (Table 4). Rice imports from the United States of America in 2015 represented close to 56 percent of FAIs of Haiti.
4.4
17.5
5.97.4
19.7
5.9
0
2
4
6
8
10
12
14
16
18
20
2014 2015
Per
cen
t
Dominican Peso US Dollar
2016 1/
- 12 -
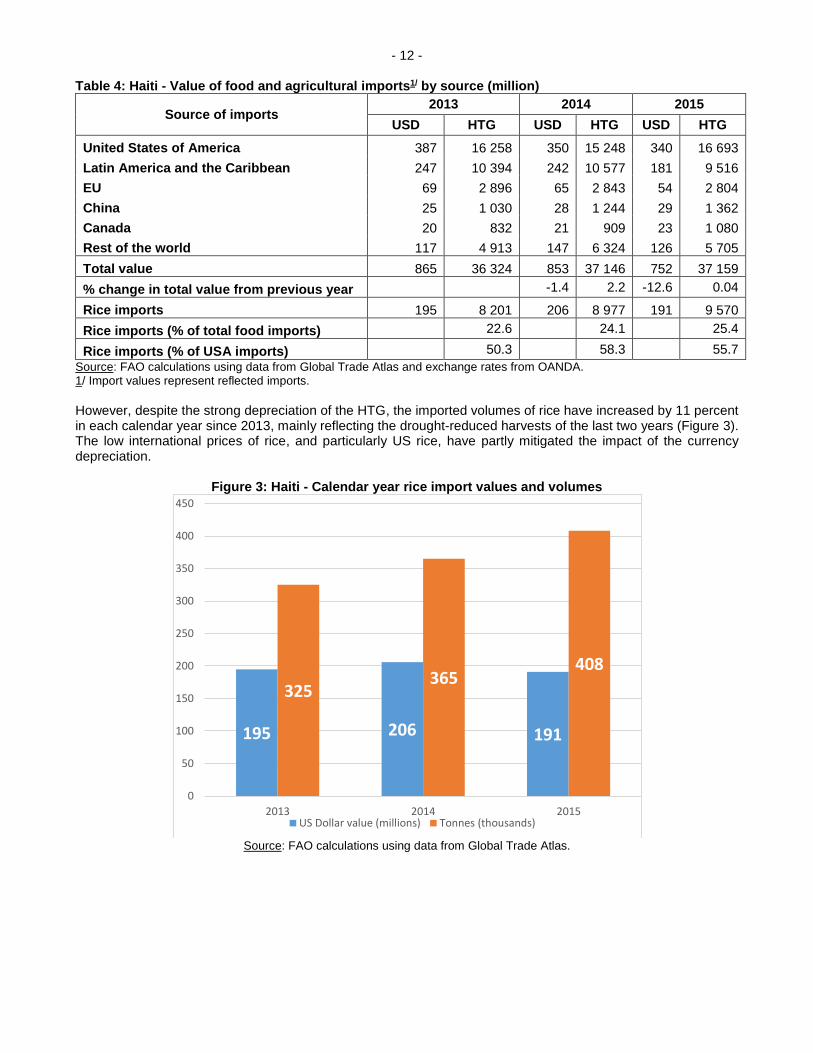
Table 4: Haiti - Value of food and agricultural imports1/ by source (million)
Source of imports 2013 2014 2015
USD HTG USD HTG USD HTG
United States of America 387 16 258 350 15 248 340 16 693
Latin America and the Caribbean 247 10 394 242 10 577 181 9 516
EU 69 2 896 65 2 843 54 2 804
China 25 1 030 28 1 244 29 1 362
Canada 20 832 21 909 23 1 080
Rest of the world 117 4 913 147 6 324 126 5 705
Total value 865 36 324 853 37 146 752 37 159
% change in total value from previous year -1.4 2.2 -12.6 0.04
Rice imports 195 8 201 206 8 977 191 9 570
Rice imports (% of total food imports) 22.6 24.1 25.4
Rice imports (% of USA imports) 50.3 58.3 55.7
Source: FAO calculations using data from Global Trade Atlas and exchange rates from OANDA. 1/ Import values represent reflected imports.
However, despite the strong depreciation of the HTG, the imported volumes of rice have increased by 11 percent in each calendar year since 2013, mainly reflecting the drought-reduced harvests of the last two years (Figure 3). The low international prices of rice, and particularly US rice, have partly mitigated the impact of the currency depreciation.
Figure 3: Haiti - Calendar year rice import values and volumes
Source: FAO calculations using data from Global Trade Atlas.
195 206 191
325365
408
0
50
100
150
200
250
300
350
400
450
2013 2014 2015US Dollar value (millions) Tonnes (thousands)

- 13 -
Inflation, and in particular food inflation, increased sharply Inflation rates have increased significantly since June 2015, coinciding with the sharp drop in the value of the HTG and also reflecting the reduced harvest of that same year (Figure 4). In January 2016, the annualized rate of inflation reached 13.3 percent, double its value at the same time in 2015 (MEF, 2016). More than half of the contribution to the inflation rate has come from the increase in food inflation in each month since July 2015 (Figure 4). However, prices of non-food items have increased significantly as well. By contrast, the growth in the cost of services has remained relatively stable.
Figure 4: Haiti - Consumer Price Index (CPI) and inflation by sector (percent)
Source: IADB.
4. AGRICULTURAL PRODUCTION Usable agricultural land concentrated in a few departments In Haiti, the agricultural year runs from April to March of the following year (Figure 5). There are two seasons: the spring season from April to August, accounts for the bulk of the national cereal production, with the exception of rice. The rice harvest, which is partially irrigated, begins in September and extends just until November. Production of pulses occurs in all seasons but it is mainly concentrated in the spring season; the second season begins in mid-September and concludes in March of the following year. There is also a minor third season, where production of pulses is important, which occurs from October to March. Starchy roots, which can be semi-perennial crops, have a cycle of anywhere from 9 to 14 months, extending across seasons. But again, the spring season, particularly for yams, potatoes and sweet potatoes, is the most important season.

- 14 -
Figure 5: Haiti - Crop calendar
According to the 2012 General Census of Agriculture, there are approximately 736 000 hectares of usable agricultural land (UAL) in Haiti (Table 5). Sixty percent of UAL is located in just four departments: Artibonite, Centre, Ouest and Nord. The concentration of UAL is closely correlated to the concentration of the population, as these four departments represent some 70 percent of the total population. By contrast, the departments of Nord-Est and Nippes have the smallest agricultural areas. Table 5: Haiti - Usable Agricultural Land by Department
Department Usable Agricultural Land
(‘000 ha)
Total Usable Agricultural Land
(%)
Artibonite 122.0 17
Centre 121.6 17
Ouest 108.1 15
Nord 83.9 11
Sud 60.5 8
Nord-Ouest 56.3 8
Sud-Est 54.7 7
Grande-Anse 52.0 7
Nord-Est 46.8 6
Nippes 30.2 4
Total 736.2
Source: FAO, using data from the 2012 General Census of Agriculture, Ministry of Agriculture of Haiti.
Agricultural production is erratic and declining Nationally, cereals, pulses and starchy roots occupy the majority of the UAL and represent about 61 percent of the daily per capita caloric consumption (Table 6). Maize, rice and sorghum are the main cereals produced, and together represent the largest share of UAL, 63 percent, with maize alone representing 41 percent of UAL (MARNDR, 2012). While cereal production is spread across the country, the largest concentrations are in Artibonite and Centre departments (Figure 6). Cereals also represent the largest shares of kilocalories consumed, 40 percent of total consumption (Table 6). Starchy roots, including potatoes, yams, sweet potatoes and cassava, are the second most important group of commodities in terms of land use and caloric contribution. Starchy roots are produced throughout the country, but mainly concentrated in the departments in the south and northeast (Figure 6). Beans are commonly intercropped with cereals and starchy roots and produced across the country but plantings are heavily concentrated in the southern and northern regions. Pulses only contribute 9 percent of daily caloric consumption.

- 15 -
Table 6: Haiti - Usable Agricultural Land and caloric contribution of cereals, pulses and starchy roots
Usable Agricultural
Surface (‘000 ha) UAL1/
(%)
Caloric consumption2/
(kcal/capita/day)
Caloric contribution
(%)
Cereals 462 63 832 40
Maize 305 41
Rice 59 8
Sorghum 98 13
Pulses 302 41 181 9
Beans 192 26
Congo peas 84 11
Inconnu peas 27 4
Starchy roots 159 22 245 12
Potatoes 5 1
Sweet potatoes 51 7
Yams 46 6
Cassava 58 8
Total UAL 736
Total caloric contribution 2 097 Source: FAO calculations from the 2012 General Census of Agriculture, Ministry of Agriculture of Haiti and FAOSTAT, 2016. 1/ Percent of UAL does not sum to 100 as pulses are sown in association with cereals and starchy roots. Cereals can
also be intercropped with starchy roots. 2/ Caloric consumption represents totals by commodity grouping which also includes imports.
Figure 6: Haiti - Predominant agricultural use of land of Communes
Source: General Census of Agriculture of Haiti, 2012.

- 16 -
In the seven-year period from 2004 to 2011, cereal-production1 increased from about 370 000 tonnes to just over 600 000 tonnes (Figure 7). However, between 2012 and 2015, cereal production followed a decreasing trend, due to several factors, including: lack of availability and/or access to adequate inputs; soil degradation; erratic weather conditions and natural disasters (such as drought or excessive rains); the continued deterioration of productive infrastructure such as irrigation canals; and continued political crisis that, at times, limits the operations of the MARNDR, particularly its’ ability to execute programmes directed at increasing production. As a result in 2015 cereal output reached its lowest level in 12 years.
Figure 7: Haiti - Cereal production
Source: FAO, using data from the Ministry of Agriculture of Haiti. Note: Figures from 2014 and 2015 are from the National Survey of Agricultural Production Estimates. 1/ FAO forecast.
Production of pulses, such as beans (both black and pinto) and peas, as well as starchy roots, closely followed the same trends as cereal production (Figure 8). However, the magnitude of changes in the growth rate of production was greater. From 2004 to 2011 production of pulses more than doubled from 79 000 tonnes to 171 000 tonnes. Production of starchy roots over the same period grew from almost 726 000 tonnes to about 1.4 million tonnes in 2011 (Figure 8, Panel B). From 2012 to 2015, in three of the four years, production of both pulses and starchy roots fell sharply from their average levels. However, unlike cereals and starchy roots, both of which reached their lowest production levels in 12 years in 2015, production of pulses, while severely reduced in 2014 and 2015, remained relatively high in comparison to historical levels
1 Production figures prior to 2014 have been generated by non-survey based estimates of the Vegetable Production Direction of the MARNDR. Production figures for 2014 and 2015 are based on the National Survey of Agricultural Production Estimates of MARNDR.
70 70 73 87 73 86 94 96 98 112 12791
202 200 205
270
210
304340
360
202
401
136
110
95 100 100
120
100
122
146150
92
111
44
32
0
100
200
300
400
500
600
700
2004 2005 2006 2007 2008 2009 2010 2011 2012 2013 2014 0
ton
ne
s (
'00
0)
Rice Maize Sorghum
2015 1/2015 1/2015 1/2015 1/
2015 1/2015 1/2015 1/2015 1/2015 1/20151/

- 17 -
Figure 8: Haiti – Production of pulses and starchy roots
Source: FAO, using data from the Ministry of Agriculture of Haiti. Note: Figures from 2014 and 2015 are from the National Survey of Agricultural Production Estimates. 1/ FAO forecast.
34 40 4060 65
84 92102
82
114
8464
2525 27
2931
3437
37
30
85
54
52
2020 22
2325
27
3031
25
37
8
5
0
50
100
150
200
250
2004 2005 2006 2007 2008 2009 2010 2011 2012 2013 2014
ton
ne
s ('
00
0)
Panel A: Pulse production
Beans Congo Peas Inconnu Peas
20151/
175 200 200 220 269360 414 437
534600
158 136
340400 400
450 378
510
561 574
699 616
76 62
199
220 220230 232
313
345347
423 433
118100
0
200
400
600
800
1000
1200
1400
1600
1800
2004 2005 2006 2007 2008 2009 2010 2011 2012 2013 2014
ton
ne
s ('
00
0)
Panel B: Starchy roots production
Potatoes Sweet Potatoes Cassava Yams
20151/

- 18 -
Drought conditions due to the El Niño episode caused sharp production losses across the country in
2014 and 2015
The aggregate national production figures tend to mask the regional differences in the areas impacted by drought in 2014 and 2015 due to the El Niño phenomenon. The last agricultural year with adequate rainfall levels and above-average production was 2013. However, even in 2013 the season began in April with signs of drought stress in some areas, particularly in Artibonite and Centre departments, as highlighted by the Vegetation Health Index2 (Figure 9, Panel 1). In 2013, the only areas in the country affected in a significant way by drought conditions were the Nord-Ouest Department and parts of the Grand Anse Department, at the beginning of the harvest period of the main agricultural spring season. The following year, 2014, was mostly dominated by drought conditions generated by the gestation period of El Niño, which was officially declared an event towards the end of the fall season of that year. In 2014, the whole country was impacted by drought to some extent, with only some southern parts of the Artibonite and Centre departments relatively less affected at the harvest period of the spring agricultural season, as illustrated by the VHI for July 2014 (Figure 9, Panel 2). In 2015, the area impacted by drought conditions increased further (Figure 9, Panel 3). The area affected by drought conditions in the vulnerable areas of the Nord-Ouest and Nord departments was particularly large by the beginning of the harvest of the 2015 spring season. The Artibonite and Centre departments, where most agricultural production and, in particular, cereal production, is concentrated, were also severely distressed by drought conditions (Figure 9, Panel 3).
2 The Vegetation Health Index (VHI) is a composite index combining the Vegetation Condition Index (VCI) and the Temperature Condition Index (TCI). The TCI relates the observed temperature to the long-term maximum, as it is assumed that higher temperatures tend to cause a deterioration in vegetation conditions. The VCI relates the observed dekadal NDVI to its long-term minimum, normalized by the historical range of NDVI values for the same dekad. The VCI was designed to separate the weather-related component of the NDVI from the ecological element. A decrease in the VHI following, for example, a decline in the VCI (relatively poor green vegetation) and an increasing TCI (warmer temperatures) would signify stressed vegetation conditions, and over a longer period would be indicative of drought. The VHI components (VCI and TCI) are given equal weights when computing the index.

- 19 -
Figure 9: Haiti - Vegetation Health Index for April and July, 2013-2015
Source: FAO/GIEWS.
Panel 1: 2013
Panel 2: 2014
Panel 3: 2015

- 20 -
5. FOOD3 AVAILABILITY Imports and a drawdown of stocks sustain food availability The methodology used to evaluate food availability was the Country Commodity Balance Sheet (CCBS) approach as described in the Joint Guidelines for Crop and Food Security Assessment Missions (FAO and WFP, 2009). The CCBS for Haiti was estimated for cereals, pulses and starchy roots for the 2015/16 marketing year (July/June). As discussed previously, these three commodity groups represent some 60 percent of the caloric consumption. In order to combine cereals with the other commodity groups, all products were converted to Maize Equivalent Tonnes (MET), using conversion rates provided by the CNSA (see Annex). The population figure used for the 2015/16 marketing year was 10.7 million as reported by UNDP. The per capita consumption levels (un-transformed) to calculate utilization figures and import needs were as follows:
i) cereals: 92 kg/year; ii) pulses: 19 kg/year; iii) starchy roots: 31.7 kg/year.
For cereals and pulses the per capita consumption levels represent historical average amounts. For starchy roots and tubers, per capita consumption was set at lower than historical levels. This was because, Haiti’s import capacity of starchy roots and tubers is limited, and so it would not be possible to fully compensate for the production losses in 2015 with increased imports. Statistics on agricultural output for all three seasons exist only for 2014 and for the main 2015 spring season. This data is derived from the National Survey of Agricultural Production Estimates (ENEPA) undertaken by SSSAI with assistance from USDA, funded by USAID, and a European Union funded FAO project. The ENEPA figures for the second and third agricultural seasons of 2015 will be published later in 2016. Therefore, for 2015, production for the second and third seasons is assumed to have remained unchanged from the drought reduced outputs of 2014. According to the CCBS estimation, the 28 percent decline in cereal production in 2015 will lead to a reduction of 13 percent in domestic cereal availability in 2015/16 compared to the previous year (Table 7, Panel A), despite a much larger-than-normal anticipated drawdown of stocks. At this level, the domestic availability of cereals would be more than 40 percent below the five-year average. The impact of the drought on the production of pulses and starchy roots was relatively limited compared to impact on the cereal harvest. When accounting for these commodities in the national balance, the overall domestic availability of food (cereals, pulses and starchy roots) is estimated to be 10 percent below the 2014/15 level at 684 million tonnes (Table 7, Panel B). Given the reduced domestic food availability, the total import requirement of cereals, pulses and starchy roots in 2015/16 is forecast to increase by 16 percent to 769 000 tonnes, representing 53 percent of domestic utilization.
3 Food refers to cereals, pulses and starchy roots.

- 21 -
Table 8: Haiti - Commodity balance sheet, marketing year 2015/16 (July/June), ‘000 tonnes Panel A
Wheat Sorghum Rice
(milled) Maize
Total cereals
2015 2014 5-year
average
Domestic availability - 32 121 250 403 458 600
% change from 2014 -47 -5 -7 -13 Stock drawdown 0 0 30 140 170 150 98 Production 0 32 91 110 233 307 502 % change from 2014 -32 -33 -21 -28
Total utilization 237 32 544 282 1 095 1 057 1 176
Food use 200 2 529 250 981 979 929 Feed use - 18 - 20 38 34 81 Other uses (seed, losses, other) 2 12 15 12 41 44 42 Exports - - - - - - - Stock build-up 35 0 0 0 35 - 124
Import requirement 237 - 423 32 692 600 576
% change from 2014 22 - 6 116 14
Panel B1/
Wheat Sorghum Rice
(milled) Maize
Total cereals
Pulses Starchy
roots Total 2015
Domestic availability - 30 132 250 412 79 192 684
% change from 2014 -47 -5 -7 -13 -5 -8 -10 Stock drawdown 0 0 33 140 173 23 94 289 Production 0 30 100 110 240 56 99 394 % change from 2014 -32 -33 -21 -28 -18 -16 -24
Total utilization 221 30 593 282 1 127 109 217 1 453
Food use 187 2 577 250 1 016 95 106 1 217 Feed use - 17 - 20 37 - 15 52 Other uses (seed, losses, other)
2 11 16 12 42 14 97 152
Exports - - - - - - - - Stock build-up 33 - - - 33 - - -
Import requirement 221 - 461 32 714 30 25 769
% change from 2014 22 0 6 116 14 17 139 16
Source: FAO/GIEWS, using data from CNSA and SSSAI of the Ministry of Agriculture of Haiti and FAOSTAT. 1/ All data is in maize tonnage equivalent.

- 22 -
6. MARKET CONDITIONS AND PRICES Field visits were made to 7 markets covering 6 departments of the 10 in the country, 3 in the northeast and 3 in the southwest (Table 8). The markets were selected to supplement price information already provided by the Emergency Food Security Assessment (EFSA), carried out by WFP in conjunction with CNSA in December 2015, and thus enable a more comprehensive overview of the situation across the country. The visits included the regional offices of the HMOA in Cap Haitien and in Jeremie and the market of Ouanaminthe, in the Nord-Est Department, which is one of the main entry gateways of food imports from the Dominican Republic. For the visits to the southwestern departments the Mission was joined by WFP, while for the visits to the north-eastern departments it was joined by FEWSNET. In total, 56 merchants were interviewed. From these visits, the Mission was able to conclude the following:
Markets were mostly supplied with imported foods from the Dominican Republic and the United States of America. Availabilities of locally-produced foods in the country were overall tight, although markets in the southwestern departments of the country had larger supplies than elsewhere. Relative to the northern departments, production in these areas was less affected by the drought in 2015.
Prices of all goods were generally increasing. Prices for domestically-sourced foods and imported beans increased the most, while prices of imported rice were increasing at a relatively slower rate or not at all. Merchants reported that they were reluctant to increase rice prices at the same rate as other goods for the fear of depressing sales. Since merchants buy on credit, and often with a credit maturity of just one week, it is critical for them to maintain cash flow levels in order to service their debts. Therefore, merchants were taking a lower profit margin, particularly for rice, in order to maintain cash flow. The depreciation of the HTG relative to the DOP and to the USD has been a key factor driving up prices.
Purchases on credit by consumers was higher in markets in the northeast departments relative to the markets in the southeast departments. In addition, merchants in the northeast reported marginal increases in the number of sellers relative to the southwest.
Merchants in all markets reported a slowdown in sales of cereals and pulses relative to February 2014, with consumers often substituting with starchy roots, which are more filling and priced lower, but contain less calories.
There were concerns regarding the effects of the political instability on the ability of the MARNDR to support farmers during the spring 2016 season. As in most developing countries, merchants are also often producers, and those interviewed showed concern about their access to seeds for the coming season. The seeds used for sowing tend to be the same grain destined for human consumption, and given current price levels in the market, access to seeds is therefore a concern. In the last two years, the MARNDR, independently or through support from FAO and other donors, distributed technology packages that include seeds. There is concern that these distributions for the main 2016 spring agricultural season might be delayed due to the disruption of Government operations after the 2015 electoral process. However, in discussion with the heads of the regional offices of the MARNDR in Cap Hatien and Jeremie, the Mission was informed that planning for this process was ongoing and that it might start on schedule.
Table 8: Haiti - Markets visited during the Mission
Region Market Name Department
North by Northeast Point Sonde Artibonite
Cap Hatien Nord
Limonade Nord
Ounaminthe Nord-Est
Southwest Fondes de Negres Nippes
Kanse Sud
Chambellan Grand'Anse
The analysis of market price data confirmed the market trends observed in the field visits Prices of domestically-produced maize meal have followed a general increasing trend since the summer of 2014 (Figure 10, Panel A). In Port au Prince, maize meal prices in March 2016 were nearly 60 percent above their year-earlier levels (Figure 10, Panel B). Prices, however, remained generally below the record highs reached in 2008.

- 23 -
Figure 10: Haiti - Maize meal retail prices and 12-month moving average of monthly price changes
Source: FAO/GIEWS calculations using data from CNSA as reported in the FPMA Price Tool.
Following sharp increases in the prices of black beans between March and November 2015, the rate of increase slowed since December 2015, reflecting the arrival of new supplies from the second season harvest, between late December and mid-February. However, prices began to increase in March 2016, with the 12-month moving average growth rate ranging from 2 percent in Les Cayes to over 4 percent in Jacmel (Figure 11, Panel B). In the January-February 2016 period, prices reached record levels in Cap Hatien, Jacmel and Port au Prince and continued at very high levels in March, with prices well above their year-earlier levels in all markets.
5
7
9
11
13
15
17
19
21
Mar
-14
May
-14
Jul-
14
Sep
-14
No
v-1
4
Jan
-15
Mar
-15
May
-15
Jul-
15
Sep
-15
No
v-1
5
Jan
-16
Mar
-16
Go
urd
es\L
bs
Panel A: Maize meal (local) retail prices
Cap Haitien Hinche Jacmel Jeremie
Les Cayes Ouanaminthe Port-au-Prince
-8
-6
-4
-2
0
2
4
6
8
10
Mar
-14
May
-14
Jul-
14
Sep
-14
No
v-1
4
Jan
-15
Mar
-15
May
-15
Jul-
15
Sep
-15
No
v-1
5
Jan
-16
Mar
-16
Per
cen
tage
gro
wth
Panel B: 12-month moving average of montly price changes
Cap Haitien Hinche Jacmel Jeremie
Les Cayes Ouanaminthe Port-au-Prince

- 24 -
Figure 11: Haiti - Black bean retail prices and 12-month moving average of monthly price changes
Source: FAO/GIEWS calculations using data from CNSA as reported in the FPMA Price Tool.
20
30
40
50
60
70
80
Mar
-14
May
-14
Jul-
14
Sep
-14
No
v-1
4
Jan
-15
Mar
-15
May
-15
Jul-
15
Sep
-15
No
v-1
5
Jan
-16
Mar
-16
Go
urd
es/L
bs
Panel A: Black bean retail prices
Cap Haitien Hinche Jacmel Jeremie
Les Cayes Ouanaminthe Port au Prince
-6.0
-4.0
-2.0
0.0
2.0
4.0
6.0
8.0
Mar
-14
May
-14
Jul-
14
Sep
-14
No
v-1
4
Jan
-15
Mar
-15
May
-15
Jul-
15
Sep
-15
No
v-1
5
Jan
-16
Mar
-16
Per
cen
t gr
ow
th
Panel B: 12-month moving average of montly price changes
Cap Haitien Hinche Jacmel Jeremie
Les Cayes Ouanaminthe Port au Prince

- 25 -
Relative to maize meal and black bean prices, imported rice prices have exhibited a lower rate of growth in 2015 (Figure 12, Panel A). The highest rate of growth of imported rice prices was observed in August 2015, when the 12-month moving average growth rate across all markets was 0.5 percent. Since then, the rate of growth of prices decelerated until February 2016 when it started to increase again. In March 2016, the average rate of growth across all markets was 0.35 percent, and 0.69 percent in Hinche. In March 2016, imported rice prices were only moderately above their year-earlier levels, and in Jacmel prices were unchanged from 2015 (Figure 12, Panel B). The relative stability of rice prices in Haiti mainly reflects low US rice export quotations, which are at six-year lows, and merchants’ reluctance to increase prices.
Figure 12: Haiti - Imported rice retail prices and 12-month moving average of monthl prices changes
Source: FAO/GIEWS calculations using data from CNSA as reported in the FPMA Price Tool.
-2.00
-1.50
-1.00
-0.50
0.00
0.50
1.00
Mar
-14
May
-14
Jul-
14
Sep
-14
No
v-1
4
Jan
-15
Mar
-15
May
-15
Jul-
15
Sep
-15
No
v-1
5
Jan
-16
Mar
-16
Per
cen
t gr
ow
th
Panel A: 12-month moving average of montly price changes
Hinche Jacmel Jeremie Port-au-Prince
20
21
22
23
24
25
26
27
28
Mar
-14
May
-14
Jul-
14
Sep
-14
No
v-1
4
Jan
-15
Mar
-15
May
-15
Jul-
15
Sep
-15
No
v-1
5
Jan
-16
Mar
-16
Go
urd
es/L
bs
Panel B: Imported rice retail price
Hinche Jacmel Jeremie Port-au-Prince

- 26 -
Black bean and rice prices are well integrated to import markets4 Prices of black bean and imported rice in Port au Prince are strongly integrated with prices of these commodities in the country’s main suppliers, namely the Dominican Republic and the United States of America, respectively. The high level of market integration infers that exogenous market factors play a very important role in determining price levels in Haiti. However, unlike 2008, international commodity prices have declined and are expected to remain low in the near future. Figure 13: Haiti - Natural log of real black bean and rice prices in Haiti, the Dominican Republic and the United States of America and time of adjustment of Haitian prices to a shock in the Dominican Republic
and the United States of America
Source: FAO/GIEWS calculations using data from CNSA as reported in the FPMA Price Tool.
4 To evaluate the level of integration of black bean and rice prices to markets in the Dominican Republic and the United States of America, prices were analyzed using the Single Equation Error Correction Model (SECM) approach used by Baquedano and Leifert (2014).
2.5
2.6
2.7
2.8
2.9
3
3.1
3.2
3.3
2.7
2.8
2.9
3
3.1
3.2
3.3
3.4
Jul-
08
Dec
-08
May
-09
Oct
-09
Mar
-10
Au
g-1
0
Jan
-11
Jun
-11
No
v-1
1
Ap
r-1
2
Sep
-12
Feb
-13
Jul-
13
Dec
-13
May
-14
Oct
-14
Mar
-15
Au
g-1
5
Jan
-16
Nat
ura
l Lo
g o
f H
aiti
pri
ces
Nat
ura
l Lo
g o
f D
om
. Rep
. pri
ces
Panel A: Natural log of real black bean prices
Dominican Rep., Sto. Domingo, Beans (Black), Retail, Peso/Lbs
Haiti, Port au Prince, Beans (Black), Retail, Gourde/Lbs
9.4
9.6
9.8
10
10.2
10.4
10.6
10.8
11
5.4
5.6
5.8
6
6.2
6.4
6.6
6.8
7
Jan
-07
Jul-
07
Jan
-08
Jul-
08
Jan
-09
Jul-
09
Jan
-10
Jul-
10
Jan
-11
Jul-
11
Jan
-12
Jul-
12
Jan
-13
Jul-
13
Jan
-14
Jul-
14
Jan
-15
Jul-
15
Jan
-16
Nat
ura
l Lo
g o
f H
aiti
Pri
ces
Nat
ura
l Lo
g o
f U
S P
rice
s
Panel B: Natural log of real rice prices
US, Rice (US Long Grain 2.4%), Export (USD/Tonne)
Haiti, Port-au-Prince, Rice (Imported), Retail (Gourde/Tonne)

- 27 -
7. EL NIÑO PHENOMENON AND EARLY OUTLOOK FOR MAIN 2016 SPRING CROP SEASON Uncertainty remains over possible impact of the ongoing El Niño event on the main spring 2016 season The latest consensus forecast of the International Research Institute for Climate and Society of Columbia University (IRI) gives a 76 percent probability that the El Niño Southern Oscillation (ENSO) will reach neutral conditions during the May-July period. With the bulk of the 2016 spring season planting occurring between late March and early June, it is likely that precipitation levels for the season may again be affected by ENSO. Under current El Niño forecasts there are two probable scenarios:
Normal rainfall distribution and planting operations are not delayed by dry conditions: This is the most optimistic scenario and would permit a possible return to normal production levels, last seen in 2013, with cereal production recovering to some 600 000 tonnes, pulses around 200 000 tonnes and starchy roots about 1.6 million tonnes.
The second scenario is for the El Niño episode to continue in a more weakened state: This is the most likely scenario given current El Niño forecasts. How production is affected will depend on the impact on the sowing period of the spring 2016 season, which goes from May to June.
With either of the above scenarios, if planting operations are delayed or reduced by the lack of seeds, outputs could be reduced for a third consecutive year, irrespective of rains. One possible way to mitigate any negative effects would be to provide additional seeds for replanting if this became necessary. Rainfall patterns have been erratic but conditions improving During the first 80 days of 2016 rainfall levels were erratic, according to remote sensing data. Generally, rainfall levels were severely below average during the first two months of the year in Artibonite and Centre departments, where national agricultural production is largely concentrated, but improved in March (Figure 14). In Artibonite and Centre departments, 50 of the first 80 days of 2016 have seen below-average rainfall levels and 30 days were below 2015 rainfall levels (Figure 14). In both departments, only 30 days have been above average, with 20 of these days occurring in the last two dekads of February.

- 28 -
Figure 14: Haiti - Rainfall by dekad in Artibonite and Centre departments
Source: FAO/GIEWS using data from FAO’s Earth Observation portal.
0
10
20
30
40
50
60
70
80
90
Jan
-De
kad
1
Jan
-De
kad
3
Feb
-De
kad
2
Mar
-De
kad
1
Mar
-De
kad
3
Ap
r-D
ekad
2
May
-Dek
ad 1
May
-Dek
ad 3
Jun
-Dek
ad 2
Jul-
Dek
ad 1
Jul-
Dek
ad 3
Au
g-D
eka
d 2
Sep
-De
kad
1
Sep
-De
kad
3
Oct
-Dek
ad 2
No
v-D
ekad
1
No
v-D
ekad
3
Dec
-De
kad
2
mili
met
ers
of
rain
Panel A: L'Artibonite Department
2016 2015 Average
0
20
40
60
80
100
120
Jan
-De
kad
1
Jan
-De
kad
3
Feb
-De
kad
2
Mar
-De
kad
1
Mar
-De
kad
3
Ap
r-D
ekad
2
May
-Dek
ad 1
May
-Dek
ad 3
Jun
-Dek
ad 2
Jul-
Dek
ad 1
Jul-
Dek
ad 3
Au
g-D
eka
d 2
Sep
-De
kad
1
Sep
-De
kad
3
Oct
-Dek
ad 2
No
v-D
ekad
1
No
v-D
ekad
3
Dec
-De
kad
2
mili
met
ers
of
rain
Panel B: Centre Department
2016 2015 Average

- 29 -
However, according to the Vegetation Health Index (VHI), vegetative conditions in March were better than at the same time in 2015 (Figure 15). Up until the second dekad of March 2016, the development of vegetation has been particularly strong in the southwest and south departments as well as in large areas in upper Artibonite and Nord-Ouest departments (Figure 15, Panel B). If this positive vegetation development continues, it would imply a likely normal production outcome, provided that other factors, other than the weather, do not adversely affect production.
Figure 15: Haiti - Vegetation Health Index, dekad 2 March 2015 and 2016
Source: FAO/GIEWS using data from FAO’s Earth Observation portal.
8. CONCLUSIONS AND RECOMMENDATIONS Domestic food availability declined significantly in 2015, from its already low level in 2014, as a consequence of the drought conditions that predominated for most of the 2015 agricultural season. As a result, some 1.5 million people are estimated to be severely food insecure and at least 200 000 people are in an extreme food emergency situation. Currently, food availability is being sustained by a substantial increase in imports, particularly for rice and wheat. This is evident in local markets where important food staples on offer, such as rice, beans, maize and wheat flour, predominately originate from the United States of America and the Dominican Republic. A significant drawdown of national food reserves is also expected in order to sustain food availability. However, the weak macro-economic environment, including a strong depreciation of the gourde, high rates of inflation and higher-than-anticipated budget deficits, could make it more difficult to sustain current levels of imports in 2016. Food price levels in March 2016 were high and near-record levels for key food staples, including maize meal and beans. However, low international prices for rice have prevented significant increases in local prices for this commodity, somewhat shielding consumers from the impact of a strong depreciation of the gourde. The high level of prices has adversely affected food access for households most affected by the drought, as food purchases represent close to two thirds of household expenditures. To cope with the high prices, local populations are substituting consumption of these commodities with starchy roots and tubers, reducing purchases and/or increasing purchases on credit.

- 30 -
Sustaining the purchasing power of households and support to agricultural activities are two important strategies to mitigate the effects of the drought. The possible impact of the ongoing El Niño phenomenon on the coming 2016 main spring agricultural season is uncertain. So far, even though rainfall has been erratic for most of the year, vegetative development has improved significantly from 2015. Nonetheless, until the harvest, which will begin in late June and continue until September, the following two strategies are recommended:
Sustain household purchasing power with targeted cash transfers and/or cash for work activities: Households across the country, and in particular the most impacted areas, have seen a significant reduction in their incomes from agriculture in the last two years, resulting in a drop in purchasing power and increases in household debt. Rural populations, and in particular farmers, have to consider using limited resources to either buy food or agricultural inputs. Sustaining household purchasing power would facilitate the normal resumption of agricultural activities. This support should be targeted and last only until the next harvest, when farmers would be able to generate income from the sale of their products.
Support to agricultural production: To increase food availability and lessen the tight supply pressure on prices, assistance to the agricultural sector should not be limited to the most affected areas of the country. The areas of the country that were most affected by the drought conditions in 2014 and then again in 2015 tend to also have the lowest level of agricultural productivity. Focusing only on these regions would have a marginal effect on production gains and ultimately food availability. Therefore, two measures are recommended:
i) providing direct assistance to the most affected regions with necessary inputs, such as seeds and fertilizers and also activities aimed at increasing the resilience of these populations to drought, such as promoting the harvesting of water through the construction of micro-tanks at the household level;
ii) rebuilding productive capacity in the more productive regions of the country, for example Artibonite, Centre, Grande-Anse and Nippes, through activities such as reinforcing good agricultural practices, improving or promoting high quality seed production and facilitating access to credit and extension services.
9. REFERENCES Baquedano, F. and William, L., 2014. Market integration and price transmission in consumer markets of developing countries. Food Policy 44:103-114. FAO and WFP, 2009. Joint Guidelines for Crop and Food Security Assessment Missions, Rome, Italy. MEF, 2016. Note de synthèse sur la situation macroéconomique et financière d’Haïti, février 2016. OCHA, 2016. Humanitarian Bulletin: Haiti. Issue 57, January 2016. WFP, 2016. Haiti Emergency Food Security Assessment. World Bank, 2016. World Development Indicators .

- 31 -
ANNEX
Haiti - CNSA Maize Equivalent Tonnes (MET) Conversion Factors
MET Conversion Factor
Cereals
Rice (paddy) 1.09
Maize 1
Sorghum 0.94
Wheat 0.93
Pulses
Dry beans 1.02
Peanuts 1.54
Congo peas 1.02
Starchy roots
Potatoes 0.21
Sweet potatoes 0.32
Cassava 0.39
Yams 0.28 Source: CNSA.

I5614E/1/05.16