FAO Criteria for SARD Meeting the basic nutritional requirements of present and future generations,...
79
FAO Criteria for SARD • Meeting the basic nutritional requirements of present and future generations, qualitatively and quantitatively while providing a number of other agricultural products • Providing durable employment, sufficient income, and decent living and working conditions for all those engaged in agricultural production • Maintaining and, where possible, enhancing the productive capacity of the natural resource base as a whole, and the regenerative capacity of renewable resources, without disrupting the functioning of basic ecological cycles and natural balances, destroying the socio-cultural attributes of rural communities, or causing contamination of
-
Upload
junior-dalton -
Category
Documents
-
view
216 -
download
0
Transcript of FAO Criteria for SARD Meeting the basic nutritional requirements of present and future generations,...

FAO Criteria for SARD• Meeting the basic nutritional requirements of present and future
generations, qualitatively and quantitatively while providing a number of other agricultural products
• Providing durable employment, sufficient income, and decent living and working conditions for all those engaged in agricultural production
• Maintaining and, where possible, enhancing the productive capacity of the natural resource base as a whole, and the regenerative capacity of renewable resources, without disrupting the functioning of basic ecological cycles and natural balances, destroying the socio-cultural attributes of rural communities, or causing contamination of the environment
• Reducing the vulnerability of the agricultural sector to adverse natural and socio-economic factors and other risks, and strengthening self-reliance

Macro Policies and the Environment
Table 6.1. Macro-environmental linkages
Macroeconomic policies and objectives
Likely environmental impactsConditions and policy
interventions to facilitate positive environmental impacts
Monetary Policy:
Stabilization of inflation and interest rate alignment
+ More sustainable use of NR due to lower inflation and reduced in-vestments
- Pressure on NR as a result of increased export competitiveness
Proper regulation of property rights, royalties, well structured concessions, command and control regulation, zoning

Macro Policies and the Environment Table 6.1. Macro-environmental linkages
Macroeconomic policies and objectives
Likely environmental impactsConditions and policy
interventions to facilitate positive environmental impacts
Fiscal Policy:
Public expenditure reduction; increased transparency/tax reform
Price reforms and subsidy red-uction on agro-inputs, energy, and water
+ Pressure for higher cost recovery in services, improved collection of rents
- Reduction of expenditures on environmental infrastructure, NR protection, and enforcement
+ More efficient use of NR, pollu-tion reduction
- Increased pollution due to substi-tution of dirty fuels
Regulatory and institutional conditions and the proper application of user charges, fees, and rents
Protection of critical social and environmental expenditures
Full subsidy removal and introduction of prices reflecting economic costs
Protection of the poor

Macro Policies and the Environment Table 6.1. Macro-environmental linkages
Macroeconomic policies and objectives
Likely environmental impactsConditions and policy
interventions to facilitate positive environmental impacts
Exchange Rate Policy:
Trade balance improvement
+ Increased price of imported inputs (fertilizers, pesticides, etc.)
- Pressure on NR as a result of increased export competitiveness
Proper regulation of property rights, royalties, well structured concessions, command and control regulation, zoning

Macro Policies and the Environment Table 6.1. Macro-environmental linkages
Macroeconomic policies and objectives
Likely environmental impactsConditions and policy
interventions to facilitate positive environmental impacts
Trade Policy:
Elimination of export taxes, import quotas, and other trade barrier
+ Improved efficiency, application of cleaner technologies, and better environ-mental management
- Increased depletion of NR
Appropriate regulation and implementation of property rights, rents, concessions

Macro Policies and the Environment Table 6.1. Macro-environmental linkages
Macroeconomic policies and objectives
Likely environmental impactsConditions and policy
interventions to facilitate positive environmental impacts
Institutional Reform:
Privatization, liberalization, restructuring, and deregulation
+ Improved efficiency, management, and response to incentives, increased investments in cleaner technologies and processes
Effective environmental regulation and enforcement

Macro Policies and the Environment Common Roots of Economic and Environmental Problems
Policy failures• growth without safeguards• lack of proper sector policies
Market failures• monopolies• imperfect information• externalities
Governance failures• lack of monitoring and control• weak management• lack of transparency• collusion
Financial sector problems• excessive exposure to risk• weak portfolio• unsustainable business
practices
Environmental problems• excessive pollution• excessive NR depletion• unsustainable industrial,
agricultural, and NR management practices

Macro Policies and the Environment
• if one traces the impacts of a macroeconomic policy change, one can find effects across many sectors, not always self-evident
• the environmental impacts of economic policies will depend critically on the economic institutions that are in place and that govern the use of the resource base and the environmental sinks of the economy
• where there are market imperfections of one kind or another, and where these cannot be resolved at source, it is desirable to use economic instruments specifically to address the environmental issues
Conclusions:

Some Introductory Concepts
What is economics about?• scarcity, allocation, and trade-offs • values: total economic value: - market vs. non-market - use vs. non-use • positive vs. normative economics• environmental vs. natural resource economics• neoclassical vs. ecological economics

Some Introductory Concepts
HumanUtility and
Consumption
TechnologyCapitalLabor
Pollution
World with income XNR Economics Natural assets

Some Introductory Concepts
TechnologyCapitalLabor
Pollution
HumanUtility and
Consumption
World with income 10X
Environmental Economics
Naturalassets
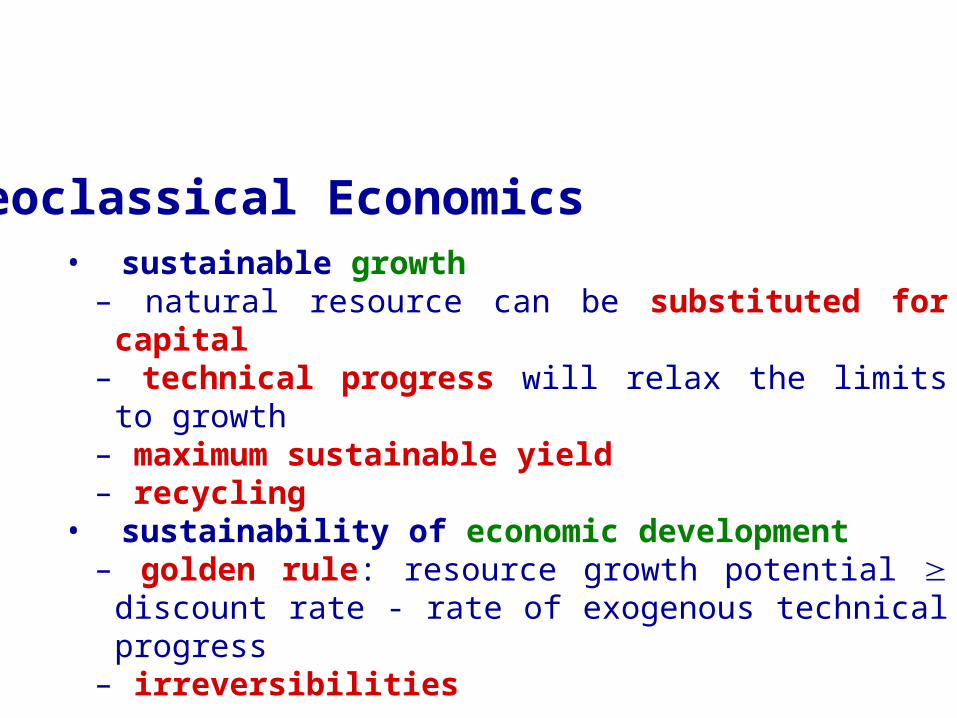
Neoclassical Economics • sustainable growth
– natural resource can be substituted for capital – technical progress will relax the limits to growth– maximum sustainable yield – recycling
• sustainability of economic development– golden rule: resource growth potential discount rate - rate of
exogenous technical progress – irreversibilities

Ecological Economics • sustainable growth
– the substitution of capital for natural resources is limited – technical progress will relax the limits to growth– functions of the environment are essentially intertwined
additional restriction on economic growth – full recycling of energy is not possible
• sustainability of economic development– continuous co-evolutionary feedback between economy and
environment – the economy has to adapt itself– economy + natural environment + culture + technology +
political system + population = ecological complex
Recalling Some Basics
Quantity (Q)
Pric
e (P
)
P1
P2
P*
Q*1 2 3 4 5 6 7
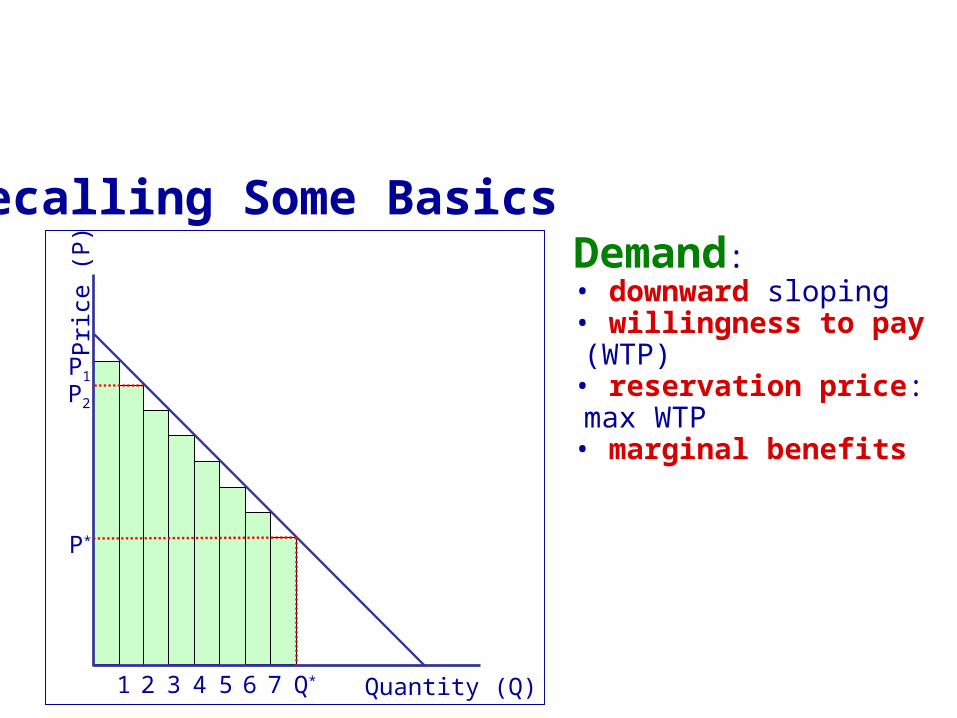
Demand:• downward sloping• willingness to pay (WTP)• reservation price: max WTP• marginal benefits
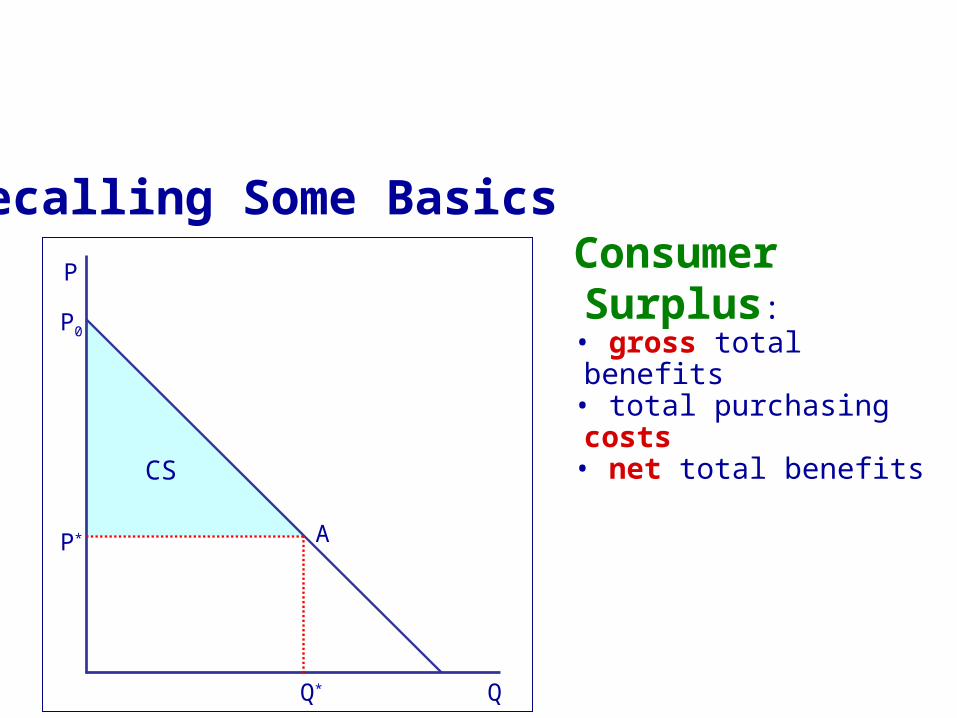
Recalling Some Basics Consumer Surplus:• gross total benefits• total purchasing costs• net total benefits
Q
P
P0
P*
Q*
CS
A

Recalling Some Basics Marginal Costs:• costs of each additional Q• MC are rising• why?• MC and supply curve
Q
TC
TC(10)
1 2 3 4 5 6 7 8 9 10
TC(9)
TC(8)
TC(7)
TC(6)TC(5)TC(4)
TC(3)TC(2)
TC(1)

Recalling Some Basics Firm equilibrium:• max MC = MR• competitive market MR = P* • why?• willingness to accept (WTA)
Q
MC
P*= MC(8)
7 8 9
Missed profits ifproducing only 7units
Lost profits ifproducing 9units

Recalling Some Basics Market supply:• horizontal sum of all firm supply curves
Q
P
P*
Q1 Q2 QT
MC1
MC2
MCT= MC1+ MC2

Recalling Some Basics Producer Surplus:• gross total benefits (revenue)• total production costs: cost of the goods sold
• net total benefits
Q
Supply = MC
P*
Q*= 8
P
PS
Cost ofgoods sold

Recalling Some Basics Market equilibrium:• market vs. individual curves • price that clears the market• why?• equilibrium price • equilibrium quantity • decentralized mechanism
Q
S
P*
Q*
P
D

Recalling Some Basics Welfare:• why to exchange?• benefits of exchanging• costs of exchanging• net social benefits• NSB = CS + PS• optimality • economic efficiency• at the equilibrium: - P = MC - WTP = MC - MB = MC
Q
S
P*
Q*
P
DCost of
goods sold
Producer surplus
Consumer surplus

Recalling Some Basics Max NSB:• max CS + PS• a competitive equilibrium is a social optimum
• Pareto optimality• FTWE: “under a set of speci-fic assumptions, any compe-titive equilibrium is Pareto optimal”
Q
S = MC
P*
Q*
P
D = MBCost of
goods sold
Producer surplus
Consumer surplus
Q*+1
A

Recalling Some Basics Market failures:• market power: e.g. monopoly• externalities: uncompensated effect on a third party, e.g. pollution, protection from floods
• ill-defined property rights: e.g. pollution, open access• public goods: non excludability + non rivalry, e.g. landscape, knowledge
• imperfect information: incompleteness or asymmetries, e.g. decisions under uncertainty, contract design (moral hazard, adverse selection)
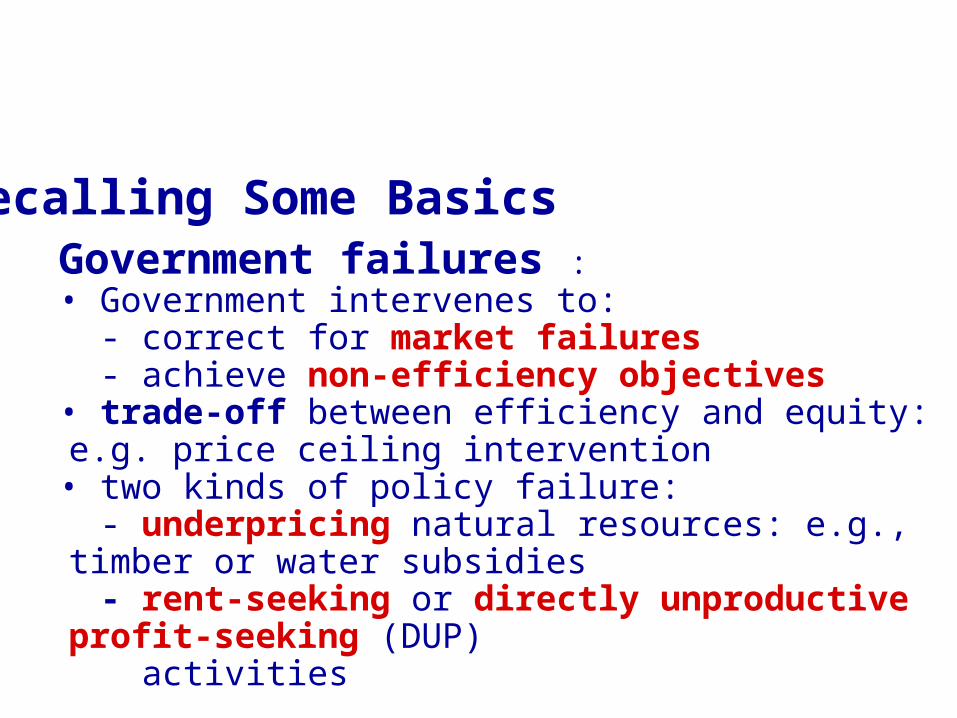
Recalling Some Basics Government failures :• Government intervenes to: - correct for market failures - achieve non-efficiency objectives • trade-off between efficiency and equity: e.g. price ceiling intervention
• two kinds of policy failure: - underpricing natural resources: e.g., timber or water subsidies - rent-seeking or directly unproductive profit-seeking (DUP) activities

Recalling Some Basics
Q
S
P*
Q*
P
D
Q1
cP1
ba
Efficiency vs. equity:price ceiling policy
PS CS Tot
-c-b -a+b -a-b
Deaweight loss (efficiency)
Distribution effect

Environmental Economics Pollution:• negative externality• social marginal costs (SMC)• private marginal costs (PMC)• total social marginal costs: TSMC = SMC + PMC
• total vs. marginal costs• internalizing a -ve externality• social vs. private optimum - no 0 pollution - balancing market and non- market goals• what if a +ve externality?• NSB = C +D + EQ
SMCP*
Q*
P
Demand
PS
QS
PMC
TSMC
A B
C
D
E

Environmental Economics Env. Improvements:• marginal benefit curve• marginal benefits of envir. improvement vs. marginal costs of pollution
• demand curve for envir. quality improvement
• WTP for environmental quality improvement
• trade-off between environm. improvement and other things we could do with income
• total benefits to the society• total benefits vs. CS
Quantity of environmentalimprovement
WTP
WTP*
E*
Marginalbenefits
A
B

Environmental Economics Env. Improvements:• marginal cost curve• environmetal improvement does not come for free
Quantity of environmentalimprovement
WTP
WTP*
E*
Marginalcosts
C

Environmental Economics Optimum level of pollution/environm. improvement:• max NSB from environmental improvement: NSB = TB – TC MB = MC • socially efficient quantity of pollution• who should enjoy the benefits and who should bear the costs?
Quantity of environmentalimprovement
WTP
WTP*
E*
Marginalbenefits
A
B
Marginalcosts
C

Environmental Economics Abatement vs. pollution damages:• Two ways to look at the same problem:- max NSB MB(A) = MC(A) - min TSC MD(Q) = MC(Q)• socially efficient quantity of pollution• who should enjoy the benefits and who should bear the costs?
Amax
MD(Q)
WTP*
MBMC
AQmax QQ*
A*
MDMC
MC(A)
MB(A)MC(Q)

Natural Resource EconomicsBiological Model:• population growth curve: X=f(t)
• logistics curve• carrying capacity: XMAX • minimum viable population: XMIN
Time
Stock (X)
XMIN
A
B
C
XMAX
X0

Natural Resource EconomicsBiological Model:• population growth rate: dX/dt =f(X)
• identify A, B and XMAX
• maximum sustainable yield• MSY highest possible harvest
XMAX
dX/dt
MSY
X0 XXMSY

Natural Resource EconomicsEconomic Model:• effort• if E X and viceversa• doubling effort does not mean doubling harvest
XMAX
dX/dtH
MSY
X0XXMSY
X1X2X3X4
H4
H3
H2
H1
E4 E3
E2
E1

Natural Resource EconomicsEconomic Model:• harvest• H=f(E) • what about X?
EMAX
H
E0EE1 E2 E3 E4
H4
H3
H2
H1
XMAXX0

Natural Resource EconomicsEconomic Model:• total revenue: TR=PH • total costs: TC=WE • single owner equilibrium: (HPROF, EPROF)
- max vs. MSY - conservation • open access (i.e. no owner) equilibrium: (HOA, EOA)
- OA vs. max vs. MSY - conservation
EMAX
TRTC
E0EEOAEPROF
HPROF
HOA
TR
TC

Natural Resource EconomicsEconomic Model:• total revenue: TR=PH • total costs: TC=WE • single owner equilibrium: (HPROF, EPROF)
- max vs. MSY - conservation • open access (i.e. no owner) equilibrium: (HOA, EOA)
- OA vs. max vs. MSY - conservation• The “Tragedy of the commons” (Hardin 1968)
EMAX
TRTC
E0EEOAEPROF
HPROF
HOA
TR
TC

Natural Resource EconomicsIntroducing time: discounting
Marginal product + Rate of capital appreciation = Discount rate
X0 P0 = V0
year 0
X1 P1 =V1
year 1
wait harvest
indifference

Property RightsCoase Theorem:• what is a property right?• Pareto improvement• sufferer’s property right• polluter’s property right• problems: - transaction costs - open access - information gathering costs - distributive impacts
Qmax
MNPB
A
O Q*
MEC
F
G
HI
JE
B
C
D

Resource Management Regimes• private: - individuals have a duty to observe the rules of use determined by the controlling agency - the agency has the right to determine those rules
• state: - individuals have the right to undertake socially acceptable uses and a duty to refrain from unacceptable uses - others have a duty to respect individual rights
• common: - a management group has the right to exclude non-members - non-members have a duty to abide that exclusion - co-owners comprise the management group and have rights and duties related to the use of resources
• open access (no property): - no users or owners are defined - individuals have the privilege but not the right to use resources

Renewable Resources and Games • prisoners’ dilemma game: - non-cooperative game - isolation - no binding agreement - the resource must be privatized or be subject to some form of state regulation and control
• assurance game: - cooperative game - interdependence - binding agrrement - overexploitation of renewable resources in open access and common property situations can be solved by cooperative agreement
• extensions: - incentives/institutions - repeated over time - no single regime is universally best suited to the wise NR management

Economic Instruments for Envir. Policy Pigovian tax:• optimal tax• need to know: - MNPB - MEC
• information aymmetries?
Q
MNPB
O Q*
MEC
(MNPB – t*)
t*
CostsBenefits

Economic Instruments for Envir. Policy Pigovian tax:• low-cost solution to standard setting
• standard at S2: TACst = OAS2 + OBS2 + OCS2
• tax t*: TACtax = OXS1 + OBS2 + OYS3
• TACst - TACtax = S1XAS2 - S2CYS3
• S1XAS2 > S2CYS3 TACst > TACtax AbatementO S1
MAC3
t*
CostsTax
MAC2
MAC1
A
B
C
X Y
S2 S3

Why to Prefer Environmental Taxes? • directly into the prices of the goods, services or activities
polluter-pays-principle• create incentives for producers and consumers• more cost-effective pollution control than regulations• spur to innovation • raise revenues which can be used directly to improve the
environment
Why Are Envir. Taxes Not Widespread? • uncertainty about the justice of Pigovian taxes• lack of knowledge of the damage function

Economic Instruments for Envir. Policy Envir. Standards:• command-and-control• need to have: - monitoring agency - penalties
• only by accident optimal• for being optimal: - standard at Q*
- penalty equal to P* - certainty of penalty
Qmax
MNPB
P*
O Q*
MECS
P
Qst QB
CostsBenefits

Taxes vs. Standards • taxes as least-cost solutions • taxes are dynamically efficient• administrative costs?• outright prohibition

Economic Instruments for Envir. Policy
Marketable Permits:• Q*: optimal number of permits• P*: optimal price of permits• S* is the supply curve• MAC curve = demand curve
Q2
MAC
P*
O Q*
MEC
S*
P1
Q1
Permitprice,Costs

Economic Instruments for Envir. Policy
Marketable Permits:• cost minimization • low-cost polluters sell permits and high-cost polluters buy them
Q2
MACT
P*
O Q*
MAC2
S*
Q1
Permitprice,Costs
Pollutionpermits
MAC1

Economic Instruments for Envir. Policy
Marketable Permits:• new entrants • opportunities for non-polluters• inflation and adjustment costs • technological ‘lock-in’ • spatial issues • types of permit systems: - ambient permit system (APS) - emissions permit system (EPS) - pollution offset (PO) system
D
P**
O Q*
S*
Permitprice,Costs
Pollutionpermits
P*
D’
IncreasedGov’t supplyof permits
Reduced Gov’t supply,environmental reservegroups purchase

Agricultural Pollution
Non-Point Source Pollution:• spatial diffusion • high variability: in space and time - polluter’s responsibility (who?) - pollution level at the source (how much?)
- ecological and economic damage caused (how?)
traditional instruments cannot be used

Agricultural Pollution
Input-based instruments:• input taxes and subsidies - the regulatory agency should know the private
production function, but - information asymmetries• input proxies and empirical models - information asymmetries
- other uncertainties

Agricultural Pollution
Ambient-based instruments:• concentration of pollutant in the environment • collective penalties - Segerson’s (1988) scheme, but - likely penalization of farms if close to the optimum
- dynamic incentive disappears - costs of information and monitoring borne by farmers

Cost-Benefit Analysis What is Cost-Benefit Analysis (CBA)?CBA is a set of operational rules, that guides public choice among several project alternatives• CBA is a method to make decisions • decision-making involves always more than one alternative (at least two: with and without)• the evaluation process is made comparing advantages and disadvantages • advantages and disadvantages are evaluated with reference to certain objectives • CBA is applied mainly in the public sector

Cost-Benefit Analysis Two types of analysis• private sector: financial analysis• public sector: economic and social analysis different objective function different contents same evaluation phases and decision rules
Decision-maker
Objective
Evaluation
Decision rules
PUBLIC PRIVATE
max NSB max
SB, SC, SRD R, C, r
NPV, B/C, IRR NPV, B/C, IRR

Cost-Benefit Analysis Financial analysis vs. economic analysis
QS
TR
PMC
TSMC
QP
CostsRevenues
Q
SMC=EC
Revenues
Costs
FinancialAnalysis
EconomicAnalysis

Cost-Benefit Analysis Why Cost-Benefit Analysis? • because the market fails to reach the social
optimum • to overcome the paternalistic approach at public
policy

Cost-Benefit Analysis How CBA must be carried out? • two fundamental principles:
- welfarism: individual preferences - Pareto principle: potential Pareto improvement
• two issues: - how to compare different individual welfare status? Kaldor-Hicks compensation criterion- how to measure the impacts of different alternatives? Money as numeraire

Discounting Why do we need discounting? • projects usually have a duration longer than 1 year• current consumption is valued higher than future
consumption (inter-temporal preference)
How to discount? • cash flow: stream of benefits and costs on the time scale• how much a future amount of money is worth today:
Vn=V0·(1+r)n V0=Vn·(1+r)-n

Discounting Discounted cash flow
Cash Flows (nominal and discounted values), r=10,00%
Year (t) Ct Bt NBt (1+r)-t DCt DBt DNBt
0 1,000 0 -1,000 0.000 1,000 0 -1.00
1 385 858 473 0.909 350 780 430
2 363 823 460 0.826 300 680 380
3 346 785 439 0.7513 260 590 330
4 337 747 410 0.6830 230 510 280
5 322 725 403 0.6209 200 450 250
Total 2,753 3,938 1,185 2,340 3,010 670

Investment Criteria Net Present Value (NPV) sum of all items in a discounted cash flow, i.e. it is the value obtained summing all discounted net benefits
CBr
CB
r
NB n
tttt
n
tt
t
00 11
NPV
decision rules:• acceptability: NPVi i• choice: NPVi
* NPVj i j
It is a monetary value It depends on the value of the discount rate (exogenous)

Investment Criteria Benefit/Cost Ratio (B/C) ratio between the sum of discounted benefits and the sum of discounted costs
decision rules:• acceptability: B/Ci 1 i• choice: B/Ci
* B/Cj i j
n
t
tt
n
t
tt
rC
rB
0
0
1
1CB
It is a pure number It depends on the value of the discount rate (exogenous)

Investment Criteria Benefit/Cost Ratio (B/C) the discount rate that yields NPV equal to 0 or B/C equal to 1
decision rules:• acceptability: IRRi r i• choice: IRRi
* IRRj i j
It is the average yearly return of a given investment It does not depend on the value of the discount rate (?)
1
1
1CB0
1NPV:=IRR
0
0
0
n
t
tt
n
t
ttn
tttt
rC
rB
r
CBr
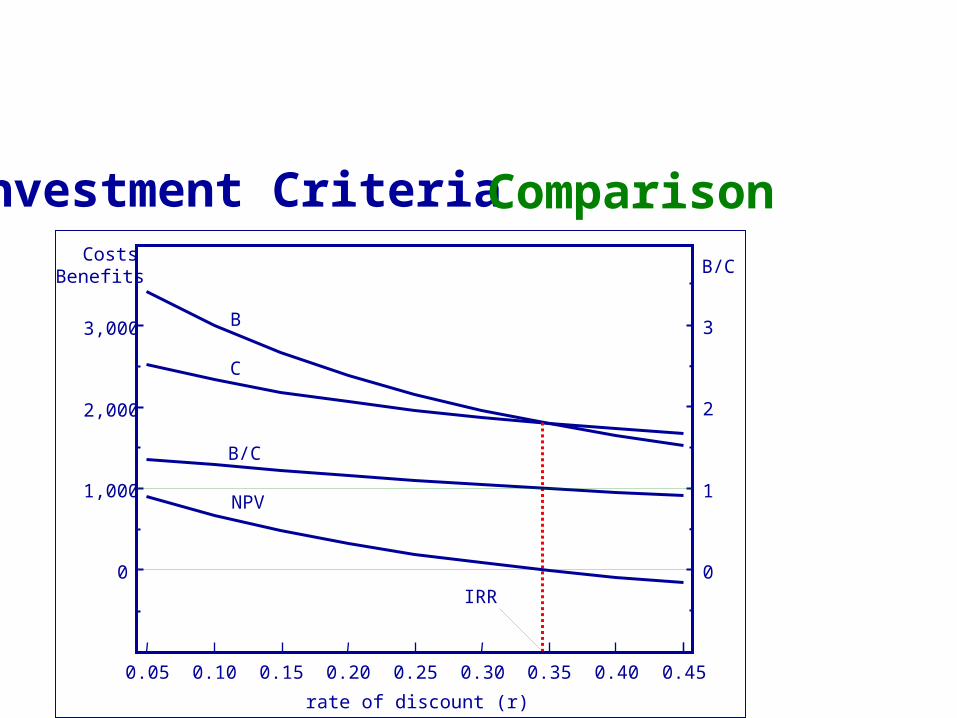
Investment Criteria Comparison
0.05 0.10 0.15 0.20 0.25 0.30 0.35 0.40 0.45
0
1,000
2,000
3,000
rate of discount (r)
CostsBenefits
0
1
2
3
B/C
B/C
NPV
B
C
IRR

Investment Criteria Comparison
Criteria Meaning Ideal Application Drawbacks
NPV
Absolute num-ber, difference between disco-unted benefits
and costs
Unconstrained resources Independent alternatives Existence of a reference discount rate Less risky projects
Max profitability in absolute terms Does not reflect the risks of “big” projects
B/C
Pure number, benefits per
unit of invested capital
Limited resources Independent alternatives Existence of a reference discount rate
Depends on how costs and benefits are defined (i.e. gross or net)
B/C increm.project
“
Limited resources Dependent alternatives Existence of a reference discount rate
Depends on how costs and benefits are defined (i.e. gross or net)
IRRYearly average rate of return
Lack of a reference discount rate
Possibility of more than one IRR Depends on the project length

Sensitivity Analysis • CBA abuse can be rampant • SA is explicit discussion of the sensitivity of NPV and B/C
ratios to changes in- assumptions- figures- calculation methods
• highlight all parts of an analysis that may be controversial or uncertain
• provide scenarios based on range of those figures• it should be automatic in any good CBA

Total Economic ValueWhat does environmental valuation mean?• Valuation means monetary valuation• WTP or WTA preferences• economic value measurements help to identify the
social optimum:- ex ante, i.e. before deciding on environmental regulation- ex post, i.e. after a regulation has been imposed
• demand curves: Marshallian vs. Hicksian• exact measures: compensating vs. equivalent

Total Economic Value
Synopsis of Exact Measures for the Monetary Evaluation of Environmental Quality Change
Implicit property
rights
Environm. improvement
Environm. worsening
Hicksian measuresRef. conds. (environm.
quality)
Refer. utility
(welfare)
Individual accepts the
change
Max WTP to secure a benefit
Min WTA to tolerate a
loss
Compensating var.Compensating surplus
POST PRE
Individual doesn’t accept
the change
Min WTA to forego a benefit
Max WTP to prevent a
loss
Equivalent variationEquivalent surplus
PRE POST

Total Economic ValueA taxonomy of components

Total Economic ValueTEV and Decision-Making • Damage and benefit are obverse sides of the same
concept • Cost-benefit analysis:
- proceed with the development: (BD - CD - BP) > 0
- do not develop : (BD - CD - BP) < 0
• TEV measures BP

Total Economic ValueEvaluation Techniques• Indirect:
- change in the vector of price: HPM- change in the vector of quantities: TCM
• Direct:- hypotetical: CVM- experimental
• weak complementarity condition

Evaluation techniquesHedonic price method (HPM)• look for a market in which private goods (e.g. real
estate) or factors of production (e.g. labour), that are linked to the environmental good through a complementarity relationship, are bought and sold
• the good is fully described by its attributes, which influence the price of the good
• example: real estate property

Evaluation techniquesHedonic price method:• PP = f (PROP, NHOOD,
ACCESS, ENV)• implicit price for the one unit
of the environmental characteristic: PP/ ENV
• marginal WTP
Environmentalquality
Propertyprice
Slope of PP
P
P

Evaluation techniquesTravel cost method (TCM)• whenever the consumption of an environmental
good involves some travel costs• visitors to a given natural area enjoy an amount of
gross benefits at least equal to the costs they incur• knowing travel costs, it is possible to infer the use
value of the natural area • example: outdoor recreation

Evaluation techniquesTravel cost method:• two step procedure: I) Kj=ixij/Aj= ifi(TCij, wij) II) demand for OR:
x(P)=ijAjfi(TCij+P, wij)• use value of OR:
V=ijAj 0P* fi(TCij+P, wij)dP where P* is the reservation price, i.e. fi(TCij+P*, wij)=0
Travelcosts
TC3
K2
D
K1K3
TC2
TC1
Attendancerates
A
B
C

Evaluation techniquesContingent valuation method (CVM)• use survey questions to elicit WTP for provision of
an environmental good • hypothetical market:
- description of the good - hypothetical circumstances (level of provision, payment vehicle, available substitutes, etc.)- questions to elicit WTP
• also respondent’s characteristics benefit transfer• example: any environmental good

Evaluation techniquesCVM formats:• open-ended:• iterative bidding game• payment card• close-ended, single bounded• close-ended, double boundedINITIAL BID
$ 100WTP
$ 100 ?
YES
NO
WTP$ 50 ?
WTP$ 200 ?
YES
max WTP ?
WTP$ 400 ?
NO
WTP$ 25 ?
NO
max WTP ?NO
max WTP ?NO
max WTP ?YES
max WTP ?YES
max WTP ?YES
$ 400
$ 200
$ 100
$ 50
$ 25

Evaluation techniquesCVM formats:• open-ended:• iterative bidding game• payment card• close-ended, single bounded• close-ended, double bounded
1.0
0 $
Probability ofbeing WTP
E[WTP]

Evaluation techniquesCVM formats:• open-ended:• iterative bidding game• payment card• close-ended, single bounded• close-ended, double bounded
1.0
0 $
Probability ofbeing WTP
A
B
C
D
B2B1B3 YYYNNYNN

Evaluation techniquesCVM issues• Reliability: extent to which the variance of an
estimate, such as mean WTP, is due to random sources survey design
• Validity: extent to which an instrument measures the concept under investigation, i.e. presence of systematic errors (bias) - strategic bias incentive compatibility - hypothetical bias scenario - design bias ordering & wording; focus groups/pre-test

Evaluation techniques
Conclusions• Indirect: only if weak complementarity only use
values• Direct: all components of TEV CVM more
versatile tool
How important is to estimate single TEV components?Operationally we focus on the TEV of a resource, not on its components