Fannie Mae Working Paper: How Much Do U.S. Households...
22
1 How Much Do U.S. Households Know About Qualifying for a Mortgage? Li-Ning Huang Fannie Mae Michael LaCour-Little (contact author) Fannie Mae & California State University-Fullerton [email protected] Mark Palim Fannie Mae Ying Pan Fannie Mae March 31, 2017 Abstract We employ survey research to assess the level of consumer understanding of the single-family mortgage lending process. In addition to assessing understanding of key elements of the mortgage process (including down payment, credit, and debt-to-income ratios) we also gauge overall sentiment regarding the housing market. Results show a significant lack of understanding about minimum mortgage qualification criteria not only among consumers in general but, more importantly, among renters who plan to purchase a home within the next five years. Key words: mortgage, home purchase, financial literacy
Transcript of Fannie Mae Working Paper: How Much Do U.S. Households...

1
How Much Do U.S. Households Know About Qualifying for a Mortgage?
Li-Ning Huang
Fannie Mae
Michael LaCour-Little (contact author)
Fannie Mae & California State University-Fullerton
Mark Palim
Fannie Mae
Ying Pan
Fannie Mae
March 31, 2017
Abstract
We employ survey research to assess the level of consumer understanding of the single-family mortgage
lending process. In addition to assessing understanding of key elements of the mortgage process
(including down payment, credit, and debt-to-income ratios) we also gauge overall sentiment regarding
the housing market. Results show a significant lack of understanding about minimum mortgage
qualification criteria not only among consumers in general but, more importantly, among renters who
plan to purchase a home within the next five years.
Key words: mortgage, home purchase, financial literacy

2
1. Introduction
Almost a decade after the housing crisis, home prices in the U.S. have fully recovered to pre-crisis
levels in most markets. Homeownership rates, however, continue to decline with the latest reported level
at 63.7%, the lowest since 1965. Figure 1 depicts the homeownership trend together with the S&P/Case-
Shiller U.S. National Home Price Index. Young adults and minority groups have experienced the greatest
declines in homeownership across the population. Concurrently, lower income groups continue to face
sizable barriers to homeownership. For example, households in the bottom income quintile have a
homeownership rate of 30%, as opposed to 87% for the top income quintile (Fuller, 2015).
Millions of households who experienced foreclosure become renters while few renter households
have entered, or re-entered, homeownership during the more recent recovery period. These two factors
explain at least half of the decline in homeownership rate since the peak (Spader and Herbert, 2016).
Multiple reasons contribute to the depressed homeownership rate. Among these is housing affordability.
Stagnant income growth in contrast to steadily increasing housing prices since the crisis have limited
homeownership (Fry and Brown, 2016). Increasing income volatility may have also played a role even in
those markets where prices remain affordable (Davidoff, 2005; McCarthy, 2014). In fact, unstable income
as the result of unemployment or underemployment (part-time jobs replacing full-time jobs) has a greater
negative impact on millennials’ homeownership than does student debt (Terrazas, 2014). An additional
explanatory factor may be tighter underwriting standards. While the loan approval rate for conventional
home purchase applications increased between 2004 and 2015, the volume of such applications fell
dramatically, partly because lending to low-credit consumers has tumbled. Conventional purchase loan
application volume fell 58% from 2004 to 2015 with some minority groups experiencing even larger
declines (Fry and Brown, 2016). Concurrently, there has been a shift toward government lending.

3
Some commentators contend that credit standards today are simply too tight. Bai, Li and Goodman
(2015) argue that aggregate mortgage credit is only about half the level as that during 2001-2003, before
the well-documented surge in riskier lending that occurred during 2004-2006. In contrast, others argue
that in some segments of the market (especially FHA), credit standards are too loose (Pinto, 2012). While
credit suppliers continually innovate in an effort to expand the market while maintaining loan quality,
relatively little is known about how much credit users actually understand about the boundaries of
existing standards.
To better understand this issue, Fannie Mae initiated a nationwide survey in 2015 to measure
consumers’ knowledge of mortgage qualification requirements. The survey finds that there is a significant
lack of understanding regarding key mortgage qualification criteria not only among consumers in general
but also among renters who plan to purchase a home within the next five years. Moreover, this lack of
knowledge about mortgage qualification is even more pronounced among lower income and minority
populations. These findings suggest that consumer education and counseling may play an important role
in advancing homeownership opportunities.
Consumer finance, generally, is already a market replete with information asymmetry. This
asymmetry contributes to market inefficiency. While lenders attempt to develop mortgage products
tailored to consumer demand, individuals may not have adequate knowledge to recognize and evaluate
these products. If consumers were better informed, they would potentially be more likely to become
buyers. Thus the mortgage industry may wish to improve consumers’ knowledge, not only to support
Americans’ homeownership aspirations, but also for sake of their own profitability (Aren, 2014). In this
paper, we attempt to position mortgage knowledge in the context of financial literacy more broadly.
The balance of the paper is organized as follows: Section 2 reviews the literature, both on financial
literacy, broadly, and on mortgage knowledge and counseling, specifically. Section 3 describes the survey
4
process and resulting data. Section 4 presents key findings. Section 5 concludes and offers additional
avenues for further research.
2. Literature Review
Although, to our knowledge, no research has directly examined the relationship between consumers’
knowledge of mortgage qualification and homeownership decisions, we can establish some baseline
knowledge from the larger body of work on financial literacy. Financial literacy may be broadly defined
as an individual’s ability to understand and make use of financial products and concepts (Lusardi and
Mitchell, 2007). Existing measures of financial literacy are dominated by test-based assessment of
knowledge regarding financial concepts, such as risk, inflation, interest and compound interest
(Fernandes, Lynch and Netemeyer, 2014)1.
There is abundant research on the relationship between financial literacy and financial behavior. Low
levels of financial literacy are associated with poor preparation for retirement (Lusardi and Mitchell,
2007), limited wealth accumulation (Van Rooij, Lusardi and Alessi, 2012), portfolio under-diversification
(Guiso and Jappelli, 2008), low levels of participation in equity markets (Van Rooij, Lusardi and Alessi,
2011), use of higher cost mortgage debt (Moore, 2003, and Lusardi and Tufano, 2009), and higher rates
of bankruptcy and foreclosure (White, 2007).
One paper specifically focuses on mortgage knowledge among existing homeowners. Bucks and
Pence (2008) investigated mortgage borrowers’ knowledge of loan terms. They compared household self-
reported information from the 2001 Survey of Consumer Finances to lender-reported data, finding that
some borrowers with adjustable-rate mortgage borrowers, especially those lower incomes, appear to
1 For example, test takers might be asked “Suppose you own $100 in a savings account earning 2 percent interest a year. After five years, how much would you save? – More than $102; exactly $102; less than $102; or don’t know.”
5
underestimate or not know how much their interest rates could change in the future. Clearly, such lack
of knowledge could leave households poorly prepared when rate changes do occur.
Despite apparent consensus that inadequate financial knowledge has costly consequences, another
strand of research finds mixed evidence that interventions, such as high school courses, counseling and
seminars, effectively improve consumer choice in financial matters. For instance, Bernheim, Garrett, and
Maki (2001) find that high school financial education requirements significantly increases asset
accumulation when participants reach adulthood. However, Cole and Shastry (2009) uses a large dataset
and find no impact from such education mandates. Avila, Nguyen and Zorn (2013) conclude that pre-
purchase homeownership counseling run by Freddie Mac effectively reduces delinquency rates among
first-time home buyers. Agarwal et al. (2010, 2014) study two mortgage counselling programs
implemented in Indiana and Illinois. One finds the Indiana counselling program reduces ex-post
delinquency among program graduates; while the Illinois program does not materially change the contract
choices of low FICO borrowers. An explanation often offered to these otherwise puzzling results on
financial education is the endogeneity of financial literacy. Both Aren (2014) and Fernandes, Lynch and
Netemeyer (2014) point out that uncontrolled personal characteristics, including risk aversion, time
preferences, and self-esteem, could all affect financial literacy and behavior simultaneously. Mallach
(2000) notes that, among a number of difficulties in rigorously measuring the effectiveness of
homeownership education and counseling, one challenge is that counseling is sometimes a mandatory
element for some mortgage programs. Under such circumstances, a well-designed control group is near
impossible. Similarly, some counseling participants may drop out creating treatment effect data censoring
problems (Moulton, Haurin and Shi, 2015).
However, these issues do not necessarily mean that financial education programs cannot be
successful. Rather, interventions might target specific populations that have the best chance of success.
We believe this paper is the first to carefully document consumer mortgage knowledge among consumers,
6
including both current and potential mortgage borrowers.2 Results can help lenders and others, such as
real estate agents and education providers, target populations most likely to benefit, enhancing mortgage
market efficiency.
3. Survey Methodology and Data
During June 29 – July 15, 2015, Fannie Mae conducted a nationwide survey to understand consumers’
perceptions about mortgage qualification process, their attitude toward homeownership, and their
sources of information and use of technology to obtain that information. A total of 3,868 American adults
participated in the survey. Each adult had to be either the sole or joint financial decision-makers in their
households (we refer to them throughout the remainder of the paper as consumers) to be qualified to
participate. The surveyed population were recruited from KnowledgePanel®, the largest online panel that
is representative of the U.S. adult population, developed by GfK, a global market research company. Out
of the 3,868 consumers, minorities and those who self-reported a “good” credit score were oversampled
to ensure robust analysis results for these subgroups. The surveyed population was then weighted to
reflect Current Population Survey benchmarks. Table 1 presents descriptive demographic statistics on
survey participants including gender, age, race and ethnicity, educational attainment, household income,
marital status, having children or not, homeownership status and region. By design, the sample surveyed
is representative of the U.S. adult population as a whole.
The survey was conducted through an online questionnaire. Non-internet households that were
selected for the sample were provided by the survey firm (the Gfk company) with a web-enabled
2 Two other surveys, National Survey of Mortgage Origination (NSMO) and American Survey of Mortgage Borrowers (ASMB), jointly conducted by Federal Housing Finance Agency (FHFA) and the Consumer Financial Protection Bureau (CFPB), survey borrowers who have already taken on mortgages to gather information on their experience in searching for, and servicing their loan over time.

7
computer and free internet service to complete the survey. Participants were expected to complete the
survey in 15 to 20 minutes, answering about 41 questions3, covering a wide range of topics regarding
housing and mortgages, including homeownership, their understanding of mortgage qualifications, their
sources of information and advisors, the mortgage process, and use of mobile technology. Examples of
questions are included in the Appendix. The multiple-choice questions include the option of “don’t know,’’
in order to avoid guessing. Aren (2014) argues that this is the preferred approach to measurement of
financial knowledge. The survey was available in both English and Spanish.
4. Results
4.1 Knowledge about Mortgage Qualifications
The survey tested consumers’ knowledge on three critical underwriting requirements: down
payment, credit score, and debt-to-income ratio. In general, results show that consumers’ knowledge in
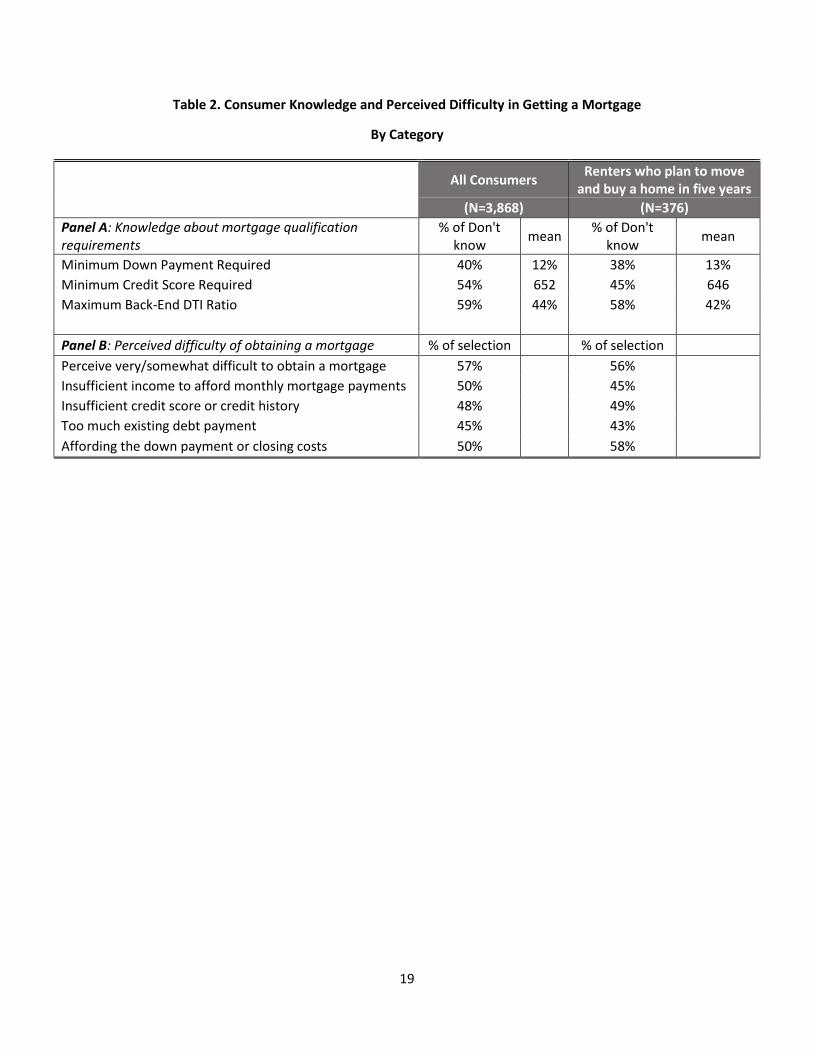
all of these areas is poor. Panel A in Table 2 presents descriptive statistics. About 40% of consumers didn’t
know what minimum down payment was required by lenders. Even among the renters who plan to move
in five years and would buy a house, accounting for 8.3% of survey participants, the “don’t-know” rate is
38%. The average perceived minimum amount of down payment among those who were able to give a
numerical answer is 12% of a house value, much higher than the actual minimum requirement. Three
quarters of consumers were unaware of the 3-5% down payment programs, including FHA and GSE
programs. This is all the more notable as FHA has had a 5% down payment program since 1980s and GSEs
since 1990s. When asked about the minimum FICO® score required by lenders, 54% of consumers either
responded “don’t know” or provided a number outside of the FICO® range.4 The average perceived
3 The questionnaire includes 33 multiple-choice questions and the remaining eight require specific numeric answers. 4 The percentage of consumers who don’t know their own FICO® or offer an out-of-range number is 49%. The range is 300-850.
8
minimum credit score requirement is 652, 32 points higher than the actual GSE eligibility standard of 620.
Among the renters who plan to move and buy a house within five years, 45% either didn’t know the
minimum credit score requirement or offered an out-of-range number. Among this group, the average
perceived minimum credit score is 646. The percentage of people who don’t know the maximum back-
end debt-to-income (DTI) ratios is 59%. On average, consumers who chose a numerical answer believe
that the maximum allowed back-end DTI is 44%, remarkably close to the actual requirement of 43% under
CFPB’s Ability-to-Repay and Qualified Mortgage Rule.5 However, variation of belief is so wide that only 5%
of consumers chose a number between 40 and 49%. Understanding of DTI among those who plan to move
and buy within five years is just as poor as that of general population.
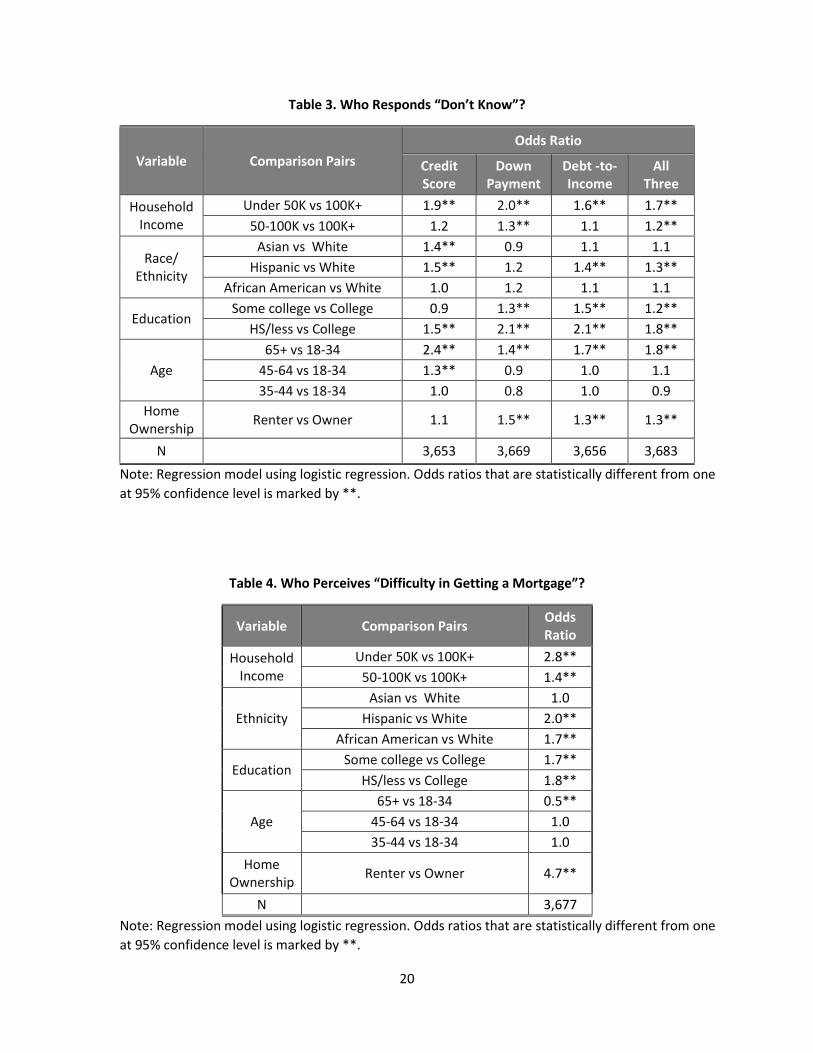
Table 3 presents the results of logit model regression analysis to assess demographic factors
associated with “don’t know” responses to questions regarding to minimum down payment, credit score
and DTI. In addition to examining the three aspects separately, we also examined who respond “don’t
know” to all three questions, which is presented in the last column of Table 2. Individual characteristics
include household income, race and ethnicity, educational level, age, and home ownership status. The
results show that lower household income, lower levels of educational attainment, and retirement age
strongly predict the “don’t know” response. Characteristic such as household income under $50k, high
school or below education and age above 65, each increases the probability of not knowing any of the
three mortgage requirements by 70-80% relative to the reference population with household income
above $100k, college education or younger age groups (between 18-34). Household income between
$50k and $100k and some college education increased the probability of responding “don’t know” by
20%. Hispanics are 30% more likely than whites to say “don’t know.” Note that African American’s
knowledge about mortgage criteria are not statistically different from whites.
5 Fannie Mae’s maximum allowable DTI as of 2015 is 45%, with flexibilities offered up to 50% for certain loan casefiles with strong compensating factors. Fannie Mae also allows the maximum DTI ratio to exceed 45% if the loans meet government mortgage loans requirement.

9
Renters are 30% more likely than home owners to choose the “don’t know” option. The difference
between renters and homeowners is not large. This is partially because even homeowners do not
necessarily have good knowledge about mortgages qualification requirements. For example, 44% and 50%
of home owners with an existing mortgage don’t know the minimum credit score and DTI requirement.
Their knowledge of minimum down payment is slightly better, with only 28% said “don’t know”, as
opposed to 48% among renters.
4.2 Housing Attitudes
Nearly eight in ten consumers thought at the time the survey was conducted (mid 2015) that it was a
good time to buy a house. Favorable mortgage rates, identified by half consumers as the primary reason
for their positive attitude, is far more popular than the next reason (a large inventory of supply), selected
by 19% of consumers. About seven in ten consumers plan to buy a home next time when they move.
Despite that optimism, however, consumers are quite skeptical about their ability to obtain a mortgage
loan. When asked whether they think it is easy or difficult to get a mortgage, more than half (57%) of
consumers say either “very difficult” or “somewhat difficult.”6 Among those who plan to move and buy a
home within next five years, the same perceived difficulty persists. Panel B in Table 2 presents the
descriptive statistics on consumers’ perceived difficulty in getting a mortgage.
Consumers who perceived difficulty are asked to choose three reasons. The four most often selected
reasons are as: insufficient income to afford monthly mortgage payments; insufficient credit score or
credit history; too much existing debt; and lack of funds for the down payment and/or for closing costs.
“Lack of job security or stability” was the fifth most often selected explanation, for 32% of respondents.
It is worth of noting that the second to fourth reasons are exactly the three underwriting requirements
about which consumers believe standards are higher than they actually are. This suggests that if
6 This question is designed on a four-point scale: very difficult, somewhat difficult, somewhat easy and very easy.

10
consumers were better informed, they might be more confident of their ability to accomplish their home
ownership goals.
Table 4 presents a logistic regression analysis of who is more likely to respond that it will be “very” or
“somewhat difficult” to obtain a mortgage. The results again show that lower-income, lower-education,
and minority consumers perceive greater difficulty. Households with incomes under $50k or between
$50k and $100k are, respectively, 2.8 times and 1.4 times as likely as households with incomes of at least
$100k to consider that it is difficult to get a mortgage. Not having a college degree increases the
probability of perceiving difficulty by 70-80%. Hispanics are twice as likely as whites to say it is difficult.
Interestingly, African Americans are 1.7 times as likely as whites to say difficult, despite the fact that their
knowledge about mortgage qualifications is no worse than whites. Similarly, consumers who are 65 or
older are actually 50% less likely than their younger counterparts to think that getting a mortgage is
difficult, suggesting an experience factor at work. In contrast, results reported earlier indicated that
people who are 65 or older actually know less than do younger consumers about mortgage qualifications.
These results suggest that factors other than lack knowledge may lead some consumers to believe that it
would be difficult for them to obtain a mortgage.
The most substantial difference is between renters and homeowners. Renters are 4.7 times as likely
as homeowners to deem getting a mortgage difficult, which is not hard to believe since most homeowners
were at least some point successful mortgage applicants7. About 19% of home owners say either “very
difficult” or “somewhat difficult”, as opposed to 69% among renters and 32% among first-time home
buyers. Apparently, experience increases consumer’s confidence in their ability to obtain a mortgage.
7 This observation is not universal, of course. Some homeowners may have obtained their homes through inheritance, marital dissolution or paid in cash, which would not necessarily have required them to ever have been mortgage borrowers.
11
4.3 Source of Advice and Use of Technology
The survey also asked consumers to pick their three most influential sources of advice when getting a
mortgage for home purchase or refinance. Lenders are the most influential, with 64% of consumers
selecting that choice as one of the top three. The second most influential source of advice are family and
friends, chosen by 50% of consumers, followed by real estate agents, chosen by 47% of consumers. The
survey also asks consumers to indicate three information sources they read, see or hear the most often
when getting mortgages. Lenders are again the most prominent source of information, chosen by 58% of
consumers, followed by real estate agents, and the media. However, the media is considered far less
influential in terms of personal source of mortgage advice. This suggests that consumers may acquire
general housing and mortgage market information through the media but when they need to make
personal mortgage decisions, they turn to individuals with whom they can build trust and have personal
communications. The survey also asks consumers what their key criteria are when choosing a lender.8 The
top two criteria selected are that “the lender is one I can trust” and “opportunity to meet face to face”,
with respectively 56% and 35% of participants considering those factors “extremely important.”
Table 5 presents results of logistic regression analysis of the demographic factors that are associated
with consumers’ choice of the most influential source of advice on getting a mortgage. Each of the five
columns in the table show who are more likely to rank lenders, real estate agents, family and friends,
government agencies or non-profit counselors as one of their top three most influential advisors. Results
show that lower income households are more likely than higher income households to rely on government
agencies or non-profit counselors, perhaps because such entities have already had programs in place.
There are notable difference in choice of the most influential source of advice by race and ethnicity. Asian
Americans are more likely to rely on friends or family members, while Hispanics and African Americans
8 This question is measured on a five-point scale: extremely important, very important, somewhat important, not important, and not at all important.
12
are more likely to seek advice from real estate agents, government agencies and non-profit counselors.
Results also show that while educational attainment does not affect choice of the most influential source
of advice, age does. As age increases, consumers are more likely to choose lenders and less likely to rely
on friends’ or family members’ advice. This implies that, within a family, mortgage advice may be passed
from the older to younger generations, consistent with the finding of Bond and Eriksen (2016) that
homeownership has an intergenerational effect from parents to children.
Through the survey we also investigate consumer use of mobile technology. Although over nine in
ten consumers use or own at least one mobile device, fewer than three in ten use the devices for financial
matters. The use of mobile devices for housing and mortgage related matters is even less popular.
However, consumers appear to believe that they will use mobile devices more in the future for financial
or mortgage shopping. The interest is stronger among minorities than non-Hispanic whites. Roughly one
third of Hispanics and Asian Americans, as opposed to about a quarter of general population, indicate that
they would like to use a mobile device in the future to check current interest rates, perform mortgage
calculations, research homes for sale, obtain and compare mortgage quotes, and receive homebuyer
educational materials. About one fifth of African Americans and Hispanics, as opposed to 13% of general
population, would like to use a mobile device in the future to fill out a mortgage application and submit
documents to lenders. Given the demographic shifts that are taking place in the U.S. these findings
emphasize the importance of what may be called the digital channel for the mortgage industry of the
future.
5. Conclusions
There appears to be a significant gap between consumer optimism about the housing market on the
one hand and the recently declining home ownership rate on the other. In order to better understand
consumer knowledge about mortgage qualifications and the path to obtaining a mortgage, Fannie Mae
13
conducted a national survey that is representative of all U.S. households. The survey finds a significant
lack of knowledge among consumers regarding the basics of mortgage requirements. About half of all
consumers, and around one third of those who plan to buy a home in the next five years, do not
understand minimum down payment, minimum credit score, or maximum debt-to-income requirements.
Even among those who were able to provide numerical answers, the variance in answers is wide.
Moreover, the mean of the perceived requirements of mortgage qualification are considerably more
stringent than the actual underwriting requirements by GSEs. These findings suggest that there may be
room to expand access to credit while maintaining credit quality by addressing consumers’ knowledge
gap. Given that it can take years to improve one’s credit score or save for a down payment, correcting
consumer misconceptions may be a more efficient approach to expanding homeownership opportunities
by encouraging households who may already be qualified to own homes. Optimistically, the large share
of “don’t know” responses may not be entirely bad news either as it may well be easier to provide new
knowledge than to reverse strongly held misconceptions. In this paper we have also shown that weak
mortgage knowledge is greater problem for renters, lower-income, less-educated and minority
households.
Another key finding of the survey is that lenders are viewed as the most important source of
information and the most influential source of advice to consumers about getting mortgages. This
suggests that lenders can play a central role in improving consumer understanding of mortgage
requirements. Our results indicate that for Hispanics and African Americans, in addition to lenders,
realtors, government agencies and non-profit counselors are influential. Therefore, such organizations
can also be valuable partners in deployment of home buyer education. Lastly, mobile technology can be
also utilized to assist mortgage shopping, application, and education.
Useful follow-up research could survey both recent successful homebuyers and unsuccessful
mortgage applicants, especially among the first-time home buyer population, lower income, less-

14
educated and minority households, to determine what worked for them and what barriers throughout
the process they may have encountered. Such surveys might also address home buyer education
programs to investigate how participation may have affected home purchase and mortgage choices.

15
References
Agarwal, Sumit, Gene Amromin, Itzhak Ben-David, Souphala Chomsisengphet, and Douglas D. Evanoff. 2009. “Do Financial Counseling Mandates Affect Mortgage Choice and Performance? Evidence from a Legislative Experiment.” Federal Reserve of Chicago Working Paper.
Agarwal, Sumit, Gene Amromin, Itzhak Ben-David, Souphala Chomsisengphet, and Douglas D. Evanoff. 2010. “Learning to Cope: Voluntary Financial Education and Loan Performance during a Housing Crisis.” American Economic Review: Papers & Proceedings 100 (May 2010): pp.495-500.
Aren, Selim. 2014. “A Literature Review on Financial Literacy.” Journal of Financial Research and Studies, 5(11), pp.33-49.
Vila, Gabriela, Nguyen Hoa and Peter Zorn. 2013. “The Benefits of Pre-Purchase Homeownership Counceling.” Freddie Mac Working Paper
Bond, Shaun and Michael Eriksen 2016. “The Role of Parents on the Home Ownership Experience of Their Children: Evidence from the Health and Retirement Study.” University of Cincinnati Working Paper.
Bai, Bing, Wei Li and Laurie Goodman. 2015. “The Credit Box Shows Early Signs of Loosening.” Washington, DC: Urban Institute.
Cole, Shawn, and Gauri Kartini Shastry. 2008. “Smart Money: The Effects of Education, Financial Literacy and Cognitive Ability on Financial Market Participation.” Harvard Business School Working Paper.
Davidoff, Thomas. “Labor Income, Housing Proces and Homeownership.” Journal of Urban Economics 59 (2005), pp.209-345.
Fernandes, Daniel, John G. Lynch, Jr. and Richard G. Netemeyer. 2014. “Financial Literacy, Financial Education and Downstream Financial Behaviors.” Management Science 201460:8, pp.1861-1883.
Fuller, Cody. 2015. “Homeownership Really Is All About the Money.” Zillow Real Estate Analytics. https://www.zillow.com/research/homeownership-by-income-9419/
Fry, Richard and Anna Brown. 2016. “In a Recovering Market, Homeownership Rates Are Down Sharply for Blacks, Young Adults.” Washington, D.C.: Pew Research Center, December.
Guiso, Luigi and Tullio Jappelli. 2008. “Financial literacy and portfolio diversification.” European University Institute, Department of Economics, Working Paper ECO 2008/31.
Lusardi, Annamaria and Olivia Mitchell. 2007. “Financial literacy and retirement preparedness: Evidence and implications for financial education.” Business Economics, Vol.42, Iss.1, pp.35-44.
Lusardi, Annamaria, and Peter Tufano. 2009. “Debt Literacy, Financial Experience and Over-indebtedness.” Dartmouth College and Harvard Business School Working Paper.
Mallach, Alan. 2000 “Home Ownership Education and Counseling.” Issues in Research and Definition. Federal Reserve Bank of Philadelphia
McCarthy Yvonne. 2014. “Dis-entangling the Mortgage Arrears Crisis: The Role of the Labor Market, Income Volatility and Housing Equity.” Central Bank of Ireland Research Paper.

16
Moulton, Stephanie, Donald R. Haurin and Wei Shi. 2015. “An Analysis of Default Risk in the Home Equity Conversion Mortgage (HECM) Program.” Journal of Urban Economics, 90 (2015) pp.17-34.
Pinto, Edward J. 2012. “How the FHA Hurts Working-Class Families and Communities.” Washington, DC: American Enterprise Institute.
Spader, Jonathan and Christopher Herbert. 2016. “Waiting for Homeownership: Assessing the Future of Homeownership, 2015-2035.” Joint Center for Housing Studies of Harvard University Working Paper, December 2016.
Terrazas, Aaron. 2014. “Want to Increase Homeownership? Give a Millennial a Good Job.” Zillow Real Estate Analytics. https://www.zillow.com/research/millennials-homeownership-7630/
Van Rooij, Maarten, Annamaria Lusardi and Rob Alessi. 2011. “Financial Literacy and Stock Market Participation.” Journal of Financial Economics, Vol. 101, pp.449-472.
Van Rooij, Maarten, Annamaria Lusardi and Rob Alessi. 2012. “Financial Literacy, Retirement Planning and Household Wealth.” Economic Journal, Vol. 122 (May), pp.449-478.
White, Michelle J. 2007. “Bankruptcy Reform and Credit Cards.” Journal of Economic Perspectives, 21(4): pp.175–99.

17
Figure 1. The Homeownership Rate and the S&P/Case-Shiller U.S. National Home Price Index
Sources: U.S. Bureau of Census, S&P Dow Jones Indices LLC.
Retrieved from FRED, Federal Reserve Bank of St. Louis. https://fred.stlouisfed.org/series/RHORUSQ156N, https://fred.stlouisfed.org/series/CSUSHPISA, March 23, 2017.
0
20
40
60
80
100
120
140
160
180
200
60
61
62
63
64
65
66
67
68
69
70
Jul-
65
Mar
-67
No
v-6
8
Jul-
70
Mar
-72
No
v-7
3
Jul-
75
Mar
-77
No
v-7
8
Jul-
80
Mar
-82
No
v-8
3
Jul-
85
Mar
-87
No
v-8
8
Jul-
90
Mar
-92
No
v-9
3
Jul-
95
Mar
-97
No
v-9
8
Jul-
00
Mar
-02
No
v-0
3
Jul-
05
Mar
-07
No
v-0
8
Jul-
10
Mar
-12
No
v-1
3
Jul-
15
Homeownership Rate [L] Case-Shiller US National HPI [R]

18
Table 1. Descriptive Statistics of Survey Participants
Characteristics Subgroup Percentage
Gender Male 49%
Female 51%
Age
18-34 25%
35-49 24%
50-64 32%
65+ 19%
Race and Ethnicity
White, non-Hispanic 68%
African American, non-Hispanic 11%
Other, non-Hispanic 5%
Hispanic 14%
2+ races, non-Hispanic 2%
Education
H.S. Less 39%
Some College 29%
College Grad+ 32%
Household Income
<$50K 40%
$50K-$100K 34%
> $100K 26%
Home Ownership
Rent Primary Residence 27%
Own Primary Residence 64%
Don’t Pay for Housing 7%
Marital Status Married 57%
Unmarried 43%
Children Children under 18 in Household 30%
No Children under 18 in Household 70%
Region
Northeast 18%
Midwest 22%
South 37%
West 23%
Sample size N= 3,868.
19
Table 2. Consumer Knowledge and Perceived Difficulty in Getting a Mortgage
By Category
All Consumers Renters who plan to move
and buy a home in five years
(N=3,868) (N=376)
Panel A: Knowledge about mortgage qualification requirements
% of Don't know
mean % of Don't
know mean
Minimum Down Payment Required 40% 12% 38% 13%
Minimum Credit Score Required 54% 652 45% 646
Maximum Back-End DTI Ratio 59% 44% 58% 42%
Panel B: Perceived difficulty of obtaining a mortgage % of selection % of selection
Perceive very/somewhat difficult to obtain a mortgage 57% 56%
Insufficient income to afford monthly mortgage payments 50% 45%
Insufficient credit score or credit history 48% 49%
Too much existing debt payment 45% 43%
Affording the down payment or closing costs 50% 58%
20
Table 3. Who Responds “Don’t Know”?
Variable Comparison Pairs
Odds Ratio
Credit Score
Down Payment
Debt -to-Income
All Three
Household Income
Under 50K vs 100K+ 1.9** 2.0** 1.6** 1.7**
50-100K vs 100K+ 1.2 1.3** 1.1 1.2**
Race/ Ethnicity
Asian vs White 1.4** 0.9 1.1 1.1
Hispanic vs White 1.5** 1.2 1.4** 1.3**
African American vs White 1.0 1.2 1.1 1.1
Education Some college vs College 0.9 1.3** 1.5** 1.2**
HS/less vs College 1.5** 2.1** 2.1** 1.8**
Age
65+ vs 18-34 2.4** 1.4** 1.7** 1.8**
45-64 vs 18-34 1.3** 0.9 1.0 1.1
35-44 vs 18-34 1.0 0.8 1.0 0.9
Home Ownership
Renter vs Owner 1.1 1.5** 1.3** 1.3**
N 3,653 3,669 3,656 3,683
Note: Regression model using logistic regression. Odds ratios that are statistically different from one
at 95% confidence level is marked by **.
Table 4. Who Perceives “Difficulty in Getting a Mortgage”?
Variable Comparison Pairs Odds Ratio
Household Income
Under 50K vs 100K+ 2.8**
50-100K vs 100K+ 1.4**
Ethnicity
Asian vs White 1.0
Hispanic vs White 2.0**
African American vs White 1.7**
Education Some college vs College 1.7**
HS/less vs College 1.8**
Age
65+ vs 18-34 0.5**
45-64 vs 18-34 1.0
35-44 vs 18-34 1.0
Home Ownership
Renter vs Owner 4.7**
N 3,677
Note: Regression model using logistic regression. Odds ratios that are statistically different from one
at 95% confidence level is marked by **.

21
Table 5. Who Are Sources of Influential Advice
Variable Comparison Pairs
Odds Ratio
Lenders Real
Estate Agents
Family /
Friends
Government Agencies
Non-Profit Counselors
Household Income
Under 50K vs 100K+ 0.9 1.1 1.0 1.6** 2.3**
50-100K vs 100K+ 0.9 1.0 1.0 1.2 1.6**
Ethnicity
Asian vs White 0.6** 0.8 1.6** 1.0 0.9
Hispanic vs White 0.9 1.6** 0.6** 1.7** 1.6**
African American vs White
0.8** 1.4** 0.6** 1.7** 2.2**
Education
Some College vs College NA
1.2 0.8 0.8 1.2
HS/less vs College 1.3 0.9 0.8 1.1
Age
65+ vs 18-34 2.2** 1.2 0.3** 1.4 1.2
45-64 vs 18-34 1.8** 1.0 0.6** 1.5** 1.0
35-44 vs 18-34 1.4** 0.8 0.9 1.4 1.6**
Home Ownership
Renter vs Owner 0.7** 0.9 1.4** 1.1 1.4**
N 3,624 3,624 3,624 3,624 3,624
Note: Regression model using logistic regression. Odds ratios that are statistically different from one at
95% confidence level is marked by **.
22
Appendix:
Sample Questions
FANNIE MAE MORTGAGE QUALIFICATION UNDERSTANDING STUDY: 2015 SURVEY
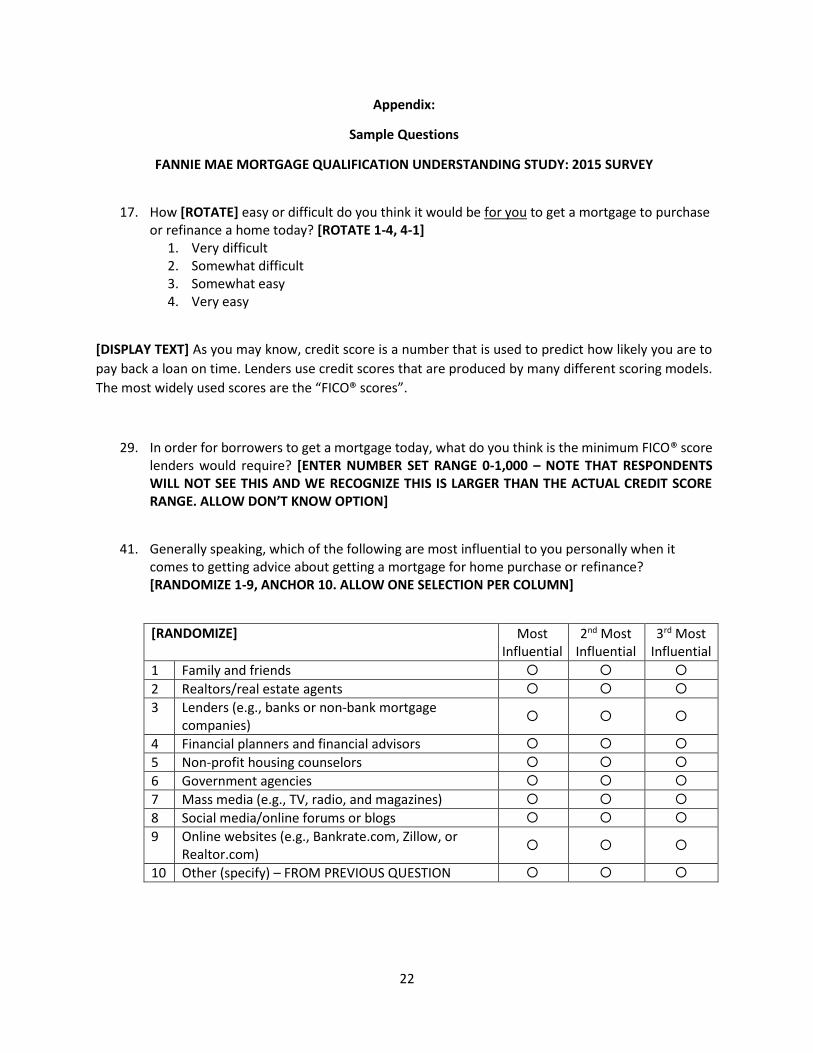
17. How [ROTATE] easy or difficult do you think it would be for you to get a mortgage to purchase
or refinance a home today? [ROTATE 1-4, 4-1] 1. Very difficult 2. Somewhat difficult 3. Somewhat easy 4. Very easy
[DISPLAY TEXT] As you may know, credit score is a number that is used to predict how likely you are to
pay back a loan on time. Lenders use credit scores that are produced by many different scoring models.
The most widely used scores are the “FICO® scores”.
29. In order for borrowers to get a mortgage today, what do you think is the minimum FICO® score lenders would require? [ENTER NUMBER SET RANGE 0-1,000 – NOTE THAT RESPONDENTS WILL NOT SEE THIS AND WE RECOGNIZE THIS IS LARGER THAN THE ACTUAL CREDIT SCORE RANGE. ALLOW DON’T KNOW OPTION]
41. Generally speaking, which of the following are most influential to you personally when it comes to getting advice about getting a mortgage for home purchase or refinance? [RANDOMIZE 1-9, ANCHOR 10. ALLOW ONE SELECTION PER COLUMN]
[RANDOMIZE] Most Influential
2nd Most Influential
3rd Most Influential
1 Family and friends 2 Realtors/real estate agents
3 Lenders (e.g., banks or non-bank mortgage companies)
4 Financial planners and financial advisors
5 Non-profit housing counselors
6 Government agencies
7 Mass media (e.g., TV, radio, and magazines) 8 Social media/online forums or blogs 9 Online websites (e.g., Bankrate.com, Zillow, or
Realtor.com)
10 Other (specify) – FROM PREVIOUS QUESTION


![The Impact of Migration and Remittances on Wealth ... · “Some migrant households have improved so much from remittances that they are now richer than [initially] rich households.”](https://static.fdocuments.us/doc/165x107/5ecac161971f177c91456a37/the-impact-of-migration-and-remittances-on-wealth-aoesome-migrant-households.jpg)