Family Policies in OECD Countries: A Comparative Analysis · · 2014-01-14employment and...
31
POPULATION AND DEVELOPMENT REVIEW 37(1): 57–87 (MARCH 2011) 57 Family Policies in OECD Countries: A Comparative Analysis OLIVIER THÉVENON THE SUCCESS OF policies to reconcile work and family life is often summarized by pointing out that for more than 15 years, among members of the Organisa- tion for Economic Cooperation and Development (OECD), the countries with the highest fertility and lowest poverty rates have been those where a high percentage of women perform paid work (OECD 2007). In these countries pro-family policies seem to strike a balance that is favorable to both women’s employment and fertility (Ahn and Mira 2002; D’Addio and Mira d’Ercole 2005). For this reason especially, work and family reconciliation policies are on the political agenda of a growing number of Western countries. Because most developed countries face the challenges of coping with both population aging and integration into a global economy, one might expect that their family policies would converge. Several factors favor the persistence of cross-national differences, however. At a fine-grain level their objectives are only partly congruent, calling for different arrays of policy in- struments. And the historical backgrounds against which family policies have developed are diverse, particularly as regards the roles of state, family, and labor market: policy responses are shaped by these contexts and by the path dependencies they give rise to (see Lewis 1992; Gornick, Meyers, and Ross 1997; Meulders and O’Dorchai 2007). In a comparative survey, Gauthier (2002) examined the evolution of family policy in the industrialized countries, focusing on changes in child- related leave and family benefits from the 1970s to the end of the 1990s. In terms of family policy she identified four groups of countries emerging in the 1980s, but with increasing dispersion within some groups over the period. This limited but intriguing evidence suggests that major policy differences have persisted and that some new differences have appeared. Given this background, I examine cross-country differences in state support to families, using recent OECD family data. The three main types of support are leave entitlements, cash transfers, and provision of services. I consider the specific features of these instruments and how they combine to
Transcript of Family Policies in OECD Countries: A Comparative Analysis · · 2014-01-14employment and...

PoPulation and develoPment Review 37(1 ) : 5 7 –8 7 (ma RCH 2 0 1 1 ) 57
Family Policies in OECD Countries: A Comparative Analysis
Olivier ThévenOn
the success of policies to reconcile work and family life is often summarized by pointing out that for more than 15 years, among members of the organisa-tion for economic Cooperation and development (oeCd), the countries with the highest fertility and lowest poverty rates have been those where a high percentage of women perform paid work (oeCd 2007). in these countries pro-family policies seem to strike a balance that is favorable to both women’s employment and fertility (ahn and mira 2002; d’addio and mira d’ercole 2005). For this reason especially, work and family reconciliation policies are on the political agenda of a growing number of western countries.
Because most developed countries face the challenges of coping with both population aging and integration into a global economy, one might expect that their family policies would converge. Several factors favor the persistence of cross-national differences, however. at a fine-grain level their objectives are only partly congruent, calling for different arrays of policy in-struments. and the historical backgrounds against which family policies have developed are diverse, particularly as regards the roles of state, family, and labor market: policy responses are shaped by these contexts and by the path dependencies they give rise to (see lewis 1992; Gornick, meyers, and Ross 1997; meulders and o’dorchai 2007).
in a comparative survey, Gauthier (2002) examined the evolution of family policy in the industrialized countries, focusing on changes in child-related leave and family benefits from the 1970s to the end of the 1990s. in terms of family policy she identified four groups of countries emerging in the 1980s, but with increasing dispersion within some groups over the period. this limited but intriguing evidence suggests that major policy differences have persisted and that some new differences have appeared.
Given this background, i examine cross-country differences in state support to families, using recent oeCd family data. the three main types of support are leave entitlements, cash transfers, and provision of services. i consider the specific features of these instruments and how they combine to

58 f a m i ly P o l i c i e s i n oecD c o u n t r i e s
form a more or less complete policy package. employing a principal compo-nent analysis, i identify clusters of countries with broadly comparable family policy packages. a key advantage of the latest oeCd dataset is that it provides more detailed information on a wider range of policy instruments than has previously been available.
the first section reviews past family policy comparisons and discusses the changing objectives and means that shape policy design. the second sec-tion gives details of the data and methods, and the third describes the coun-try patterns in family policy revealed by the analysis. Finally, a concluding section discusses the varying contexts shaping family policies and the work/life balance.
Family policy models: Diversity of aims
Changes in families’ lifestyles call for a “modernization” of family-support policies (Kaufmann et al. 2002). modernization is of course a multifaceted concept. what is meant here is that policies should become more effective in reconciling different objectives—a perspective that is now explicit in recent assessments of family policies in europe (letablier et al. 2009; lohmann, Rostgaard, and Spiess 2009). while all these objectives broadly seek an im-proved work/life balance, they sometimes clash. indeed, a common finding is that family policies are more heterogeneous than is suggested by the stan-dard analysis of welfare state regimes (see meulders and o’dorchai 2007 for a survey).
Six main aims of family-support policies can be identified:1. Poverty reduction and income maintenance. this aim is typically
addressed by allocating special benefits to low-income families with children (maître, nolan, and whelan 2005; Ritakallio and Bradshaw 2006). it is a key facet of social policy in anglo-Saxon countries, and also in Southern european countries, although family-support policies remain fragmented in the latter (Ferrara 2005). Policies may vary both in the coverage of such benefits (universal or targeted on low-income families) and in the degree to which transfers are retrogressive with income and progressive with family size. Housing benefits that increase with family size are a key instrument for reducing poverty (Bradshaw and mayhew 2006; Fagnani and math 2008).
2. direct compensation for the economic cost of children. Cash benefits and/or fiscal transfers to families aim to narrow the gap in living standards between families with children and the childless. Because they are not nec-essarily limited to low-income families, they may not reduce overall income inequality. indeed, they can be remarkably generous for large families re-gardless of household income. they may extend throughout the childhood period, potentially with an increasing impact on the household budget as the children grow (thévenon 2009a).
o l i v i e r t h é v e n o n 59
3. Fostering employment. Family policies in recent years have often sought to reconcile work and family life, especially for women, in order to sustain the increase in female labor force participation (esping-andersen 1999; oeCd 2002–2007). a higher participation rate contributes to the eco-nomic and financial sustainability of the welfare state. an increase in employ-ment of highly qualified women is also presumed to yield productivity gains and foster economic growth (esping-andersen 2009; luci 2009). Provision of a family-friendly context typically combines three kinds of measures: en-titlement to parental leave after the birth of a child, with guaranteed security of income and employment; childcare services adapted to the working hours of parents with young children; and a tax and benefit system that contains incentives to work.
4. improving gender equity. Policies can promote equal sharing of both paid and unpaid work between partners, including childcare (lewis 1992, 2006; Bettio and Plantenga 2004; Hantrais 2007). Childbirth-related leave can be designed to avoid lengthy withdrawal from the labor market and to encourage take-up by fathers through better-paid, “fractionable” parental leave and leave that is lost if not used (moss and Coram 2008; Ray, Gornick, and Schmitt 2009). tax and benefit systems are also important tools for fos-tering gender equity—for example, through differences in tax rates applied to the household’s first and second earner.
5. Support for early childhood development. a number of oeCd coun-tries have designed family policies with this objective in mind (Gornick and meyers 2006; oeCd 2009b). two factors are generally considered beneficial for children in early childhood: the time spent by parents in caring for and educating their children, and children’s enrollment in formal childcare and preschool education (Kamerman et al. 2003; Heckman and masterov 2007). at the same time, having both parents in employment reduces poverty, which is positive for child well-being and development (whiteford and ade-ma 2007; esping-andersen 2009). norms regarding the appropriate starting age and duration of formal childcare vary quite widely across countries, but there is more agreement on the value of preschool education.
6. Raising birth rates. Population aging and its major cause, persisting very low fertility, are a concern for most oeCd countries because of their long-term consequences for economic growth and the sustainability of the welfare state. Raising fertility has rarely been an explicit objective of family support, although it is seen as a positive potential by-product. at least in europe, how-ever, awareness of the need for higher fertility has been spreading, along with debate on how it might be promoted—as evidenced by the eC Green Paper on the policy implications of population aging (european Commission 2005). two considerations are in the foreground of this debate. First, actual fertility falls short of the desired number of children reported by parents, a gap that policy measures might be able to close (d’addio and mira d’ercole 2005; Gauthier
60 f a m i ly P o l i c i e s i n oecD c o u n t r i e s
and Philipov 2008). Second, female labor force participation is not seen as necessarily an obstacle to raising fertility, since comparatively high levels of fertility are found in some countries where female employment rates are also high. (in other countries, however, fertility and female labor force participa-tion do seem more in opposition, and a polarization of work/family decisions has been observed over the last decade. See thévenon 2009b.)
the balance among these six policy objectives differs among countries, in turn shaping the policy measures employed. the resulting policies dif-fer not only in their design of specific instruments but also in the degree of consistency they achieve in supporting people’s decisions about work and family. this variation is reflected in the diverse mix of cash benefits, in-kind support, and flexible working time arrangements made available (Gornick, meyers, and Ross 1997; de Hénau, meulders, and o’dorchai 2006; oeCd 2002–2007) and in the extent to which different kinds of family support are combined over the course of the childrearing years. the cross-country policy differences, as several studies have noted, only partially coincide with the predominant and widely accepted classification of welfare state regimes—see Gornick, meyers, and Ross (1997), de Hénau, meulders, and o’dorchai (2006), and thévenon (2006).
Data and methodology
data for the present study are drawn from the oeCd Family database, re-leased in June 2009 and referring to the situation around 2005 (see adema et al. 2009). the coverage includes 28 countries (termed the oeCd-28) out of the total 34 members, grouped in regional/cultural clusters as follows: anglo-Saxon (australia, Canada, ireland, new Zealand, united Kingdom, united States), nordic (denmark, Finland, iceland, norway, Sweden), Continental european (austria, Belgium, France, Germany, luxembourg, netherlands, Switzerland), Southern european (Greece, italy, Portugal, Spain), eastern european (Czech Republic, Hungary, Poland, Slovakia), and asian (Japan, South Korea). other member countries, such as turkey and mexico, were not included because of large gaps in data availability.
there is no unanimity in the literature regarding which indicators best describe a country’s family policy. to avoid too narrow a focus, i use a wide set of indicators aimed at capturing policy characteristics from different perspec-tives. the three dimensions of family support—in-cash, in-kind, and in-time (through leave entitlements)—are included, with a range of indicators for each policy instrument to best portray its multifaceted nature. the data were also selected (and the number of indicators limited) to minimize the gaps in country coverage and to avoid redundancy. the selected indicators do not necessarily provide a comprehensive assessment of the coverage of policies or of their uptake.1 moreover, only statutory entitlements are considered, not discretionary employer-provided benefits.
o l i v i e r t h é v e n o n 61
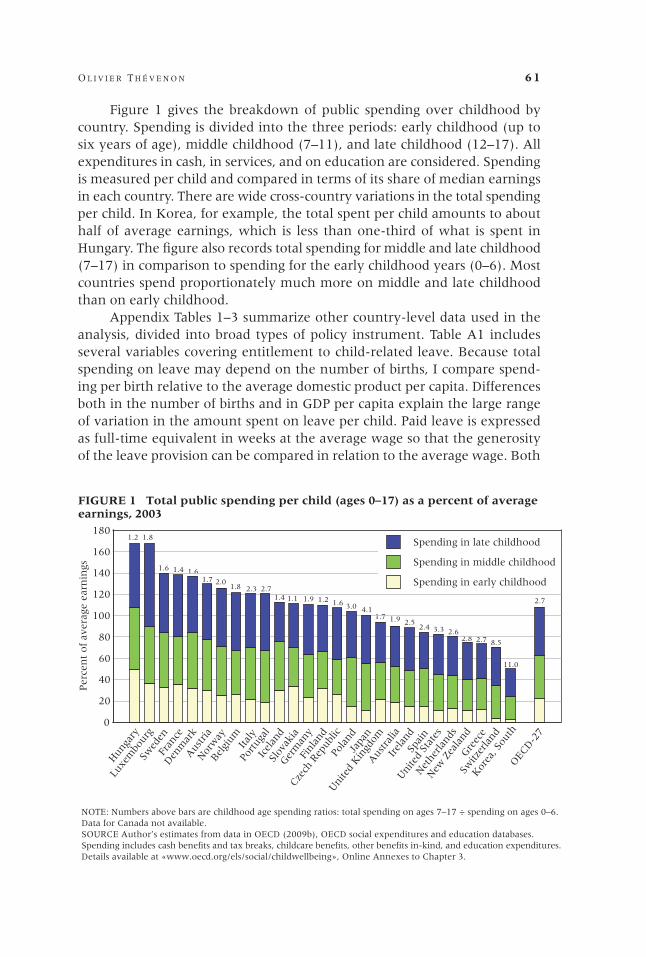
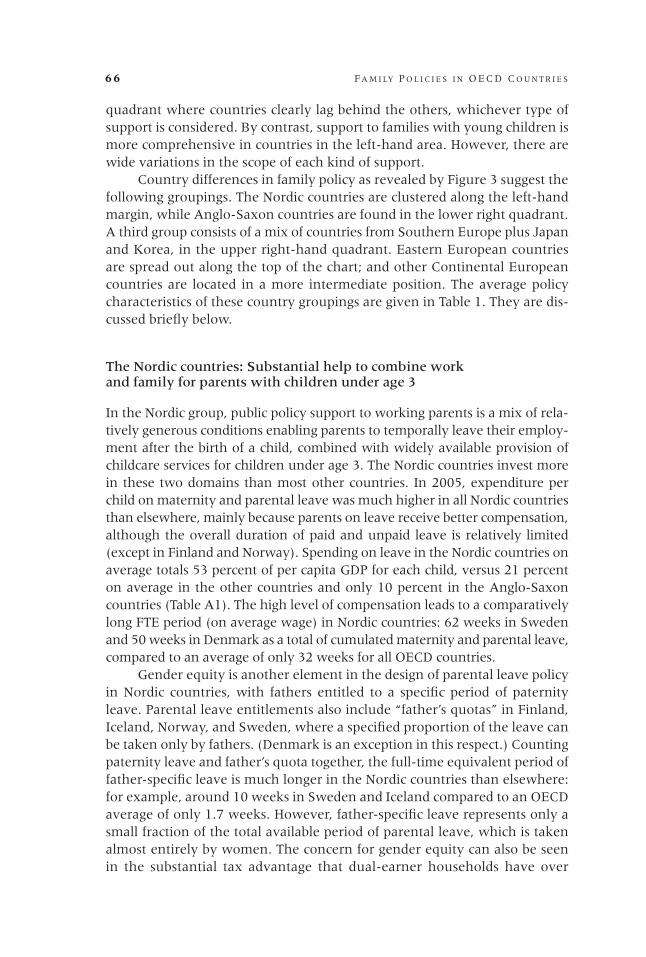
Figure 1 gives the breakdown of public spending over childhood by country. Spending is divided into the three periods: early childhood (up to six years of age), middle childhood (7–11), and late childhood (12–17). all expenditures in cash, in services, and on education are considered. Spending is measured per child and compared in terms of its share of median earnings in each country. there are wide cross-country variations in the total spending per child. in Korea, for example, the total spent per child amounts to about half of average earnings, which is less than one-third of what is spent in Hungary. the figure also records total spending for middle and late childhood (7–17) in comparison to spending for the early childhood years (0–6). most countries spend proportionately much more on middle and late childhood than on early childhood.
appendix tables 1–3 summarize other country-level data used in the analysis, divided into broad types of policy instrument. table a1 includes several variables covering entitlement to child-related leave. Because total spending on leave may depend on the number of births, i compare spend-ing per birth relative to the average domestic product per capita. differences both in the number of births and in GdP per capita explain the large range of variation in the amount spent on leave per child. Paid leave is expressed as full-time equivalent in weeks at the average wage so that the generosity of the leave provision can be compared in relation to the average wage. Both
1.2 1.8
1.6 1.4 1.61.7 2.0
1.8 2.3 2.71.4 1.1 1.9 1.2 1.6 3.0 4.1
1.7 1.9 2.52.4 3.3 2.6
2.72.8 8.5
2.7
11.0
FIGURE 1 Total public spending per child (ages 0–17) as a percent of averageearnings, 2003
Hun
gary
Luxe
mbo
urg
Swed
enFr
ance
Den
mar
kAus
tria
Nor
way
Belgi
um Italy
Portug
alIc
elan
dSl
ovak
iaGer
man
yFi
nlan
d
Czech
Rep
ublic
Pola
ndJa
pan
Uni
ted
Kin
gdom
Aus
tral
iaIrel
and
Spai
n
Uni
ted
Stat
es
Net
herla
nds
New
Zea
land
Gre
ece
Switz
erla
nd
Kor
ea, S
outh
OEC
D-2
7
0
20
40
60
80
100
120
140
160
180
Per
cen
t of
aver
age
earn
ings
NOTE: Numbers above bars are childhood age spending ratios: total spending on ages 7–17 ÷ spending on ages 0–6. Data for Canada not available.SOURCE Author’s estimates from data in OECD (2009b), OECD social expenditures and education databases. Spending includes cash benefits and tax breaks, childcare benefits, other benefits in-kind, and education expenditures. Details available at «www.oecd.org/els/social/childwellbeing», Online Annexes to Chapter 3.
Spending in early childhood
Spending in middle childhood
Spending in late childhood
62 f a m i ly P o l i c i e s i n oecD c o u n t r i e s
paid maternity leave and parental leave are taken into account. moreover, in order to capture the total period for which parents (mainly mothers) can be absent from work after childbirth, i also show the total period of employment-protected child-related leave, whether paid or not. For working parents with children under preschool age, this total offers one indication of the balance sought by the policy between personal and formal childcare. as a measure of gender equity, a possible reason for keeping parental leave relatively short and well-paid, the table also includes fathers’ specific entitlements (through paternity leave, the father’s quota, or the bonus in the duration of parental leave when shared by the two parents).
a second group of variables describes the provision of childcare and preschool education services (table a2). the data include spending on public childcare and preschool services both as a percentage of GdP and per child. the table also includes estimates of service coverage and average hours of school attendance per week and estimates of childcare costs (as an indication of the affordability of center-based care).
the third set of variables is concerned with overall income support re-ceived by families through the tax and benefit systems (table a3): benefits in proportion to GdP and in proportion to average earnings, variation of benefits by family size, and contribution to poverty reduction. tax breaks granted to families in addition to cash benefits are an important source of transfers in some countries such as Belgium, France, and Germany. the progressivity of support for larger family sizes indicates the degree of targeting of support to larger families—here measured by the “family size ratio,” comparing the additional benefits granted for a third child to equivalent households with one child only. (in Belgium, Canada, France, Japan, and Sweden income support is focused especially on large families.) the contribution of family-based transfers to poverty reduction is gauged by the benefits to low-income families in proportion to average earnings and by the treatment of single-parent households. in most countries support is twice as high for low-income families, though with considerable variation.2
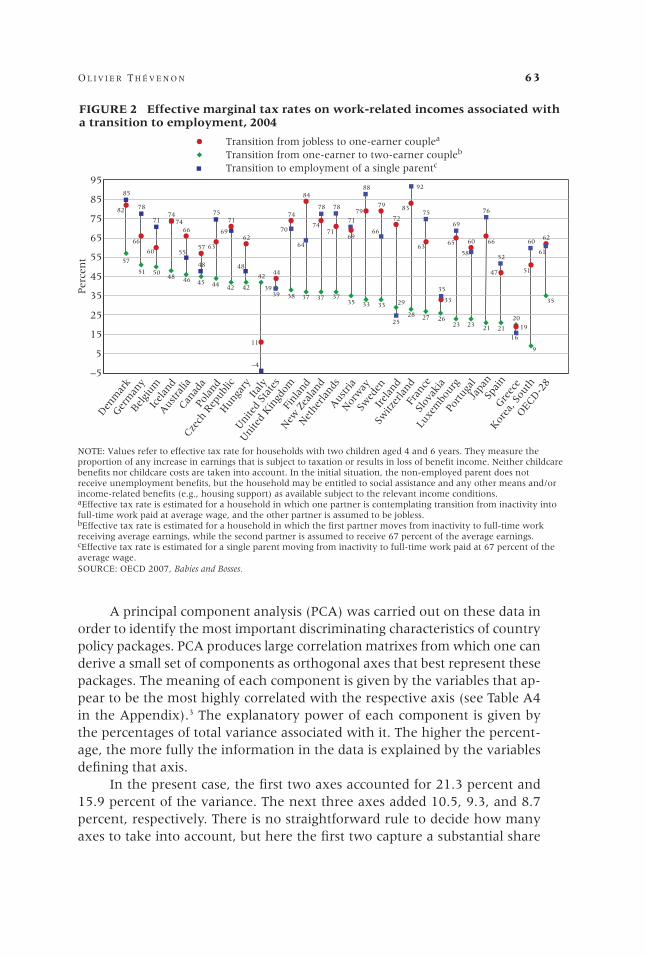
Figure 2 displays the result of transfers on the average effective tax rates applicable to parents with children above 3 years of age contemplating the transition to work. these tax rates measure the proportion of any increase in earnings that is lost either to taxation or in forgone benefit income. thus, high rates signal the relative disincentive to employment that is attributable to taxation. they also indirectly inform us about the tax bill incurred to cover support for households in balancing work and family life. By contrast, the lower (and possibly negative) rates in italy show the relatively high incen-tive for jobless couples and single parents to become employed. the effective tax rates are estimated for different partnership situations, including parents living as couples or alone with children, but only for a very limited number of possible transitions.
o l i v i e r t h é v e n o n 63
a principal component analysis (PCa) was carried out on these data in order to identify the most important discriminating characteristics of country policy packages. PCa produces large correlation matrixes from which one can derive a small set of components as orthogonal axes that best represent these packages. the meaning of each component is given by the variables that ap-pear to be the most highly correlated with the respective axis (see table a4 in the appendix).3 the explanatory power of each component is given by the percentages of total variance associated with it. the higher the percent-age, the more fully the information in the data is explained by the variables defining that axis.
in the present case, the first two axes accounted for 21.3 percent and 15.9 percent of the variance. the next three axes added 10.5, 9.3, and 8.7 percent, respectively. there is no straightforward rule to decide how many axes to take into account, but here the first two capture a substantial share
82
66
60
74
66
57 63
71
62
11
44
74
84
7471
69
7979
72
83
63
33
65 60 66
47
19
51
62
F
F FF
F F FF F F
F F F F FF
F FF F F F
F FF F F
F
F
57
51 5048 46 45 44 42 42
42
3938 37 37 37
35 33 33 29
28 27 2623 23 21 21
20
9
35
B
B
BB
B
B
B
B
B
B
B
B
B
B
B
B
B
B
B
B
B
B
B
B
B
85
78
71 74
55
48
75
69
48
–4
39
70
64
78 78
71
88
66
25
92
75
35
69
58
76
52
16
60
61
Den
mar
kGer
man
yBel
gium
Icel
and
Aus
tral
iaCan
ada
Pola
nd
Czech
Rep
ublic
Hun
gary
Italy
Uni
ted
Stat
es
Uni
ted
Kin
gdom
Finl
and
New
Zea
land
Net
herla
nds
Aus
tria
Nor
way
Swed
enIrel
and
Switz
erla
ndFr
ance
Slov
akia
Luxe
mbo
urg
Portug
alJa
pan
Spai
nGre
ece
Kor
ea, S
outh
OEC
D-2
8
–5
5
15
25
35
45
55
65
75
85
95
Per
cen
t
Transition from jobless to one-earner couplea
F Transition from one-earner to two-earner coupleb
B Transition to employment of a single parentc
FIGURE 2 Effective marginal tax rates on work-related incomes associated with a transition to employment, 2004
NOTE: Values refer to effective tax rate for households with two children aged 4 and 6 years. They measure theproportion of any increase in earnings that is subject to taxation or results in loss of benefit income. Neither childcarebenefits nor childcare costs are taken into account. In the initial situation, the non-employed parent does notreceive unemployment benefits, but the household may be entitled to social assistance and any other means and/orincome-related benefits (e.g., housing support) as available subject to the relevant income conditions.aEffective tax rate is estimated for a household in which one partner is contemplating transition from inactivity intofull-time work paid at average wage, and the other partner is assumed to be jobless.bEffective tax rate is estimated for a household in which the first partner moves from inactivity to full-time workreceiving average earnings, while the second partner is assumed to receive 67 percent of the average earnings.cEffective tax rate is estimated for a single parent moving from inactivity to full-time work paid at 67 percent of theaverage wage.SOURCE: OECD 2007, Babies and Bosses.
J
J
J
J
J
J
J
J
J
J
J
J
J
JJ
J
J J
J
J
J
J
J J
J
J
J
J
J
J
B
B
BB
64 f a m i ly P o l i c i e s i n oecD c o u n t r i e s
of the dataset structure—thus effectively summarizing much of the relevant information on contrasting country policies.4
in the remainder of this article i focus mainly on the similarities and con-trasts among countries as revealed by the first two principal components.
Family policy patterns in OECD countries
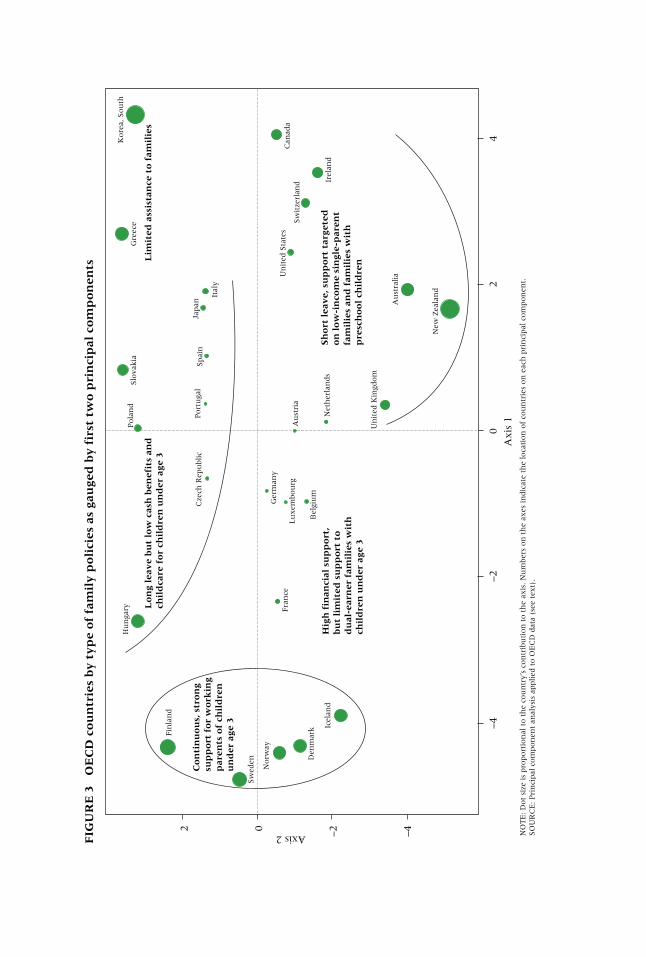
Figure 3 shows how countries are located on the plane defined by these components. the closer the countries are to each other, the greater the similarities in their policy packages, and the more distant they are, the more dissimilar—in terms of the policy dimensions used to define the corresponding axis. the size of the circle marking a country is proportional to that country’s contribution to the component: countries with larger circles are the most “typical” of the family policy regimes represented by the axes. dominant family-policy characteristics corresponding to different areas of the chart are labeled. although some country clusters can be identified, the groups are mostly heterogeneous.
the key variables constituting the first component (the horizontal axis of Figure 3) relate to the support provided to working parents with children under age 3 years to enable them to combine work and childcare. the main contrast along this axis is the difference between the countries clustered on the left-hand side of the chart (the nordic countries) and all the others. Sup-port is more comprehensive in the former group: spending on both leave entitlements and services for families with very young children is higher. on the whole, in these countries, public investment in early childhood is greater than in middle and late childhood. By contrast, the periods of middle and late childhood are a much clearer focus of investment in countries located on the right-hand side of the chart (largely because of spending on education). low-income and/or large families are also a more obvious target of financial support on this side of the chart, although these variables account for only a small share of cross-country differences.
the second component (the vertical axis of Figure 3) also displays some significant contrasts. the “generosity” of leave entitlements is a key variable here, with countries located in the top left part of the chart offering longer periods of leave. the compensation rate is not always very high during mater-nity or parental leave owing to flat-rate payment; however, combined with a relatively long period of leave, the result is quite a long full-time-equivalent (Fte) period (at average wage). while leave entitlement is less generous in countries at the bottom of the chart, the investments in educational services for preschool children are higher here than elsewhere. also, cash transfers through the tax and benefits system amount to a higher proportion of GdP.
to sum up, overall support to families with young children is lower in countries in the right-hand side of the chart, and especially in the top right
Co
nti
nu
ou
s, s
tro
ng
sup
po
rt f
or
wo
rkin
gp
aren
ts o
f ch
ild
ren
un
der
age
3
Lo
ng
leav
e b
ut
low
cas
h b
enef
its
and
ch
ild
care
fo
r ch
ild
ren
un
der
age
3
Hig
h f
inan
cial
su
pp
ort
, b
ut
lim
ited
su
pp
ort
to
d
ual
-ear
ner
fam
ilie
s w
ith
ch
ild
ren
un
der
age
3
Sh
ort
lea
ve,
su
pp
ort
tar
gete
do
n l
ow
-in
com
e si
ngl
e-p
aren
tfa
mil
ies
and
fam
ilie
s w
ith
pre
sch
oo
l ch
ild
renL
imit
ed a
ssis
tan
ce t
o f
amil
ies
FIG
UR
E 3
O
EC
D c
ou
ntr
ies
by
ty
pe
of
fam
ily
po
lici
es a
s ga
uge
d b
y f
irst
tw
o p
rin
cip
al c
om
po
nen
ts
Axis
1
–4
–2
0
2
4
2 0 –2 –4
New
Zea
lan
d
Au
stra
lia
Un
ited
Kin
gdom
Net
her
lan
ds
Au
stri
a
Un
ited
Sta
tes
Sw
itze
rlan
d Irel
and
Can
ada
Bel
giu
m
Lu
xem
bou
rg
Ger
man
y
Fra
nce
Icel
and
Den
mar
k
Norw
ay
Sw
eden
Fin
lan
d
Cze
ch R
epu
blic
Hu
nga
ryPola
nd
Port
uga
lSpai
nJa
pan
Ital
y
Slo
vakia
Gre
ece
Kore
a, S
ou
th
NO
TE
: D
ot
size
is
pro
port
ion
al t
o t
he
cou
ntr
y’s
con
trib
uti
on
to t
he
axis
. N
um
bers
on
th
e ax
es in
dic
ate
the
loca
tion
of
cou
ntr
ies
on
eac
h p
rin
cipal
com
pon
ent.
SO
UR
CE
: Pri
nci
pal
com
pon
ent
anal
ysis
applied
to O
EC
D d
ata
(see
tex
t).
Axis 2
66 f a m i ly P o l i c i e s i n oecD c o u n t r i e s
quadrant where countries clearly lag behind the others, whichever type of support is considered. By contrast, support to families with young children is more comprehensive in countries in the left-hand area. However, there are wide variations in the scope of each kind of support.
Country differences in family policy as revealed by Figure 3 suggest the following groupings. the nordic countries are clustered along the left-hand margin, while anglo-Saxon countries are found in the lower right quadrant. a third group consists of a mix of countries from Southern europe plus Japan and Korea, in the upper right-hand quadrant. eastern european countries are spread out along the top of the chart; and other Continental european countries are located in a more intermediate position. the average policy characteristics of these country groupings are given in table 1. they are dis-cussed briefly below.
The Nordic countries: Substantial help to combine work and family for parents with children under age 3
in the nordic group, public policy support to working parents is a mix of rela-tively generous conditions enabling parents to temporally leave their employ-ment after the birth of a child, combined with widely available provision of childcare services for children under age 3. the nordic countries invest more in these two domains than most other countries. in 2005, expenditure per child on maternity and parental leave was much higher in all nordic countries than elsewhere, mainly because parents on leave receive better compensation, although the overall duration of paid and unpaid leave is relatively limited (except in Finland and norway). Spending on leave in the nordic countries on average totals 53 percent of per capita GdP for each child, versus 21 percent on average in the other countries and only 10 percent in the anglo-Saxon countries (table a1). the high level of compensation leads to a comparatively long Fte period (on average wage) in nordic countries: 62 weeks in Sweden and 50 weeks in denmark as a total of cumulated maternity and parental leave, compared to an average of only 32 weeks for all oeCd countries.
Gender equity is another element in the design of parental leave policy in nordic countries, with fathers entitled to a specific period of paternity leave. Parental leave entitlements also include “father’s quotas” in Finland, iceland, norway, and Sweden, where a specified proportion of the leave can be taken only by fathers. (denmark is an exception in this respect.) Counting paternity leave and father’s quota together, the full-time equivalent period of father-specific leave is much longer in the nordic countries than elsewhere: for example, around 10 weeks in Sweden and iceland compared to an oeCd average of only 1.7 weeks. However, father-specific leave represents only a small fraction of the total available period of parental leave, which is taken almost entirely by women. the concern for gender equity can also be seen in the substantial tax advantage that dual-earner households have over

TA
bl
E 1
M
ain
fam
ily
po
licy
in
dic
ato
rs b
y g
rou
p o
f co
un
trie
s, 2
005–
07
Fu
ll-t
ime
Ch
ild
care
Pre
sch
oo
l
eq
uiv
alen
ta F
ull
-tim
e
serv
ices
serv
ices
N
et
ben
efits
Sp
end
ing
of
mat
ern
ity
eq
uiv
alen
ta S
pen
din
g co
ver
age
Av
erag
e co
ver
age
chil
dca
re
and
tax
Fis
cal
p
er c
hil
d
plu
s o
f fa
ther
- o
n
(% o
f h
ou
rs o
f (%
of
cost
s fo
r b
reak
s S
up
po
rt
pri
vil
ege
as
% o
f p
aren
tal
spec
ific
chil
dca
re
chil
dre
n
chil
dca
re
chil
dre
n
du
al-
for
to l
ow
- to
du
al-
G
DP
per
le
aves
le
ave
serv
ices
ag
es 0
– at
ten
dan
ce
ages
3–
earn
er
fam
ilie
s in
com
e ea
rner
F
amil
y p
oli
cy m
od
el
cap
ita
(in
wee
ks)
(i
n w
eek
s)
(% o
f G
DP
) 2
yea
rs)
per
wee
k
5 y
ears
) fa
mil
yb
(% o
f G
DP
) fa
mil
iesc
ho
use
ho
ldsd
nord
ic c
ou
ntr
ies
52.6
44.6
6.7
1.5
2
46
33
82
9
1.5
2
.2
5.1
Con
tin
enta
l eu
ropea
n
cou
ntr
ies
22.3
31.9
0.7
0.8
7
36
26
85
9
2.2
1
.1
3.0
an
glo-S
axon
co
un
trie
s
an
d S
wit
zerl
and
8.1
10.6
0.0
0.5
0
30
24
72
24
1.7
4
.7
3.0
Sou
ther
n e
uro
pe,
Jap
an,
an
d S
ou
th K
ore
a 12.5
27.8
0.7
0.5
7
28
32
74
8
0.6
3
.6
5.3
eas
tern
eu
ropea
n
cou
ntr
ies
51.1
58.5
1.3
0.6
2
7
29
71
7
1.5
2
.9
3.9
oe
Cd
ave
rage
28.6
31.7
1.7
0.7
9
30
28
71
13
1.5
3
.0
4.0
no
te
: un
wei
ghte
d a
vera
ges.
a See
note
a in
tab
le a
1.
b See
note
b in
tab
le a
2.
c See
note
a in
tab
le a
3.
dSee
note
e in
tab
le a
3.
68 f a m i ly P o l i c i e s i n oecD c o u n t r i e s
single-earner ones with the same total earnings. long periods of flat-rate paid parental childcare leave in norway or Finland go against gender equity, however, given its predominant use by women.
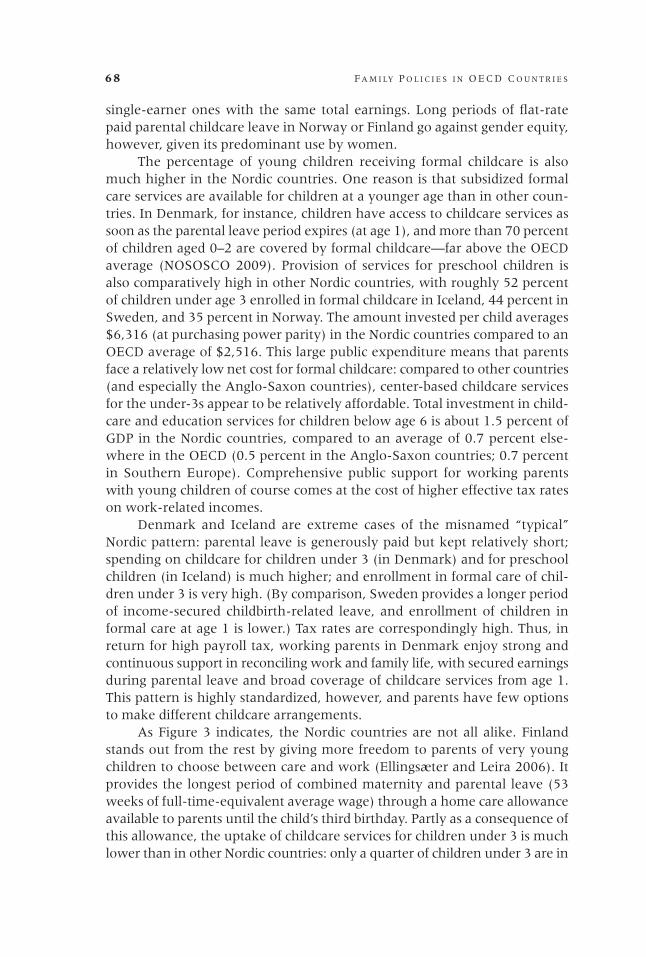
the percentage of young children receiving formal childcare is also much higher in the nordic countries. one reason is that subsidized formal care services are available for children at a younger age than in other coun-tries. in denmark, for instance, children have access to childcare services as soon as the parental leave period expires (at age 1), and more than 70 percent of children aged 0–2 are covered by formal childcare—far above the oeCd average (noSoSCo 2009). Provision of services for preschool children is also comparatively high in other nordic countries, with roughly 52 percent of children under age 3 enrolled in formal childcare in iceland, 44 percent in Sweden, and 35 percent in norway. the amount invested per child averages $6,316 (at purchasing power parity) in the nordic countries compared to an oeCd average of $2,516. this large public expenditure means that parents face a relatively low net cost for formal childcare: compared to other countries (and especially the anglo-Saxon countries), center-based childcare services for the under-3s appear to be relatively affordable. total investment in child-care and education services for children below age 6 is about 1.5 percent of GdP in the nordic countries, compared to an average of 0.7 percent else-where in the oeCd (0.5 percent in the anglo-Saxon countries; 0.7 percent in Southern europe). Comprehensive public support for working parents with young children of course comes at the cost of higher effective tax rates on work-related incomes.
denmark and iceland are extreme cases of the misnamed “typical” nordic pattern: parental leave is generously paid but kept relatively short; spending on childcare for children under 3 (in denmark) and for preschool children (in iceland) is much higher; and enrollment in formal care of chil-dren under 3 is very high. (By comparison, Sweden provides a longer period of income-secured childbirth-related leave, and enrollment of children in formal care at age 1 is lower.) tax rates are correspondingly high. thus, in return for high payroll tax, working parents in denmark enjoy strong and continuous support in reconciling work and family life, with secured earnings during parental leave and broad coverage of childcare services from age 1. this pattern is highly standardized, however, and parents have few options to make different childcare arrangements.
as Figure 3 indicates, the nordic countries are not all alike. Finland stands out from the rest by giving more freedom to parents of very young children to choose between care and work (ellingsæter and leira 2006). it provides the longest period of combined maternity and parental leave (53 weeks of full-time-equivalent average wage) through a home care allowance available to parents until the child’s third birthday. Partly as a consequence of this allowance, the uptake of childcare services for children under 3 is much lower than in other nordic countries: only a quarter of children under 3 are in

o l i v i e r t h é v e n o n 69
formal day care.5 women are disproportionately the carers of young children, hence the extended period of paid leave is unfavorable for the gender balance in the labor market. However, a fiscal lever compensates for this unbalanced incentive by giving a more significant tax advantage to dual-earner house-holds compared to single-earners when children are over 3 years of age.
Anglo-Saxon countries: Support for poor families, single parents, and households with preschool children
the anglo-Saxon countries, along with the Southern european plus asia group, lie at the opposite end of the public-support spectrum from the nordic countries, but differ in their positions on the vertical axis of Figure 3. anglo-Saxon countries are distinctive in several respects. Statutory entitlements for paid leave following the birth of a child are relatively modest: although par-ents are entitled to a period of protected employment, payment is limited and the total Fte period of leave is comparatively short (nine weeks maximum in the uK). However, employer-provided benefits (not covered in this study) can partly compensate for this low level of statutory entitlements.6
the supply of public childcare and education services is generally lower for children under age 3, although there are sharp differences between countries in the group (see below). the costs of childcare services to parents are thus higher. Such costs can be reduced significantly by tax deductions, childcare benefits, or rebates, as is the case in australia, but this reduction is fairly marginal in ireland, new Zealand, and the united Kingdom (see table a2, and immervoll and Barber 2005). Childcare costs erode the gains from employment, although effective tax rates before childcare costs are in the medium range.
By contrast, enrollment rates for preschool children in formal care are higher in this group than in the others, and public expenditure per child cov-ered is higher than for early infancy. the provision of educational services for preschool children is thus a focus of childcare investment in these countries: children’s educational and cognitive development is a key driver of state in-tervention (oeCd 2009b).
the anglo-Saxon countries provide more support in cash than do other countries providing comparable help in kind. they also strongly target this cash support on poor families, including single-parent families. low-income families (those with 25 percent or less of the average earnings) receive, on average, five times as much as two-earner families at the average wage, com-pared to three times as much taking all oeCd countries together (see table 1). the benefit provided for a single parent with one child aged 3 is 16 percent of the average wage, while the oeCd average is 10 percent. anti-poverty policies are clearly used more here than in other countries as drivers of cash transfers to support families. Fiscal and welfare levers also play a large part in promoting parents’ labor market participation: effective tax rates are low

70 f a m i ly P o l i c i e s i n oecD c o u n t r i e s
compared to nordic and Continental european countries, especially for single parents; all anglo-Saxon countries also provide significant tax advantages for a second earner in the household compared to single-earner families.
Countries in this group are spread out within Figure 3, with the uK and new Zealand placed well apart from the others. Public spending per child un-der 3 enrolled in childcare and education services is higher in these two coun-tries, although the average weekly number of hours in attendance is lower than in the uS or ireland. investment in services for preschool children and coverage rates are higher in the uK and, especially, in new Zealand, where spending per child is about 2.5 times the oeCd average. the total amount spent on childcare services represents 1 percent of GdP in the uK, where it has been boosted by the childcare strategy launched since the end of the 1990s (oeCd 2005). australia and the uS spend half this amount. note that Switzerland is also located in this cluster, very close to the uS: its maternity leave is quite short, and there is no additional entitlement for paid leave. the supply and use of childcare services for children under age 3 are also com-paratively low, although this observation masks wide differences among the Swiss cantons (oeCd 2004).
Southern Europe, Japan, Korea: Even more limited assistance
Southern european countries are also characterized by a limited period of paid child-related leave and less extensive provision of childcare services. in all cases, the total period of full-time-equivalent leave is very short (17.4 weeks in these countries compared to the oeCd average of 32). Portugal deviates slightly from the other Southern european countries with wider coverage of formal childcare under age 3 and, especially, more hours of attendance (40 hours per week on average). one explanation for this is the comparatively low incidence of part-time work in Portugal, where female employment rates and the subsequent volume of childcare demand are especially high (see next section). Paternity leave and fiscal advantages for two-earner families are also higher, indicating concern for gender equity. the period of paid leave is longer in both Japan and Korea, but they share other characteristics with Southern european countries, including the absence of fathers’ specific entitlement to parental or paternity leave. only “regular” workers are covered by these entitlements.
the main shared feature in these countries is the rather low volume of cash transfers (very low in asia), which represents a significant difference from the anglo-Saxon group. the provision of childcare services for children under preschool age is also quite low, equivalent to the oeCd average, but the net cost paid by parents is also comparatively low. these countries are characterized by a “deficit” of policies, whichever aspect is considered.
Korea stands out from the other countries in the group, with expen-diture for early childhood that is less than one-tenth of the amount spent

o l i v i e r t h é v e n o n 71
for older children. Spending on maternity and parental leave is low despite entitlements that cover a relatively long period, probably because uptake rates are particularly low. Spending on childcare and education per child is also comparatively low, as are financial transfers received by families. this weak support to families and working parents explains the extreme position of Korea in the top right-hand corner of Figure 3.
limited assistance to families in this group of countries, however, is bal-anced by significantly lower effective tax rates on the transition to work. thus there is a strong fiscal lever encouraging parents to combine work and family life: effective tax rates are set at a low level that maintains the incentive to work. incentives for having a second earner are also relatively strong, since dual-earner households enjoy considerable tax advantages. this emphasis on work-related earnings is understandable in a context where economic need remains a clear driver of parental participation in the labor force.
Eastern Europe: Policies in transition
the eastern european countries have all experienced a transition to a market economy in the last two decades, but their family policies are by no means uniform. in the early years of this transition, the main guideline for orga-nizing family allowances was the principle of universality, with the aim of compensating for the loss of job security and wage subsidies that character-ized the former system. However, many of these countries have since moved toward means-tested support, while less emphasis has been placed on policies enabling women to combine motherhood with paid work (Rostgaard 2004). as a result, the development of family and childcare policies has varied in its timing and followed different patterns (Szelewa and Polakowski 2008). total expenditure on both in-cash and in-kind support is far lower in these countries than in the anglo-Saxon or Southern european groups, indicated by their position near the top border of Figure 3. But their positions vary quite widely with regard to leave and childcare policy, as seen in their wide scatter along the horizontal axis.
Hungary differs from the others in the group in that it provides much more comprehensive support to parents with young children: parental leave payments are higher (73 weeks’ full-time equivalent against 16 in Poland and 50 in Czech Republic). Hungary is comparable to Finland in the prior-ity given to paid parental leave over the provision of formal care for young children. about 10 percent of children under age 3 are covered by formal care, a relatively low proportion compared to the oeCd average but high compared to the other eastern european countries. For example, in com-parison to Poland, Hungary’s public spending on childcare services is higher and service coverage for preschool children is also higher (87 percent versus Poland’s 41 percent). Families in Hungary also receive more generous finan-cial benefits (2 percent of GdP compared to 1 percent in Poland), although

72 f a m i ly P o l i c i e s i n oecD c o u n t r i e s
the poorest families receive a relatively small share of this support. Slovakia also stands apart, with a limited period of paid parental leave but with unpaid leave that can be extended to three years. investment in childcare facilities is also relatively low despite higher coverage rates for children under age 3 than in other eastern european countries. as in Hungary, the level of family benefits is relatively high as a percentage of GdP but is not targeted on poor families. in its combination of a long period of unpaid leave and limited avail-ability of other types of support, Slovakia is comparable to most Southern european countries.
Continental European countries: Moving away from “conservatism”?
Family policies in Continental european countries lie in an intermediate position between the patterns described above. Families traditionally benefit from explicit support in these countries, as illustrated by the high levels of transfers to families: spending for families with children is much higher than the oeCd average in all these countries except in the netherlands, where it is at the average. this support is still marked by “conservatism,” however, in that gender equality and the reconciliation of work and family life are not obvious drivers of policy support.
all these countries except the netherlands provide relatively high levels of cash support through benefits and tax breaks (2.2 percent of GdP com-pared with the 1.5 percent oeCd average in 2005). the income support is less obviously targeted on low-income families, since the top of the earnings scale absorbs approximately the same share of benefits (in Belgium, Germany, luxembourg, and the netherlands) or a slightly higher share (in austria and France). this is because support to families in these countries is quite tradi-tional, in the sense that one of the basic aims of transfers is to compensate for child costs borne by all families, including the richer ones, in comparison to childless households (thévenon 2009a). Further, taxation is not designed to encourage labor market participation of both parents. workers’ effective tax rates are relatively high and there is little or no fiscal advantage for dual-earner families compared to single-earner ones. in France and Germany, traditional one-earner households actually have lower tax rates than two-earner families.
these countries are fairly heterogeneous as regards leave entitlements and care service provision. in all of them, the full-time-equivalent period of leave is the oeCd average, but entitlements differ across countries. most (austria, Belgium, France) provide a fairly long period of leave paid at a fixed rate.7 in the netherlands, leave is shorter, often unpaid, and taken on a part-time basis. Germany is the only country where leave was reformed from a flat rate payment for a long leave period to a short, well-paid period.

o l i v i e r t h é v e n o n 73
differences in childcare policies are also considerable, although invest-ment in childcare services is slightly higher here than the oeCd average. investment in childcare services for children under 3 is much higher in France than in the other countries. there are also differences in both coverage and intensity of use, which are higher in Belgium, France, and luxembourg. enrollment rates of children under 3 in formal care are much lower in the other countries (except in the netherlands), but children are covered on a part-time basis. average formal care attendance is about 17, 22, and 23 hours respectively in the netherlands, Germany, and austria, but more than 30 hours in Belgium, France, and luxembourg.
the Continental countries are thus in a middle position with respect to other oeCd countries that have more advanced strategies to support either working parents or disadvantaged families, or both. although reforms have been introduced in recent years, the model of one-earner families continues to shape part of the institutional setting. their policy strategies are more com-posite in aim and heterogeneous in design than in the other groups. France illustrates this well: its transfers to families are comparatively high in order to help households bear the cost of children; working parents receive additional support either to care for children at home (through entitlements to quite long parental leave and higher spending per child) or to work (with fairly ample provision of formal childcare services, available from a very young age and on a full-time basis); however, the incentive to work is limited by the lower tax rates for one-earner families compared to two-earner families. all in all, France’s position is closer to the nordic countries than to other Conti-nental european countries.8
By contrast, in Germany the parental leave system is undergoing re-form, but there is still a considerable shortage of childcare services for chil-dren under preschool age. the netherlands has similarities to the united Kingdom, with short parental leave combined with provision of part-time childcare services. (the development of part-time work facilitates this kind of arrangement—thévenon 2009b—a topic discussed below.)
Different contexts shaping family policies
Family policies are rooted in particular historical and institutional circum-stances, which influence their design. i consider here the extent to which such contextual specificities can be related to patterns of family support.
three contextual dimensions bear closely on the policy objectives listed earlier in this article: poverty, fertility, and labor market position of families (which includes a dimension of gender equity). i have chosen these dimensions because of data availability and for ease of interpretation: the indicators of context and the policy instruments discussed above must be closely linked.9
74 f a m i ly P o l i c i e s i n oecD c o u n t r i e s
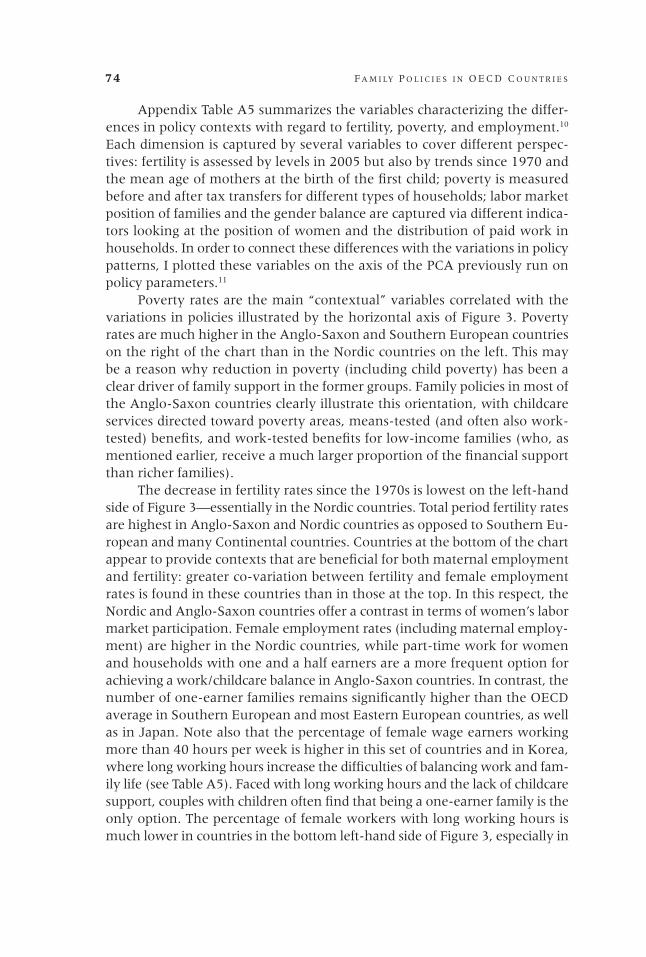
appendix table a5 summarizes the variables characterizing the differ-ences in policy contexts with regard to fertility, poverty, and employment.10 each dimension is captured by several variables to cover different perspec-tives: fertility is assessed by levels in 2005 but also by trends since 1970 and the mean age of mothers at the birth of the first child; poverty is measured before and after tax transfers for different types of households; labor market position of families and the gender balance are captured via different indica-tors looking at the position of women and the distribution of paid work in households. in order to connect these differences with the variations in policy patterns, i plotted these variables on the axis of the PCa previously run on policy parameters.11
Poverty rates are the main “contextual” variables correlated with the variations in policies illustrated by the horizontal axis of Figure 3. Poverty rates are much higher in the anglo-Saxon and Southern european countries on the right of the chart than in the nordic countries on the left. this may be a reason why reduction in poverty (including child poverty) has been a clear driver of family support in the former groups. Family policies in most of the anglo-Saxon countries clearly illustrate this orientation, with childcare services directed toward poverty areas, means-tested (and often also work-tested) benefits, and work-tested benefits for low-income families (who, as mentioned earlier, receive a much larger proportion of the financial support than richer families).
the decrease in fertility rates since the 1970s is lowest on the left-hand side of Figure 3—essentially in the nordic countries. total period fertility rates are highest in anglo-Saxon and nordic countries as opposed to Southern eu-ropean and many Continental countries. Countries at the bottom of the chart appear to provide contexts that are beneficial for both maternal employment and fertility: greater co-variation between fertility and female employment rates is found in these countries than in those at the top. in this respect, the nordic and anglo-Saxon countries offer a contrast in terms of women’s labor market participation. Female employment rates (including maternal employ-ment) are higher in the nordic countries, while part-time work for women and households with one and a half earners are a more frequent option for achieving a work/childcare balance in anglo-Saxon countries. in contrast, the number of one-earner families remains significantly higher than the oeCd average in Southern european and most eastern european countries, as well as in Japan. note also that the percentage of female wage earners working more than 40 hours per week is higher in this set of countries and in Korea, where long working hours increase the difficulties of balancing work and fam-ily life (see table a5). Faced with long working hours and the lack of childcare support, couples with children often find that being a one-earner family is the only option. the percentage of female workers with long working hours is much lower in countries in the bottom left-hand side of Figure 3, especially in
o l i v i e r t h é v e n o n 75
denmark, Finland, and norway and in some Continental european countries such as France and Germany.
Discussion: Persistent variations in models of work/life balance?
the preceding analysis supports the argument that family policies in the oeCd remain diverse even though most member countries have increased their support to families. For some countries, the development of these poli-cies is quite recent and represents a change in orientation of the welfare state. the reconciliation of work and family life has often been a criterion in this development, but there are still major differences in the way this criterion is combined with and balanced against other family policy objectives. the main differences concern the level of support for working parents with children under preschool age and the extent to which parental leave entitlements and provision of childcare services complement each other. in agreement with previous studies, i found broad geographical variation in family policies, with some distinct clustering of countries but also considerable dispersion within each cluster.
in part this cross-country variation might reflect different stages of policy development. But more fundamentally it suggests that family poli-cies are based on different “models”—that is, on different institutionalized relationships between policy objectives and instruments. a particular family policy model is anchored in a particular welfare regime, that is, in a distinc-tive allocation of roles in welfare provision among the family, the state, and the market. thus, the contrasting policy designs reflect relatively persistent variations in the modes of coordination between work and care during the family building process (thévenon 2006).
as to policy drivers, the nordic and anglo-Saxon countries illustrate two different patterns that achieve higher rates of female employment as well as higher fertility. in the nordic countries, support to working mothers seems to be sufficiently prolonged, diversified, and continuous over the course of family life to allow a substantial proportion of women to participate in the labor market full-time even during the period of family formation. the work/family balance is initially achieved by major state intervention to provide a complementary mix of generous parental leave payments to secure household income for the period directly following a birth. this is followed by a relatively prolonged supply of affordable childcare services and direct income transfers to the family. the widely accepted justification for this high level of support is to achieve the combined objectives of child education, adult autonomy, and gender equity. Households can rely on a diverse set of resources that help to secure their transition into parenthood and into employment. in particular, women are encouraged to find a job and to keep it, even after the birth of
76 f a m i ly P o l i c i e s i n oecD c o u n t r i e s
children, although the effective tax bill that has to be paid as a counterpart is relatively high. investments of this kind—the provision of affordable child-care, income support, and secure income during parental leave—may lower poverty rates and raise female employment. Flexible work-time practices also contribute to achieving a balance between work and family since the propor-tion of employees working more than 40 hours a week is limited. However, the nordic countries show a high degree of occupational segregation, which can be seen partly as an unwanted consequence of segmented family policies (datta Gupta, Smith, and verner 2008). this pattern does not apply to all countries in northern europe: in Finland, for example, policies for parents with children under age 3 are less obviously focused on pro-employment objectives.
in the anglo-Saxon policy model, a key parameter in the balance between work and family life is part-time work for women with children under school age. Here, the balance is achieved with less public investment and through policies that regard childcare as a matter of private choice. in this respect, one prominent objective is to limit the effective tax rate so that households maintain freedom of choice in their childcare preferences. Fam-ily support thus functions largely through means-tested and/or work-tested transfers focusing on parents at risk of poverty, who are encouraged to enter the labor market. low effective tax rates are intended to ensure a financial gain from returning to work, and labor market flexibility is expected to pro-vide effective means for households to manage their family obligations. labor market flexibility here includes the increasing practice of part-time work and the opportunity to change jobs and to switch in and out of employment over time. Formal childcare is generally provided by “marketized” services for which only limited public co-funding is provided. Households may receive childcare subsidies, depending on their labor supply decisions. nevertheless, formal services remain expensive and the available supply of childcare (along with some use of informal support) only suffices to allow mothers’ part-time work. this pattern implies a clearer gender-based division of roles since female labor market participation has to adjust sequentially over the course of fam-ily life (thévenon 2006). nonetheless, the anglo-Saxon countries still have higher poverty rates than the oeCd average.
the situation in most Continental european countries is more mixed. the provision of financial support to families with children represents a clear policy emphasis on compensating for the cost of children in the household budget. Continental countries differ, however, in the extent to which ad-ditional support is given to working parents with young children through leave entitlement and childcare services. Some are eager to give parents of children under 3 more opportunities either to work or to care for children through financial support and a long period of parental leave. the provision of formal childcare services is limited in terms of both population coverage
o l i v i e r t h é v e n o n 77
and hours of the day. France stands as an exception in two respects: a home care allowance is paid for a period that varies with the child’s birth order, and formal care is widely available on a full-time basis, including for very young children (center-based places are potentially available from the age of 3 months). However, dual support for either work or care generates inequalities between parents who can afford formal care and those who have no other option than to take advantage of the home care allowance and accept the consequences of withdrawal from the labor market. effective conditions for freedom of choice are met if parents receive full childcare support when they decide to return to work. to achieve this, leave entitlement and the provision of formal care services must be available at the appropriate times, and work-ing parents must be able to benefit from this support continuously over the childhood period. in that respect, eastern and Southern european countries as well as Japan and Korea lag behind the rest. overall public support to fami-lies in these countries is still quite limited and is highly fragmented—that is, heterogeneous within countries and discontinuous over the course of family life. long working hours add to the lack of formal childcare support for work-ing parents to cope with family responsibilities. in these contexts, it is not surprising that these countries perform least well in terms of fertility, female employment, and poverty rates, showing highly polarized behavior with re-spect to fertility and women’s labor market participation (esping-andersen 2009; thévenon 2009b).
Finally, i note that this analysis does not strictly reproduce the catego-ries of countries derived from the well-established classification of welfare state regimes or from previous cross-country comparisons of family policies (Gornick, meyers, and Ross 1997; Gauthier 2002). one reason may be that my comparison is based on a larger and more recent dataset. another reason may be that in recent developments and reforms of family-support policy, some countries have switched to more mixed forms of support in order to achieve additional objectives. this kind of analysis should be considered as a first step toward better assessment of the processes actually involved in the evolution of family-support policies.

78 f a m i ly P o l i c i e s i n oecD c o u n t r i e s
APPENDIX TAblE A1 Key characteristics of childcare leave policies
Total length of Total FTEa paid available FTEa paid FTEa paid Spending FTEa paid length of maternity length of length of per child length of parental and parental maternity father- as % of maternity leave/ leave (paid and parental specific GDP per leave home careb or unpaid) leavec leaved capita (in weeks) (in weeks) (in weeks) (in weeks) (in weeks) Country 2005 2007 2007 2007 2007 2007
australia 7.2 0.0 0.0 52.0 0.0 0.0austria 15.4 16.0 21.7 112.0 37.7 0.4Belgium 15.8 11.3 2.6 27.0 13.9 1.2Canada 21.4 8.4 19.3 50.0 27.7 0.0Czech Republic 60.8 13.7 50.3 164.0 64.0 0.0denmark 47.4 18.0 32.0 50.0 50.0 2.0Finland 58.0 16.9 35.8 173.5 52.7 5.7France 27.5 16.0 31.1 143.0 47.1 2.0Germany 23.0 14.0 34.6 162.0 48.6 0.0Greece 8.9 17.0 0.0 28.0 17.0 0.4Hungary 67.7 16.8 72.8 108.0 89.6 1.0iceland 44.3 10.4 0.0 26.0 10.4 10.4ireland 5.5 18.2 0.0 62.0 18.2 0.0italy 18.7 16.0 7.8 47.0 19.6 0.0Japan 13.6 8.4 31.2 58.0 39.6 0.0Korea, South 1.0 15.0 42.3 67.0 57.3 0.0luxembourg 39.0 16.0 12.1 40.0 28.1 0.4netherlands 12.9 16.0 0.0 29.0 16.0 0.4new Zealand 4.4 6.0 0.0 12.0 6.0 0.0norway 53.7 9.0 38.4 109.0 47.4 6.0Poland 24.6 18.0 16.1 174.0 34.1 4.0Portugal 18.5 17.0 0.0 29.0 17.0 2.0Slovakia 51.3 15.4 30.7 156.0 46.1 0.0Spain 14.5 16.0 0.0 162.0 16.0 2.0Sweden 59.4 9.6 52.8 84.0 62.4 9.3Switzerland 0.0 12.8 0.0 16.0 12.8 0.0united Kingdom 10.3 9.3 0.0 52.0 9.3 0.3united States .. 0.0 0.0 12.0 0.0 0.0oeCd-28 26.8 12.9 19.0 78.7 31.7 1.7
.. data not available aFull-time equivalent is the length of full-time leave that the same amount of leave would cover at 100 percent of the average rate of pay: Fte = duration of leave in weeks x payment (as a percent of average earnings). Benefits and payment rates applicable as of 1 January 2006. “Home care” or “childrearing” allowances are included, although they are not nec-essarily linked to employment protection. “top-ups” of state leave payments by employers are not included. when two options are available to parents of a young child, i consider the option that applies specifically to working insured parents (as, for example, in Hungary). Part-time options are not considered here. bleave to care for children can be referred to within countries alternatively as parental or home/childcare leave. in some countries, entitlements to childcare leave add to parental leave rights. i consider both entitlements here. in-depth descrip-tion of leave systems can be found in moss and Korintus (2008). only statutory entitlements are covered here. cthese estimates are given here for information only and are not included in the subsequent component analysis because this would be redundant with the information given for maternity and parental leave separately. dFather-specific leave is the sum of entitlements to paternity leave and any quota of parental leave reserved for fathers’ use, as is the case in some countries. SouRCe: oeCd Family database, as of october 2009.

AP
PE
ND
IX T
Ab
lE
A2
Ed
uca
tio
n a
nd
ch
ild
care
ser
vic
es f
or
chil
dre
n n
ot
yet
in
pri
mar
y s
cho
ol
A
ver
age
N
et
Net
S
pen
din
g S
pen
din
g C
hil
dca
re
ho
urs
of
Pre
sch
oo
l ch
ild
care
ch
ild
care
p
er c
hil
d
per
ch
ild
on
se
rvic
es
atte
nd
ance
se
rvic
es
cost
s fo
r co
sts
S
pen
din
g o
n
on
ser
vic
es
serv
ices
fo
r co
ver
age
per
wee
k
cov
erag
e d
ual
-ear
ner
fo
r si
ngl
e
chil
dca
re
for
chil
dre
n
pre
sch
oo
l (%
of
chil
- (f
or
chil
- (f
or
chil
- fa
mil
yb
par
entc
se
rvic
es
un
der
age
3a
chil
dre
n
dre
n a
ged
d
ren
age
d
dre
n a
ged
(%
of
net
(%
of
net
(% o
f G
DP
) (U
S$
PP
P)
(US
$ P
PP
) 0–
2 y
ears
)a 0–
2 y
ears
) 3–
5 y
ears
) in
com
e)
inco
me)
C
ou
ntr
y
2005
20
05
2005
20
06
2006
20
06
2004
20
04
au
stra
lia
0.6
1,7
26
5,7
09
24.5
18.0
59.8
9.7
6.6
au
stri
a 0.5
3,2
51
6,2
05
10.5
23.0
74.8
14.9
9.3
Bel
giu
m
0.9
2,3
33
4,6
98
41.7
30.0
99.8
4.2
3.5
Can
ada
0.2
..
4,0
52
24.0
32.0
56.8
22.0
44.5
Cze
ch R
epu
blic
0.6
1,0
73
2,5
50
2.6
17.0
82.0
7.6
14.7
den
mar
k
1.6
6,3
76
3,7
43
70.5
34.0
90.7
7.8
8.5
Fin
lan
d
1.4
7,1
18
2,4
20
25.0
35.0
48.2
7.2
4.1
Fra
nce
1.6
2,8
58
4,6
79
42.9
30.0
100.2
11.3
8.8
Ger
man
y 0.7
860
3,5
38
21.2
22.0
89.4
8.4
6.8
Gre
ece
0.4
1,1
69
..
18.2
31.0
47.1
4.7
4.6
Hu
nga
ry
1.2
620
3,2
04
10.5
29.0
86.9
6.5
0.0
icel
and
1.7
5,7
33
4,5
89
52.9
36.0
95.0
14.9
13.5
irel
and
0.3
1,4
30
..
25.2
25.0
48.6
29.2
51.7
ital
y 0.7
1,5
58
4,6
26
28.6
30.0
101.1
..
..Ja
pan
0.5
2,6
83
1,2
07
15.2
..
87.7
14.2
14.0
Kore
a, S
ou
th
0.3
754
1,3
75
30.8
..
33.9
8.7
15.7
lu
xem
bou
rg
0.5
3,5
54
..
43.4
31.0
85.5
5.7
4.8
net
her
lan
ds
1.0
1,0
92
5,8
81
53.9
17.0
58.0
11.5
3.0
new
Zea
lan
d
0.7
476
6,0
01
37.9
20.0
94.5
27.5
14.3
norw
ay
1.3
6,4
25
4,1
27
35.3
31.0
90.6
7.7
–6
.0Pola
nd
0.3
..
1,8
30
8.6
35.0
41.0
4.6
12.7
Port
uga
l 0.8
1,2
89
3,2
93
43.6
40.0
78.7
4.2
2.0
Slo
vakia
0.4
414
1,9
09
4.9
33.0
73.0
7.8
17.1
Spai
n
0.7
1,2
34
4,1
51
33.9
28.0
97.7
..
..Sw
eden
1.6
5,9
28
3,6
27
44.0
29.0
85.5
6.2
4.8
Sw
itze
rlan
d
0.3
1,1
29
2,5
15
..
..
96.8
29.8
22.7
un
ited
Kin
gdom
1.0
3,5
63
4,2
55
39.7
18.0
90.5
32.7
14.4
un
ited
Sta
tes
0.5
794
4,6
60
31.4
31.0
58.3
19.4
6.2
oe
Cd
-28
0.8
2,5
17
3,7
94
30.4
28.2
76.9
12.6
11.6
.. d
ata
not
avai
labl
e
a P
ubl
ic c
hildca
re s
pen
din
g an
d c
ove
rage
may
be
slig
htl
y u
nder
esti
mat
ed in
Fed
eral
cou
ntr
ies
like
Can
ada
or
Sw
itze
rlan
d, w
her
e ch
ildca
re p
olici
es a
re m
an-
aged
at
the
pro
vin
cial
leve
l.
b Hou
seh
old
ch
ildca
re s
pen
din
g is
est
imat
ed f
or
a du
al-e
arn
er f
amily
wit
h t
wo c
hildre
n a
nd f
ull-t
ime
earn
ings
of
167 p
erce
nt
of
the
aver
age
wag
e in
2004. t
he
firs
t ea
rner
is a
ssu
med
to e
arn
th
e av
erag
e w
age
and t
he
seco
nd t
wo-t
hir
ds
of
it. t
he
two c
hildre
n a
re a
ssu
med
to b
e u
nder
3 y
ears
of
age
and t
o b
e ca
red f
or
full-t
ime
(40
hou
rs p
er w
eek)
(oe
Cd
2007: c
har
t 6.5
).
c Sin
gle
par
ents
are
ass
um
ed t
o h
ave
two c
hildre
n u
nder
age
3 a
nd t
o w
ork
fu
ll t
ime
at 6
7 p
erce
nt
of
the
aver
age
wag
e.
So
uR
Ce
: oe
Cd
Fam
ily
dat
abas
e, a
s of
oct
obe
r 2009 a
nd o
eC
d (
2007).

80 f a m i ly P o l i c i e s i n oecD c o u n t r i e s
APPENDIX TAblE A3 Characteristics of benefits and tax transfers for families
Support to Maximum Single- Fiscal low-income benefit parent privilege benefits and familiesa amount for benefitsd to equal- tax breaks (% of one childb Family (% of earner for families average (% of average size average house- (% of GDP) earnings) earnings) ratioc earnings) holdse Country 2005 2004 2005 2004 2005 2006
australia 2.2 6.6 14 .. 8 4.0austria 2.4 1.4 7 3.5 0 8.3Belgium 2.2 1.1 3 6.2 1 2.9Canada 1.0 6.5 8 41.2 1 4.3Czech Republic 1.6 2.6 4 2.9 .. –1.4denmark 1.6 2.6 4 3.0 6 1.9Finland 1.6 2.2 4 2.1 6 10.8France 2.2 1.4 2 7.0 28 –0.3Germany 2.3 0.9 4 3.0 .. –1.6Greece 0.7 0.4 1 .. 0 14.3Hungary 1.9 0.6 3 .. 1 16.5iceland 1.3 2.4 6 0.0 4 –0.2ireland 2.3 1.2 5 3.3 34 2.4italy 0.6 0.0 4 .. .. 5.9Japan 0.8 5.0 1 4.6 10 1.4Korea, South 0.0 9.5 .. .. 1 5.2luxembourg 3.1 1.0 7 .. .. 2.6netherlands 1.2 1.0 2 2.5 .. 6.1new Zealand 1.9 11.2 9 0.0 36 5.0norway 1.7 2.3 3 3.0 37 5.5Poland 0.9 7.4 2 .. 7 0.7Portugal 0.9 3.9 3 .. .. 3.8Slovakia 1.7 1.0 3 3.0 .. –0.1Spain 0.5 2.5 1 .. .. 0.9Sweden 1.5 1.7 4 6.1 5 7.6Switzerland 1.0 1.8 3 .. .. 1.3united Kingdom 2.6 2.7 3 2.4 5 4.1united States 0.7 2.8 3 2.9 .. 0.0oeCd-28 1.5 3.0 4.2 .. .. 4.0
.. data not available atargeting of support on low-income parents is estimated as the ratio between the proportion of total financial assistance for children paid to low-income families (up to 25 percent of average earnings) and the proportion paid to families with two workers at average earnings (i.e., household income equals twice the average wage). assistance for children is cal-culated as the difference between the net income of a single-income couple without children and a single-income couple with two children, expressed as a percentage of the average worker’s earnings (oeCd 2007: table 4.2). bthis measures the maximum benefit that can be received by households with one child aged 3–12 years, measured as a percent of average earnings. Source: oeCd (2007), Benefits and wages: oeCd indicators, Paris. cthe family size ratio is the relative difference in the supplement of income after tax and benefits given to couples with three children compared to supplement of net income to couples with the same earnings and one child. it is based on two-earner couples with average earnings, with children aged 7–14 years. these estimates are derived from the Bradshaw and Finch dataset on the transfers received by families, broken down by family type (see Bradshaw and mayhew 2006). dthis estimates the maximum additional benefit received by a single parent with a child under 3, measured as a percent of average earnings. Source: oeCd (2007), Benefits and wages: oeCd indicators, Paris. ethe incentive to have a second earner in the household is measured by the difference in the marginal effective tax rate of a single-earner married couple where the earnings rise from half to 100 percent of average earnings after an increase in the working partner’s labor supply (the other partner remaining inactive) and the marginal tax rate applying to the same increase in earnings due to the labor supply of the second earner, the first earner being assumed to earn 67 percent of the average income. a positive value indicates that single-earner households pay more tax than dual earners with the same increase in income (i.e. that there is an advantage for dual-earner families). this estimation is limited, however, because differences in taxation vary with household income. SouRCe: oeCd Family database, as of october 2009.

o l i v i e r t h é v e n o n 81
APPENDIX TAblE A4 Correlations between active variables and axes in principal component analysis
Axis 1 Axis 2 Axis 3 Axis 4 Axis 5
Spending in middle/early childhood 0.56 0.15 0.66 0.01 0.19Spending on services (% GdP) –0.88 –0.17 0.12 –0.22 –0.03Spending on services for children under 3 –0.75 –0.12 0.30 0.02 –0.28Spending on services for preschool children –0.06 –0.72 –0.41 –0.33 –0.17Coverage of services (0–2 years) –0.35 –0.50 0.41 –0.52 –0.03average hours of formal care attendance (0–2 years) –0.24 0.49 0.34 –0.33 –0.29Coverage of preschool (3–5 years) –0.28 –0.24 0.19 –0.19 0.42net childcare costs for dual-earner family 0.46 –0.58 0.09 0.11 0.15net childcare costs for single parent 0.57 –0.13 0.06 0.35 –0.11Spending on maternity and parental leave –0.77 0.33 –0.14 0.24 –0.16Fte length of maternity leave –0.17 0.55 –0.13 –0.12 0.31Fte length of parental leave –0.47 0.49 0.02 0.51 0.01maximum length of maternity and parental leave –0.34 0.49 –0.24 0.54 0.24Fte length of paternity leave –0.72 0.04 0.33 –0.11 –0.24Benefits and tax breaks for families (% GdP) –0.35 –0.50 –0.48 0.32 0.15Support to low-income families 0.38 –0.03 0.62 0.34 –0.34max. benefit amount for one child 0.13 –0.57 –0.14 0.32 –0.47Family size ratio 0.32 0.06 0.10 0.25 –0.61Single-parent benefit –0.03 –0.37 –0.06 0.07 0.48etR of a transition from jobless to one-earner couple –0.48 –0.48 0.36 0.47 0.12etR of a transition from one-earner to two-earner couple –0.38 –0.39 –0.28 0.16 –0.36Fiscal advantage to equal-earner households –0.11 0.27 –0.26 –0.23 –0.35etR for single parent of transition to employment –0.44 –0.37 0.48 0.34 0.30
noteS: Fte = full-time equivalent (see note to table a1); etR = effective tax rate (see notes to Figure 2).

AP
PE
ND
IX T
Ab
lE
A5
Ch
arac
teri
stic
s o
f th
e co
nte
xts
of
fam
ily
po
lici
es
P
ov
erty
rate
sa P
ov
erty
P
ov
erty
F
emal
e S
har
e o
f
bef
ore
ra
tesb
ra
tesb
in
C
hil
d
Mea
n a
ge
emp
loy
men
t p
art-
tim
e
tax
es a
nd
in
co
up
le
sin
gle-
par
ent
po
ver
ty
Per
iod
D
ecre
ase
of
mo
ther
ra
te
emp
loy
men
t
tran
sfer
s fa
mil
ies
fam
ilie
s ra
tesc
fert
ilit
y r
ates
in
TF
R
at fi
rst
bir
th
(age
25–
49)
in f
amil
y
Co
un
try
m
id-2
000s
m
id-2
000s
m
id-2
000s
m
id-2
000s
20
05
sin
ce 1
970
2005
20
07
2007
au
stra
lia
28.6
6.5
3
8.3
1
1.8
1
.81
1
.1
26
.8
69
.6
40
.7a
ust
ria
23.1
4.5
2
1.2
6
.2
1.4
1
0.9
2
6.3
7
6.1
3
1.4
Bel
giu
m
32.7
7.3
2
5.1
1
0.0
1
.72
0
.5
27
.4
74
.1
34
.7C
anad
a 23.1
9.3
4
4.7
1
5.1
1
.53
0
.7
28
.0
76
.9
26
.2C
zech
Rep
ubl
ic
28.2
5.5
3
2.0
1
0.3
1
.28
0
.6
24
.9
69
.2
5.6
den
mar
k
23.6
2.0
6
.8
2.7
1
.80
0
.2
27
.7
79
.4
25
.6Fin
lan
d
17.6
2.7
1
3.7
4
.2
1.8
0
0.0
2
7.4
7
8.7
1
4.9
Fra
nce
30.7
5.8
1
9.3
7
.6
1.9
4
0.5
2
7.9
7
5.1
2
2.9
Ger
man
y 33.6
8.6
4
1.5
1
6.3
1
.34
0
.7
28
.2
73
.3
39
.2G
reec
e 32.5
11.7
2
6.5
1
3.2
1
.28
1
.1
26
.6
61
.6
12
.9H
un
gary
29.9
6.8
2
5.2
8
.7
1.3
2
0.7
2
5.1
6
4.1
4
.2ic
elan
d
20.1
6.2
1
7.9
8
.3
2.0
5
0.8
2
5.5
8
2.6
2
6.0
irel
and
30.9
10.1
4
7.0
1
6.3
1
.88
2
.1
27
.8
69
.5
34
.9it
aly
33.8
14.0
2
5.6
1
5.5
1
.34
1
.4
28
.0
58
.9
29
.4Ja
pan
26.9
10.5
5
8.7
1
3.7
1
.26
0
.8
28
.0
64
.3
40
.9K
ore
a, S
ou
th
17.5
8.1
2
6.7
1
0.7
1
.08
1
.9
29
.1
60
.0
12
.3lu
xem
bou
rg
29.1
9.7
4
1.2
1
2.4
1
.70
0
.3
28
.4
71
.5
27
.2n
eth
erla
nds
24.7
6.3
3
9.0
1
1.5
1
.73
0
.8
28
.6
78
.2
59
.7n
ew Z
eala
nd
26.6
9.4
3
9.1
1
5.0
2
.01
1
.3
30
.1
71
.8
34
.5n
orw
ay
24.0
2.1
1
3.3
4
.6
1.8
4
0.7
2
6.9
8
1.0
3
2.9
Pola
nd
37.5
18.4
4
3.5
2
1.5
1
.24
1
.0
24
.5
70
.2
16
.3Port
uga
l 29.0
13.3
3
3.4
1
6.6
1
.40
1
.4
26
.5
76
.5
13
.2Slo
vakia
27.4
9.2
3
3.5
1
0.9
1
.25
1
.2
24
.2
67
.6
4.1
Spai
n
17.6
13.9
4
0.5
1
7.3
1
.34
1
.6
29
.1
65
.7
21
.4Sw
eden
26.7
2.8
7
.9
4.0
1
.77
0
.2
27
.9
79
.8
19
.0Sw
itze
rlan
d
18.0
4.9
1
8.5
9
.4
1.4
2
0.7
2
9.1
7
7.0
4
5.7
un
ited
Kin
gdom
26.3
6.1
2
3.7
1
0.1
1
.80
0
.6
29
.1
72
.1
38
.8u
nit
ed S
tate
s 26.3
13.6
4
7.5
2
0.6
2
.05
0
.4
24
.9
71
.2
17
.8o
eC
d–2
8
23.7
8.4
3
0.4
1
1.6
1
.6
0.9
2
7.3
7
2.0
2
6.2
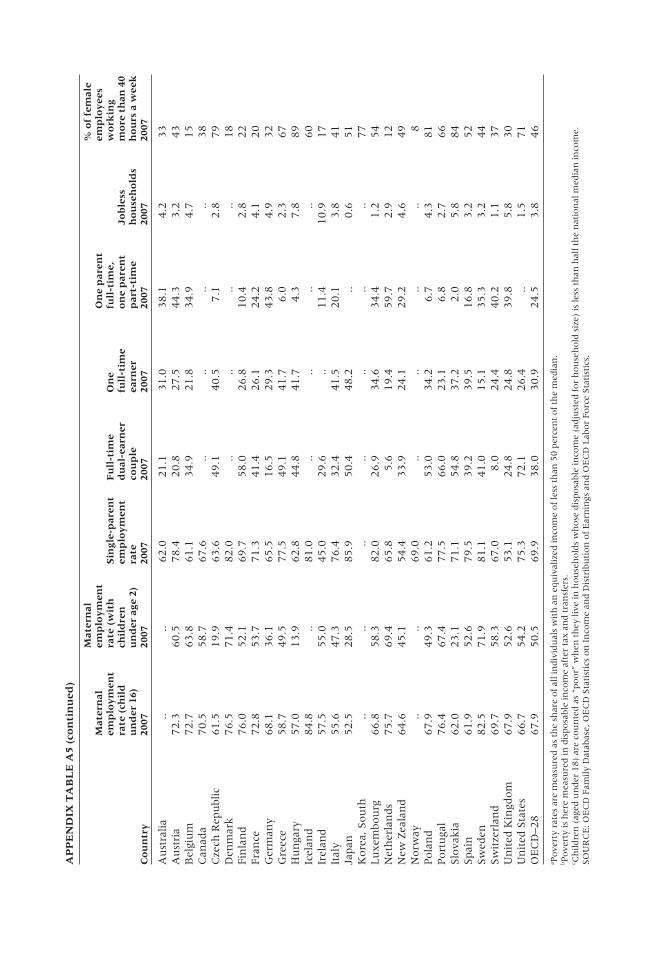
AP
PE
ND
IX T
Ab
lE
A5
(co
nti
nu
ed)
Mat
ern
al
%
of
fem
ale
M
ater
nal
em
plo
ym
ent
O
ne
par
ent
em
plo
yee
s
emp
loy
men
t ra
te (
wit
h
Sin
gle-
par
ent
Fu
ll-t
ime
On
e fu
ll-t
ime,
wo
rkin
g
rate
(ch
ild
ch
ild
ren
em
plo
ym
ent
du
al-e
arn
er
full
-tim
e o
ne
par
ent
Job
less
m
ore
th
an 4
0
un
der
16)
u
nd
er a
ge 2
) ra
te
cou
ple
ea
rner
p
art-
tim
e h
ou
seh
old
s h
ou
rs a
wee
k
Co
un
try
20
07
2007
20
07
2007
20
07
2007
20
07
2007
au
stra
lia
..
..
62
.0
21
.1
31
.0
38
.1
4.2
3
3a
ust
ria
72.3
60.5
7
8.4
2
0.8
2
7.5
4
4.3
3
.2
43
Bel
giu
m
72.7
63.8
6
1.1
3
4.9
2
1.8
3
4.9
4
.7
15
Can
ada
70.5
58.7
6
7.6
..
..
..
..
38
Cze
ch R
epu
blic
61.5
19.9
6
3.6
4
9.1
4
0.5
7
.1
2.8
7
9d
enm
ark
76.5
71.4
8
2.0
..
..
..
..
18
Fin
lan
d
76.0
52.1
6
9.7
5
8.0
2
6.8
1
0.4
2
.8
22
Fra
nce
72.8
53.7
7
1.3
4
1.4
2
6.1
2
4.2
4
.1
20
Ger
man
y 68.1
36.1
6
5.5
1
6.5
2
9.3
4
3.8
4
.9
32
Gre
ece
58.7
49.5
7
7.5
4
9.1
4
1.7
6
.0
2.3
6
7H
un
gary
57.0
13.9
6
2.8
4
4.8
4
1.7
4
.3
7.8
8
9ic
elan
d
84.8
..
8
1.0
..
..
..
..
60
irel
and
57.5
55.0
4
5.0
2
9.6
..
1
1.4
1
0.9
1
7it
aly
55.6
47.3
7
6.4
3
2.4
4
1.5
2
0.1
3
.8
41
Japan
52.5
28.5
8
5.9
5
0.4
4
8.2
..
0
.6
51
Kore
a, S
ou
th
..
..
..
..
..
..
..
77
lu
xem
bou
rg
66.8
58.3
8
2.0
2
6.9
3
4.6
3
4.4
1
.2
54
net
her
lan
ds
75.7
69.4
6
5.8
5
.6
19
.4
59
.7
2.9
1
2n
ew Z
eala
nd
64.6
45.1
5
4.4
3
3.9
2
4.1
2
9.2
4
.6
49
norw
ay
..
..
69
.0
..
..
..
..
8Pola
nd
67.9
49.3
6
1.2
5
3.0
3
4.2
6
.7
4.3
8
1Port
uga
l 76.4
67.4
7
7.5
6
6.0
2
3.1
6
.8
2.7
6
6Slo
vakia
62.0
23.1
7
1.1
5
4.8
3
7.2
2
.0
5.8
8
4Spai
n
61.9
52.6
7
9.5
3
9.2
3
9.5
1
6.8
3
.2
52
Sw
eden
82.5
71.9
8
1.1
4
1.0
1
5.1
3
5.3
3
.2
44
Sw
itze
rlan
d
69.7
58.3
6
7.0
8
.0
24
.4
40
.2
1.1
3
7u
nit
ed K
ingd
om
67.9
52.6
5
3.1
2
4.8
2
4.8
3
9.8
5
.8
30
un
ited
Sta
tes
66.7
54.2
7
5.3
7
2.1
2
6.4
..
1
.5
71
oe
Cd
–28
67.9
50.5
6
9.9
3
8.0
3
0.9
2
4.5
3
.8
46
a Pove
rty
rate
s ar
e m
easu
red a
s th
e sh
are
of
all i
ndiv
idu
als
wit
h a
n e
qu
ival
ized
inco
me
of
less
th
an 5
0 p
erce
nt
of
the
med
ian
. b P
ove
rty
is h
ere
mea
sure
d in
dis
posa
ble
inco
me
afte
r ta
x a
nd t
ran
sfer
s.
c Ch
ildre
n (
aged
un
der
18)
are
cou
nte
d a
s “p
oor”
wh
en t
hey
live
in h
ou
seh
old
s w
hose
dis
posa
ble
inco
me
(adju
sted
for
hou
seh
old
siz
e) is
less
th
an h
alf
the
nat
ion
al m
edia
n in
com
e.
So
uR
Ce
: oe
Cd
Fam
ily
dat
abas
e, o
eC
d S
tati
stic
s on
in
com
e an
d d
istr
ibu
tion
of
ear
nin
gs a
nd o
eC
d l
abor
Forc
e Sta
tist
ics.

84 f a m i ly P o l i c i e s i n oecD c o u n t r i e s
Figures in this article are available in color in the electronic edition of the journal.
i am indebted to willem adema, annette Panzera, and maria Huerta, who have devoted constant effort to developing the oeCd Fam-ily database. willem adema also provided valuable comments on an earlier draft of this article. the views expressed in this article can-not be attributed to the oeCd or its member Countries. this research was funded by the european Commission within the project “Re-productive decision-making in macro–micro perspective” (RePRo).
1 Collecting data on benefit or leave uptake has, for example, proved to be impos-sible: although administrative data identify the number of persons taking leave or receiving benefits, there are no estimates of the total population eligible to claim them.
2 the indicators in appendix table a3 are partial measures of the progressivity of support. nonetheless, other estimates of the targeting of family transfers on low-income groups, such as those calculated in the same way as the Gini coefficient, are in broad agreement (see table 6 in whiteford and adema 2007). Because these estimates are not available for the complete set of countries, the principal component analysis carried out below includes only the “low-income” ratio given in column 2 of table a3.
3 the dataset used here includes an unbalanced number of variables represent-ing the three aspects of family policy (leave, services, benefits). the incidence of one set of characteristics can thus be overestimated simply because the number of variables de-scribing one policy dimension is larger. to overcome this problem, the same data were analyzed using multifactorial analysis (mFa) to weight each of the three groups of family policy instruments. this analysis produced results very similar to the ones presented here and showed that such weighting was not necessary. a cluster analysis was also carried out to observe how countries can be progressively grouped together. However, since the results are quite sensitive to the number of axes considered, my comments
are based on the results of the PCa only. dif-ferent analyses were also performed to assess the treatment of missing values in the data-set: details are available on request «[email protected]».
4 a discontinuity in the decreasing series of variances (more precisely, in the series of diminishing eigenvalues of the correlation matrixes) is often taken to indicate a threshold at which the inclusion of further dimensions can cease (Cattell 1966). in this case, the eigenvalues decrease sharply from the third. the correlations defining the first five axes are given in table a4. Further details of the analy-sis are available from the author on request «[email protected]».
5 in 2008 only 1 percent of children un-der age 1 year and 42 percent between ages 1 and 2 were enrolled in day-care centers and other subsidized services (noSoSCo 2009). By comparison, in norway, where home care leave is also available for more than one year (47 weeks Fte paid leave), the enrollment rates for subsidized formal care were 4 percent for children under age 1 and 75 percent for children between 1 and 2 years.
6 Because they are not statutory, the cov-erage of employer-provided benefits is difficult to assess. they can be substantial, however: in australia, data from the Pregnancy and em-ployment transitions Survey in 2005 showed that 73 percent of mothers with children under age 2 years who worked as a wage em-ployee in their last main job while pregnant took 34 weeks of leave on average.
7 in France, this long period of leave (156 weeks) paid at a fixed rate applies to births of a second or subsequent child. Parents of one child only are entitled to a shorter leave (26 weeks) after the standard maternity leave.
8 this position is confirmed by the results of a cluster analysis run on the same set of data; results are not presented.
9 note also that other contextual param-eters, such as the relative proportion of seniors in the population, have not been found to be highly correlated with the identified differ-ences in policy patterns.
Notes
o l i v i e r t h é v e n o n 85
10 it is difficult, both theoretically and empirically, to distinguish between “contextu-al” and “outcome” variables. while the former variables shape policy objectives, the latter are the variables that policies are directly designed to affect. However, some variables may be considered as both contextual and outcome, depending on whether they are observed be-fore or after policy change. two criteria can be used to separate contextual information from outcomes: one is to consider, when possible, values of variables before policy impact, as done here for poverty rates measured before tax and transfers; the second is to consider the contextual situation during the period
preceding the observation of policy variables. Such contextual data are not available in the dataset used here. it would also be misleading to consider contextual variables as “ex ante” conditions since they result from past policies. addressing the endogeneity of policies would guarantee a clearer separation between con-textual and outcome variables.
11 table of correlations available on re-quest «[email protected]». technically, these variables were introduced as “illustra-tive” parameters in the component analysis and consequently did not enter into the defini-tion of the axes derived from policy variables, which were the only “active” variables.
References
adema, w., m. Huerta, a. Panzera, o. thévenon, and m. Pearson. 2009. “the oeCd Family database: developing a cross-national tool for assessing family policies and outcomes,” Child Indicators Research 2(4): 437–460.
ahn, n. and P. mira. 2002. “a note on the relationship between fertility and female employ-ment rates in developed countries,” Journal of Population Economics 15(4): 667–682.
Bettio, F. and J. Plantenga. 2004. “Comparing care regimes in europe,” Feminist Economist 10(1): 85–113.
Bradshaw, J. and e. mayhew. 2006. “Family benefit packages,” in J. Bradshaw and a. Hatland (eds.), Social Policy, Family Change and Employment in Comparative Perspective. Cheltenham: edward elgar.
Cattell, R. B. 1966. “the Scree test for the number of factors,” Multivariate Behavioral Research 1(2): 245–276.
d’addio, a. and m. mira d’ercole. 2005. “trends and determinants of fertility rates in oeCd countries: the role of policies,” Social, employment and migration working Papers 27, oeCd, Paris.
datta Gupta, n., n. Smith, and m. verner. 2008. “Childcare and parental leave in the nordic countries: a model to aspire to?,” Review of Economics of the Household 6(1): 65–89.
de Hénau, J., d. meulders, and S. o’dorchai. 2006. “the childcare triad? indicators assessing three fields of child policies for working mothers in the eu-15,” Journal of Comparative Policy Analysis 8(2): 129–148.
ellingsæter, a. l. and a. leira (eds.). 2006. Politicising Parenthood in Scandinavia: Gender Relations in Welfare States. Bristol: Policy Press.
esping-andersen, G. 1999. Social Foundations of Postindustrial Economies. oxford: oxford uni-versity Press.
———. 2009. The Incomplete Revolution—Adapting Welfare States to Women’s New Roles. Cambridge: Polity Press.
european Commission. 2005. “Confronting demographic change: a new solidarity between the generations,” Green Paper 94.
Fagnani, J. and a. math. 2008. “Family packages in 11 european countries: multiple ap-proaches,” in a. leira and C. Saraceno (eds.), Childhood: Changing Contexts. Bingley: emerald Group Publishing, pp. 55–78.
Ferrera, m. (ed.). 2005. “welfare state reform in Southern europe—Fighting poverty and social exclusion in italy, Spain, Portugal and Greece,” Routledge/EUI Studies in the Political Economy of Welfare.
86 f a m i ly P o l i c i e s i n oecD c o u n t r i e s
Gauthier, a. H. 2002. “Family policies in industrialized countries: is there convergence?,” Population 57 (2): 447–474.
Gauthier, a. and d. Philipov. 2008. “Can policies enhance fertility in europe?,” Vienna Year-book of Population Research, pp. 1–16.
Gornick, J. and m. meyers. 2006. “welfare regimes in relation to paid work and care: a view from the united States on social protection in the european countries,” Revue Française des Affaires Sociales. Paris.
Gornick, J., m. meyers, and K. Ross. 1997. ‘Supporting the employment of mothers: Policy variation across fourteen welfare states,” Journal of European Social Policy 7(1): 45–70.
Hantrais, l. 2007. Social Policy in the European Union. Basinstoke: Palgrave macmillan.Heckman, J. and d. masterov. 2007. “the productivity argument for investing in young
children,” nBeR working paper 13016.immervoll, H. and d. Barber. 2005. “Can parents afford to work? Childcare costs, tax-benefit
policies and work incentives,” oeCd Social, employment and migration working Papers 31, Paris.
Kamerman, S., m. neuman., J. waldfogel, and J. Brooks-Gunn. 2003. “Social policies, family types and child outcomes in selected oeCd countries,” oeCd Social, employment and migration working Papers 6, Paris.
Kaufmann, F. X., a. Kuijstrn, H. J. Schulze, and K. P Strohmeier (eds.). 2002. Family Life and Family Policies in Europe, vol.2 Problems and Issues in Comparative Perspective. oxford university Press.
letablier, m.th., a. luci, a. math, and o. thévenon (eds.). 2009. The Costs of Raising Children and the Effectiveness of Supporting Parenthood Policies in European Countries: A Literature Review. Rapport pour la Commission européenne, ined.
lewis, J. 1992. “Gender and the development of welfare regime,” Journal of European Social Policy 2(3): 159–173.
———. 2006. ‘what instruments to foster what kind of gender equality?,” Revue Française des Affaires Sociales, special vol. Social Welfare Reforms in Europe 1: 147–166.
lohmann, H., F. H. Peter, t. Rostgaard, and C. K. Spiess. 2009. “towards a framework for assessing family policies in the eu,” oeCd Social, employment and migration working Papers 88 «www.oecd.org/els/workingpapers».
luci, a. 2009. “indirect cost of children in a macroeconomic perspective: the impact of gen-der gap in education and employment and of fertility on country’s growth,” in m.th. letablier, a. luci, a. math, and o. thévenon (eds.), The Costs of Raising Children and the Effectiveness of Supporting Parenthood Policies in European Countries: A Literature Review. Rapport pour la Commission européenne, ined, Paris.
maitre, B., B. nolan, and C. t. whelan. 2005. “welfare regimes and household income pack-aging in the european union,” Journal of European Social Policy 15 (2): 157–171.
meulders, d. and S. o’dorchai. 2007. “the position of mothers in a comparative welfare state perspective,” in d. del Boca and C. wetzels (eds,), Social Policies, Labour Markets and Motherhood. Cambridge university Press, pp. 3–27.
moss, P. and th. Coram. 2008. “making parental leave parental: an overview of policies to increase fathers’ use of leave, ” in P. moss and m. Korintus (eds.), International Review of Leave Policies and Related Research 2008. employment Relations Research Series no. 100.
moss, P. and m. Korintus (eds.). 2008. International Review of Leave Policies and Related Research 2008. employment Relations Research Series no. 100.
noSoSCo. 2009. “Social protection in the nordic Countries, 2007/08,” «http://nososco-eng.nom-nos.dk/».
oeCd Family database. «www.oecd.org/els/social/family/database».oeCd. 2002–2007. Babies and Bosses: Reconciling Work and Family Life, vols. 1–5, Paris.———. 2009a. Growing Unequal? Income Distribution and Poverty in OECD Countries. Paris.———. 2009b. Doing Better for Children. Paris.

o l i v i e r t h é v e n o n 87
Ray, R., J Gornick, and J. Schmitt. 2009. “Parental leave policies in 21 countries: assessing generosity and gender equality,” Center for economic and Policy Research, new York.
Ritakallio, v-m. and J. Bradshaw. 2006. “Family poverty in the european union,” in J. Brad-shaw and a. Hatland (eds.), Social Policy, Family Change and Employment in Comparative Perspective. Cheltenham: edward elgar.
Rostgaard, t. 2004. “Family support policy in Central and eastern european countries: a de-cade and half of transition,” unesco education Center.
Szelewa, d. and m. Polakowski. 2008. “who cares? Changing patterns of childcare in Central and eastern europe,” Journal of European Social Policy 18: 115–131.
thévenon o. 2006. ‘Régimes d’etat Social et convention familiale: une analyse des régulations emploi-famille,” Economies et Sociétés, série ‘socio-économie’ du travail 27(6): 137–171.
———. 2009a. “assessing the cost of children: a challenge for policies,” in m.th. letablier, a. luci, a. math, and o. thévenon (eds.), The Costs of Raising Children and the Effectiveness of Supporting Parenthood Policies in European Countries: A Literature Review. Rapport pour la Commission européenne, ined.
———. 2009b. “increased women’s labour force participation in europe: Progress in the work-life balance or polarization of behaviours?,” Population-E 64(2): 235–272.
witheford, P. and w. adema. 2007. “what works best in reducing child poverty: a benefit or work strategy?,” oeCd Social, employment and migration working Papers 51, Paris.