Family Firms and Labor Relationspages.stern.nyu.edu/~hmueller/papers/Labor.pdflabor relations. In...
28
218 American Economic Journal: Macroeconomics 3 (April 2011): 218–245 http://www.aeaweb.org/articles.php?doi=10.1257/mac.3.2.218 I think the fact that I’m in the Heinz family helps make for a better climate in labor negotiations. — Charles Heinz 1 E mpirical evidence suggests that family ownership has important implications for economic growth. Several studies find that family firms—at least second- and later-generation family firms in which the chief executive officer (CEO) is a family member, especially if CEO succession is based on primogeniture—perform relatively poorly (e.g., Francisco Pérez-González 2006; Morten Bennedsen et al. 2007; Nicholas Bloom and John van Reenen 2007), which has negative implications for economic growth. 2 Moreover, the reluctance of many families to accept dilution 1 Vice president of industrial relations at H. J. Heinz Company. The quote is from Perrin Stryker, “Would You Hire Your Son?” March 1957, 228, cited in Robert G. Donnelley (1964). 2 When first-generation family firms and those run by professional (i.e., nonfamily) managers are included in the definition, family firms are generally found to outperform other firms (e.g., Ronald C. Anderson and David M. Reeb 2003; Belen Villalonga and Raphael Amit 2006; Bloom and van Reenen 2007). However, these results are purely based on cross-sectional variation, making a causal interpretation difficult. Bennedsen et. al (2007), using the gender of the departing CEO’s firstborn child as an instrument, show that family firms in which the successor CEO is a family member perform worse than those in which the successor CEO is unrelated. By design, their study does not address the issue of whether first-generation family firms perform poorly. * Mueller: NYU Stern School of Business, 44 West Fourth Street, New York, NY 10012 and NBER, CEPR, and ECGI (e-mail: [email protected]); Philippon: NYU Stern School of Business, 44 West Fourth Street, New York, NY 10012 and NBER and CEPR (e-mail: [email protected]). We thank three anonymous referees, our discussants Randall Morck (NBER) and Raghu Rau (WFA), Raj Aggarwal, Lucian Bebchuk, Nick Bloom, Andrew Clark, Michael Faulkender, Oliver Hart, Winfried Koeniger, Lubo Litov, Fausto Panunzi, Mark Roe, Paola Sapienza, Antoinette Schoar, Andrei Shleifer, Jeremy Stein, Guido Tabellini, Paolo Volpin, Jeff Wurgler, Bernie Yeung, and seminar participants at Harvard University, Stanford University, Princeton University, University of California-Berkeley, New York University, Northwestern University, Washington University in St. Louis, University of Minnesota, USC, Bocconi, DELTA-PSE, the PSE-IZA Workshop on Cultural Economics in Paris, the WFA meetings in Keystone, and the NBER Corporate Finance Summer Institute in Cambridge for helpful comments. We are especially grateful to Nick Bloom and Mara Faccio for providing us with data. † To comment on this article in the online discussion forum, or to view additional materials, visit the article page at http://www.aeaweb.org/articles.php?doi=10.1257/mac.3.2.218. Family Firms and Labor Relations † By Holger M. Mueller and Thomas Philippon* This paper examines the relationship between family ownership and the quality of labor relations. We find that family ownership is more prevalent in countries in which labor relations are hostile, consistent with the notion that family firms are particularly effective at coping with difficult labor relations. Our results are robust to controlling for minority shareholder protection and other potential determinants of family ownership. To address endogeneity issues, we show that, controlling for industry- and country-fixed effects, industries that are more labor dependent have relatively more family ownership in countries with worse labor relations. (JEL G32, G34, J52, J53)
Transcript of Family Firms and Labor Relationspages.stern.nyu.edu/~hmueller/papers/Labor.pdflabor relations. In...
218
American Economic Journal: Macroeconomics 3 (April 2011): 218–245http://www.aeaweb.org/articles.php?doi=10.1257/mac.3.2.218
I think the fact that I’m in the Heinz family helps make for a better climate in labor negotiations.
— Charles Heinz1
Empirical evidence suggests that family ownership has important implications for economic growth. Several studies find that family firms—at least second-
and later-generation family firms in which the chief executive officer (CEO) is a family member, especially if CEO succession is based on primogeniture—perform relatively poorly (e.g., Francisco Pérez-González 2006; Morten Bennedsen et al. 2007; Nicholas Bloom and John van Reenen 2007), which has negative implications for economic growth.2 Moreover, the reluctance of many families to accept dilution
1 Vice president of industrial relations at H. J. Heinz Company. The quote is from Perrin Stryker, “Would You Hire Your Son?” March 1957, 228, cited in Robert G. Donnelley (1964).
2 When first-generation family firms and those run by professional (i.e., nonfamily) managers are included in the definition, family firms are generally found to outperform other firms (e.g., Ronald C. Anderson and David M. Reeb 2003; Belen Villalonga and Raphael Amit 2006; Bloom and van Reenen 2007). However, these results are purely based on cross-sectional variation, making a causal interpretation difficult. Bennedsen et. al (2007), using the gender of the departing CEO’s firstborn child as an instrument, show that family firms in which the successor CEO is a family member perform worse than those in which the successor CEO is unrelated. By design, their study does not address the issue of whether first-generation family firms perform poorly.
* Mueller: NYU Stern School of Business, 44 West Fourth Street, New York, NY 10012 and NBER, CEPR, and ECGI (e-mail: [email protected]); Philippon: NYU Stern School of Business, 44 West Fourth Street, New York, NY 10012 and NBER and CEPR (e-mail: [email protected]). We thank three anonymous referees, our discussants Randall Morck (NBER) and Raghu Rau (WFA), Raj Aggarwal, Lucian Bebchuk, Nick Bloom, Andrew Clark, Michael Faulkender, Oliver Hart, Winfried Koeniger, Lubo Litov, Fausto Panunzi, Mark Roe, Paola Sapienza, Antoinette Schoar, Andrei Shleifer, Jeremy Stein, Guido Tabellini, Paolo Volpin, Jeff Wurgler, Bernie Yeung, and seminar participants at Harvard University, Stanford University, Princeton University, University of California-Berkeley, New York University, Northwestern University, Washington University in St. Louis, University of Minnesota, USC, Bocconi, DELTA-PSE, the PSE-IZA Workshop on Cultural Economics in Paris, the WFA meetings in Keystone, and the NBER Corporate Finance Summer Institute in Cambridge for helpful comments. We are especially grateful to Nick Bloom and Mara Faccio for providing us with data.
† To comment on this article in the online discussion forum, or to view additional materials, visit the article page at http://www.aeaweb.org/articles.php?doi=10.1257/mac.3.2.218.
Family Firms and Labor Relations†
By Holger M. Mueller and Thomas Philippon*
This paper examines the relationship between family ownership and the quality of labor relations. We find that family ownership is more prevalent in countries in which labor relations are hostile, consistent with the notion that family firms are particularly effective at coping with difficult labor relations. Our results are robust to controlling for minority shareholder protection and other potential determinants of family ownership. To address endogeneity issues, we show that, controlling for industry- and country-fixed effects, industries that are more labor dependent have relatively more family ownership in countries with worse labor relations. (JEL G32, G34, J52, J53)
ContentsFamily Firms and Labor Relations† 218
I. Main Hypothesis and Micro-level Evidence 220A. Main Hypothesis 221B. Micro-level Evidence 222II. Data 224A. Ownership Data 224B. Labor Relations Data 227III. Family Ownership and Labor Relations 228A. Basic OLS Regressions 228B. Labor-Specific or General Social Capital? 231C. Legal Determinants of Family Ownership 232D. Other Determinants of Family Ownership 234IV. Labor Origin 236V. Family Ownership Across Industries and Countries 239VI. Strike Activity 241A. Quebec versus the Rest of Canada 241B. Strike Activity in the 1960s 242VII. Conclusion 243REFERENCES 244
VOL. 3 NO. 2 219MuELLER AND pHiLippON: FAMiLy FiRMS AND LABOR RELATiONS
of their ownership stakes impairs their ability to raise equity capital, which again has negative implications for economic growth.
There is considerable variation in family ownership across countries. A leading explanation is that this variation is due to differences in minority shareholder protec-tion (Rafael La Porta, Florencio Lopez-de-Silanes, and Andrei Shleifer 1999). This paper focuses on a different explanation; family firms are particularly effective at coping with hostile labor relations, so they arise as a natural response when labor relations are difficult. For instance, due to their longer time horizons, family owners may have a comparative advantage at sustaining implicit labor contracts, which may be reciprocated by workers with cooperative behavior. Moreover, family owners may be tougher on labor than professional managers are. Given their typically large ownership stakes, family owners may be more willing to put up with the (psycho-logical and other) costs of confronting hostile labor, whereas hired managers tend to prefer the “quiet life” (Marianne Bertrand and Sendhil Mullainathan 2003).
Consistent with the notion that family firms are particularly effective at coping with hostile labor relations, we find that they are more prevalent in countries in which labor relations are difficult. This result is robust across many specifications. It holds for different subsamples (e.g., Europe, Asia) and different measures of fam-ily ownership. It also holds if we control for other potential determinants of family ownership, such as minority shareholder protection, measures of trust and social capital, creditor rights, rule of law, union bargaining power, labor regulation, a coun-try’s left-right political orientation, income inequality, and financial development. While some of these variables are significant in our regression, our measure of the quality of labor relations is always significant at the 1 percent level. That said, an important limitation of our study is that it is based on a relatively small sample of 30 countries, and even fewer countries in some regressions.
Some of the robustness checks warrant more discussion. First, while minority shareholder protection is significant in our regression, it is not clear in which direc-tion the causality goes. For instance, if families expect not to sell out (e.g., due to rea-sons put forward in this paper), then poor minority shareholder protection could also be due to low demand from business players, implying the causality may be reversed. Second, measures of trust and social capital are generally not significant. We believe this is good news for advocates of social capital theories, as it implies that one can distinguish among different forms of social capital, each of which may be relevant in a different context. Third, neither union bargaining power nor labor regulation is significant in our regression. Hence, it is not just some aspect of labor pressure that is relevant for family ownership, but it is precisely the issue of whether labor is hostile or cooperative.3 Fourth, measures of a country’s political orientation, such as Marco Pagano and Paolo F. Volpin’s (2005) voting index or Mark J. Roe’s (2003)
3 Compare, for instance, Sweden and Italy. Employment protection is tighter, and labor unions are stronger, in Sweden than in Italy. In 1994, for example, Sweden’s trade union density was 91 percent, while in Italy it was only 39 percent (Organization for Economic Co-Operation and Development (OECD) 1997). Likewise, the bar-gaining power of labor unions, as perceived by executives, is much higher in Sweden (see Table 1a of the online Appendix). And yet, labor relations are much more hostile in Italy (see, again, Table 1a of the online Appendix). Hence, Sweden has strong yet cooperative labor unions, while Italy has weaker yet hostile and, to a considerable degree, anti-capitalist labor unions.
220 AMERiCAN ECONOMiC JOuRNAL: MACROECONOMiCS ApRiL 2011
left-right political index, are not significant, though they appear to be well suited to explain state ownership. That said, it could be that these measures matter indirectly for family ownership through the quality of labor relations. For instance, if the polity has generous social benefits, then labor’s demand for health, retirement, and other benefits may be lower, facilitating cooperative labor relations.
We address the issue of causality in two ways. We first look into the historical causes for the differences in the quality of labor relations across countries. In his classic book, historian Colin Crouch (1993) documents the struggles of the emerg-ing European liberal states in the eighteenth and nineteenth centuries to maintain a political monopoly, or to claim what he calls “political space.” According to Crouch (1993), there is considerable variation in the way the liberal states dealt with the attempts of guilds and labor organizations to occupy political space—ranging from confrontation to co-optation—which has had a lasting effect on the countries’ indus-trial relations until the present. Based on Crouch’s classification, we construct an instrument, “labor origin,” capturing the extent to which the emerging European lib-eral states confronted guilds and labor organizations. While the IV result confirms our previous OLS result, its usefulness is limited as the instrument is weak accord-ing to the criteria in James H. Stock and Motohiro Yogo (2005). The second way to address causality employs the methodology by Raghuram G. Rajan and Luigi Zingales (1998). The hypothesis is whether, controlling for industry- and country-fixed effects, industries that are more labor dependent have more family ownership in countries with worse labor relations. The result confirms our previous OLS result.
In the main part of our analysis, we use survey-based measures of the quality of labor relations. In the final part of our study, we explore whether the documented relationship between family ownership and labor relations also extends to non-survey-based measures, such as strike activity. To do so, we replace our survey-based measures of the quality of labor relations with actual strike data from the 1960s (Western countries only). The 1960s are ideal for our purposes, as many of the factors that commonly affect strike activity, such as unemployment, were then relatively uniform across Western countries, implying they are naturally being con-trolled for. Consistent with our survey-based results, we find that high strike activity in the 1960s predicts family ownership more than 30 years later. This result also holds if we instrument strike activity using labor origin. Notably, in this case, the IV regression does not suffer from a weak-instruments problem.
The rest of this paper is organized as follows. Section I develops our main hypoth-esis and provides supporting “micro-level” evidence. Section II describes the data. Section III presents our basic OLS regressions and considers alternative hypotheses. Sections IV and V address the issue of causality. Section VI uses strike data from the 1960s to predict family ownership more than 30 years later. Section VII concludes.
I. Main Hypothesis and Micro-level Evidence
This section develops our main hypothesis, which states that family owner-ship should be more prevalent in countries with more hostile labor relations. This hypothesis is consistent with, but is not necessarily evidence of, the notion that fam-ily firms are particularly effective at coping with hostile labor relations, so they arise
VOL. 3 NO. 2 221MuELLER AND pHiLippON: FAMiLy FiRMS AND LABOR RELATiONS
as a natural response when labor relations are difficult. To support this notion, we provide limited “micro-level” evidence showing that family firms have lower union-ization rates and experience fewer strikes than do nonfamily firms. The evidence is not causal though, as it is purely based on cross-sectional variation in family owner-ship. Moreover, that family firms have lower unionization rates may, but need not, be indicative of their ability to keep hostile labor out. This interpretation assumes that labor unions instigate hostility between firms and workers, which may not be true in all countries.
A. Main Hypothesis
Benefits of Family Ownership.—Family-owned firms may be particularly effec-tive at coping with hostile labor relations for two reasons. First, family owners may be tougher on labor than professional managers. Given their typically large owner-ship stakes, family owners may be more willing to put up with the (psychological and other) costs of confronting hostile labor, whereas hired managers tend to prefer the “quiet life” (Bertrand and Mullainathan 2003). Second, due to their longer time horizons, family owners may have a comparative advantage at sustaining implicit labor contracts, which may be reciprocated by workers with cooperative behavior.4 As Andrei Shleifer and Lawrence H. Summers (1988) argue, even if professional managers wanted to commit to such implicit contracts, their ability to do so is often limited if the firm is widely held due to the possibility of a hostile takeover.5 In con-trast, family-owned firms, like any firm with tightly held ownership, are immune to hostile takeovers.
Costs of Family Ownership.—There are many potential costs of family owner-ship, such as forgone diversification benefits and poor operating performance (see the introduction). Given their often poor performance, one might conjecture that family firms have lower surivival rates, running counter to the idea that they have longer time horizons. While this is ultimately an empirical question, it should be noted that poor performance does not immediately imply that family firms have lower survival rates. To the extent that family control is associated with “amenity potential” (Harold Demsetz and Kenneth Lehn 1985)—i.e., nonpecuniary private benefits of control—family owners may keep their companies alive (by tapping their private wealth, if necessary) even if the company performs poorly.
Optimal Degree of Family Ownership.—If family ownership is chosen optimally, the marginal benefits should equal the marginal costs. As argued above, the bene-fits of family ownership may be particularly large when labor relations are hostile.
4 “In some family companies, the loyalty of employees and nonrelated managers to the family and the company is found to be particularly significant. Unlike the loyalty felt toward nonrelated managers, it is not lost when the recipient retires, but tends to be carried over to his son and through him to the company” (Donnelley 1964).
5 “If the stakeholders anticipate a hostile takeover, they will realize the trustworthiness of the incumbent manag-ers is worthless, since they will be duly removed when shareholder interest so demands” (Shleifer and Summers 1988).
222 AMERiCAN ECONOMiC JOuRNAL: MACROECONOMiCS ApRiL 2011
Accordingly, we would expect more family ownership in countries with more hostile labor relations.
B. Micro-level Evidence
Evidence from French publicly Listed Companies.—Using French panel data, David Sraer and David Thesmar (2007) find that employment in family firms is less sensitive to industry shocks than it is in widely held firms, which they argue is “consistent with a view of heir-managed family firms as providing their workers with long-term implicit insurance contracts.” 6 The evidence is not causal, though, and, importantly, it is limited to publicly listed companies, raising concerns about selection bias.
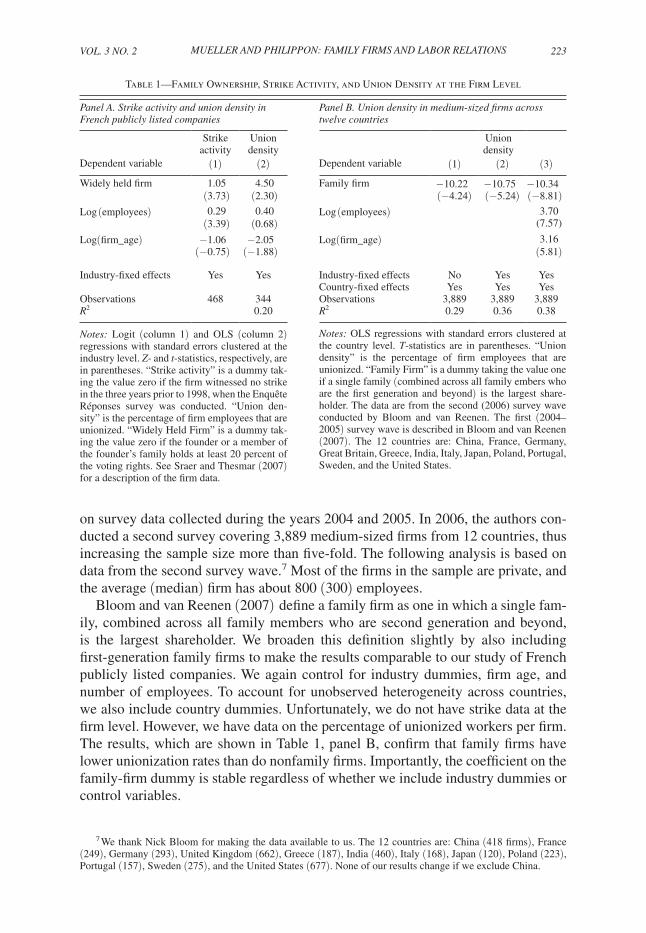
To the extent that French family firms provide their workers with implicit employ-ment insurance, the question is whether workers reciprocate with cooperative behav-ior. To address this question, we match Sraer and Thesmar’s data with data from the “Enquête Réponses,” a survey of managers conducted in 1998 to study plant-level work organization in France. Using Sraer and Thesmar’s (2007) definition, we clas-sify a family firm as one in which the founder or a member of the founder’s family holds at least 20 percent of the voting rights. Two questions from the survey are of interest to us. One question asks whether there has been a strike in the three years prior. The other question asks what is the percentage of workers that are unionized.
A look at the data suggests that strikes are indeed less prevalent in family firms. While only 18 percent of family firms witnessed strikes in the three years prior to the survey, the number for widely held firms is 35 percent. To verify that this result is not driven by family firms’ clustering in particular industries, or by the (often smaller) size of family firms, we run a logit regression in which we control for industry dummies, firm age, and number of employees. The result, which is shown in Table 1, panel A, column 1, confirms that family firms experience fewer strikes than do widely held firms. We obtain a similar result if we use the percentage of unionized workers as our dependent variable. While on average only 10 percent of workers in family firms are unionized, the number for widely held firms is 15 per-cent. As column 2 of panel A shows, the picture is similar if we control for industry dummies, firm age, and number of employees.
An important concern is that the above results are based on publicly listed firms. Family firms are less likely to be publicly listed than other firms, implying those that are publicly listed may be positively selected. To address this concern, we now present evidence from medium-sized firms—most of them private—from 12 differ-ent countries.
Evidence from Medium-Sized Firms from 12 Countries.—In an influential paper, Bloom and van Reenen (2007) examine the management practices of 732 medium-sized firms in the United States, France, Germany, and the United Kingdom based
6 We find a similar result for the United States. Among the 1,000 largest publicly traded companies in the United States, those with a significant ultimate owner (5 percent or more) are less likely to reduce employment than are widely held firms. The result is obtained after controlling for firm size, age, and industry fixed effects.
VOL. 3 NO. 2 223MuELLER AND pHiLippON: FAMiLy FiRMS AND LABOR RELATiONS
on survey data collected during the years 2004 and 2005. In 2006, the authors con-ducted a second survey covering 3,889 medium-sized firms from 12 countries, thus increasing the sample size more than five-fold. The following analysis is based on data from the second survey wave.7 Most of the firms in the sample are private, and the average (median) firm has about 800 (300) employees.
Bloom and van Reenen (2007) define a family firm as one in which a single fam-ily, combined across all family members who are second generation and beyond, is the largest shareholder. We broaden this definition slightly by also including first-generation family firms to make the results comparable to our study of French publicly listed companies. We again control for industry dummies, firm age, and number of employees. To account for unobserved heterogeneity across countries, we also include country dummies. Unfortunately, we do not have strike data at the firm level. However, we have data on the percentage of unionized workers per firm. The results, which are shown in Table 1, panel B, confirm that family firms have lower unionization rates than do nonfamily firms. Importantly, the coefficient on the family-firm dummy is stable regardless of whether we include industry dummies or control variables.
7 We thank Nick Bloom for making the data available to us. The 12 countries are: China (418 firms), France (249), Germany (293), United Kingdom (662), Greece (187), India (460), Italy (168), Japan (120), Poland (223), Portugal (157), Sweden (275), and the United States (677). None of our results change if we exclude China.
Table 1—Family Ownership, Strike Activity, and Union Density at the Firm Level
panel A. Strike activity and union density in French publicly listed companies
panel B. union density in medium-sized firms across twelve countries
Strike activity
Union density
Uniondensity
Dependent variable (1) (2) Dependent variable (1) (2) (3)
Widely held firm 1.05 4.50 Family firm −10.22 −10.75 −10.34(3.73) (2.30) (−4.24) (−5.24) (−8.81)
Log (employees) 0.29 0.40 Log (employees) 3.70(3.39) (0.68) (7.57)
Log(firm_age) −1.06 −2.05 Log(firm_age) 3.16(−0.75) (−1.88) (5.81)
Industry-fixed effects Yes Yes Industry-fixed effects No Yes YesCountry-fixed effects Yes Yes Yes
Observations 468 344 Observations 3,889 3,889 3,889R2 0.20 R2 0.29 0.36 0.38
Notes: Logit (column 1) and OLS (column 2) regressions with standard errors clustered at the industry level. Z- and t-statistics, respectively, are in parentheses. “Strike activity” is a dummy tak-ing the value zero if the firm witnessed no strike in the three years prior to 1998, when the Enquête Réponses survey was conducted. “Union den-sity” is the percentage of firm employees that are unionized. “Widely Held Firm” is a dummy tak-ing the value zero if the founder or a member of the founder’s family holds at least 20 percent of the voting rights. See Sraer and Thesmar (2007) for a description of the firm data.
Notes: OLS regressions with standard errors clustered at the country level. T-statistics are in parentheses. “Union density” is the percentage of firm employees that are unionized. “Family Firm” is a dummy taking the value one if a single family (combined across all family embers who are the first generation and beyond) is the largest share-holder. The data are from the second (2006) survey wave conducted by Bloom and van Reenen. The first (2004–2005) survey wave is described in Bloom and van Reenen (2007). The 12 countries are: China, France, Germany, Great Britain, Greece, India, Italy, Japan, Poland, Portugal, Sweden, and the United States.
224 AMERiCAN ECONOMiC JOuRNAL: MACROECONOMiCS ApRiL 2011
II. Data
A. Ownership Data
Ownership of publicly Held Companies.— Our ownership data come from four different sources: Stijn Claessens, Simeon Djankov, and Larry H. P. Lang (2000) (henceforth “CDL”); Mara Faccio and Lang (2002) (henceforth “FL”); Yoser Gadhoum, Lang, and Leslie Young (2005) (henceforth “GLY”); and La Porta, Lopez-de-Silanes, and Shleifer (1999) (henceforth “LLS”). All four papers exam-ine the ultimate ownership of publicly held companies, meaning that ownership is traced back to the family and individual level.
CDL (2000) provide ownership data for nine East Asian countries for the year 1996: Hong Kong, Indonesia, Japan, South Korea, Malaysia, the Philippines, Singapore, Taiwan, and Thailand. The final sample includes 2,980 firms represent-ing 56 percent of all publicly traded firms in these countries. CDL (2000) mea-sure family control both in terms of the fraction of firms controlled by families (20 percent cutoff) and the fraction of the total market capitalization controlled by the top five families. As Table 1a of the online Appendix shows, with the exception of Japan, family control is pervasive in East Asia. While only 10 percent of Japanese firms are controlled by families, the fraction of family-controlled firms in the other eight countries ranges from 45 percent (Philippines) to 72 percent (Indonesia). The picture is similar with respect to the fraction of the total market capitalization con-trolled by the top five families. While the top five families in Japan control only 2 percent of the total market capitalization, the corresponding number for the other 8 countries ranges from 20 percent (Singapore) to 43 percent (Philippines).
FL (2002) provide ownership data for 13 Western European countries for the years 1996 to 1999: Austria, Belgium, Finland, France, Germany, Ireland, Italy, Norway, Portugal, Spain, Sweden, Switzerland, and the United Kingdom. The final sample includes 5,232 firms representing 94 percent of all publicly traded firms in these countries. FL (2002) use the same two measures of family control as CDL (2000). As Table 1a of the online Appendix shows, family control is also perva-sive in Western Europe. The fraction of firms controlled by families ranges from 24 percent (United Kingdom) to 65 percent (France and Germany), while the fraction of the total market capitalization controlled by the top five families ranges from 4 percent (United Kingdom) to 25 percent (Portugal).
GLY (2005) provide ownership data for 3,607 publicly traded companies in the United States for the year 1996. Table 1a of the online Appendix shows that only 20 percent of the firms are controlled by families (20 percent cutoff), which implies the United States ranks second only to Japan as the country with the most widely dispersed (ultimate) ownership.
LLS (1999) provide ownership data for 27 wealthy countries, primarily for the years 1995 and 1996. Their focus is on the 20 largest firms in each country as mea-sured by the firms’ market capitalization. As Table 1a of the online Appendix shows, the fraction of family-controlled firms (20 percent cutoff) among the top 20 firms ranges from 0 percent (United Kingdom) to 70 percent (Hong Kong). LLS (1999) also construct a sample of ten medium-sized publicly traded firms per country.
VOL. 3 NO. 2 225MuELLER AND pHiLippON: FAMiLy FiRMS AND LABOR RELATiONS
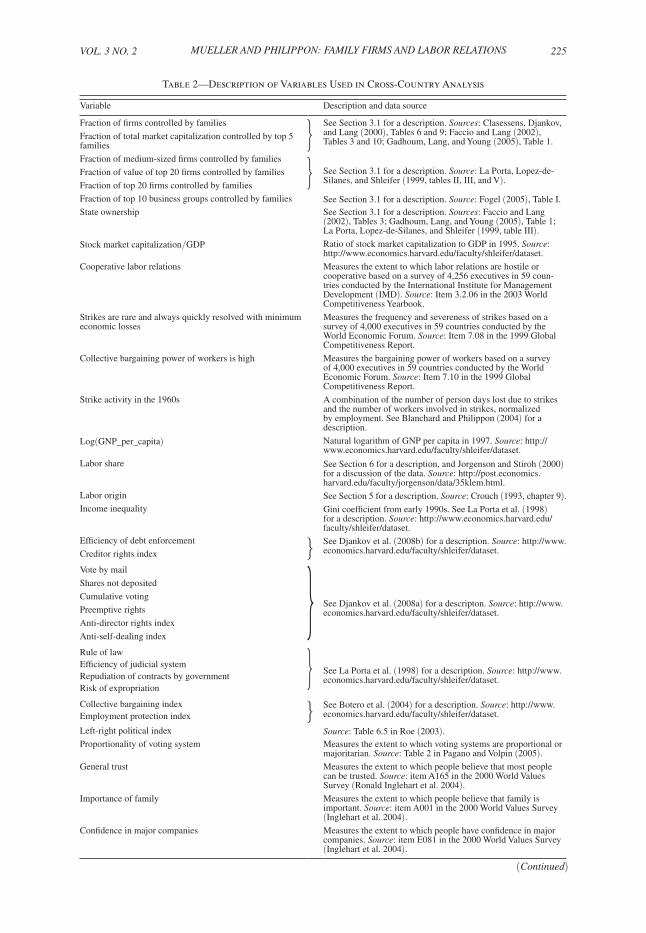
Table 2—Description of Variables Used in Cross-Country Analysis
Variable Description and data source
Fraction of firms controlled by families
Fraction of total market capitalization controlled by top 5 families } See Section 3.1 for a description. Sources: Clasessens, Djankov,
and Lang (2000), Tables 6 and 9; Faccio and Lang (2002), Tables 3 and 10; Gadhoum, Lang, and Young (2005), Table 1.
Fraction of medium-sized firms controlled by families
Fraction of value of top 20 firms controlled by families
Fraction of top 20 firms controlled by families} See Section 3.1 for a description. Source: La Porta, Lopez-de-
Silanes, and Shleifer (1999, tables II, III, and V).
Fraction of top 10 business groups controlled by families See Section 3.1 for a description. Source: Fogel (2005), Table I.State ownership See Section 3.1 for a description. Sources: Faccio and Lang
(2002), Tables 3; Gadhoum, Lang, and Young (2005), Table 1; La Porta, Lopez-de-Silanes, and Shleifer (1999, table III).
Stock market capitalization/GDP Ratio of stock market capitalization to GDP in 1995. Source: http://www.economics.harvard.edu/faculty/shleifer/dataset.
Cooperative labor relations Measures the extent to which labor relations are hostile or cooperative based on a survey of 4,256 executives in 59 coun-tries conducted by the International Institute for Management Development (IMD). Source: Item 3.2.06 in the 2003 World Competitiveness Yearbook.
Strikes are rare and always quickly resolved with minimum economic losses
Measures the frequency and severeness of strikes based on a survey of 4,000 executives in 59 countries conducted by the World Economic Forum. Source: Item 7.08 in the 1999 Global Competitiveness Report.
Collective bargaining power of workers is high Measures the bargaining power of workers based on a survey of 4,000 executives in 59 countries conducted by the World Economic Forum. Source: Item 7.10 in the 1999 Global Competitiveness Report.
Strike activity in the 1960s A combination of the number of person days lost due to strikes and the number of workers involved in strikes, normalized by employment. See Blanchard and Philippon (2004) for a description.
Log(GNP_per_capita) Natural logarithm of GNP per capita in 1997. Source: http://www.economics.harvard.edu/faculty/shleifer/dataset.
Labor share See Section 6 for a description, and Jorgenson and Stiroh (2000) for a discussion of the data. Source: http://post.economics.harvard.edu/faculty/jorgenson/data/35klem.html.
Labor origin See Section 5 for a description. Source: Crouch (1993, chapter 9).Income inequality Gini coefficient from early 1990s. See La Porta et al. (1998)
for a description. Source: http://www.economics.harvard.edu/faculty/shleifer/dataset.
Efficiency of debt enforcement
Creditor rights index } See Djankov et al. (2008b) for a description. Source: http://www.economics.harvard.edu/faculty/shleifer/dataset.
Vote by mail
Shares not deposited
Cumulative voting
Preemptive rights
Anti-director rights index
Anti-self-dealing index
} See Djankov et al. (2008a) for a descripton. Source: http://www.economics.harvard.edu/faculty/shleifer/dataset.
Rule of lawEfficiency of judicial systemRepudiation of contracts by governmentRisk of expropriation
} See La Porta et al. (1998) for a description. Source: http://www.economics.harvard.edu/faculty/shleifer/dataset.
Collective bargaining indexEmployment protection index } See Botero et al. (2004) for a description. Source: http://www.
economics.harvard.edu/faculty/shleifer/dataset.
Left-right political index Source: Table 6.5 in Roe (2003).Proportionality of voting system Measures the extent to which voting systems are proportional or
majoritarian. Source: Table 2 in Pagano and Volpin (2005).General trust Measures the extent to which people believe that most people
can be trusted. Source: item A165 in the 2000 World Values Survey (Ronald Inglehart et al. 2004).
Importance of family Measures the extent to which people believe that family is important. Source: item A001 in the 2000 World Values Survey (Inglehart et al. 2004).
Confidence in major companies Measures the extent to which people have confidence in major companies. Source: item E081 in the 2000 World Values Survey (Inglehart et al. 2004).
(Continued)
226 AMERiCAN ECONOMiC JOuRNAL: MACROECONOMiCS ApRiL 2011
There, the fraction of family-controlled firms (20 percent cutoff) is generally higher, ranging from 10 percent (Japan and the United States) to 100 percent (Greece).
There are 30 countries for which we have both ownership data and data on the quality of labor relations. Unfortunately, CDL (2000), FL (2002), GLY (2005), and LLS (1999) construct their ownership measures in different ways. Moreover, while CDL (2000), FL (2002), and GLY (2005) cover a large fraction of all publicly traded firms, LLS (1999) only cover the 20 largest firms per country, and their selection criteria make it difficult to compare large and small countries. To obtain consistent measures for all 30 countries, we proceed in two stages. Whenever possible, we use the two measures of family control from CDL (2000), FL (2002), and GLY (2005), namely, the fraction of firms controlled by families (20 percent cutoff) and the frac-tion of the total market capitalization controlled by the top five families. This pro-vides us with 23 countries. For the remaining seven countries—Australia, Canada, Denmark, Greece, Israel, Netherlands, and New Zealand—we use predicted values using data from LLS (1999) based on the following regression:8
(1) Fa m i, j = α j + β j′ LLS i + ε i j ,
where Fa m i,j is the particular measure j of family control for country i in CDL (2000), FL (2002), and GLY (2005), and where LLS i is the vector of the three mea-sures of family control for country i in LLS. For the first measure in CDL (2000), FL (2002), and GLY (2005)—the fraction of firms controlled by families—we obtain an R 2 of 43 percent for the 18 countries that are included in both CDL (2000), FL (2002), GLY (2005), and LLS (1999). For the second measure—the fraction of the total market capitalization controlled by the top five families—we obtain an R 2 of 41 percent.
State Ownership.—In some regressions, we use state ownership as our dependent variable. Our measure of state ownership is constructed the same way as our mea-sure of family control. That is, whenever possible, we use the measures from FL
8 As we show in Section IIIA, our basic results are robust to dropping those countries for which we only have predicted values based on the data from LLS (1999).
Trust in judiciary Measures the independence of the judiciary based on a survey of 4,000 executives in 59 countries conducted by the World Economic Forum. Source: Item 8.05 in the 1999 Global Competitiveness Report.
Trust in politicians Measures the financial honesty of politicians based on a survey of 4,000 executives in 59 countries conducted by the World Economic Forum. Source: Item 8.19 in the 1999 Global Competitiveness Report.
Trust in management Measures credibility of managers based on a survey of 4,256 ex-ecutives in 59 countries conducted by the International Institute for Management Development (IMD). Source: Item 3.4.03 in the 2003 World Competitiveness Yearbook.
Legal origin See La Porta et al. (1999) for a description. Source: http://www.economics.harvard.edu/faculty/shleifer/dataset.
Table 2—Description of Variables Used in Cross-Country Analysis (Continued)
Variable Description and data source
VOL. 3 NO. 2 227MuELLER AND pHiLippON: FAMiLy FiRMS AND LABOR RELATiONS
(2002) and GLY (2005). (The regressions do not include Asian countries.) For the remaining countries, we use predicted values using data from LLS (1999) based on a regression similar to that in equation (1).
Ownership of publicly and privately Held Business Groups.—Kathy Fogel (2006) constructs various measures of the ultimate ownership of the ten larg-est non-government business groups in each country for the year 1996. Unlike the CDL (2000), FL (2002), GLY (2005), and LLS (1999) measures, which are based on publicly traded companies, Fogel’s measures are based on both pub-licly and privately held business groups. Fogel constructs four measures, which are all highly correlated. The particular measure we use in our analysis is the labor-weighted fraction of the ten largest business groups controlled by families (20 percent cutoff).
B. Labor Relations Data
Cooperative Labor Relations.—We use survey data to measure the quality of labor relations. The data come from two different surveys. The first survey, conducted by the International Institute of Management Development (IMD), is published in the World Competitiveness Yearbook. It is sent to thousands of executives each year. In the year 2003, for instance, it was sent to 4,256 executives in 59 countries. Besides other questions, the executives are being asked to respond to the following state-ment: “Labor relations are generally … (hostile, productive).” Responses may vary from 1 to 10, a low number indicating hostile labor relations. Table 1b of the online Appendix reports the survey results for the years 1999 and 2003. While we have these data from 1996 onward, the country rankings are all highly correlated over time. For instance, the correlation between the 1999 and 2003 rankings is 90 percent (see Table 2 of the online Appendix).
The second survey is conducted by the World Economic Forum and published in the Global Competitiveness Report (GCR). It is sent to thousands of execu-tives in over 50 countries. The question that is most relevant for us asks the executives if they agree with the statement “Labor/employer relations are gener-ally cooperative.” Responses can vary from 1 (strong disagreement) to 7 (strong agreement). Table 1b of the online Appendix reports the survey results for the years 1993, 1999, and 2003. While we have these data for other years as well, the country rankings are again highly correlated over time. For instance, the cor-relations between the 1993, 1999, and 2003 rankings are between 89 percent and 97 percent (see Table 2 of the online Appendix).
In the year 1999 only, the GCR survey asked a more nuanced question: The executives were asked if they agree with the statement “Strikes are rare and always quickly resolved with minimum economic losses.” The result is reported in Table 1b of the online Appendix. As Table 2 of the online Appendix shows, the country rank-ing correlates strongly with that from the question asking whether “Labor/employer relations are generally cooperative.”
Not only are our various measures of the quality of labor relations highly cor-related over time, but there is also a strong correlation across the two surveys. For
228 AMERiCAN ECONOMiC JOuRNAL: MACROECONOMiCS ApRiL 2011
example, the correlation between the IMD and GCR measures in 1999 (2003) is 94 percent (91 percent) (see Table 2 of the online Appendix). On the other hand, our measures of the quality of labor relations are uncorrelated with the perceived bargaining power of workers. Each year, the GCR survey asks executives to respond to the statement “The collective bargaining power of workers is high.” For brevity, Table 1a of the online Appendix only reports the result for one particular year, 1999, but the results are very similar for other years. As Table 2 of the online Appendix shows, there is no correlation between the (perceived) bargaining power of workers and any of our six measures of the quality of labor relations.
Given the high correlation among our measures of the quality of labor relations—both across different surveys and over time—none of the problems encountered in the construction of our ownership variables arises here. In fact, all our results are robust to using any of the measures listed in Table 1b of the online Appendix. For brevity, we focus on a single measure, the IMD measure from 2003, which we call “Cooperative Labor Relations.”
Strike Activity in the 1960s.—Our survey measures reflect the opinions of exec-utives. It would be useful to know if these opinions also corresponded to observ-able measures of labor hostility, such as strike activity. The problem is that strike activity commonly depends on many factors, notably unemployment. Given that we have a relatively small sample, controlling for all these factors is impossible. Alternatively, we can consider a time period in which these factors are “naturally being controlled for,” e.g., because they were relatively uniform across countries. The 1960s are such a period; unemployment was uniformly low across Western countries, while TFP growth was high. Our measure of strike activity in the 1960s, adopted from Olivier Blanchard and Philippon (2004), is a combination of the number of days lost due to strikes and the number of workers involved in strikes, normalized by employment. As Blanchard and Philippon (2004) show, there exists a significant negative relationship between strike activity in the 1960s and the quality of labor relations in the 1990s. Indeed, the correlation between strike activity in the 1960s and our measure, Cooperative Labor Relations, is minus 63 percent, suggesting that high strike activity in the 1960s can predict hostile labor relations more than 30 years later.
III. Family Ownership and Labor Relations
A. Basic OLS Regressions
Table 3 presents our basic OLS regressions. We use robust standard errors in all regressions to account for heteroskedasticity. The first two regressions, shown in col-umns 1 and 2, consider the relationship between Cooperative Labor Relations and our two measures of family control: the fraction of firms controlled by families (20 per-cent cutoff) and the fraction of the total market capitalization controlled by the top five families. Given the way these two measures are constructed, there is likely a system-atic effect of country size. All else equal, the top five families in Sweden are likely to control a greater fraction of the national stock market capitalization than the top five
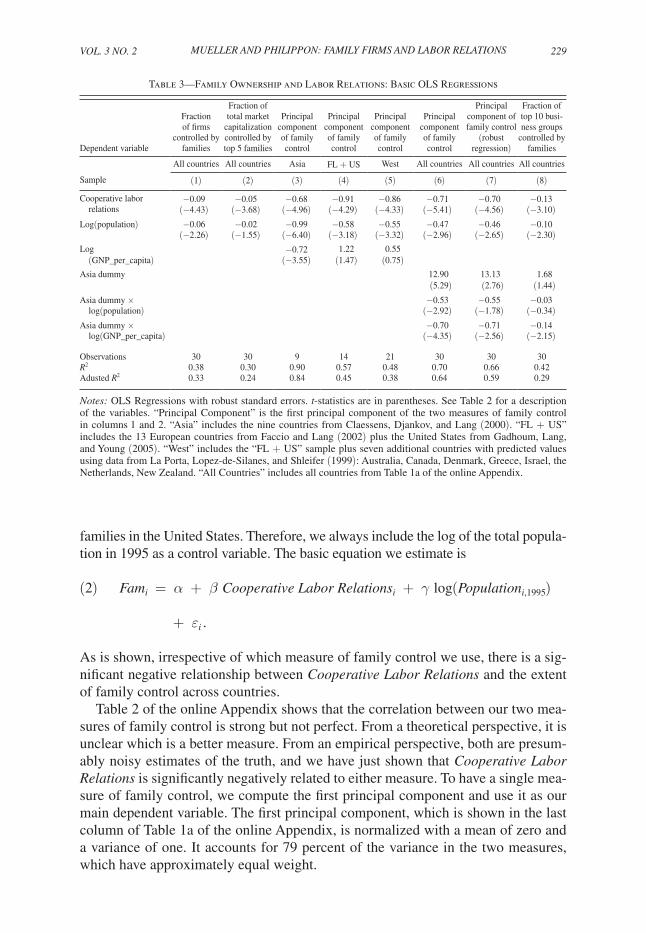
VOL. 3 NO. 2 229MuELLER AND pHiLippON: FAMiLy FiRMS AND LABOR RELATiONS
families in the United States. Therefore, we always include the log of the total popula-tion in 1995 as a control variable. The basic equation we estimate is
(2) Fa m i = α + β Cooperative Labor Relation s i + γ log(populatio n i,1995 )
+ ε i .
As is shown, irrespective of which measure of family control we use, there is a sig-nificant negative relationship between Cooperative Labor Relations and the extent of family control across countries.
Table 2 of the online Appendix shows that the correlation between our two mea-sures of family control is strong but not perfect. From a theoretical perspective, it is unclear which is a better measure. From an empirical perspective, both are presum-ably noisy estimates of the truth, and we have just shown that Cooperative Labor Relations is significantly negatively related to either measure. To have a single mea-sure of family control, we compute the first principal component and use it as our main dependent variable. The first principal component, which is shown in the last column of Table 1a of the online Appendix, is normalized with a mean of zero and a variance of one. It accounts for 79 percent of the variance in the two measures, which have approximately equal weight.
Table 3—Family Ownership and Labor Relations: Basic OLS Regressions
Dependent variable
Fraction of firms
controlled by families
Fraction of total market
capitalization controlled by top 5 families
Principal componentof familycontrol
Principal componentof family control
Principal componentof family control
Principal componentof family control
Principal component of family control
(robust regression)
Fraction of top 10 busi-ness groups
controlled by families
All countries All countries Asia FL + US West All countries All countries All countries
Sample (1) (2) (3) (4) (5) (6) (7) (8)
Cooperative labor −0.09 −0.05 −0.68 −0.91 −0.86 −0.71 −0.70 −0.13 relations (−4.43) (−3.68) (−4.96) (−4.29) (−4.33) (−5.41) (−4.56) (−3.10)Log(population) −0.06 −0.02 −0.99 −0.58 −0.55 −0.47 −0.46 −0.10
(−2.26) (−1.55) (−6.40) (−3.18) (−3.32) (−2.96) (−2.65) (−2.30)Log −0.72 1.22 0.55 (GNP_per_capita) (−3.55) (1.47) (0.75)Asia dummy 12.90 13.13 1.68
(5.29) (2.76) (1.44)Asia dummy × −0.53 −0.55 −0.03 log(population) (−2.92) (−1.78) (−0.34)Asia dummy × −0.70 −0.71 −0.14 log(GNP_per_capita) (−4.35) (−2.56) (−2.15)
Observations 30 30 9 14 21 30 30 30R2 0.38 0.30 0.90 0.57 0.48 0.70 0.66 0.42Adusted R2 0.33 0.24 0.84 0.45 0.38 0.64 0.59 0.29
Notes: OLS Regressions with robust standard errors. t-statistics are in parentheses. See Table 2 for a description of the variables. “Principal Component” is the first principal component of the two measures of family control in columns 1 and 2. “Asia” includes the nine countries from Claessens, Djankov, and Lang (2000). “FL + US” includes the 13 European countries from Faccio and Lang (2002) plus the United States from Gadhoum, Lang, and Young (2005). “West” includes the “FL + US” sample plus seven additional countries with predicted values using data from La Porta, Lopez-de-Silanes, and Shleifer (1999): Australia, Canada, Denmark, Greece, Israel, the Netherlands, New Zealand. “All Countries” includes all countries from Table 1a of the online Appendix.
230 AMERiCAN ECONOMiC JOuRNAL: MACROECONOMiCS ApRiL 2011
A shortcoming of our ownership data is that the samples in CDL (2000), FL (2002), GLY (2005), and LLS (1999) include only publicly held firms.9 To verify that our main measure of family control is also representative of a broader popula-tion of firms, we can check whether it correlates with the corresponding measure in the sample by Bloom and van Reenen (2007), which is based on 3,889 medium-sized firms, most of them private, from 12 different countries (see Section IB). Nine of these countries are also represented in our sample: France, Germany, Greece, Italy, Japan, Portugal, Sweden, the United Kingdom, and the United States. For each of these countries, we compute the mean fraction of family firms based on the ownership data provided by Bloom and van Reenen (2007) and cor-relate it with our measure, the principal component of family control. The correla-tion is 68.5 percent, and it is significant at the 5 percent level. As this correlation is based on nine observations, we need to verify that it is not driven by outliers. The rank correlation is only slightly lower (58.3 percent), and it is significant at the 10 percent level.
Using the principal component of family control as our dependent variable, we next estimate equation (2) separately for different subsamples, for two reasons. First, we want to allow for systematic differences between Asian and Western countries. Second, we want to make sure that our results are robust to dropping those seven countries for which we have only predicted values using data from LLS (1999) based on equation (1). Column 3 of Table 3 shows the results for Asia. Column 4 shows the results for Western countries, excluding those countries for which we have only predicted values, and column 5 shows the results for all Western coun-tries, including those countries for which we have only predicted values. As can be seen, Cooperative Labor Relations is negatively related to family control and significant at the 1 percent level in all regressions. Also, the coefficients on coun-try size and gross national product (GNP) per capita are different for Asian and Western countries. In fact, GNP per capita is not significant among Western coun-tries, which is not surprising, given that these countries are relatively homogeneous in their developments. On the other hand, the coefficient on GNP per capita is nega-tive and significant in Asia, suggesting that family ownership is more prevalent in less developed economies.
We next run a regression based on the entire sample, which includes a dummy for Asia as well as interaction terms of this dummy with country size and GNP per capita. For parsimony, we restrict the coefficient associated with GNP per capita to zero for Western countries, as it is otherwise small and insignificant. As is shown in column 6 of Table 3, Cooperative Labor Relations is negatively related to family control and significant at the 1 percent level.
A major shortcoming of our ownership data is that they are based on pub-licly held firms. We have already shown that our measure of family control is highly correlated with the corresponding measure in the sample by Bloom and van Reenen (2007), which is based on medium-sized firms, most of them private.
9 In the United States, the fraction of private sector employment accounted for by publicly listed firms is less than a third (Steven J. Davis et al. 2007), and it is likely smaller in many of the other countries considered here, raising concerns about selection bias.
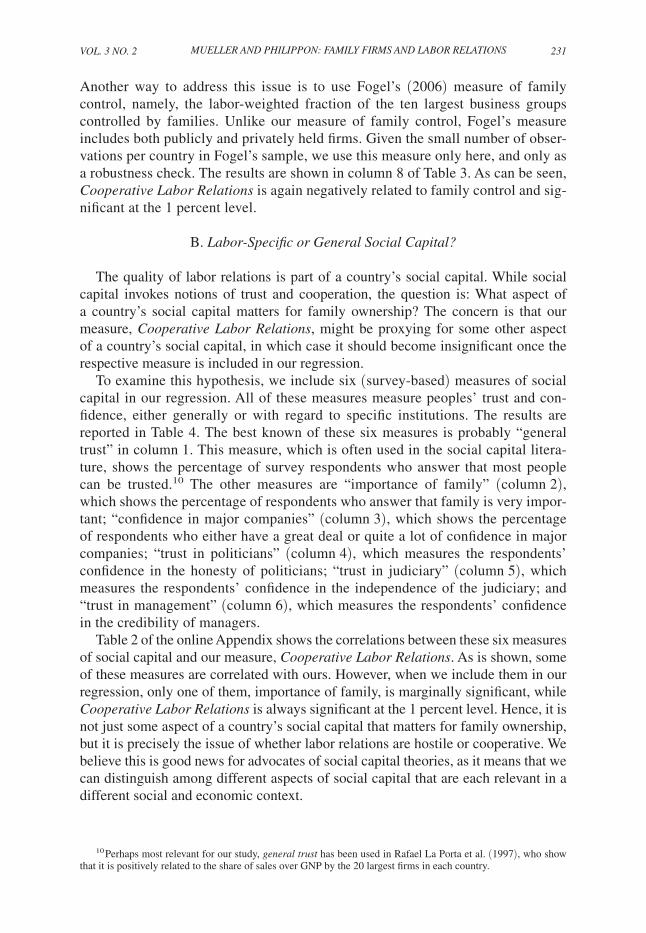
VOL. 3 NO. 2 231MuELLER AND pHiLippON: FAMiLy FiRMS AND LABOR RELATiONS
Another way to address this issue is to use Fogel’s (2006) measure of family control, namely, the labor-weighted fraction of the ten largest business groups controlled by families. Unlike our measure of family control, Fogel’s measure includes both publicly and privately held firms. Given the small number of obser-vations per country in Fogel’s sample, we use this measure only here, and only as a robustness check. The results are shown in column 8 of Table 3. As can be seen, Cooperative Labor Relations is again negatively related to family control and sig-nificant at the 1 percent level.
B. Labor-Specific or General Social Capital?
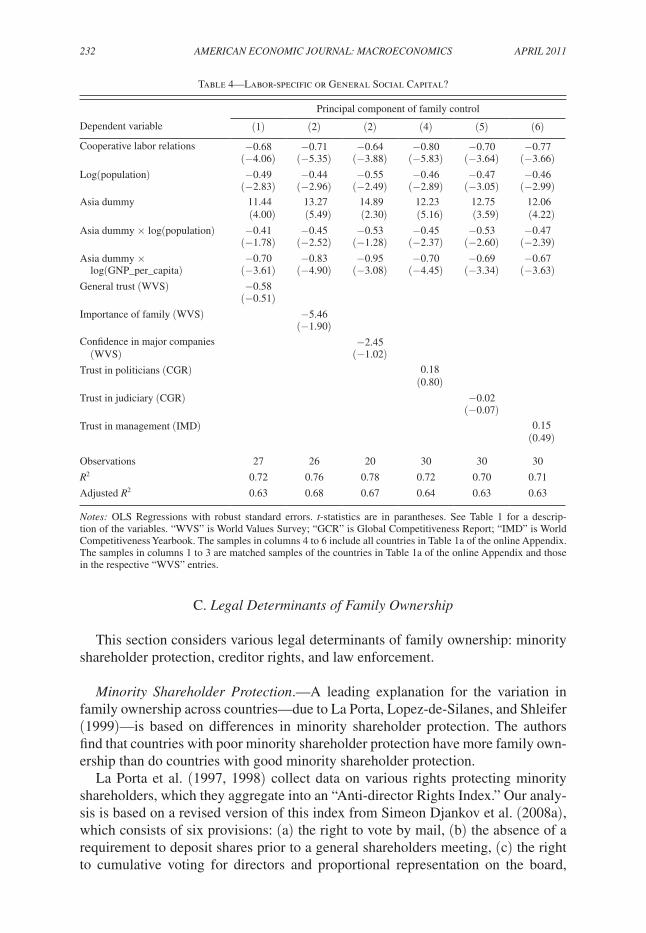
The quality of labor relations is part of a country’s social capital. While social capital invokes notions of trust and cooperation, the question is: What aspect of a country’s social capital matters for family ownership? The concern is that our measure, Cooperative Labor Relations, might be proxying for some other aspect of a country’s social capital, in which case it should become insignificant once the respective measure is included in our regression.
To examine this hypothesis, we include six (survey-based) measures of social capital in our regression. All of these measures measure peoples’ trust and con-fidence, either generally or with regard to specific institutions. The results are reported in Table 4. The best known of these six measures is probably “general trust” in column 1. This measure, which is often used in the social capital litera-ture, shows the percentage of survey respondents who answer that most people can be trusted.10 The other measures are “importance of family” (column 2), which shows the percentage of respondents who answer that family is very impor-tant; “confidence in major companies” (column 3), which shows the percentage of respondents who either have a great deal or quite a lot of confidence in major companies; “trust in politicians” (column 4), which measures the respondents’ confidence in the honesty of politicians; “trust in judiciary” (column 5), which measures the respondents’ confidence in the independence of the judiciary; and “trust in management” (column 6), which measures the respondents’ confidence in the credibility of managers.
Table 2 of the online Appendix shows the correlations between these six measures of social capital and our measure, Cooperative Labor Relations. As is shown, some of these measures are correlated with ours. However, when we include them in our regression, only one of them, importance of family, is marginally significant, while Cooperative Labor Relations is always significant at the 1 percent level. Hence, it is not just some aspect of a country’s social capital that matters for family ownership, but it is precisely the issue of whether labor relations are hostile or cooperative. We believe this is good news for advocates of social capital theories, as it means that we can distinguish among different aspects of social capital that are each relevant in a different social and economic context.
10 Perhaps most relevant for our study, general trust has been used in Rafael La Porta et al. (1997), who show that it is positively related to the share of sales over GNP by the 20 largest firms in each country.
232 AMERiCAN ECONOMiC JOuRNAL: MACROECONOMiCS ApRiL 2011
C. Legal Determinants of Family Ownership
This section considers various legal determinants of family ownership: minority shareholder protection, creditor rights, and law enforcement.
Minority Shareholder protection.—A leading explanation for the variation in family ownership across countries—due to La Porta, Lopez-de-Silanes, and Shleifer (1999)—is based on differences in minority shareholder protection. The authors find that countries with poor minority shareholder protection have more family own-ership than do countries with good minority shareholder protection.
La Porta et al. (1997, 1998) collect data on various rights protecting minority shareholders, which they aggregate into an “Anti-director Rights Index.” Our analy-sis is based on a revised version of this index from Simeon Djankov et al. (2008a), which consists of six provisions: (a) the right to vote by mail, (b) the absence of a requirement to deposit shares prior to a general shareholders meeting, (c) the right to cumulative voting for directors and proportional representation on the board,
Table 4—Labor-specific or General Social Capital?
Principal component of family control
Dependent variable (1) (2) (2) (4) (5) (6)
Cooperative labor relations −0.68 −0.71 −0.64 −0.80 −0.70 −0.77(−4.06) (−5.35) (−3.88) (−5.83) (−3.64) (−3.66)
Log(population) −0.49 −0.44 −0.55 −0.46 −0.47 −0.46(−2.83) (−2.96) (−2.49) (−2.89) (−3.05) (−2.99)
Asia dummy 11.44 13.27 14.89 12.23 12.75 12.06(4.00) (5.49) (2.30) (5.16) (3.59) (4.22)
Asia dummy × log(population) −0.41 −0.45 −0.53 −0.45 −0.53 −0.47(−1.78) (−2.52) (−1.28) (−2.37) (−2.60) (−2.39)
Asia dummy × −0.70 −0.83 −0.95 −0.70 −0.69 −0.67 log(GNP_per_capita) (−3.61) (−4.90) (−3.08) (−4.45) (−3.34) (−3.63)General trust (WVS) −0.58
(−0.51)Importance of family (WVS) −5.46
(−1.90)Confidence in major companies −2.45 (WVS) (−1.02)Trust in politicians (CGR) 0.18
(0.80)Trust in judiciary (CGR) −0.02
(−0.07)Trust in management (IMD) 0.15
(0.49)
Observations 27 26 20 30 30 30
R2 0.72 0.76 0.78 0.72 0.70 0.71
Adjusted R2 0.63 0.68 0.67 0.64 0.63 0.63
Notes: OLS Regressions with robust standard errors. t-statistics are in parantheses. See Table 1 for a descrip-tion of the variables. “WVS” is World Values Survey; “GCR” is Global Competitiveness Report; “IMD” is World Competitiveness Yearbook. The samples in columns 4 to 6 include all countries in Table 1a of the online Appendix. The samples in columns 1 to 3 are matched samples of the countries in Table 1a of the online Appendix and those in the respective “WVS” entries.
VOL. 3 NO. 2 233MuELLER AND pHiLippON: FAMiLy FiRMS AND LABOR RELATiONS
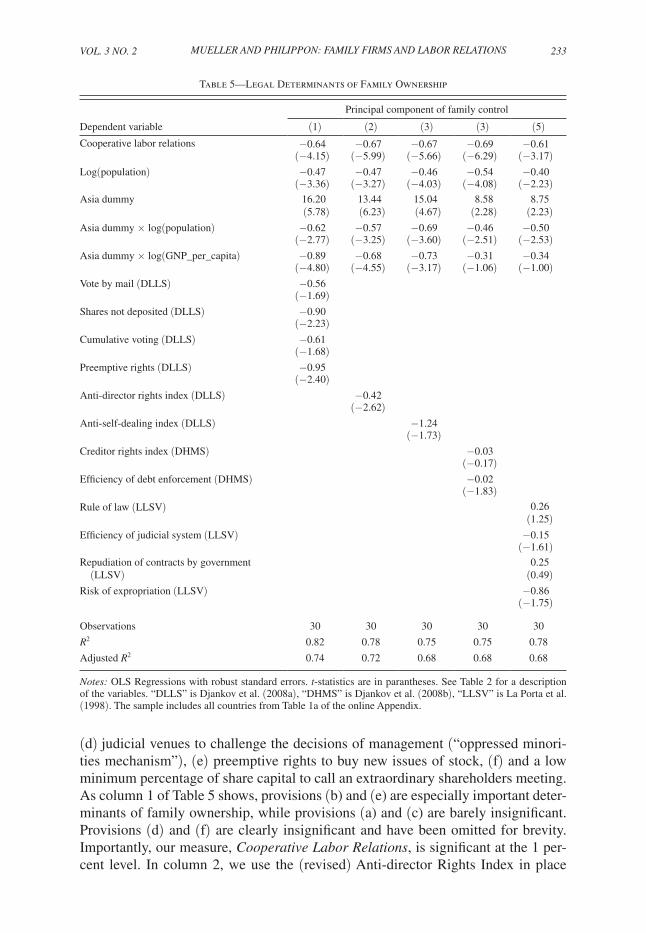
(d) judicial venues to challenge the decisions of management (“oppressed minori-ties mechanism”), (e) preemptive rights to buy new issues of stock, (f) and a low minimum percentage of share capital to call an extraordinary shareholders meeting. As column 1 of Table 5 shows, provisions (b) and (e) are especially important deter-minants of family ownership, while provisions (a) and (c) are barely insignificant. Provisions (d) and (f) are clearly insignificant and have been omitted for brevity. Importantly, our measure, Cooperative Labor Relations, is significant at the 1 per-cent level. In column 2, we use the (revised) Anti-director Rights Index in place
Table 5—Legal Determinants of Family Ownership
Principal component of family control
Dependent variable (1) (2) (3) (3) (5)Cooperative labor relations −0.64 −0.67 −0.67 −0.69 −0.61
(−4.15) (−5.99) (−5.66) (−6.29) (−3.17)Log(population) −0.47 −0.47 −0.46 −0.54 −0.40
(−3.36) (−3.27) (−4.03) (−4.08) (−2.23)Asia dummy 16.20 13.44 15.04 8.58 8.75
(5.78) (6.23) (4.67) (2.28) (2.23)Asia dummy × log(population) −0.62 −0.57 −0.69 −0.46 −0.50
(−2.77) (−3.25) (−3.60) (−2.51) (−2.53)Asia dummy × log(GNP_per_capita) −0.89 −0.68 −0.73 −0.31 −0.34
(−4.80) (−4.55) (−3.17) (−1.06) (−1.00)Vote by mail (DLLS) −0.56
(−1.69)Shares not deposited (DLLS) −0.90
(−2.23)Cumulative voting (DLLS) −0.61
(−1.68)Preemptive rights (DLLS) −0.95
(−2.40)Anti-director rights index (DLLS) −0.42
(−2.62)Anti-self-dealing index (DLLS) −1.24
(−1.73)Creditor rights index (DHMS) −0.03
(−0.17)Efficiency of debt enforcement (DHMS) −0.02
(−1.83)Rule of law (LLSV) 0.26
(1.25)Efficiency of judicial system (LLSV) −0.15
(−1.61)Repudiation of contracts by government 0.25 (LLSV) (0.49)Risk of expropriation (LLSV) −0.86
(−1.75)
Observations 30 30 30 30 30
R2 0.82 0.78 0.75 0.75 0.78
Adjusted R2 0.74 0.72 0.68 0.68 0.68
Notes: OLS Regressions with robust standard errors. t-statistics are in parantheses. See Table 2 for a description of the variables. “DLLS” is Djankov et al. (2008a), “DHMS” is Djankov et al. (2008b), “LLSV” is La Porta et al. (1998). The sample includes all countries from Table 1a of the online Appendix.
234 AMERiCAN ECONOMiC JOuRNAL: MACROECONOMiCS ApRiL 2011
of the individual provisions. The results confirm that minority shareholder protec-tion is an important determinant of family ownership. But so is Cooperative Labor Relations, which is again significant at the 1 percent level.11
Djankov et al. (2008a) also construct another index of minority shareholder rights, the “Anti-self-dealing Index,” which measures the extent to which minority share-holders are protected against self-dealing by controlling shareholders. As column 3 of Table 5 shows, the Anti-self-dealing Index is marginally significant in our regres-sion, while Cooperative Labor Relations is again significant at the 1 percent level.
Creditor Rights.—The clash between secured creditors and managers/employees is probably as important as the clash between minority shareholders and the latter. This is because when firms enter into distress, secured creditors in many countries can seize the collateral and shut the firm down, which is bad for both managers and employees. To see whether this matters for family ownership, we include both an index of credi-tor rights and a measure of the efficiency of debt enforcement in our regression. Both measures are from Simeon Djankov et al. (2008b). The results are shown in column 4 of Table 5. While the creditor rights index is not significant, the measure of the effi-ciency of debt enforcement is significant and enters with the predicted (negative) sign, implying that countries with more efficient debt enforcement have less family owner-ship. Cooperative Labor Relations is again significant at the 1 percent level.
Law Enforcement.—La Porta et al. (1998) argue that a strong system of law enforcement may substitute for weak minority shareholder protection, as courts could then step in and “rescue investors abused by the management.” The authors provide data on various measures of law enforcement. Two of these measures, “efficiency of judicial system” and “rule of law,” pertain to law enforcement proper. As column 5 of Table 5 shows, neither measure is significant in our regression. Two other measures, “repudiation of contracts by government” and “risk of expropriation,” are not related to law enforcement proper, but instead to the government’s stance toward private contracting and property rights. While the second measure is marginally significant, Cooperative Labor Relations remains significant at the 1 percent level.
D. Other Determinants of Family Ownership
This section considers other determinants of family ownership: union power, labor regulation, the pro-labor orientation of governments, income inequality, and financial development.
union Bargaining power and Labor Regulation.—Both Roe (2003) and this paper argue that family firms are particularly effective at coping with labor pressure. The question is: Where does this labor pressure come from? Roe (2003) focuses on measures of formal labor empowerment, such as labor regulation and the pro-labor
11 We obtain similar results if we use the original Anti-director Rights Index from La Porta et al. (1997, 1998) instead of the revised index from Djankov et al. (2008a).
VOL. 3 NO. 2 235MuELLER AND pHiLippON: FAMiLy FiRMS AND LABOR RELATiONS
orientation of governments. A related measure, which is not the focus of Roe’s (2003) work, is the bargaining power of labor unions.
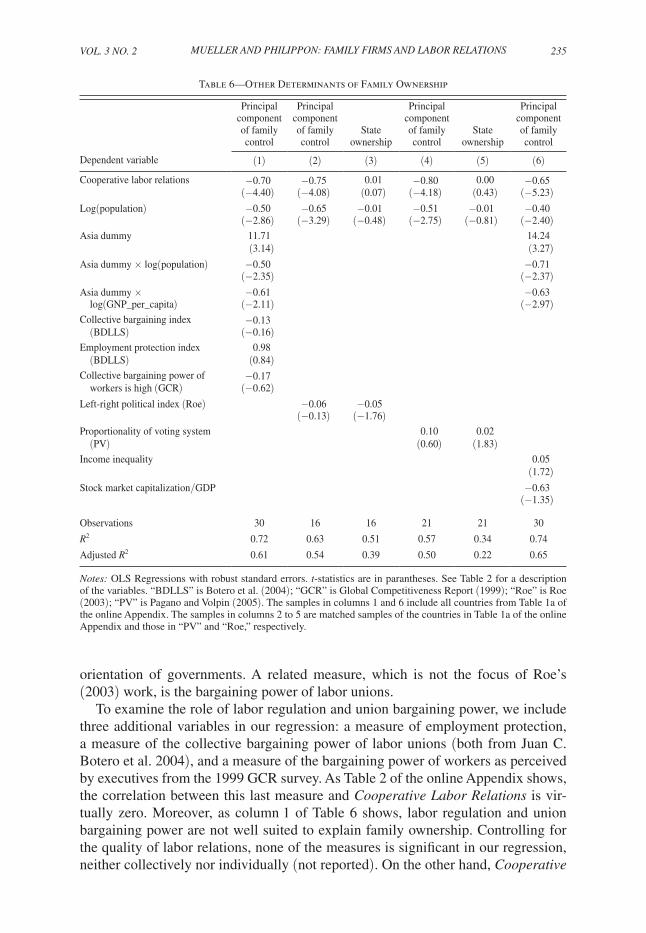
To examine the role of labor regulation and union bargaining power, we include three additional variables in our regression: a measure of employment protection, a measure of the collective bargaining power of labor unions (both from Juan C. Botero et al. 2004), and a measure of the bargaining power of workers as perceived by executives from the 1999 GCR survey. As Table 2 of the online Appendix shows, the correlation between this last measure and Cooperative Labor Relations is vir-tually zero. Moreover, as column 1 of Table 6 shows, labor regulation and union bargaining power are not well suited to explain family ownership. Controlling for the quality of labor relations, none of the measures is significant in our regression, neither collectively nor individually (not reported). On the other hand, Cooperative
Table 6—Other Determinants of Family Ownership
Principal component of family control
Principal component of family control
State ownership
Principal component of family control
State ownership
Principal component of family control
Dependent variable (1) (2) (3) (4) (5) (6)
Cooperative labor relations −0.70 −0.75 0.01 −0.80 0.00 −0.65(−4.40) (−4.08) (0.07) (−4.18) (0.43) (−5.23)
Log(population) −0.50 −0.65 −0.01 −0.51 −0.01 −0.40(−2.86) (−3.29) (−0.48) (−2.75) (−0.81) (−2.40)
Asia dummy 11.71 14.24(3.14) (3.27)
Asia dummy × log(population) −0.50 −0.71(−2.35) (−2.37)
Asia dummy × −0.61 −0.63 log(GNP_per_capita) (−2.11) (−2.97)Collective bargaining index −0.13 (BDLLS) (−0.16)Employment protection index 0.98 (BDLLS) (0.84)Collective bargaining power of −0.17 workers is high (GCR) (−0.62)Left-right political index (Roe) −0.06 −0.05
(−0.13) (−1.76)Proportionality of voting system 0.10 0.02 (PV) (0.60) (1.83)Income inequality 0.05
(1.72)Stock market capitalization/GDP −0.63
(−1.35)
Observations 30 16 16 21 21 30
R2 0.72 0.63 0.51 0.57 0.34 0.74
Adjusted R2 0.61 0.54 0.39 0.50 0.22 0.65
Notes: OLS Regressions with robust standard errors. t-statistics are in parantheses. See Table 2 for a description of the variables. “BDLLS” is Botero et al. (2004); “GCR” is Global Competitiveness Report (1999); “Roe” is Roe (2003); “PV” is Pagano and Volpin (2005). The samples in columns 1 and 6 include all countries from Table 1a of the online Appendix. The samples in columns 2 to 5 are matched samples of the countries in Table 1a of the online Appendix and those in “PV” and “Roe,” respectively.
236 AMERiCAN ECONOMiC JOuRNAL: MACROECONOMiCS ApRiL 2011
Labor Relations is significant at the 1 percent level. Accordingly, it is not just some aspect of labor pressure that matters for family ownership, but it is precisely the issue of whether labor is hostile or cooperative.
political Theories.—Another measure of formal labor empowerment is a country’s left-right political orientation. Countries at the left end of the political spectrum—“social democracies” in Roe’s (2003) words—are more likely to be more labor friendly. To examine whether this has any bearing on family ownership, we include Roe’s left-right political index in our regression. As column 2 of Table 6 shows, the index is not significant. In related work, Pagano and Volpin (2005) develop a political theory of investor and employment protection, arguing that countries with propor-tional voting systems have weaker investor protection, but stronger employment pro-tection, than do countries with majoritarian voting systems. Thus, Pagano and Volpin’s (2005) voting index provides us with an alternative measure of a country’s pro-labor orientation. As is shown in column 4, this index is also not significant. In contrast, Cooperative Labor Relations is significant at the 1 percent level in both regressions.
While our results suggest that measures of a country’s political orientation are not well suited to explain family ownership, this does not mean that politics do not matter. As columns 3 and 5 of Table 6 show, political measures are well suited to explain state ownership. In both regressions, the respective measures—the left-right political index by Roe (2003) and the voting index by Pagano and Volpin (2005)—have (limited) explanatory power, while our measure, Cooperative Labor Relations, is clearly insignificant.
Stock Market Development and income inequality.—Countries with more devel-oped stock markets may have institutions that—similar to minority shareholder pro-tection—are more conducive to widely held ownership. To test this hypothesis, we include the ratio of stock market capitalization to gross domestic product (GDP), which is a widely used measure of stock market development (e.g., Raymond Fisman and Inessa Love 2004). As column 6 of Table 6 shows, this measure enters with the predicted (negative) sign, but is—unlike minority shareholder protection—not significant.
A concern is that Cooperative Labor Relations might proxy for income inequal-ity, in the sense that countries with high income inequality might also have worse labor relations. At the same time, family ownership might be related to income inequality, in the sense that countries with high income inequality might be coun-tries in which a few families control a large fraction of the stock market. For some countries, this argument may be true. In the aggregate, however, it is not true. As is shown in column 6 of Table 6, income inequality (as measured by the Gini coef-ficient) is only marginally significant, while Cooperative Labor Relations is signifi-cant at the 1 percent level.
IV. Labor Origin
To address the issue of causality, we look into the historical causes for the observed differences in the quality of labor relations across countries. In his classic book,
VOL. 3 NO. 2 237MuELLER AND pHiLippON: FAMiLy FiRMS AND LABOR RELATiONS
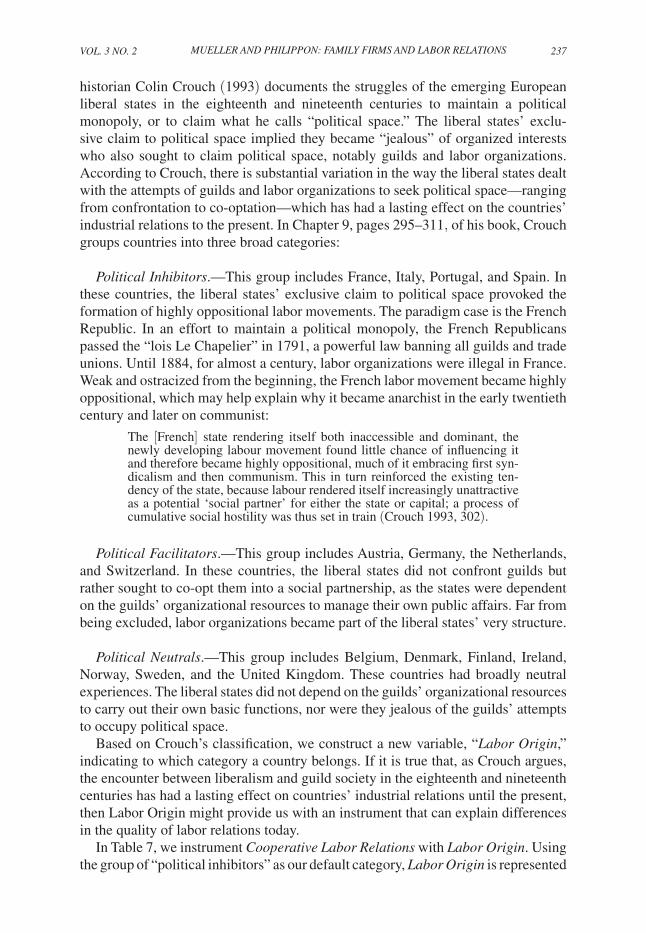
historian Colin Crouch (1993) documents the struggles of the emerging European liberal states in the eighteenth and nineteenth centuries to maintain a political monopoly, or to claim what he calls “political space.” The liberal states’ exclu-sive claim to political space implied they became “jealous” of organized interests who also sought to claim political space, notably guilds and labor organizations. According to Crouch, there is substantial variation in the way the liberal states dealt with the attempts of guilds and labor organizations to seek political space—ranging from confrontation to co-optation—which has had a lasting effect on the countries’ industrial relations to the present. In Chapter 9, pages 295–311, of his book, Crouch groups countries into three broad categories:
political inhibitors.—This group includes France, Italy, Portugal, and Spain. In these countries, the liberal states’ exclusive claim to political space provoked the formation of highly oppositional labor movements. The paradigm case is the French Republic. In an effort to maintain a political monopoly, the French Republicans passed the “lois Le Chapelier” in 1791, a powerful law banning all guilds and trade unions. Until 1884, for almost a century, labor organizations were illegal in France. Weak and ostracized from the beginning, the French labor movement became highly oppositional, which may help explain why it became anarchist in the early twentieth century and later on communist:
The [French] state rendering itself both inaccessible and dominant, the newly developing labour movement found little chance of influencing it and therefore became highly oppositional, much of it embracing first syn-dicalism and then communism. This in turn reinforced the existing ten-dency of the state, because labour rendered itself increasingly unattractive as a potential ‘social partner’ for either the state or capital; a process of cumulative social hostility was thus set in train (Crouch 1993, 302).
political Facilitators.—This group includes Austria, Germany, the Netherlands, and Switzerland. In these countries, the liberal states did not confront guilds but rather sought to co-opt them into a social partnership, as the states were dependent on the guilds’ organizational resources to manage their own public affairs. Far from being excluded, labor organizations became part of the liberal states’ very structure.
political Neutrals.—This group includes Belgium, Denmark, Finland, Ireland, Norway, Sweden, and the United Kingdom. These countries had broadly neutral experiences. The liberal states did not depend on the guilds’ organizational resources to carry out their own basic functions, nor were they jealous of the guilds’ attempts to occupy political space.
Based on Crouch’s classification, we construct a new variable, “Labor Origin,” indicating to which category a country belongs. If it is true that, as Crouch argues, the encounter between liberalism and guild society in the eighteenth and nineteenth centuries has had a lasting effect on countries’ industrial relations until the present, then Labor Origin might provide us with an instrument that can explain differences in the quality of labor relations today.
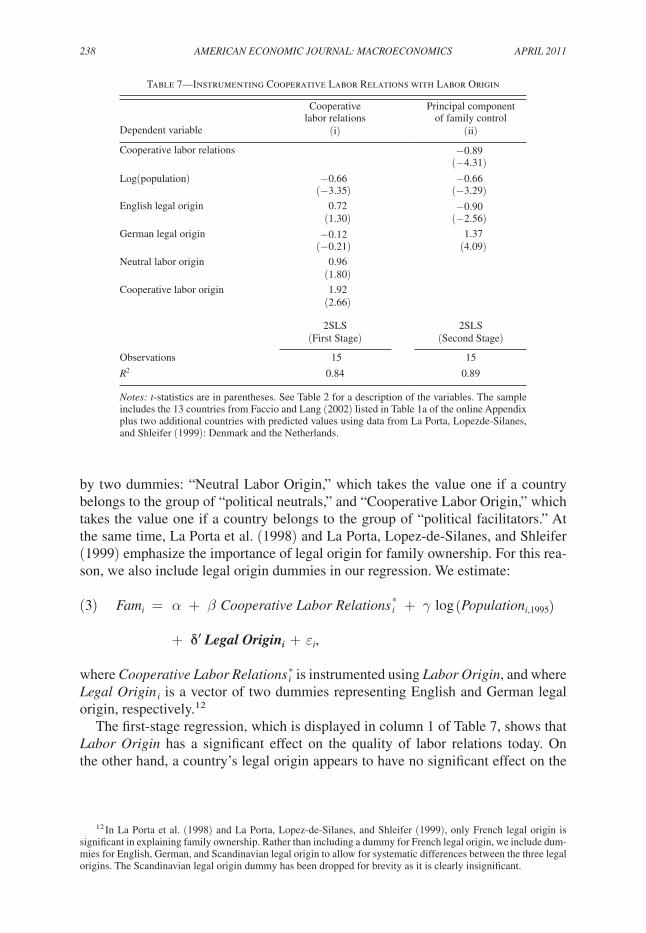
In Table 7, we instrument Cooperative Labor Relations with Labor Origin. Using the group of “political inhibitors” as our default category, Labor Origin is represented
238 AMERiCAN ECONOMiC JOuRNAL: MACROECONOMiCS ApRiL 2011
by two dummies: “Neutral Labor Origin,” which takes the value one if a country belongs to the group of “political neutrals,” and “Cooperative Labor Origin,” which takes the value one if a country belongs to the group of “political facilitators.” At the same time, La Porta et al. (1998) and La Porta, Lopez-de-Silanes, and Shleifer (1999) emphasize the importance of legal origin for family ownership. For this rea-son, we also include legal origin dummies in our regression. We estimate:
(3) Fa m i = α + β Cooperative Labor Relation s i * + γ log (populatio n i,1995 )
+ δ′ LegalOrigini + ε i ,
where Cooperative Labor Relation s i * is instrumented using Labor Origin, and where Legal Origi n i is a vector of two dummies representing English and German legal origin, respectively.12
The first-stage regression, which is displayed in column 1 of Table 7, shows that Labor Origin has a significant effect on the quality of labor relations today. On the other hand, a country’s legal origin appears to have no significant effect on the
12 In La Porta et al. (1998) and La Porta, Lopez-de-Silanes, and Shleifer (1999), only French legal origin is significant in explaining family ownership. Rather than including a dummy for French legal origin, we include dum-mies for English, German, and Scandinavian legal origin to allow for systematic differences between the three legal origins. The Scandinavian legal origin dummy has been dropped for brevity as it is clearly insignificant.
Table 7—Instrumenting Cooperative Labor Relations with Labor Origin
Cooperativelabor relations
Principal componentof family control
Dependent variable (i) (ii)
Cooperative labor relations −0.89(−4.31)
Log(population) −0.66 −0.66(−3.35) (−3.29)
English legal origin 0.72 −0.90(1.30) (−2.56)
German legal origin −0.12 1.37(−0.21) (4.09)
Neutral labor origin 0.96(1.80)
Cooperative labor origin 1.92(2.66)
2SLS 2SLS(First Stage) (Second Stage)
Observations 15 15
R2 0.84 0.89
Notes: t-statistics are in parentheses. See Table 2 for a description of the variables. The sample includes the 13 countries from Faccio and Lang (2002) listed in Table 1a of the online Appendix plus two additional countries with predicted values using data from La Porta, Lopezde-Silanes, and Shleifer (1999): Denmark and the Netherlands.
VOL. 3 NO. 2 239MuELLER AND pHiLippON: FAMiLy FiRMS AND LABOR RELATiONS
quality of labor relations.13 The second-stage regression, which is displayed in col-umn 2, confirms that Cooperative Labor Relations is negatively related to family control and significant at the 1 percent level. In fact, the coefficient is similar to that in our OLS regressions.14 Also, both legal origin dummies are significant and enter with the predicted sign (see La Porta et al. 1998).
Though the IV result confirms our OLS result, its usefulness is, unfortunately, limited. While we can reject the null that Neutral and Cooperative Labor Origin are jointly insignificant in the first-stage regression, the corresponding F− statistic is only 3.88, implying that the instrument is weak according to the criteria in Table 5.2 of Stock and Yogo (2005).
V. Family Ownership Across Industries and Countries
Another way to address the issue of causality employs the methodology by Rajan and Zingales (1998). Adapted to our specific context, the hypothesis is that—con-trolling for industry- and country-fixed effects—industries that are more labor dependent should have more family ownership in countries with worse labor rela-tions. As Rajan and Zingales (1998) note, “such a finding could be the ‘smoking gun’ in the debate about causality.” In particular, the ability to include industry- and country-fixed effects alleviates concerns about omitted variables.
When constructing our measure of industries’ labor dependence, we encounter the same conceptual issue as Rajan and Zingales (1998) do, namely, the labor share in an industry must reflect the demand for labor solely based on technological con-siderations. In particular, it must not be “contaminated” by aspects related to the quality of labor relations. For this reason, it is problematic to use data on labor shares in each country. Instead, we follow Rajan and Zingales (1998) and use the United States as our benchmark to compute labor shares.15 As is common practice, we compute the labor share of industry j as v l j /(v l j + v k j ), where v l j and v k j denote the values of labor inputs and capital services, respectively, for industry j in 1995. Labor shares are displayed in the online Appendix, Table 3, column i.
Our ownership data are based on FL’s (2002) sample of 5,232 Western European companies described in Section IIA.16 There are 853 companies with missing
13 This is also true in an unconditional sense, i.e., when we drop all variables except Legal Origin from the first-stage regression. In that case, the coefficients on English and German legal origin are 0.96 (t− statistic of 0.99) and 0.95 (t− statistic of 1.15), respectively.
14 While Labor Origin is correlated with either the fraction of Catholics or Protestants, this correlation is far from perfect. In fact, Ireland, Belgium, and Austria, three of the most Catholic countries in Europe, are classified as either “political neutrals” or “political facilitators.” Likewise, the four Scandinavian countries, which each had less than one percent Catholics in 1900, are classified as “political neutrals,” while Germany, the Netherlands, and Switzerland, which all had a much higher fraction of Catholics in 1900, are classified as “political facilitators.” Indeed, if we replace Labor Origin with either the fraction of Catholics or Protestants in 1900, the R 2 of the second-stage regression drops by 23 percentage points, and Cooperative Labor Relations is only significant at the 5 percent level. (The year 1900 is the earliest year for which we have religion data available.)
15 The use of US data as a proxy for industries’ dependence (here: on labor) in other countries rests on the assumption that there are technological reasons for why some industries are more labor dependent than others, and these technological reasons are comparable across countries. We believe this is a reasonable assumption in our case, as the countries in our regression are all Western European countries. Moreover, to the extent that our US-based measures are noisy proxies of the industries’ true labor dependence in other countries, it only makes it harder for us to find significant results.
16 We are grateful to Mara Faccio for providing us with the industry classifications.
240 AMERiCAN ECONOMiC JOuRNAL: MACROECONOMiCS ApRiL 2011
industry classifications, leaving us with a final sample of 4,379 companies from 13 Western European countries. For a given industry j and country k, we compute the mean fraction of firms controlled by families. Since we have 19 industries and 13 countries, this implies a total of 247 potential observations. In 17 cases, there are no firms in a particular industry and country, leaving us with 230 observations. Table 3 of the online Appendix provides summary statistics.
The first equation we estimate includes both industry- and country-level control variables but no fixed effects. We estimate
(4) Fa m jk = α + β′ Control s j,k + γ LaborShar ej
× CooperativeLaborRelationsk + ε j k ,
where Fa m jk is the mean fraction of firms controlled by families in industry j and country k, and where Control s j, k includes—besides Labor Shar e j and Cooperative Labor Relation s k —the log of the total population in 1995. Standard errors are clustered at the country level. (The results are similar if we cluster at the industry level.) As column 1 of Table 8 shows, the interaction term between Labor Sharej and Cooperative Labor Relation s k is negative and significant at the 1 percent level, implying that industries that are more labor dependent have more family ownership in countries with worse labor relations.
The possibility of an omitted variable, either at the country or industry level, is a major concern in any empirical cross-country analysis. In the next regression, we therefore include—in place of specific industry- and country-level control vari-ables—industry- and country-fixed effects, implying the only variables that are identified are those that vary both across industries and countries. The equation we estimate is:
(5) Fa m jk = α + β Labor Shar e j × Cooperative Labor Relation s k + η j
+ ξ k + ε j k ,
where ηj and ξ k are industry- and country-fixed effects, respectively. As column 2 of Table 3 shows, the interaction term between Labor Sharej and Cooperative Labor Relationsk is again negative and significant at the 1 percent level, confirming that our previous results are robust to including fixed effects. The coefficient on the interac-tion term is similar to that in column 1, while the R 2 is naturally higher, given that we have included industry- and country-fixed effects.
A concern is that Cooperative Labor Relations might proxy for some other coun-try-level characteristic. To address this concern, we run—similar to what we did in Sections IIIB to IIID—“horse races” between Cooperative Labor Relations and other country-level variables. In each case, we include an additional interaction term Labor Sharej × Zk, where Zk is the respective country-level variable. (Zk as a stand-alone control variable is not identified because of the country-fixed effects.) As can-didates for Zk, we use the Anti-director Rights Index from Section IIIC, the Collective Bargaining Index and a measure of the bargaining power of workers as perceived
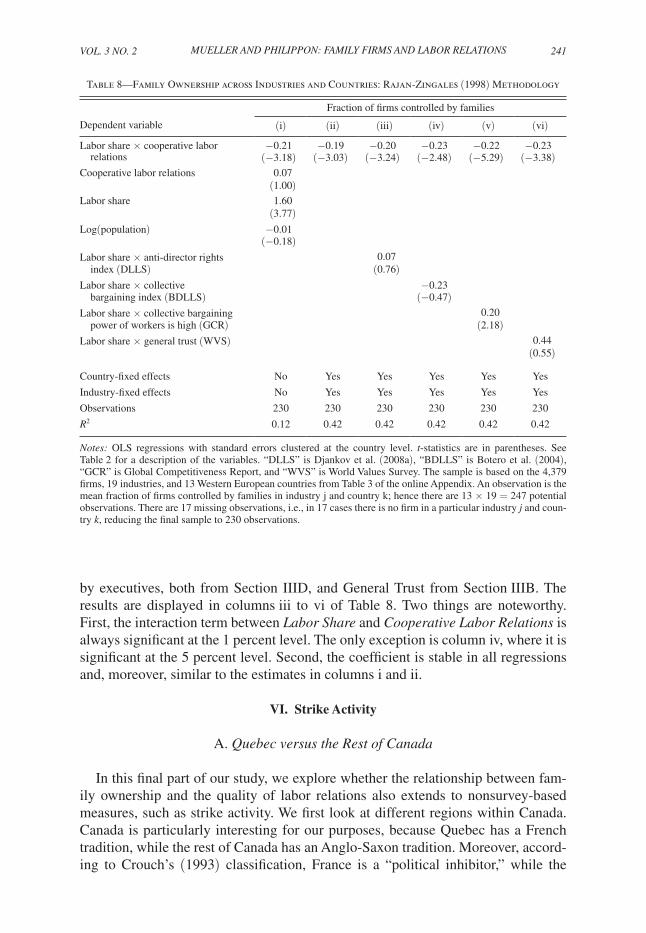
VOL. 3 NO. 2 241MuELLER AND pHiLippON: FAMiLy FiRMS AND LABOR RELATiONS
by executives, both from Section IIID, and General Trust from Section IIIB. The results are displayed in columns iii to vi of Table 8. Two things are noteworthy. First, the interaction term between Labor Share and Cooperative Labor Relations is always significant at the 1 percent level. The only exception is column iv, where it is significant at the 5 percent level. Second, the coefficient is stable in all regressions and, moreover, similar to the estimates in columns i and ii.
VI. Strike Activity
A. Quebec versus the Rest of Canada
In this final part of our study, we explore whether the relationship between fam-ily ownership and the quality of labor relations also extends to nonsurvey-based measures, such as strike activity. We first look at different regions within Canada. Canada is particularly interesting for our purposes, because Quebec has a French tradition, while the rest of Canada has an Anglo-Saxon tradition. Moreover, accord-ing to Crouch’s (1993) classification, France is a “political inhibitor,” while the
Table 8—Family Ownership across Industries and Countries: Rajan-Zingales (1998) Methodology
Fraction of firms controlled by families
Dependent variable (i) (ii) (iii) (iv) (v) (vi)
Labor share × cooperative labor −0.21 −0.19 −0.20 −0.23 −0.22 −0.23 relations (−3.18) (−3.03) (−3.24) (−2.48) (−5.29) (−3.38)Cooperative labor relations 0.07
(1.00)Labor share 1.60
(3.77)Log(population) −0.01
(−0.18)Labor share × anti-director rights 0.07 index (DLLS) (0.76)Labor share × collective −0.23 bargaining index (BDLLS) (−0.47)Labor share × collective bargaining 0.20 power of workers is high (GCR) (2.18)Labor share × general trust (WVS) 0.44
(0.55)
Country-fixed effects No Yes Yes Yes Yes Yes
Industry-fixed effects No Yes Yes Yes Yes Yes
Observations 230 230 230 230 230 230
R2 0.12 0.42 0.42 0.42 0.42 0.42
Notes: OLS regressions with standard errors clustered at the country level. t-statistics are in parentheses. See Table 2 for a description of the variables. “DLLS” is Djankov et al. (2008a), “BDLLS” is Botero et al. (2004), “GCR” is Global Competitiveness Report, and “WVS” is World Values Survey. The sample is based on the 4,379 firms, 19 industries, and 13 Western European countries from Table 3 of the online Appendix. An observation is the mean fraction of firms controlled by families in industry j and country k; hence there are 13 × 19 = 247 potential observations. There are 17 missing observations, i.e., in 17 cases there is no firm in a particular industry j and coun-try k, reducing the final sample to 230 observations.
242 AMERiCAN ECONOMiC JOuRNAL: MACROECONOMiCS ApRiL 2011
United Kingdom is a “political neutral” (see Section IV). Hence, we would expect to find more labor hostility in Quebec than in the rest of Canada. And if our cross-country results extend to different regions within a country, then we would also expect that Quebec has more family ownership than does the rest of Canada.
We have strike data from 1953 until 2002, both for Quebec separately and for Canada as a whole, where strike activity is defined as the number of person-days lost due to strikes and lockouts, normalized by the number of salaried workers. A look at the data confirms that the average strike activity in Quebec is significantly higher than in the rest of Canada. As for family ownership, Najah Attig and Yoser Gadhoum (2003) report ultimate ownership data for the year 1996, both for Quebec separately and for Canada as a whole. Their sample includes 1,112 publicly held companies, 155 of which are headquartered in Quebec. And indeed, family ownership is more pervasive in Quebec. While 57 percent of all firms in Quebec are controlled by fami-lies (20 percent cutoff), only 38 percent of all firms in the rest of Canada are con-trolled by families. This difference is significant at the 1 percent level. While this is encouraging, it should be noted that these results are based on raw data, i.e., they do not control for other factors that might explain differences between Quebec and the rest of Canada, such as industry structure or the legal environment. (For example, Quebec, like France, has a Civil Law code, while the remaining Canadian provinces have a Common Law code.)17
B. Strike Activity in the 1960s
We finally return to our cross-country study, except that we use actual strike data instead of survey-based measures of the quality of labor relations. The problem with using strike data is that strike activity depends on many factors, notably unemploy-ment. Given that we have a limited number of countries, it is impossible to control for all these factors. In the 1960s, however, many of the factors that commonly affect strike activity—including unemployment and TFP growth—were relatively uniform across Western countries, which makes this period ideal for our study. Our measure of strike activity is adopted from Blanchard and Philippon (2004). Greece, Portugal, and Spain are excluded from our sample. All three countries were dictatorships in the 1960s, and strikes were illegal there.
The results are in column i of Table 9. As is shown, high strike activity in the 1960s is significantly positively related to family ownership more than thirty years later. Prima facie, reverse causality is not a major concern, as the dependent vari-able is from the 1990s. And yet, given that family ownership is likely persistent, we cannot rule out that the causality goes the other way. To address this possibility, we instrument strike activity in the 1960s with Labor Origin (see Section IV). The first-stage regression, which is displayed in column 2 of Table 9, shows that there is a significant relationship between Labor Origin and strike activity in the 1960s.
17 That said, the relevant corporation law is the same for firms in Quebec and the rest of Canada, which makes it less likely that the observed differences in family ownership are due to differences in minority shareholder protec-tion. As Attig and Gadhoum (2003) note, “traded firms in Quebec and in the rest of Canada are created under the same law, Canada Business Corporations Act. In addition, stock market regulations in the different provinces of Canada are not remarkably different.”
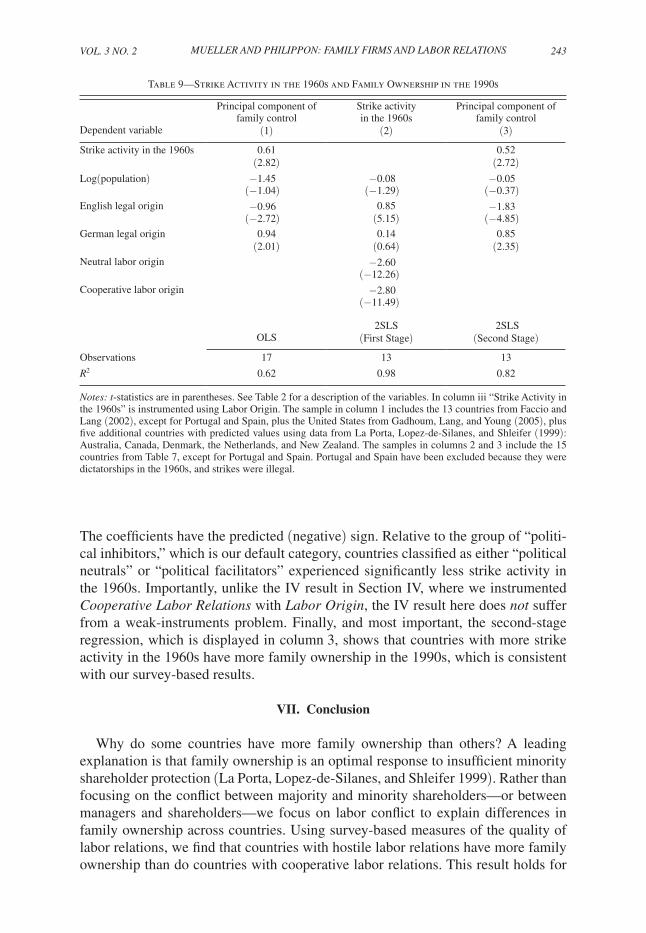
VOL. 3 NO. 2 243MuELLER AND pHiLippON: FAMiLy FiRMS AND LABOR RELATiONS
The coefficients have the predicted (negative) sign. Relative to the group of “politi-cal inhibitors,” which is our default category, countries classified as either “political neutrals” or “political facilitators” experienced significantly less strike activity in the 1960s. Importantly, unlike the IV result in Section IV, where we instrumented Cooperative Labor Relations with Labor Origin, the IV result here does not suffer from a weak-instruments problem. Finally, and most important, the second-stage regression, which is displayed in column 3, shows that countries with more strike activity in the 1960s have more family ownership in the 1990s, which is consistent with our survey-based results.
VII. Conclusion
Why do some countries have more family ownership than others? A leading explanation is that family ownership is an optimal response to insufficient minority shareholder protection (La Porta, Lopez-de-Silanes, and Shleifer 1999). Rather than focusing on the conflict between majority and minority shareholders—or between managers and shareholders—we focus on labor conflict to explain differences in family ownership across countries. Using survey-based measures of the quality of labor relations, we find that countries with hostile labor relations have more family ownership than do countries with cooperative labor relations. This result holds for
Table 9—Strike Activity in the 1960s and Family Ownership in the 1990s
Principal component of family control
Strike activity in the 1960s
Principal component of family control
Dependent variable (1) (2) (3)
Strike activity in the 1960s 0.61 0.52(2.82) (2.72)
Log(population) −1.45 −0.08 −0.05(−1.04) (−1.29) (−0.37)
English legal origin −0.96 0.85 −1.83(−2.72) (5.15) (−4.85)
German legal origin 0.94 0.14 0.85(2.01) (0.64) (2.35)
Neutral labor origin −2.60(−12.26)
Cooperative labor origin −2.80(−11.49)
2SLS 2SLSOLS (First Stage) (Second Stage)
Observations 17 13 13
R2 0.62 0.98 0.82
Notes: t-statistics are in parentheses. See Table 2 for a description of the variables. In column iii “Strike Activity in the 1960s” is instrumented using Labor Origin. The sample in column 1 includes the 13 countries from Faccio and Lang (2002), except for Portugal and Spain, plus the United States from Gadhoum, Lang, and Young (2005), plus five additional countries with predicted values using data from La Porta, Lopez-de-Silanes, and Shleifer (1999): Australia, Canada, Denmark, the Netherlands, and New Zealand. The samples in columns 2 and 3 include the 15 countries from Table 7, except for Portugal and Spain. Portugal and Spain have been excluded because they were dictatorships in the 1960s, and strikes were illegal.
244 AMERiCAN ECONOMiC JOuRNAL: MACROECONOMiCS ApRiL 2011
different measures of family ownership as well as for different subsamples (e.g., Asia, Europe). It also holds if we control for minority shareholder protection, credi-tor rights, law enforcement, stock market development, income inequality, labor regulation, union bargaining power, and other potential determinants of family ownership, including measures of trust and social capital. Finally, the result holds if—instead of using survey-based measures of the quality of labor relations—we use actual strike data from the 1960s. As is shown, differences in strike activity in the 1960s can predict differences in family ownership more than 30 years later.
REFERENCES
Anderson, Ronald C., and David M. Reeb. 2003. “Founding-Family Ownership and Firm Perfor-mance: Evidence from the S&P 500.” Journal of Finance, 58(3): 1301–28.
Attig, Najah, and Yoser Gadhoum. 2003. “The Governance of Canadian Traded Firms: An Analysis of the Ultimate Ownership Structure.” Unpublished.
Bennedsen, Morten, Kasper Meisner Nielson, Francisco Pérez-González, and Daniel Wolfenzon. 2007. “Inside the Family Firm: The Role of Families in Succession Decisions and Performance.” Quar-terly Journal of Economics, 122(2): 647–91.
Bertrand, Marianne, and Sendhil Mullainathan. 2003. “Enjoying the Quiet Life? Corporate Gover-nance and Managerial Preferences.” Journal of political Economy, 111(5): 1043–75.
Blanchard, Olivier, and Thomas Philippon. 2004. “The Quality of Labor Relations and Unemploy-ment.” National Bureau of Economic Research Working Paper 10590.
Bloom, Nicholas, and John Van Reenen. 2007. “Measuring and Explaining Management Practices across Firms and Countries.” Quarterly Journal of Economics, 122(4): 1351–1408.
Botero, Juan C., Simeon Djankov, Rafael La Porta, Florencio Lopez-de-Silanes, and Andrei Shleifer. 2004. “The Regulation of Labor.” Quarterly Journal of Economics, 119(4): 1339–82.
Claessens, Stijn, Simeon Djankov, and Larry H. P. Lang. 2000. “The Separation of Ownership and Control in East Asian Corporations.” Journal of Financial Economics, 58(1–2): 81–112.
Crouch, Colin. 1993. industrial Relations and European State Traditions. Oxford: Clarendon Press.Davis, Steven J., John Haltiwanger, Ron Jarmin, and Javier Miranda. 2007. “Volatility and Disper-
sion in Business Growth Rates: Publicly Traded versus Privately Held Firms.” In NBER Macro-economics Annual 2006, ed. Daron Acemoglu, Kenneth Rogoff and Michael Woodford, 107–56. Cambridge, MA: MIT Press.
Demsetz, Harold, and Kenneth Lehn. 1985. “The Structure of Corporate Ownership: Causes and Con-sequences.” Journal of political Economy, 93(6): 1155–77.
Djankov, Simeon, Rafael La Porta, Florencio Lopez-de-Silanes, and Andrei Shleifer. 2008a. “The Law and Economics of Self-Dealing.” Journal of Financial Economics, 88(3): 430–65.
Djankov, Simeon, Oliver Hart, Caralee McLiesh, and Andrei Shleifer. 2008b. “Debt Enforcement around the World.” Journal of political Economy, 116(6): 1105–49.
Donnelley, Robert G. 1964. “The Family Business.” Harvard Business Review, 42(4): 93–105.Faccio, Mara, and Larry H. P. Lang. 2002. “The Ultimate Ownership of Western European Corpora-
tions.” Journal of Financial Economics, 65(3): 365–95.Fisman, Raymond, and Inessa Love. 2004. “Financial Development and Intersectoral Allocation: A
New Approach.” Journal of Finance, 59(6): 2785–2807.Fogel, Kathy. 2006. “Oligarchic Family Control, Social Economic Outcomes, and the Quality of Gov-
ernment.” Journal of international Business Studies, 37(5): 603–22.Gadhoum, Yoser, Larry H. P. Lang, and Leslie Young. 2005. “Who Controls US?” European Financial
Management, 11(3): 339–63.Inglehart, Ronald, Miguel Basáñez, Jaime Díez-Medrano, Loek Halman, and Ruud Luijkx, ed. 2004.
Human Beliefs and Values: A Cross-Cultural Sourcebook Based on the 1999–2002 Values Surveys. Mexico: Siglo XXI Editores.
International Institute for Management Development (IMD). Various Years. iMD World Competitive-ness yearbook. Lausanne: IMD.
Jorgenson, Dale W., and Kevin J. Stiroh. 2000. “Raising the Speed Limit: U.S. Economic Growth in the Information Age.” Brookings papers on Economic Activity, 125–211.
La Porta, Rafael, Florencio Lopez-de-Silanes, and Andrei Shleifer. 1999. “Corporate Ownership around the World.” Journal of Finance, 54(2): 471–517.
VOL. 3 NO. 2 245MuELLER AND pHiLippON: FAMiLy FiRMS AND LABOR RELATiONS
La Porta, Rafael, Florencio Lopez-de-Silanes, Andrei Shleifer, and Robert W. Vishny. 1997. “Trust in Large Organizations.” American Economic Review, 87(2): 333–38.
La Porta, Rafael, Florencio Lopez-de-Silanes, Andrei Shleifer, and Robert W. Vishny. 1998. “Law and Finance.” Journal of political Economy, 106(6): 1113–55.
Organisation for Economic Co-Operation and Development (OECD). 1997. Employment Outlook. Paris: OECD.
Pagano, Marco, and Paolo F. Volpin. 2005. “The Political Economy of Corporate Governance.” Ameri-can Economic Review, 95(4): 1005–30.
Pérez-González, Francisco. 2006. “Inherited Control and Firm Performance.” American Economic Review, 96(5): 1559–88.
Rajan, Raghuram G., and Luigi Zingales. 1998. “Financial Dependence and Growth.” American Eco-nomic Review, 88(3): 559–86.
Roe, Mark J. 2003. political Determinants of Corporate Governance: political Context, Corporate impact. Oxford: Oxford University Press.
Shleifer, Andrei, and Lawrence H. Summers. 1988. “Breach of Trust in Hostile Takeovers.” In Corpo-rate Takeovers: Causes and Consequences, ed. Alan J. Auerbach, 33–56. Chicago: University of Chicago Press.
Sraer, David, and David Thesmar. 2007. “Performance and Behavior of Family Firms: Evidence from the French Stock Market.” Journal of the European Economic Association, 5(4): 709–51.
Stock, James H., and Motohiro Yogo. 2005. “Testing for Weak Instruments in Linear IV Regression.” In identification and inference for Econometric Models: Essays in Honor of Thomas Rothenberg, ed. Donald W. K. Andrews and James H. Stock, 80–108. Cambridge, UK: Cambridge University Press.
Villalonga, Belen, and Raphael Amit. 2006. “How Do Family Ownership, Control and Management Affect Firm Value?” Journal of Financial Economics, 80(2): 385–417.
World Economic Forum. Various Years. The Global Competitiveness Report. New York: Palgrave MacMillan.