Fall 2016 AM107Team3 P2 Final Report
66
Memo Of Transmittal Date: November 18, 2016 To: Senior Partners of Copeland Associates Chauncey Joyce John Keifer Lori Marchese Tom Marchese Copeland Hall, Court Street Athens, Ohio 45701 From: AM107 Cohort Team 3 Subject: Feasibility Analysis of Bizzy’s Breakfast Bar Dear Senior Partners: The attached business report, written for the senior partners of Copeland Associates, analyzes the feasibility of opening the fast-casual breakfast restaurant, Bizzy’s Breakfast Bar, in Des Moines, Iowa. The report provides insight on the restaurant industry as a whole, as well as an in-depth look at the fast-casual breakfast segment that operates within the industry. The report introduces the specific business concept of Bizzy’s Breakfast Bar, including all the components necessary in defining our business mission, future outlook, and strategies to be employed. In order for our company to succeed, we have identified variables that are essential in the creation and initial planning of our concept, which ultimately defines how we operate and under what standards we set for the customer experience. The report also describes the research and analysis behind the decision of choosing Des Moines, Iowa, as our primary location for the business. Also, both indirect and direct competitors are defined based on numerous variables that factor into the analysis, as well as the expected response to entry that these companies will be facing. Additionally, two extensive demand scenarios were conducted, including primary research and secondary research. Components of the primary research were found by speaking to managers and associates of companies both in Des Moines, Iowa, as well as other cities across the United States. By combining this useful information with additional research, we were able to perform and analyze calculations that led us to our analysis of comparable markets. On the other hand, the secondary research was found by utilizing various resources that provided insight to our demographic target market analyses. The report also addresses the marketing plan that the restaurant will implement within the first few years of operation, and what type of strategies we expect to be the most successful. By strategically determining the prices for our menu, we were able to create an inviting menu, identify Bizzy’s product mix, and establish promotional concepts that will be useful for gaining customer awareness and customer retention. Along with a marketing plan the report includes additional plans for operational and managerial strategies, so that Bizzy’s Breakfast Bar is able to continuously maintain and utilize its resources in the most efficient and effective way. In order to ensure quality customer service and appropriate resource management, we decided to purchase a cloud based information technology system that is useful for various functions of our business. Finally, the conclusion of the feasibility analysis is supported by several financial assumptions, carefully calculated and reported within the report as well in the appendices. The report is accompanied with additional tools that make up the appendices to show how we utilized our research, which ultimately affected the conclusions that were made. A PESTLE analysis was used to help analyze the macro-environment of the restaurant industry, while the Porter’s analysis was used to analyze both the fast-casual and breakfast segments within the micro-environment. Additional tools such as the Business Canvas Model, SWOT analysis, and various others were utilized in order to assist in the feasibility analysis of our fast-casual breakfast restaurant, Bizzy’s Breakfast Bar. We would like to thank Copeland Associates for providing us the opportunity to create and present this report, and for trusting in our team to construct the feasibility analysis of Bizzy’s Breakfast Bar. Please feel free to contact us with any questions that may arise, and we will be happy to provide our assistance. Sincerely, AM107 Cohort Team 3 Jeffrey Cox [email protected] Danielle DeMaria [email protected] Laura Gilmore [email protected] Tonny Michel [email protected] Tayler Sweeney [email protected] Page | I
-
Upload
tayler-sweeney -
Category
Documents
-
view
16 -
download
4
Transcript of Fall 2016 AM107Team3 P2 Final Report

Memo Of TransmittalDate: November 18, 2016
To: Senior Partners of Copeland AssociatesChauncey Joyce John KeiferLori MarcheseTom Marchese
Copeland Hall, Court Street Athens, Ohio 45701
From: AM107 Cohort Team 3
Subject: Feasibility Analysis of Bizzy’s Breakfast Bar
Dear Senior Partners:
The attached business report, written for the senior partners of Copeland Associates, analyzes the feasibility of opening the fast-casual breakfast restaurant, Bizzy’s Breakfast Bar, in Des Moines, Iowa. The report provides insight on the restaurant industry as a whole, as well as an in-depth look at the fast-casual breakfast segment that operates within the industry. The report introduces the specific business concept of Bizzy’s Breakfast Bar, including all the components necessary in defining our business mission, future outlook, and strategies to be employed. In order for our company to succeed, we have identified variables that are essential in the creation and initial planning of our concept, which ultimately defines how we operate and under what standards we set for the customer experience. The report also describes the research and analysis behind the decision of choosing Des Moines, Iowa, as our primary location for the business. Also, both indirect and direct competitors are defined based on numerous variables that factor into the analysis, as well as the expected response to entry that these companies will be facing. Additionally, two extensive demand scenarios were conducted, including primary research and secondary research. Components of the primary research were found by speaking to managers and associates of companies both in Des Moines, Iowa, as well as other cities across the United States. By combining this useful information with additional research, we were able to perform and analyze calculations that led us to our analysis of comparable markets. On the other hand, the secondary research was found by utilizing various resources that provided insight to our demographic target market analyses.
The report also addresses the marketing plan that the restaurant will implement within the first few years of operation, and what type of strategies we expect to be the most successful. By strategically determining the prices for our menu, we were able to create an inviting menu, identify Bizzy’s product mix, and establish promotional concepts that will be useful for gaining customer awareness and customer retention. Along with a marketing plan the report includes additional plans for operational and managerial strategies, so that Bizzy’s Breakfast Bar is able to continuously maintain and utilize its resources in the most efficient and effective way. In order to ensure quality customer service and appropriate resource management, we decided to purchase a cloud based information technology system that is useful for various functions of our business. Finally, the conclusion of the feasibility analysis is supported by several financial assumptions, carefully calculated and reported within the report as well in the appendices.
The report is accompanied with additional tools that make up the appendices to show how we utilized our research, which ultimately affected the conclusions that were made. A PESTLE analysis was used to help analyze the macro-environment of the restaurant industry, while the Porter’s analysis was used to analyze both the fast-casual and breakfast segments within the micro-environment. Additional tools such as the Business Canvas Model, SWOT analysis, and various others were utilized in order to assist in the feasibility analysis of our fast-casual breakfast restaurant, Bizzy’s Breakfast Bar.
We would like to thank Copeland Associates for providing us the opportunity to create and present this report, and for trusting in our team to construct the feasibility analysis of Bizzy’s Breakfast Bar. Please feel free to contact us with any questions that may arise, and we will be happy to provide our assistance.
Sincerely,
AM107 Cohort Team 3Jeffrey Cox [email protected] DeMaria [email protected] Gilmore [email protected] Michel [email protected] Sweeney [email protected]
Page | I

Jeffrey Cox Danielle Demaria
Laura Gilmore
Tayler SweeneyTonny Michel
Copeland Associates: Team 3
Jeffery Cox Danielle DeMaria
Page | II

Prepared for:Senior Partners of Copeland Associates:
Professor MarcheseProfessor Marchese
Professor JoyceProfessor Keifer
Prepared by:AM 107 Team 3
Jeffery CoxDanielle DeMaria
Laura GilmoreTonny Michel
Tayler Sweeney
Page | III

Industry Analysis The following report consists of an in-depth feasibility analysis of the fast-casual, start-up breakfast restaurant, Bizzy’s Breakfast Bar, and its forecasted success in Des Moines, Iowa. First, it was necessary to take a look at the restaurant industry as a whole, as well as the trends that exist on the macro-environmental level. Some trends that exist in the industry include increasing breakfast demand, healthy breakfast food, and demand for breakfast-to-go/delivery. Second, it was essential to analyze the micro-environmental factors that include aspects of the fast-casual segment, as well as the breakfast food segment.
Competitor StrategiesIn addition to analyzing the macro and micro-environments of the industry, both indirect and direct competitors were identified in Des Moines, Iowa, that Bizzy’s will be competing against in their market segment. Direct competitors include companies such as Bruegger’s Bagels, Panera Bread, and PerKup Café. These restaurants may view Bizzy’s Breakfast Bar as more of a threat, as not only are they located on the same street, but they are also targeting the same market. On the other hand, indirect competitors include restaurants such as Waveland Café and IHOP, because although these companies serve breakfast as well, they are considered part of the casual dining segment. After using various tools and extensive research to analyze the market segment in which Bizzy’s will be competing, the company was able to strategically place themselves among their competitors. In order to see success, the restaurant will develop and maintain several competitive advantages that ensure their future growth.
Business ConceptBizzy’s Breakfast Bar was created to satisfy the many consumers who want an all day breakfast. It is a fast-casual restaurant, catering to customers who want a fast, high quality meal, at a lower price. Bizzy’s mission is simple, they create a conducive atmosphere for customers who are passionate about seeking memories from home-style food, while they care to ensure the balance between their environment and creating unique tastes for everyone. In terms of the target market, Bizzy’s is geared to target the millennial generation, including individuals ages 18-34 years old. 27% of the total population in Des Moines, Iowa, are considered millennials. Millennials are flourishing in this area, as it is a great place for young professionals to start both careers and families. With one of the lowest unemployment rates of 3.4% as of 2016, the job market in this city is very promising. Additionally, in the first half of 2015, 59% of millennials aged 21-35 used a mortgage to buy a home in the Des Moines downtown area, hence the importance of providing a quick, fast-casual breakfast bar that caters to all young professionals’ tastes.
Demand ScenariosUpon determining the forecasted demand for Bizzy’s Breakfast Bar, it was necessary to both utilize various research tools as well as contact multiple restaurants that operate under the breakfast segment of the restaurant industry, and contain a few aspects of operational similarity. After being fortunate enough to collect significant data from these restaurants, Bizzy’s conducted their first demand scenario: comparable concepts. By contacting these restaurants, they identified IHOP, Bruegger’s Bagels, and Waveland Café to be among the most relevant and relatable to Bizzy’s. Once the data was collected and weighted based on concept similarity, the average amount of customers per day and average ticket price were calculated. After these average amounts were calculated, Bizzy’s then determined the average customers per week, as well as customers per year. With this information, estimated annual sales of Bizzy’s Breakfast Bar were determined to be $1,101,240. This estimation compares to the second demand scenario, that measures the average customers per day and average ticket price based on Bizzy’s target market and exact location. For the second demand scenario, estimated annual sales calculated to be $931,680. Upon that projection, Bizzy’s decided to measure the comparable concepts demand scenario with a weight of 70%, while the demographic preferences demand scenario weighted at 30%, such that the first scenario provides more accurate data and relative comparison.
Executive Summary
Marketing, Business Logistics, and Information SystemsIn order for Bizzy’s to successfully run their restaurant, it was necessary to establish multiple strategies that will best utilize the resources in an efficient and effective way. First, they designed and implemented a marketing plan for the weeks prior to opening, in order to attract customers in the area and gain customer awareness. Then, promotional strategies were created for both the grand opening of the restaurant and the first months of operation. These marketing strategies include utilizing social media advertising through Twitter, Facebook, and Instagram, establishing consumer relationships with a mobile app and customer loyalty card, and maintaining public relations by sponsoring community events and posting eye-catching flyers in the area. In addition, it was essential to determine ways to strategically manage and maintain business logistics and operations, as well as customer relationship management efforts. By implementing a cloud based IOS system called iConnect, Bizzy’s Breakfast Bar can successfully manage its inventory, customer and employee relationships, online ordering, and more. This system gives Bizzy’s the information technology necessary to best utilize and showcase their potential. Additionally, QuickBooks will be the accounting software that the company will be purchasing, which is easily compatible and will integrate with iConnect.
Financial AssumptionsFinally, the feasibility analysis is supported by financial data that estimates the success of Bizzy’s Breakfast Bar within the first five years of operation. By calculating the Net Present Value, Internal Rate of Return, and Payback Period, it was found that Bizzy’s Breakfast Bar will see successful results, and is able to continue to grow in the near future.
Table 1: Decision Making CriteriaNet Present Value $352,832 Internal Rate of Return 50.06%Payback Period 2.33 Years
Page | IV
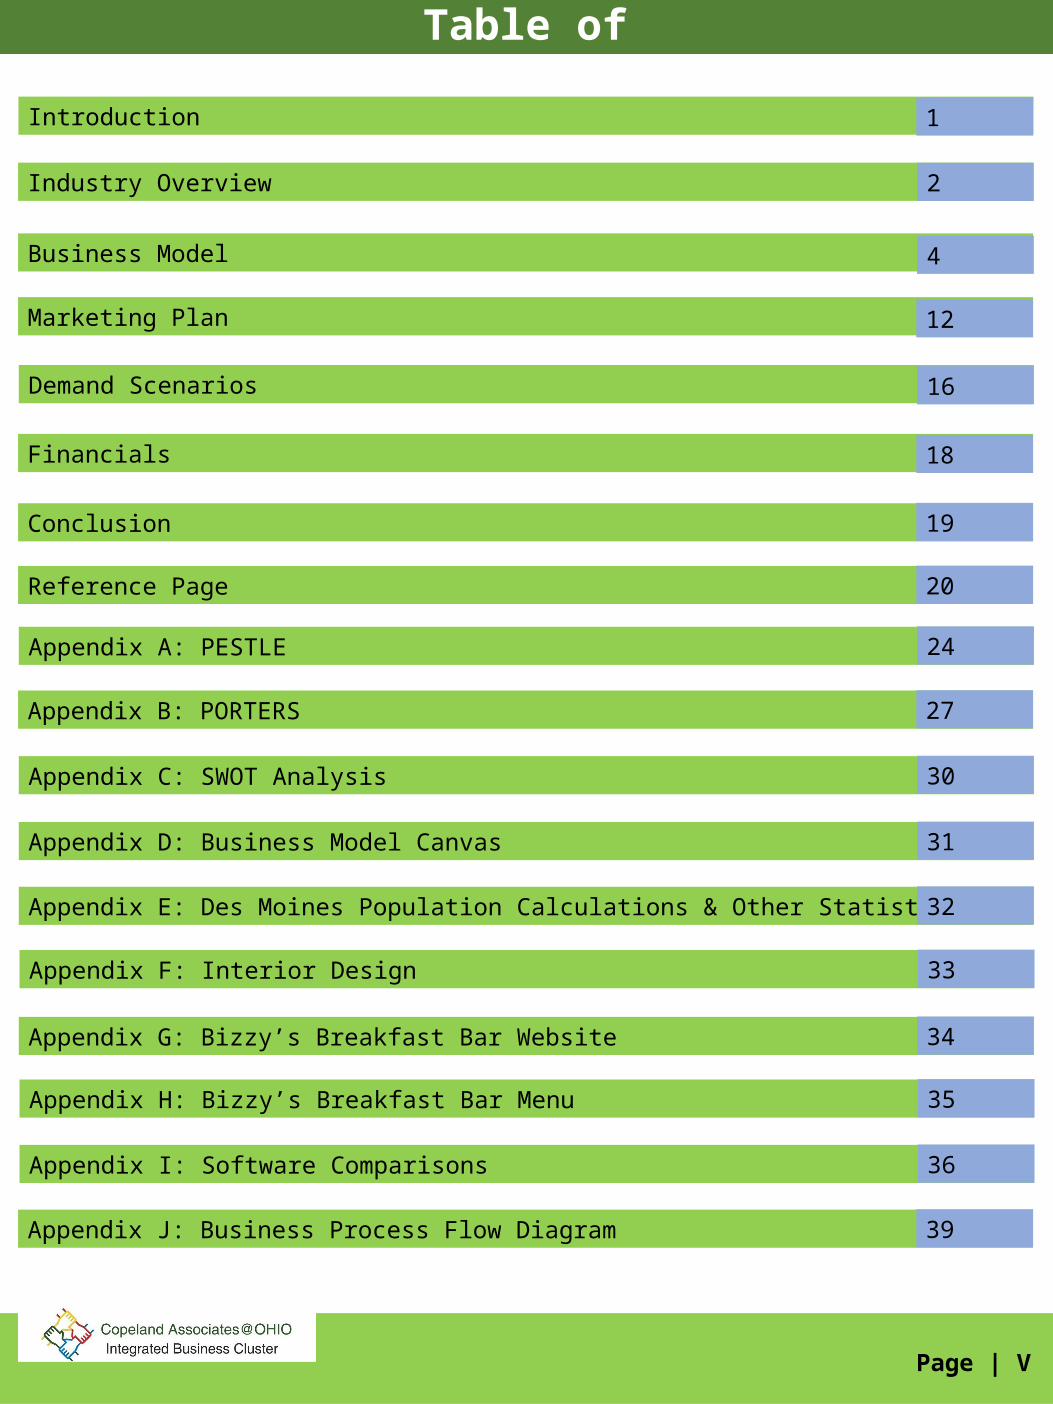
Table of Contents
Introduction 1
Industry Overview
Business Model
Marketing Plan
Financials
Demand Scenarios
Conclusion
2
4
12
16
18
19
Appendix A: PESTLE 24
Appendix B: PORTERS 27
Appendix C: SWOT Analysis 30
Appendix D: Business Model Canvas 31
Reference Page 20
Appendix E: Des Moines Population Calculations & Other Statistics 32
Appendix F: Interior Design 33
Appendix G: Bizzy’s Breakfast Bar Website 34
Appendix H: Bizzy’s Breakfast Bar Menu 35
Appendix I: Software Comparisons 36
Appendix J: Business Process Flow Diagram 39
Page | V

Table of Contents
Appendix K: Mobile App 41
Appendix L: Sales Dashboard
Appendix M: KPIs: Sales By Sq. Ft. and Customers Per Day, By Hour
Appendix N: KPIs: Top Selling Items
Appendix P: Brand Equity
Appendix O: Employee Work Schedule
Appendix Q: Pro Forma Balance Sheet
42
43
44
45
46
47
Appendix S : Quarterly Income Statement 49
Appendix T: Capital Budgeting 50
Appendix U: Year 1 Cash Flows 51
Appendix R: Pro Forma Income Statement 48
Appendix V: Loan Amortization 52
Appendix W: Straight Line Depreciation 55
Page | V
Appendix X: Cash to Sales Comparison 56
Appendix Y: Key Financial Ratios Summary 57

List of Figures
Figure A: Restaurant Industry Sales 2
Figure B: Traffic Percent Change Versus Year Ago
Figure D: Consumers Who Say They Want Breakfast All Day
Figure C: 2013 Restaurant Traffic Growth By Segment
Figure E: Breakfast Box
Figure G: Exterior of Restaurant
Figure F: Location of Restaurant
Figure H: Store Blueprint
2
3
3
3
4
4
4
Figure I: Market Shares 2015 5
Figure J: Map Layout
Figure L: 78% of the Iowa Population
Figure K: 27% of Iowa Population
Figure M: Population of Millennials from 2014-2020
Figure O: Starbucks Sales By Hour
Figure N: IHOPE Sales By Hour
Figure P: What Healthy Food At A Restaurant Means
5
6
6
7
8
8
8
Figure Q: MIS Gear 9
Figure R: iConnect System Comparison 9
Page | VI

List of Figures
Figure S: Daily Organizational Structure 10
Figure T: Floor Plan
Figure V: Public Advertising
Figure U: Supplier Benefits
Figure W: Bizzy’s Breakfast Bar Menu
Figure Y: Product Percentage Mix
Figure X: Product Mix
Figure Z: Yearly Net Income
11
11
13
13
14
14
18
Page | VII

List of Tables
Table 1: Decision Making Criteria IV
Table 2: Device Comparison
Table 3: Bizzy’s Employees Model
9
10
Table 4: Comparable Concepts
Table 5: Calculating Conversion Rate For Panera Bread
Table 7: Bizzy’s Breakfast Bar Projected Sales
Table 6: Bizzy’s Breakfast Bar Projected Customers
Table 8: Yearly Cash Flows
16
17
17
17
18
Page | VIII
Table 9: Demand Scenarios 19
Introduction
Page | 1
Introduction Industry Overview
Business Model
Demand Scenarios
Financials ConclusionMarketing Plan
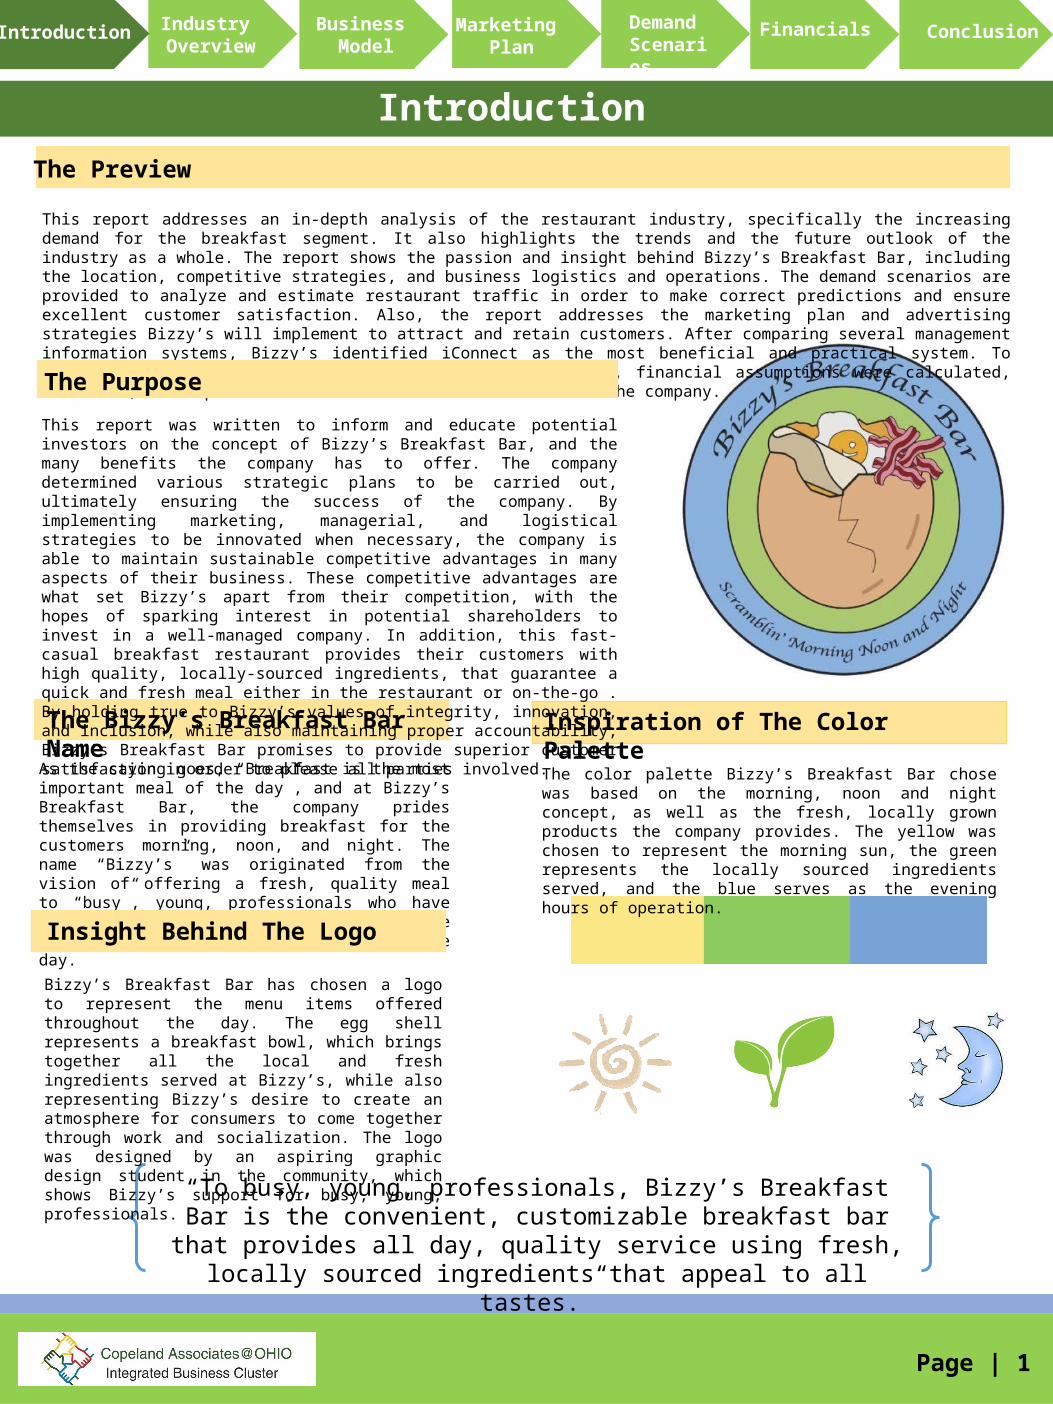
“To busy, young, professionals, Bizzy’s Breakfast Bar is the convenient, customizable breakfast bar that provides all day, quality service using fresh,
locally sourced ingredients that appeal to all tastes.”
This report addresses an in-depth analysis of the restaurant industry, specifically the increasing demand for the breakfast segment. It also highlights the trends and the future outlook of the industry as a whole. The report shows the passion and insight behind Bizzy’s Breakfast Bar, including the location, competitive strategies, and business logistics and operations. The demand scenarios are provided to analyze and estimate restaurant traffic in order to make correct predictions and ensure excellent customer satisfaction. Also, the report addresses the marketing plan and advertising strategies Bizzy’s will implement to attract and retain customers. After comparing several management information systems, Bizzy’s identified iConnect as the most beneficial and practical system. To support the feasibility analysis of Bizzy’s Breakfast Bar, financial assumptions were calculated, estimated, and explained in order to ensure the success of the company.
As the saying goes, “Breakfast is the most important meal of the day”, and at Bizzy’s Breakfast Bar, the company prides themselves in providing breakfast for the customers morning, noon, and night. The name “Bizzy’s” was originated from the vision of offering a fresh, quality meal to “busy”, young, professionals who have expressed an interest of wanting the choice to eat breakfast at any time of the day.
The Bizzy’s Breakfast Bar Name
Insight Behind The Logo
Bizzy’s Breakfast Bar has chosen a logo to represent the menu items offered throughout the day. The egg shell represents a breakfast bowl, which brings together all the local and fresh ingredients served at Bizzy’s, while also representing Bizzy’s desire to create an atmosphere for consumers to come together through work and socialization. The logo was designed by an aspiring graphic design student in the community, which shows Bizzy’s support for busy, young, professionals.
Inspiration of The Color Palette
The color palette Bizzy’s Breakfast Bar chose was based on the morning, noon and night concept, as well as the fresh, locally grown products the company provides. The yellow was chosen to represent the morning sun, the green represents the locally sourced ingredients served, and the blue serves as the evening hours of operation.
The Purpose
The Preview
This report was written to inform and educate potential investors on the concept of Bizzy’s Breakfast Bar, and the many benefits the company has to offer. The company determined various strategic plans to be carried out, ultimately ensuring the success of the company. By implementing marketing, managerial, and logistical strategies to be innovated when necessary, the company is able to maintain sustainable competitive advantages in many aspects of their business. These competitive advantages are what set Bizzy’s apart from their competition, with the hopes of sparking interest in potential shareholders to invest in a well-managed company. In addition, this fast-casual breakfast restaurant provides their customers with high quality, locally-sourced ingredients, that guarantee a quick and fresh meal either in the restaurant or on-the-go . By holding true to Bizzy’s values of integrity, innovation, and inclusion, while also maintaining proper accountability, Bizzy’s Breakfast Bar promises to provide superior customer satisfaction in order to please all parties involved.

Industry Overview
The restaurant industry consists of various segments making it more broad and diverse. The goal of restaurants is to develop a wide range of foods with unique tastes. Companies in the food and service industry operate restaurants under several segments, such as full-service restaurants (FSRs), quick-service restaurants (QSRs), fast-casual restaurants (FCRs), cafeterias and buffets, snack bars, food trucks and more. The combination of these segments in this industry innovate menus, hence promoting the culture of dining outside. The US restaurant industry includes about 630,000 restaurants with a combined annual revenue of about $783 billion as shown in Figure A (National Restaurant Association, 2016).
As a result, some fast-casual restaurants have been researching on providing all day breakfast because as the breakfast segment grows in the future, it could be extended into the lunch and dinner hours, this shows there will be some consumers seeking breakfast food during lunch or dinner.
In the past, there have been external factors (Macro) that influence the restaurant industry, specifically the breakfast segment. As discussed in the PESTLE analysis, both federal and state laws passed by lawmakers require additional information such as the calories to be displayed on menus. With this insight, consumers are able to make healthier choices based on their physical needs. Additionally, the industry has been benefiting from the positive impact of advanced technology. For instance, the introduction of mobile pay, online orders, and integrated technology systems help in organizing and analyzing the big data to predict the future, while developing business ideas.
The graph below shows a continuous increase in morning meals in restaurants while there is a gradual decrease in lunch, dinner and PM snacks. As a result of this data, restaurants are adjusting to these new trends to develop innovative menu items to satisfy their consumer’s demand. In short, although there is a slow growth in morning meals in restaurants, it has impacted the strategy, planning, and menu engineering for restaurants. They are allocating huge resources into research and development to satisfy consumer’s wants and needs.
Page | 2
The Restaurant Industry
The Breakfast Industry
Figure B
Figure A
Breakfast has become an increasingly popular and lucrative segment of the quick service restaurant industry, as restaurants deal with stagnant sales in lunch and dinner. The breakfast restaurant segment is currently at a rapid growth in the nation due to a huge demand by consumers. For this reason, the segment is currently worth “…$65 billion. In eight years it is predicted to swell in value to $83 billion” (Mintel, 2012). Fast-casual restaurants that serve breakfast have been keeping up with the trend of providing healthy breakfast on their menus and paying more attention to the earlier parts of the day for heavy breakfast eaters.
Source: restaurant.org
Source: npd.com
Industry Overview
Industry Overview
Business Model
Demand Scenarios
Financials ConclusionMarketing Plan
Introduction

Trends and Outlook
Society has always listened to their parents and physician’s advice when they were kids saying that “breakfast is the most important meal of the day”. It is indeed true that breakfast is the most important meal of the day because it provides consumers with good nutrients to kick start busy days (WebMD, 2016). Recently, restaurants have adapted breakfast foods on their menu to attract breakfast lovers during the morning traffic, but that is not enough to satisfy consumer demands. Figure D, from (Garcia, 2016) shows the percentage of each age range and their demand for all day breakfast. Millennials, ages 18-34, show a 77% lead, with ages 45-54 following with 72%. Although there is a limited growth in the types of food served in the industry, there is a higher growth in the breakfast segment. According to NPD, “Breakfast accounted for nearly 60% of the industry’s traffic growth over the past five years” (2016), because it is the new trend. Recently, McDonald’s began the all-day breakfast due to the outcry of its loyal customers on social media and the results. Sales for the first quarter revenue increased 5% in their same store sales worldwide (Garcia, 2016).
A technological trend within this industry is the need for mobile payment. The CEO of Sunny Street Café expressed the importance of quick customer service to their customers. With mobile payments, they reduce transaction costs and are integrated with a customer relationship management system. Bloomberg Technology said, “by 2019, eMarketer estimates that the total value of transactions made by tapping a phone on an in-store terminal will reach $210 billion, up from $8.7 billion in 2015” (Rampton, 2016). It’s critical for companies to stay up to date with the newest technology to increase their potential revenues.
Page | 3
Trends and Outlook
Another key trend in the breakfast industry is the demand for healthy food. With breakfast being the most important meal of the day, to- go boxes are being implemented because customers have realized the necessity of enjoying breakfast, even if it’s at any time of the day. Consumers are now demanding the use of fresh, local, and high quality ingredients. Due to research available through the internet and documentaries, consumers are aware of health issues with eating fast food. Breakfast restaurants in the industry are following this trend by demanding higher quality ingredients from their suppliers (not so much the fat/calorie aspect of it). Appendix A, discusses how many of the top chains in the breakfast industry have adopted this trend and began using local vegetables and cattle as ingredients. The breakfast segment has a bright future because the restaurant traffic for breakfast is forecasted to increase by 8%, according to The NDP Group in Figure C. As a result, there is a need for more restaurants to serve breakfast all day. The forecast below describes the nature in which people are changing their eating habits (Eaters, 2016).
Figure D: Consumers Who Say They Want Breakfast All Day
Figure C
Figure E: Breakfast Box
Source: Marketwatch.com Source: Publiccbd.com.au
Industry OverviewIndustry Overview
Industry Overview
Business Model
Demand Scenarios
Financials ConclusionMarketing Plan
Introduction

Bizzy’s Breakfast Bar decided to operate business in the heart of downtown Des Moines, a promising location where not only is the millennial generation growing and prominent, but also a city that lacks intimidating competition within the breakfast food segment. In Des Moines, Iowa, 27% of the total population is made up of millennials (Simply Map, 2015).
Located at the corner of Walnut Street, the location boasts direct street access from many downtown campuses such as Wells Fargo, Principal Financial Group, and Nationwide Insurance, as well as numerous hotels and residential projects.
Figure F: Location of Restaurant
Source: CBRE Hubbel Commercial
Store Layout
Location
Figure G: Exterior Of Restaurant
Source: CBRE Hubbel Commercial
Source: City Feet Des Moines
Page | 4
Figure H: Store Blueprint
Within the downtown area of Des Moines, daytime population counts to nearly 77,000, while local traffic amounts to over 16,000 in terms of traffic volume per day.
According to NAR, 29% of people who moved to Des Moines from 2010 to 2012 were millennials, which was a higher percentage than many other millennial cities such as Seattle, Austin and Dallas.
The New York Times recognizes that Des Moines isn’t having trouble creating jobs; having an unemployment rate of 3.4% in 2016, being one of the lowest in the country.
Industry Overview
Bizzy’s Breakfast Bar strives to create a conducive, open atmosphere that allows customers to both enjoy company with friends and family, while allowing others to remain focused in a relaxed, accommodating space. Being in the hustle and bustle of a city, time is certainly of the essence, which is why the location and ambiance of our restaurant is of the utmost importance. Bizzy’s Breakfast Bar operates as an assembly–line style ordering system, where customers have the option of choosing from a variety of menu items, customizing it to their liking, and receiving their food within minutes. We place vital importance on placing the customer as our number one priority, which is what will leave the customer feeling welcome and at home, always wanting to return to Bizzy’s Breakfast Bar.
Additionally, Bizzy’s Breakfast Bar will have electrical outlets strategically placed throughout the restaurant in order to cater to the many young professionals in the area who use mobile devices. These young professionals will be able to utilize the open, relaxed environment as a workplace. Located in Appendix F, the interior design and desired store feel is provided, which contains booth-style seating and modern, interior structures, allowing natural sunlight to stream through the abundance of windows.
Industry Overview
Industry Overview
Business Model
Demand Scenarios
Financials ConclusionMarketing Plan
Introduction

Competitor Strategies
Industry Overview
There are several restaurants within 12-miles that Bizzy’s Breakfast Bar will be competing with such as IHOP, Denny’s, Panera Bread, Bruegger’s Bagels, Waveland Café and PerKup Café. IHOP, Denny’s, Panera Bread, and Bruegger’s Bagels are all established chains that are well known with their consumers. Waveland Café and PerKup Café are small, one location restaurants, only known to the Des Moines area. IHOP, Denny’s, Waveland Café, and PerKup Café all fall within the family dining segment. Panera Bread is seeking those who are looking for healthier options and Bruegger’s Bagels is popular with Millennial’s and their families.
For a new fast-casual restaurant such has Bizzy’s Breakfast Bar to enter the downtown Des Moines market, restaurants such as Denny’s, IHOP and Panera Bread are not expected to view this restaurant as much of a threat. Figure I shows the market share of three competitors. When a market share is consistently increasing, they show a competitive advantage because this means the company is growing it’s revenues faster than it’s competitors. The higher the market share, the bigger advantage because it will increase profitability (Investopedia, 2014). Panera has the highest market share, due to the national brand recognitions. Then follows IHOP and lastly comes Denny’s. Small restaurants such as Waveland Café and PerKup Café, which very low market shares and similar location to Bizzy’s, would see a new breakfast restaurant opening as a threat due to the similar all day breakfast menu offerings.
IHOP has been working with their suppliers to become 100% gestation crate-free pork and they are hoping to reach this goal by 2020. They are also focusing on international growth and have recently opened 18 units in places such as Singapore, Guam and Indonesia (Mintel, 2015). International growth helps set IHOP apart from other competitors. It is important for revenues to be expanded globally.
Denny’s is also expanded globally, they have been expanding overseas and hope to open 30 diners within the next 10 years in the Middle East (Mintel, 2015). Denny’s has started opening non-traditional stores, “featuring state-of-the-art kitchen equipment along with a full-service, craft cocktail bar, which offers beer, wine and a variety of contemporary cocktails” (Mintel, 2015). They are also implementing building materials that are sound proof to not disturb their neighbors (Mintel, 2015). Denny’s has also started a new restaurant called “The Den” which is targeted towards college students and their franchisors are very interested in expanding this concept.
Panera Bread states they have an obligation to give back to the communities in which they operate in. They are partnered with Feeding America to help fight hunger and have provided healthy food and funds which has provided approximately 17 million free meals (Mintel, 2015). Bruegger’s Bagels has been working to introduce new menu items and new designs to stay relevant to Millennial guests. Millennial’s parents have been loyal customers to the brand and they hope to keep the children who grew up eating at Bruegger’s Bagels by staying current with their wants. (Bruegger’s Bagels, 2016). PerKup Café wants to provide home cooked meals that you would get at Grandma’s house. (PerKup Café, 2016). Waveland Café states they are a family friendly diner with a “Cheers” feel. (Stone, 2016).
Overview
Competitors
Figure J shows the distance between all the competitors to Bizzy’s . The direct companies to Bizzy’s Breakfast Bar would be Bruegger’s Bagels, Panera Bread, and PerKup Café. They may view Bizzy’s Breakfast Bar as more of a threat, as not only are they located on the same street, but they are also targeting the same market. Bizzy’s is a small start up company that will not be expected to become a direct competitor to Waveland Café or IHOP. Companies such has Panera and IHOP would be more of an indirect competitor because although these companies serve breakfast all day, they are part of the casual dining experience.
Figure I
IHOP D enny's Panera Bread
6%5%
9%
Market Shares 2015
Page | 5
Source: Google Maps, 2016
Source: Passport,2015
Map Layout
Figure J
Waveland Café
Bruegger’s Bagels/ Panera Bread
PerKup Café
Denny’s
IHOP
Bizzy’s
Map Layout
Industry OverviewIndustry Overview
Industry Overview
Business Model
Demand Scenarios
Financials ConclusionMarketing Plan
Introduction

Business Concept
OverviewFoodies across the nation would agree coming together for a meal is not just about eating, it’s about sharing, creating memories and engaging with their food (Hynum,2016). Millennials make up 50% of foodies, while all other generations make up the rest (Hynum, 2016). There are many Mexican restaurants, Italian restaurants and burger restaurants, but not so many all day breakfast restaurants. This is a real problem because according to The National Restaurant Association’s 2015 Restaurant Industry Forecast, it showed that “70 percent of consumers wanted restaurants to serve breakfast throughout the day” (Carolan, 2015).
Bizzy’s Breakfast Bar was created to satisfy the many consumers who want an all day breakfast. Bizzy’s is taking their business to another level by making the meals they create specifically to one’s unique style with an assembly line of delicious breakfast items. Among this assembly line, the consumer can order a breakfast bowl, burrito, sandwich, or visit the omelet station. The ingredients are all fresh and locally sourced. Bizzy’s wants to create an environment for busy young professionals, whether they are a student or working.
SatisfactionIn order to ensure success of the company, the most important aspect are the customers. Customer satisfaction is not only relying on the behavior of the employees, but also price, quality of food, and atmosphere (Admin, 2016). All these factors determine how many loyal customers the company will have in the future. Bizzy’s will create a work friendly environment with high quality food to ensure they are meeting the needs of customers. As a result, the rate of loyal customers will increase, with the potential of new customers.
Loyal customers are important to the growth of the business for many reasons. Cleanfax mentions “Getting customers to repeat is as important for growing your business as advertising, referrals and networking”. Since Bizzy’s Breakfast Bar is a new company, giving their best service out in the beginning is an important concept for their future growth. Ross Beard states, “customer satisfaction is important because it provides marketers and business owners with a metric that they can use to manage and improve their businesses”. When Bizzy’s understands where the company stands with their customers, it will be easier for them to acknowledge their strengths and weaknesses. If customers are unhappy, 13% tell over 20 people that their experience was bad (Beard, 2014). If the population of 18-34 year olds in Des Moines, Iowa is 59,798, according to Simply Map, and 13% is 7,773, and of those 7,800 people they each tell 20 people they are unsatisfied with Bizzy’s Breakfast Bar, that is almost 160,000 people receiving the negative feedback of the restaurant. The two maps below show the effect of the 13% of unhappy customers.
The 27% of the Iowa population, ages 18-34 years old
The 78% of the Iowa population that has a negative outlook of the company based on the 13% dissatisfied customers
Des Moines, IA Des Moines, IA
Figure L Source: SimplyMapFigure K
Page | 6
Industry Overview
Industry Overview
Business Model
Demand Scenarios
Financials ConclusionMarketing Plan
Introduction

Our mission is simple, we create a conducive atmosphere for customers who are passionate about seeking memories from home-style food while we care to ensure the balance between our environment and creating unique taste for everyone.
Who is Bizzy’s Breakfast Bar?
InclusionBizzy’s prides themselves in bringing friends, families, peers, and co-workers together in a creative, working, and laid-back environment.
InnovationBizzy’s is always looking for a better way to keep up to date with the latest trends and technology. Bizzy’s has the latest technology and being new to the industry, building from the ground up, the company has a major advantage.
IntegrityBizzy’s holds each employee accountable for being honest and doing the right thing. Bizzy’s serves the customers, the way the employees would want to be treated.
Target Market
The target market for Bizzy’s Breakfast Bar considers the following demographics: age, type of employment (including students), income, and location. Bizzy’s is targeting the age range of 18-34, in Des Moines, Iowa. The location was chosen according to realtor.com saying, 59% of ages 21-35 using mortgages, were located in the #1 spot of Des Moines, Iowa in the beginning half of 2015. The need for this age range, in this location is major because “the job market is growing so rapidly that the risk of absolute unemployment is very low” (New York Times, 2016). Ages 18-34 are the ones who are coming right out of school to find a job. When Des Moines has a 3.4% unemployment rate (New York Times, 2016), that is very appealing. Bizzy’s is a fast-casual restaurant, bringing in customers who want a fast, high quality meal, at a lower price. A typical fast-casual meal costs around $7.40, according to the NPD Group (Forbes, 2014). The affordable pricing is what appeals to the millennial generation. The average income of 18-34 year olds in Iowa is from $23,000-$35,000 based on the youngest millennials being in college and potentially working part time, to the higher ranged millennials who are working full time (Kiersz & Elkins, 2015). The future outlook for restaurants are high.
Typically, when one starts a family, they begin grocery shopping and cooking at home. In April, The U.S. Department of Commerce reported that “Americans spent $52.3 billion at restaurants and bars in March, and $49.7 billion in grocery stores. It is the first time grocery spending has lagged behind fast food sales since the government started tracking statistics nearly 25 years ago” (Halzack, 2014). This may be because this age range will have formed a habit of going out to eat, rather than cooking at home. A habit can take an average of 66 days (Clear, 2014). If the youngest millennial is 18, the average millennial is spending $174 on dining-out (Shah, 2015), that is spending around $44 weekly, and an average fast-casual meal is $8. This age range is eating out around 5 times a week. Continuing these eating habits for 16 more years, will only increase eating out and decrease eating at home. Clear, in The Washington Post says “first, they (millennials) grew up and came of age at a time where it was completely normal for mothers to work outside the home, and they were raised eating a lot of restaurant meals and takeout. So, for them the habit has continued as they've moved out of their parents' homes”. Grocery stores may be in trouble.
Business Concept
Value Proposition
Source: Forbes Magazine
Figure M: Population of Millennials from 2014-2020
Industry Overview
Industry Overview
Business Model
Demand Scenarios
Financials ConclusionMarketing Plan
Introduction
Page | 7

All Day BreakfastAll day breakfast is an advantage that is not being utilized by a majority of the restaurant industry. IHOP and McDonald’s are a couple of competitors that are currently utilizing all day breakfast. There is a massive demand to have breakfast all day and these two restaurants are proof of this concept. La Monica found that McDonald’s saw a 5.7% growth in same store sales following their implementation of all day breakfast. In figure N and O, IHOP see’s most of it sales around 11:00 AM and after 6 PM, while Starbucks has a steady day, sparking in the morning and night. These times are both outside of what would be considered normal breakfast hours. Bizzy’s advantage of having breakfast all day significantly reduces the number of competitors it has during non-breakfast hours. Bizzy’s concept is combining restaurants like IHOP with coffee shops like Starbucks, to create a unique atmosphere. Having this all day menu will allow Bizzy’s to have a competitive advantage over competitors like Sunny Street Café or PerKup Café that close around 2 PM.
A Healthy PhilanthropyThe definition of healthy is changing. Figure P shows more consumers are focusing on the freshness of ingredients rather than total calorie or fat count (Business Insider, 2014). Bizzy’s has the competitive advantage of having quality ingredients. Bizzy’s is setting themselves apart by having all local ingredients, from organic coffee to fresh food cut and made daily. Made to order omelets are an option Bizzy’s has to offer, something a restaurant does not see everyday. McDonald’s, one of the biggest competitors in the fast all day breakfast category, does not have the reputation of having fresh and less processed ingredients, while Bizzy’s will.
Figure PSource: Business Insider
SpeedFast-casual restaurants have an advantage over full service and QSR restaurants because they use quality ingredients while also having the speedy service that consumers want. Bizzy’s sets itself apart from traditional all day breakfast competitors by having the quality of a sit down café, but also having the speed of a fast-casual restaurant. QSR Magazine found that the global fast-casual sales growth in 2015 was 10.4% while the entire consumer foodservice growth was at just 5.7% (QSR Magazine, 2016). This shows the competitive advantage that the fast-casual segment has over the rest of the industry.
Source: Google
Figure N: IHOP Sales by Hour Figure O: Starbucks Sales by Hour
A restaurant knows their products are fresh when the customer can see the food being prepared right in front of their eyes (Aaker, 2016). Bizzy’s plans to reach out to local suppliers for fresh vegetables weekly and give back by partnering with Alliance for A Healthier Generation. This non-profit organization is meant to empower children to eat healthy and transform the environment (Alliance for A Healthier Generation, 2016). By giving back to this organization, it will support Bizzy’s healthy philanthropy.
Competitive Advantage
Business Concept
Page | 8
Industry Overview
Industry Overview
Business Model
Demand Scenarios
Financials ConclusionMarketing Plan
Introduction

Technology and Information Systems
Page | 9
Accounting System
Inventory System
Bizzy’s evaluated multiple systems based on the restaurants specific functionality wants and needs. These functions included the following: a mobile compatibility, cloud based software that includes functionality for all of the business functions (with the exception of accounting), and provides reliable customer tracking and in depth analysis tools. It also must be able to integrate with accounting software. It would also be a perk to have a system that can easily expand with the business if Bizzy’s chooses to eventually move to multiple locations. Having one system with all of these functionalities will allow for more effective management of the restaurant and also help to provide superior customer service.
Features Web iOS Android
General
Works Offline
– X X
Cloud Based X X X
Multi-location Ready
X X X
QuickBooksiConnect can easily be integrated with accounting software as well, including QuickBooks. Bizzy’s chose to add QuickBooks as a bolt-on to iConnect because it is the recommended accounting software by iConnect and it also meets all of the invoice, payroll, and bill payment capabilities that Bizzy’s requires. QuickBooks will also help the company save time and be more efficient by utilizing things like instant online payment capabilities. As one of the top rated accounting software's, QuickBooks is a perfect fit for Bizzy’s Breakfast Bar.
iConnectThis system is a perfect fit for Bizzy’s Breakfast Bar as it provides an easy-to-use one stop shop for all of the business management needs. iConnect includes Point of Sale, CRM, and inventory management all in one package. All of the hardware needed to run this system is also included for a one time fee. The cloud-based mobile compatibility allows the user to make updates in store or on-the-go using a smart phone or tablet across multiple platforms. It also has built in CRM that allows the user to track customer interaction along with other sales and employee features. iConnect also includes inventory management functionality that provides the user to easily keep track of inventory received and also reconciliation of orders. On top of these features, iConnect also has the ability to manage employees through scheduling and clock in/out functions. Although there is a long list of features, other key elements include online ordering and dash boarding. For a full list of attributes, visit www.iconnectpos.com/iconnect-features
Figure R: iConnect Systems Comparison
Table 2: Device Comparison
Figure Q: MIS Gear
Industry Overview
Industry Overview
Business Model
Demand Scenarios
Financials ConclusionMarketing Plan
Introduction
Types of Systems
Source: Software Insider, 2016
Management Structure
Page | 10
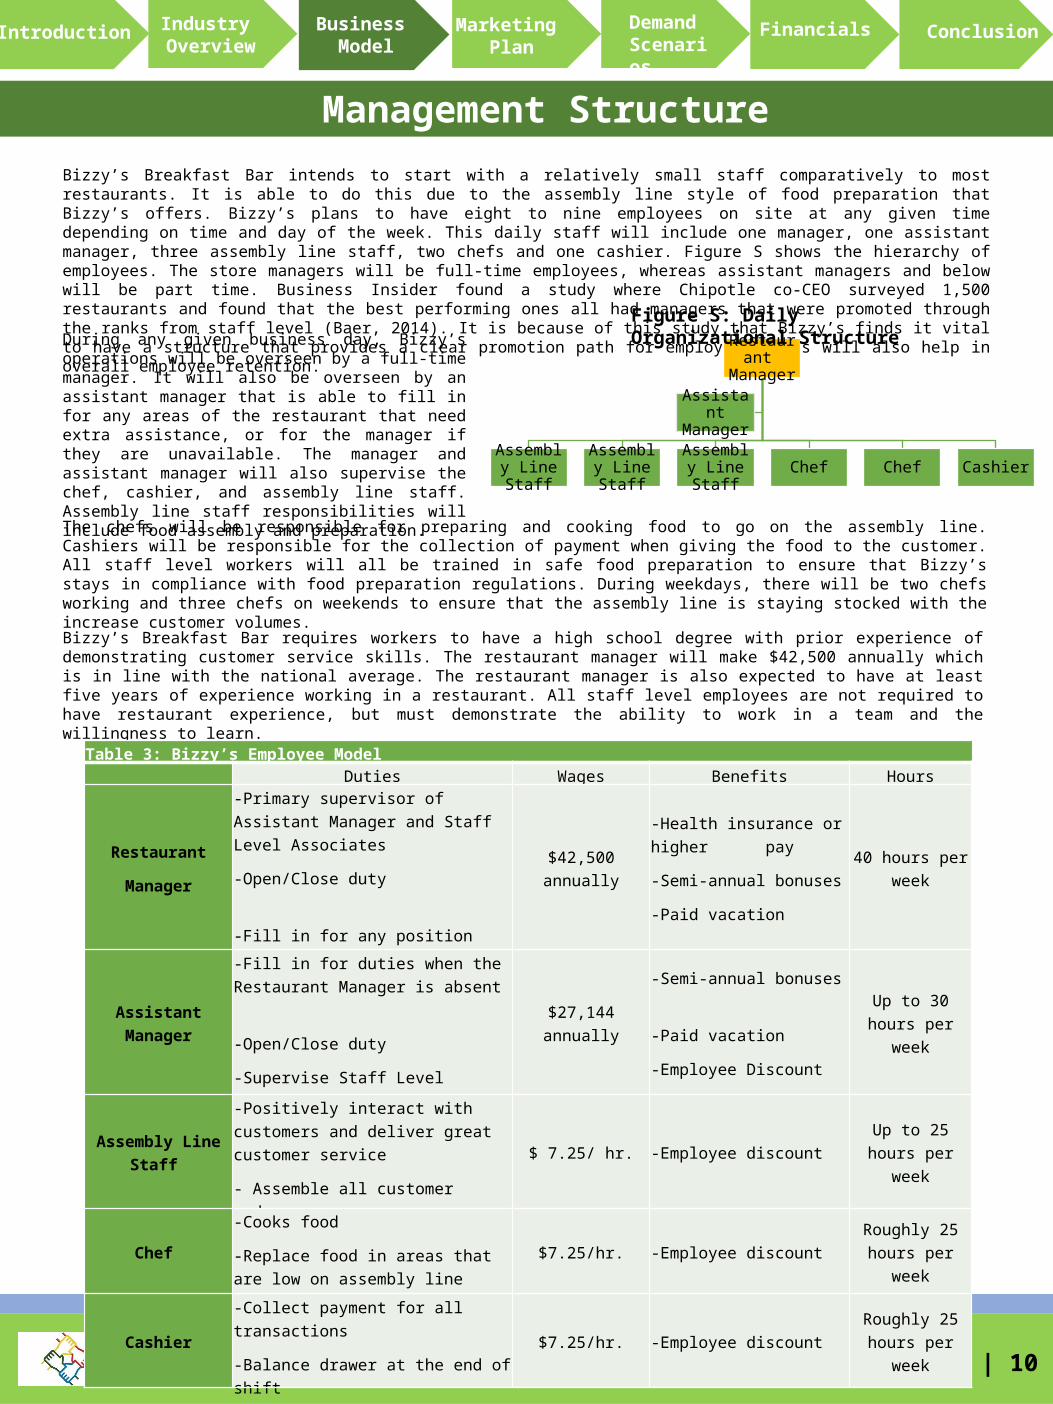
Bizzy’s Breakfast Bar intends to start with a relatively small staff comparatively to most restaurants. It is able to do this due to the assembly line style of food preparation that Bizzy’s offers. Bizzy’s plans to have eight to nine employees on site at any given time depending on time and day of the week. This daily staff will include one manager, one assistant manager, three assembly line staff, two chefs and one cashier. Figure S shows the hierarchy of employees. The store managers will be full-time employees, whereas assistant managers and below will be part time. Business Insider found a study where Chipotle co-CEO surveyed 1,500 restaurants and found that the best performing ones all had managers that were promoted through the ranks from staff level (Baer, 2014). It is because of this study that Bizzy’s finds it vital to have a structure that provides a clear promotion path for employees. This will also help in overall employee retention.
Restaurant Manager
Assembly Line Staff
Assembly Line Staff
Assembly Line Staff Chef Chef Cashier
Assistant Manager
Bizzy’s Breakfast Bar requires workers to have a high school degree with prior experience of demonstrating customer service skills. The restaurant manager will make $42,500 annually which is in line with the national average. The restaurant manager is also expected to have at least five years of experience working in a restaurant. All staff level employees are not required to have restaurant experience, but must demonstrate the ability to work in a team and the willingness to learn.
Table 3: Bizzy’s Employee Model Duties Wages Benefits Hours
Restaurant
Manager
-Primary supervisor of Assistant Manager and Staff Level Associates
-Open/Close duty
-Fill in for any position when needed
$42,500 annually
-Health insurance or higher pay
-Semi-annual bonuses
-Paid vacation
40 hours per week
Assistant Manager
-Fill in for duties when the Restaurant Manager is absent
-Open/Close duty
-Supervise Staff Level Associates
$27,144 annually
-Semi-annual bonuses
-Paid vacation
-Employee Discount
Up to 30 hours per week
Assembly Line Staff
-Positively interact with customers and deliver great customer service
- Assemble all customer orders $ 7.25/ hr. -Employee discount Up to 25 hours per week
Chef
-Cooks food
-Replace food in areas that are low on assembly line
$7.25/hr. -Employee discount Roughly 25 hours per week
Cashier
-Collect payment for all transactions
-Balance drawer at the end of shift $7.25/hr. -Employee discount Roughly 25 hours per week
During any given business day, Bizzy’s operations will be overseen by a full-time manager. It will also be overseen by an assistant manager that is able to fill in for any areas of the restaurant that need extra assistance, or for the manager if they are unavailable. The manager and assistant manager will also supervise the chef, cashier, and assembly line staff. Assembly line staff responsibilities will include food assembly and preparation.
The chefs will be responsible for preparing and cooking food to go on the assembly line. Cashiers will be responsible for the collection of payment when giving the food to the customer. All staff level workers will all be trained in safe food preparation to ensure that Bizzy’s stays in compliance with food preparation regulations. During weekdays, there will be two chefs working and three chefs on weekends to ensure that the assembly line is staying stocked with the increase customer volumes.
Figure S: Daily Organizational Structure
Industry Overview
Industry Overview
Business Model
Demand Scenarios
Financials ConclusionMarketing Plan
Introduction

Page | 11
Industry Overview
Other Business Logistics and Operations
In order for Bizzy’s Breakfast Bar to maintain fresh, locally sourced ingredients, we will be purchasing our perishable goods at the beginning of each week from Loffredo Fresh Produce Co. Upon deciding which supplier to choose, it was necessary to research several suppliers in the areas surrounding Des Moines, Iowa, and rate each one on criteria such as ease of purchase, availability of goods, and arrival time of the goods.
After comparing the criterion, Bizzy’s identified Loffredo Fresh Produce Co. as the main supplier for Bizzy’s Breakfast Bar, as they fit well with the desired requirements. This supplier is located directly in the Des Moines area, assuring that no more than 36 hours are spent in transport, and that the goods are delivered from the grower to our refrigerator within 72 hours. This supplier also offers online ordering, so that purchasing the goods necessary for weekly operations is made simple and efficient. In addition to Loffredo Co., Bizzy’s will be purchasing weekly protein from Butchers Choice butcher shop, ensuring quality meat to our customers each and every day.
Upon receiving fresh inventory, it is essential to monitor the weekly goods we receive, as well as track the process and inventory turn-over. The cloud-based iOS system the company has chosen, iConnect, allows Bizzy’s to accurately monitor our inventory and the required amount of fresh goods to have in the restaurant at all times. In addition to monitoring Bizzy’s inventory, this system also assures that all of our employee’s are being held accountable to a predetermined weekly schedule, and receiving paychecks in a timely, organized manner. These two factors are important performance indicators that Bizzy’s Breakfast Bar is able to take advantage of with this type of integrated information system.
Online ordering
Locally sourced goods
Maximum of 72 hours
delivery time
Figure U: Supplier Benefits
Bizzy’s Breakfast Bar will operate business 360 days out of the year, excluding the following holidays: New Year’s Day, Easter Day, Thanksgiving Day, Christmas Day, and New Year’s Eve. The store’s hours of operation run from six o’clock in the morning to ten o’clock in the evening, Sunday through Saturday. Each day, a manager, chef and employee will arrive one hour before the restaurant opens, in order to properly prep the ingredients and prepare the restaurant for customers’ arrival. In order to carry out our day-to-day operations, we will be hiring 2 managers, 1 assistant manager, 4 chefs, and 12-18 regular employees, with the opportunity of hiring additional staff upon realizing more demand than expected. With that being said, one manager or assistant manager will be present in the restaurant at all times, with the assistant manager working during the peak hours of operation. By utilizing all the talent Bizzy’s recruits in their employees, Bizzy’s Breakfast Bar is fit to deliver excellent customer service and quality, fresh meals each and every day.
In addition to human resource needs, Bizzy’s Breakfast Bar will require various pieces of equipment in order to efficiently and effectively operate business. Within the 2,365 square feet that Bizzy’s will occupy, about one-third, or about 780 feet, will be needed for kitchen space. Also, the kitchen space will be made up of three separate sections, including the grilling and cooking space, the prepping space for vegetables and other perishables, and the assembly line where customers will view the ingredients and place orders. In order for the menu items to be made and produced correctly, Bizzy’s will need several pieces of equipment including, but not limited to, a grill, tabletop fryer, multi-component sink, well steam table, and refrigerator.
Figure T: Floor Plan
Source: Loffredo Fresh Produce Co.
Management Structure
Industry Overview
Industry Overview
Business Model
Demand Scenarios
Financials ConclusionMarketing Plan
Introduction

Page | 12
Industry Overview
Who is Alex?
Bizzy’s Breakfast Bar is strategically placed on the busy corner of Walnut Street. Although the location is superior, competitors such as Bruegger’s Bagels and Panera are in short proximity. Bruegger’s offers quick and affordable meals within the industry, while Panera offers a more reserved and expensive menu option. What these competitors have in common with Bizzy’s is accessibility of breakfast all day. To set Bizzy’s apart from competitors, Bizzy’s offers a one of a kind, customizable, all day breakfast. Bizzy’s Breakfast Bar is looking into beneficial marketing strategies to ensure the success the company desires.
Promotions
Social Media
• Twitter• Instagram• Facebook
Relationships
• Mobile App• Customer
Loyalty Card
Public Relations
• Community Sponsors
• Flyers• Bus
Advertising
Bizzy’s is fully aware of the benefits advertising has on the company. Social media, relationships, and public relations are the three segments of advertising the company will focus on. Having a wide range of techniques is essential for the success of Bizzy’s Breakfast Bar. Within each segment of advertising are various channels. The channels are specific to the company’s needs in order to promote their business. The restaurant allows a 6% usage of gross annual sales for their advertising budget. Since the restaurant is located in a busy downtown area, the majority of customers will be walking to this location. With this target of walkers, Bizzy’s will be able to strategically promote their company.
Social Media
With the many outlets available, Bizzy’s chose to focus on Twitter, Instagram, and Facebook. The company has chosen Twitter and Instagram based on the graphs from Statista stating the age ranges of 18-34 accounting for almost 50% of usage for both Twitter and Instagram. Bizzy’s chose Facebook to expand the reach to additional age groups. It’s important for Bizzy’s Breakfast Bar to create accounts with the username BBBar_2016 on both Instagram and Twitter to establish a presence with interactive users. The most successful account used was Facebook because it was able to provide the most useful information from star ratings, to reviews and comments.
Relationships
Building relationships with customers is a top priority in order to maintain customer loyalty. The company strives to give the best customer satisfaction to all their guests. Two strategies Bizzy’s is using to build rapport with their customers are through mobile apps and customer loyalty cards. Mobile apps are important to the present and future of Bizzy’s Breakfast Bar because so many consumers are using this feature on smart phones. With the POS system, iConnect, customers are able to pay through their mobile phones, decreasing transaction costs. The mobile app produces a customer/company relationship with interactive features, such as jumping to front of the line due to mobile ordering. Appendix K shows what Bizzy’s mobile app looks like. On the other hand, customer loyalty cards are used to build a customer’s profile and decipher between who gets specific promotions. Customer loyalty cards, BOGOs, emails, and incentives are given when the customer reaches the specific goal, which then brings in repeat customers.
Marketing Plan
Alex is an 18-34 year old millennial of either gender who maintains an occupation within the heart of downtown Des Moines, Iowa. During the week days, Alex enjoys a working environment within walking distance of the office to conduct personal or professional meetings. According to Successful Meetings, around 63% of meeting planners find it more productive to work outside the office (Ting, 2013). After a stressful work day, Alex desires the comfort and memories of dinner for breakfast, just like mom use to make. On the weekends, Alex enjoys sleeping in later, but still craves breakfast as the first meal of the day.
Industry Overview
Industry Overview
Business Model
Demand Scenarios
Financials ConclusionMarketing Plan
Introduction

Page | 13
Industry Overview
Promotions
Public Relations
Bizzy’s believes creating publicity for the company is crucial for their success. Since the central target market are walkers downtown, Bizzy’s will distribute both pre-opening and grand opening flyers to local businesses within walking distance. By doing this, Bizzy’s will be able to spark interest of potential customers, ultimately resulting in a successful grand opening.
Bizzy’s Breakfast Bar can reach out to the community in many different ways. Bizzy’s prides themselves in a healthy lifestyle and can promote their business at the same time, such as partnering with The Turkey Trot race. The Turkey Trot race raises money for Above + Beyond Cancer. Bizzy’s will sponsor a special needs baseball team called Kiwanis Miracle League, which “provides a place for children with special needs to enjoy our nation’s past time, Baseball” (Kiwanis Miracle League, 2016).
Pre-Opening Grand Opening
Pricing
Bizzy’s Breakfast Bar menu shows some options that are available to purchase. To keep up with the surrounding direct and indirect competition, Bizzy’s must price their items accordingly. The company will compare the competitors prices in order to stay competitive, yet profitable. Chipotle’s Bowl and Burritos range from $6.50-$7.50. Since Bizzy’s is all locally sourced and offer some organic products, Bizzy’s will have a higher ticket price of $9.50, on average. In the end, the benefit is a higher quality breakfast with all the same great tastes.
Figure W shows the menu options with their products listed. Bizzy’s meals are freshly made right in front of the customers eyes which is another factor of increased prices (Blank, 2013). Bizzy’s earns credibility of the company name by ensuring customers fresh, quality, ingredients.
Marketing Plan
Figure V: Public Advertising
Figure W: Bizzy’s Breakfast Bar Menu
Turkey Trot
Industry Overview
Industry Overview
Business Model
Demand Scenarios
Financials ConclusionMarketing Plan
Introduction

Industry Overview
Page | 14
Industry Overview
Products
Bowl45%
Burrito30%
Bagel10%
Omelet15%
Bizzy's Breakfast Bar Product Mix
Bowl Burrito Bagel Omelette
Bizzy’s Breakfast Bar is supplied by a local company called Loffredo Fresh Produce. To explain who Loffredo is, they say it best themselves, “Loffredo is the Midwest's leader in specialty produce supply chain management utilizing the buying power of our affiliation with PRO*ACT, which includes 45 produce distributors and over 60 distribution centers across the country to service multi unit operators” (2016). Bizzy’s chose this company because they state “If we don’t have what you need, we can create it in our in-house processing department”. This is a big advantage to Bizzy’s Breakfast Bar because if Bizzy’s wants to try unique items, Loffredo Fresh Produce will be sure to get it. Loffredo has a delivery system that will be transported by truck in under 72 hours or by mail in 24 hours (Loffredo Fresh Produce, 2016).
Figure W shows Bizzy’s Breakfast Bar’s products the customers can choose from. Since Bizzy’s is so diverse, the customer can choose from many options and create their own unique bowl, burrito, omelet, or bagel. Figure Y shows the product mix of percentages of products purchased from customers. Bowls take the lead with 45% of sales, while burritos follow. Lagging behind are the omelets and bagels.
Figure Y : Product Percentage Mix
Breakfast bowls make up most of the products sold at Bizzy’s Breakfast Bar. The bowls make up 45% of sales. It is a bowl filled with ingredients Bizzy’s offers. These ingredients come from Loffredo’s. It can be taken on the go or eaten inside the restaurant. Bizzy’s feels that customers being able to customize products to their liking is important to the restaurants vision.
Breakfast burritos make up a large portion of sales with 30%. Burritos carry everything a bowl does plus the tortilla shell. The burritos are easy to take on the go if the customer is in a rush. Incorporating the shell into the customers meal will satisfy their hunger longer. According to a study from Wolfson Medical Center and Hebrew University of Journalism “Women who eat their largest daily meal at breakfast are far more likely to lose weight and waist line circumference” (2013). Adding the shell will increase these chances.
Bizzy’s Breakfast Bar offers omelets to the customer that wants something different. Omelets account for 15% of sales at Bizzy’s. The low numbers could possibly come from the wait time it takes for the customer to receive the omelet. Many people are rushing in the morning and a bowl or burrito is more convenient for the consumers.
The lowest sales for Bizzy’s Breakfast bar are the bagels, accounting for 10%. Since Bizzy’s is a newer restaurant, many consumers are choosing the items they can not normally receive at other places. Breakfast bagels can be found in many different restaurants and this may be why the sales are the lowest out of the four.
Marketing Plan
Figure X: Product Mix
Industry Overview
Industry Overview
Business Model
Demand Scenarios
Financials ConclusionMarketing Plan
Introduction
Page | 15
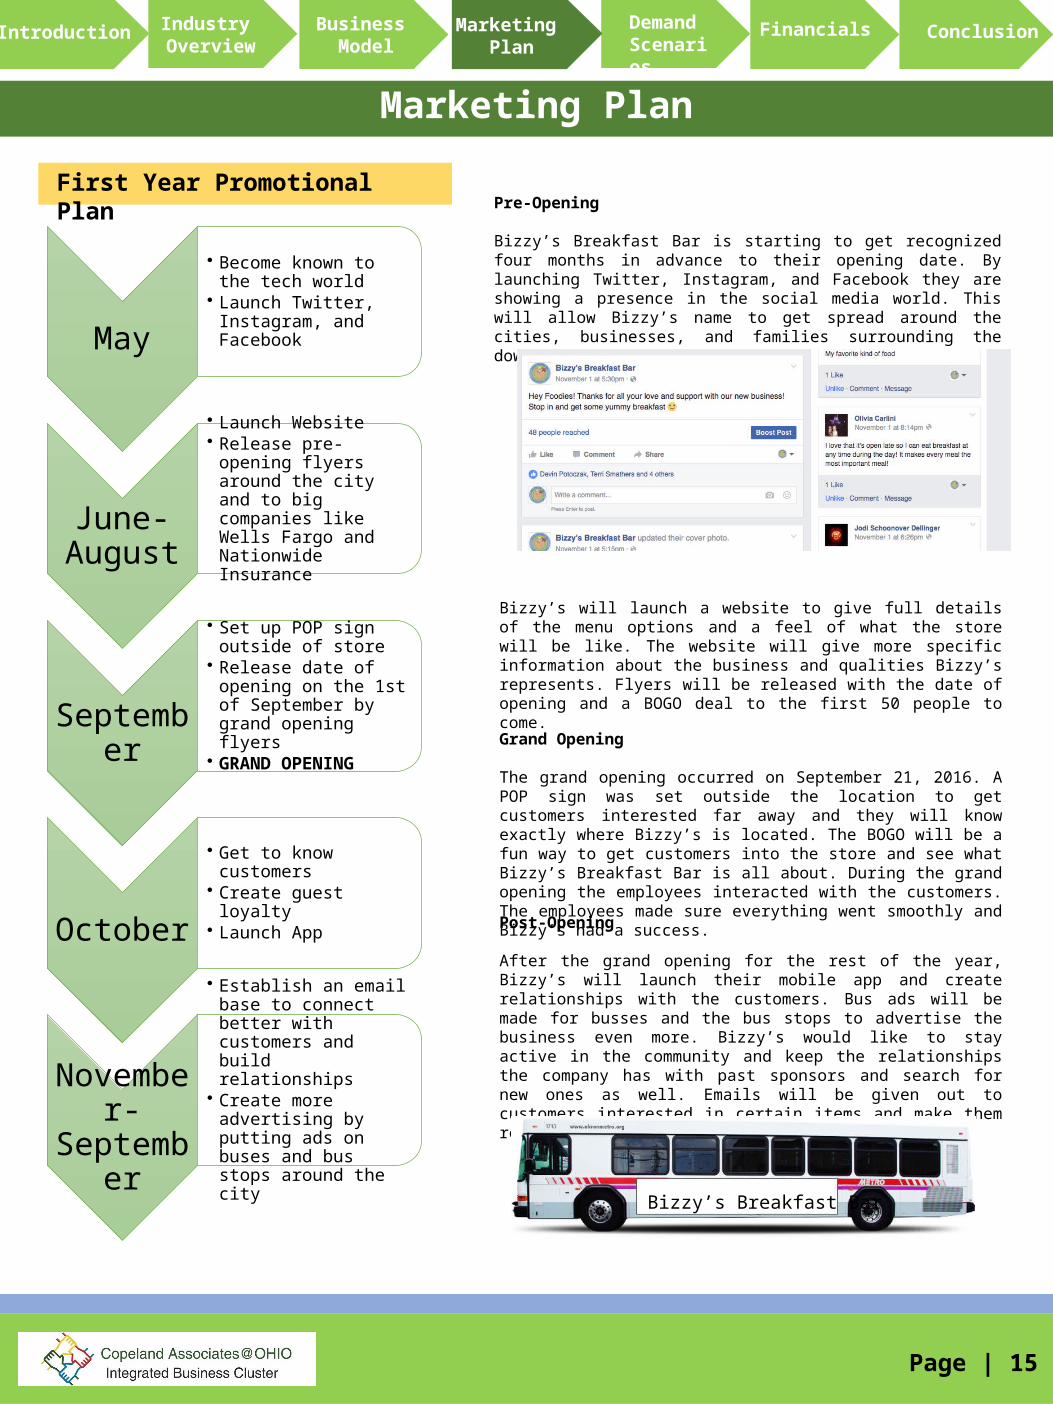
May
• Become known to the tech world
• Launch Twitter, Instagram, and Facebook
June-August
• Launch Website• Release pre-opening flyers
around the city and to big companies like Wells Fargo and Nationwide Insurance
September
• Set up POP sign outside of store
• Release date of opening on the 1st of September by grand opening flyers
• GRAND OPENING
October
• Get to know customers • Create guest loyalty• Launch App
November-September
• Establish an email base to connect better with customers and build relationships
• Create more advertising by putting ads on buses and bus stops around the city
Pre-Opening
Bizzy’s Breakfast Bar is starting to get recognized four months in advance to their opening date. By launching Twitter, Instagram, and Facebook they are showing a presence in the social media world. This will allow Bizzy’s name to get spread around the cities, businesses, and families surrounding the downtown area. Below shows the Facebook page.
Grand Opening
The grand opening occurred on September 21, 2016. A POP sign was set outside the location to get customers interested far away and they will know exactly where Bizzy’s is located. The BOGO will be a fun way to get customers into the store and see what Bizzy’s Breakfast Bar is all about. During the grand opening the employees interacted with the customers. The employees made sure everything went smoothly and Bizzy’s had a success.
Post-Opening
After the grand opening for the rest of the year, Bizzy’s will launch their mobile app and create relationships with the customers. Bus ads will be made for busses and the bus stops to advertise the business even more. Bizzy’s would like to stay active in the community and keep the relationships the company has with past sponsors and search for new ones as well. Emails will be given out to customers interested in certain items and make them repeat customers.
Bizzy’s will launch a website to give full details of the menu options and a feel of what the store will be like. The website will give more specific information about the business and qualities Bizzy’s represents. Flyers will be released with the date of opening and a BOGO deal to the first 50 people to come.
Marketing Plan
First Year Promotional Plan
Industry Overview
Industry Overview
Business Model
Demand Scenarios
Financials ConclusionMarketing Plan
Introduction
Bizzy’s Breakfast Bar

Industry Overview
Demand Forecast: Comparable Concepts (Weight: 70%)In order to forecast the demand of Bizzy’s Breakfast Bar, it was necessary to identify comparable concepts that could be used as benchmarking devices which assist in the demand estimation. As opposed to choosing additional markets to compare our company against, we were able to identify restaurants relatively similar to our concept within the Des Moines area, making our calculations and estimations significantly more accurate and relatable. We’ve decided to utilize data from IHOP, Bruegger’s Bagels, and Waveland Café, as each of the concepts represent an aspect making up our fast-casual breakfast bar. In addition to using their data, each of the restaurants were weighted based on similarity of concept in comparison with Bizzy’s. IHOP was given a weight of 10%, while Waveland Café was given a weight of 20%. Each of these concepts represent more of a casual dining experience, while offering additional lunch and dinner items, which is why they both received a rather low weighting. Bruegger’s Bagels, on the other hand, represents the similar fast-casual breakfast experience, which is why the restaurant received a higher weight of 70%.
After collecting data from these restaurants as well as weighing each one in comparison with Bizzy’s, the average amount of customers per day were calculated. Next, Bizzy’s determined an average ticket value of $9.50, such that this amount allows for the offering of locally sourced, organic products. With this information, estimated annual sales of Bizzy’s Breakfast Bar were determined, being about $1,101,240. Overall, Bizzy’s Breakfast Bar recognizes this as an accurate estimation, as the companies used as benchmarks are not only combined aspects that make up the company’s concept, but also consist of relatively different market shares within the industry. With an overall weight of 70% for this demand scenario, Bizzy’s believes the below estimations are accurate predictions that represent the average sales Bizzy’s Breakfast Bar is likely to experience within several years of operation.
Page | 16
Industry Overview
Business Model
Marketing Plan
Demand Scenario 2 Financials ConclusionDemand
Scenario 1
Table 5: Comparable Concepts
Bizzy's Breakfast Bar, Des Moines,
IA
IHOP, Des Moines, IA
(Weight 10%)
Bruegger's Bagels, Des Moines, IA(Weight 70%)
Waveland Café, Des Moines, IA(Weight 20%)
Population 217,775 217,775 217,775 217,775
Median Household Income 44,862 44,862 44,862 44,862
Enrolled in College 6,560 6,560 6,560 6,560
Unemployment 4,375 4,375 4,375 4,375
Customers Per Day 322 470 300 325
Customers Per Week 2,254 3,290 2,100 2,275
Customers Per Year 115,920 171,550 109,500 118,625
Average Ticket Price $9.50 $11.50 $5.50 $11.50
Annual Sales $1,101,240.00 $1,972,825.00 $602,250.00 $1,364,187.50

Demand Forecast: Demographic Markets (Weight 30%)
Page | 17
Industry Overview
Table 5: Calculating Conversion Rate for Panera Bread
Customers Per Day 200Surrounding Population (1 Mile) 17,304
Conversion Rate 1.1558%
Table 7: Bizzy's Breakfast Bar Projected Sales Sales Per Day $2,588
Sales Per Week $18,116 Sales Per Month $77,640
Annual Sales
$931,680
Table 6: Bizzy's Breakfast Bar Projected Customers Surrounding Population(1 Mile) 19,530Conversion Rate 1.1558%Customers Per Day 225Customers Per Week 1,575Customers Per Month 6,750Annual Customers 81,000
Industry Overview
Industry Overview
Business Model
Demand Scenarios
Financials ConclusionMarketing Plan
Introduction
• In order to find the expected traffic for Bizzy’s Breakfast Bar, the company analyzed the conversion rates of similar competitors within the area of downtown Des Moines. Since Panera Bread is close in proximity to Bizzy’s and has a similar concept, it was best to use their conversion rate to estimate one for Bizzy’s Breakfast Bar. After getting the conversion rate of 1.1558%, Bizzy’s was able to calculate their projected customers.
Step 1
• Using the estimated conversion rate of 1.1558% and finding the 1 mile surrounding population of Bizzy’s location to be 19,530 (Free Map Tools, 2016), the calculation of customers per day was able to be projected. Bizzy’s Breakfast Bar is predicting 225 customers per day, or 81,000 customers per year.
Step 2
• Through research, the average ticket price for a fast-casual restaurant is said to be about $11.50 (Forbes Magazine, 2014). Calculating the sales per day was based on this data point and the above projected customers per day. After projecting the estimated $2,588 sales per day, the annual sales of Bizzy’s Breakfast Bar would be about $931,680.
Step 3

Financial Statements
Page | 18
Industry Overview
Balance SheetThe graph below shows the gradual but positive increase in assets over a 5 year period. In the balance sheet, which states a summary of the Bizzy’s financial situation for investors like Copeland Associates. To best estimate the cash balance for each year, Bizzy’s benchmarked from comparable restaurants such as Chipotle and Panera Bread. It was determined for the information to be relevant to a new business, the information used for Chipotle was from their first years in business 2005-2009. Panera Bread information was used for the same time frame to take any economic factors into account. Bizzy’s then used this information to determine the amount of cash needed to successfully pay the bills for each quarter. For more information on that, please look in Appendix S. There is information about some important financial ratios Bizzy’s calculated to use in order to continue the smooth operation of the restaurant and meet its main goal to Our mission is simple, we create a conducive atmosphere for customers who are passionate about seeking memories from home-style food while we care to ensure the balance between our environment and creating unique taste for everyone.
Income Statement
Sales for the first year at Bizzy’s Breakfast Bar is estimated to be about $1,101,240.00. This was calculated by using Bizzy’s first demand scenario that is deemed to be the most accurate forecast hence it was weighed 70%. Sales are expected to remain constant in year 1 and year 2 for Bizzy’s because it projected the first couple of years might be rough after opening. However, it is anticipated that sales would increase between 1-3.5% from the beginning of year 3. We are predicting this due to our intense operational and marketing strategy that will be implemented in the years to come after Bizzy’s grand opening. The other reason for this is to match the overall GDP growth in the US. Cost of sales, direct store expenses, G&A expenses, and pre-opening expenses were determined by benchmarking from restaurants with similar size, concept and flow of traffic to estimate Bizzy’s numbers.
Capital Budgeting
The initial investment for Bizzy’s Breakfast Bar is $300,000. $210,000 will be from Copeland Associates, Bizzy’s investors, and the rest $90,000 will be borrowed from the bank with an interest rate of 8% compounded quarterly for a 7 year period. Based on our primary and secondary data Bizzy’s projects Net Present Value to be $352,832.01 with a 30% cost of capital in equity for investors. If Bizzy’s was to sell the restaurant, it would be sold at $836,640.03 which is equal to the fifth year project cash flow in Appendix T. With an internal rate of return at 50.06%, Bizzy’s financials may not be perfect but it is leading a positive trend. IRR being greater than the 30% borrowed from the bank proves that Bizzy’s is a good investment for investors such as Copeland Associates to invest their money. In addition, according to the numbers from Bizzy’s cash flows, payback period is estimated to be 2.33 years. That means it will take the restaurant 2.33 years to recover the initial cost of $300,000. In general, this project is feasible therefore, investors will accept Bizzy’s investment.
Figure Z: Yearly Net Income
Industry Overview
Industry Overview
Business Model
Demand Scenarios
Financials ConclusionMarketing Plan
Introduction
Year 1 Year 2 Year 3 Year 4 Year 5
$(80,000.00)
$(60,000.00)
$(40,000.00)
$(20,000.00)
$-
$20,000.00
$40,000.00
$60,000.00
$80,000.00
$(63,195)
$53,277$57,452
$59,610
$63,336
Net Income
Although net income increases after the 2nd year of operations, it is very important to point out on the graph above the quick recovery from a net loss of about more than ($60,000) in the first year to a more than $53,000 in its second year. The graph above depicts that Bizzy’s is cautiously optimistic about a continuous increase in net income after a huge loss in its first year of operation. For more information about the income statement, refer to Appendix R for more details.
Years Cash Flows
Year 0 (290,000.00)
Year 1 (36,383.41)
Year 2 178,198.13
Year 3 229,219.64
Year 4 290,471.23
Year 5 836,640.03
Table 8 : Yearly Cash Flows

Conclusion
Page | 19
In conclusion, this report addresses the feasibility of Bizzy’s Breakfast Bar concept being successful in the breakfast food segment of the restaurant industry. After analyzing the restaurant industry as a whole, it was determined that there are growing trends toward breakfast food and food quality. As the first to create the assembly line, fast-casual breakfast concept, Bizzy’s has a great opportunity to quickly gain market share due to the first mover advantage. More specifically, this breakfast concept is predicted to see success in the area of downtown Des Moines, Iowa, as there are a significant amount of millennials looking for a quality, fast meal that caters to all tastes, as well as a lacking of intimidating breakfast food competition in the area. Both of these components add to the success that Bizzy’s is expecting to see, which ultimately allows for the growth and development of Bizzy’s Breakfast Bar in the future.
Moreover, Bizzy’s Breakfast Bar meets the needs of a quick meal for the busy professional, while also creating an atmosphere of inclusion, innovation, and integrity, that is perfect for a business meeting or a sit down meal with friends. Bizzy’s has many different factors that attribute to why it will see success, however three main factors play the biggest roles in its unique positioning in the market. These three factors include speed, quality, and all day breakfast. Due to the lack of quality ingredients in the all day breakfast segment of the industry, Bizzy’s Breakfast Bar provides fresh, locally sourced ingredients that sets them apart from their competition. By utilizing the cloud-based integrated technology system Bizzy’s has chosen, they will be able to accurately track, manage, and innovate their customer service and relationship management, as well as inventory, online ordering, and much more.
After analyzing the competitive landscape of the market through two different demand scenarios, there is evidence showing that there is a strong demand for this concept. By establishing specific marketing strategies that involve promotions before, after, and during the grand opening, Bizzy’s is expecting to gain customer awareness, as well as develop excellent customer retention. The use of iConnect technology assists in the accountability aspect of the business vision, as each and every employee will be held to a high standard of excellence. Additionally, the Zero software ensures that paying the employees occurs on-time and in an efficient manner, resulting in employee satisfaction.
Finally, after calculating various financial assumptions, Bizzy’s Breakfast Bar is expected to see an increase in Net Income after establishing a firm basis in year three, as well as a positive Net Present Value (NPV), ultimately showcasing the success Bizzy’s Breakfast Bar is foreseeing.
Industry Overview
Table 9: Demand Scenario
Annual Customers Annual Sales Weight
Comparable Concepts 115,920 $1,101,240.00 70%
Demographic Preferences
81,000 $931,680 30%
Industry Overview
Industry Overview
Business Model
Demand Scenarios
Financials ConclusionMarketing Plan
Introduction

Page | 20
Reference Page
Baer, D. (2016, April). A Brilliant Management Insight Helps Chipotle Retain Its Best Employees. Retrieved November 3, 2016 from http://www.businessinsider.com/chipotle-internal-promotion-program-2014-4
Best Buy: Expert Service. Unbeatable Price. (2016). Retrieved November 05, 2016, from http://www.bestbuy.com/
Blank, C. (2013). High Prices? No Problem. Retrieved November 15, 2016, from https://www.qsrmagazine.com/exclusives/high-prices-no-problem
Booth, B. & Morris, C. (2016, August). How millennials are building the next iconic pizza chain. Retrieved from: http://www.cnbc.com
Bragg, S. (2016). What is the proper classification of fixed assets? - Questions & Answers - AccountingTools. Retrieved November 03, 2016, from http://www.accountingtools.com/questions-and-answers/what-is-the-proper-classification-of-fixed-assets.html
Breakfast Boxes. (n.d.). Retrieved October 26, 2016, from http://publiccbd.com.au/product-category/breakfast/breakfast-boxes/
Chamlee, V. (2016, May). Americans Are Increasingly Obsessed With Breakfast. Retrieved October 26, 2016, from http://www.eater.com/2016/5/17/11691604/us-breakfast-consumption-rise
Chassy, B., & Entine, J. (2015, December). The Real Cost Of Mandatory GMO Labeling. Retrieved August 29, 2016 from http://www.huffingtonpost.com/jon-entine/the-real-cost-of-mandator_b_8865742.html
Chipotle, Annual Reports. (2005-2016). Retrieved November 11, 2016, from http://media.corporate-ir.net/media_files/irol/19/194775/AnnualReports.pdf
Commercial Restaurant Supplies & Equipment from WebstaurantStore. (2003-2016). Retrieved November 05, 2016, from http://www.webstaurantstore.com/
Dhar, T., & Baylis, K. (2011, October). Fast-Food Consumption and the Ban on advertising Targeting Children: The Quebec Experience. Retrieved August 24, 2016 from
Business Source Complete Facts at a Glance. (2016, January). Retrieved October 26, 2016, from
http://www.restaurant.org/News-Research/Research/Facts-at-a-Glance
Fall 2013 NHCS Adult Study 12-month. (2013). Retrieved October 13, 2016, from https://oneview-simmonsresearch-com.proxy.library.ohiou.edu/main/#.
Federal Tax Information. (2016). Retrieved November 04, 2016, from http://www.payroll-taxes.com/federal-tax

Page | 21
Financial Reports. (2016). Retrieved November 11, 2016, from https://www.panerabread.com/en-us/company/financial-reports.html
Free Map Tools. (2016). Retrieved November 1, 2016 from https://www.freemaptools.com/find-population.htm
Garcia, T. (2016, January 25). Does all-day breakfast mean long-term growth for McDonald's? Retrieved October 26, 2016, from http://www.marketwatch.com/story/does-all-day-breakfast-mean-long-term-growth-for-mcdonalds-2016-01-13
Giandelone, E. (2011, February). Breakfast Restaurant Trends. Retrieved October 26, 2016, from http://www.mintel.com
Graphic IQ. (2016). Software Insider. Retrieved From http://point-of-sale.softwareinsider.com/compare/374-410-769/Square-Register-vs-iConnect-POS-vs-ShopKeep
Group, T. N. (2010, June). Breakfast Accounts for Nearly 60% of U.S. Restaurant Industry Traffic Growth Over the Past Five Years, and Continues to Be Bright Spot. Retrieved October 26, 2016, from https://www.npd.com/wps/portal/npd/us/news/press-releases/pr_100621/
How the Fast-Casual Segment is Gaining Market Share in the Restaurant Industry. (2014, June 23). Retrieved November 11, 2016, from http://www.forbes.com/sites/greatspeculations/2016/11/11/nvidias-stock-soars-on-strong-third-quarter-results/#543694d12965
Hynum, R. (2015, December). The 2016 Pizza Power Report: A state-of-the industry analysis. PMG Pizza Magazine. Retrieved from http://www.pmq.com/December-2015/The-
2016-Pizza-Power-Report-A-state-of-the-industry-analysis/ on October 11, 2016.
iConnect. (2016). Retrieved November 4, 2016 from http://www.iconnectpos.com/
Insureon. (2016). Retrieved November 04, 2016, from https://foodservices.insureon.com/resources/cost/restaurants
Iowa - May 2015 OES State Occupational Employment and Wage Estimates. (2015, May). Retrieved November 15, 2016, from http://www.bls.gov/oes/current/oes_IA.htm
Kiwanis Miracle League. (2016). Home. Retrieved from: http://kiwanismiracleleague.org/
Laube, J. (2016). Rest Numbers-Pt 1-Workbook - Restaurant Business. Retrieved November 5, 2016, from http://www.restaurantowner.com/RN_1.pdf
Lewis, A. (2013, August). The Math Behind Higher Pay at McDonald's. Retrieved August 29, 2016 from
http://www.wsj.com/articles/SB10001424127887324009304579043422002553480
Loffredo Fresh Produce Co., Inc. (2016). Retrieved November 3, 2016 from http://www.loffredo.com/about/service
Reference Page

Lutz, A. (2015, March). 5 ways millennials' dining habits are different from their parents'. Business Insider. Retrieved from: http://www.businessinsider.com
Mack, S. (2016). Smallbusiness.chron.com. Retrieved October 20, 2016 from
http://smallbusiness.chron.com/entry-barriers-restaurants-36947.html McLynn, K. (2014, March). Breakfast Restaurant Visits Grow While Lunch and Dinner Visits Decline, Reports
NPD. Retrieved October 26, 2016, from https://www.npd.com/wps/portal/npd/us/news/press-releases/breakfast-restaurant-visits-grow-while-lunch-and-dinner-visits-decline-reports-npd/
Mekouer, Dora. (2015). Top 10 Most Popular Ethnic Cuisines in US. Retrieved October 12, 2016 from http://blogs.voanews.com/all-about-america/2015/05/18/top-10- most-
popular-ethnic-cuisines-in-us/ Millennial Marketing. (2016). Millennials are the tastemakers in food. Retrieved from:
http://www.millennialmarketing.com/ National Restaurant Association. (2015, September). 4 in 5 consumers eat ethnic
cuisines regularly. Retrieved October 12, 2016 from http://www.restaurant.org/News-Research/News/4-in-5-consumers-eat-ethnic-cuisines-regularly
NetWaiter. (2015). Important Stats About Mobile Online Ordering Retrieved from https://www.netwaiter.net/articles/Important-Stats-About-Mobile-Online-Ordering/
Oches, S. (2013, September). Pizza’s Arms Race. QSR. Retrieved from https://www.qsrmagazine.com/competition/pizza-s-arms-race on October 11, 2016.
Pace, G. (2011, November 10). The Cost of Starting Up a Restaurant. Retrieved November 03, 2016, from
http://www.inc.com/articles/201111/business-start-up-costs-restaurant.html
Quick Books. (2016). Retrieved November 4, 2016 from https://quickbooks.intuit.com/om/qbhp/
Restaurant. (2016). Retrieved November 05, 2016, from http://www.referenceforbusiness.com/business-plans/Business-Plans-Volume-07/Restaurant.html
Restaurant job growth to outpace economy in 2016. (2016, February). Retrieved October 26, 2016, from http://www.restaurant.org/News-Research/News/Restaurant-job-growth-to-outpace-economy-in-2016
Room Sketcher. (2016). Retrieved November 4, 2016 from http://planner.roomsketcher.com/#/?pid=3028842
Schlossberg, M. (2015, June). The fastest-growing restaurant in America should terrify traditional pizza chains. Business Insider. Retrieved from: http://www.businessinsider.com
Page | 22
Reference Page
Page | 23
Statista. (2016). Distribution of Instagram users in the United States as of December 2015, by age group. Retrieved from: https://www.statista.com
Statista. (2016). Number of monthly active Facebook users worldwide as of 3rd quarter 2016 (in millions). Retrieved from: https://www.statista.com
Statista. (2016). Number of monthly active Twitter users worldwide from 1st quarter 2010 to 3rd quarter 2016 (in millions). Retrieved from: https://www.statista.com
Statistic Brain. (2015, September). Pizza statistics. Retrieved from: http://www.statisticbrain.com/pizza-statistics/
Sung, A. (2013, May). What millennials want. FSR Magazine. Retrieved from: https://www.fsrmagazine.com
Sustainable Pulse. (2015, October). GM Crops Now Banned in 38 Countries Worldwide – Sustainable Pulse Research Retrieved August 29, 2016 from http://sustainablepulse.com/2015/10/22/gm-crops-now-banned-in-36-countries-worldwide-sustainable-pulse-research/#.V8mWoPkrJQL\
Taxes. (2015, June). Retrieved October 26, 2016, from http://www.restaurant.org/advocacy/Taxes
Technomic. (2012, August). Chain Restaurants Missing Out on Ethnic Menu Opportunities. Retrieved October 12, 2016 from
https://www.technomic.com/Reports_and_Newsletters/Consumer_Trend_Reports/
TREND TRACKER. (2015). Restaurant Business, 114(12), 48. Retrieved from Business Source Complete on October 11, 2016.
Tristano, D. (2016, April). The Continued Rise of Fast-Casual Pizza. Forbes Magazine.
Retrieved from http://www.forbes.com/sites/darrentristano/2016/04/06/the-continued-rise-of-fast-casual-pizza/#2e9c52b96444 on October 11, 2016.
Tsai, M. (2016, June). Eight countries taking action against marketing junk food to kids.
Retrieved August 29, 2016 from http://www.csmonitor.com/Business/The-Bite/2016/0627/Eight-countries-taking-action-against-marketing-junk-food-to-kids
Wilson Restaurant Supply, Wilson Restaurant Supply Equipment Service, Restaurant Supply Cedar Falls, Restaurant Supply Waterloo IA, Restaurant Supply. (2016). Retrieved November 05, 2016, from http://wilsonrestaurantsupply.com/
Wray, L. R. (2009, April). The Social and Economic Importance of Full Employment. Retrieved October 26, 2016, from http://www.levyinstitute.org/publications/the-social-and-economic-importance-of-full-employment
Reference Page

POLITICAL
ECONOMICS
SOCIAL
TECHNOLOGY
LEGAL
ENVIRONMENT
Health Care and Education Reconciliation Act of 2010 would require menu-labeling in restaurants that have more than 20 locations under the same name. This was part of Obama’s health care law for consumers to make better dietary choices. The FDA is providing guidance to the restaurants to comply by the May 5, 2017 deadline (National Restaurant Association, 2016). The Department of Labor has also added a new law changing the overtime rules for employees. The new rule which goes into effect in December 2016, will require overtime to be paid to anyone making under $47,476 which is double the current law of $23,660. Restaurant owners are stating they will not be able to absorb the costs and it will hinder employees advancing into managerial positions (National Restaurant Association, 2016). On top of these changes restaurants have already had to make changes due to ObamaCare, which requires employers to offer health insurance to employees working more than 30 hours per week and Obama’s proposal to increase the minimum wage (Goodman, 2016).
POLITICAL
ECONOMICS
The US economy is deeply impacted by the restaurant industry because the industry is made up of more than 1 million restaurant and annual revenue is about $782.7 billion. Since restaurants have deep roots in the American culture, it has created millions of employment opportunities for people in the country. According to the NRA, “The restaurant industry continues to be one of the strongest job creators in the economy, with industry job growth outpacing the overall economy for the 16th consecutive year in 2015.” (NRA 2016) Additionally, the job creations from the restaurant industry helps in increasing national productivity, and provide income for the workers and their families.
Page | 24
APPENDIX A- PESTLE Analysis
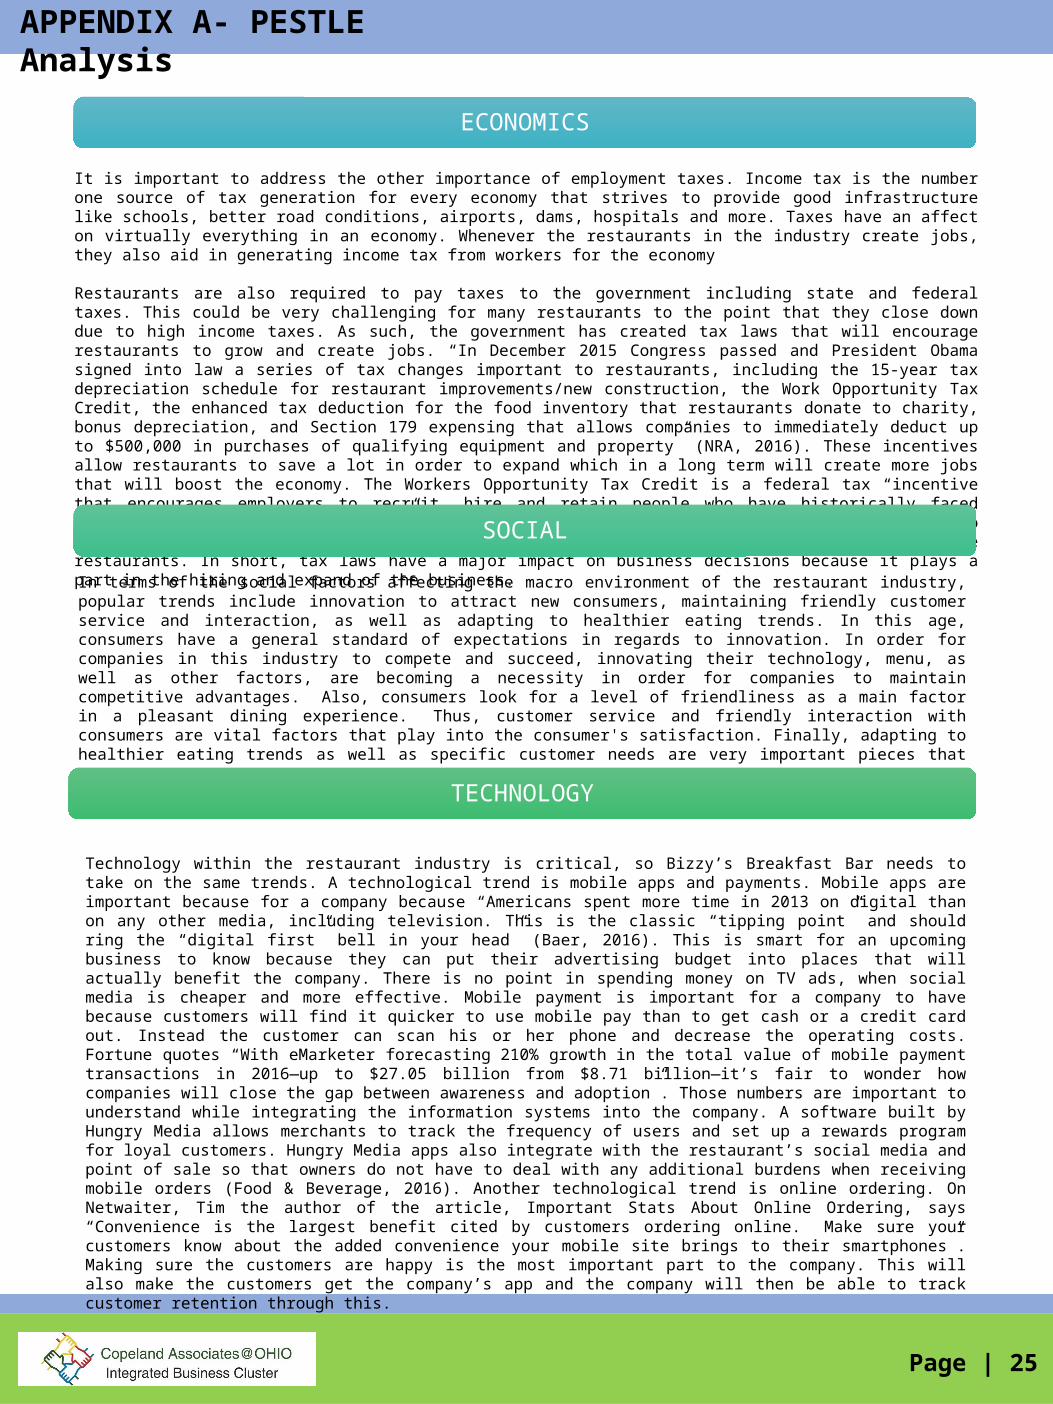
It is important to address the other importance of employment taxes. Income tax is the number one source of tax generation for every economy that strives to provide good infrastructure like schools, better road conditions, airports, dams, hospitals and more. Taxes have an affect on virtually everything in an economy. Whenever the restaurants in the industry create jobs, they also aid in generating income tax from workers for the economy
Restaurants are also required to pay taxes to the government including state and federal taxes. This could be very challenging for many restaurants to the point that they close down due to high income taxes. As such, the government has created tax laws that will encourage restaurants to grow and create jobs. “In December 2015 Congress passed and President Obama signed into law a series of tax changes important to restaurants, including the 15-year tax depreciation schedule for restaurant improvements/new construction, the Work Opportunity Tax Credit, the enhanced tax deduction for the food inventory that restaurants donate to charity, bonus depreciation, and Section 179 expensing that allows companies to immediately deduct up to $500,000 in purchases of qualifying equipment and property” (NRA, 2016). These incentives allow restaurants to save a lot in order to expand which in a long term will create more jobs that will boost the economy. The Workers Opportunity Tax Credit is a federal tax “incentive that encourages employers to recruit, hire and retain people who have historically faced significant barriers to employment” (NRA, 2016). WOTC is a great incentive for restaurants to have a diverse workforce, secure jobs for people and most importantly, save money for the restaurants. In short, tax laws have a major impact on business decisions because it plays a part in the hiring and expand of the business.
ECONOMICS
SOCIAL
In terms of the social factors affecting the macro environment of the restaurant industry, popular trends include innovation to attract new consumers, maintaining friendly customer service and interaction, as well as adapting to healthier eating trends. In this age, consumers have a general standard of expectations in regards to innovation. In order for companies in this industry to compete and succeed, innovating their technology, menu, as well as other factors, are becoming a necessity in order for companies to maintain competitive advantages. Also, consumers look for a level of friendliness as a main factor in a pleasant dining experience. Thus, customer service and friendly interaction with consumers are vital factors that play into the consumer's satisfaction. Finally, adapting to healthier eating trends as well as specific customer needs are very important pieces that are necessary and expected, as consumer’s behaviors and diets are
constantly evolving.
TECHNOLOGY
Page | 25
Technology within the restaurant industry is critical, so Bizzy’s Breakfast Bar needs to take on the same trends. A technological trend is mobile apps and payments. Mobile apps are important because for a company because “Americans spent more time in 2013 on digital than on any other media, including television. This is the classic “tipping point” and should ring the “digital first” bell in your head” (Baer, 2016). This is smart for an upcoming business to know because they can put their advertising budget into places that will actually benefit the company. There is no point in spending money on TV ads, when social media is cheaper and more effective. Mobile payment is important for a company to have because customers will find it quicker to use mobile pay than to get cash or a credit card out. Instead the customer can scan his or her phone and decrease the operating costs. Fortune quotes “With eMarketer forecasting 210% growth in the total value of mobile payment transactions in 2016—up to $27.05 billion from $8.71 billion—it’s fair to wonder how companies will close the gap between awareness and adoption”. Those numbers are important to understand while integrating the information systems into the company. A software built by Hungry Media allows merchants to track the frequency of users and set up a rewards program for loyal customers. Hungry Media apps also integrate with the restaurant’s social media and point of sale so that owners do not have to deal with any additional burdens when receiving mobile orders (Food & Beverage, 2016). Another technological trend is online ordering. On Netwaiter, Tim the author of the article, Important Stats About Online Ordering, says “Convenience is the largest benefit cited by customers ordering online. Make sure your customers know about the added convenience your mobile site brings to their smartphones”. Making sure the customers are happy is the most important part to the company. This will also make the customers get the company’s app and the company will then be able to track customer retention through this.
APPENDIX A- PESTLE Analysis

The environment is an important factor that affects decisions made by companies worldwide in the restaurant industry. The ability to adapt to certain weather conditions is an example of an external environmental problem that companies may have to face. For example, Subway has seen problems in the past with the lack of rain in certain regions, which directly affected the growth of banana peppers in those areas, which are one of their key ingredients. On the other hand, additional environmental factors include sustainability and go-green initiatives, as well as the trend of promoting locally-grown ingredients. All of these factors are appealing to consumers, as some individuals tend to look at the ethical behaviors
and initiatives companies are implementing in comparison to others, ultimately becoming a decision-making factor on behalf of the consumer.
LEGAL
One of the greatest factors when it comes to global food regulation is the legislation regarding Genetically Modified Organisms (GMOs). This has a tremendous impact on strategy in the restaurant industry based on what area of the global market the company operates in. Sustainable Pulse (2015) found that “Thirty eight (38) countries worldwide have officially banned the cultivation of GM crops and only 28 actually grow GM crops”. More and more countries are making the switch to GMO bans every year. Many parts of the U.S. are also moving toward more regulation on GMOs.
The use of non-GMO product affects the bottom line of the companies in the industry by raising the total cost of the product. Chassy and Entine (2015) found that “The lower productivity and higher cost of production would translate into a 10-50% increased cost of ingredients”. These higher cost in non-GMO marketplaces will undoubtedly affect the way restaurants operate in certain areas. Our recommendation is that restaurants in the industry start to transition toward using non-GMO products in all markets because of the trends supporting that GMO products will soon be regulated in most of the market around the entire globe.
Another legal factor that is affecting the restaurant industry is the varying minimum wage regulations in different countries. Labor cost skyrocket when operating in countries like Australia or France where the minimum wage is much higher relative to the rest of the world. It is much more lucrative, from a labor standpoint, to do business in countries that have very low minimum wage requirements in order to keep operating costs as low as possible. Although labor cost make up a large part of the restaurant industries cost structure, it is still possible to find solutions to the growing minimum wage in some markets. Al Lewis (2015) found that “In Australia, for instance, fast-food workers already make about $15. Only some of this higher cost of labor is passed on to consumers. The rest is absorbed by using more technology than people, and demanding more productivity from the fewer people they pay this higher wage.” This shows that restaurants must alter their operations strategy in order to be successful in a high minimum wage environment.
The third legal challenge in the restaurant industry is the growing number of countries that are moving to some kind of ban or limitation on advertising meant to target children. Marisa Tsai (2016) found that eight countries from Mexico to the United Kingdom have adopted some form of limit on advertising for foods high in calories, fat, sugar, and salt. This is an advantage for restaurants in the industry that have moved to a healthy menu, but detrimental to restaurants that have not adapted to healthier menu items.
One of the first areas to introduce a ban on junk food advertisements to children was Quebec, Canada. Dhar and Baylis (2011) found that they “estimate that the ban reduced fast-food consumption by US$88 million per year”. This is just one example of the enormous role that advertisements play in the restaurant industry. Any such limitations on how they are can advertise can dramatically affect their sales. Our recommendation is that restaurants in the industry move to healthier menu items before a majority of the market follows the trend of imposing these bans.
ENVIRONMENT
APPENDIX A- PESTLE Analysis
Page | 26

Competitive Rivalry -
HIGH
Threat of New Entry - Moderate
Buyer Power -
High
Threat of Substitution
- High
Supplier Power -
High
Page | 27
APPENDIX B- Porter’s Analysis

Competitive RivalryBreakfast is the most important meal of the day and QSR restaurants are seeing a rise in the need to offer breakfast items. Competitors such as McDonald’s, Taco Bell, Starbucks, and Dunkin Donuts have all implemented new menus and strategies to capitalize rising interest in quick breakfast options. McDonald’s Corp introduced all day breakfast last year, which offers a limited breakfast menu after the 10:30 a.m. original cut off time (Jargon, 2016). Taco Bell has started serving breakfast and reports that 6% of their total sales are from breakfast menu items (Jargon, 2016). The breakfast market is not saturated so there is room for newcomers to enter the market but they must offer something that differentiates themselves from the common household names such as the competitors listed above (Wolf, 2012). Consumers are looking for menu items they can quickly grab and go on their way to work and typically like routine, so a new restaurant must be able to provide a different experience to intrigue the customers to break into this competitive market (Wolf, 2012).
Buyer PowerThe consumer holds a high amount of power in the restaurant industry, partially due to the highly saturated industry and amount of restaurants. Factors that tend to affect the bargaining power of the consumers include price sensitivity, convenient location, and appetite preferences. However, in terms of the fast-casual breakfast segment, there is not a significant presence nor saturation in this segment, hence the success expected to be seen.
Supplier PowerIn order for restaurants to operate on a productive level and provide excellent customer service, they will need suppliers. For restaurants that serve breakfast, like Bizzy’s Breakfast Bar, will need food suppliers, packaging suppliers, receipt papers, utilities and even suppliers that provide restaurants with restroom supplies. suppliers contribute to about 80% of the operations in restaurants that serve breakfast because suppliers and restaurants need each other to stay on top of the market. Even though there are varieties of suppliers to choose from, breakfast restaurants narrow down their choices based on their company beliefs, culture, mission statement, values, and goals. Due to this, breakfast restaurants are able to choose suppliers they can rely on providing them with good and quality supplies, fresh ingredients and in general, suppliers that can assist restaurants in achieving the goal of providing excellent customer satisfaction.
Restaurants provide customers with great customer service. The industry tends to put majority of their focus into food quality because that’s what consumers are demanding. For industry restaurants to provide quality foods, it has to come from their suppliers. Therefore, suppliers are pressured by restaurants to provide quality, fresh, and healthy produce. Since this is the new trend, (fresh foods) restaurants have to adapt to this by seeking for new supplies that could provide them with this scale of produce they need.
Threat of SubstitutionIt is high for the restaurant industry because there are many different options of cafes, meeting areas, studying areas, and different restaurants. It is easy for a customer to switch products because downtown Des Moines offers different places to eat or do work. Many fast casual places offer the same price points or cheaper if a consumer wants that quick meal. Chipotle has the same assembly line making getting food fast with good quality, with the relatively same prices as Bizzy’s. This makes Chipotle an indirect substitution because it serves a different type of food with the same concept. Even though it is indirect, there is still a high substitution rate.
Page | 28
APPENDIX B- Porter’s Analysis

Threat of New EntryThe restaurant industry is more protected than most when it comes to threats of new entry to the market. There is a great amount of time and costs that occur when a new restaurant tries to enter the market. There are substantial startup cost in the food, dining materials, and the hiring of employees alone. Location of the restaurant is a major factor in the industry. Mack (n.d.) found that “Even if you do manage to find a good location, you face sizable rent or mortgage costs, which can be difficult to cover during the initial months of business.” The longer it takes for the restaurant to become fully operational and enter the market, the harder it becomes to take on all these costs.
When it comes to Bizzy’s specific segment of fast casual breakfast, the first mover advantage comes into effect as well. This is because Bizzy’s will be the first restaurant to create this specific segment. This means that Bizzy’s will be able to capture a large market share of this segment early on and develop a following before any other restaurants can enter this part of the market.Larger more experienced restaurants also have an advantage in the amount of specialist knowledge they have compared to new restaurants. This knowledge can extend too many things. For example, it can take years in order to develop an efficient and effective operations strategy in order to get food to the customer as quickly and high quality as possible. Large chains have had much more experience in perfecting processes like these.
New restaurants trying to enter the market have a large disadvantage when it comes to economies of scale. Mack (n.d.) found that “a large restaurant has greater negotiating power with suppliers and so can demand wholesale pricing. New restaurants can’t demand such pricing, meaning their average supply costs are higher”. It is difficult for new restaurants to have competitive pricing with large chains that do not incur these extra costs.
Threats of new entry in the industry are also limited because of the different things in place protecting the processes and technology of the current companies in the industry. Some forms of technology protection include patents and trade secrets. The USTPO (2013) found that “Many food companies and restaurants choose to use trade secrets to protect their recipes and methods because it allows them to use the secretive nature as a marketing tool”. Patents are also used to protect a restaurants technology. For example, Adam (2006) points out that McDonalds filed for a patent that protected the process in which it makes sandwiches with its "sandwich assembly tool”. However, this patent does not stop other restaurants from making sandwiches since there are an endless combination of way someone can make a sandwich.
Restaurant regulation and competition are also barriers to enter the restaurant industry. Kaufman (2011) found that restaurant regulation is a big hurdle to jump through for new restaurants because of all licensing and certifications that need to be in place before the first plate can be served.
One of the greatest challenges that deters new restaurants from entering the market is the threat of competition from established brands. Mack (n.d.) points out that “When a new restaurant opens, it is in immediate and direct competition with nearby restaurants, which might already have loyal customer bases. Winning these customers over might be difficult for new owners, especially if the new restaurant offers fare similar to restaurants that have a lock on that niche.” The sum of all of the challenges a restaurant faces when trying to enter the restaurant industry shows that there is moderate threat to new entry in the market.
APPENDIX B- Porter’s Analysis
Page | 29

APPENDIX C- SWOT Analysis
Strengths:
Efficiency: the assembly line and limited menu items will allow Bizzy’s to quickly get people their food
Quality: Ingredients are locally sourced and fresh
Availability: Breakfast is available to consumers throughout the day when most competitors close midafternoon
Customization: Consumers have the power to create their own dish based on the ingredients available in the assembly line
Employees: Employee training is quick and efficient due to the easy to learn assembly line system and limited number of menu items
Weaknesses:
Variety: Bizzy’s is attacking a niche market and does not appeal to consumers that don’t like breakfast style food
Brand awareness: With Bizzy’s being a new restaurant and new concept, it will have little to no brand recognition when it first opens for business.
Buyer Power: Bizzy’s is new and buys local ingredients so it will not be able to buy mass quantities of ingredients as cheap as its larger competitors
Opportunities:
Innovations: There is always massive opportunity to adapt to the new technologies being utilized in the restaurant industry (e.g. Data mining, applications, virtual menu boards)
Expansion: Brand awareness will grow with the amount of locations that are added. More locations will allow Bizzy’s to have a better national presence and allow us to capture a larger share of the market
Threats:
Market Saturation: The breakfast restaurant industry is becoming increasingly saturated so Bizzy’s will have to keep innovating in order to stay ahead of the competition
Full-Service Breakfast: All day full-service breakfast will be in direct competition with our fast-casual concept
SWOT
Page | 30

Customer Segments:• Demographic Segmentation:
Millennials, business professionals, Baby Boomers.
• Psychographic segmentation: Convenience, healthy, and lifestyle
• Behavioral segmentation: Business breakfast outings since Bizzy’s is located in the heart of downtown Des Moines
Value Propositions:• Inclusion• Innovation• Integrity
Customer Relationships:• Bizzy’s will treat every customer
with dignity and respect• Bizzy’s believes as a leader it will
be our responsibility to give back to the community and take care of the locals
• Bizzy’s will constantly try and learn how it can meet the needs of each of their customers with constant evolution and innovation
Revenue Systems:• Breakfast burritos• Scrambled eggs• Toasts• Sides• Coffee and tea• Fruit juice• Drinks• To-Go boxes• Opening all day
Cost Structure:• Advertisement• Technology• Expansion• Ingredients • Supplies• Research and Development• Labor and benefits • Rent• Taxes• Miscellaneous
Key Activities:• Marketing food• Selling Food• Giving back to the community
Key Partners:• Des Moines City Schools• The Wounded Warrior Project• Red Cross• Make a Wish• Best Buddies
Key Resources:• Physical resources• Human resources• Hiring Personnel• Financial• Organizational
Channels:• Social Media• Commercials• Sponsorships• Billboards• Cookies
APPENDIX D-Business Model Canvas
Page | 31

Total Population (2015): 217,775
% of population years 18-24 (2015): 10.89%% of population years 25-34 (2015): 16.57%Total % of population years 18-34 (2015): 27.46%
# population years 18-24 (2015): 23,706# population years 25-34 (2015): 36,092Total # population years 18-34 (2015): 57,798Total Des Moines Population (2015): 217,775
57,798/217,775 = 26.54 % 27% of total Des Moines population are millennials
• Between 2010 and 2012, 29 percent of people who moved to Des Moines were millennials, according to NAR. That was a higher percentage than many other millennial hotbeds such as Austin, Seattle and Dallas.
• According to the data the median price for a home in Des Moines is $218,000 compared to $738,000 San Francisco.
• “In a piece titled ‘In Iowa, Jobs Are Plentiful but Workers Are Not’, The New York Times brought up the fact that Iowa isn’t having a problem creating jobs; we’re having a problem filling those positions. Our unemployment rate is 3.4%, which is one of the lowest in the country. Especially in Des Moines where many companies are choosing to locate their headquarters, the job market is growing so rapidly that the risk of absolute unemployment is very low. According to the Greater Des Moines Partnership, the average per capita personal income is also about $3,000 higher than the United States’ average, so a move to Des Moines may result in you making more money.” (Hart, K 2016)
APPENDIX E- Des Moines Population Calculations & Other Statistics
Page | 32

APPENDIX F- Bizzy’s Breakfast Bar Store Interior Design
Page | 33
Source: Pinterest, 2016

APPENDIX G- Bizzy’s Breakfast Bar Website
Page | 34

APPENDIX H- Bizzy’s Breakfast Bar Menu
Page | 35

APPENDIX I - Software Comparison
Page | 36
Square Register$252 (% of sales)
iConnect POS$75 (flat rate)
ShopKeep$69 (flat rate)
Source: Software Insider, 2016

APPENDIX I - Software Comparison
Page | 37
Square Register iConnect POS ShopKeep
Source: Software Insider, 2016

APPENDIX I - Software Comparison
Page | 38
ShopKeepiConnect POSSquare Register
Source: Software Insider, 2016

APPENDIX N - Business Process Flow Diagram
Page | 39

APPENDIX N - Business Process Flow Cont’d
Page | 40
The business process starts off when the customer walks into the store. The customer then waits in line until the first employee in the assembly line greets the customer. There is then a decision to be made of whether or not the customer wants a burrito, bowl, or bagel bites. Once the customer has made a decision, Employee 1 either gets the bowl/ bagel bites or steams the tortilla for the burrito. Employee 1 then passes the dish to Employees 2. As Employee 2 takes over, they ask the customer if they want scrambled eggs or peppers included. After Employee 2 fulfills this portion of the order they then pass it to Employee 3. Employee 3 then adds the customers choice of extra toppings (full topping list can be found on the menu slide). After completing the food, Employee 3 adds a lid to the plate/ bowl or wraps up the burrito. The food is then passed to cashier. The customer then has a decision on if the order is for here or to go. If it is to go the cashier puts it in a bag. If it is for here the cashier puts it on a tray. The cashier ends the process by asking if the customer wants a drink, inputs the order into the system, receives the payment, and hands the customer the order.
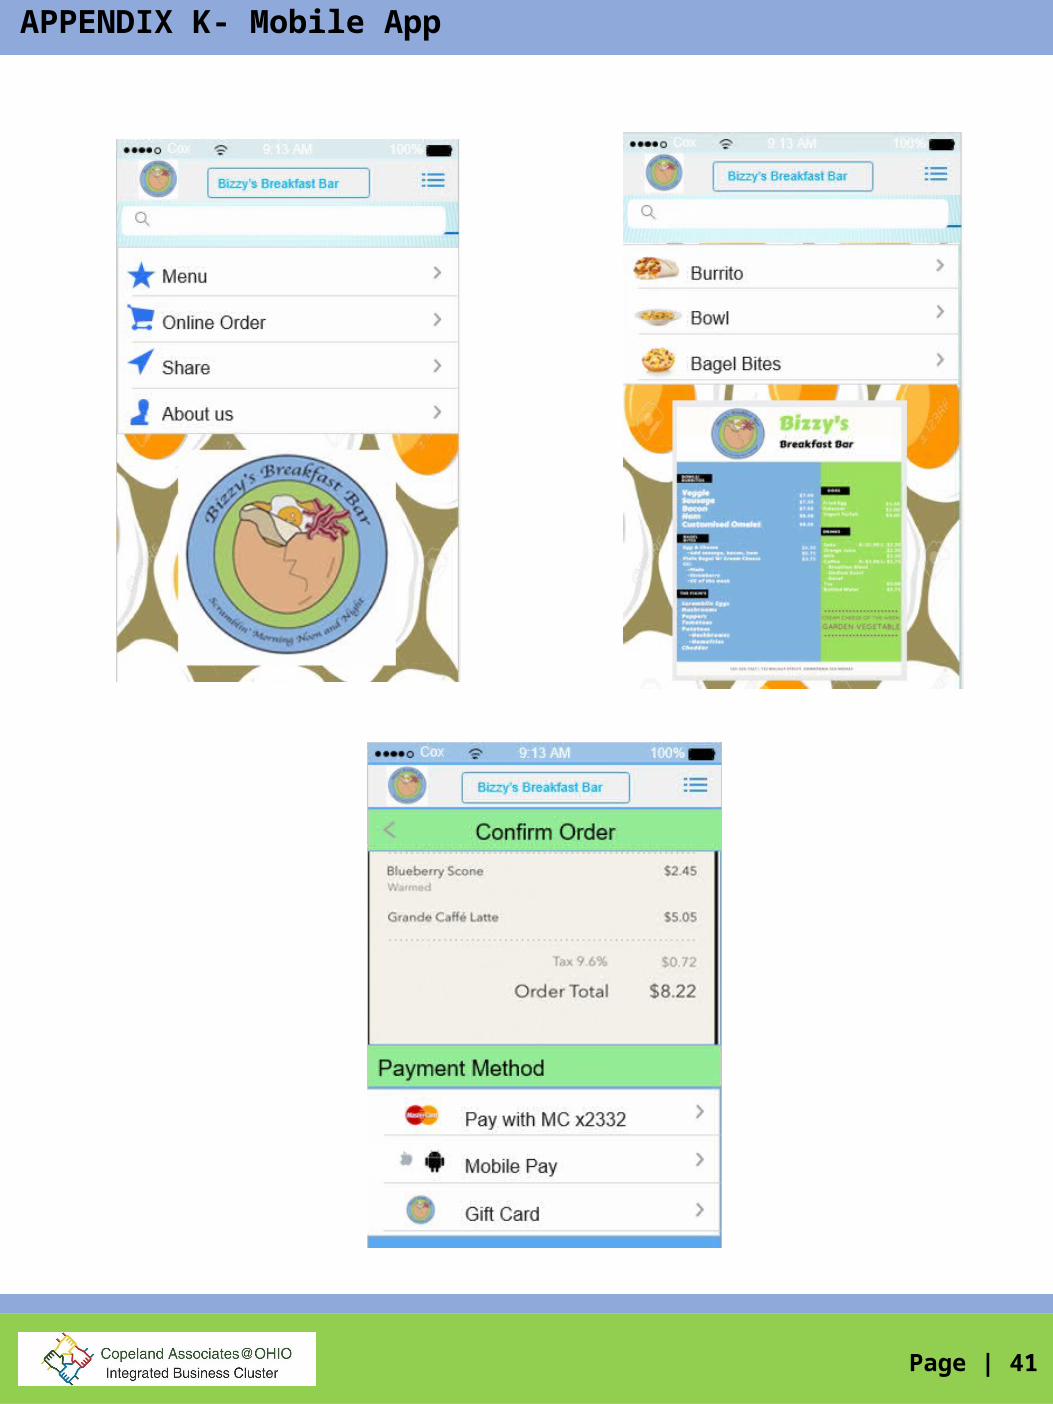
APPENDIX K- Mobile App
Page | 41

APPENDIX L- Sales Dashboard
Page | 42

APPENDIX M- KPIs Sales Per Sq. Ft. & Customers Per Day by Hour
Page | 43
The Sales Per Square Ft. was used as a Key Performance Indicator (KPI) because the research showed that it was a common measurement against competitors in the industry. Because this measurement is so standard it will allow Bizzy’s to make easy comparisons. This measurement is very useful in determining how Bizzy’s is doing against the competition. It is also a great tool for internal comparison when it comes to improving our efficiency and speed based on the space we have available to us. This will allow Bizzy’s to easily compare themselves against the industry leaders that have similar food preparation techniques and similar sized facilities. This calculation will be in direct correlation with Bizzy’s success as they attempt to meet Sales Per Sq. Ft. goals.
The calculations seen in this graph are currently just projections of how the restaurant will do in the first five years. Although it is just a projection it will still be extremely useful in determining how Bizzy’s actual sales per Sq. Ft. are doing compared against their projection. Bizzy’s key performance indicator will be crucial in measuring our success against our competitors in the beginning and future years.
6am 8am 10am 12pm 2pm 4pm 6pm 8pm 10pm0
10
20
30
40
50
60
Customers Per Day, By Hour
Hours of Operation
Num
ber o
f Cus
tom
ers
Customers per day, by the hour is a key performance indicator because it targets many aspects to Bizzy’s Breakfast Bar’s information system. In order to track inventory, manage employees, and understand how the business operates, it is important to take note of when hours of operation are the busiest. The owner and managers must track inventory throughout the day. Knowing the busy hours of the day helps the company prepare for how much inventory they will need in order to not run out. On the other hand, the managers need to know how many employees to schedule during certain hours based on the data collected through the customer relationship management system, integrated with iConnect. If hours are busier, more employees will need to be scheduled and if the hours of the day are slower, not so many employees need to work. Managing the employees does not only affect the efficiency of Bizzy’s Breakfast Bar, but it also affects the budget, more specifically the operation costs. If there is an unexpected peak at night, the management team needs to know who may be available to come into work based on the employees availability. The company can track the current trends and manage the company efficiently and satisfy the customers.

APPENDIX N- KPI Top Selling Items
Page | 44
The top selling items in the restaurant are being used as a key performance indicator (KPI) for Bizzy’s sales. Bowls have been forecasted to come in the lead at 172 per day. This is followed by 115 for burritos, 57 for omelets, and 44 for bagel bites. Bagels see the lowest sales because that is an item that is less unique to Bizzy’s Breakfast Bar. This is because you can go to many other restaurants and buy a bagel, but there are more limited places that someone can go to get a breakfast bowl. A similar concept applies to omelets since many people are in a hurry in the morning hours and do not have the time to wait for an omelet to be prepared. A detailed explanation for this forecast can be found in the marketing section. This KPI will help Bizzy’s determine which items are cash cows, and also items that need to be improved on or promoted. This will also assist in determining which items are contributing the most to the day to day growth of Bizzy’s Breakfast Bar. This will also help with inventory tracking because the restaurant manager will be able to determine which items they need to order more of in order to keep up with demand.

APPENDIX O- Employee Work Schedule
CredibilityThe creators of Bizzy’s are all millennials who are full time students seeing the struggle of not having a
quick and quality breakfast any time of the day
Page | 45

APPENDIX P- Brand Equity Diagram
PersonalityThe restaurant is unique and modern. We want people to feel like they are in a no judgement zone.
Emotional BenefitsA promising work
environment, but also a place to hangout with
friends. This is a homey to-go breakfast
Functional BenefitsIt is quick and convenient, while still being affordable. The product is portable and will satisfy hunger
CredibilityThe creators of Bizzy’s are all millennials who are full time students seeing the struggle of not having a
quick and quality breakfast any time of the day
Product AttributesServes fresh and local ingredients. The products are free-range and easy to customize
Consumer Value PropositionA meal that can fuel consumers to get through the day by letting them create the most important meal with their one of a kind style.
PositioningTo busy, young professionals Bizzy’s Breakfast Bar is the convenient, customizable breakfast bar that provides all day, quality service using fresh, locally sourced ingredients that appeal to all tastes.
SloganScramblin’
Morning Noon & Night
Page | 46
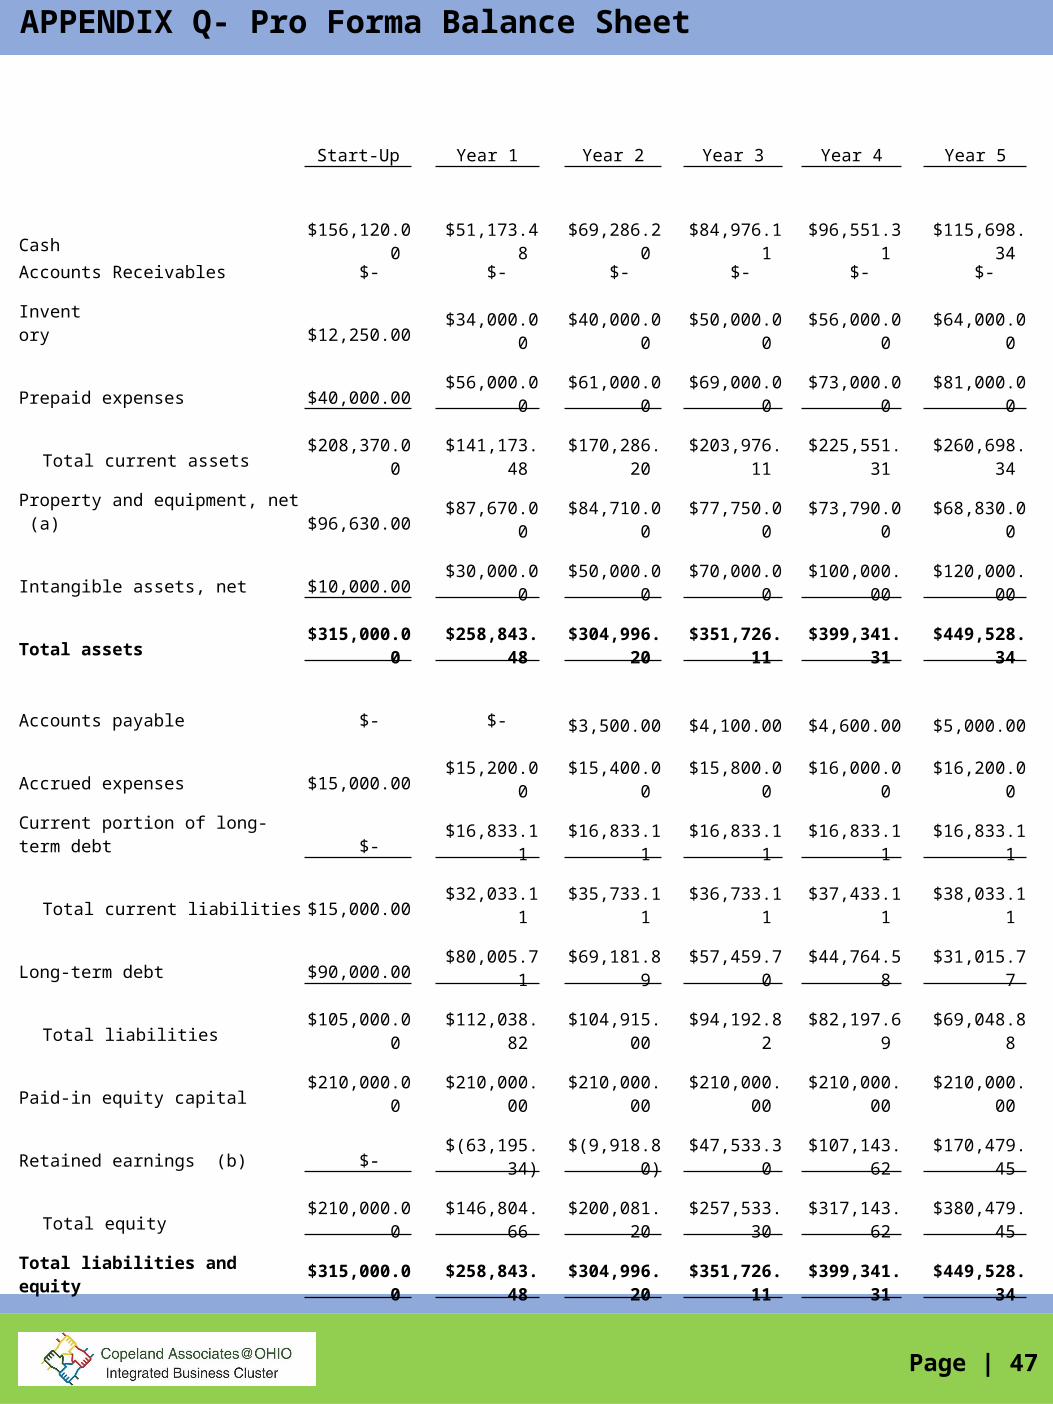
APPENDIX Q- Pro Forma Balance Sheet
Page | 47
Start-Up Year 1 Year 2 Year 3 Year 4 Year 5
Cash $156,120.00 $51,173.48 $69,286.20 $84,976.11 $96,551.31 $115,698.34 Accounts Receivables $- $- $- $- $- $- Inventory $12,250.00 $34,000.00 $40,000.00 $50,000.00 $56,000.00 $64,000.00 Prepaid expenses $40,000.00 $56,000.00 $61,000.00 $69,000.00 $73,000.00 $81,000.00
Total current assets $208,370.00 $141,173.48 $170,286.20 $203,976.11 $225,551.31 $260,698.34 Property and equipment, net (a) $96,630.00 $87,670.00 $84,710.00 $77,750.00 $73,790.00 $68,830.00 Intangible assets, net $10,000.00 $30,000.00 $50,000.00 $70,000.00 $100,000.00 $120,000.00
Total assets $315,000.00 $258,843.48 $304,996.20 $351,726.11 $399,341.31 $449,528.34
Accounts payable $- $- $3,500.00 $4,100.00 $4,600.00 $5,000.00 Accrued expenses $15,000.00 $15,200.00 $15,400.00 $15,800.00 $16,000.00 $16,200.00 Current portion of long-term debt $- $16,833.11 $16,833.11 $16,833.11 $16,833.11 $16,833.11
Total current liabilities $15,000.00 $32,033.11 $35,733.11 $36,733.11 $37,433.11 $38,033.11 Long-term debt $90,000.00 $80,005.71 $69,181.89 $57,459.70 $44,764.58 $31,015.77
Total liabilities $105,000.00 $112,038.82 $104,915.00 $94,192.82 $82,197.69 $69,048.88 Paid-in equity capital $210,000.00 $210,000.00 $210,000.00 $210,000.00 $210,000.00 $210,000.00 Retained earnings (b) $- $(63,195.34) $(9,918.80) $47,533.30 $107,143.62 $170,479.45
Total equity $210,000.00 $146,804.66 $200,081.20 $257,533.30 $317,143.62 $380,479.45
Total liabilities and equity $315,000.00 $258,843.48 $304,996.20 $351,726.11 $399,341.31 $449,528.34
(a) Property and equipment, net:Leasehold improvements $20,000.00 $20,000.00 $20,000.00 $20,000.00 $20,000.00 $20,000.00 Fixtures and equipment $75,000.00 $81,000.00 $93,000.00 $101,000.00 $112,000.00 $122,000.00 Computer hardware and software $1,200.00 $1,200.00 $1,200.00 $1,200.00 $1,200.00 $1,200.00 Printers $430.00 $430.00 $430.00 $430.00 $430.00 $430.00
$96,630.00 $102,630.00 $114,630.00 $122,630.00 $133,630.00 $143,630.00 Less: Accumulated depr and amort $- $14,960.00 $29,920.00 $44,880.00 $59,840.00 $74,800.00
Property and equipment, net $96,630.00 $87,670.00 $84,710.00 $77,750.00 $73,790.00 $68,830.00
(b) Retained earnings:Balance, beginning of year $- $- $(63,195.34) $(9,918.80) $47,533.30 $107,143.62 Net income - $(63,195.34) $53,276.53 $57,452.10 $59,610.32 $63,335.84 Less: Distribution to owner - $- $- $- $- $-
Balance, end of year $- $(63,195.34) $(9,918.80) $47,533.30 $107,143.62 $170,479.45

APPENDIX R- Pro Forma Income Statement
Page | 48
Year 1 Year 2 Year 3 Year 4 Year 5
Sales (a) $1,101,240.00 $1,101,240.00 $1,121,760.00 $1,145,700.00 $1,173,060.00 Cost of goods sold and occupany costs (b) $483,901.00 $489,901.00 $503,050.18 $511,206.26 $524,601.54
Gross profit $617,339.00 $611,339.00 $618,709.82 $634,493.74 $648,458.46 Direct store expenses (c) $329,966.32 $334,966.32 $329,979.92 $323,719.92 $323,083.72 General and administrative expenses (d) $181,024.80 $183,024.80 $189,435.20 $208,914.00 $218,461.20 Pre-opening expenses $162,704.40 $- $- $- $-
Operating income $(56,356.52) $93,347.88 $99,294.70 $101,859.82 $106,913.54 Interest expense $6,838.82 $6,009.30 $5,110.92 $4,137.99 $3,084.30
Income before income taxes $(63,195.34) $87,338.58 $94,183.78 $97,721.83 $103,829.24 Provision for income taxes $- $34,062.05 $36,731.67 $38,111.51 $40,493.40
Net income $(63,195.34) $53,276.53 $57,452.10 $59,610.32 $63,335.84
(a) Sales:Number of customers per day 322.00 322.00 328.00 335.00 343.00
x Average transaction value $9.50 $9.50 $9.50 $9.50 $9.50 Sales per day $3,059.00 $3,059.00 $3,116.00 $3,182.50 $3,258.50
x Number of days open per year 360 360 360 360 360 Sales $1,101,240.00 $1,101,240.00 $1,121,760.00 $1,145,700.00 $1,173,060.00
(b) Cost of goods sold and occupancy costs:Cost of goods sold $407,459 $407,459 $415,608 $419,764.06 $428,159 Rent $40,205.00 $40,205.00 $40,205.00 $40,205.00 $40,205.00 Utilities $33,037.20 $39,037.20 $44,037.20 $48,037.20 $53,037.20 Restaurant Insurance $3,200.00 $3,200.00 $3,200.00 $3,200.00 $3,200.00
Cost of goods sold and occupancy costs $483,901.00 $489,901.00 $503,050.18 $511,206.26 $524,601.54
(c) Direct store expenses:Store payroll, payroll taxes, and benefits $201,105.39 $201,105.39 $201,105.39 $201,105.39 $201,105.39 Store supplies $43,560.16 $48,560.16 $53,560.16 $57,560.16 $67,560.16 Depreciation and amortization $14,960.00 $14,960.00 $14,960.00 $14,960.00 $14,960.00 Advertising $66,074.40 $66,074.40 $56,088.00 $45,828.00 $35,191.80 Repairs and maintenance $330.37 $330.37 $330.37 $330.37 $330.37 Software Expenses $3,936.00 $3,936.00 $3,936.00 $3,936.00 $3,936.00
Direct store expenses $329,966.32 $334,966.32 $329,979.92 $323,719.92 $323,083.72
(d) General and Adminstrative Expenses:Admin. Salaries $159,000.00 $161,000.00 $167,000.00 $186,000.00 $195,000.00 Credit Card Processing Fees $22,024.80 $22,024.80 $22,435.20 $22,914.00 $23,461.20 General and Administrative Expenses $181,024.80 $183,024.80 $189,435.20 $208,914.00 $218,461.20
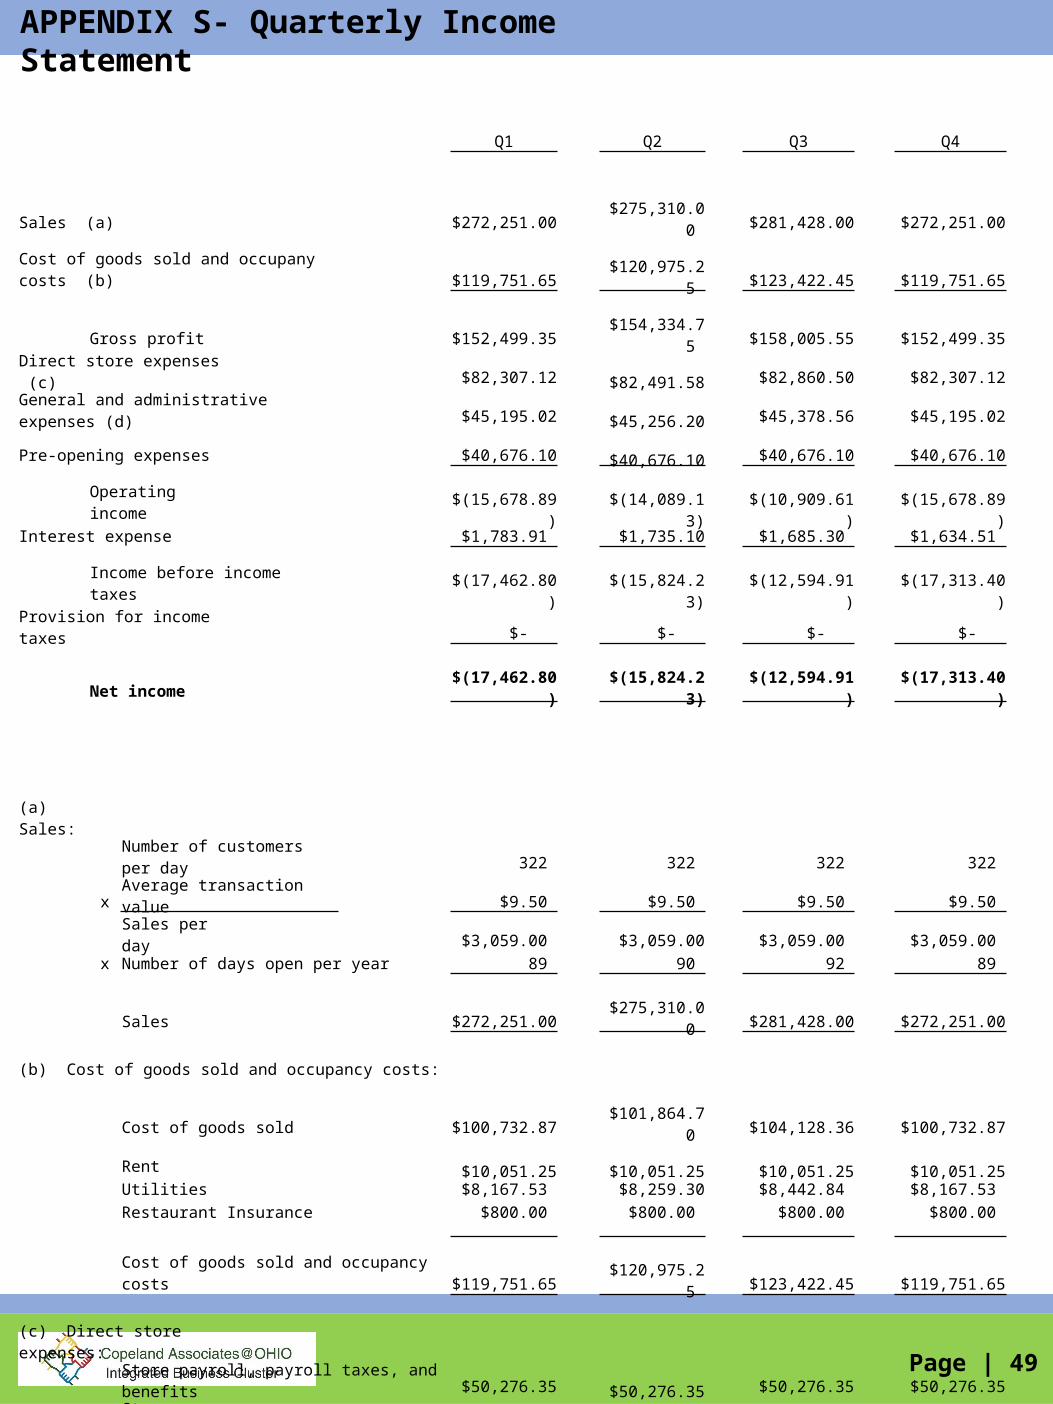
APPENDIX S- Quarterly Income Statement
Page | 49
Q1 Q2 Q3 Q4
Sales (a) $272,251.00 $275,310.00 $281,428.00 $272,251.00 Cost of goods sold and occupany costs (b) $119,751.65 $120,975.25 $123,422.45 $119,751.65
Gross profit $152,499.35 $154,334.75 $158,005.55 $152,499.35 Direct store expenses (c) $82,307.12 $82,491.58 $82,860.50 $82,307.12 General and administrative expenses (d) $45,195.02 $45,256.20 $45,378.56 $45,195.02 Pre-opening expenses $40,676.10 $40,676.10 $40,676.10 $40,676.10
Operating income $(15,678.89) $(14,089.13) $(10,909.61) $(15,678.89)Interest expense $1,783.91 $1,735.10 $1,685.30 $1,634.51
Income before income taxes $(17,462.80) $(15,824.23) $(12,594.91) $(17,313.40)Provision for income taxes $- $- $- $-
Net income $(17,462.80) $(15,824.23) $(12,594.91) $(17,313.40)
(a) Sales:Number of customers per day 322 322 322 322
x Average transaction value $9.50 $9.50 $9.50 $9.50 Sales per day $3,059.00 $3,059.00 $3,059.00 $3,059.00
x Number of days open per year 89 90 92 89 Sales $272,251.00 $275,310.00 $281,428.00 $272,251.00
(b) Cost of goods sold and occupancy costs:Cost of goods sold $100,732.87 $101,864.70 $104,128.36 $100,732.87 Rent $10,051.25 $10,051.25 $10,051.25 $10,051.25 Utilities $8,167.53 $8,259.30 $8,442.84 $8,167.53 Restaurant Insurance $800.00 $800.00 $800.00 $800.00
Cost of goods sold and occupancy costs $119,751.65 $120,975.25 $123,422.45 $119,751.65
(c) Direct store expenses:Store payroll, payroll taxes, and benefits $50,276.35 $50,276.35 $50,276.35 $50,276.35 Store supplies $10,890.04 $10,890.04 $10,890.04 $10,890.04 Depreciation and amortization $3,740.00 $3,740.00 $3,740.00 $3,740.00 Advertising $16,335.06 $16,518.60 $16,885.68 $16,335.06 Repairs and maintenance $81.68 $82.59 $84.43 $81.68 Software expenses $984.00 $984.00 $984.00 $984.00 Direct store expenses $82,307.12 $82,491.58 $82,860.50 $82,307.12
(d) General and Adminstrative Expenses:Admin. Salaries $39,750.00 $39,750.00 $39,750.00 $39,750.00 Credit Card Processing Fees $5,445.02 $5,506.20 $5,628.56 $5,445.02 General and Administrative Expenses $45,195.02 $45,256.20 $45,378.56 $45,195.02

APPENDIX T- Capital Budgeting
Page | 50
Year 0 Year 1 Year 2 Year 3 Year 4 Year 5
EBIT $
-
$(56,356.52)
93,347.88
$99,294.70
$101,859.82
$106,913.54
x (1 - tax rate)
- 85% 61% 61% 61% 61%Operating profit after tax
$ -
$(47,903.04)
$56,942.21
$60,569.77
$62,134.49
$65,217.26
+Depreciation and amortization
$ -
$14,960.00
$14,960.00
$14,960.00
$14,960.00
$14,960.00
Operating cash flow $
-
$(32,943.04)
$71,902.21
$75,529.77 $77,094.49
$80,177.26
-Change in net working capital
$193,370.00
$(84,229.63)
$(191,005.92)
$(231,439.87)
$(287,166.74)
$(337,798.60)
- Capital spending
$96,630.00
$87,670.00
$84,710.00
$77,750.00 $73,790.00
$68,830.00
Free cash flow
$(290,000.00)
$(36,383.41)
$178,198.13
$229,219.64
$290,471.23
$349,145.86
+Horizon value (end of year 5)
$ -
$ -
$ -
$ -
$ -
$487,494.16
Project cash flow
$(290,000.00)
$(36,383.41)
$178,198.13
$229,219.64
$290,471.23
$836,640.03
EBITDA (year 5) $ 121,873.54
x Market multiple 4.0
Horizon value (end of year 5) $ 487,494.16
Required Rate of Return:
Weighted average cost of capital (WACC):
Capital x Cost of x After-Tax = WACCStructure Capital Adjustment
Debt 30% x 8% x 68.8% = 0.016512
Equity 70% x 30% = 0.21
22.65%
Decision-Making Criteria
Net present value = $352,832.01
Internal rate of return = 50.06%
Payback period = 2.33
ACCEPT

APPENDIX U- Year 1 Cash Flows
Page | 51
Q1 Q2 Q3 Q4
EBIT $(15,678.89) $(14,089.13) $(10,909.61) $(15,678.89)
x (1 - tax rate) 1.000 1.000 1.000 1.000
Operating profit after tax $(15,678.89) $(14,089.13) $(10,909.61) $(15,678.89)
+ Depreciation and amortization $ 3,740.00 $ 3,740.00 $ 3,740.00 $ 3,740.00
Operating cash flow $(11,938.89) $(10,349.13) $ (7,169.61) $(11,938.89)
- Change in Net Working Capital $(21,057.41) $(21,057.41) $(21,057.41) $(21,057.41)
- Capital Spending $ 21,917.50 $ 21,917.50 $ 21,917.50 $ 21,917.50
Free cash flow $(12,798.98) $(11,209.22) $ (8,029.70) $(12,798.98)

APPENDIX V-Loan Amortization
No.Payment
DateBeginning
Balance Payment Principal InterestEnding Balance
1 2/1/17 $90,000.00 $1,402.76 $802.76 $600.00 $89,197.24
2 3/1/17 $89,197.24 $1,402.76 $808.11 $594.65 $88,389.13
3 4/1/17 $88,389.13 $1,402.76 $813.50 $589.26 $87,575.63
4 5/1/17 $87,575.63 $1,402.76 $818.92 $583.84 $86,756.71
5 6/1/17 $86,756.71 $1,402.76 $824.38 $578.38 $85,932.33
6 7/1/17 $85,932.33 $1,402.76 $829.88 $572.88 $85,102.45
7 8/1/17 $85,102.45 $1,402.76 $835.41 $567.35 $84,267.04
8 9/1/17 $84,267.04 $1,402.76 $840.98 $561.78 $83,426.06
9 10/1/17 $83,426.06 $1,402.76 $846.59 $556.17 $82,579.48
10 11/1/17 $82,579.48 $1,402.76 $852.23 $550.53 $81,727.25
11 12/1/17 $81,727.25 $1,402.76 $857.91 $544.85 $80,869.34
12 1/1/18 $80,869.34 $1,402.76 $863.63 $539.13 $80,005.71
13 2/1/18 $80,005.71 $1,402.76 $869.39 $533.37 $79,136.32
14 3/1/18 $79,136.32 $1,402.76 $875.18 $527.58 $78,261.13
15 4/1/18 $78,261.13 $1,402.76 $881.02 $521.74 $77,380.12
16 5/1/18 $77,380.12 $1,402.76 $886.89 $515.87 $76,493.22
17 6/1/18 $76,493.22 $1,402.76 $892.80 $509.95 $75,600.42
18 7/1/18 $75,600.42 $1,402.76 $898.76 $504.00 $74,701.66
19 8/1/18 $74,701.66 $1,402.76 $904.75 $498.01 $73,796.91
20 9/1/18 $73,796.91 $1,402.76 $910.78 $491.98 $72,886.14
21 10/1/18 $72,886.14 $1,402.76 $916.85 $485.91 $71,969.28
22 11/1/18 $71,969.28 $1,402.76 $922.96 $479.80 $71,046.32
23 12/1/18 $71,046.32 $1,402.76 $929.12 $473.64 $70,117.20
24 1/1/19 $70,117.20 $1,402.76 $935.31 $467.45 $69,181.89
25 2/1/19 $69,181.89 $1,402.76 $941.55 $461.21 $68,240.34
26 3/1/19 $68,240.34 $1,402.76 $947.82 $454.94 $67,292.52
27 4/1/19 $67,292.52 $1,402.76 $954.14 $448.62 $66,338.38
28 5/1/19 $66,338.38 $1,402.76 $960.50 $442.26 $65,377.87
29 6/1/19 $65,377.87 $1,402.76 $966.91 $435.85 $64,410.97
30 7/1/19 $64,410.97 $1,402.76 $973.35 $429.41 $63,437.61
31 8/1/19 $63,437.61 $1,402.76 $979.84 $422.92 $62,457.77
32 9/1/19 $62,457.77 $1,402.76 $986.37 $416.39 $61,471.40
33 10/1/19 $61,471.40 $1,402.76 $992.95 $409.81 $60,478.45
34 11/1/19 $60,478.45 $1,402.76 $999.57 $403.19 $59,478.88
35 12/1/19 $59,478.88 $1,402.76 $1,006.23 $396.53 $58,472.65
36 1/1/20 $58,472.65 $1,402.76 $1,012.94 $389.82 $57,459.70
37 2/1/20 $57,459.70 $1,402.76 $1,019.69 $383.06 $56,440.01
38 3/1/20 $56,440.01 $1,402.76 $1,026.49 $376.27 $55,413.52
39 4/1/20 $55,413.52 $1,402.76 $1,033.34 $369.42 $54,380.18
40 5/1/20 $54,380.18 $1,402.76 $1,040.22 $362.53 $53,339.96
41 6/1/20 $53,339.96 $1,402.76 $1,047.16 $355.60 $52,292.80
42 7/1/20 $52,292.80 $1,402.76 $1,054.14 $348.62 $51,238.66
Page | 52

APPENDIX V-Loan Amortization43 8/1/20 $51,238.66 $1,402.76 $1,061.17 $341.59 $50,177.49
44 9/1/20 $50,177.49 $1,402.76 $1,068.24 $334.52 $49,109.25
45 10/1/20 $49,109.25 $1,402.76 $1,075.36 $327.39 $48,033.88
46 11/1/20 $48,033.88 $1,402.76 $1,082.53 $320.23 $46,951.35
47 12/1/20 $46,951.35 $1,402.76 $1,089.75 $313.01 $45,861.60
48 1/1/21 $45,861.60 $1,402.76 $1,097.02 $305.74 $44,764.58
49 2/1/21 $44,764.58 $1,402.76 $1,104.33 $298.43 $43,660.25
50 3/1/21 $43,660.25 $1,402.76 $1,111.69 $291.07 $42,548.56
51 4/1/21 $42,548.56 $1,402.76 $1,119.10 $283.66 $41,429.46
52 5/1/21 $41,429.46 $1,402.76 $1,126.56 $276.20 $40,302.90
53 6/1/21 $40,302.90 $1,402.76 $1,134.07 $268.69 $39,168.82
54 7/1/21 $39,168.82 $1,402.76 $1,141.63 $261.13 $38,027.19
55 8/1/21 $38,027.19 $1,402.76 $1,149.24 $253.51 $36,877.95
56 9/1/21 $36,877.95 $1,402.76 $1,156.91 $245.85 $35,721.04
57 10/1/21 $35,721.04 $1,402.76 $1,164.62 $238.14 $34,556.42
58 11/1/21 $34,556.42 $1,402.76 $1,172.38 $230.38 $33,384.04
59 12/1/21 $33,384.04 $1,402.76 $1,180.20 $222.56 $32,203.84
60 1/1/22 $32,203.84 $1,402.76 $1,188.07 $214.69 $31,015.77
61 2/1/22 $31,015.77 $1,402.76 $1,195.99 $206.77 $29,819.78
62 3/1/22 $29,819.78 $1,402.76 $1,203.96 $198.80 $28,615.82
63 4/1/22 $28,615.82 $1,402.76 $1,211.99 $190.77 $27,403.84
64 5/1/22 $27,403.84 $1,402.76 $1,220.07 $182.69 $26,183.77
65 6/1/22 $26,183.77 $1,402.76 $1,228.20 $174.56 $24,955.57
66 7/1/22 $24,955.57 $1,402.76 $1,236.39 $166.37 $23,719.18
67 8/1/22 $23,719.18 $1,402.76 $1,244.63 $158.13 $22,474.55
68 9/1/22 $22,474.55 $1,402.76 $1,252.93 $149.83 $21,221.62
69 10/1/22 $21,221.62 $1,402.76 $1,261.28 $141.48 $19,960.34
70 11/1/22 $19,960.34 $1,402.76 $1,269.69 $133.07 $18,690.65
71 12/1/22 $18,690.65 $1,402.76 $1,278.15 $124.60 $17,412.49
72 1/1/23 $17,412.49 $1,402.76 $1,286.68 $116.08 $16,125.81
73 2/1/23 $16,125.81 $1,402.76 $1,295.25 $107.51 $14,830.56
74 3/1/23 $14,830.56 $1,402.76 $1,303.89 $98.87 $13,526.67
75 4/1/23 $13,526.67 $1,402.76 $1,312.58 $90.18 $12,214.09
76 5/1/23 $12,214.09 $1,402.76 $1,321.33 $81.43 $10,892.76
77 6/1/23 $10,892.76 $1,402.76 $1,330.14 $72.62 $9,562.62
78 7/1/23 $9,562.62 $1,402.76 $1,339.01 $63.75 $8,223.61
79 8/1/23 $8,223.61 $1,402.76 $1,347.94 $54.82 $6,875.67
80 9/1/23 $6,875.67 $1,402.76 $1,356.92 $45.84 $5,518.75
81 10/1/23 $5,518.75 $1,402.76 $1,365.97 $36.79 $4,152.78
82 11/1/23 $4,152.78 $1,402.76 $1,375.07 $27.69 $2,777.71
83 12/1/23 $2,777.71 $1,402.76 $1,384.24 $18.52 $1,393.47
84 1/1/24 $1,393.47 $1,402.76 $1,393.47 $9.29 $0.00
Page | 53

APPENDIX V-Loan Amortization
Year 1 Year 2 Year 3 Year4 Year 51st Quarter $1,783.91 $1,582.69 $1,364.77 $1,128.75 $873.16 2nd Quarter $1,735.10 $1,529.83 $1,307.51 $1,066.75 $806.01 3rd Quarter $1,685.30 $1,475.90 $1,249.11 $1,003.50 $737.51 4th Quarter $1,634.51 $1,420.89 $1,189.53 $938.98 $667.63 Total $6,838.82 $6,009.30 $5,110.92 $4,137.99 $3,084.30
Payment $16,833.11 $16,833.11 $16,833.11 $16,833.11 $16,833.11
Page | 54

DescriptionPhysical Location Asset No. Serial No.
Acquisition Date
Acquisition Cost
Estimated Useful Life
(Years)Estimated
Salvage Value
Estimated Straight-Line Depreciation
Valuefryers, griddle, refrigerator, sink, toaster, microwave, steam table, refrigeratored table, etc
713 Walnut St Des Moines IA. 2 n/a 8/17/17 $50,000.00 5 $10,000.00 $8,000.00
Server that hosts company documents
713 Walnut St Des Moines IA. 3 n/a 8/21/17 $1,200.00 5 $400.00 $160.00
Shelves, flooring, ceiling, electricals, plumbing, counters, painting etc
713 Walnut St Des Moines IA. 4 n/a 6/2/17 $20,000.00 5 $7,000.00 $2,600.00
tables, chairs, booths, office chairs, office desk etc
713 Walnut St Des Moines IA. 5 n/a 7/15/17 $30,000.00 5 $9,000.00 $4,200.00
TOTAL $101,200.00 $26,400.00 $14,960.00
APPENDIX W- Straight Line Depreciation
Page | 55

APPENDIX X- Cash to Sale Comparison
Page | 56

APPENDIX Y- Key Financial Ratios Summary
Page | 57
Year 1 Year 2 Year 3 Year 4 Year 5
Current Ratios $4.41 $4.77 $5.55 $6.03 $6.85
Inventory turnover $14.23 $12.25 $10.06 $9.13 $8.20
Quick Ratio $3.35 $3.65 $4.19 $4.53 $5.17
Cash ratio $1.60 $1.94 $2.31 $2.58 $3.04
Total Debt Ratio $0.43 $0.34 $0.27 $0.21 $0.15
Days sales in inventory $25.29 $29.39 $35.78 $39.44 $43.92
Total Assets Turnover (TAT) $4.25 $3.61 $3.19 $2.87 $0.14
Profit Margin $(0.057) $0.048 $0.051 $0.052 $0.054
ROA $(0.24) $0.17 $0.16 $0.15 $0.14
Revenue Per seat $(3.51) $2.96 $3.19 $3.31 $3.52
Sales Per Square footage $465.64 $465.64 $474.32 $484.44 $496.01