
Fall 2014 ILA LRM Model Solutions - Society of Actuaries
19
ILA LRM Fall 2014 Solutions Page 1 ILA LRM Model Solutions Fall 2014 1. Learning Objectives: 2. The candidate will demonstrate an understanding of the various sources of risks faced by an insurer. 4. The candidate will demonstrate an understanding of the principles of modeling, cash flow testing and asset-liability matching, and perform related calculations. Learning Outcomes: (2a) Identify, categorize and evaluate potential sources of risk in products including but not limited to mortality, morbidity, and lapse. (2b) Identify, categorize and evaluate potential sources of risk in investments including but not limited to credit risk, liquidity, equity-based exposure and asset-liability matching. (2c) Describe and evaluate the other risks an insurance company faces including operational, marketplace and expense risks. (4a) For an ALM model (i) Select appropriate assumptions and scenarios (ii) Model dynamic behavior of both assets and liabilities (iii) Model and explain various strategies, including hedging (iv) Analyze and evaluate results (including actual v. projected differences) (v) Recommend appropriate strategies (4b) Define and calculate duration, convexity and key rate durations including the rationale for matching as a means to manage risk Sources: LRM-115-14: Chapter 22 of Life Insurance Accounting, Asset/Liability Management LRM-114-14: ALM for Insurers LRM-120-14 Chapter 14: Life Insurance Products and Finance - Atkinson/Dallas - Section 14.4 only on ALM Matching Commentary on Question: Commentary listed underneath question component.
Transcript of Fall 2014 ILA LRM Model Solutions - Society of Actuaries
ILA LRM Fall 2014 Solutions Page 1
ILA LRM Model Solutions
Fall 2014
1. Learning Objectives: 2. The candidate will demonstrate an understanding of the various sources of risks
faced by an insurer.
4. The candidate will demonstrate an understanding of the principles of modeling,
cash flow testing and asset-liability matching, and perform related calculations.
Learning Outcomes:
(2a) Identify, categorize and evaluate potential sources of risk in products including
but not limited to mortality, morbidity, and lapse.
(2b) Identify, categorize and evaluate potential sources of risk in investments including
but not limited to credit risk, liquidity, equity-based exposure and asset-liability
matching.
(2c) Describe and evaluate the other risks an insurance company faces including
operational, marketplace and expense risks.
(4a) For an ALM model
(i) Select appropriate assumptions and scenarios
(ii) Model dynamic behavior of both assets and liabilities
(iii) Model and explain various strategies, including hedging
(iv) Analyze and evaluate results (including actual v. projected differences)
(v) Recommend appropriate strategies
(4b) Define and calculate duration, convexity and key rate durations including the
rationale for matching as a means to manage risk
Sources:
LRM-115-14: Chapter 22 of Life Insurance Accounting, Asset/Liability Management
LRM-114-14: ALM for Insurers
LRM-120-14 Chapter 14: Life Insurance Products and Finance - Atkinson/Dallas -
Section 14.4 only on ALM Matching
Commentary on Question:
Commentary listed underneath question component.

ILA LRM Fall 2014 Solutions Page 2
1. Continued
Solution:
(a) Define each of the following ALM methods:
(i) Exact cash flow matching
(ii) Cash flow testing
(iii) Duration matching (immunization)
(iv) Convexity matching
(v) Dynamic financial analysis
Commentary on Question:
Most candidates were able to answer parts (i)-(iv), but many struggled fully
explaining dynamic financial analysis (DFA). To receive full credit for part (v),
the candidate needed to either provide a description of DFA and list the
components or list and provide a description of each of the components.
(i) Exact cash flow matching
Eliminate interest rate risk by buying assets with cash flows that exactly
offset liability cash flows.
(ii) Cash flow testing
Assess the potential cash flow impact of projecting cash flows under
various interest rate scenarios.
(iii) Duration matching (immunization)
Matching the first derivative of the present value of liability and asset cash
flows with respect to interest rates (duration) so that their values move in
tandem for small change in interest rates.
(iv) Convexity matching
In addition to duration matching, also matching the second derivative of
the present value of liability and asset cash flows with respect to interest
rates (convexity) so that their values move in tandem for larger changes in
interest rates.

ILA LRM Fall 2014 Solutions Page 3
1. Continued
(v) Dynamic financial analysis (DFA)
Allows the insurer to evaluate the company’s position under a range of
scenarios and to assess the impact of different strategic moves. DFA
consists of the following components:
1.) Summarize the initial condition
2.) Create a scenario generator
3.) Build a financial calculator to translate scenarios into financial results
4.) Develop an optimizer to evaluate different strategic alternatives
5.) Analyze the results
(b) Define the following risks and state how they would impact each product sold by
JSW:
(i) Disintermediation risk
(ii) Reinvestment risk
Commentary on Question:
Most candidates were able to successfully define each risk but many failed or
omitted to explain how each risk impacted the specific products.
(i) Disintermediation risk
Risk of having to sell assets at depressed values to cover cash outflows
when interest rates rise.
10-year Term
Minimal risk since term has little to no cash surrender value.
Permanent Life
Since permanent life policies can have significant cash surrender values, if
interest rates rise policyowners would be inclined to surrender their
policies in order to seek higher returns elsewhere.
(ii) Reinvestment risk
The risk of reinvesting at lower-than-expected rates when liability cash
flows extend further in the future than asset cash flows.

ILA LRM Fall 2014 Solutions Page 4
1. Continued
10-year Term
Minimal risk since there are many assets available that cover the 10 year
duration of the liability.
Permanent Life
The duration of the liability for permanent life insurance often exceeds the
duration of any assets available in the marketplace (generally 30 years),
which allows for the potential for reinvestment risk.
(c) Explain how JSW could revise its cash flow matching methodology to reduce
interest rate risk.
Commentary on Question:
This question was intended to have the candidate suggest that the company adopt
a more centralized/holistic ALM function. However, almost all candidates just
suggested an alternative ALM technique instead of exact cash flow matching
which we also excepted. To receive full credit for a “centralized/holistic” answer
one would need to both identify the opportunity and explain in details the benefits
of a centralized ALM function. In contrast, to receive full credit for an
“alternative strategy”, one needed to identify the disadvantages of exact cash
flow matching, propose an alternative method, describe why the alternative
method would be better, and then mention the opportunity to combine both
products into a centralized ALM function.
“Centralized/holistic” Answer
Currently, JSW has separate ALM groups and separate assets backing each
product. JSW could utilize a holistic approach to help reduce their interest rate
risk. By consolidating their ALM groups and combining the assets backing each
product, JSW would be no worse off with respect to cash flow mismatch.
However, this would increase their flexibility in matching liability cash flows as
well as reduce the possibility of mismatch and increase their ability to invest in
higher yielding assets.
“Alternative Strategy” Answer
Even though exact cash flow matching eliminates interest rate risk, it is not a
practical ALM technique due to the uncertainty of liability cash flows and the
reduced investment flexibility the technique offers. An alternative approach
would be to match the duration and convexities of the assets and liabilities. This
technique would allow JSW more flexibility with their investment options then
with exact cash flow matching.

ILA LRM Fall 2014 Solutions Page 5
1. Continued
In addition, JSW could also combine their ALM groups into a centralized group
in order to take advantage of any efficiencies this might offer.
(d)
(i) Identify the risks associated with your colleague’s strategy.
(ii) Identify another hedging strategy and explain the risks it introduces.
Commentary on Question:
Many candidates failed to identify that the market risk in question related to a
guaranteed minimum death benefit (GMDB) on a variable life insurance policy
and that the colleague was suggesting a static hedge. In particular, many
candidates overlooked the fact that in a variable life insurance contract the assets
are invested in the underlying funds so there is no upside risk. Note that even
though static hedges are explicitly tested in the Life Pricing exams, they are
generally considered common knowledge.
Part (ii) was looking for a description of dynamic hedging and then to compare
the pros and cons versus dynamic and static hedging. Reinsurance was also an
accepted an alternative hedging strategy.
(i) Identify the risks associated with your colleague’s strategy.
My colleague is proposing a static hedge to help reduce the market risk
related to the guaranteed minimum death benefit (GMDB). The following
are some risks with this proposal:
Lack of availability of options with expiry dates matching long-term
death benefits.
Longer term options, in general, have greater credit risk.
Uncertainty of projected death benefits relating to potential difference
in actual to expected mortality and lapse experience.
(ii) Identify another hedging strategy and explain the risks it introduces.
I propose implementing a dynamic hedge by constructing a hedge
portfolio with equity market sensitivities (greeks: delta, theta, etc.) that
match those of the liabilities. In theory, changes in the hedge portfolio
will offset changes of the guaranteed liability.

ILA LRM Fall 2014 Solutions Page 6
1. Continued
The following are some risks that dynamic hedging introduces:
Credit Risk: The hedge portfolio will still be exposed to counterparty
credit risk but should be lower than the longer term options needed for
the static hedge.
Basis Risk: Basis risk, the risk of imperfect hedging, is present with
both strategies; however, dynamic hedging allows the opportunity to
rebalance whereas static hedging is locked in.
Operational Risk: Since dynamic hedge may require frequent
rebalancing, the additional transaction costs may outweigh the benefits
compared to a static hedge.
Catastrophic Risk: Dynamic hedging, in extreme circumstances, may
prove ineffective and could result in sizeable losses.

ILA LRM Fall 2014 Solutions Page 7
2. Learning Objectives: 3. The candidate will demonstrate an understanding of important risk measurement
techniques along with their uses and limitations, and be able to perform risk
measurement calculations.
Learning Outcomes:
(3a) Analyze and evaluate risk measures & estimators (e.g., Value-At-Risk,
Conditional Tail Expectations, etc.)
(3b) Apply and analyze scenario and stress testing in managing risk including the
calibration and setting of assumptions
Sources:
C-25-07, An Introduction to Risk Measures for Actuarial Applications, Hardy
Chapter 14: Stress Testing, Jorion
Getting to Know CTE , Ingram
ERM - 102 - 12 Value-At-Risk: Evolution, Deficirencies and Alternatives - Vozian 2010
(also FE-C181-11)
Commentary on Question:
Commentary listed underneath question component.
Solution:
(a) Compare and contrast the following tail risk calculations:
(i) 95% VaR
(ii) 95% CTE
Commentary on Question:
Most of the candidate did well on this question
(i) α-VaR represents the loss that, with probability α will not be exceeded
(ii) the CTE is the expected loss given that the loss falls in the worst (1 − α)
part of the loss distribution
(b) Calculate the 95% VaR and 95% CTE for X+Y, assuming X and Y are
independent. Show all work.
Commentary on Question:
Most candidates did poorly on the calculation because they failed to develop the
distribution of X+Y. Some even confused VAR with variance.

ILA LRM Fall 2014 Solutions Page 8
2. Continued
The VaR is set at 200 which is the smallest number that gives the property that the
loss will be smaller with at least 95% probability.
CTE95 = E[X+Y|X+Y>=200] = =(2500*0.00015 + 2080*0.00085 + 2005*0.004
+ 620*0.00435 + 510*0.0255 + 200*0.01515)/0.05 = 577.9
(c) Explain the shortcomings of VaR and how stress testing can complement standard
VaR models.
Commentary on Question:
Most candidates were able to identify and provide a brief explanation on one or
more of the shortcomings of VAR. Some candidates just identified shortcomings
without an explanation. As the questions asked to ‘explain’ shortcomings, no
credit was awarded if no explanation was provided.

ILA LRM Fall 2014 Solutions Page 9
2. Continued
Shortcoming of VAR
1. VAR is not coherant – it fails the sub-additivity property and doesn't consider
tail risk
2. VAR assumed normal distribution - the real distribution return is not normally
distributed, no skew in tail
3. VAR calculation method is not prescribed - different companies use different
methodologies to calculate VAR
4. Parametric risk - VAR Historical data and observation period, can be distorted
by outliers and dependent on data used in parameter calibration
5. Agency problem – VAR can be manipulated by manager to hide risks
6. Regulatory disclosure - No standard VAR reporting template are enforced by
the regulator which gives rise to risk of misrepresentation
How can stress testing be complement to VAR
VaR are based on recent historical data which fails to identify extreme unusual
situations and stress testing can help manage situations that could cause
extraordinary losses through the utilization of i) scenario analysis; ii) stressing
models and iii) policy responses. It helps the managers paint a more realistic
picture of tail risks.
ILA LRM Fall 2014 Solutions Page 10
3. Learning Objectives: 2. The candidate will demonstrate an understanding of the various sources of risks
faced by an insurer.
3. The candidate will demonstrate an understanding of important risk measurement
techniques along with their uses and limitations, and be able to perform risk
measurement calculations.
Learning Outcomes:
(2a) Identify, categorize and evaluate potential sources of risk in products including
but not limited to mortality, morbidity, and lapse.
(2c) Describe and evaluate the other risks an insurance company faces including
operational, marketplace and expense risks.
(3a) Analyze and evaluate risk measures & estimators (e.g., Value-At-Risk,
Conditional Tail Expectations, etc.)
Sources:
Sweeting Chapter 14: Quantifying Particular Risks; 14.6 Liquidity Risk; 14.8
Demographic Risk & 14.9 Non-Life Insurance Risk
A New Approach for Managing Operational Risk - SoA Research 2008.]
Commentary on Question:
Commentary listed underneath question component.
Solution:
(a) Describe primary sources of Demographic Risk and explain how they can be
modeled.
Commentary on Question:
To get full marks, candidates needed to list and describe the 4 primary sources of
demographic risk (from the list of 5 below), and give an explanation on how the
risk can be modeled. Few candidates were able to describe the risks, and even
fewer candidates explained how the risk can be modeled.
Level Risk: Risk that the underlying mortality of a particular population differs
from that assumed.
Risk can be modeled through Experience Rating and Risk Rating
Volatility Risk: Risk that the mortality experience will differ from that assumed
due to there being a finite number of lives in the population considered.
Risk is best modeled stochastically (i.e. Binomial is optimal but Poisson is
acceptable)
ILA LRM Fall 2014 Solutions Page 11
3. Continued
Catastrophe Risk: Risk of large losses due to some significant event increasing
mortality rates beyond simple random volatility.
Risk can be modeled using scenario analysis or copulas
Trend Risk: Risk that mortality rates will improve over time at a rate different to
be assumed.
Risk can be modeled through parametric or non-parametric (i.e. P-spline)
methods
Lapse risk: Risk that unexpected persistency could lead to financial losses.
Risk can be modeled by combining company’s experience with industry
experience based on credibility.
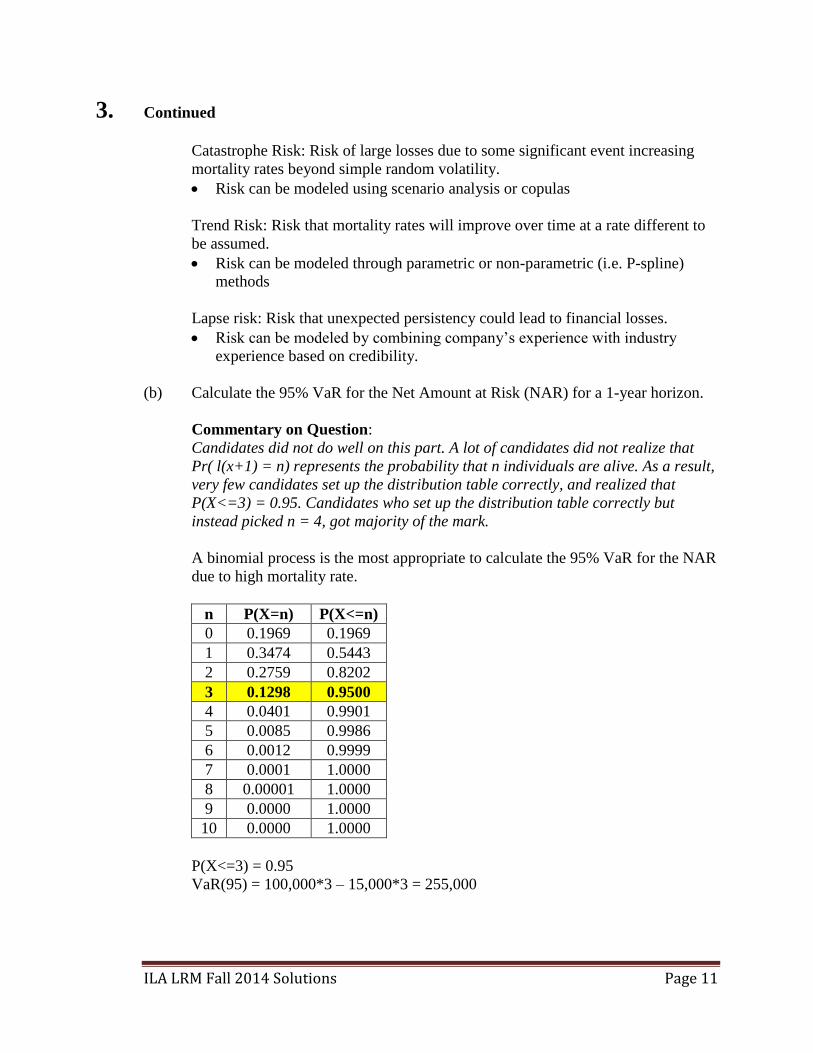
(b) Calculate the 95% VaR for the Net Amount at Risk (NAR) for a 1-year horizon.
Commentary on Question:
Candidates did not do well on this part. A lot of candidates did not realize that
Pr( l(x+1) = n) represents the probability that n individuals are alive. As a result,
very few candidates set up the distribution table correctly, and realized that
P(X<=3) = 0.95. Candidates who set up the distribution table correctly but
instead picked n = 4, got majority of the mark.
A binomial process is the most appropriate to calculate the 95% VaR for the NAR
due to high mortality rate.
n P(X=n) P(X<=n)
0 0.1969 0.1969
1 0.3474 0.5443
2 0.2759 0.8202
3 0.1298 0.9500
4 0.0401 0.9901
5 0.0085 0.9986
6 0.0012 0.9999
7 0.0001 1.0000
8 0.00001 1.0000
9 0.0000 1.0000
10 0.0000 1.0000
P(X<=3) = 0.95
VaR(95) = 100,000*3 – 15,000*3 = 255,000

ILA LRM Fall 2014 Solutions Page 12
3. Continued
(c) Describe the risks XYZ may face from its claims paying process.
Commentary on Question:
This question was not well answered but most of the candidates received partial
marks. Candidates lost points for not providing sufficient number of risks.
This is an example of process risk.
XYZ faces reputation risk as it has not kept its promise and this may be
negatively portrayed in the media.
The slow payment of claims could lead to legal/litigation risk.
The slow payment of claims could also damage Mirage's competitiveness in
the market; they could lose existing and potential customers.
(d) As part of your risk review of XYZ, you interview a few key employees of the
company. Critique each of the following three statements:
(i) One of XYZ’s top sales agents stated, “Sometimes it is necessary to
change the medical declaration or smoking status on an application for a
life insurance product in order to get the customer a premium rate they
can afford. There is really no downside risk in doing this; I get
commission for selling the policy, the customer gets insurance, and the
company gets new sales.”
(ii) The Chief Financial Officer of XYZ said, “Our operational risk
management focus should be on risks that have a high likelihood and a
high impact. Those are the risks that are most dangerous to the
company.”
(iii) The Manager of actuarial modeling stated, “The best way to model
operational risk is to use internal data. Since every company faces unique
operational risks, external data would be irrelevant. When gathering
internal data, we will exclude any outliers that could greatly distort the
mean.”
Commentary on Question:
Candidates performed well on this part compared to other parts of this question.
Well prepared candidates were able to recognize that there were issues with all
the statements above and were successfully able to critique them. On the other
hand, very few candidates adequately explained the external data portion in Part
(iii).
ILA LRM Fall 2014 Solutions Page 13
3. Continued
(i) This is an example of principal-agent. It is not a criminal risk because the
agent doesn't intend to hurt anyone, and truly believes that it is beneficial
for everyone.
The agent is wrong when he states there is no downside risk. Changing
underwriting information to increase sales may nominally benefit him and
the company, but in the long run it is not in the company's best interest.
In addition, changing the underwriting info on life products exposes the
company to mortality risk. The company may think this business has
lower expected mortality which will lead to inadequate reserves and
possibly inadequate future pricing.
(ii) The high likelihood risks are not the most dangerous to a company
because these risks are not unexpected and as a result, the company should
have already prepared for them.
The statement is consistent with traditional operational risk management,
which focuses on commonly observable threats but the largest risks go
unrecognized.
Instead, company should focus on high severity and low frequency events
because these events are the ones that can pose the biggest risks to a
company.
(iii) External data can be very valuable when modeling operational risk. When
using external data, you assume that operational risks are independent so,
for example, 10 years of data from 20 companies represents 200 years of
data. This is more valuable than internal data points from one company
when assessing tail event.
The outliers should not be ignored in the modeling data. In operational
risk, the outliers are usually the most relevant since they represent the
large, rare events that could pose the biggest threat to the company.

ILA LRM Fall 2014 Solutions Page 14
4. Learning Objectives: 1. The candidate will demonstrate an understanding of the principles of Risk
Management.
Learning Outcomes:
(1a) Define and evaluate risk.
(1d) Describe how risk management techniques may be used to manage capital
deployed by insurers and how they impact strategic decision making.
Sources:
Risk Appetite: Linkage with Strategic Planning
ILA-C124-10: Insurance Criteria: Refining the Focus of Insurer ERM Criteria, June 2006
(exclude pp. 20-26 (property/Casualty -Nonlife Insurance Risk)
Commentary on Question:
Commentary listed underneath question component.
Solution:
(a)
(i) Calculate the profit margin and risk-adjusted return on capital (RAROC)
for each proposed product.
(ii) Recommend which UL product(s) ABC Life should add to its portfolio, if
any. Justify your answer.
Commentary on Question:
The general concept of using RAROC to compare the options was fairly well
understood
Common mistakes were missing the PV factors in the RAROC formula and not
comparing the results against the hurdle rate.
Profit Margin
RAROC
UL #1
Profit Margin 13.64%
RAROC
UL #2
Profit Margin 8.89%
ILA LRM Fall 2014 Solutions Page 15
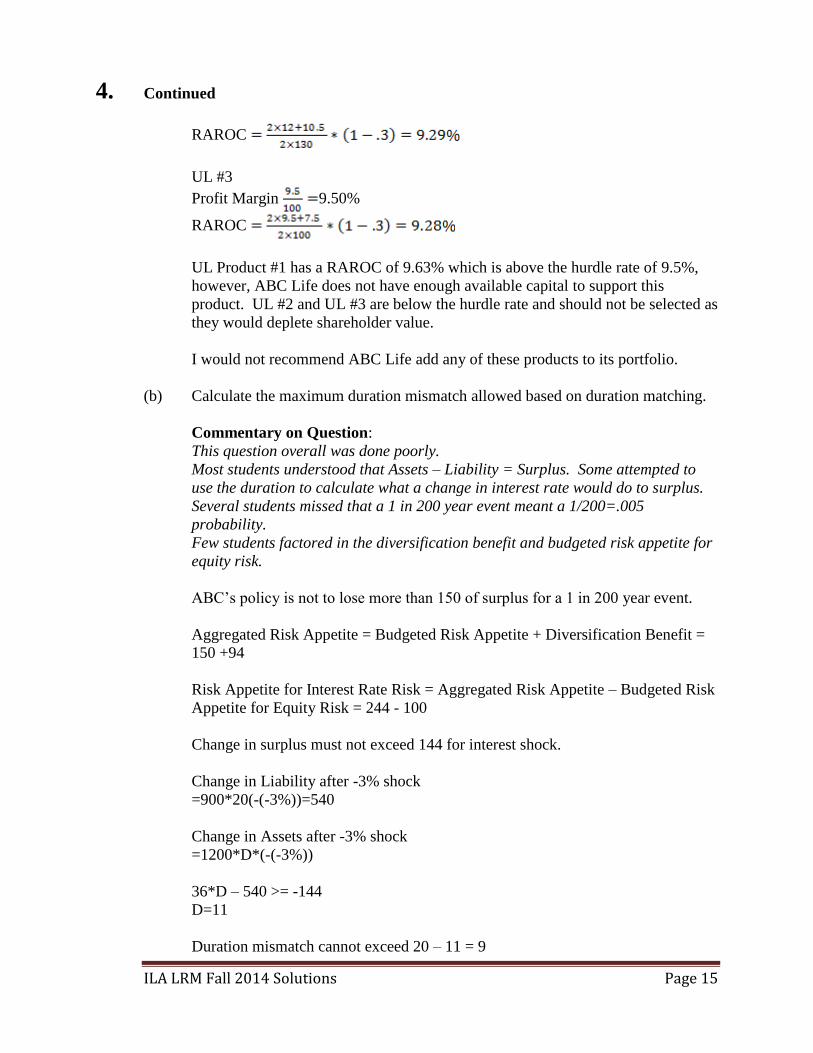
4. Continued
RAROC
UL #3
Profit Margin 9.50%
RAROC
UL Product #1 has a RAROC of 9.63% which is above the hurdle rate of 9.5%,
however, ABC Life does not have enough available capital to support this
product. UL #2 and UL #3 are below the hurdle rate and should not be selected as
they would deplete shareholder value.
I would not recommend ABC Life add any of these products to its portfolio.
(b) Calculate the maximum duration mismatch allowed based on duration matching.
Commentary on Question:
This question overall was done poorly.
Most students understood that Assets – Liability = Surplus. Some attempted to
use the duration to calculate what a change in interest rate would do to surplus.
Several students missed that a 1 in 200 year event meant a 1/200=.005
probability.
Few students factored in the diversification benefit and budgeted risk appetite for
equity risk.
ABC’s policy is not to lose more than 150 of surplus for a 1 in 200 year event.
Aggregated Risk Appetite = Budgeted Risk Appetite + Diversification Benefit =
150 +94
Risk Appetite for Interest Rate Risk = Aggregated Risk Appetite – Budgeted Risk
Appetite for Equity Risk = 244 - 100
Change in surplus must not exceed 144 for interest shock.
Change in Liability after -3% shock
=900*20(-(-3%))=540
Change in Assets after -3% shock
=1200*D*(-(-3%))
36*D – 540 >= -144
D=11
Duration mismatch cannot exceed 20 – 11 = 9
ILA LRM Fall 2014 Solutions Page 16
5. Learning Objectives: 2. The candidate will demonstrate an understanding of the various sources of risks
faced by an insurer.
4. The candidate will demonstrate an understanding of the principles of modeling,
cash flow testing and asset-liability matching, and perform related calculations.
Learning Outcomes:
(2b) Identify, categorize and evaluate potential sources of risk in investments including
but not limited to credit risk, liquidity, equity-based exposure and asset-liability
matching.
(4a) For an ALM model
(vi) Select appropriate assumptions and scenarios
(vii) Model dynamic behavior of both assets and liabilities
(viii) Model and explain various strategies, including hedging
(ix) Analyze and evaluate results (including actual v. projected differences)
(x) Recommend appropriate strategies
(4b) Define and calculate duration, convexity and key rate durations including the
rationale for matching as a means to manage risk
Sources:
LRM –100-14 Chew Ch 31 – theory of risk capital in finance
Case Study
Commentary on Question:
In general, candidates performed poorly on this question. To earn significant points,
candidates were expected not only to explain relevant concepts, but also to apply them to
the Simple Life case study as well. Candidates received full marks if they have correctly
explained the context of the statement and provided at least one example relevant to the
case study.
Areas where candidates performed well:
Recognizing that standard accounting methods fail to adequately account for risk,
which could produce either under- or over-statement of profit
Defining risk capital as amount required to insure any loss in net assets relative to
risk-free investment of net assets
Diversification benefits arising from low correlations among existing lines of
business
Commenting on potential diversification benefits not only among lines of business,
but also between companies in Lyon group and from considering new lines
Some candidates made direct reference to economic capital and risk-based capital in
Simple Life financial statements

ILA LRM Fall 2014 Solutions Page 17
5. Continued
Stating profitability and IRR distorted by using allocation of risk capital using stand-
alone basis
Providing examples of information risks, e.g. underwriting concerns for term block
Areas where candidates did not perform well:
Not making any reference to the case study
Stating that risk depends on form of financing
Stating “correct/incorrect” or “true/false” without any supporting reasoning
Stating full allocation of capital among lines of business is feasible
Solution:
Validate each of the following statements based on Chew’s paper “Theory of Risk
Capital in Financial Firms” and explain how each statement applies in the context of
Simple Life or its holding company, Lyon Corporation:
(i) “Standard methods of accounting can fail to measure risk capital and its
associated costs correctly in the calculation of a company’s profitability,
resulting in an overstatement of profitability.”
Standard methods of accounting often fail to include gains or losses from
insurance along with gains and losses from all other assets when calculating
profitability
Omission of risk capital expended overstates profits when underlying assets
perform well and understates when assets perform poorly
From case study:
(a) Impact of risk capital is not clearly presented in current income statements
(b) Value of parental guarantees by Lyon to Simple Life is not reflected
(ii) “The amount of risk capital depends only on the riskiness of net assets and not at
all on the form of financing of net assets.”
Gross assets can be risky, but if they match the liabilities, the net assets are
riskless
Risk capital is independent of form of financing
Risk capital is value of guarantee that pays for any underperformance of assets
relative to investing net assets at risk-free rate
From case study:
(a) Simple Life looks to achieve some level of asset/liability matching
(including hedging) which would reduce amount of risk capital required
(b) More explicit determination of risk capital required to determine net assets

ILA LRM Fall 2014 Solutions Page 18
5. Continued
(iii) “The risk capital of a multi-business firm can be less than the aggregate risk
capital of the businesses on a standalone basis.”
When businesses are not perfectly correlated with one another, there will be a
diversification benefit
Risk capital will mirror the diversification
The businesses coinsure each other
From case study:
(a) Balance sheet from Simple Life shows both risk-based and economic
capital at parent level
(b) There is diversification from multiple companies and geographic locations
(iv) “The full allocation of risk capital across individual businesses of a multi-
business firm is not feasible.”
Full allocation of capital overstates the amount of marginal capital required
Risk capital evaluated on standalone basis overstates marginal capital required
Riskiness of net assets affected by correlations between business units
From case study:
(a) Risk calculated for each unit separately. Aggregate risk calculated using
correlation matrix based on prior 10 years of market movements.
Negative correlations floored at 0
(b) Lyon overall credit rating is BBB+. Rating reflects weakened capital
position from acquisition failure (A Health Company) offset by financial
success and niche position of A P&C Company
(v) “The true profitability of individual businesses can be significantly distorted by
the attempt to fully allocate the risk capital of a multi-line business.”
With diversification, businesses that appear unprofitable due to high risk
capital requirements on a standalone basis might appear profitable when
combined with business having offsetting risks
True profitability of businesses within multi-business firm will be distorted if
using standalone risk capital
Similar challenges occur even if using marginal risk capital
From case study:
(a) Current level of analysis does not support full allocation as diversification
benefits not attributable to lines of business
(b) Need better analysis of marginal risk capital
(c) Profitability by line not clear without reflecting correct capital
requirements

ILA LRM Fall 2014 Solutions Page 19
5. Continued
(vi) “The economic costs of risk capital to the firm are the spreads on the price of
asset insurance arising from information costs due to moral hazard or adverse
selection and agency costs.”
Expected profit should reflect economic cost of capital
Transacting is not costless: requires a spread over fair market value
Spreads are “deadweight” and arise from cost of economic risk capital
Spreads can be lowered by being more transparent in reporting, but can lead to
loss of competitive advantage
From case study:
(a) Surplus (net assets) allocated by line of business within general account
(b) Can only track spread costs at aggregate corporate level
(c) Lyon and Simple Life may not be able to provide level of detail required
to achieve greater transparency


