Fairness, Incentives, and Salience in the Demand for Redistribution Christina Fong Department of...
28
Fairness, Incentives, and Salience in the Demand for Redistribution Christina Fong Department of Social and Decision Sciences
-
date post
19-Dec-2015 -
Category
Documents
-
view
214 -
download
0
Transcript of Fairness, Incentives, and Salience in the Demand for Redistribution Christina Fong Department of...
Fairness, Incentives, and Salience in the Demand for Redistribution
Christina Fong
Department of Social and Decision Sciences

The Americans...are fond of explaining almost all the actions of their lives by the principle of self interest rightly understood; they show with complacency how an enlightened regard for themselves constantly prompts them to assist one another and inclines them willingly to sacrifice a portion of their time and property to the welfare of the state. In this respect I think they frequently fail to do themselves justice; in the United States as well as elsewhere people are sometimes seen to give way to those disinterested and spontaneous impulses that are natural to man; but the Americans seldom admit that they yield to emotions of this kind; they are more anxious to do honor to their philosophy than to themselves.
Alexis de Tocqueville Democracy in America (1835), Book II, chapter VII
Today’s Agenda
• Overview research on behavioral motives for public redistribution.
• Research is located at intersection of several enormous literatures on causes and consequences of social policy– Political history
– Public economics
– Public opinion, political psychology, behavioral economics

Motivation: Step Toward a Larger Goal
• Explain dramatic differences in the quantities of transfers across redistributive situations. – In 1995: Sweden spent 33% of GDP on social expenditures. U.S
spent under 16% . – Foreign aid expenditures roughly 10x greater in Northern Europe
than in U.S.– Dramatic and uneven growth of OECD public sectors since
WWII. • Sweden: General outlays 31% of GDP in 1960, 64.5% in 1985• US: General outlays 27% of GDP in 1960, 36.7% in 1985.
– 24% support spending on “welfare,” 64% support “assistance for the poor.”
– Charitable donations raised after Sept. 11.

Two Main Questions
• Why and to what extent do people care about others in various settings?
• Why and to what extent do people place the responsibility of social welfare in the hands of the public sector (governments) rather than the private sector (markets, communities, families)

Traditional Econ View: #1
• Selfish median voter– Median Y less than mean– Even if not, risk aversion creates insurance
motives
• Abundant, striking evidence against pure self-interest
• Consequence: much effort on the wrong questions

Traditional Econ View: #2• Simple altruism and variants
– A positive weight is placed on recipient’s utility from consumption, or utility from one’s own gift or transfer.
• Open question: to what extent does behavioral evidence contradict this?– Generosity may depend on perceptions of the poor, group
membership, social distance– Generosity may vary across situations, cultures, time
• If generosity is conditional and situation variant, traditional theories lose their power unless we can find simple, empirically & historically disciplined assumptions about:– Behavior– Institutional environment

Method• Establish a set of empirical regularities using sensitivity analysis
on different types of data• Begin with traditional model
U¹=(1-α)u(c2)+αu(c2)– Traditional assumption is that transfers made only from rich to poor, so
this is a form of inequality aversion • U¹ =u(cr)-α[u(cr)-u(cp)]
• Attempt to incorporate reasonable behavioral assumptions into this framework– Formulation of α.– Attention to beliefs, preferences, incentives, and constraints.
• Take history into account when deciding which variables to endogenize

Published Behavioral Effects• Americans support less redistribution if they think poor are lazy
rather than industrious but unlucky (Kluegel and Smith 1986)• Socioeconomic characteristics have surprisingly small effects
compared to “lazy poor” effects and “lazy poor” effect is not spurious (Fong 2001).
• Effect is widespread, occurs in several European countries and in different contexts (Bowles, Fong, Gintis Forthcoming).
• Americans exhibit racial group loyalty in their attitudes to redistribution (Luttmer 2001)
• Americans exhibit negative exposure effects if exposed to recipients with undesirable traits (Luttmer 2001)

“Lazy poor” effects are enormous
Figure 1.Estimated Probabilities for Four Categories of People
Full Sample (N = 2738)
0
0.1
0.2
0.3
0.4
0.5
0.6
1 2 3 4 5 6
Support for Redistribution
Est
imat
ed P
rob
abili
tiy
Believes in Luck
Believes in Effort
Low Socio-Econ Status
High Socio-Econ Status

Recent Findings
• Substantial amount of generosity that is not conditioned on beliefs about causes of income, group membership, or social proximity.– Substantial and VERY robust correlation between
domestic and foreign public generosity• In country-level expenditures• In individual-level attitudinal support• Individual sense of moral duty to help poor countries predicts
country level expenditures on domestic and foreign transfers
• Consistent with research on cultural traits (Hofstede 2001)

Country-level Expenditure DataDynamic models predicting Social Security Transfers (%GDP)
Naive LSDV First Difference FD2SLS
Independent Var. Coeff. (S.E.) Coeff. (S.E.) Coeff. (S.E.)
IVfor SSTRAN lag 0.108** (0.042)
ODA (%GDP) 6.295*** (0.678) 0.791 (0.811) 0.760 (0.828)
ODA (%GDP) lag 3.239*** (0.772) 3.398*** (0.786)
ODA (%GDP) lag2
Real GDPpc (1000s) -0.425*** (0.122) -1.221*** (0.155) -1.172*** (0.158)
Unemployment rate 32.915*** (3.982) 19.597*** (4.687) 23.716*** (5.001)
% pop. over 65 83.689*** (12.337)
Pop. (millions) 0.029 (0.017)
Open -0.038*** (0.009) -0.009 (0.009) -0.009 (0.009)
Open lag -0.000 (0.008) -0.004 (0.009)
Time 0.152*** (0.040)
R2 .9460 .3814 .3435
N 441 441 394
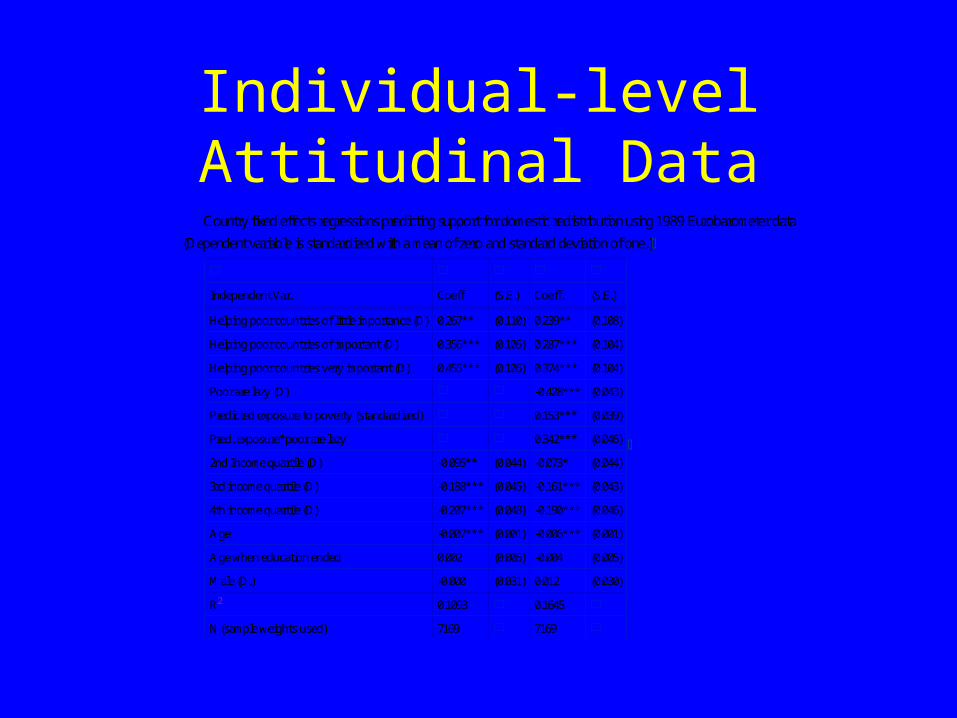
Individual-level Attitudinal DataCountry fixed effects regressions predicting support for domestic redistribution using 1989 Eurobarometer data
(Dependent variable is standardized with a mean of zero and standard deviation of one.)
Independent Var. Coeff (S.E.) Coeff. (S.E.)
Helping poor countries of little importance (D) 0.267** (0.110) 0.239** (0.108)
Helping poor countries of important (D) 0.356*** (0.105) 0.287*** (0.104)
Helping poor countries very important (D) 0.455*** (0.105) 0.374*** (0.104)
Poor are lazy (D) -0.428*** (0.043)
Predicted exposure to poverty (standardized) 0.153*** (0.039)
Pred. exposure*poor are lazy 0.342*** (0.046)
2nd Income quartile (D) -0.095** (0.044) -0.073* (0.044)
3rd income quartile (D) -0.188*** (0.045) -0.161*** (0.043)
4th income quartile (D) -0.207*** (0.048) -0.190*** (0.046)
Age -0.007*** (0.001) -0.006*** (0.001)
Age when education ended 0.002 (0.005) -0.004 (0.005)
Male (D.) -0.000 (0.031) 0.012 (0.030)
R2 0.1093 0.1645
N (sample weights used) 7169 7169

Substitution between public and private giving?
• Incentive for public giving: If transfers are private, people may free-ride on each other's altruism. Under-provision of transfers.
• Incentive for private giving: Taxes and public transfers involve incentive costs
• Survey results: People who have given to charity want more public redistribution but are more likely to live in countries that in fact spend less.
• More work on this in progress with Jörgen Weibull

Merged Expenditure and Attitudinal Data
Ordered Probit regressions predicting real ODA expendituresCoeff. S.E.
Has given to charity -0.253*** (0.028)
Moral duty to help 2 0.075 (0.064)
Moral duty to help 3 0.291*** (0.055)
Moral duty to help 4 0.355*** (0.058)
Age 0.004*** (0.001)
Male -0.030 (0.028)
Age when education ended 0.055*** (0.005)
N 7861
Note: Including income quartiles has no noticeable effect on the reported results but results in the loss of over 1300 observations.

Possible Modeling Approach
• α=f(C, A(êj),G(| i- j|+|êi- êj|)).
• ∂α/∂C>0, ∂α/∂A>0, ∂α/∂G<0.
• Can impose a shape consistent with idea that decision rules may change suddenly with the context (Loewenstein 2001)– α might be sigmoid shaped function of the
arguments
Issues!
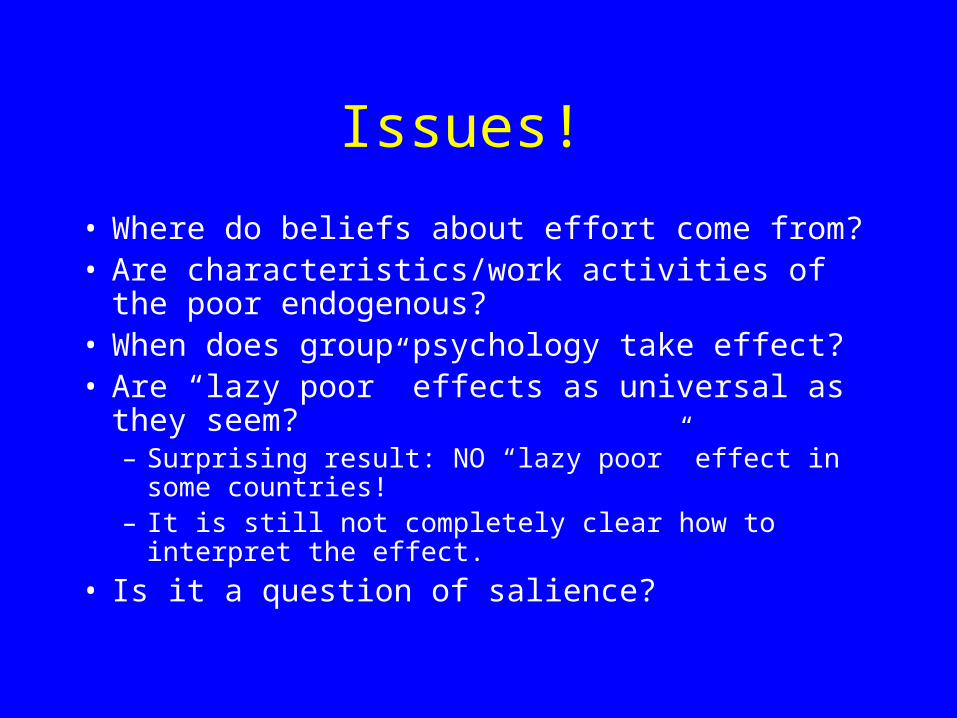
• Where do beliefs about effort come from?• Are characteristics/work activities of the poor
endogenous?• When does group psychology take effect?• Are “lazy poor” effects as universal as they seem?
– Surprising result: NO “lazy poor” effect in some countries!
– It is still not completely clear how to interpret the effect.
• Is it a question of salience?

Salience (What Follows is Work in
Progress!)
• Assumption: A individual’s attention is focused on a variable and the variable becomes salient when that person perceives a consequence to different values that the variable may take.

Stylized Fact
• Countries in which social expenditures are either in large part work promoting or in small part means tested have smaller “lazy poor” effects.

OECD Social Expenditures Data
• Old age pensions• Disability pensions• Occupational Injury and Disease• Sickness Benefits• Services for the Elderly and Disabled People• Survivors• Family cash benefits• Family services• Active labor market programs• Unemployment• Health• Housing• Other contingencies
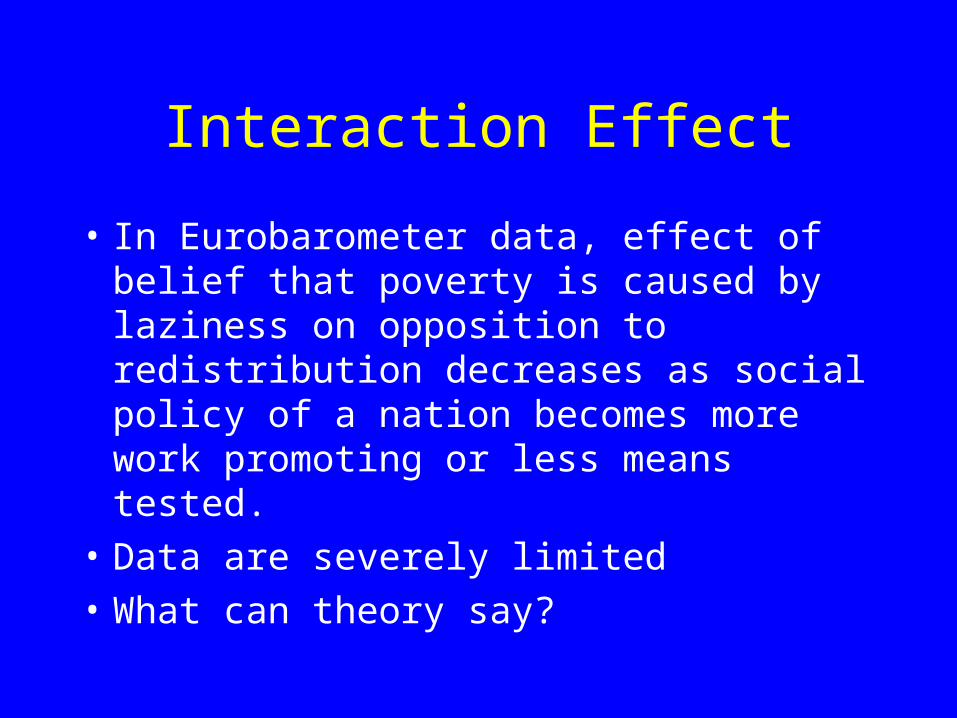
Interaction Effect
• In Eurobarometer data, effect of belief that poverty is caused by laziness on opposition to redistribution decreases as social policy of a nation becomes more work promoting or less means tested.
• Data are severely limited
• What can theory say?

Optimal Redistribution with Endog. Search Effort and Exog.
Work Requirements• People may either work and earn income in
private sector or take government transfer and meet certain work obligations of the social policy.
• Probability of not getting private sector job depends on luck and effort.
• Rich care about the poor

Two Steps
• Individuals choose job search effort given the tax/transfer rate and exogenously enforceable effort levels in social program and exogenous work norms in private sector alternative
• Taking the optimal effort function into account, individuals choose their preferred level of redistribution

Result
• Optimal redistribution increases in exogenously enforced effort.
• The effect of effort expended on optimal redistribution decreases as the exogenously enforceable effort increases.

Interpretation
• Incentive problems can focus attention on the disutility of effort and the labor market activities of the poor and make this a salient issue in redistributive politics.
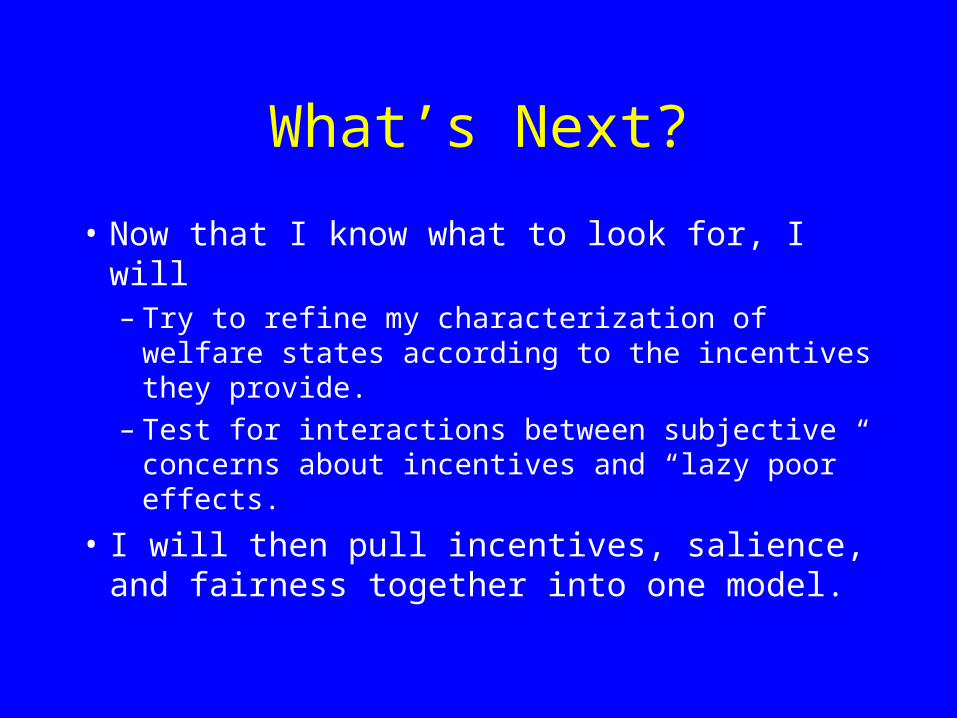
What’s Next?
• Now that I know what to look for, I will– Try to refine my characterization of welfare
states according to the incentives they provide. – Test for interactions between subjective
concerns about incentives and “lazy poor” effects.
• I will then pull incentives, salience, and fairness together into one model.

Summary
• In economics, trusted empirical regularities are often a constraining factor.
• Most of the progress in my research area has been empirical. Four important effects:
1. “Lazy poor” effects
2. Unconditional generosity
3. Racial group loyalty
4. Social distance/proximity

Summary, Con’t
• However, I have found that these effects are not universal.
• Under what conditions might the variables be salient and have effects on redistributive demands?
• I model incentive costs as the main consequence of “laziness” that tax payers may focus on in their decision over their optimal redistribution.
• This application area illustrates important functions of theory: to illuminate the variables and how they matter, and guide empirical investigation.