Compensation and Org Review Study - Fairfax County, Virginia
Fairfax County, Virginia
Chesapeake Bay TMDL
Action Plan
Final Approved by
Virginia DEQ
August 15, 2017
Permit No: VA0088587


TOC
Fairfax County Chesapeake Bay TMDL Action Plan
Final Approved by DEQ
August 15, 2017
Table of Contents
1. Introduction ................................................................................................................................... 1
1.1 Purpose................................................................................................................................ 1
1.2 Cooperative Approach to Implementation .......................................................................... 1
1.3 Summary of Required Reductions and Means and Methods to Achieve Required
Reductions .......................................................................................................................... 2
2. Program and Legal Authority .................................................................................................... 4
2.1 Current Program and Legal Authority ................................................................................ 4
2.2 Need for New or Modified Legal Authority ....................................................................... 4
3. Means and Methods to Address Discharges from New Sources ........................................... 4
4. Estimated Existing Source Loads and Calculated Total Pollutant of Concern (POC)
Required Reductions .................................................................................................................... 5
4.1 MS4 Service Area Delineation Methodology ..................................................................... 5
4.2 Pervious and Impervious Surface Delineation Methodology ............................................. 6
4.3 Estimated Existing Source Loads ....................................................................................... 8
4.4 Pollutant Reductions Required – First Permit Cycle .......................................................... 8
5. Means and Methods to Meet Required Reductions and Schedule ...................................... 10
5.1 Structural Retrofits for TMDL Compliance Beginning July 1, 2009 ............................... 10
5.2 Stream Restoration for TMDL Compliance Beginning July 1, 2009 ............................... 10
5.3 All Structural Facilities (Regulatory and Non-Regulatory) Between January 1, 2006
and June 30, 2009 ............................................................................................................. 11
5.4 Redevelopment to Meet Regulatory Criteria Beginning July 1, 2009 .............................. 11
5.5 More Stringent Water Quality Requirements for Single Family
Residential Development .................................................................................................. 12
5.6 In-Lake Forebay Retrofits ................................................................................................. 13
5.7 Septic Conversions ........................................................................................................... 14
Fairfax County Chesapeake Bay TMDL Action Plan
Final Approved by Virginia DEQ – August 15, 2017
TOC
5.8 Off-Site Pollutant Reduction Credits ................................................................................ 15
5.9 Nutrient Management Plans .............................................................................................. 15
5.10 Land Use Change .............................................................................................................. 15
5.11 Additional Means and Methods ........................................................................................ 15
5.12 Summary of Means and Methods ..................................................................................... 16
6. Means and Methods to Offset Increased Loads from New Sources Initiating
Construction Between July 1, 2009 and June 30, 2014 ......................................................... 17
7. Means and Methods to Offset Increased Loads from Grandfathered Projects Beginning
Construction After July 1, 2014 ................................................................................................ 19
8. List of Future Projects Qualifying as Grandfathered ........................................................... 19
9. Overall Compliance Ledger ...................................................................................................... 19
10. Estimated Cost of Compliance .................................................................................................. 20
11. Public Comments ........................................................................................................................ 21
Tables Table 1.A Summary of Means and Methods ............................................................................................... 2
Table 1.B Summary of Required Reductions and Means and Methods to Achieve Required Reductions . 3
Table 4.A Estimated Existing Source Loads ............................................................................................... 8
Table 4.B Required Reductions - First Permit Cycle ................................................................................... 9
Table 5.A Summary of Reductions from Structural Retrofits for TMDL Compliance
Beginning July 1, 2009 ............................................................................................................................... 10
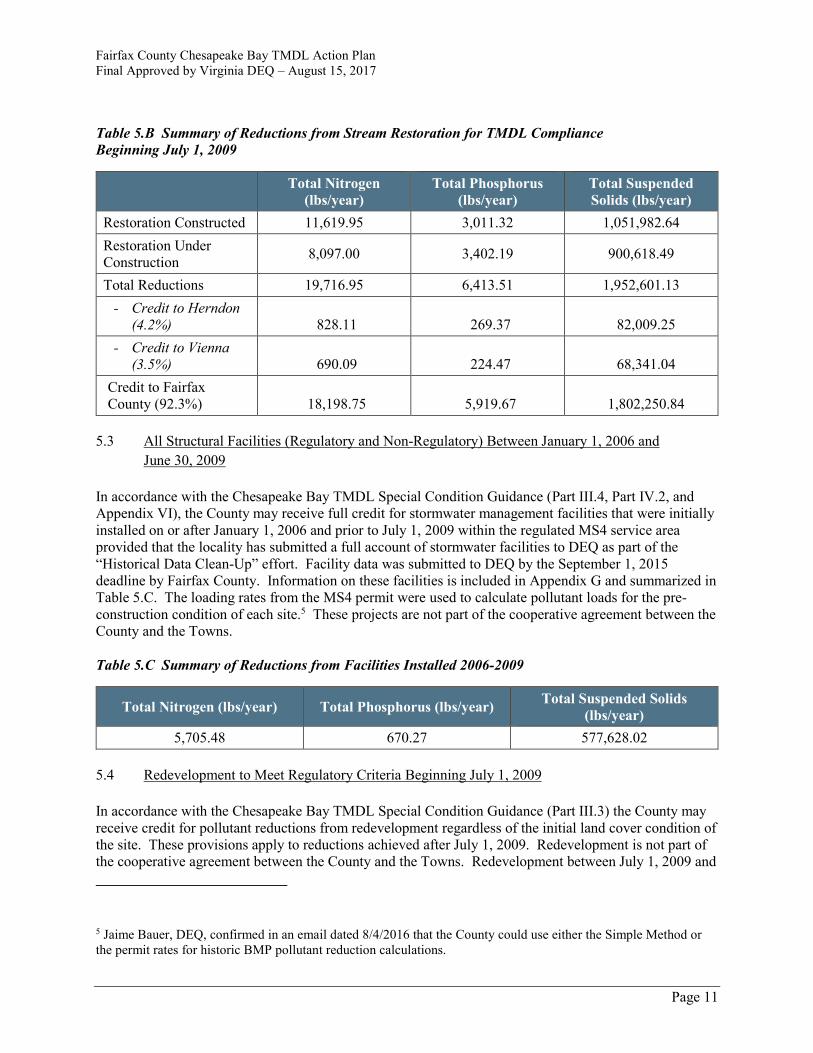
Table 5.B Summary of Reductions from Stream Restoration for TMDL Compliance
Beginning July 1, 2009 ............................................................................................................................... 11
Table 5.C Summary of Reductions from Facilities Installed 2006-2009 ................................................... 11
Table 5.D Summary of Reductions from Redevelopment ......................................................................... 12
Table 5.E Summary of Reductions from More Stringent Standards for Single Family Residential
Development ............................................................................................................................................... 13
Table 5.F Summary of Reductions from In-Lake Forebay Retrofits ......................................................... 14
Table 5.G Summary of Reductions from Septic Conversions ................................................................... 14
Table 5.H Summary of Reductions from Nutrient Management Plans ..................................................... 15
Table 5.I Summary of Reductions from Land Use Changes ..................................................................... 15
Table 5.J Summary of Means and Methods ............................................................................................... 16

Fairfax County Chesapeake Bay TMDL Action Plan
Final Approved by Virginia DEQ – August 15, 2017
TOC
Table 6.A New Sources Compliance Ledger ............................................................................................. 18
Table 7.A Required Reductions from Grandfathered Sources ................................................................... 19
Table 9.A Overall Compliance Ledger ...................................................................................................... 19
Table 10.A Estimated Cost of Compliance ................................................................................................ 21
Figures Figure 4.A MS4 Service Area ...................................................................................................................... 7
Appendices
Appendix A Permit Compliance Crosswalk
Appendix B Cooperative Agreement
Appendix C MS4 Program Plan Components Related to Meeting the Chesapeake Bay TMDL
Appendix D Active VPDES Industrial Stormwater Permit Holders
Appendix E Structural Retrofits for TMDL Compliance Beginning July 1, 2009
Appendix F Stream Restoration for TMDL Compliance Beginning July 1, 2009
Appendix G Facilities Installed Between January 1, 2006 and June 30, 2009
Appendix H Redevelopment Credit Beginning July 1, 2014
Appendix I More Stringent Water Quality Requirements for Single Family Residential Development
Beginning July 1, 2009
Appendix J In-Lake Forebay Retrofit Calculations
Appendix K List of Residential Septic Conversions and Commercial Septic Conversion Calculations
Appendix L Nutrient Management Plans Beginning July 1, 2009
Appendix M Land Use Changes Beginning July 1, 2009
Appendix N New Source Compliance Calculations
Appendix O Grandfathered Projects
Appendix P Public Comments

Fairfax County Chesapeake Bay TMDL Action Plan
Final Approved by Virginia DEQ – August 15, 2017
TOC
Page 1
Fairfax County Chesapeake Bay TMDL Action Plan
Final Approved by DEQ
August 15, 2017
1. Introduction
1.1 Purpose
A Total Maximum Daily Load (TMDL) for the Chesapeake Bay was established by the U.S.
Environmental Protection Agency in 2010. A TMDL establishes the maximum amount of a pollutant that
can enter a water body without violating water quality standards. Pollutants of concern (POCs) identified
for the Chesapeake Bay include total nitrogen (TN), total phosphorus (TP), and total suspended solids
(TSS). Virginia subsequently developed and adopted a Watershed Implementation Plan (WIP) that
establishes the framework for meeting the Chesapeake Bay TMDL. The Virginia WIP states that holders
of Municipal Separate Storm Sewer System (MS4) permits will implement a phased approach for meeting
required reductions over three five-year permit cycles based on the following schedule: 5% of required
reductions by the end of the first permit cycle; a total of 40% of required reductions by the end of the
second permit cycle; and, 100% of required reductions by the end of the third permit cycle.
This Chesapeake Bay TMDL Action Plan establishes how Fairfax County (County) will meet the 5%
reduction target in accordance with Part I.D.1 of the MS4 permit and the Chesapeake Bay TMDL Special
Condition Guidance developed by the Virginia Department of Environmental Quality (DEQ Guidance
Memo No 15-2005) dated May 18, 2015. Reductions in excess of 5% are applied to the next permit cycle
requirements.
Appendix A summarizes the requirements from the County’s MS4 permit and provides a crosswalk to the
specific sections where the requirements are addressed in this Chesapeake Bay TMDL Action Plan.
1.2 Cooperative Approach to Implementation
The County’s MS4 permit allows for “Establishment of a memorandum of understanding (MOU) with
other MS4 permittees that discharge to the same or adjacent eight digit hydrologic unit within the same
basin to implement BMPs collectively. The MOU shall include a mechanism for dividing the POC
reductions created by BMP implementation between the cooperative MS4s.”1 Based on this authority,
Fairfax County, the Town of Herndon, and the Town of Vienna (the Towns) have entered into such an
MOU. The MOU is included in Appendix B.
1 Section I.D.1.b)2)(c) of the County permit and Section I.C.2.b.(3) of the Towns permit.
Fairfax County Chesapeake Bay TMDL Action Plan
Final Approved by Virginia DEQ – August 15, 2017
Page 2
The MOU provides for the cooperating localities to receive joint credit for each stormwater management
facility or project funded through the County’s Stormwater Service District Fee and brought on-line
beginning July 1, 2009. The Stormwater Service District Fee is assessed in the County and the Towns.
Credit is provided regardless of the facility’s location within the cooperating localities and in proportion
to the percentage of the total load reductions that are established for each locality. Load reductions are
calculated for the County in Section 4 and for the Towns in their respective action plans. The proportion
of the load reduction for the Towns was averaged among TN, TP, and TSS. Based on this analysis, the
County and the Towns have agreed that Herndon and Vienna will respectively be credited 4.2% and 3.5%
of the pollutant reduction for each eligible stormwater facility. The County will be credited the remaining
92.3%.2 These proportions may change by mutual agreement based on a process established in the MOU.
Any changes will be reported in the annual reports to DEQ.
In addition to its cooperative agreement with the Towns, the County is currently negotiating a separate
MOU with Fairfax County Public Schools (FCPS) to define respective stormwater management roles and
responsibilities. As provided for in the County’s MS4 permit, DEQ will terminate the FCPS MS4 permit
if the MOU is approved by the County and FCPS. At that time, this plan will be updated to include the
loads for FCPS as well as means and methods implemented to that point.
1.3 Summary of Required Reductions and Means and Methods to Achieve Required Reductions
In accordance with the MS4 permit, the County must calculate reductions required from existing sources
as of June 30, 2009 (Section 4) and then calculate offsets to account for increases in pollutant loads due to
new sources initiating construction between July 1, 2009 and June 30, 2014 (Section 6) and grandfathered
projects beginning construction after July 1, 2014 (Section 7). The County must then identify the means
and methods to achieve the required POC reductions accordingly.
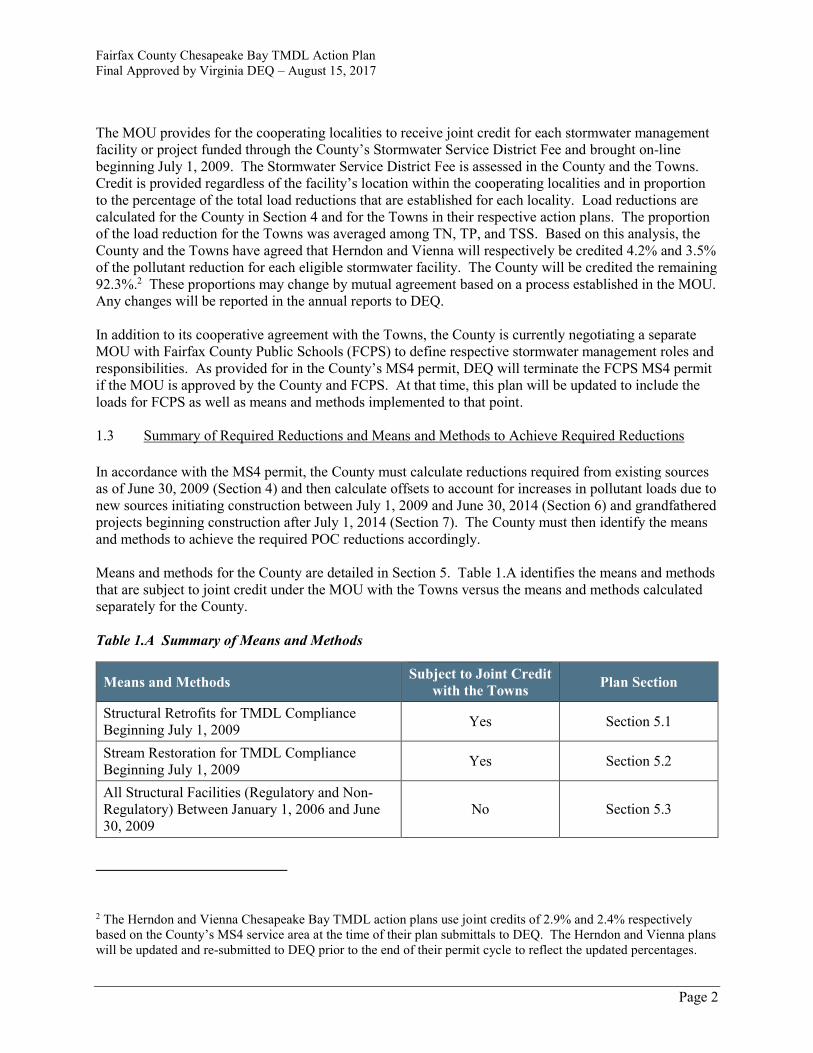
Means and methods for the County are detailed in Section 5. Table 1.A identifies the means and methods
that are subject to joint credit under the MOU with the Towns versus the means and methods calculated
separately for the County.
Table 1.A Summary of Means and Methods
Means and Methods Subject to Joint Credit
with the Towns Plan Section
Structural Retrofits for TMDL Compliance
Beginning July 1, 2009 Yes Section 5.1
Stream Restoration for TMDL Compliance
Beginning July 1, 2009 Yes Section 5.2
All Structural Facilities (Regulatory and Non-
Regulatory) Between January 1, 2006 and June
30, 2009
No Section 5.3
2 The Herndon and Vienna Chesapeake Bay TMDL action plans use joint credits of 2.9% and 2.4% respectively
based on the County’s MS4 service area at the time of their plan submittals to DEQ. The Herndon and Vienna plans
will be updated and re-submitted to DEQ prior to the end of their permit cycle to reflect the updated percentages.

Fairfax County Chesapeake Bay TMDL Action Plan
Final Approved by Virginia DEQ – August 15, 2017
Page 3
Means and Methods Subject to Joint Credit
with the Towns Plan Section
Redevelopment to Meet Regulatory Criteria
Beginning July 1, 2009 No Section 5.4
More Stringent Water Quality Requirements for
Single Family Residential Development No Section 5.5
In-Lake Forebay Retrofits Yes Section 5.6
Septic Conversion No Section 5.7
Off-Site Pollutant Reduction Credits No Section 5.8
Nutrient Management Plans No Section 5.9
Land Use Change No Section 5.10
Additional Means and Methods No Section 5.11
Table 1.B summarizes the required reductions from existing sources and how the County will achieve the
required reductions.
Table 1.B Summary of Required Reductions and Means and Methods to Achieve Required Reductions
Total Nitrogen
(lbs/year)
Total Phosphorus
(lbs/year)
Total Suspended
Solids (lbs/year)
Required Reductions from Existing
Sources 2,959.42 323.42 263,865.57
+ Required New Source Offsets3 -408.00 -229.82 -114,820.29
+ Required Grandfathered Offsets 56.27 8.11 3,727.09
= Total Required Reductions and
Offsets for Current Permit Cycle 2,607.69 101.71 152,772.37
- Means and Methods from
Section 5 38,343.95 7,561.63 3,231,537.49
= Reductions Remaining for Current
Permit Cycle -35,736.26 -7,459.92 -3,078,765.12
Credit Applied to Next Permit
Cycle 35,736.26 7,459.92 3,078,765.12
3 The assessment of new sources as defined in the MS4 permit yielded a net credit, rather than a required offset, for
TN, TP, and TSS. See Section 6 for a detailed explanation.
Fairfax County Chesapeake Bay TMDL Action Plan
Final Approved by Virginia DEQ – August 15, 2017
Page 4
2. Program and Legal Authority
2.1 Current Program and Legal Authority
The County has adopted an MS4 Program Plan that documents implementation of all MS4 permit
requirements, including the programmatic and legal authorities required to meet the “Special Condition
for the Chesapeake Bay TMDL.” The full MS4 Program Plan can be found at
http://www.fairfaxcounty.gov/dpwes/stormwater/ms4permit.htm. Appendix C provide a summary of
program plan elements implemented by the County that relate to controlling TN, TP, and TSS.
2.2 Need for New or Modified Legal Authority
After reviewing the existing MS4 Program Plans and the County’s legal authorities, the County finds that
no additional legal authorities are required for compliance with the “Special Condition for the Chesapeake
Bay TMDL.”
3. Means and Methods to Address Discharges from New Sources
The County must identify and implement the means and methods necessary to address discharges into the
MS4 from new sources. Any new source that disturbs one acre or greater and utilizes an average land
cover condition greater than 16% impervious cover for the design of post-development stormwater
management facilities must be offset.
Between July 1, 2009 and June 30, 2014, Fairfax County utilized the equivalent of an average land cover
condition of 18%. The County demonstrated no-net-increase above 18% through application of the
following: 40% phosphorus removal for new development County-wide; 50% phosphorus removal for
new development in the Water Supply Protection Overlay District (WSPOD); and, 10% phosphorus
removal for redevelopment County-wide. These reductions were required for all land uses, including
those under 18%, except that the County provided exemptions for large lot subdivisions (5-acre lots or
greater) and infill development (individual home construction, home additions, etc.) that did not create
more than 18% impervious cover. The 18% average impervious cover value and the County’s
methodology for achieving no-net-increase were accepted by the Chesapeake Bay Local Assistance Board
with their finding on August 19, 1993 that the County’s adopted program was consistent with the
Chesapeake Bay Preservation Area Designation and Management Regulations. The total offsets required
to be addressed by this plan for new development between July 1, 2009 and June 30, 2014 are further
discussed in Section 6.
The County adopted County Code Chapter 124, “Stormwater Management Ordinance,” effective July 1,
2014 to meet the requirements of the Virginia Stormwater Management Act (§62.1-44.15:24 et seq, Code
of Virginia), the Erosion and Sediment Control Act (§62.1-44.15:51 et seq, Code of Virginia), the
Chesapeake Bay Preservation Act (§62.1-44.15:67 et seq, Code of Virginia), and their attendant
regulations. In accordance with state requirements, all new development must meet a standard of 0.41
pounds of phosphorus per acre per year. All redevelopment must reduce the phosphorus load by 20% if
the land disturbance is one acre or greater or by 10% if the land disturbance is less than one acre (not to
exceed the 0.41 standard for new development). The standard of 0.41 pounds of phosphorus per acre per
year is mandated by the Virginia Stormwater Management Regulations, and according to DEQ’s guidance
meets the requirement for no-net-increase from new sources.
Fairfax County Chesapeake Bay TMDL Action Plan
Final Approved by Virginia DEQ – August 15, 2017
Page 5
In addition, the ordinance adopted by the County is more stringent than state minimum requirements for
single family residential development under one acre that is not part of a common plan of development.
The County may take credit for this more stringent regulation. See Section 5.5 for details.
4. Estimated Existing Source Loads and Calculated Total Pollutant of
Concern (POC) Required Reductions
The following sections describe the methodology used by the County to estimate existing POC source
loads. In accordance with the MS4 permit, the County must estimate the annual POC loads discharged
from existing sources as of June 30, 2009, based on the 2009 progress run. Completed calculation tables
from the permits are included in Table 4.A.
4.1 MS4 Service Area Delineation Methodology
The Fairfax County MS4 service area is defined in the permit as those areas draining to outfalls owned or
operated by the County that discharge to surface waters. Storm sewer system GIS data (including MS4
outfalls) was used in conjunction with hydrologic features, local topographic data, and high-resolution
aerial photos to delineate the MS4 boundaries and create MS4 boundary polygon layers. Artificial
conveyances and natural drainage features were thoroughly reviewed in a GIS environment by engineers
and planners in order to accurately account for storm sewer drainage areas and determine break points
between the manmade and natural hydrologic systems.
The County and the Towns have cooperatively agreed to utilize the following methodology for allocating
pollutant loadings where drainage flows across jurisdictional boundaries:
Any pollutant loading from an area of the Towns that drains through a pipe or other conveyance
to the County’s regulated system remains the responsibility of the Towns up-flow of the
interconnection.
Any pollutant loading from an area of the County that drains through a pipe or other conveyance
to the Towns’ regulated system remains the responsibility of the County up-flow of the
interconnection.
Any pollutant loading from an area of the Towns that sheet flows across jurisdictional boundaries
to the County’s regulated system remains the responsibility of the Towns within the Towns’
boundary.
Any pollutant loading from an area of the County that sheet flows across jurisdictional boundaries
to the Towns’ regulated system remains the responsibility of the County within the County’s
boundary.
In addition to the Towns, the County considered the following MS4 permit holders in the development of
its service area: Arlington County (VA0088579); City of Alexandria (VAR040057); City of Fairfax
(VAR040064); City of Falls Church (VAR040065); Loudoun County (VAR040067); U.S. Army – Fort
Belvoir (VAR040093); Northern Virginia Community College (VAR040095); Central Intelligence
Agency (VAR040101); George Mason University (VAR040106); George Washington Memorial
Parkway (VAR040111); Metropolitan Washington Airport Authority (VAR040120); U.S. Geological
Survey (VAR040126); and, Virginia Department of Transportation (VAR040115).

Fairfax County Chesapeake Bay TMDL Action Plan
Final Approved by Virginia DEQ – August 15, 2017
Page 6
VDOT provided in its VDOT Chesapeake Bay TMDL Action Plan approved by DEQ the following
description of its service area “…The VDOT MS4 service area includes VDOT right-of-way (ROW) and
property that is located within 2010 US Census Bureau urbanized areas in each of the four major river
basins of the Chesapeake Bay watershed.” These areas have been excluded from the County’s MS4
service area in accordance with DEQ’s Chesapeake Bay TMDL Special Guidance (Part II.2).4
In accordance with Part I.B.2.m)(5) of the MS4 permit, “The permittee shall coordinate with VDOT to
identify any areas within the permittee’s municipal boundaries that drain to the VDOT MS4 and are
unaccounted for in the Chesapeake Bay TMDL Action Plan developed by VDOT or the permittee. The
unaccounted areas shall be quantified (acres) in the Chesapeake Bay TMDL Action Plan submitted by the
permittee.” Fairfax County has calculated the area within the County’s geographic boundary draining to
VDOT outfalls but not included in the VDOT MS4 service area. This area totals 14,295.91 acres. The
spatial layer to support this calculation can be provided to DEQ on request.
Figure 4.A shows the County’s MS4 service area delineation. The County submitted a detailed MS4
service area to DEQ by the deadline of October 1, 2016 established in the MS4 permit.
Also in accordance with the DEQ guidance, the County has excluded from its MS4 service area land
regulated under any general VPDES permit that addresses industrial stormwater. VPDES industrial
stormwater permit holders located within the County MS4 area are listed in Appendix D.
Finally, the County may exclude forested land if it is contiguous, is a minimum of 900 square meters, and
meets other specific criteria. After a preliminary analysis, the County has opted not to exclude these areas
at this time, but reserves the right to do so in future updates to this plan.
4.2 Pervious and Impervious Surface Delineation Methodology
A GIS approach was used to determine the County’s regulated urban impervious and regulated urban
pervious acres. Planimetric impervious cover GIS data was developed by Fairfax County from 2009
aerial imagery. Impervious cover surfaces include buildings, roads, parking lots, sidewalks, recreational
surfaces, and other similar features.
To calculate the 2009 impervious regulated area, the 2009 planimetric impervious cover features were
clipped using the MS4 boundary polygon layers and the resulting acres were totaled. Regulated pervious
acres were calculated by subtracting the regulated impervious acres from the total MS4 acres.
4 This approach was confirmed in an email from Jaime Bauer, DEQ, on 9/20/2016. “DEQ staff believe that the
methodology used by VDOT to delineate their serve area is appropriate and has approved the first phase of the
VDOT Chesapeake Bay TMDL action plan based on that delineations. We anticipate VDOT will continue to use
this methodology in future action plans. As such, to avoid double counting MS4 permittees may exclude those lands
that VDOT has identified as being part of the VDOT service area.”

Fairfax County Chesapeake Bay TMDL Action Plan
Final Approved by Virginia DEQ – August 15, 2017
Page 7
Figure 4.A MS4 Service Area

Fairfax County Chesapeake Bay TMDL Action Plan
Final Approved by Virginia DEQ – August 15, 2017
Page 8
4.3 Estimated Existing Source Loads
The County must estimate the total existing source loads for TN, TP, and TSS as of June 30, 2009 based
on the 2009 Chesapeake Bay Model progress run and using 2009 Edge of Stream (EOS) loading rates.
Table 4.A present the estimated existing source loads for the County in accordance with the MS4 permit
and the Chesapeake Bay TMDL Special Conditions Guidance (Appendix I). This table is based on Table
1 “Calculation Sheet for Estimating Existing Source Loads for the Potomac River Basin” of the County’s
MS4 permit and represents the estimated existing pollutant loads from the County’s MS4.
Table 4.A Estimated Existing Source Loads
Source Pollutant
Total
Existing
Acres Served
by MS4
(6/30/09)
2009 EOS
Loading Rate
(lbs/acre/yr)
Estimated Total POC Load
Based on 2009 Progress Run
Regulated
Urban
Impervious Nitrogen
19,273 16.86 324,942.78
824,001.91 Regulated
Urban
Pervious
49,559 10.07 499,059.13
Regulated
Urban
Impervious Phosphorus
19,273 1.62 31,222.26
51,541.45 Regulated
Urban
Pervious
49,559 0.41 20,319.19
Regulated
Urban
Impervious Total
Suspended
Solids
19,273 1,171.32 22,574,850.36
31,287,322.56 Regulated
Urban
Pervious
49,559 175.8 8,712,472.20
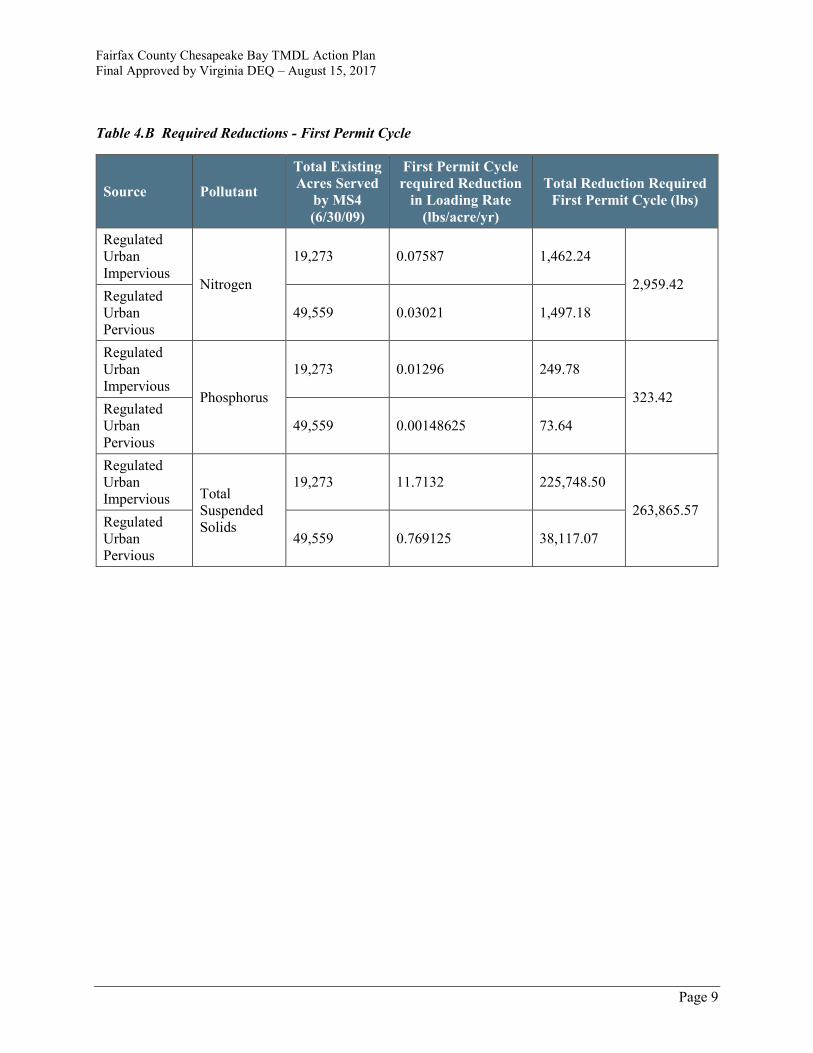
4.4 Pollutant Reductions Required – First Permit Cycle
The pollutant reductions required during this permit cycle are calculated using Table 2 “Calculation Sheet
for Determining Total POC Reductions Required During this State Permit Cycle for the Potomac River
Basin” of the MS4 permit. Loading rates have been corrected based on the Chesapeake Bay TMDL
Special Conditions Guidance (Appendix I). Table 4.B shows the completed calculations. These pollutant
reductions represent 5% of the total reductions required based on the 2009 Chesapeake Bay Model
progress run. They do not represent 5% of the total existing source loads in Table 4.A.
Fairfax County Chesapeake Bay TMDL Action Plan
Final Approved by Virginia DEQ – August 15, 2017
Page 9
Table 4.B Required Reductions - First Permit Cycle
Source Pollutant
Total Existing
Acres Served
by MS4
(6/30/09)
First Permit Cycle
required Reduction
in Loading Rate
(lbs/acre/yr)
Total Reduction Required
First Permit Cycle (lbs)
Regulated
Urban
Impervious Nitrogen
19,273 0.07587 1,462.24
2,959.42 Regulated
Urban
Pervious
49,559 0.03021 1,497.18
Regulated
Urban
Impervious Phosphorus
19,273 0.01296 249.78
323.42 Regulated
Urban
Pervious
49,559 0.00148625 73.64
Regulated
Urban
Impervious Total
Suspended
Solids
19,273 11.7132 225,748.50
263,865.57 Regulated
Urban
Pervious
49,559 0.769125 38,117.07
Fairfax County Chesapeake Bay TMDL Action Plan
Final Approved by Virginia DEQ – August 15, 2017
Page 10
5. Means and Methods to Meet Required Reductions and Schedule
This section describes the means and methods by which the County will achieve the 5% reduction
required for source loads in existence as of June 30, 2009 as calculated in Section 4. Means and methods
included in this plan are those completed or under-construction as of June 30, 2016 unless otherwise
stated. Additional means and methods after June 30, 2016 will be reported in the annual reports to DEQ.
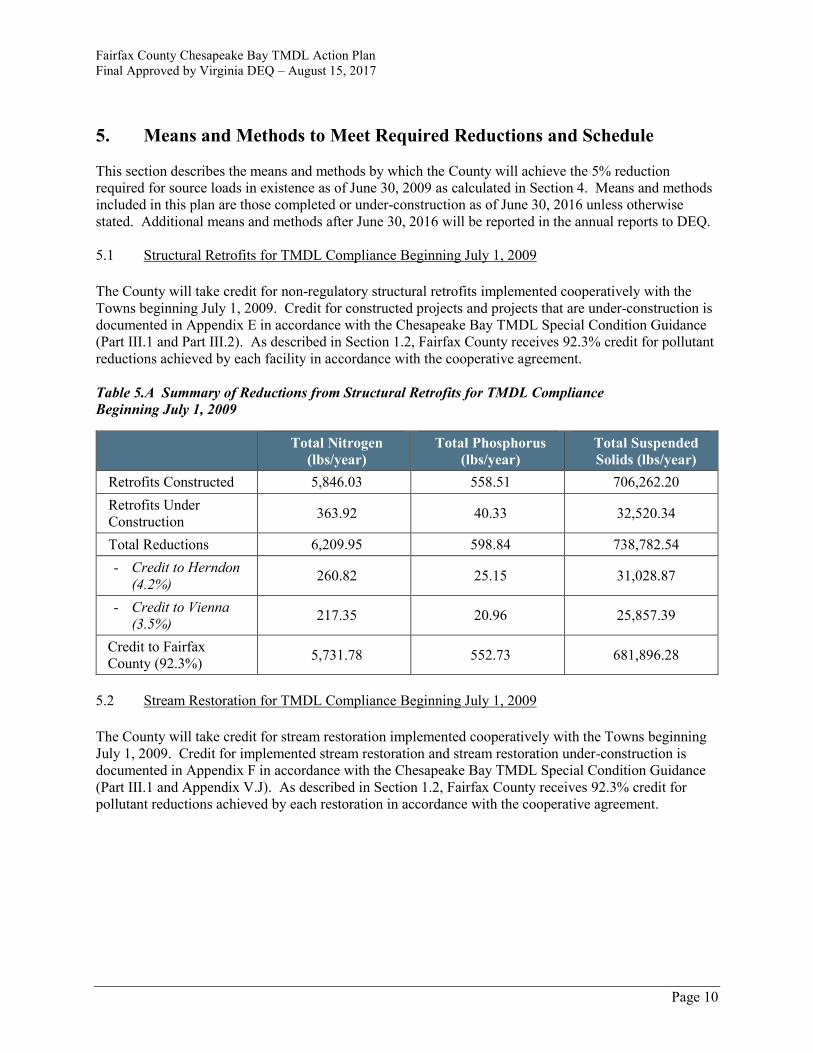
5.1 Structural Retrofits for TMDL Compliance Beginning July 1, 2009
The County will take credit for non-regulatory structural retrofits implemented cooperatively with the
Towns beginning July 1, 2009. Credit for constructed projects and projects that are under-construction is
documented in Appendix E in accordance with the Chesapeake Bay TMDL Special Condition Guidance
(Part III.1 and Part III.2). As described in Section 1.2, Fairfax County receives 92.3% credit for pollutant
reductions achieved by each facility in accordance with the cooperative agreement.
Table 5.A Summary of Reductions from Structural Retrofits for TMDL Compliance
Beginning July 1, 2009
Total Nitrogen
(lbs/year)
Total Phosphorus
(lbs/year)
Total Suspended
Solids (lbs/year)
Retrofits Constructed 5,846.03 558.51 706,262.20
Retrofits Under
Construction 363.92 40.33 32,520.34
Total Reductions 6,209.95 598.84 738,782.54
- Credit to Herndon
(4.2%) 260.82 25.15 31,028.87
- Credit to Vienna
(3.5%) 217.35 20.96 25,857.39
Credit to Fairfax
County (92.3%) 5,731.78 552.73 681,896.28
5.2 Stream Restoration for TMDL Compliance Beginning July 1, 2009
The County will take credit for stream restoration implemented cooperatively with the Towns beginning
July 1, 2009. Credit for implemented stream restoration and stream restoration under-construction is
documented in Appendix F in accordance with the Chesapeake Bay TMDL Special Condition Guidance
(Part III.1 and Appendix V.J). As described in Section 1.2, Fairfax County receives 92.3% credit for
pollutant reductions achieved by each restoration in accordance with the cooperative agreement.
Fairfax County Chesapeake Bay TMDL Action Plan
Final Approved by Virginia DEQ – August 15, 2017
Page 11
Table 5.B Summary of Reductions from Stream Restoration for TMDL Compliance
Beginning July 1, 2009
Total Nitrogen
(lbs/year)
Total Phosphorus
(lbs/year)
Total Suspended
Solids (lbs/year)
Restoration Constructed 11,619.95 3,011.32 1,051,982.64
Restoration Under
Construction 8,097.00 3,402.19 900,618.49
Total Reductions 19,716.95 6,413.51 1,952,601.13
- Credit to Herndon
(4.2%) 828.11 269.37 82,009.25
- Credit to Vienna
(3.5%) 690.09 224.47 68,341.04
Credit to Fairfax
County (92.3%) 18,198.75 5,919.67 1,802,250.84
5.3 All Structural Facilities (Regulatory and Non-Regulatory) Between January 1, 2006 and
June 30, 2009
In accordance with the Chesapeake Bay TMDL Special Condition Guidance (Part III.4, Part IV.2, and
Appendix VI), the County may receive full credit for stormwater management facilities that were initially
installed on or after January 1, 2006 and prior to July 1, 2009 within the regulated MS4 service area
provided that the locality has submitted a full account of stormwater facilities to DEQ as part of the
“Historical Data Clean-Up” effort. Facility data was submitted to DEQ by the September 1, 2015
deadline by Fairfax County. Information on these facilities is included in Appendix G and summarized in
Table 5.C. The loading rates from the MS4 permit were used to calculate pollutant loads for the pre-
construction condition of each site.5 These projects are not part of the cooperative agreement between the
County and the Towns.
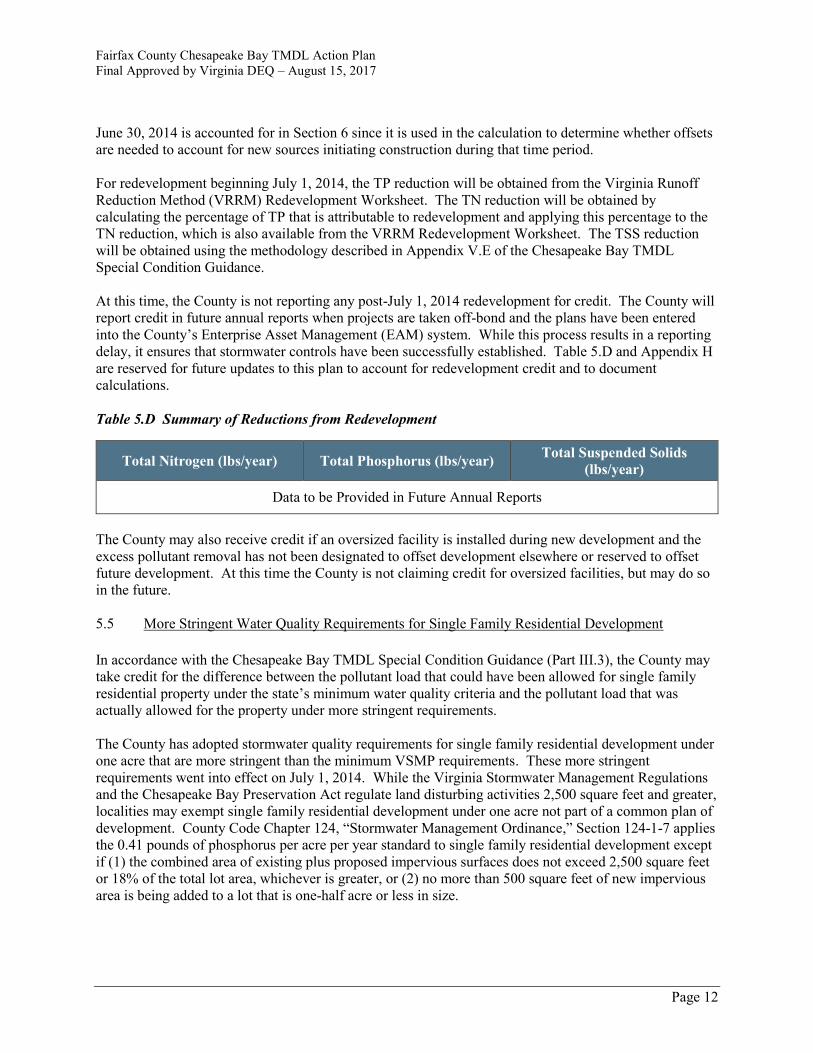
Table 5.C Summary of Reductions from Facilities Installed 2006-2009
Total Nitrogen (lbs/year) Total Phosphorus (lbs/year) Total Suspended Solids
(lbs/year)
5,705.48 670.27 577,628.02
5.4 Redevelopment to Meet Regulatory Criteria Beginning July 1, 2009
In accordance with the Chesapeake Bay TMDL Special Condition Guidance (Part III.3) the County may
receive credit for pollutant reductions from redevelopment regardless of the initial land cover condition of
the site. These provisions apply to reductions achieved after July 1, 2009. Redevelopment is not part of
the cooperative agreement between the County and the Towns. Redevelopment between July 1, 2009 and
5 Jaime Bauer, DEQ, confirmed in an email dated 8/4/2016 that the County could use either the Simple Method or
the permit rates for historic BMP pollutant reduction calculations.
Fairfax County Chesapeake Bay TMDL Action Plan
Final Approved by Virginia DEQ – August 15, 2017
Page 12
June 30, 2014 is accounted for in Section 6 since it is used in the calculation to determine whether offsets
are needed to account for new sources initiating construction during that time period.
For redevelopment beginning July 1, 2014, the TP reduction will be obtained from the Virginia Runoff
Reduction Method (VRRM) Redevelopment Worksheet. The TN reduction will be obtained by
calculating the percentage of TP that is attributable to redevelopment and applying this percentage to the
TN reduction, which is also available from the VRRM Redevelopment Worksheet. The TSS reduction
will be obtained using the methodology described in Appendix V.E of the Chesapeake Bay TMDL
Special Condition Guidance.
At this time, the County is not reporting any post-July 1, 2014 redevelopment for credit. The County will
report credit in future annual reports when projects are taken off-bond and the plans have been entered
into the County’s Enterprise Asset Management (EAM) system. While this process results in a reporting
delay, it ensures that stormwater controls have been successfully established. Table 5.D and Appendix H
are reserved for future updates to this plan to account for redevelopment credit and to document
calculations.
Table 5.D Summary of Reductions from Redevelopment
Total Nitrogen (lbs/year) Total Phosphorus (lbs/year) Total Suspended Solids
(lbs/year)
Data to be Provided in Future Annual Reports
The County may also receive credit if an oversized facility is installed during new development and the
excess pollutant removal has not been designated to offset development elsewhere or reserved to offset
future development. At this time the County is not claiming credit for oversized facilities, but may do so
in the future.
5.5 More Stringent Water Quality Requirements for Single Family Residential Development
In accordance with the Chesapeake Bay TMDL Special Condition Guidance (Part III.3), the County may
take credit for the difference between the pollutant load that could have been allowed for single family
residential property under the state’s minimum water quality criteria and the pollutant load that was
actually allowed for the property under more stringent requirements.
The County has adopted stormwater quality requirements for single family residential development under
one acre that are more stringent than the minimum VSMP requirements. These more stringent
requirements went into effect on July 1, 2014. While the Virginia Stormwater Management Regulations
and the Chesapeake Bay Preservation Act regulate land disturbing activities 2,500 square feet and greater,
localities may exempt single family residential development under one acre not part of a common plan of
development. County Code Chapter 124, “Stormwater Management Ordinance,” Section 124-1-7 applies
the 0.41 pounds of phosphorus per acre per year standard to single family residential development except
if (1) the combined area of existing plus proposed impervious surfaces does not exceed 2,500 square feet
or 18% of the total lot area, whichever is greater, or (2) no more than 500 square feet of new impervious
area is being added to a lot that is one-half acre or less in size.
Fairfax County Chesapeake Bay TMDL Action Plan
Final Approved by Virginia DEQ – August 15, 2017
Page 13
Similar to redevelopment in Section 5.4, the County is not reporting any post-July 1, 2014 more stringent
water quality requirements for credit. The County will report credit in future annual reports when
projects are taken off-bond and the plans have been entered into the County’s EAM system.
With regard to single family residential development under one acre between July 1, 2009 and June 30,
2014, the County’s water quality requirements did not exceed state minimum standards. However, the
County may take credit for development that results in a net decrease in pollutant loads. Since these
projects are under one acre, they are not included in the calculations in Section 6 to account for new
sources during this time period. To calculate credit, the County used the Simple Method to determine the
difference between pre- and post-development loads considering pre- and post-impervious surface area
and the removal efficiencies of implemented stormwater management facilities.
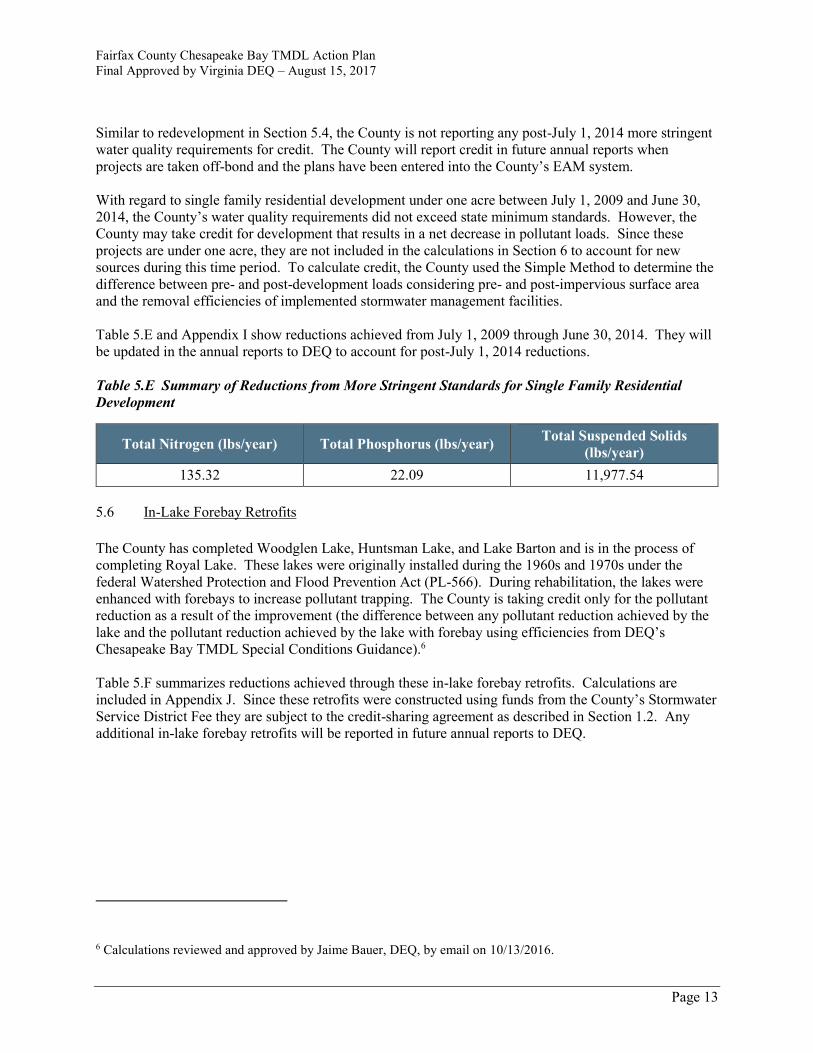
Table 5.E and Appendix I show reductions achieved from July 1, 2009 through June 30, 2014. They will
be updated in the annual reports to DEQ to account for post-July 1, 2014 reductions.
Table 5.E Summary of Reductions from More Stringent Standards for Single Family Residential
Development
Total Nitrogen (lbs/year) Total Phosphorus (lbs/year) Total Suspended Solids
(lbs/year)
135.32 22.09 11,977.54
5.6 In-Lake Forebay Retrofits
The County has completed Woodglen Lake, Huntsman Lake, and Lake Barton and is in the process of
completing Royal Lake. These lakes were originally installed during the 1960s and 1970s under the
federal Watershed Protection and Flood Prevention Act (PL-566). During rehabilitation, the lakes were
enhanced with forebays to increase pollutant trapping. The County is taking credit only for the pollutant
reduction as a result of the improvement (the difference between any pollutant reduction achieved by the
lake and the pollutant reduction achieved by the lake with forebay using efficiencies from DEQ’s
Chesapeake Bay TMDL Special Conditions Guidance).6
Table 5.F summarizes reductions achieved through these in-lake forebay retrofits. Calculations are
included in Appendix J. Since these retrofits were constructed using funds from the County’s Stormwater
Service District Fee they are subject to the credit-sharing agreement as described in Section 1.2. Any
additional in-lake forebay retrofits will be reported in future annual reports to DEQ.
6 Calculations reviewed and approved by Jaime Bauer, DEQ, by email on 10/13/2016.

Fairfax County Chesapeake Bay TMDL Action Plan
Final Approved by Virginia DEQ – August 15, 2017
Page 14
Table 5.F Summary of Reductions from In-Lake Forebay Retrofits
Total Nitrogen
(lbs/year)
Total Phosphorus
(lbs/year)
Total Suspended
Solids (lbs/year)
In-Lake Forebay
Retrofits Implemented 7,167.81 424.57 169,055.52
- Credit to Herndon
(4.2%) 301.05 17.83 7,100.33
- Credit to Vienna
(3.5%) 250.87 14.86 5,916.94
Credit to Fairfax
County (92.3%) 6,615.89 391.88 156,038.24
5.7 Septic Conversions
The County may take credit for the connection of septic systems to the sanitary sewer. Septic systems
must be located within the regulated MS4 service area and credit is only available for TN. In order to
calculate TN credit, the 2010 Census is used to determine the County’s average number of people per
household. The average is then multiplied by the TN edge of stream loading value of 3.6
lbs/TN/year/person. The average number of people per household for Fairfax County based on the 2010
Census is 2.80. The County has identified 179 residential households that converted from septic to
sanitary from January 1, 2006 (this includes one residential household that was replaced by a commercial
use).
The County also identified one commercial conversions for this time period. DEQ approved the County’s
formula for determining TN reduced per gallon.7 This per gallon reduction is then used on a site-by-site
basis for determining the reduction credit for a commercial conversion based on the approved septic
design by the Virginia Department of Health.
The list of residential conversions and the commercial septic conversion calculations are included in
Appendix K. The reduction credit for TN is calculated in Table 5.G.
Table 5.G Summary of Reductions from Septic Conversions
Type Number Avg HH TN (lbs/year)
Residential 179 2.8 1,804.32
Commercial 1 (see Appendix K) 2.53
Total 1,806.85
7 Email from Kelsey Brooks, DEQ, on 9/28/2016.
Fairfax County Chesapeake Bay TMDL Action Plan
Final Approved by Virginia DEQ – August 15, 2017
Page 15
5.8 Off-Site Pollutant Reduction Credits
The County has the option to acquire, use, and transfer nutrient and sediment credits under the Code of
Virginia (§62.1-44.19:21 and §62.1-44.19:21.1, respectively). The County does not propose to meet
reductions using these provisions as part of this plan. However, it reserves the right to acquire, use, and
transfer credits in the future.
5.9 Nutrient Management Plans
The County may take credit for nutrient management plans (NMPs) that are developed for land outside of
the regulated MS4 and for land inside of the regulated MS4 under one acre provided it is not a regulated
golf course. In accordance with the Chesapeake Bay TMDL Special Condition Guidance (Appendix
V.K), blended urban nutrient management removal rates of 9% and 4.5% are used for TN and TP
respectively. In addition, for NMPs outside of the regulated MS4, the County may only take credit for the
pounds of TN and TP addressed in the plan minus the 48% required by the Virginia WIP to meet baseline
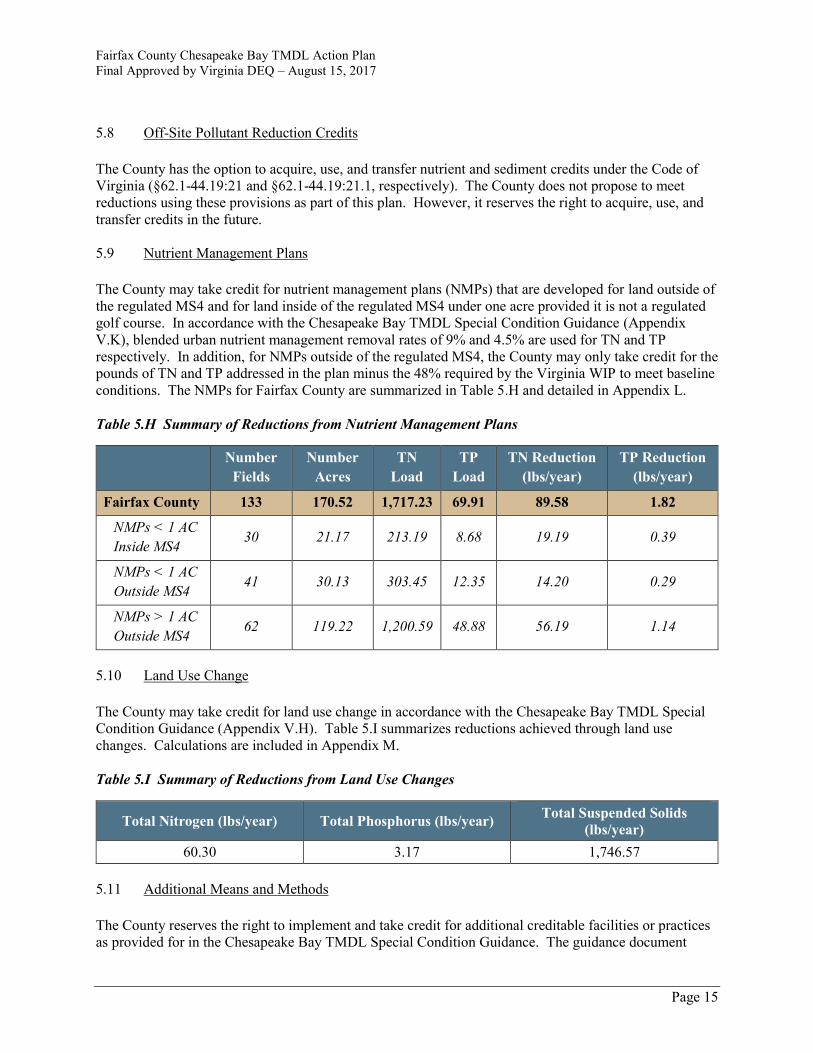
conditions. The NMPs for Fairfax County are summarized in Table 5.H and detailed in Appendix L.
Table 5.H Summary of Reductions from Nutrient Management Plans
Number
Fields
Number
Acres
TN
Load
TP
Load
TN Reduction
(lbs/year)
TP Reduction
(lbs/year)
Fairfax County 133 170.52 1,717.23 69.91 89.58 1.82
NMPs < 1 AC
Inside MS4 30 21.17 213.19 8.68 19.19 0.39
NMPs < 1 AC
Outside MS4 41 30.13 303.45 12.35 14.20 0.29
NMPs > 1 AC
Outside MS4 62 119.22 1,200.59 48.88 56.19 1.14
5.10 Land Use Change
The County may take credit for land use change in accordance with the Chesapeake Bay TMDL Special
Condition Guidance (Appendix V.H). Table 5.I summarizes reductions achieved through land use
changes. Calculations are included in Appendix M.
Table 5.I Summary of Reductions from Land Use Changes
Total Nitrogen (lbs/year) Total Phosphorus (lbs/year) Total Suspended Solids
(lbs/year)
60.30 3.17 1,746.57
5.11 Additional Means and Methods
The County reserves the right to implement and take credit for additional creditable facilities or practices
as provided for in the Chesapeake Bay TMDL Special Condition Guidance. The guidance document

Fairfax County Chesapeake Bay TMDL Action Plan
Final Approved by Virginia DEQ – August 15, 2017
Page 16
specifically references the work of the Chesapeake Bay Urban Stormwater Workgroup, which includes
credits for street sweeping and urban nutrient management and homeowner best management practices
such as rainwater harvesting, downspout disconnection, permeable hard-scapes, tree planting, and
impervious cover removal. Reductions achieved will be documented to DEQ in the annual reports.
5.12 Summary of Means and Methods
Table 5.J provides a summary of means and methods described in Sections 5.1 through 5.11. These
means and methods exceed the required reductions from Section 4 for each POC. Refer to Table 9.A for
the overall compliance ledger taking into account total reductions required and all means and methods.
Table 5.J Summary of Means and Methods
Item Source TN
(lbs/year)
TP
(lbs/year)
TSS
(lbs/year)
Structural Retrofits for
TMDL Compliance
Section 5.1;
Table 5.A 5,731.78 552.73 681,896.28
Stream Restoration for
TMDL Compliance
Section 5.2;
Table 5.B 18,198.75 5,919.67 1,802,250.84
All Structural Facilities
2006-2009
Section 5.3:
Table 5.C 5,705.48 670.27 577,628.02
Redevelopment Section 5.4;
Table 5.D 0.00 0.00 0.00
More Stringent Single
Family Residential
Standards
Section 5.5;
Table 5.E 135.32 22.09 11,977.54
In-Lake Forebay Retrofits Section 5.6;
Table 5.F 6,615.89 391.88 156,038.24
Septic Conversions Section 5.7;
Table 5.G 1,806.85 0.00 0.00
Off-Site Pollutant
Reduction Credits Section 5.8 0.00 0.00 0.00
Nutrient Management
Plans
Section 5.9;
Table 5.H 89.58 1.82 0.00
Land Use Change Section 5.10;
Table 5.I 60.30 3.17 1,746.57
Additional Means and
Measures Section 5.11 0.00 0.00 0.00
Total Means and
Methods
Sum Section
5.1 to
Section 5.11
38,343.95 7,561.63 3,231,537.49
Fairfax County Chesapeake Bay TMDL Action Plan
Final Approved by Virginia DEQ – August 15, 2017
Page 17
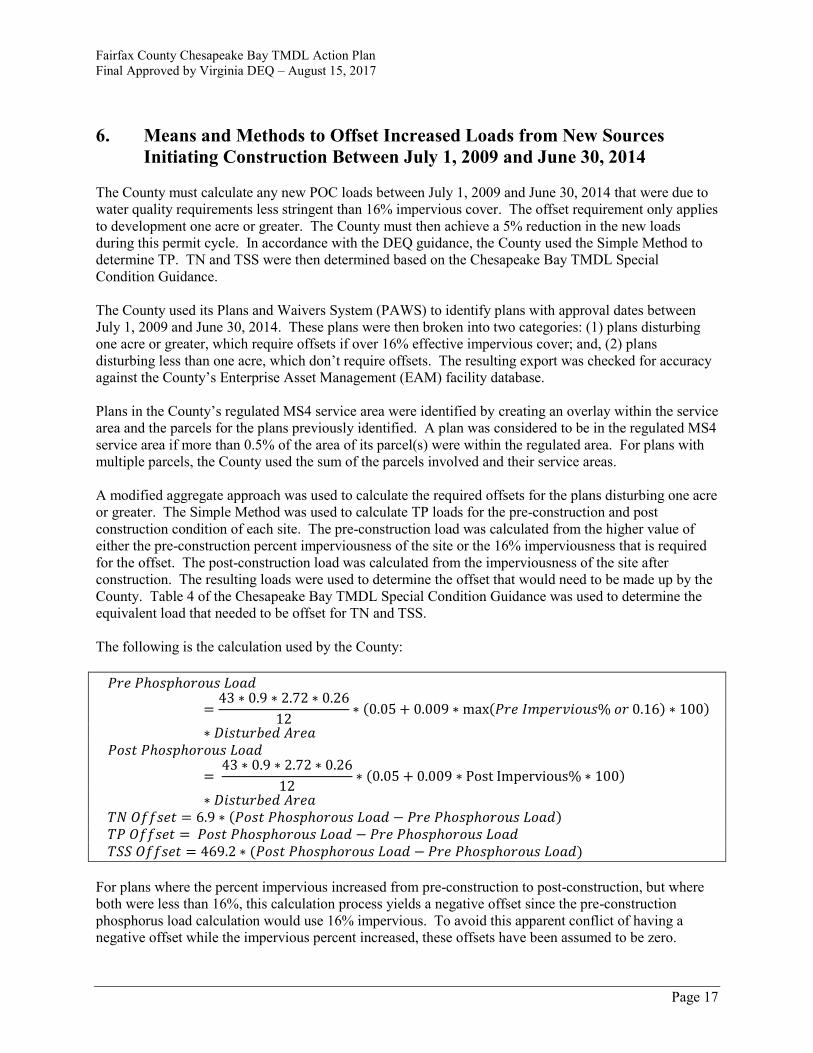
6. Means and Methods to Offset Increased Loads from New Sources
Initiating Construction Between July 1, 2009 and June 30, 2014
The County must calculate any new POC loads between July 1, 2009 and June 30, 2014 that were due to
water quality requirements less stringent than 16% impervious cover. The offset requirement only applies
to development one acre or greater. The County must then achieve a 5% reduction in the new loads
during this permit cycle. In accordance with the DEQ guidance, the County used the Simple Method to
determine TP. TN and TSS were then determined based on the Chesapeake Bay TMDL Special
Condition Guidance.
The County used its Plans and Waivers System (PAWS) to identify plans with approval dates between
July 1, 2009 and June 30, 2014. These plans were then broken into two categories: (1) plans disturbing
one acre or greater, which require offsets if over 16% effective impervious cover; and, (2) plans
disturbing less than one acre, which don’t require offsets. The resulting export was checked for accuracy
against the County’s Enterprise Asset Management (EAM) facility database.
Plans in the County’s regulated MS4 service area were identified by creating an overlay within the service
area and the parcels for the plans previously identified. A plan was considered to be in the regulated MS4
service area if more than 0.5% of the area of its parcel(s) were within the regulated area. For plans with
multiple parcels, the County used the sum of the parcels involved and their service areas.
A modified aggregate approach was used to calculate the required offsets for the plans disturbing one acre
or greater. The Simple Method was used to calculate TP loads for the pre-construction and post
construction condition of each site. The pre-construction load was calculated from the higher value of
either the pre-construction percent imperviousness of the site or the 16% imperviousness that is required
for the offset. The post-construction load was calculated from the imperviousness of the site after
construction. The resulting loads were used to determine the offset that would need to be made up by the
County. Table 4 of the Chesapeake Bay TMDL Special Condition Guidance was used to determine the
equivalent load that needed to be offset for TN and TSS.
The following is the calculation used by the County:
𝑃𝑟𝑒 𝑃ℎ𝑜𝑠𝑝ℎ𝑜𝑟𝑜𝑢𝑠 𝐿𝑜𝑎𝑑
=43 ∗ 0.9 ∗ 2.72 ∗ 0.26
12∗ (0.05 + 0.009 ∗ max(𝑃𝑟𝑒 𝐼𝑚𝑝𝑒𝑟𝑣𝑖𝑜𝑢𝑠% 𝑜𝑟 0.16) ∗ 100)
∗ 𝐷𝑖𝑠𝑡𝑢𝑟𝑏𝑒𝑑 𝐴𝑟𝑒𝑎
𝑃𝑜𝑠𝑡 𝑃ℎ𝑜𝑠𝑝ℎ𝑜𝑟𝑜𝑢𝑠 𝐿𝑜𝑎𝑑
= 43 ∗ 0.9 ∗ 2.72 ∗ 0.26
12∗ (0.05 + 0.009 ∗ Post Impervious% ∗ 100)
∗ 𝐷𝑖𝑠𝑡𝑢𝑟𝑏𝑒𝑑 𝐴𝑟𝑒𝑎
𝑇𝑁 𝑂𝑓𝑓𝑠𝑒𝑡 = 6.9 ∗ (𝑃𝑜𝑠𝑡 𝑃ℎ𝑜𝑠𝑝ℎ𝑜𝑟𝑜𝑢𝑠 𝐿𝑜𝑎𝑑 − 𝑃𝑟𝑒 𝑃ℎ𝑜𝑠𝑝ℎ𝑜𝑟𝑜𝑢𝑠 𝐿𝑜𝑎𝑑)
𝑇𝑃 𝑂𝑓𝑓𝑠𝑒𝑡 = 𝑃𝑜𝑠𝑡 𝑃ℎ𝑜𝑠𝑝ℎ𝑜𝑟𝑜𝑢𝑠 𝐿𝑜𝑎𝑑 − 𝑃𝑟𝑒 𝑃ℎ𝑜𝑠𝑝ℎ𝑜𝑟𝑜𝑢𝑠 𝐿𝑜𝑎𝑑
𝑇𝑆𝑆 𝑂𝑓𝑓𝑠𝑒𝑡 = 469.2 ∗ (𝑃𝑜𝑠𝑡 𝑃ℎ𝑜𝑠𝑝ℎ𝑜𝑟𝑜𝑢𝑠 𝐿𝑜𝑎𝑑 − 𝑃𝑟𝑒 𝑃ℎ𝑜𝑠𝑝ℎ𝑜𝑟𝑜𝑢𝑠 𝐿𝑜𝑎𝑑)
For plans where the percent impervious increased from pre-construction to post-construction, but where
both were less than 16%, this calculation process yields a negative offset since the pre-construction
phosphorus load calculation would use 16% impervious. To avoid this apparent conflict of having a
negative offset while the impervious percent increased, these offsets have been assumed to be zero.

Fairfax County Chesapeake Bay TMDL Action Plan
Final Approved by Virginia DEQ – August 15, 2017
Page 18
The offset calculated using the above equation does not consider the stormwater management facilities
installed to reduce the load coming from developed sites. As a result, the next step is to determine the
pollutant reduction provided by these practices. To be consistent with the calculation of offsets, pollutant
reduction credit was only taken for those facilities constructed with plans identified as being in the MS4
service area.
𝑇𝑁 𝐶𝑟𝑒𝑑𝑖𝑡 = 𝑇𝑁 𝐸𝑓𝑓𝑖𝑐𝑖𝑒𝑛𝑐𝑦 ∗43 ∗ 0.9 ∗ 2.72 ∗ 0.26 ∗ 6.9
12∗ (0.05 + 0.009 ∗ 𝐼𝑚𝑝𝑒𝑟𝑣𝑖𝑜𝑢𝑠% ∗ 100)
∗ 𝐴𝑟𝑒𝑎𝑇𝑟𝑒𝑎𝑡𝑒𝑑
𝑇𝑃 𝐶𝑟𝑒𝑑𝑖𝑡 = 𝑇𝑃 𝐸𝑓𝑓𝑖𝑐𝑖𝑒𝑛𝑐𝑦 ∗43 ∗ 0.9 ∗ 2.72 ∗ 0.26
12∗ (0.05 + 0.009 ∗ 𝐼𝑚𝑝𝑒𝑟𝑣𝑖𝑜𝑢𝑠% ∗ 100)
∗ 𝐴𝑟𝑒𝑎𝑇𝑟𝑒𝑎𝑡𝑒𝑑
𝑇𝑆𝑆 𝐶𝑟𝑒𝑑𝑖𝑡 = 𝑇𝑆𝑆 𝐸𝑓𝑓𝑖𝑐𝑖𝑒𝑛𝑐𝑦 ∗43 ∗ 0.9 ∗ 2.72 ∗ 0.26 ∗ 469.2
12∗ (0.05 + 0.009 ∗ 𝐼𝑚𝑝𝑒𝑟𝑣𝑖𝑜𝑢𝑠% ∗ 100) ∗ 𝐴𝑟𝑒𝑎𝑇𝑟𝑒𝑎𝑡𝑒𝑑
As shown in the calculations above, credit was calculated using the Simple Method for loading.
Efficiencies were determined on a facility type basis using efficiencies and design standards from Fairfax
County design standards or from DEQ when available. The Fairfax County design standards came from
either the Fairfax County Public Facilities Manual (PFM) or from Letters to Industry. If an efficiency
wasn’t directly available in the Fairfax County design standards or from DEQ, the Chesapeake Bay
Established Efficiencies were used or the efficiency was calculated using the Treated Depth required by
the PFM design standard for the facility type with the Chesapeake Bay Program Retrofits Expert Panel.
Manufactured Treatment Devices were credited using the PFM or DEQ efficiency for TP and assuming
one half inch treated depth8 using the Chesapeake Bay Program Retrofit Expert Panel.
The final step is to subtract the credit from implemented stormwater management practices from the
calculated offset. Rather than yielding a required net offset, this results in a net credit for TN, TP, and
TSS. A summary of this process is shown in Table 6.A. The detailed offset and credit calculations are
provided in Appendix N.
Table 6.A New Sources Compliance Ledger
Pollutant TN
(lbs/year)
TP
(lbs/year)
TSS
(lbs/year)
Increase from New
Impervious Cover 1,202.69 174.30 81,782.93
Reduction from
Stormwater Facilities 1,610.69 404.12 196,603.22
Net Reduction 408.00 229.82 114,820.29
8 As provided through email by Kelsey Brooks, DEQ, on 8/7/2015.
Fairfax County Chesapeake Bay TMDL Action Plan
Final Approved by Virginia DEQ – August 15, 2017
Page 19
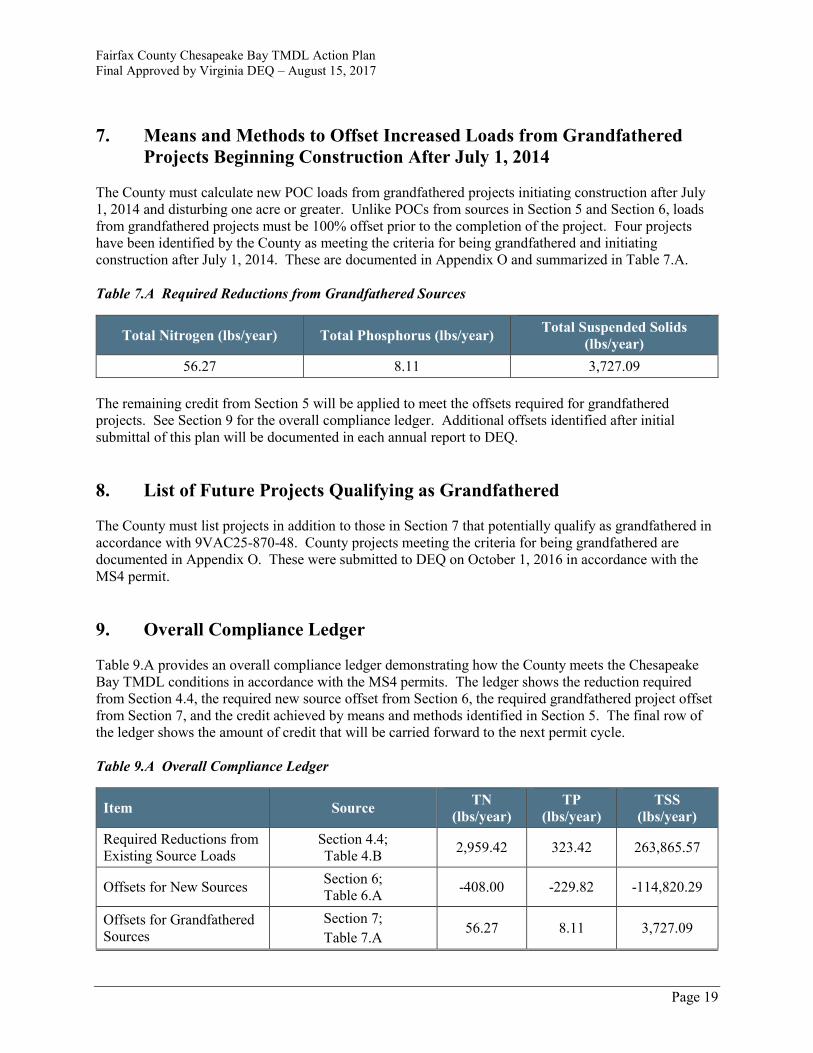
7. Means and Methods to Offset Increased Loads from Grandfathered
Projects Beginning Construction After July 1, 2014
The County must calculate new POC loads from grandfathered projects initiating construction after July
1, 2014 and disturbing one acre or greater. Unlike POCs from sources in Section 5 and Section 6, loads
from grandfathered projects must be 100% offset prior to the completion of the project. Four projects
have been identified by the County as meeting the criteria for being grandfathered and initiating
construction after July 1, 2014. These are documented in Appendix O and summarized in Table 7.A.
Table 7.A Required Reductions from Grandfathered Sources
Total Nitrogen (lbs/year) Total Phosphorus (lbs/year) Total Suspended Solids
(lbs/year)
56.27 8.11 3,727.09
The remaining credit from Section 5 will be applied to meet the offsets required for grandfathered
projects. See Section 9 for the overall compliance ledger. Additional offsets identified after initial
submittal of this plan will be documented in each annual report to DEQ.
8. List of Future Projects Qualifying as Grandfathered
The County must list projects in addition to those in Section 7 that potentially qualify as grandfathered in
accordance with 9VAC25-870-48. County projects meeting the criteria for being grandfathered are
documented in Appendix O. These were submitted to DEQ on October 1, 2016 in accordance with the
MS4 permit.
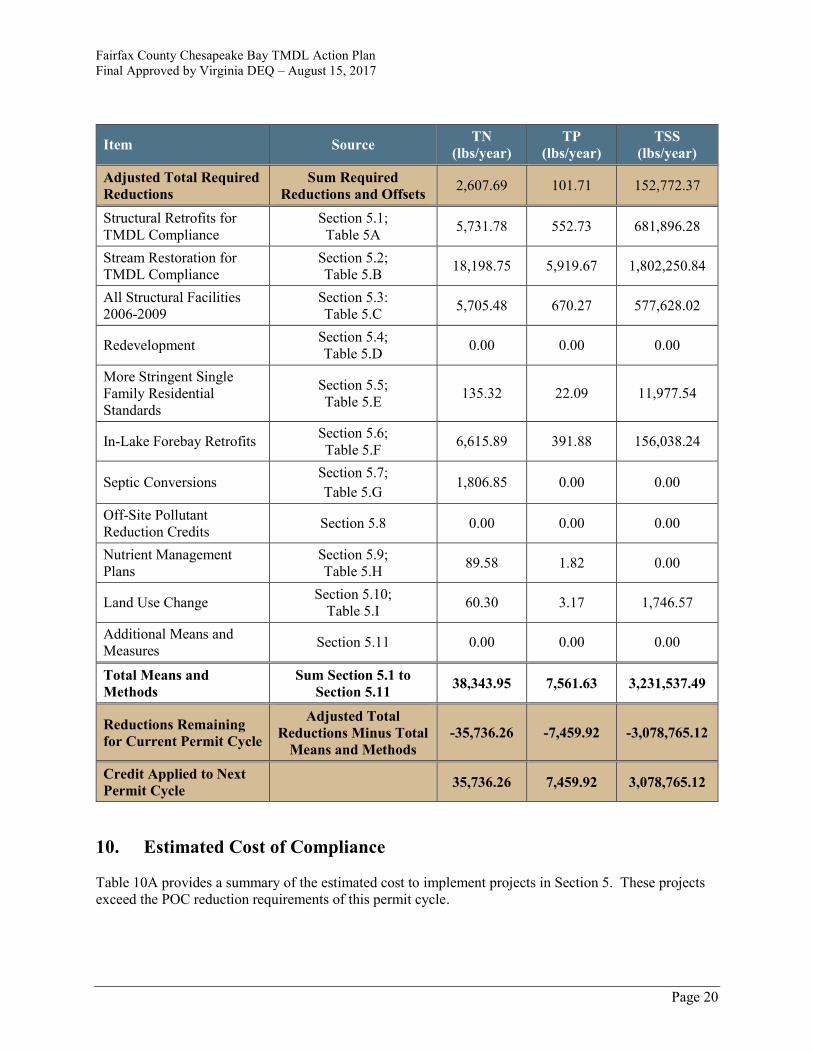
9. Overall Compliance Ledger
Table 9.A provides an overall compliance ledger demonstrating how the County meets the Chesapeake
Bay TMDL conditions in accordance with the MS4 permits. The ledger shows the reduction required
from Section 4.4, the required new source offset from Section 6, the required grandfathered project offset
from Section 7, and the credit achieved by means and methods identified in Section 5. The final row of
the ledger shows the amount of credit that will be carried forward to the next permit cycle.
Table 9.A Overall Compliance Ledger
Item Source TN
(lbs/year)
TP
(lbs/year)
TSS
(lbs/year)
Required Reductions from
Existing Source Loads
Section 4.4;
Table 4.B 2,959.42 323.42 263,865.57
Offsets for New Sources Section 6;
Table 6.A -408.00 -229.82 -114,820.29
Offsets for Grandfathered
Sources
Section 7;
Table 7.A 56.27 8.11 3,727.09
Fairfax County Chesapeake Bay TMDL Action Plan
Final Approved by Virginia DEQ – August 15, 2017
Page 20
Item Source TN
(lbs/year)
TP
(lbs/year)
TSS
(lbs/year)
Adjusted Total Required
Reductions
Sum Required
Reductions and Offsets 2,607.69 101.71 152,772.37
Structural Retrofits for
TMDL Compliance
Section 5.1;
Table 5A 5,731.78 552.73 681,896.28
Stream Restoration for
TMDL Compliance
Section 5.2;
Table 5.B 18,198.75 5,919.67 1,802,250.84
All Structural Facilities
2006-2009
Section 5.3:
Table 5.C 5,705.48 670.27 577,628.02
Redevelopment Section 5.4;
Table 5.D 0.00 0.00 0.00
More Stringent Single
Family Residential
Standards
Section 5.5;
Table 5.E 135.32 22.09 11,977.54
In-Lake Forebay Retrofits Section 5.6;
Table 5.F 6,615.89 391.88 156,038.24
Septic Conversions Section 5.7;
Table 5.G 1,806.85 0.00 0.00
Off-Site Pollutant
Reduction Credits Section 5.8 0.00 0.00 0.00
Nutrient Management
Plans
Section 5.9;
Table 5.H 89.58 1.82 0.00
Land Use Change Section 5.10;
Table 5.I 60.30 3.17 1,746.57
Additional Means and
Measures Section 5.11 0.00 0.00 0.00
Total Means and
Methods
Sum Section 5.1 to
Section 5.11 38,343.95 7,561.63 3,231,537.49
Reductions Remaining
for Current Permit Cycle
Adjusted Total
Reductions Minus Total
Means and Methods
-35,736.26 -7,459.92 -3,078,765.12
Credit Applied to Next
Permit Cycle 35,736.26 7,459.92 3,078,765.12
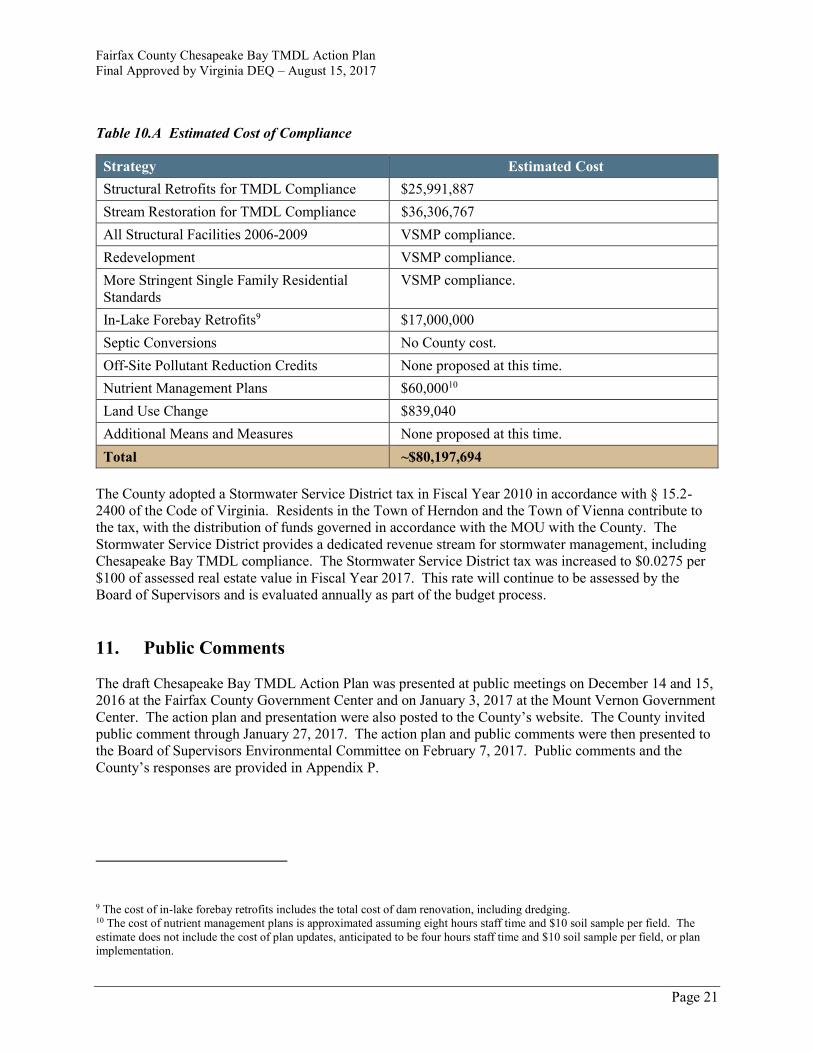
10. Estimated Cost of Compliance
Table 10A provides a summary of the estimated cost to implement projects in Section 5. These projects
exceed the POC reduction requirements of this permit cycle.
Fairfax County Chesapeake Bay TMDL Action Plan
Final Approved by Virginia DEQ – August 15, 2017
Page 21
Table 10.A Estimated Cost of Compliance
Strategy Estimated Cost
Structural Retrofits for TMDL Compliance $25,991,887
Stream Restoration for TMDL Compliance $36,306,767
All Structural Facilities 2006-2009 VSMP compliance.
Redevelopment VSMP compliance.
More Stringent Single Family Residential
Standards
VSMP compliance.
In-Lake Forebay Retrofits9 $17,000,000
Septic Conversions No County cost.
Off-Site Pollutant Reduction Credits None proposed at this time.
Nutrient Management Plans $60,00010
Land Use Change $839,040
Additional Means and Measures None proposed at this time.
Total ~$80,197,694
The County adopted a Stormwater Service District tax in Fiscal Year 2010 in accordance with § 15.2-
2400 of the Code of Virginia. Residents in the Town of Herndon and the Town of Vienna contribute to
the tax, with the distribution of funds governed in accordance with the MOU with the County. The
Stormwater Service District provides a dedicated revenue stream for stormwater management, including
Chesapeake Bay TMDL compliance. The Stormwater Service District tax was increased to $0.0275 per
$100 of assessed real estate value in Fiscal Year 2017. This rate will continue to be assessed by the
Board of Supervisors and is evaluated annually as part of the budget process.
11. Public Comments
The draft Chesapeake Bay TMDL Action Plan was presented at public meetings on December 14 and 15,
2016 at the Fairfax County Government Center and on January 3, 2017 at the Mount Vernon Government
Center. The action plan and presentation were also posted to the County’s website. The County invited
public comment through January 27, 2017. The action plan and public comments were then presented to
the Board of Supervisors Environmental Committee on February 7, 2017. Public comments and the
County’s responses are provided in Appendix P.
9 The cost of in-lake forebay retrofits includes the total cost of dam renovation, including dredging. 10 The cost of nutrient management plans is approximated assuming eight hours staff time and $10 soil sample per field. The
estimate does not include the cost of plan updates, anticipated to be four hours staff time and $10 soil sample per field, or plan
implementation.

Fairfax County Chesapeake Bay TMDL Action Plan
Final Approved by Virginia DEQ – August 15, 2017
Page 22
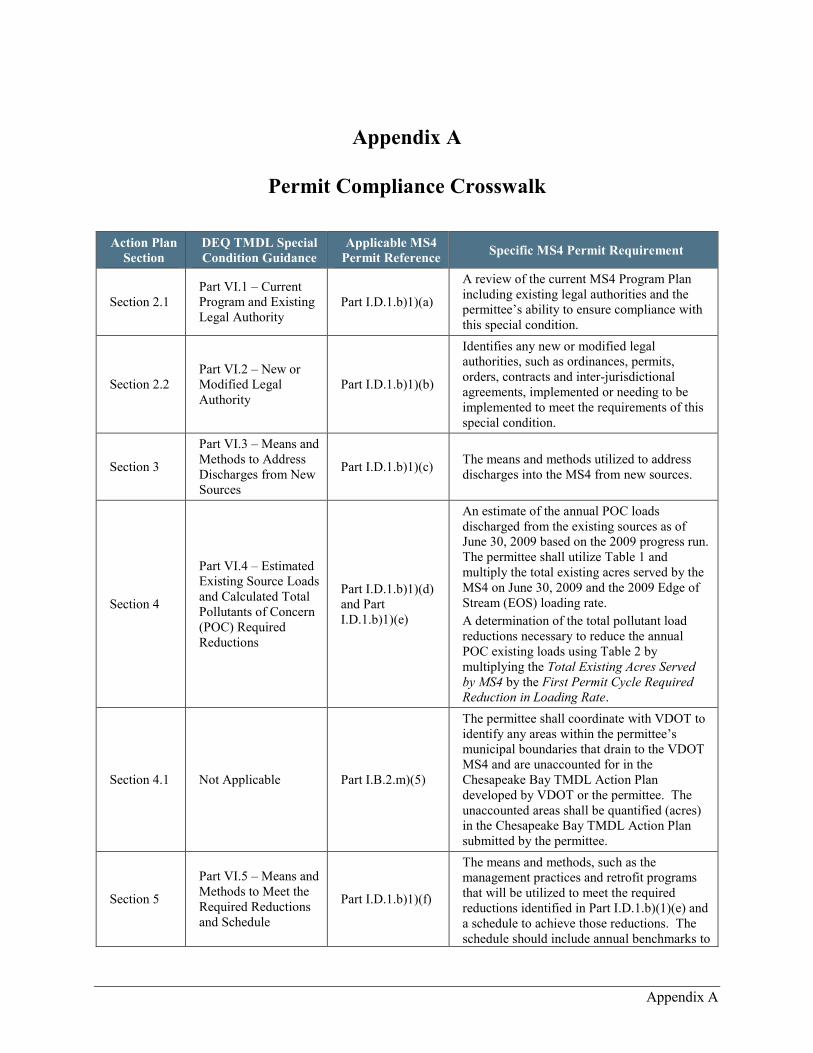
Appendix A
Appendix A
Permit Compliance Crosswalk
Action Plan
Section
DEQ TMDL Special
Condition Guidance
Applicable MS4
Permit Reference Specific MS4 Permit Requirement
Section 2.1
Part VI.1 – Current
Program and Existing
Legal Authority
Part I.D.1.b)1)(a)
A review of the current MS4 Program Plan
including existing legal authorities and the
permittee’s ability to ensure compliance with
this special condition.
Section 2.2
Part VI.2 – New or
Modified Legal
Authority
Part I.D.1.b)1)(b)
Identifies any new or modified legal
authorities, such as ordinances, permits,
orders, contracts and inter-jurisdictional
agreements, implemented or needing to be
implemented to meet the requirements of this
special condition.
Section 3
Part VI.3 – Means and
Methods to Address
Discharges from New
Sources
Part I.D.1.b)1)(c) The means and methods utilized to address
discharges into the MS4 from new sources.
Section 4
Part VI.4 – Estimated
Existing Source Loads
and Calculated Total
Pollutants of Concern
(POC) Required
Reductions
Part I.D.1.b)1)(d)
and Part
I.D.1.b)1)(e)
An estimate of the annual POC loads
discharged from the existing sources as of
June 30, 2009 based on the 2009 progress run.
The permittee shall utilize Table 1 and
multiply the total existing acres served by the
MS4 on June 30, 2009 and the 2009 Edge of
Stream (EOS) loading rate.
A determination of the total pollutant load
reductions necessary to reduce the annual
POC existing loads using Table 2 by
multiplying the Total Existing Acres Served
by MS4 by the First Permit Cycle Required
Reduction in Loading Rate.
Section 4.1 Not Applicable Part I.B.2.m)(5)
The permittee shall coordinate with VDOT to
identify any areas within the permittee’s
municipal boundaries that drain to the VDOT
MS4 and are unaccounted for in the
Chesapeake Bay TMDL Action Plan
developed by VDOT or the permittee. The
unaccounted areas shall be quantified (acres)
in the Chesapeake Bay TMDL Action Plan
submitted by the permittee.
Section 5
Part VI.5 – Means and
Methods to Meet the
Required Reductions
and Schedule
Part I.D.1.b)1)(f)
The means and methods, such as the
management practices and retrofit programs
that will be utilized to meet the required
reductions identified in Part I.D.1.b)(1)(e) and
a schedule to achieve those reductions. The
schedule should include annual benchmarks to

Appendix A
Action Plan
Section
DEQ TMDL Special
Condition Guidance
Applicable MS4
Permit Reference Specific MS4 Permit Requirement
demonstrate the on-going progress in meeting
the reductions.
Section 6
Part VI.6 – Means and
Methods to Offset
Increased Loads from
New Sources
Initiating Construction
between July 1, 2009
and June 30, 2014
Part I.D.1.b)1)(g)
The means and methods to offset the
increased loads from new sources initiating
construction between July 1, 2009 and June
30, 2014 that disturb one acre or greater as a
result of the utilization of an average land
cover condition greater than 16% impervious
cover for the design of post development
stormwater management facilities. The
permittee shall utilize Table 3 to develop the
equivalent pollutant load for nitrogen and total
suspended solids. The permittee shall offset
5% of the calculated increased load from
these new sources during the permit cycle.
Section 7
Part VI.7 – Means and
Methods to Offset
Increased Loads from
Grandfathered
Projects that Begin
Construction after
July 1, 2014
Part I.D.1.b)1)(h)
The means and methods to offset the
increased loads from grandfathered projects in
accordance with 9VAC25-870-48, that disturb
one acre or greater that begin construction
after July 1, 2014 where the project utilized an
average land cover condition greater than 16%
impervious cover in the design of post
development stormwater management
facilities. The permittee shall utilize Table 3
to develop the equivalent pollutant load for
nitrogen and total suspended solids.
Section 8
Part VI.8 – List of
Future Projects, and
Associated Acreage
that Qualify as
Grandfathered
Part I.D.1.b)1)(i)
A list of future projects and associated
acreage that qualify as grandfathered in
accordance with 9VAC25-870-48.
Section 9
Part VI.9 – Estimated
Expected Cost to
Implement Necessary
Reductions
Part I.D.1.b)1)(j)
An estimate of the expected cost to implement
the necessary reductions during the permit
cycle.
Section 10
Part VI.10.a&b –
Public Comments on
Draft Action Plan
Part I.D.1.b)1)(k)
and Part
I.D.1.b)1)(l)
An opportunity for receipt and consideration
of public comment on the draft Chesapeake
Bay TMDL Action Plan.
A list of all comments received as a result of
public comment and any modifications made
to the draft Chesapeake Bay TMDL Action
Plan as a result of the public comments.

Appendix B
Appendix B
Cooperative Agreement Between the Fairfax County Board of
Supervisors and the Towns of Herndon and Vienna
The cooperative agreement between the Fairfax County Board of Supervisors and the towns of Herndon
and Vienna is provided in this appendix.

Appendix B
COOPERATIVE AGREEMENT BETWEEN THE FAIRFAX COUNTY BOARD OF
SUPERVISORS, THE TOWN OF VIENNA, and TOWN OF HERNDON TO SHARE
CERTAIN STORMWATER SERVICE DISTRICT FEES AND RESPONSIBILITY FOR
RELATED SERVICES
This Agreement (“Agreement”) is entered into on this ____ day of ______, 2016, by and
between the BOARD OF SUPERVISORS OF FAIRFAX COUNTY, VIRGINIA (“FAIRFAX”),
the TOWN COUNCIL OF VIENNA, VIRGINIA (“VIENNA”), and the TOWN COUNCIL OF
HERNDON, VIRGINIA (“HERNDON”) (referenced collectively as the “Parties” or “the
Governing Bodies”, and individually as the “Party”).
WITNESSETH:
WHEREAS the Towns of Vienna and Herndon (also referenced herein as “the Towns”)
are located within Fairfax County (also referenced herein as “the County”); and
WHEREAS Fairfax County, the Town of Vienna, and the Town of Herndon each
maintain, operate, and improve stormwater systems that affect one another; and
WHEREAS Fairfax County and the Towns are each subject to a Municipal Separate
Storm Sewer System (“MS4”) permit issued by the Virginia Department of Environmental
Quality (“DEQ”); and
WHEREAS FAIRFAX has cooperated with VIENNA and HERNDON to maintain,
operate, and improve their respective stormwater systems and wish to continue such cooperation
in the future in the best interests of their residents; and
WHEREAS pursuant to Va. Code Ann. § 15.2-2400 (2012), FAIRFAX has established a
Stormwater Service District (“Service District”), and is authorized, pursuant to Va. Code Ann.
§ 15.2403(6) (Supp. 2016) to levy and collect an annual fee upon any property located within
such Service District (“the Service District Fee”); and
2
WHEREAS the Towns of Vienna and Herndon are located within Fairfax County’s
Service District; and
WHEREAS, pursuant to Va. Code Ann. § 15.2-2403(6), Fairfax County collects revenues
from properties located within the Towns of Vienna and Herndon; and
WHEREAS, pursuant to Va. Code Ann. § 15.2-2403.3 (Supp. 2016), by virtue of the
Towns’ maintenance of separate MS4 permits and their location within the Service District, the
Towns are entitled to the Service District Fee revenues collected by Fairfax County within their
respective jurisdictions; and
WHEREAS, the actual amount of revenues collected from the Service District Fee will
vary from year to year; and
WHEREAS, each MS4 permit, among other things, assigns jurisdiction-specific,
pollutant load reduction requirements for nitrogen, phosphorus, and sediment to address the
Chesapeake Bay Total Maximum Daily Load (referred to herein as “TMDL”), and requires each
MS4-permit jurisdiction to develop a Chesapeake Bay TMDL Action Plan that identifies the
practices, means, and methods that are to be implemented by the permittee to achieve the
required pollutant reductions; and
WHEREAS, the Commonwealth’s Chesapeake Bay TMDL Watershed Implementation
Plan (referred to herein as “the WIP”) establishes the total pollutant reduction loads required to
achieve the Chesapeake Bay TMDL and the timeframe for MS4-permit jurisdictions to achieve
their assigned pollutant reductions; and
WHEREAS, each MS4 permit also requires the development of action plans for other
pollutants where a TMDL assigns a wasteload allocation (“WLA”) to the permittee; and
3
WHEREAS, pursuant to their respective MS4 permits, the Towns submitted their initial
Chesapeake Bay TMDL Action Plans to DEQ prior to the deadline of October 1, 2015 while the
County’s initial Chesapeake Bay TMDL Action Plan will be submitted to DEQ prior to the
deadline of April 1, 2017. Action plans for other TMDLs are submitted in accordance with the
schedule contained in each MS4 permit; and
WHEREAS, while each MS4-permit jurisdiction is ultimately responsible for compliance
with its MS4 permit, MS4 permits allow and encourage cooperation and coordination among
permit holders, and such cooperation and coordination can mutually benefit MS4-permit
jurisdictions through more effective and cost-efficient protection of water resources in each
jurisdiction; and
WHEREAS, the purpose this Agreement, in part, is for the Parties to work cooperatively
to satisfy the pollutant load reduction requirements of their current and future MS4 permits by
implementing stormwater management practices within the Parties’ jurisdiction that reduce the
discharge of pollutants; and
WHEREAS, FAIRFAX, VIENNA, or HERNDON may terminate this Agreement as set
forth by the terms herein if, pursuant to applicable law, either locality chooses not to participate
under this Agreement or chooses not to share the Stormwater Service District Fees; and
WHEREAS FAIRFAX, VIENNA, and HERNDON have determined and agreed that the
best interests of each locality’s residents are fulfilled if FAIRFAX utilizes a portion of the
Service District Fees collected by FAIRFAX from properties within the Towns to assist the
Towns in maintaining, operating, and improving their respective stormwater systems to achieve
the goals of effective regional water quality improvement and local initiatives in these localities
and to satisfy certain MS4 permit requirements;
4
NOW, THEREFORE, in consideration of the mutual obligations set forth herein and
other good and valuable consideration, so long as FAIRFAX continues to administer the Service
District in FAIRFAX that encompasses VIENNA and HERNDON, and so long as VIENNA and
HERNDON qualify to receive the Service District Fees collected by FAIRFAX from properties
within the Towns, FAIRFAX, VIENNA, and HERNDON agree as follows:
1. FAIRFAX will continue to engage in a coordinated approach with VIENNA, and
HERNDON to maintain and operate their respective stormwater systems throughout the
incorporated and unincorporated parts of FAIRFAX. Moreover, FAIRFAX, VIENNA, and
HERNDON will engage in a coordinated approach for future improvements to their respective
stormwater systems.
2. This Agreement’s duration shall be for one fiscal year and shall renew at the
beginning of each fiscal year thereafter unless terminated pursuant to the terms set forth herein
below. For the purposes of this Agreement, “fiscal year” shall mean Fairfax County’s fiscal
year, which, at the time of the execution of this agreement, ends on June 30.
3. This Agreement’s purpose is to set forth how the Parties shall share revenues to
be collected pursuant to the Service District Fee, including revenues collected from properties
within VIENNA and HERNDON, and the respective obligations of the Parties with respect to
the stormwater management services described herein.
STORMWATER FEE REVENUE SHARING
4. FAIRFAX shall collect all revenues to be collected pursuant to the Service
District Fee, including revenues collected from properties within the Towns.
5. Revenues actually collected throughout the Service District are referred to herein
as “STORMWATER FEE REVENUES.”
5
6. At the end of each fiscal year, FAIRFAX shall calculate separately the total
amount of stormwater fee revenues that were actually collected from properties within VIENNA
and HERNDON from the amount of stormwater fee revenues collected elsewhere in FAIRFAX
(the “VIENNA STORMWATER FEE” and “HERNDON STORMWATER FEE”).
7. On or before October 30th of each fiscal year, FAIRFAX shall estimate the
anticipated VIENNA STORMWATER FEE and HERNDON STORMWATER FEE for that
year, and shall pay to VIENNA and HERNDON an amount equal to twenty-five percent (25%)
of the estimated VIENNA STORMWATER FEE and HERNDON STORMWATER FEE,
respectively, for that fiscal year, rounded to the nearest penny (the “PAID VIENNA
REVENUES” and “PAID HERNDON REVENUES”).
8. The Parties acknowledge and agree that PAID VIENNA REVENUES and/or
PAID HERNDON REVENUES may be more or less than the amount that is actually due and
owing to either or both of the Towns, and which amount is calculated at the end of each fiscal
year.
9. If the PAID VIENNA REVENUES for a particular fiscal year are determined to
have been less than 25% of the actual VIENNA STORMWATER FEE actually collected for that
fiscal year, then FAIRFAX shall pay VIENNA the difference between the PAID VIENNA
REVENUES and 25% of the VIENNA STORMWATER FEE actually collected for that fiscal
year. FAIRFAX shall pay this difference at the same time as it pays the next fiscal year’s PAID
VIENNA REVENUES.
10. If the PAID HERNDON REVENUES for a particular fiscal year are determined
to have been less than 25% of the actual stormwater fee actually collected for that fiscal year in
HERNDON, then FAIRFAX shall pay HERNDON the difference between the PAID
6
HERNDON REVENUES and 25% of the HERNDON STORMWATER FEE actually collected
for that fiscal year in HERNDON. FAIRFAX shall pay this difference at the same time as it
pays the next fiscal year’s PAID HERNDON REVENUES.
11. If the PAID VIENNA REVENUES for a particular fiscal year are determined to
have been more than 25% of the actual VIENNA STORMWATER FEE actually collected for
that fiscal year, then FAIRFAX shall deduct the difference between the PAID VIENNA
REVENUES and 25% of the VIENNA STORMWATER FEE actually collected for that fiscal
year from the amount that FAIRFAX pays for the next fiscal year’s PAID VIENNA
REVENUES.
12. If the PAID HERNDON REVENUES for a particular fiscal year are determined
to have been more than 25% of the actual HERNDON STORMWATER FEE actually collected
for that fiscal year, then FAIRFAX shall deduct the difference between the PAID HERNDON
REVENUES and 25% of the HERNDON STORMWATER FEE actually collected for that fiscal
year from the amount that FAIRFAX pays for the next fiscal year’s PAID HERNDON
REVENUES.
13. Once FAIRFAX has determined the amount of the actual VIENNA
STORMWATER FEE and HERNDON STORMWATER FEE, which shall occur within 90 days
of the fiscal year end, FAIRFAX shall forward the respective amounts to the Towns’ Mayors in
writing (“FINAL ACCOUNTING”). If VIENNA and/or HERNDON disputes the amount of the
FINAL ACCOUNTING, then within 30 days of the Mayors’ receipt of this FINAL
ACCOUNTING, VIENNA and/or HERNDON, shall state the complete factual basis for any
such dispute in writing to the Fairfax County Executive, and the Parties shall endeavor in good
faith to resolve any such dispute. Upon the resolution of any such dispute, or if VIENNA and/or

7
HERNDON fails to dispute the amount of the FINAL ACCOUNTING within 30 days of either
Mayor’s receipt thereof, then VIENNA and/or HERNDON shall be deemed to have accepted
payment of the respective fiscal year’s PAID VIENNA REVENUES or PAID HERNDON
REVENUES, which shall result in the waiver of any right to request from FAIRFAX any
additional amount of the collected STORMWATER FEE REVENUES. VIENNA’s and/or
HERNDON’s waiver of any such balance, however, is conditioned upon FAIRFAX’s
obligations to VIENNA and/or HERNDON pursuant to this Agreement.
14. Pursuant to Va. Code Ann. § 15.2-2403.3 VIENNA and HERNDON shall expend
the PAID VIENNA REVENUES and PAID HERNDON REVENUES, respectively, only for
costs directly related to the Towns’ stormwater systems and not for non-stormwater-system
costs, such as public safety, schools, or road maintenance.
15. Under this Agreement, neither VIENNA nor HERNDON is required to expend
any of the paid revenues within any specific amount of time. This Agreement does not affect any
other authority that VIENNA or HERNDON might have to carry over revenues from year-to-
year or to expend revenues in one fiscal year when the revenues were collected in a previous
fiscal year.
16. If, at any time in the future, either VIENNA or HERNDON becomes
unincorporated or ceases to qualify to receive paid revenues for any reason or terminates its
stormwater program or ceases to maintain its stormwater systems, none of the previously paid
revenues shall be expended for anything other than the maintenance, operation, and improvement
of such Town’s stormwater systems. If any such amounts are returned to FAIRFAX they may be
used for other qualified uses in the Service District as FAIRFAX, or its designee, in its or his
sole discretion, deems appropriate.

8
TMDL COMPLIANCE AND THE TMDL ADVISORY COMMITTEE
17. Fairfax, Vienna, and Herndon agree that Fairfax will implement stormwater
management practices throughout the County and in the Towns sufficient to achieve the TMDL
pollutant load reduction requirements that are incorporated into each Party’s respective current
and future MS4 permit.
18. A TMDL Compliance Advisory Committee (hereinafter referred to as the
“Advisory Committee”) shall be established and shall be comprised of one or more
representatives from each governing body.
19. Regardless of the number of representatives appointed by each governing body,
each locality will have one vote on the Advisory Committee.
20. The Advisory Committee shall:
a. establish, pursuant to each Party’s respective MS4 permit, the nitrogen,
phosphorus, and sediment (referred to as “pollutants of concern” or “POCs”) load
reductions necessary for each individual Party to achieve full compliance with the
Chesapeake Bay TMDL and the WIP (referred to herein as “the Chesapeake Bay
TMDL Endpoint”).
b. establish the “TOTAL POLLUTANT REDUCTION,” which is the total amount
of each POC that the Parties must reduce in order to reach the Chesapeake Bay
TMDL Endpoint.
c. establish the percentage of the TOTAL POLLUTANT REDUCTION for which
each locality is responsible. That percentage assigned to each Party shall
hereinafter be referred to, respectively, as the “FAIRFAX PERCENTAGE,”
“VIENNA PERCENTAGE,” and “HERNDON PERCENTAGE.”

9
d. as determined by the Advisory Committee, the FAIRFAX PERCENTAGE,
VIENNA PERCENTAGE, and the HERNDON PERCENTAGE may be
established for each POC, an average of POCs, or by another mutually agreed
upon methodology that will allocate pollutant reduction credits for projects
completed under this Agreement as provided for in paragraph 27 below, in a
manner necessary to meet the Chesapeake Bay TMDL Endpoint.
e. establish a watershed-specific FAIRFAX PERCENTAGE, VIENNA
PERCENTAGE, and HERNDON PERCENTAGE to allocate pollutant reduction
credits for projects implemented within a watershed to meet a non-Chesapeake
Bay TMDL Endpoint.
21. VIENNA and HERNDON may at any time provide FAIRFAX with a list of
stormwater management projects to be considered for implementation. Before submitting any
such project, the submitting Town must thoroughly investigate and analyze each project to
ensure that any such project is feasible. Any project submitted before June 30 of each year will
be considered by FAIRFAX for implementation during the following fiscal year. If a project is
not implemented, it will continue to be considered for implementation in subsequent fiscal years
until such time that the project is determined to be infeasible. Selection of projects for
implementation and determination of final feasibility are at the sole discretion of the Director of
the Fairfax County Department of Public Works and Environmental Services (“Director”).
22. By April 1 of each year, the Director will send to the Towns of VIENNA and
HERNDON and/or their designees a proposed list of projects within their jurisdiction.
23. Within 30 days after each Mayors’ receipt of this list, the Towns shall provide
comments and suggestions regarding each project, its timing, and its costs for implementation,

10
lifetime maintenance, and replacement. If the Towns provide any comments or suggestions, the
Director shall fully consider any such comments, and may, but shall not be obligated to
implement or adhere to them. In the event that a dispute exists regarding implementation of any
project on the list sent by the Director, the Director and the disputing Town shall endeavor in
good faith to resolve any such dispute, but final authority for the implementation of any such
projects rests solely with Fairfax County and the Director.
24. FAIRFAX will pay for the development of the updated Chesapeake Bay TMDL
Action Plan for each Town that is due at the beginning of each new MS4 permit cycle. Each
Town will be responsible for routine annual updates as required in the MS4 permits. FAIRFAX
will also pay for the initial development of other TMDL action plans necessary for compliance
with each Town’s MS4 permit and any substantial updates to these action plans required in
future permit cycles. The action plans will include all information necessary to demonstrate
compliance with MS4 permit requirements. Changes or additions to projects identified in the
action plans will be reported to each Town annually in accordance with paragraph 31.
25. FAIRFAX shall be solely responsible for implementing projects under this
Agreement, excluding the acquisition of any permanent or temporary land rights necessary to
construct and maintain a project located within a Town. The Parties may, as necessary, have
agreements that are separate from this Agreement that address the Parties’ responsibilities over
specific projects, facilities, and other funding.
26. A project is subject to this Agreement if it is funded in whole or in part by the
Service District Fee and substantially completed on or after July 1, 2009.
27. For each project substantially completed under this Agreement on or after July 1,
2009, whether the project or facility is located within VIENNA, HERNDON, or elsewhere

11
within Fairfax County, the Parties will receive a pollutant reduction credit for each POC. The
reduction credit is determined by applying the VIENNA PERCENTAGE and the HERNDON
PERCENTAGE to the estimated total POC load reductions for each project that is substantially
completed pursuant to this Agreement (the “VIENNA CREDIT,” “HERNDON CREDIT,”
“FAIRFAX CREDIT,” and collectively “REDUCTION CREDITS”). For completed projects
and facilities, the REDUCTION CREDITS shall survive any termination of this Agreement
provided that the functionality and performance of completed projects are maintained as
designed by the jurisdiction in which the project is constructed, unless otherwise agreed to by the
Parties.
28. The Party in whose jurisdiction any stormwater management facility or
improvement is constructed under this Agreement shall ensure that the long-term maintenance of
such facility or improvement is performed as necessary to maintain the functionality and
performance thereof. Each party shall ensure long-term maintenance in accordance with Va.
Code Ann. § 62.1-44.15.15:27(E)(2) and 9 Va. Admin. Code §§ 25-870-58 and 112. In the event
that a Party’s failure to maintain a project completed under this Agreement results in a decrease
in the amount of POCs removed therefrom, as determined by DEQ, then that Party shall, at its
sole cost, maintain or improve the facility to restore the facility to its original functionality.
29. In the event that a Party is unable to meet its load reduction requirement for a
specific reporting period, and another Party has exceeded its load reduction requirement, the
Director may, with written notification to the Parties, transfer credit from shared credit projects
among Parties in a manner to ensure that each Party is able to meet its load reduction
requirement. Any such transfer shall be temporary and last only as long as it is needed to
12
address the immediate shortfall. Further, no transfer will occur or stay in force that would result
in a donating Party being in non-compliance with an MS4 permit condition.
30. Any Party that completes a stormwater management project from funds not
generated by or transferred through Fairfax County shall be entitled to claim all resulting load
reduction credits for purposes of satisfying its MS4 permit requirements.
31. FAIRFAX will prepare an annual report that details the activities performed under
this Agreement. The report will provide sufficient detail so that each locality may use it to meet
their respective MS4 permit reporting obligations to DEQ. Fairfax will provide the report
annually no later than one month before the date the annual report is due to DEQ.
STAFF TRAINING
32. Without any additional invitation or payment, VIENNA’s and/or HERNDON’s
staff may attend MS4 permit-related training programs that are conducted or hosted by
FAIRFAX. FAIRFAX will provide VIENNA and HERNDON with at least one-month’s
advance notice of such training opportunities.
TERMINATION
33. Any Party may terminate this Agreement by resolution of that Party’s governing
body. Any such resolution shall be at a public meeting with notice in writing to the non-
terminating Parties. Notice shall be made at least three weeks in advance of any such meeting to
the Mayor(s) or, as applicable, the County Executive, of Fairfax County. After adoption of any
such resolution, the terminating Party shall notify the remaining Parties. The termination shall
be effective no earlier than the end of the fiscal year in which the governing body’s vote for the
resolution for the termination occurs.
13
34. If this Agreement is terminated by any party other than FAIRFAX, the Agreement
shall remain in force as to the remaining parties. The terminating Town shall have responsibility
to maintain and replace, as necessary, any facility constructed under this Agreement that is
located within its boundaries and shall assume all liability for such facility. Unless otherwise
agreed to by the Parties, neither Town shall have any liability or responsibility for any facility
that is located outside of its jurisdictional boundaries and was developed and implemented under
this Agreement.
ADDITIONAL PROVISIONS
35. This Agreement is integrated and contains all provisions of the Agreement
between the Parties.
36. In the event of a conflict between any term(s) of this Agreement and either of the
Parties’ MS4 permits or other permit requirements, either Party’s respective permit provision(s),
shall control.
37. Any provision or term of this Agreement may be modified only by a writing that
is approved by resolution at a public meeting of each of the localities’ respective governing
bodies.
38. This Agreement shall be binding on the Parties’ respective agencies, employees,
agents, and successors-in-interests.
39. This Agreement shall not be assigned by either of the Parties unless both of the
Parties agree to such an assignment in writing.
40. Nothing in this Agreement otherwise limits the respective regulatory and police
powers of the Parties.
14
41. The Parties agree that nothing in this Agreement creates a third-party beneficiary.
The Parties also agree that this Agreement does not confer any standing or right to sue or to
enforce any provision of this Agreement or any other right or benefit to any person who is not a
party to this Agreement, including but not limited to a citizen, resident, private entity, or local,
state, or federal governmental or public body.
42. This Agreement may be executed in two or more counterparts, each of which
shall be deemed an original, but all of which together shall constitute one in the same
Agreement.
43. This Agreement shall be governed by Virginia law, and any litigation relating to
this Agreement shall be brought and/or maintained only in the Circuit Court of Fairfax County,
Virginia.
IN WITNESS WHEREOF, the Parties have executed this Agreement, as verified by their
signatures below.
[Signatures appear on the following pages.]

15
TOWN OF VIENNA
By:___________________________
(Name and Title)
STATE OF VIRGINIA :
: to-wit
COUNTY OF FAIRFAX :
The foregoing Agreement was acknowledged before me by __________________
of the Town of VIENNA, this _______ day of _______________ 2016 on behalf of the Town of
VIENNA.
________________________
Notary Public
My commission expires: ________________________
Notary Registration Number: _____________________
16
TOWN OF HERNDON
By:___________________________
(Name and Title)
STATE OF VIRGINIA :
: to-wit
COUNTY OF FAIRFAX :
The foregoing Agreement was acknowledged before me by __________________
of the Town of HERNDON, this _______ day of _______________ 2016 on behalf of the Town
of HERNDON.
________________________
Notary Public
My commission expires: ________________________
Notary Registration Number: _____________________
17
BOARD OF SUPERVISORS OF
FAIRFAX COUNTY, VIRGINIA
By:________________________________
Edward L. Long Jr.
County Executive
Fairfax County, Virginia
STATE OF VIRGINIA :
: to-wit
COUNTY OF FAIRFAX :
The foregoing Agreement was acknowledged before me by __________________ of the
County Executive, on behalf of the Board of Supervisors of Fairfax County, Virginia this
_______ day of _______________ 2016.
________________________
Notary Public
My commission expires: ________________________
Notary Registration Number: _____________
Approved as to form: ___________________
Office of the County Attorney
Fairfax, Virginia

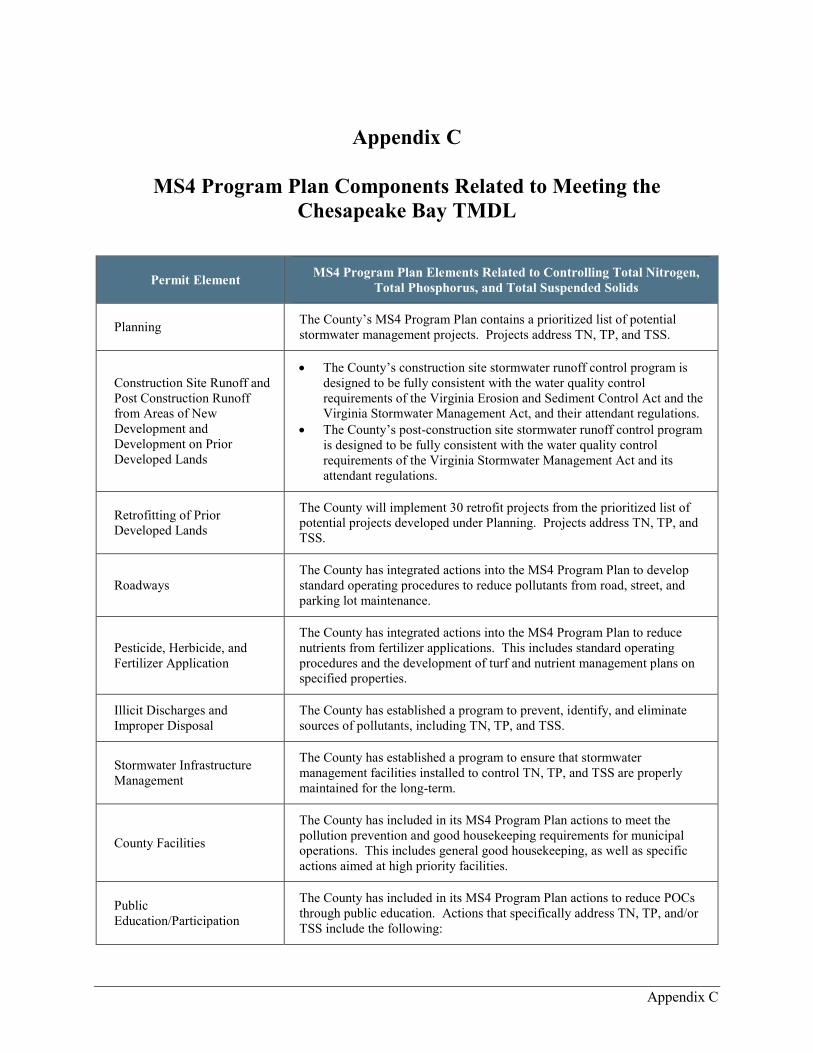
Appendix C
Appendix C
MS4 Program Plan Components Related to Meeting the
Chesapeake Bay TMDL
Permit Element MS4 Program Plan Elements Related to Controlling Total Nitrogen,
Total Phosphorus, and Total Suspended Solids
Planning The County’s MS4 Program Plan contains a prioritized list of potential
stormwater management projects. Projects address TN, TP, and TSS.
Construction Site Runoff and
Post Construction Runoff
from Areas of New
Development and
Development on Prior
Developed Lands
The County’s construction site stormwater runoff control program is
designed to be fully consistent with the water quality control
requirements of the Virginia Erosion and Sediment Control Act and the
Virginia Stormwater Management Act, and their attendant regulations.
The County’s post-construction site stormwater runoff control program
is designed to be fully consistent with the water quality control
requirements of the Virginia Stormwater Management Act and its
attendant regulations.
Retrofitting of Prior
Developed Lands
The County will implement 30 retrofit projects from the prioritized list of
potential projects developed under Planning. Projects address TN, TP, and
TSS.
Roadways
The County has integrated actions into the MS4 Program Plan to develop
standard operating procedures to reduce pollutants from road, street, and
parking lot maintenance.
Pesticide, Herbicide, and
Fertilizer Application
The County has integrated actions into the MS4 Program Plan to reduce
nutrients from fertilizer applications. This includes standard operating
procedures and the development of turf and nutrient management plans on
specified properties.
Illicit Discharges and
Improper Disposal
The County has established a program to prevent, identify, and eliminate
sources of pollutants, including TN, TP, and TSS.
Stormwater Infrastructure
Management
The County has established a program to ensure that stormwater
management facilities installed to control TN, TP, and TSS are properly
maintained for the long-term.
County Facilities
The County has included in its MS4 Program Plan actions to meet the
pollution prevention and good housekeeping requirements for municipal
operations. This includes general good housekeeping, as well as specific
actions aimed at high priority facilities.
Public
Education/Participation
The County has included in its MS4 Program Plan actions to reduce POCs
through public education. Actions that specifically address TN, TP, and/or
TSS include the following:
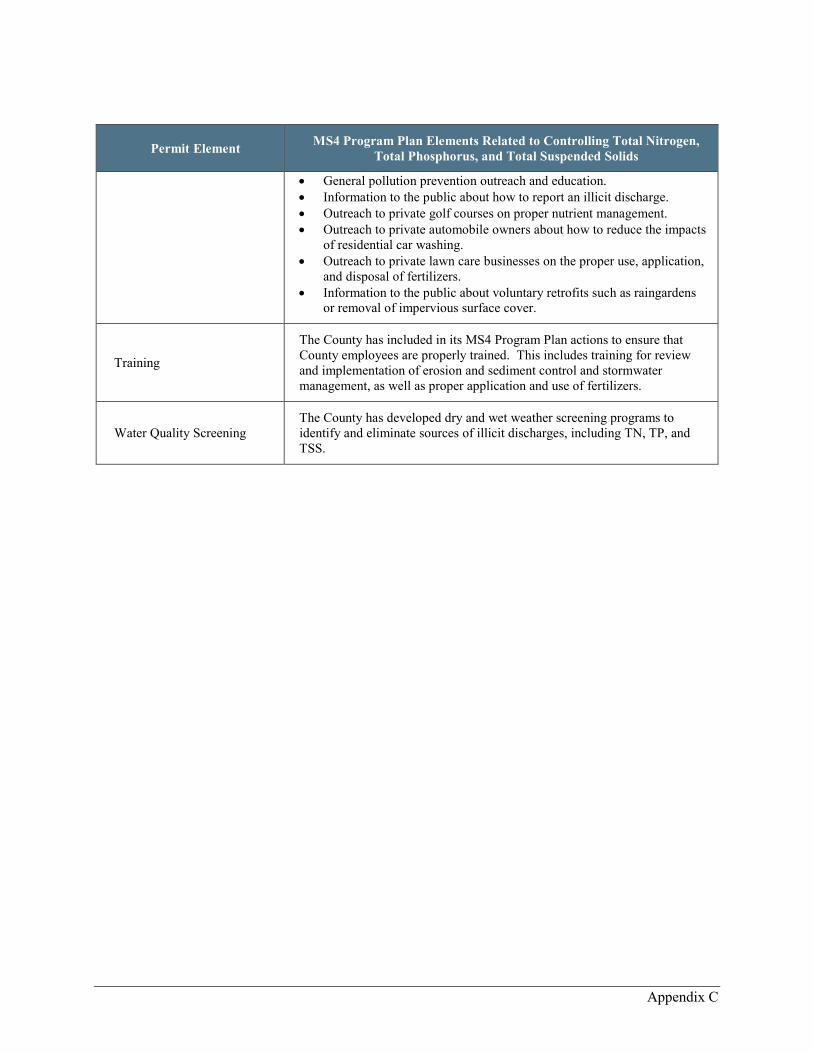
Appendix C
Permit Element MS4 Program Plan Elements Related to Controlling Total Nitrogen,
Total Phosphorus, and Total Suspended Solids
General pollution prevention outreach and education.
Information to the public about how to report an illicit discharge.
Outreach to private golf courses on proper nutrient management.
Outreach to private automobile owners about how to reduce the impacts
of residential car washing.
Outreach to private lawn care businesses on the proper use, application,
and disposal of fertilizers.
Information to the public about voluntary retrofits such as raingardens
or removal of impervious surface cover.
Training
The County has included in its MS4 Program Plan actions to ensure that
County employees are properly trained. This includes training for review
and implementation of erosion and sediment control and stormwater
management, as well as proper application and use of fertilizers.
Water Quality Screening
The County has developed dry and wet weather screening programs to
identify and eliminate sources of illicit discharges, including TN, TP, and
TSS.
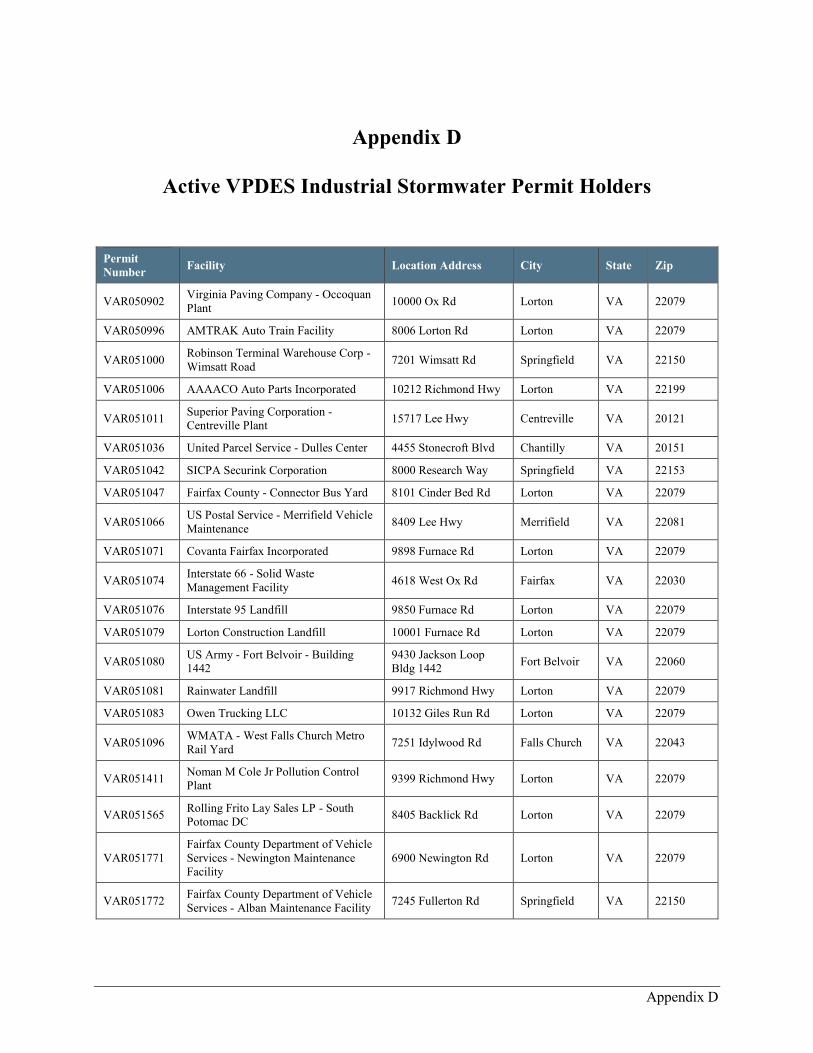
Appendix D
Appendix D
Active VPDES Industrial Stormwater Permit Holders
Permit
Number Facility Location Address City State Zip
VAR050902 Virginia Paving Company - Occoquan
Plant 10000 Ox Rd Lorton VA 22079
VAR050996 AMTRAK Auto Train Facility 8006 Lorton Rd Lorton VA 22079
VAR051000 Robinson Terminal Warehouse Corp -
Wimsatt Road 7201 Wimsatt Rd Springfield VA 22150
VAR051006 AAAACO Auto Parts Incorporated 10212 Richmond Hwy Lorton VA 22199
VAR051011 Superior Paving Corporation -
Centreville Plant 15717 Lee Hwy Centreville VA 20121
VAR051036 United Parcel Service - Dulles Center 4455 Stonecroft Blvd Chantilly VA 20151
VAR051042 SICPA Securink Corporation 8000 Research Way Springfield VA 22153
VAR051047 Fairfax County - Connector Bus Yard 8101 Cinder Bed Rd Lorton VA 22079
VAR051066 US Postal Service - Merrifield Vehicle
Maintenance 8409 Lee Hwy Merrifield VA 22081
VAR051071 Covanta Fairfax Incorporated 9898 Furnace Rd Lorton VA 22079
VAR051074 Interstate 66 - Solid Waste
Management Facility 4618 West Ox Rd Fairfax VA 22030
VAR051076 Interstate 95 Landfill 9850 Furnace Rd Lorton VA 22079
VAR051079 Lorton Construction Landfill 10001 Furnace Rd Lorton VA 22079
VAR051080 US Army - Fort Belvoir - Building
1442
9430 Jackson Loop
Bldg 1442 Fort Belvoir VA 22060
VAR051081 Rainwater Landfill 9917 Richmond Hwy Lorton VA 22079
VAR051083 Owen Trucking LLC 10132 Giles Run Rd Lorton VA 22079
VAR051096 WMATA - West Falls Church Metro
Rail Yard 7251 Idylwood Rd Falls Church VA 22043
VAR051411 Noman M Cole Jr Pollution Control
Plant 9399 Richmond Hwy Lorton VA 22079
VAR051565 Rolling Frito Lay Sales LP - South
Potomac DC 8405 Backlick Rd Lorton VA 22079
VAR051771
Fairfax County Department of Vehicle
Services - Newington Maintenance
Facility
6900 Newington Rd Lorton VA 22079
VAR051772 Fairfax County Department of Vehicle
Services - Alban Maintenance Facility 7245 Fullerton Rd Springfield VA 22150
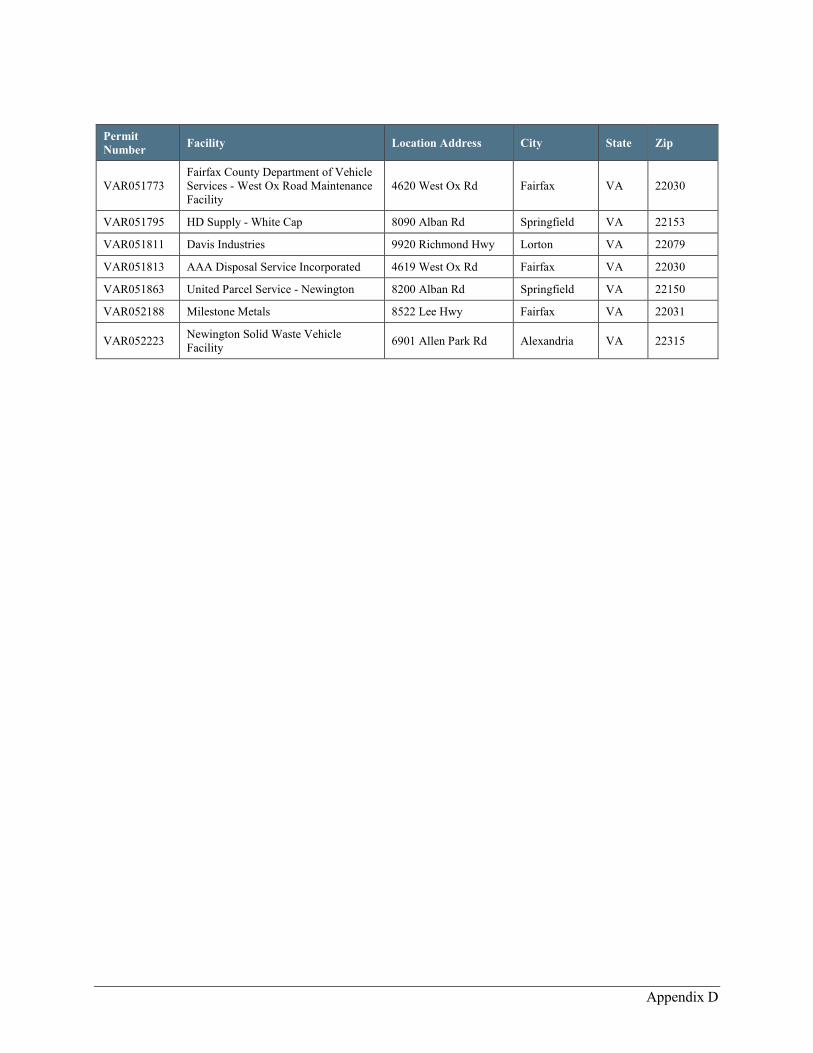
Appendix D
Permit
Number Facility Location Address City State Zip
VAR051773
Fairfax County Department of Vehicle
Services - West Ox Road Maintenance
Facility
4620 West Ox Rd Fairfax VA 22030
VAR051795 HD Supply - White Cap 8090 Alban Rd Springfield VA 22153
VAR051811 Davis Industries 9920 Richmond Hwy Lorton VA 22079
VAR051813 AAA Disposal Service Incorporated 4619 West Ox Rd Fairfax VA 22030
VAR051863 United Parcel Service - Newington 8200 Alban Rd Springfield VA 22150
VAR052188 Milestone Metals 8522 Lee Hwy Fairfax VA 22031
VAR052223 Newington Solid Waste Vehicle
Facility 6901 Allen Park Rd Alexandria VA 22315

Appendix E
Appendix E
Structural Retrofits for TMDL Compliance Beginning July 1, 2009

Appendix E
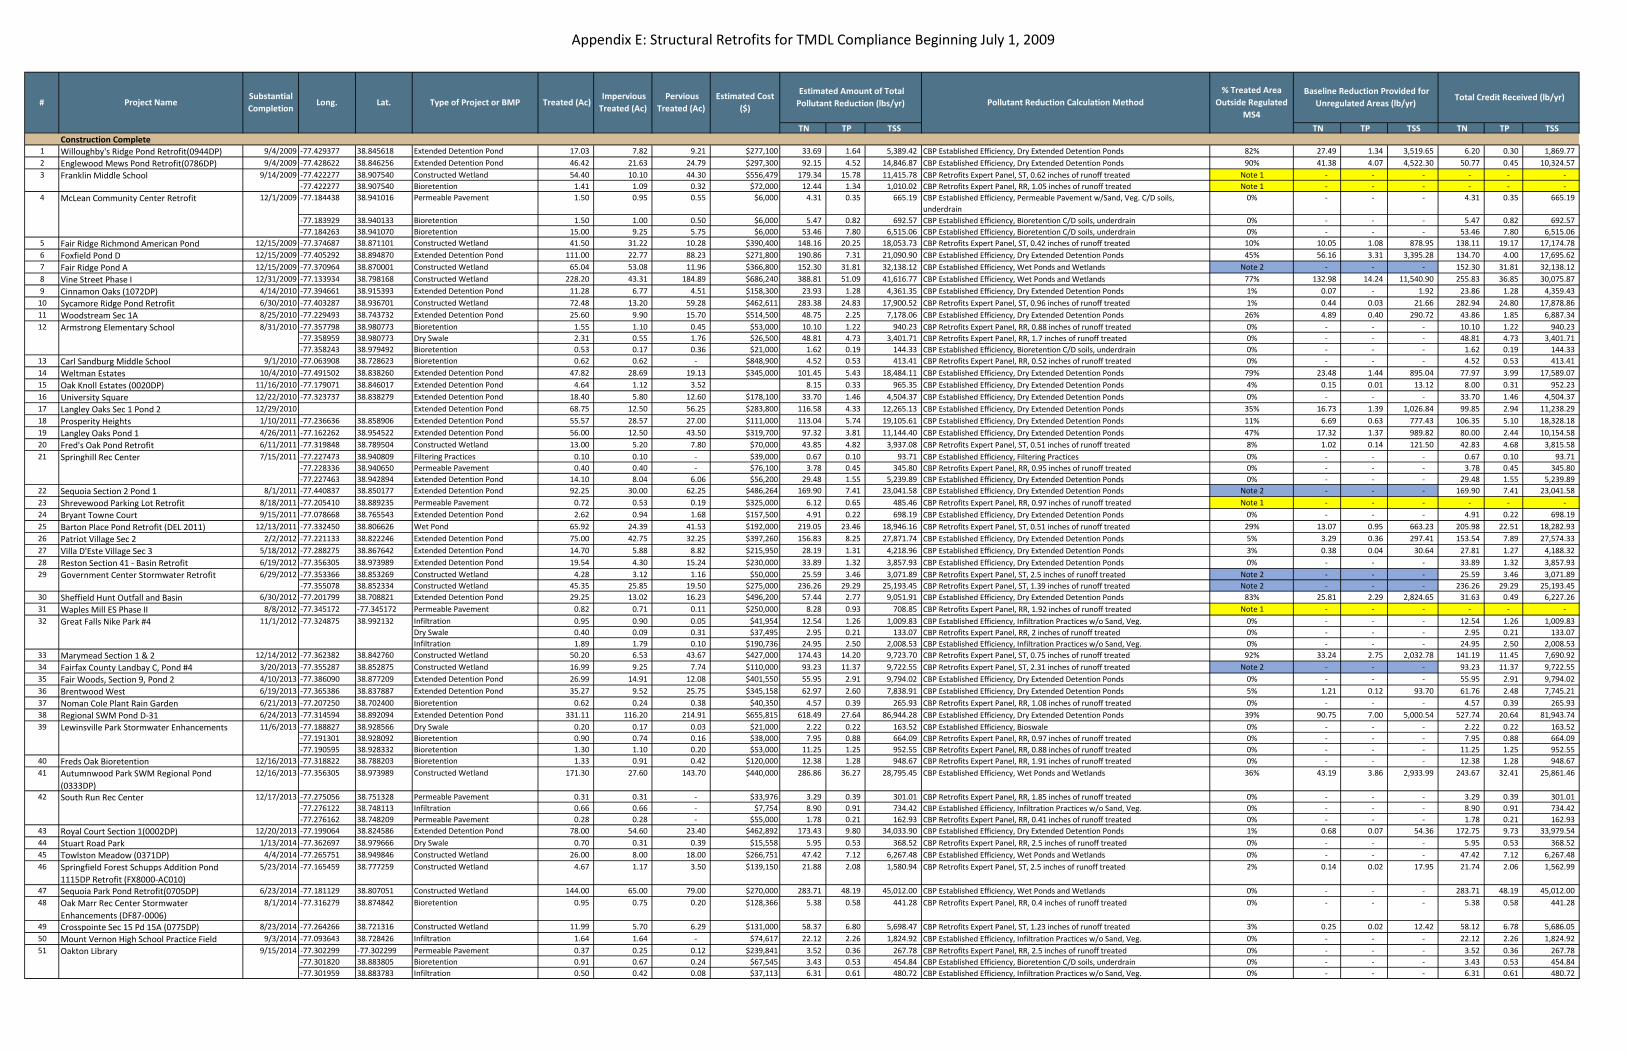
Appendix E: Structural Retrofits for TMDL Compliance Beginning July 1, 2009
TN TP TSS TN TP TSS TN TP TSS Construction Complete
1 Willoughby's Ridge Pond Retrofit(0944DP) 9/4/2009 -77.429377 38.845618 Extended Detention Pond 17.03 7.82 9.21 $277,100 33.69 1.64 5,389.42 CBP Established Efficiency, Dry Extended Detention Ponds 82% 27.49 1.34 3,519.65 6.20 0.30 1,869.77
2 Englewood Mews Pond Retrofit(0786DP) 9/4/2009 -77.428622 38.846256 Extended Detention Pond 46.42 21.63 24.79 $297,300 92.15 4.52 14,846.87 CBP Established Efficiency, Dry Extended Detention Ponds 90% 41.38 4.07 4,522.30 50.77 0.45 10,324.57
-77.422277 38.907540 Constructed Wetland 54.40 10.10 44.30 $556,479 179.34 15.78 11,415.78 CBP Retrofits Expert Panel, ST, 0.62 inches of runoff treated Note 1 - - - - - -
-77.422277 38.907540 Bioretention 1.41 1.09 0.32 $72,000 12.44 1.34 1,010.02 CBP Retrofits Expert Panel, RR, 1.05 inches of runoff treated Note 1 - - - - - -
-77.184438 38.941016 Permeable Pavement 1.50 0.95 0.55 $6,000 4.31 0.35 665.19 CBP Established Efficiency, Permeable Pavement w/Sand, Veg. C/D soils,
underdrain
0% - - - 4.31 0.35 665.19
-77.183929 38.940133 Bioretention 1.50 1.00 0.50 $6,000 5.47 0.82 692.57 CBP Established Efficiency, Bioretention C/D soils, underdrain 0% - - - 5.47 0.82 692.57
-77.184263 38.941070 Bioretention 15.00 9.25 5.75 $6,000 53.46 7.80 6,515.06 CBP Established Efficiency, Bioretention C/D soils, underdrain 0% - - - 53.46 7.80 6,515.06
5 Fair Ridge Richmond American Pond 12/15/2009 -77.374687 38.871101 Constructed Wetland 41.50 31.22 10.28 $390,400 148.16 20.25 18,053.73 CBP Retrofits Expert Panel, ST, 0.42 inches of runoff treated 10% 10.05 1.08 878.95 138.11 19.17 17,174.78
6 Foxfield Pond D 12/15/2009 -77.405292 38.894870 Extended Detention Pond 111.00 22.77 88.23 $271,800 190.86 7.31 21,090.90 CBP Established Efficiency, Dry Extended Detention Ponds 45% 56.16 3.31 3,395.28 134.70 4.00 17,695.62
7 Fair Ridge Pond A 12/15/2009 -77.370964 38.870001 Constructed Wetland 65.04 53.08 11.96 $366,800 152.30 31.81 32,138.12 CBP Established Efficiency, Wet Ponds and Wetlands Note 2 - - - 152.30 31.81 32,138.12
8 Vine Street Phase I 12/31/2009 -77.133934 38.798168 Constructed Wetland 228.20 43.31 184.89 $686,240 388.81 51.09 41,616.77 CBP Established Efficiency, Wet Ponds and Wetlands 77% 132.98 14.24 11,540.90 255.83 36.85 30,075.87
9 Cinnamon Oaks (1072DP) 4/14/2010 -77.394661 38.915393 Extended Detention Pond 11.28 6.77 4.51 $158,300 23.93 1.28 4,361.35 CBP Established Efficiency, Dry Extended Detention Ponds 1% 0.07 - 1.92 23.86 1.28 4,359.43
10 Sycamore Ridge Pond Retrofit 6/30/2010 -77.403287 38.936701 Constructed Wetland 72.48 13.20 59.28 $462,611 283.38 24.83 17,900.52 CBP Retrofits Expert Panel, ST, 0.96 inches of runoff treated 1% 0.44 0.03 21.66 282.94 24.80 17,878.86
11 Woodstream Sec 1A 8/25/2010 -77.229493 38.743732 Extended Detention Pond 25.60 9.90 15.70 $514,500 48.75 2.25 7,178.06 CBP Established Efficiency, Dry Extended Detention Ponds 26% 4.89 0.40 290.72 43.86 1.85 6,887.34
-77.357798 38.980773 Bioretention 1.55 1.10 0.45 $53,000 10.10 1.22 940.23 CBP Retrofits Expert Panel, RR, 0.88 inches of runoff treated 0% - - - 10.10 1.22 940.23
-77.358959 38.980773 Dry Swale 2.31 0.55 1.76 $26,500 48.81 4.73 3,401.71 CBP Retrofits Expert Panel, RR, 1.7 inches of runoff treated 0% - - - 48.81 4.73 3,401.71
-77.358243 38.979492 Bioretention 0.53 0.17 0.36 $21,000 1.62 0.19 144.33 CBP Established Efficiency, Bioretention C/D soils, underdrain 0% - - - 1.62 0.19 144.33
13 Carl Sandburg Middle School 9/1/2010 -77.063908 38.728623 Bioretention 0.62 0.62 - $848,900 4.52 0.53 413.41 CBP Retrofits Expert Panel, RR, 0.52 inches of runoff treated 0% - - - 4.52 0.53 413.41
14 Weltman Estates 10/4/2010 -77.491502 38.838260 Extended Detention Pond 47.82 28.69 19.13 $345,000 101.45 5.43 18,484.11 CBP Established Efficiency, Dry Extended Detention Ponds 79% 23.48 1.44 895.04 77.97 3.99 17,589.07
15 Oak Knoll Estates (0020DP) 11/16/2010 -77.179071 38.846017 Extended Detention Pond 4.64 1.12 3.52 8.15 0.33 965.35 CBP Established Efficiency, Dry Extended Detention Ponds 4% 0.15 0.01 13.12 8.00 0.31 952.23
16 University Square 12/22/2010 -77.323737 38.838279 Extended Detention Pond 18.40 5.80 12.60 $178,100 33.70 1.46 4,504.37 CBP Established Efficiency, Dry Extended Detention Ponds 0% - - - 33.70 1.46 4,504.37
17 Langley Oaks Sec 1 Pond 2 12/29/2010 Extended Detention Pond 68.75 12.50 56.25 $283,800 116.58 4.33 12,265.13 CBP Established Efficiency, Dry Extended Detention Ponds 35% 16.73 1.39 1,026.84 99.85 2.94 11,238.29
18 Prosperity Heights 1/10/2011 -77.236636 38.858906 Extended Detention Pond 55.57 28.57 27.00 $111,000 113.04 5.74 19,105.61 CBP Established Efficiency, Dry Extended Detention Ponds 11% 6.69 0.63 777.43 106.35 5.10 18,328.18
19 Langley Oaks Pond 1 4/26/2011 -77.162262 38.954522 Extended Detention Pond 56.00 12.50 43.50 $319,700 97.32 3.81 11,144.40 CBP Established Efficiency, Dry Extended Detention Ponds 47% 17.32 1.37 989.82 80.00 2.44 10,154.58
20 Fred's Oak Pond Retrofit 6/11/2011 -77.319848 38.789504 Constructed Wetland 13.00 5.20 7.80 $70,000 43.85 4.82 3,937.08 CBP Retrofits Expert Panel, ST, 0.51 inches of runoff treated 8% 1.02 0.14 121.50 42.83 4.68 3,815.58
-77.227473 38.940809 Filtering Practices 0.10 0.10 - $39,000 0.67 0.10 93.71 CBP Established Efficiency, Filtering Practices 0% - - - 0.67 0.10 93.71
-77.228336 38.940650 Permeable Pavement 0.40 0.40 - $76,100 3.78 0.45 345.80 CBP Retrofits Expert Panel, RR, 0.95 inches of runoff treated 0% - - - 3.78 0.45 345.80
-77.227463 38.942894 Extended Detention Pond 14.10 8.04 6.06 $56,200 29.48 1.55 5,239.89 CBP Established Efficiency, Dry Extended Detention Ponds 0% - - - 29.48 1.55 5,239.89
22 Sequoia Section 2 Pond 1 8/1/2011 -77.440837 38.850177 Extended Detention Pond 92.25 30.00 62.25 $486,264 169.90 7.41 23,041.58 CBP Established Efficiency, Dry Extended Detention Ponds Note 2 - - - 169.90 7.41 23,041.58
23 Shrevewood Parking Lot Retrofit 8/18/2011 -77.205410 38.889235 Permeable Pavement 0.72 0.53 0.19 $325,000 6.12 0.65 485.46 CBP Retrofits Expert Panel, RR, 0.97 inches of runoff treated Note 1 - - - - - -
24 Bryant Towne Court 9/15/2011 -77.078668 38.765543 Extended Detention Pond 2.62 0.94 1.68 $157,500 4.91 0.22 698.19 CBP Established Efficiency, Dry Extended Detention Ponds 0% - - - 4.91 0.22 698.19
25 Barton Place Pond Retrofit (DEL 2011) 12/13/2011 -77.332450 38.806626 Wet Pond 65.92 24.39 41.53 $192,000 219.05 23.46 18,946.16 CBP Retrofits Expert Panel, ST, 0.51 inches of runoff treated 29% 13.07 0.95 663.23 205.98 22.51 18,282.93
26 Patriot Village Sec 2 2/2/2012 -77.221133 38.822246 Extended Detention Pond 75.00 42.75 32.25 $397,260 156.83 8.25 27,871.74 CBP Established Efficiency, Dry Extended Detention Ponds 5% 3.29 0.36 297.41 153.54 7.89 27,574.33
27 Villa D'Este Village Sec 3 5/18/2012 -77.288275 38.867642 Extended Detention Pond 14.70 5.88 8.82 $215,950 28.19 1.31 4,218.96 CBP Established Efficiency, Dry Extended Detention Ponds 3% 0.38 0.04 30.64 27.81 1.27 4,188.32
28 Reston Section 41 - Basin Retrofit 6/19/2012 -77.356305 38.973989 Extended Detention Pond 19.54 4.30 15.24 $230,000 33.89 1.32 3,857.93 CBP Established Efficiency, Dry Extended Detention Ponds 0% - - - 33.89 1.32 3,857.93
-77.353366 38.853269 Constructed Wetland 4.28 3.12 1.16 $50,000 25.59 3.46 3,071.89 CBP Retrofits Expert Panel, ST, 2.5 inches of runoff treated Note 2 - - - 25.59 3.46 3,071.89
-77.355078 38.852334 Constructed Wetland 45.35 25.85 19.50 $275,000 236.26 29.29 25,193.45 CBP Retrofits Expert Panel, ST, 1.39 inches of runoff treated Note 2 - - - 236.26 29.29 25,193.45
30 Sheffield Hunt Outfall and Basin 6/30/2012 -77.201799 38.708821 Extended Detention Pond 29.25 13.02 16.23 $496,200 57.44 2.77 9,051.91 CBP Established Efficiency, Dry Extended Detention Ponds 83% 25.81 2.29 2,824.65 31.63 0.49 6,227.26
31 Waples Mill ES Phase II 8/8/2012 -77.345172 -77.345172 Permeable Pavement 0.82 0.71 0.11 $250,000 8.28 0.93 708.85 CBP Retrofits Expert Panel, RR, 1.92 inches of runoff treated Note 1 - - - - - -
Infiltration 0.95 0.90 0.05 $41,954 12.54 1.26 1,009.83 CBP Established Efficiency, Infiltration Practices w/o Sand, Veg. 0% - - - 12.54 1.26 1,009.83
Dry Swale 0.40 0.09 0.31 $37,495 2.95 0.21 133.07 CBP Retrofits Expert Panel, RR, 2 inches of runoff treated 0% - - - 2.95 0.21 133.07
Infiltration 1.89 1.79 0.10 $190,736 24.95 2.50 2,008.53 CBP Established Efficiency, Infiltration Practices w/o Sand, Veg. 0% - - - 24.95 2.50 2,008.53
33 Marymead Section 1 & 2 12/14/2012 -77.362382 38.842760 Constructed Wetland 50.20 6.53 43.67 $427,000 174.43 14.20 9,723.70 CBP Retrofits Expert Panel, ST, 0.75 inches of runoff treated 92% 33.24 2.75 2,032.78 141.19 11.45 7,690.92
34 Fairfax County Landbay C, Pond #4 3/20/2013 -77.355287 38.852875 Constructed Wetland 16.99 9.25 7.74 $110,000 93.23 11.37 9,722.55 CBP Retrofits Expert Panel, ST, 2.31 inches of runoff treated Note 2 - - - 93.23 11.37 9,722.55
35 Fair Woods, Section 9, Pond 2 4/10/2013 -77.386090 38.877209 Extended Detention Pond 26.99 14.91 12.08 $401,550 55.95 2.91 9,794.02 CBP Established Efficiency, Dry Extended Detention Ponds 0% - - - 55.95 2.91 9,794.02
36 Brentwood West 6/19/2013 -77.365386 38.837887 Extended Detention Pond 35.27 9.52 25.75 $345,158 62.97 2.60 7,838.91 CBP Established Efficiency, Dry Extended Detention Ponds 5% 1.21 0.12 93.70 61.76 2.48 7,745.21
37 Noman Cole Plant Rain Garden 6/21/2013 -77.207250 38.702400 Bioretention 0.62 0.24 0.38 $40,350 4.57 0.39 265.93 CBP Retrofits Expert Panel, RR, 1.08 inches of runoff treated 0% - - - 4.57 0.39 265.93
38 Regional SWM Pond D-31 6/24/2013 -77.314594 38.892094 Extended Detention Pond 331.11 116.20 214.91 $655,815 618.49 27.64 86,944.28 CBP Established Efficiency, Dry Extended Detention Ponds 39% 90.75 7.00 5,000.54 527.74 20.64 81,943.74
-77.188827 38.928566 Dry Swale 0.20 0.17 0.03 $21,000 2.22 0.22 163.52 CBP Established Efficiency, Bioswale 0% - - - 2.22 0.22 163.52
-77.191301 38.928092 Bioretention 0.90 0.74 0.16 $38,000 7.95 0.88 664.09 CBP Retrofits Expert Panel, RR, 0.97 inches of runoff treated 0% - - - 7.95 0.88 664.09
-77.190595 38.928332 Bioretention 1.30 1.10 0.20 $53,000 11.25 1.25 952.55 CBP Retrofits Expert Panel, RR, 0.88 inches of runoff treated 0% - - - 11.25 1.25 952.55
40 Freds Oak Bioretention 12/16/2013 -77.318822 38.788203 Bioretention 1.33 0.91 0.42 $120,000 12.38 1.28 948.67 CBP Retrofits Expert Panel, RR, 1.91 inches of runoff treated 0% - - - 12.38 1.28 948.67
41 Autumnwood Park SWM Regional Pond
(0333DP)
12/16/2013 -77.356305 38.973989 Constructed Wetland 171.30 27.60 143.70 $440,000 286.86 36.27 28,795.45 CBP Established Efficiency, Wet Ponds and Wetlands 36% 43.19 3.86 2,933.99 243.67 32.41 25,861.46
-77.275056 38.751328 Permeable Pavement 0.31 0.31 - $33,976 3.29 0.39 301.01 CBP Retrofits Expert Panel, RR, 1.85 inches of runoff treated 0% - - - 3.29 0.39 301.01
-77.276122 38.748113 Infiltration 0.66 0.66 - $7,754 8.90 0.91 734.42 CBP Established Efficiency, Infiltration Practices w/o Sand, Veg. 0% - - - 8.90 0.91 734.42
-77.276162 38.748209 Permeable Pavement 0.28 0.28 - $55,000 1.78 0.21 162.93 CBP Retrofits Expert Panel, RR, 0.41 inches of runoff treated 0% - - - 1.78 0.21 162.93
43 Royal Court Section 1(0002DP) 12/20/2013 -77.199064 38.824586 Extended Detention Pond 78.00 54.60 23.40 $462,892 173.43 9.80 34,033.90 CBP Established Efficiency, Dry Extended Detention Ponds 1% 0.68 0.07 54.36 172.75 9.73 33,979.54
44 Stuart Road Park 1/13/2014 -77.362697 38.979666 Dry Swale 0.70 0.31 0.39 $15,558 5.95 0.53 368.52 CBP Retrofits Expert Panel, RR, 2.5 inches of runoff treated 0% - - - 5.95 0.53 368.52
45 Towlston Meadow (0371DP) 4/4/2014 -77.265751 38.949846 Constructed Wetland 26.00 8.00 18.00 $266,751 47.42 7.12 6,267.48 CBP Established Efficiency, Wet Ponds and Wetlands 0% - - - 47.42 7.12 6,267.48
46 Springfield Forest Schupps Addition Pond
1115DP Retrofit (FX8000-AC010)
5/23/2014 -77.165459 38.777259 Constructed Wetland 4.67 1.17 3.50 $139,150 21.88 2.08 1,580.94 CBP Retrofits Expert Panel, ST, 2.5 inches of runoff treated 2% 0.14 0.02 17.95 21.74 2.06 1,562.99
47 Sequoia Park Pond Retrofit(0705DP) 6/23/2014 -77.181129 38.807051 Constructed Wetland 144.00 65.00 79.00 $270,000 283.71 48.19 45,012.00 CBP Established Efficiency, Wet Ponds and Wetlands 0% - - - 283.71 48.19 45,012.00
48 Oak Marr Rec Center Stormwater
Enhancements (DF87-0006)
8/1/2014 -77.316279 38.874842 Bioretention 0.95 0.75 0.20 $128,366 5.38 0.58 441.28 CBP Retrofits Expert Panel, RR, 0.4 inches of runoff treated 0% - - - 5.38 0.58 441.28
49 Crosspointe Sec 15 Pd 15A (0775DP) 8/23/2014 -77.264266 38.721316 Constructed Wetland 11.99 5.70 6.29 $131,000 58.37 6.80 5,698.47 CBP Retrofits Expert Panel, ST, 1.23 inches of runoff treated 3% 0.25 0.02 12.42 58.12 6.78 5,686.05
50 Mount Vernon High School Practice Field 9/3/2014 -77.093643 38.728426 Infiltration 1.64 1.64 - $74,617 22.12 2.26 1,824.92 CBP Established Efficiency, Infiltration Practices w/o Sand, Veg. 0% - - - 22.12 2.26 1,824.92
-77.302299 -77.302299 Permeable Pavement 0.37 0.25 0.12 $239,841 3.52 0.36 267.78 CBP Retrofits Expert Panel, RR, 2.5 inches of runoff treated 0% - - - 3.52 0.36 267.78
-77.301820 38.883805 Bioretention 0.91 0.67 0.24 $67,545 3.43 0.53 454.84 CBP Established Efficiency, Bioretention C/D soils, underdrain 0% - - - 3.43 0.53 454.84
-77.301959 38.883783 Infiltration 0.50 0.42 0.08 $37,113 6.31 0.61 480.72 CBP Established Efficiency, Infiltration Practices w/o Sand, Veg. 0% - - - 6.31 0.61 480.72
# Project Name
3 Franklin Middle School
8/31/2010
21 Springhill Rec Center 7/15/2011
Substantial
CompletionLong.
% Treated Area
Outside Regulated
MS4
Baseline Reduction Provided for
Unregulated Areas (lb/yr) Total Credit Received (lb/yr)
Type of Project or BMP Treated (Ac) Impervious
Treated (Ac)
Pervious
Treated (Ac)
Estimated Cost
($)
Estimated Amount of Total
Pollutant Reduction (lbs/yr) Pollutant Reduction Calculation MethodLat.
9/14/2009
4 McLean Community Center Retrofit 12/1/2009
Armstrong Elementary School
39 Lewinsville Park Stormwater Enhancements 11/6/2013
29 Government Center Stormwater Retrofit 6/29/2012
32 Great Falls Nike Park #4 11/1/2012
42 South Run Rec Center 12/17/2013
51 Oakton Library 9/15/2014
-77.324875 38.992132
12
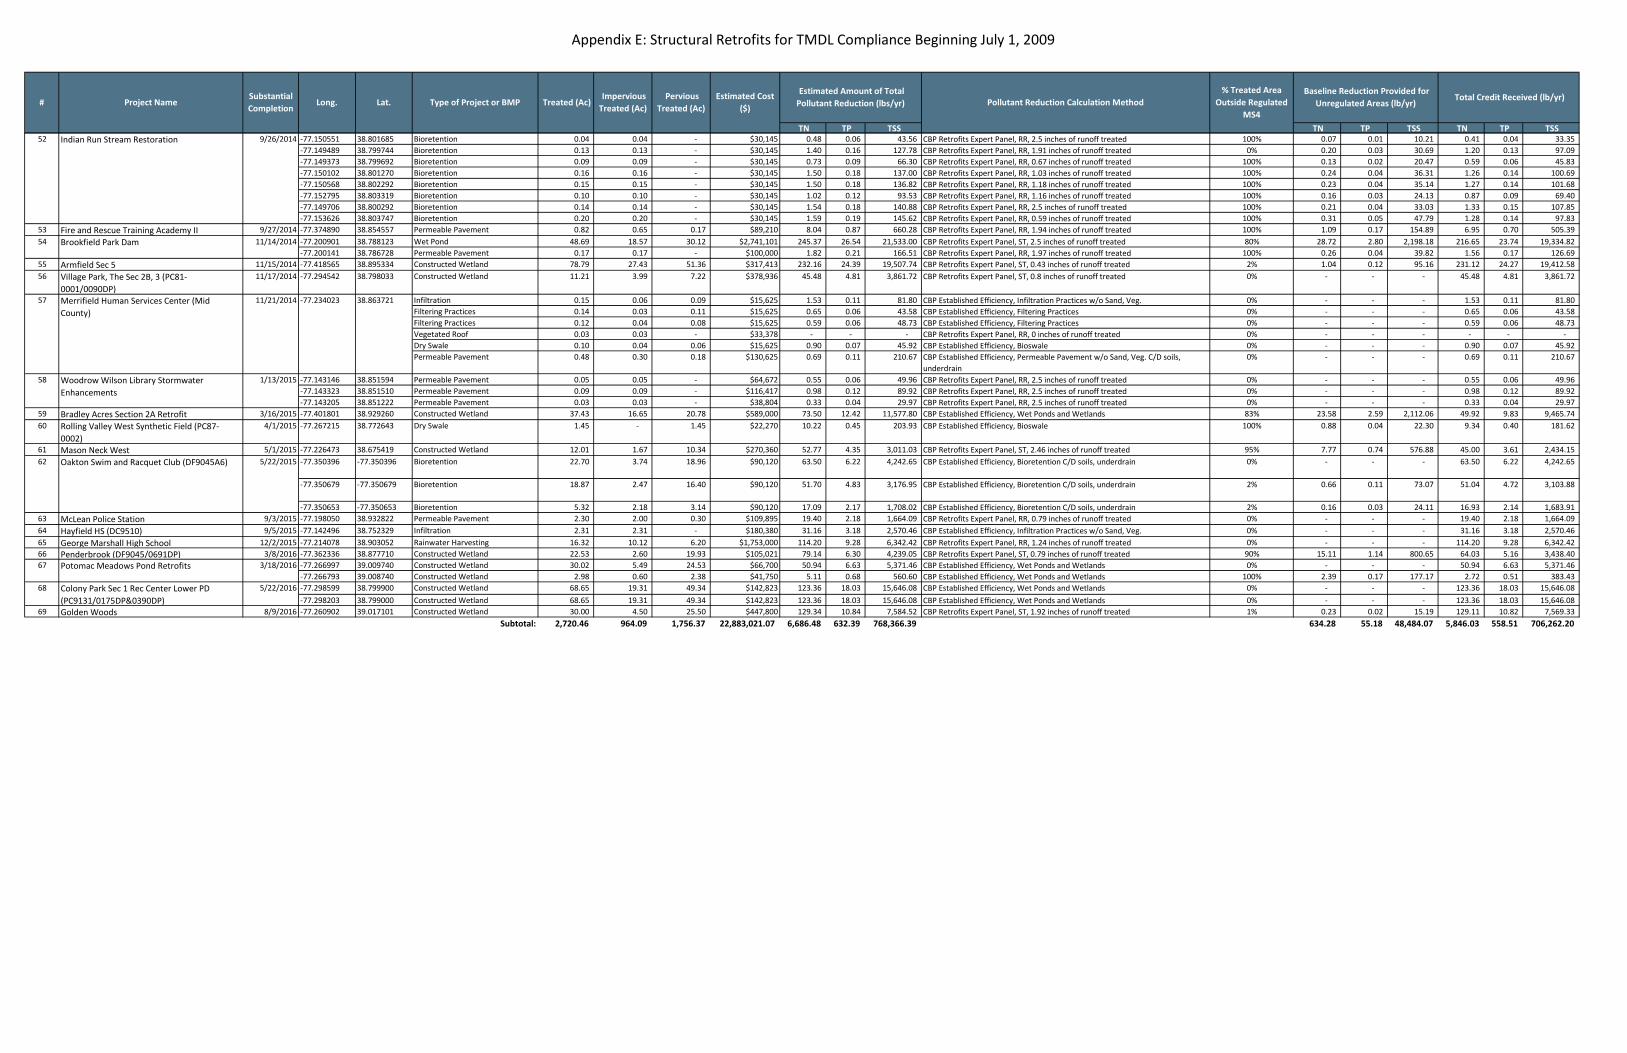
Appendix E: Structural Retrofits for TMDL Compliance Beginning July 1, 2009
TN TP TSS TN TP TSS TN TP TSS
# Project NameSubstantial
CompletionLong.
% Treated Area
Outside Regulated
MS4
Baseline Reduction Provided for
Unregulated Areas (lb/yr) Total Credit Received (lb/yr)
Type of Project or BMP Treated (Ac) Impervious
Treated (Ac)
Pervious
Treated (Ac)
Estimated Cost
($)
Estimated Amount of Total
Pollutant Reduction (lbs/yr) Pollutant Reduction Calculation MethodLat.
-77.150551 38.801685 Bioretention 0.04 0.04 - $30,145 0.48 0.06 43.56 CBP Retrofits Expert Panel, RR, 2.5 inches of runoff treated 100% 0.07 0.01 10.21 0.41 0.04 33.35
-77.149489 38.799744 Bioretention 0.13 0.13 - $30,145 1.40 0.16 127.78 CBP Retrofits Expert Panel, RR, 1.91 inches of runoff treated 0% 0.20 0.03 30.69 1.20 0.13 97.09
-77.149373 38.799692 Bioretention 0.09 0.09 - $30,145 0.73 0.09 66.30 CBP Retrofits Expert Panel, RR, 0.67 inches of runoff treated 100% 0.13 0.02 20.47 0.59 0.06 45.83
-77.150102 38.801270 Bioretention 0.16 0.16 - $30,145 1.50 0.18 137.00 CBP Retrofits Expert Panel, RR, 1.03 inches of runoff treated 100% 0.24 0.04 36.31 1.26 0.14 100.69
-77.150568 38.802292 Bioretention 0.15 0.15 - $30,145 1.50 0.18 136.82 CBP Retrofits Expert Panel, RR, 1.18 inches of runoff treated 100% 0.23 0.04 35.14 1.27 0.14 101.68
-77.152795 38.803319 Bioretention 0.10 0.10 - $30,145 1.02 0.12 93.53 CBP Retrofits Expert Panel, RR, 1.16 inches of runoff treated 100% 0.16 0.03 24.13 0.87 0.09 69.40
-77.149706 38.800292 Bioretention 0.14 0.14 - $30,145 1.54 0.18 140.88 CBP Retrofits Expert Panel, RR, 2.5 inches of runoff treated 100% 0.21 0.04 33.03 1.33 0.15 107.85
-77.153626 38.803747 Bioretention 0.20 0.20 - $30,145 1.59 0.19 145.62 CBP Retrofits Expert Panel, RR, 0.59 inches of runoff treated 100% 0.31 0.05 47.79 1.28 0.14 97.83
53 Fire and Rescue Training Academy II 9/27/2014 -77.374890 38.854557 Permeable Pavement 0.82 0.65 0.17 $89,210 8.04 0.87 660.28 CBP Retrofits Expert Panel, RR, 1.94 inches of runoff treated 100% 1.09 0.17 154.89 6.95 0.70 505.39
-77.200901 38.788123 Wet Pond 48.69 18.57 30.12 $2,741,101 245.37 26.54 21,533.00 CBP Retrofits Expert Panel, ST, 2.5 inches of runoff treated 80% 28.72 2.80 2,198.18 216.65 23.74 19,334.82
-77.200141 38.786728 Permeable Pavement 0.17 0.17 - $100,000 1.82 0.21 166.51 CBP Retrofits Expert Panel, RR, 1.97 inches of runoff treated 100% 0.26 0.04 39.82 1.56 0.17 126.69
55 Armfield Sec 5 11/15/2014 -77.418565 38.895334 Constructed Wetland 78.79 27.43 51.36 $317,413 232.16 24.39 19,507.74 CBP Retrofits Expert Panel, ST, 0.43 inches of runoff treated 2% 1.04 0.12 95.16 231.12 24.27 19,412.58
56 Village Park, The Sec 2B, 3 (PC81-
0001/0090DP)
11/17/2014 -77.294542 38.798033 Constructed Wetland 11.21 3.99 7.22 $378,936 45.48 4.81 3,861.72 CBP Retrofits Expert Panel, ST, 0.8 inches of runoff treated 0% - - - 45.48 4.81 3,861.72
Infiltration 0.15 0.06 0.09 $15,625 1.53 0.11 81.80 CBP Established Efficiency, Infiltration Practices w/o Sand, Veg. 0% - - - 1.53 0.11 81.80
Filtering Practices 0.14 0.03 0.11 $15,625 0.65 0.06 43.58 CBP Established Efficiency, Filtering Practices 0% - - - 0.65 0.06 43.58
Filtering Practices 0.12 0.04 0.08 $15,625 0.59 0.06 48.73 CBP Established Efficiency, Filtering Practices 0% - - - 0.59 0.06 48.73
Vegetated Roof 0.03 0.03 - $33,378 - - - CBP Retrofits Expert Panel, RR, 0 inches of runoff treated 0% - - - - - -
Dry Swale 0.10 0.04 0.06 $15,625 0.90 0.07 45.92 CBP Established Efficiency, Bioswale 0% - - - 0.90 0.07 45.92
Permeable Pavement 0.48 0.30 0.18 $130,625 0.69 0.11 210.67 CBP Established Efficiency, Permeable Pavement w/o Sand, Veg. C/D soils,
underdrain
0% - - - 0.69 0.11 210.67
-77.143146 38.851594 Permeable Pavement 0.05 0.05 - $64,672 0.55 0.06 49.96 CBP Retrofits Expert Panel, RR, 2.5 inches of runoff treated 0% - - - 0.55 0.06 49.96
-77.143323 38.851510 Permeable Pavement 0.09 0.09 - $116,417 0.98 0.12 89.92 CBP Retrofits Expert Panel, RR, 2.5 inches of runoff treated 0% - - - 0.98 0.12 89.92
-77.143205 38.851222 Permeable Pavement 0.03 0.03 - $38,804 0.33 0.04 29.97 CBP Retrofits Expert Panel, RR, 2.5 inches of runoff treated 0% - - - 0.33 0.04 29.97
59 Bradley Acres Section 2A Retrofit 3/16/2015 -77.401801 38.929260 Constructed Wetland 37.43 16.65 20.78 $589,000 73.50 12.42 11,577.80 CBP Established Efficiency, Wet Ponds and Wetlands 83% 23.58 2.59 2,112.06 49.92 9.83 9,465.74
60 Rolling Valley West Synthetic Field (PC87-
0002)
4/1/2015 -77.267215 38.772643 Dry Swale 1.45 - 1.45 $22,270 10.22 0.45 203.93 CBP Established Efficiency, Bioswale 100% 0.88 0.04 22.30 9.34 0.40 181.62
61 Mason Neck West 5/1/2015 -77.226473 38.675419 Constructed Wetland 12.01 1.67 10.34 $270,360 52.77 4.35 3,011.03 CBP Retrofits Expert Panel, ST, 2.46 inches of runoff treated 95% 7.77 0.74 576.88 45.00 3.61 2,434.15
-77.350396 -77.350396 Bioretention 22.70 3.74 18.96 $90,120 63.50 6.22 4,242.65 CBP Established Efficiency, Bioretention C/D soils, underdrain 0% - - - 63.50 6.22 4,242.65
-77.350679 -77.350679 Bioretention 18.87 2.47 16.40 $90,120 51.70 4.83 3,176.95 CBP Established Efficiency, Bioretention C/D soils, underdrain 2% 0.66 0.11 73.07 51.04 4.72 3,103.88
-77.350653 -77.350653 Bioretention 5.32 2.18 3.14 $90,120 17.09 2.17 1,708.02 CBP Established Efficiency, Bioretention C/D soils, underdrain 2% 0.16 0.03 24.11 16.93 2.14 1,683.91
63 McLean Police Station 9/3/2015 -77.198050 38.932822 Permeable Pavement 2.30 2.00 0.30 $109,895 19.40 2.18 1,664.09 CBP Retrofits Expert Panel, RR, 0.79 inches of runoff treated 0% - - - 19.40 2.18 1,664.09
64 Hayfield HS (DC9510) 9/5/2015 -77.142496 38.752329 Infiltration 2.31 2.31 - $180,380 31.16 3.18 2,570.46 CBP Established Efficiency, Infiltration Practices w/o Sand, Veg. 0% - - - 31.16 3.18 2,570.46
65 George Marshall High School 12/2/2015 -77.214078 38.903052 Rainwater Harvesting 16.32 10.12 6.20 $1,753,000 114.20 9.28 6,342.42 CBP Retrofits Expert Panel, RR, 1.24 inches of runoff treated 0% - - - 114.20 9.28 6,342.42
66 Penderbrook (DF9045/0691DP) 3/8/2016 -77.362336 38.877710 Constructed Wetland 22.53 2.60 19.93 $105,021 79.14 6.30 4,239.05 CBP Retrofits Expert Panel, ST, 0.79 inches of runoff treated 90% 15.11 1.14 800.65 64.03 5.16 3,438.40
-77.266997 39.009740 Constructed Wetland 30.02 5.49 24.53 $66,700 50.94 6.63 5,371.46 CBP Established Efficiency, Wet Ponds and Wetlands 0% - - - 50.94 6.63 5,371.46
-77.266793 39.008740 Constructed Wetland 2.98 0.60 2.38 $41,750 5.11 0.68 560.60 CBP Established Efficiency, Wet Ponds and Wetlands 100% 2.39 0.17 177.17 2.72 0.51 383.43
-77.298599 38.799900 Constructed Wetland 68.65 19.31 49.34 $142,823 123.36 18.03 15,646.08 CBP Established Efficiency, Wet Ponds and Wetlands 0% - - - 123.36 18.03 15,646.08
-77.298203 38.799000 Constructed Wetland 68.65 19.31 49.34 $142,823 123.36 18.03 15,646.08 CBP Established Efficiency, Wet Ponds and Wetlands 0% - - - 123.36 18.03 15,646.08
69 Golden Woods 8/9/2016 -77.260902 39.017101 Constructed Wetland 30.00 4.50 25.50 $447,800 129.34 10.84 7,584.52 CBP Retrofits Expert Panel, ST, 1.92 inches of runoff treated 1% 0.23 0.02 15.19 129.11 10.82 7,569.33
Subtotal: 2,720.46 964.09 1,756.37 22,883,021.07 6,686.48 632.39 768,366.39 634.28 55.18 48,484.07 5,846.03 558.51 706,262.20
52 Indian Run Stream Restoration 9/26/2014
54 Brookfield Park Dam 11/14/2014
58 Woodrow Wilson Library Stormwater
Enhancements
1/13/2015
57
68 Colony Park Sec 1 Rec Center Lower PD
(PC9131/0175DP&0390DP)
5/22/2016
62 Oakton Swim and Racquet Club (DF9045A6) 5/22/2015
67 Potomac Meadows Pond Retrofits
38.863721-77.234023
3/18/2016
Merrifield Human Services Center (Mid
County)
11/21/2014
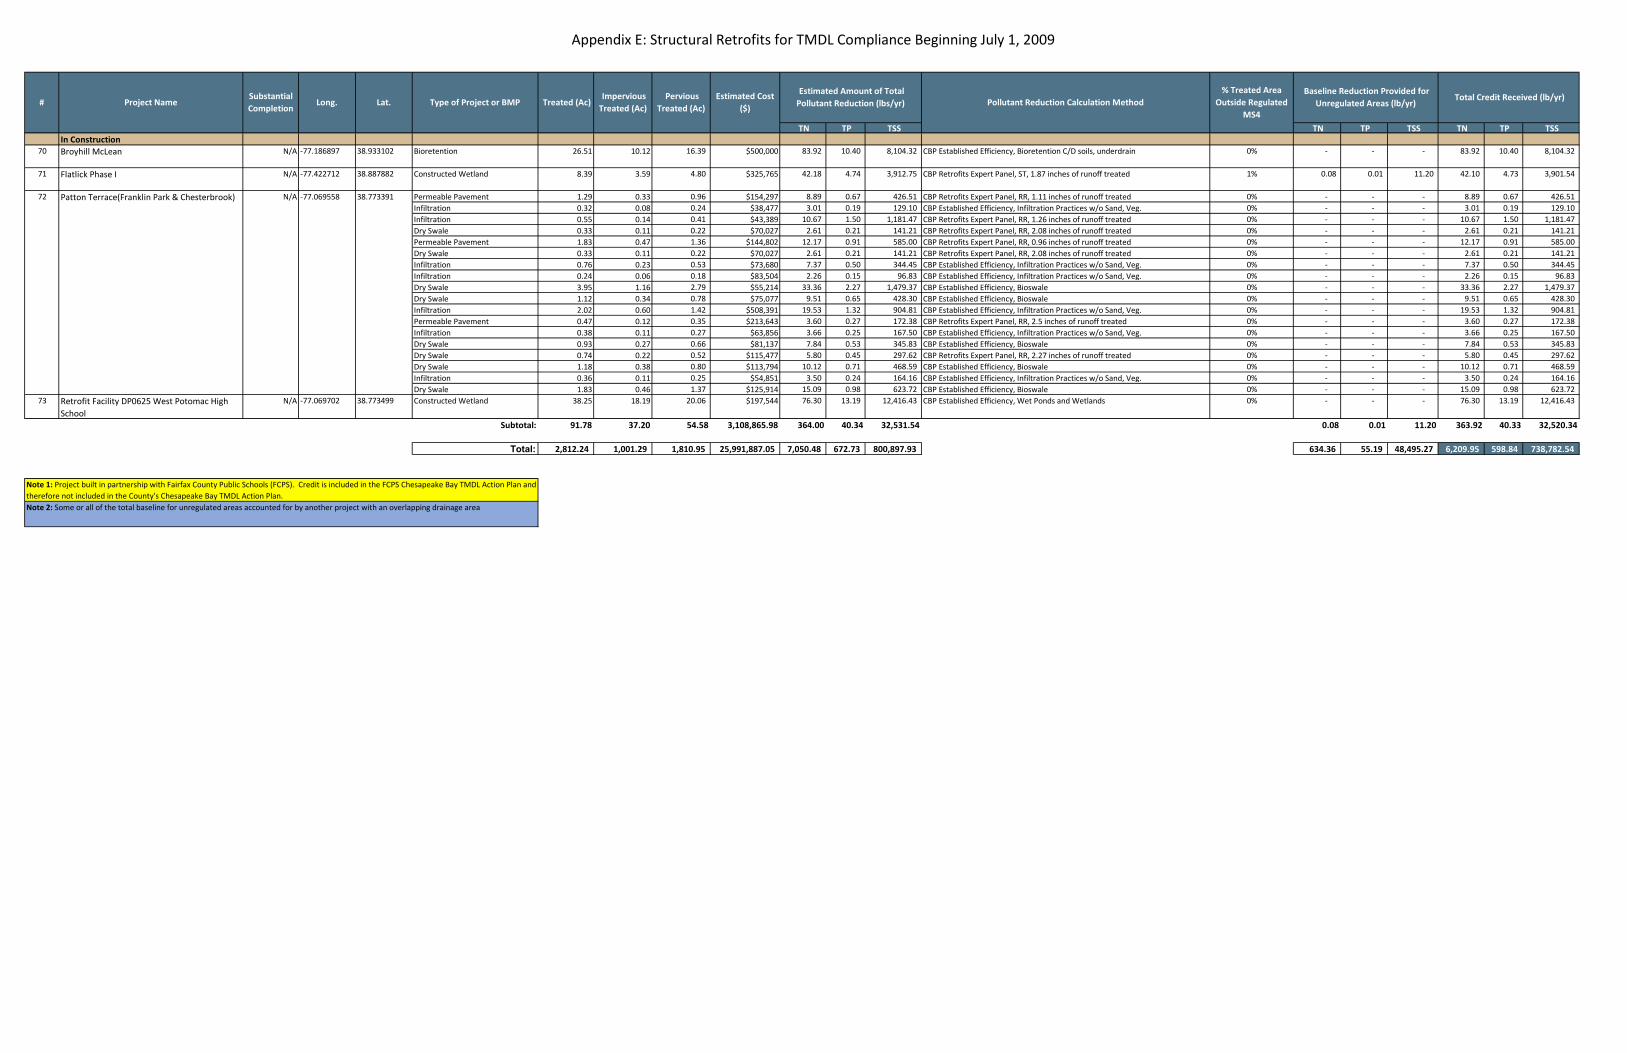
Appendix E: Structural Retrofits for TMDL Compliance Beginning July 1, 2009
TN TP TSS TN TP TSS TN TP TSS
# Project NameSubstantial
CompletionLong.
% Treated Area
Outside Regulated
MS4
Baseline Reduction Provided for
Unregulated Areas (lb/yr) Total Credit Received (lb/yr)
Type of Project or BMP Treated (Ac) Impervious
Treated (Ac)
Pervious
Treated (Ac)
Estimated Cost
($)
Estimated Amount of Total
Pollutant Reduction (lbs/yr) Pollutant Reduction Calculation MethodLat.
In Construction70 Broyhill McLean N/A -77.186897 38.933102 Bioretention 26.51 10.12 16.39 $500,000 83.92 10.40 8,104.32 CBP Established Efficiency, Bioretention C/D soils, underdrain 0% - - - 83.92 10.40 8,104.32
71 Flatlick Phase I N/A -77.422712 38.887882 Constructed Wetland 8.39 3.59 4.80 $325,765 42.18 4.74 3,912.75 CBP Retrofits Expert Panel, ST, 1.87 inches of runoff treated 1% 0.08 0.01 11.20 42.10 4.73 3,901.54
Permeable Pavement 1.29 0.33 0.96 $154,297 8.89 0.67 426.51 CBP Retrofits Expert Panel, RR, 1.11 inches of runoff treated 0% - - - 8.89 0.67 426.51
Infiltration 0.32 0.08 0.24 $38,477 3.01 0.19 129.10 CBP Established Efficiency, Infiltration Practices w/o Sand, Veg. 0% - - - 3.01 0.19 129.10
Infiltration 0.55 0.14 0.41 $43,389 10.67 1.50 1,181.47 CBP Retrofits Expert Panel, RR, 1.26 inches of runoff treated 0% - - - 10.67 1.50 1,181.47
Dry Swale 0.33 0.11 0.22 $70,027 2.61 0.21 141.21 CBP Retrofits Expert Panel, RR, 2.08 inches of runoff treated 0% - - - 2.61 0.21 141.21
Permeable Pavement 1.83 0.47 1.36 $144,802 12.17 0.91 585.00 CBP Retrofits Expert Panel, RR, 0.96 inches of runoff treated 0% - - - 12.17 0.91 585.00
Dry Swale 0.33 0.11 0.22 $70,027 2.61 0.21 141.21 CBP Retrofits Expert Panel, RR, 2.08 inches of runoff treated 0% - - - 2.61 0.21 141.21
Infiltration 0.76 0.23 0.53 $73,680 7.37 0.50 344.45 CBP Established Efficiency, Infiltration Practices w/o Sand, Veg. 0% - - - 7.37 0.50 344.45
Infiltration 0.24 0.06 0.18 $83,504 2.26 0.15 96.83 CBP Established Efficiency, Infiltration Practices w/o Sand, Veg. 0% - - - 2.26 0.15 96.83
Dry Swale 3.95 1.16 2.79 $55,214 33.36 2.27 1,479.37 CBP Established Efficiency, Bioswale 0% - - - 33.36 2.27 1,479.37
Dry Swale 1.12 0.34 0.78 $75,077 9.51 0.65 428.30 CBP Established Efficiency, Bioswale 0% - - - 9.51 0.65 428.30
Infiltration 2.02 0.60 1.42 $508,391 19.53 1.32 904.81 CBP Established Efficiency, Infiltration Practices w/o Sand, Veg. 0% - - - 19.53 1.32 904.81
Permeable Pavement 0.47 0.12 0.35 $213,643 3.60 0.27 172.38 CBP Retrofits Expert Panel, RR, 2.5 inches of runoff treated 0% - - - 3.60 0.27 172.38
Infiltration 0.38 0.11 0.27 $63,856 3.66 0.25 167.50 CBP Established Efficiency, Infiltration Practices w/o Sand, Veg. 0% - - - 3.66 0.25 167.50
Dry Swale 0.93 0.27 0.66 $81,137 7.84 0.53 345.83 CBP Established Efficiency, Bioswale 0% - - - 7.84 0.53 345.83
Dry Swale 0.74 0.22 0.52 $115,477 5.80 0.45 297.62 CBP Retrofits Expert Panel, RR, 2.27 inches of runoff treated 0% - - - 5.80 0.45 297.62
Dry Swale 1.18 0.38 0.80 $113,794 10.12 0.71 468.59 CBP Established Efficiency, Bioswale 0% - - - 10.12 0.71 468.59
Infiltration 0.36 0.11 0.25 $54,851 3.50 0.24 164.16 CBP Established Efficiency, Infiltration Practices w/o Sand, Veg. 0% - - - 3.50 0.24 164.16
Dry Swale 1.83 0.46 1.37 $125,914 15.09 0.98 623.72 CBP Established Efficiency, Bioswale 0% - - - 15.09 0.98 623.72
73 Retrofit Facility DP0625 West Potomac High
School
N/A -77.069702 38.773499 Constructed Wetland 38.25 18.19 20.06 $197,544 76.30 13.19 12,416.43 CBP Established Efficiency, Wet Ponds and Wetlands 0% - - - 76.30 13.19 12,416.43
Subtotal: 91.78 37.20 54.58 3,108,865.98 364.00 40.34 32,531.54 0.08 0.01 11.20 363.92 40.33 32,520.34
Total: 2,812.24 1,001.29 1,810.95 25,991,887.05 7,050.48 672.73 800,897.93 634.36 55.19 48,495.27 6,209.95 598.84 738,782.54
Note 1: Project built in partnership with Fairfax County Public Schools (FCPS). Credit is included in the FCPS Chesapeake Bay TMDL Action Plan and
therefore not included in the County's Chesapeake Bay TMDL Action Plan.
Note 2: Some or all of the total baseline for unregulated areas accounted for by another project with an overlapping drainage area
-77.069558 38.77339172 Patton Terrace(Franklin Park & Chesterbrook) N/A

Appendix F
Appendix F
Stream Restoration for TMDL Compliance Beginning July 1, 2009
As indicated in DEQ’s Chesapeake Bay TMDL Special Condition Guidance, the list of stream restoration
projects is followed by pictures documenting the degraded nature of the stream prior to restoration. Each
project is cross-referenced by project number and is identified as being either construction complete (CC)
or under construction (UC).

Appendix F
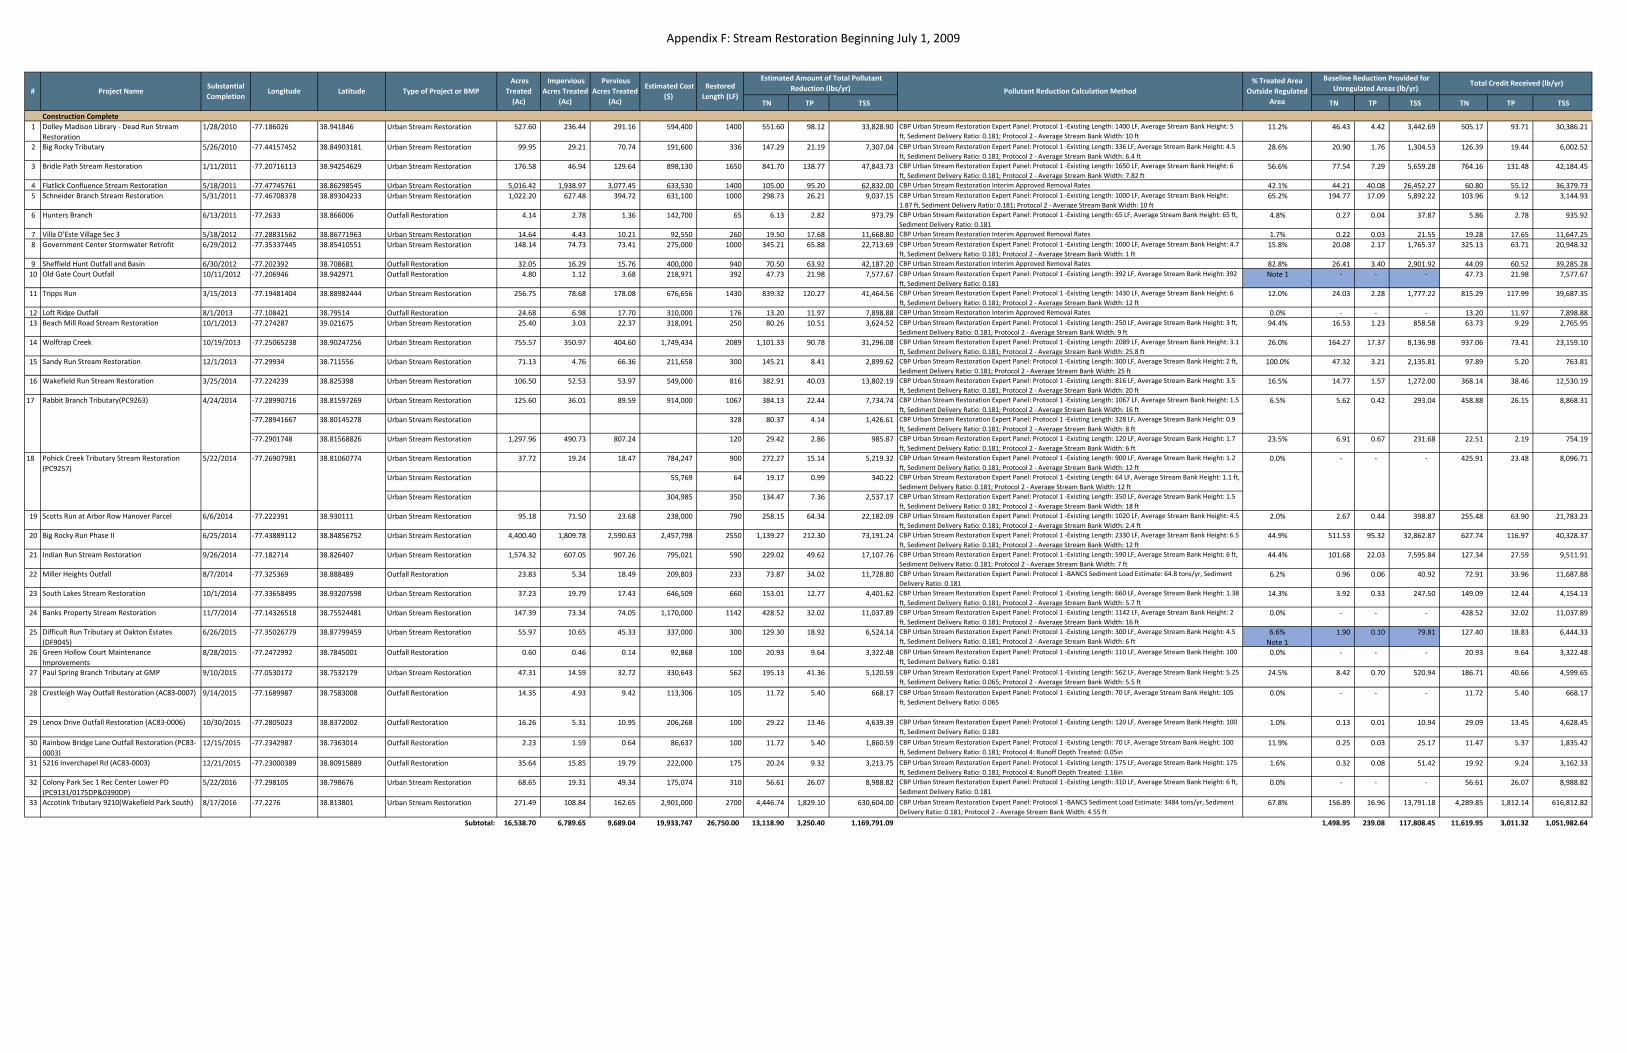
Appendix F: Stream Restoration Beginning July 1, 2009
TN TP TSS TN TP TSS TN TP TSS
Construction Complete
1 Dolley Madison Library - Dead Run Stream
Restoration
1/28/2010 -77.186026 38.941846 Urban Stream Restoration 527.60 236.44 291.16 594,400 1400 551.60 98.12 33,828.90 CBP Urban Stream Restoration Expert Panel: Protocol 1 -Existing Length: 1400 LF, Average Stream Bank Height: 5
ft, Sediment Delivery Ratio: 0.181; Protocol 2 - Average Stream Bank Width: 10 ft11.2% 46.43 4.42 3,442.69 505.17 93.71 30,386.21
2 Big Rocky Tributary 5/26/2010 -77.44157452 38.84903181 Urban Stream Restoration 99.95 29.21 70.74 191,600 336 147.29 21.19 7,307.04 CBP Urban Stream Restoration Expert Panel: Protocol 1 -Existing Length: 336 LF, Average Stream Bank Height: 4.5
ft, Sediment Delivery Ratio: 0.181; Protocol 2 - Average Stream Bank Width: 6.4 ft28.6% 20.90 1.76 1,304.53 126.39 19.44 6,002.52
3 Bridle Path Stream Restoration 1/11/2011 -77.20716113 38.94254629 Urban Stream Restoration 176.58 46.94 129.64 898,130 1650 841.70 138.77 47,843.73 CBP Urban Stream Restoration Expert Panel: Protocol 1 -Existing Length: 1650 LF, Average Stream Bank Height: 6
ft, Sediment Delivery Ratio: 0.181; Protocol 2 - Average Stream Bank Width: 7.82 ft56.6% 77.54 7.29 5,659.28 764.16 131.48 42,184.45
4 Flatlick Confluence Stream Restoration 5/18/2011 -77.47745761 38.86298545 Urban Stream Restoration 5,016.42 1,938.97 3,077.45 633,530 1400 105.00 95.20 62,832.00 CBP Urban Stream Restoration Interim Approved Removal Rates 42.1% 44.21 40.08 26,452.27 60.80 55.12 36,379.73
5 Schneider Branch Stream Restoration 5/31/2011 -77.46708378 38.89304233 Urban Stream Restoration 1,022.20 627.48 394.72 631,100 1000 298.73 26.21 9,037.15 CBP Urban Stream Restoration Expert Panel: Protocol 1 -Existing Length: 1000 LF, Average Stream Bank Height:
1.87 ft, Sediment Delivery Ratio: 0.181; Protocol 2 - Average Stream Bank Width: 10 ft65.2% 194.77 17.09 5,892.22 103.96 9.12 3,144.93
6 Hunters Branch 6/13/2011 -77.2633 38.866006 Outfall Restoration 4.14 2.78 1.36 142,700 65 6.13 2.82 973.79 CBP Urban Stream Restoration Expert Panel: Protocol 1 -Existing Length: 65 LF, Average Stream Bank Height: 65 ft,
Sediment Delivery Ratio: 0.181 4.8% 0.27 0.04 37.87 5.86 2.78 935.92
7 Villa D'Este Village Sec 3 5/18/2012 -77.28831562 38.86771963 Urban Stream Restoration 14.64 4.43 10.21 92,550 260 19.50 17.68 11,668.80 CBP Urban Stream Restoration Interim Approved Removal Rates 1.7% 0.22 0.03 21.55 19.28 17.65 11,647.25
8 Government Center Stormwater Retrofit 6/29/2012 -77.35337445 38.85410551 Urban Stream Restoration 148.14 74.73 73.41 275,000 1000 345.21 65.88 22,713.69 CBP Urban Stream Restoration Expert Panel: Protocol 1 -Existing Length: 1000 LF, Average Stream Bank Height: 4.7
ft, Sediment Delivery Ratio: 0.181; Protocol 2 - Average Stream Bank Width: 1 ft15.8% 20.08 2.17 1,765.37 325.13 63.71 20,948.32
9 Sheffield Hunt Outfall and Basin 6/30/2012 -77.202392 38.708681 Outfall Restoration 32.05 16.29 15.76 400,000 940 70.50 63.92 42,187.20 CBP Urban Stream Restoration Interim Approved Removal Rates 82.8% 26.41 3.40 2,901.92 44.09 60.52 39,285.28
10 Old Gate Court Outfall 10/11/2012 -77.206946 38.942971 Outfall Restoration 4.80 1.12 3.68 218,971 392 47.73 21.98 7,577.67 CBP Urban Stream Restoration Expert Panel: Protocol 1 -Existing Length: 392 LF, Average Stream Bank Height: 392
ft, Sediment Delivery Ratio: 0.181 Note 1 - - - 47.73 21.98 7,577.67
11 Tripps Run 3/15/2013 -77.19481404 38.88982444 Urban Stream Restoration 256.75 78.68 178.08 676,656 1430 839.32 120.27 41,464.56 CBP Urban Stream Restoration Expert Panel: Protocol 1 -Existing Length: 1430 LF, Average Stream Bank Height: 6
ft, Sediment Delivery Ratio: 0.181; Protocol 2 - Average Stream Bank Width: 12 ft12.0% 24.03 2.28 1,777.22 815.29 117.99 39,687.35
12 Loft Ridge Outfall 8/1/2013 -77.108421 38.79514 Outfall Restoration 24.68 6.98 17.70 310,000 176 13.20 11.97 7,898.88 CBP Urban Stream Restoration Interim Approved Removal Rates 0.0% - - - 13.20 11.97 7,898.88
13 Beach Mill Road Stream Restoration 10/1/2013 -77.274287 39.021675 Urban Stream Restoration 25.40 3.03 22.37 318,091 250 80.26 10.51 3,624.52 CBP Urban Stream Restoration Expert Panel: Protocol 1 -Existing Length: 250 LF, Average Stream Bank Height: 3 ft,
Sediment Delivery Ratio: 0.181; Protocol 2 - Average Stream Bank Width: 9 ft94.4% 16.53 1.23 858.58 63.73 9.29 2,765.95
14 Wolftrap Creek 10/19/2013 -77.25065238 38.90247256 Urban Stream Restoration 755.57 350.97 404.60 1,749,434 2089 1,101.33 90.78 31,296.08 CBP Urban Stream Restoration Expert Panel: Protocol 1 -Existing Length: 2089 LF, Average Stream Bank Height: 3.1
ft, Sediment Delivery Ratio: 0.181; Protocol 2 - Average Stream Bank Width: 25.8 ft26.0% 164.27 17.37 8,136.98 937.06 73.41 23,159.10
15 Sandy Run Stream Restoration 12/1/2013 -77.29934 38.711556 Urban Stream Restoration 71.13 4.76 66.36 211,658 300 145.21 8.41 2,899.62 CBP Urban Stream Restoration Expert Panel: Protocol 1 -Existing Length: 300 LF, Average Stream Bank Height: 2 ft,
Sediment Delivery Ratio: 0.181; Protocol 2 - Average Stream Bank Width: 25 ft100.0% 47.32 3.21 2,135.81 97.89 5.20 763.81
16 Wakefield Run Stream Restoration 3/25/2014 -77.224239 38.825398 Urban Stream Restoration 106.50 52.53 53.97 549,000 816 382.91 40.03 13,802.19 CBP Urban Stream Restoration Expert Panel: Protocol 1 -Existing Length: 816 LF, Average Stream Bank Height: 3.5
ft, Sediment Delivery Ratio: 0.181; Protocol 2 - Average Stream Bank Width: 20 ft16.5% 14.77 1.57 1,272.00 368.14 38.46 12,530.19
-77.28990716 38.81597269 Urban Stream Restoration 125.60 36.01 89.59 914,000 1067 384.13 22.44 7,734.74 CBP Urban Stream Restoration Expert Panel: Protocol 1 -Existing Length: 1067 LF, Average Stream Bank Height: 1.5
ft, Sediment Delivery Ratio: 0.181; Protocol 2 - Average Stream Bank Width: 16 ft
-77.28941667 38.80145278 Urban Stream Restoration 328 80.37 4.14 1,426.61 CBP Urban Stream Restoration Expert Panel: Protocol 1 -Existing Length: 328 LF, Average Stream Bank Height: 0.9
ft, Sediment Delivery Ratio: 0.181; Protocol 2 - Average Stream Bank Width: 8 ft
-77.2901748 38.81568826 Urban Stream Restoration 1,297.96 490.73 807.24 120 29.42 2.86 985.87 CBP Urban Stream Restoration Expert Panel: Protocol 1 -Existing Length: 120 LF, Average Stream Bank Height: 1.7
ft, Sediment Delivery Ratio: 0.181; Protocol 2 - Average Stream Bank Width: 6 ft23.5% 6.91 0.67 231.68 22.51 2.19 754.19
Urban Stream Restoration 37.72 19.24 18.47 784,247 900 272.27 15.14 5,219.32 CBP Urban Stream Restoration Expert Panel: Protocol 1 -Existing Length: 900 LF, Average Stream Bank Height: 1.2
ft, Sediment Delivery Ratio: 0.181; Protocol 2 - Average Stream Bank Width: 12 ft
Urban Stream Restoration 55,769 64 19.17 0.99 340.22 CBP Urban Stream Restoration Expert Panel: Protocol 1 -Existing Length: 64 LF, Average Stream Bank Height: 1.1 ft,
Sediment Delivery Ratio: 0.181; Protocol 2 - Average Stream Bank Width: 12 ft
Urban Stream Restoration 304,985 350 134.47 7.36 2,537.17 CBP Urban Stream Restoration Expert Panel: Protocol 1 -Existing Length: 350 LF, Average Stream Bank Height: 1.5
ft, Sediment Delivery Ratio: 0.181; Protocol 2 - Average Stream Bank Width: 18 ft
19 Scotts Run at Arbor Row Hanover Parcel 6/6/2014 -77.222391 38.930111 Urban Stream Restoration 95.18 71.50 23.68 238,000 790 258.15 64.34 22,182.09 CBP Urban Stream Restoration Expert Panel: Protocol 1 -Existing Length: 1020 LF, Average Stream Bank Height: 4.5
ft, Sediment Delivery Ratio: 0.181; Protocol 2 - Average Stream Bank Width: 2.4 ft2.0% 2.67 0.44 398.87 255.48 63.90 21,783.23
20 Big Rocky Run Phase II 6/25/2014 -77.43889112 38.84856752 Urban Stream Restoration 4,400.40 1,809.78 2,590.63 2,457,798 2550 1,139.27 212.30 73,191.24 CBP Urban Stream Restoration Expert Panel: Protocol 1 -Existing Length: 2330 LF, Average Stream Bank Height: 6.5
ft, Sediment Delivery Ratio: 0.181; Protocol 2 - Average Stream Bank Width: 12 ft44.9% 511.53 95.32 32,862.87 627.74 116.97 40,328.37
21 Indian Run Stream Restoration 9/26/2014 -77.182714 38.826407 Urban Stream Restoration 1,574.32 607.05 907.26 795,021 590 229.02 49.62 17,107.76 CBP Urban Stream Restoration Expert Panel: Protocol 1 -Existing Length: 590 LF, Average Stream Bank Height: 6 ft,
Sediment Delivery Ratio: 0.181; Protocol 2 - Average Stream Bank Width: 7 ft44.4% 101.68 22.03 7,595.84 127.34 27.59 9,511.91
22 Miller Heights Outfall 8/7/2014 -77.325369 38.888489 Outfall Restoration 23.83 5.34 18.49 209,803 233 73.87 34.02 11,728.80 CBP Urban Stream Restoration Expert Panel: Protocol 1 -BANCS Sediment Load Estimate: 64.8 tons/yr, Sediment
Delivery Ratio: 0.181 6.2% 0.96 0.06 40.92 72.91 33.96 11,687.88
23 South Lakes Stream Restoration 10/1/2014 -77.33658495 38.93207598 Urban Stream Restoration 37.23 19.79 17.43 646,509 660 153.01 12.77 4,401.62 CBP Urban Stream Restoration Expert Panel: Protocol 1 -Existing Length: 660 LF, Average Stream Bank Height: 1.38
ft, Sediment Delivery Ratio: 0.181; Protocol 2 - Average Stream Bank Width: 5.7 ft14.3% 3.92 0.33 247.50 149.09 12.44 4,154.13
24 Banks Property Stream Restoration 11/7/2014 -77.14326518 38.75524481 Urban Stream Restoration 147.39 73.34 74.05 1,170,000 1142 428.52 32.02 11,037.89 CBP Urban Stream Restoration Expert Panel: Protocol 1 -Existing Length: 1142 LF, Average Stream Bank Height: 2
ft, Sediment Delivery Ratio: 0.181; Protocol 2 - Average Stream Bank Width: 16 ft0.0% - - - 428.52 32.02 11,037.89
25 Difficult Run Tributary at Oakton Estates
(DF9045)
6/26/2015 -77.35026779 38.87799459 Urban Stream Restoration 55.97 10.65 45.33 337,000 300 129.30 18.92 6,524.14 CBP Urban Stream Restoration Expert Panel: Protocol 1 -Existing Length: 300 LF, Average Stream Bank Height: 4.5
ft, Sediment Delivery Ratio: 0.181; Protocol 2 - Average Stream Bank Width: 6 ft
6.6%
Note 1
1.90 0.10 79.81 127.40 18.83 6,444.33
26 Green Hollow Court Maintenance
Improvements
8/28/2015 -77.2472992 38.7845001 Outfall Restoration 0.60 0.46 0.14 92,868 100 20.93 9.64 3,322.48 CBP Urban Stream Restoration Expert Panel: Protocol 1 -Existing Length: 110 LF, Average Stream Bank Height: 100
ft, Sediment Delivery Ratio: 0.181 0.0% - - - 20.93 9.64 3,322.48
27 Paul Spring Branch Tributary at GMP 9/10/2015 -77.0530172 38.7532179 Urban Stream Restoration 47.31 14.59 32.72 330,643 562 195.13 41.36 5,120.59 CBP Urban Stream Restoration Expert Panel: Protocol 1 -Existing Length: 562 LF, Average Stream Bank Height: 5.25
ft, Sediment Delivery Ratio: 0.065; Protocol 2 - Average Stream Bank Width: 5.5 ft24.5% 8.42 0.70 520.94 186.71 40.66 4,599.65
28 Crestleigh Way Outfall Restoration (AC83-0007) 9/14/2015 -77.1689987 38.7583008 Outfall Restoration 14.35 4.93 9.42 113,306 105 11.72 5.40 668.17 CBP Urban Stream Restoration Expert Panel: Protocol 1 -Existing Length: 70 LF, Average Stream Bank Height: 105
ft, Sediment Delivery Ratio: 0.065 0.0% - - - 11.72 5.40 668.17
29 Lenox Drive Outfall Restoration (AC83-0006) 10/30/2015 -77.2805023 38.8372002 Outfall Restoration 16.26 5.31 10.95 206,268 100 29.22 13.46 4,639.39 CBP Urban Stream Restoration Expert Panel: Protocol 1 -Existing Length: 120 LF, Average Stream Bank Height: 100
ft, Sediment Delivery Ratio: 0.181 1.0% 0.13 0.01 10.94 29.09 13.45 4,628.45
30 Rainbow Bridge Lane Outfall Restoration (PC83-
0003)
12/15/2015 -77.2342987 38.7363014 Outfall Restoration 2.23 1.59 0.64 86,637 100 11.72 5.40 1,860.59 CBP Urban Stream Restoration Expert Panel: Protocol 1 -Existing Length: 70 LF, Average Stream Bank Height: 100
ft, Sediment Delivery Ratio: 0.181; Protocol 4: Runoff Depth Treated: 0.05in11.9% 0.25 0.03 25.17 11.47 5.37 1,835.42
31 5216 Inverchapel Rd (AC83-0003) 12/21/2015 -77.23000389 38.80915889 Outfall Restoration 35.64 15.85 19.79 222,000 175 20.24 9.32 3,213.75 CBP Urban Stream Restoration Expert Panel: Protocol 1 -Existing Length: 175 LF, Average Stream Bank Height: 175
ft, Sediment Delivery Ratio: 0.181; Protocol 4: Runoff Depth Treated: 1.16in1.6% 0.32 0.08 51.42 19.92 9.24 3,162.33
32 Colony Park Sec 1 Rec Center Lower PD
(PC9131/0175DP&0390DP)
5/22/2016 -77.298105 38.798676 Urban Stream Restoration 68.65 19.31 49.34 175,074 310 56.61 26.07 8,988.82 CBP Urban Stream Restoration Expert Panel: Protocol 1 -Existing Length: 310 LF, Average Stream Bank Height: 6 ft,
Sediment Delivery Ratio: 0.1810.0% - - - 56.61 26.07 8,988.82
33 Accotink Tributary 9210(Wakefield Park South) 8/17/2016 -77.2276 38.813801 Urban Stream Restoration 271.49 108.84 162.65 2,901,000 2700 4,446.74 1,829.10 630,604.00 CBP Urban Stream Restoration Expert Panel: Protocol 1 -BANCS Sediment Load Estimate: 3484 tons/yr, Sediment
Delivery Ratio: 0.181; Protocol 2 - Average Stream Bank Width: 4.55 ft67.8% 156.89 16.96 13,791.18 4,289.85 1,812.14 616,812.82
Subtotal: 16,538.70 6,789.65 9,689.04 19,933,747 26,750.00 13,118.90 3,250.40 1,169,791.09 1,498.95 239.08 117,808.45 11,619.95 3,011.32 1,051,982.64
8,868.31 26.15 458.88 293.04 0.42 5.62 6.5%
8,096.71 23.48 425.91 - - - 0.0%18 Pohick Creek Tributary Stream Restoration
(PC9257)
5/22/2014
Total Credit Received (lb/yr) Estimated Cost
($)
Restored
Length (LF)
17 4/24/2014Rabbit Branch Tributary(PC9263)
Longitude Latitude
Estimated Amount of Total Pollutant
Reduction (lbs/yr) Pollutant Reduction Calculation Method
% Treated Area
Outside Regulated
Area
Baseline Reduction Provided for
Unregulated Areas (lb/yr) Type of Project or BMP
Acres
Treated
(Ac)
Impervious
Acres Treated
(Ac)
Pervious
Acres Treated
(Ac)
# Project NameSubstantial
Completion
-77.26907981 38.81060774
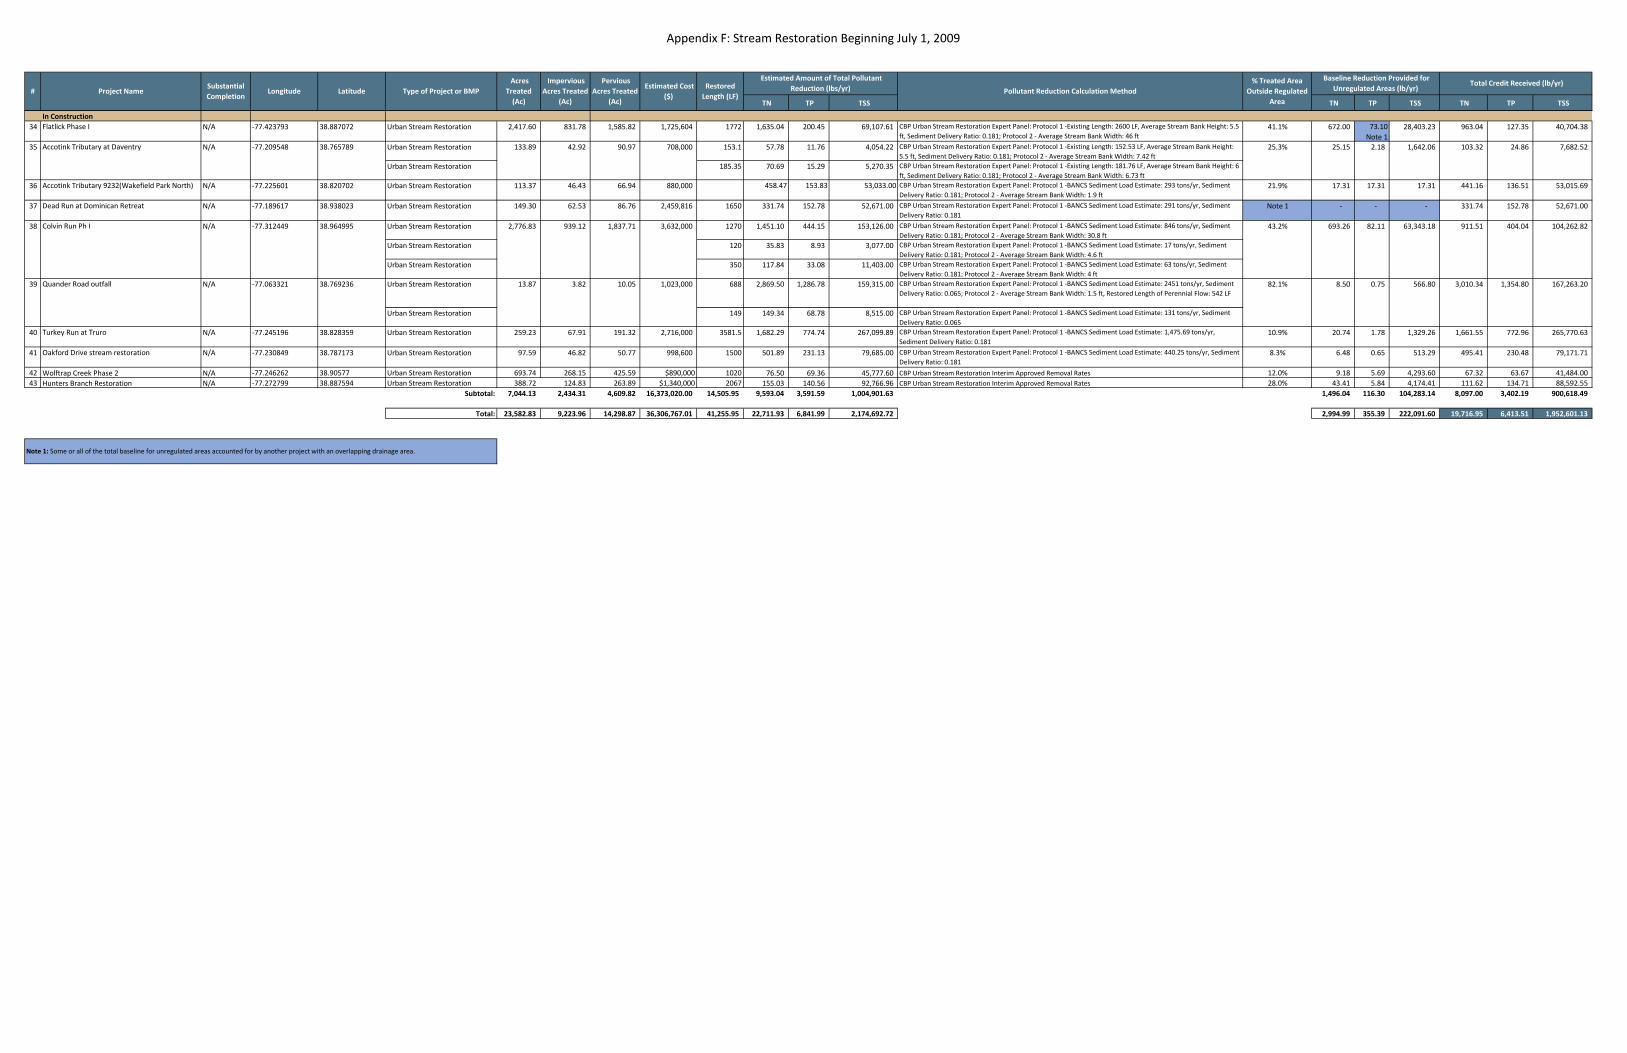
Appendix F: Stream Restoration Beginning July 1, 2009
TN TP TSS TN TP TSS TN TP TSS
Total Credit Received (lb/yr) Estimated Cost
($)
Restored
Length (LF)Longitude Latitude
Estimated Amount of Total Pollutant
Reduction (lbs/yr) Pollutant Reduction Calculation Method
% Treated Area
Outside Regulated
Area
Baseline Reduction Provided for
Unregulated Areas (lb/yr) Type of Project or BMP
Acres
Treated
(Ac)
Impervious
Acres Treated
(Ac)
Pervious
Acres Treated
(Ac)
# Project NameSubstantial
Completion
In Construction
34 Flatlick Phase I N/A -77.423793 38.887072 Urban Stream Restoration 2,417.60 831.78 1,585.82 1,725,604 1772 1,635.04 200.45 69,107.61 CBP Urban Stream Restoration Expert Panel: Protocol 1 -Existing Length: 2600 LF, Average Stream Bank Height: 5.5
ft, Sediment Delivery Ratio: 0.181; Protocol 2 - Average Stream Bank Width: 46 ft41.1% 672.00 73.10
Note 1
28,403.23 963.04 127.35 40,704.38
Urban Stream Restoration 153.1 57.78 11.76 4,054.22 CBP Urban Stream Restoration Expert Panel: Protocol 1 -Existing Length: 152.53 LF, Average Stream Bank Height:
5.5 ft, Sediment Delivery Ratio: 0.181; Protocol 2 - Average Stream Bank Width: 7.42 ft
Urban Stream Restoration 185.35 70.69 15.29 5,270.35 CBP Urban Stream Restoration Expert Panel: Protocol 1 -Existing Length: 181.76 LF, Average Stream Bank Height: 6
ft, Sediment Delivery Ratio: 0.181; Protocol 2 - Average Stream Bank Width: 6.73 ft
36 Accotink Tributary 9232(Wakefield Park North) N/A -77.225601 38.820702 Urban Stream Restoration 113.37 46.43 66.94 880,000 458.47 153.83 53,033.00 CBP Urban Stream Restoration Expert Panel: Protocol 1 -BANCS Sediment Load Estimate: 293 tons/yr, Sediment
Delivery Ratio: 0.181; Protocol 2 - Average Stream Bank Width: 1.9 ft21.9% 17.31 17.31 17.31 441.16 136.51 53,015.69
37 Dead Run at Dominican Retreat N/A -77.189617 38.938023 Urban Stream Restoration 149.30 62.53 86.76 2,459,816 1650 331.74 152.78 52,671.00 CBP Urban Stream Restoration Expert Panel: Protocol 1 -BANCS Sediment Load Estimate: 291 tons/yr, Sediment
Delivery Ratio: 0.181Note 1 - - - 331.74 152.78 52,671.00
Urban Stream Restoration 1270 1,451.10 444.15 153,126.00 CBP Urban Stream Restoration Expert Panel: Protocol 1 -BANCS Sediment Load Estimate: 846 tons/yr, Sediment
Delivery Ratio: 0.181; Protocol 2 - Average Stream Bank Width: 30.8 ft
Urban Stream Restoration 120 35.83 8.93 3,077.00 CBP Urban Stream Restoration Expert Panel: Protocol 1 -BANCS Sediment Load Estimate: 17 tons/yr, Sediment
Delivery Ratio: 0.181; Protocol 2 - Average Stream Bank Width: 4.6 ft
Urban Stream Restoration 350 117.84 33.08 11,403.00 CBP Urban Stream Restoration Expert Panel: Protocol 1 -BANCS Sediment Load Estimate: 63 tons/yr, Sediment
Delivery Ratio: 0.181; Protocol 2 - Average Stream Bank Width: 4 ft
Urban Stream Restoration 688 2,869.50 1,286.78 159,315.00 CBP Urban Stream Restoration Expert Panel: Protocol 1 -BANCS Sediment Load Estimate: 2451 tons/yr, Sediment
Delivery Ratio: 0.065; Protocol 2 - Average Stream Bank Width: 1.5 ft, Restored Length of Perennial Flow: 542 LF
Urban Stream Restoration 149 149.34 68.78 8,515.00 CBP Urban Stream Restoration Expert Panel: Protocol 1 -BANCS Sediment Load Estimate: 131 tons/yr, Sediment
Delivery Ratio: 0.065
40 Turkey Run at Truro N/A -77.245196 38.828359 Urban Stream Restoration 259.23 67.91 191.32 2,716,000 3581.5 1,682.29 774.74 267,099.89 CBP Urban Stream Restoration Expert Panel: Protocol 1 -BANCS Sediment Load Estimate: 1,475.69 tons/yr,
Sediment Delivery Ratio: 0.18110.9% 20.74 1.78 1,329.26 1,661.55 772.96 265,770.63
41 Oakford Drive stream restoration N/A -77.230849 38.787173 Urban Stream Restoration 97.59 46.82 50.77 998,600 1500 501.89 231.13 79,685.00 CBP Urban Stream Restoration Expert Panel: Protocol 1 -BANCS Sediment Load Estimate: 440.25 tons/yr, Sediment
Delivery Ratio: 0.1818.3% 6.48 0.65 513.29 495.41 230.48 79,171.71
42 Wolftrap Creek Phase 2 N/A -77.246262 38.90577 Urban Stream Restoration 693.74 268.15 425.59 $890,000 1020 76.50 69.36 45,777.60 CBP Urban Stream Restoration Interim Approved Removal Rates 12.0% 9.18 5.69 4,293.60 67.32 63.67 41,484.00
43 Hunters Branch Restoration N/A -77.272799 38.887594 Urban Stream Restoration 388.72 124.83 263.89 $1,340,000 2067 155.03 140.56 92,766.96 CBP Urban Stream Restoration Interim Approved Removal Rates 28.0% 43.41 5.84 4,174.41 111.62 134.71 88,592.55
Subtotal: 7,044.13 2,434.31 4,609.82 16,373,020.00 14,505.95 9,593.04 3,591.59 1,004,901.63 1,496.04 116.30 104,283.14 8,097.00 3,402.19 900,618.49
Total: 23,582.83 9,223.96 14,298.87 36,306,767.01 41,255.95 22,711.93 6,841.99 2,174,692.72 2,994.99 355.39 222,091.60 19,716.95 6,413.51 1,952,601.13
10.05 1,023,000 82.1% 8.50 0.75 566.80 3,010.34 1,354.80 167,263.20 39 Quander Road outfall N/A -77.063321 38.769236 13.87 3.82
24.86 7,682.52
38 Colvin Run Ph I N/A -77.312449 38.964995 2,776.83 939.12 1,837.71 3,632,000 43.2% 693.26 82.11 63,343.18 911.51 404.04 104,262.82
133.89 42.92 90.97 708,000 25.3% 25.15 2.18 1,642.06 103.32
Note 1: Some or all of the total baseline for unregulated areas accounted for by another project with an overlapping drainage area.
35 Accotink Tributary at Daventry N/A -77.209548 38.765789

Appendix G
Appendix G
Facilities Installed Between January 1, 2006 and June 30, 2009

Appendix G
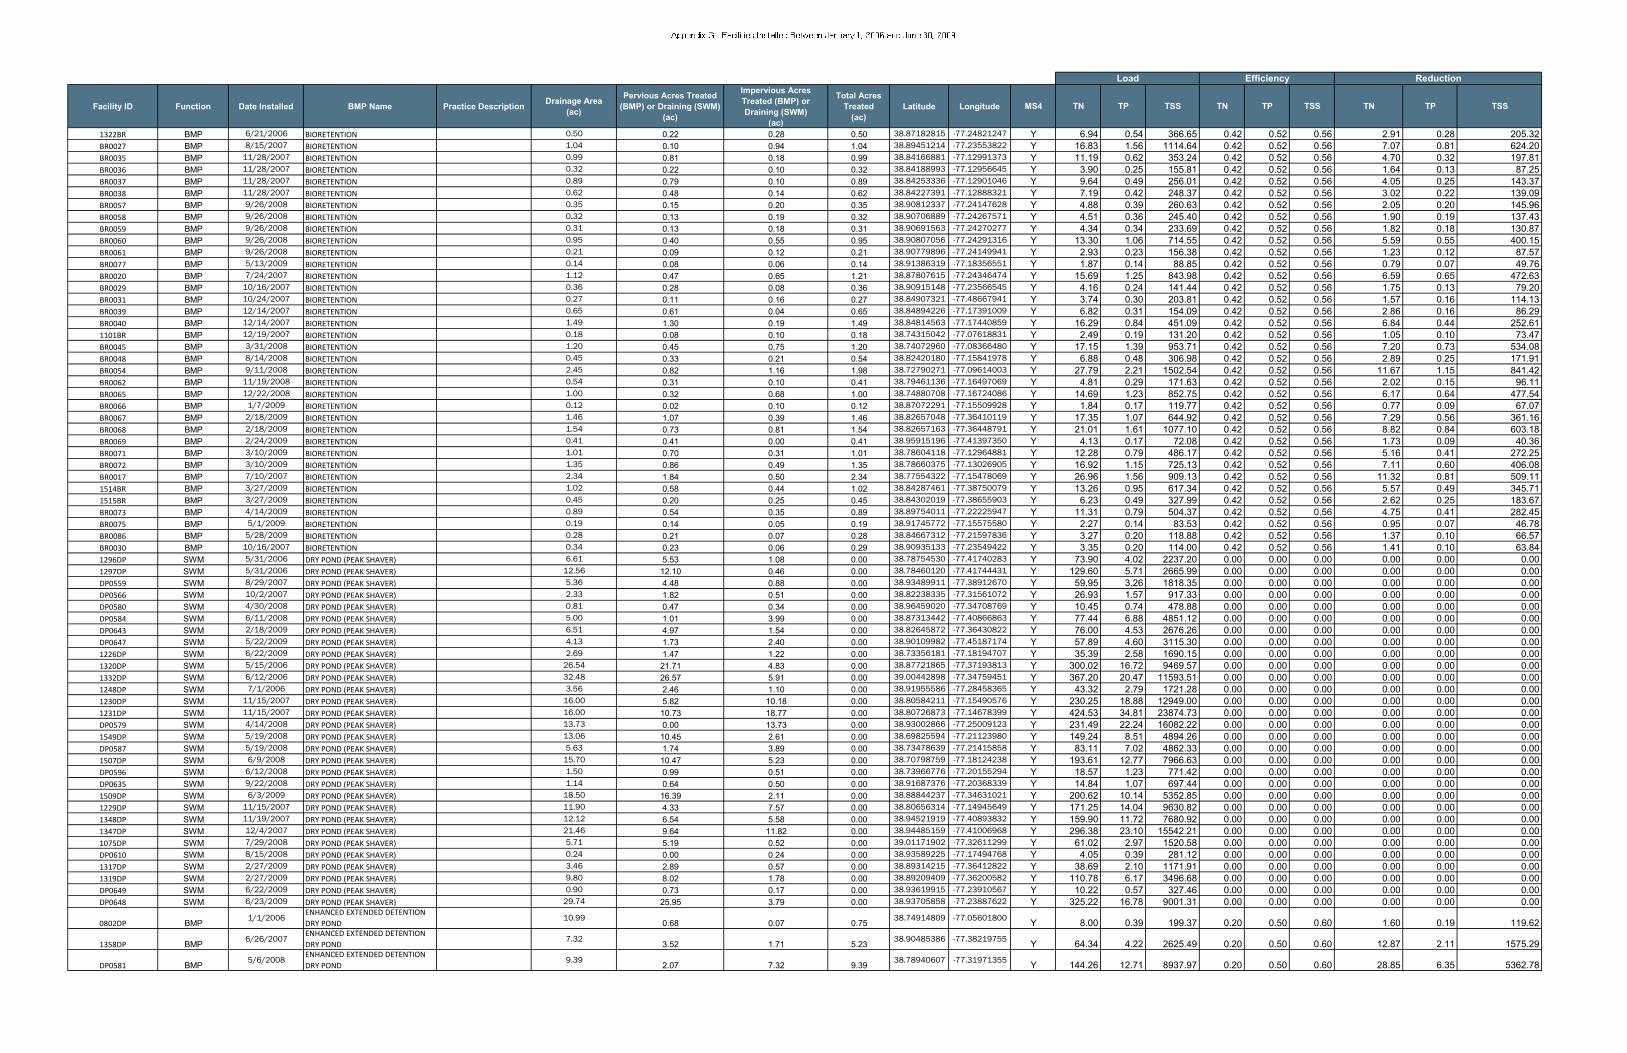
Facility ID Function Date Installed BMP Name Practice DescriptionDrainage Area
(ac)
Pervious Acres Treated
(BMP) or Draining (SWM)
(ac)
Impervious Acres
Treated (BMP) or
Draining (SWM)
(ac)
Total Acres
Treated
(ac)
Latitude Longitude MS4 TN TP TSS TN TP TSS TN TP TSS
1322BR BMP 6/21/2006 BIORETENTION 0.50 0.22 0.28 0.50 38.87182815 -77.24821247 Y 6.94 0.54 366.65 0.42 0.52 0.56 2.91 0.28 205.32
BR0027 BMP 8/15/2007 BIORETENTION 1.04 0.10 0.94 1.04 38.89451214 -77.23553822 Y 16.83 1.56 1114.64 0.42 0.52 0.56 7.07 0.81 624.20
BR0035 BMP 11/28/2007 BIORETENTION 0.99 0.81 0.18 0.99 38.84166881 -77.12991373 Y 11.19 0.62 353.24 0.42 0.52 0.56 4.70 0.32 197.81
BR0036 BMP 11/28/2007 BIORETENTION 0.32 0.22 0.10 0.32 38.84188993 -77.12956645 Y 3.90 0.25 155.81 0.42 0.52 0.56 1.64 0.13 87.25
BR0037 BMP 11/28/2007 BIORETENTION 0.89 0.79 0.10 0.89 38.84253336 -77.12901046 Y 9.64 0.49 256.01 0.42 0.52 0.56 4.05 0.25 143.37
BR0038 BMP 11/28/2007 BIORETENTION 0.62 0.48 0.14 0.62 38.84227391 -77.12888321 Y 7.19 0.42 248.37 0.42 0.52 0.56 3.02 0.22 139.09
BR0057 BMP 9/26/2008 BIORETENTION 0.35 0.15 0.20 0.35 38.90812337 -77.24147628 Y 4.88 0.39 260.63 0.42 0.52 0.56 2.05 0.20 145.96
BR0058 BMP 9/26/2008 BIORETENTION 0.32 0.13 0.19 0.32 38.90706889 -77.24267571 Y 4.51 0.36 245.40 0.42 0.52 0.56 1.90 0.19 137.43
BR0059 BMP 9/26/2008 BIORETENTION 0.31 0.13 0.18 0.31 38.90691563 -77.24270277 Y 4.34 0.34 233.69 0.42 0.52 0.56 1.82 0.18 130.87
BR0060 BMP 9/26/2008 BIORETENTION 0.95 0.40 0.55 0.95 38.90807056 -77.24291316 Y 13.30 1.06 714.55 0.42 0.52 0.56 5.59 0.55 400.15
BR0061 BMP 9/26/2008 BIORETENTION 0.21 0.09 0.12 0.21 38.90779896 -77.24149941 Y 2.93 0.23 156.38 0.42 0.52 0.56 1.23 0.12 87.57
BR0077 BMP 5/13/2009 BIORETENTION 0.14 0.08 0.06 0.14 38.91386319 -77.18356551 Y 1.87 0.14 88.85 0.42 0.52 0.56 0.79 0.07 49.76
BR0020 BMP 7/24/2007 BIORETENTION 1.12 0.47 0.65 1.21 38.87807615 -77.24346474 Y 15.69 1.25 843.98 0.42 0.52 0.56 6.59 0.65 472.63
BR0029 BMP 10/16/2007 BIORETENTION 0.36 0.28 0.08 0.36 38.90915148 -77.23566545 Y 4.16 0.24 141.44 0.42 0.52 0.56 1.75 0.13 79.20
BR0031 BMP 10/24/2007 BIORETENTION 0.27 0.11 0.16 0.27 38.84907321 -77.48667941 Y 3.74 0.30 203.81 0.42 0.52 0.56 1.57 0.16 114.13
BR0039 BMP 12/14/2007 BIORETENTION 0.65 0.61 0.04 0.65 38.84894226 -77.17391009 Y 6.82 0.31 154.09 0.42 0.52 0.56 2.86 0.16 86.29
BR0040 BMP 12/14/2007 BIORETENTION 1.49 1.30 0.19 1.49 38.84814563 -77.17440859 Y 16.29 0.84 451.09 0.42 0.52 0.56 6.84 0.44 252.61
1101BR BMP 12/19/2007 BIORETENTION 0.18 0.08 0.10 0.18 38.74315042 -77.07618831 Y 2.49 0.19 131.20 0.42 0.52 0.56 1.05 0.10 73.47
BR0045 BMP 3/31/2008 BIORETENTION 1.20 0.45 0.75 1.20 38.74072960 -77.08366480 Y 17.15 1.39 953.71 0.42 0.52 0.56 7.20 0.73 534.08
BR0048 BMP 8/14/2008 BIORETENTION 0.45 0.33 0.21 0.54 38.82420180 -77.15841978 Y 6.88 0.48 306.98 0.42 0.52 0.56 2.89 0.25 171.91
BR0054 BMP 9/11/2008 BIORETENTION 2.45 0.82 1.16 1.98 38.72790271 -77.09614003 Y 27.79 2.21 1502.54 0.42 0.52 0.56 11.67 1.15 841.42
BR0062 BMP 11/19/2008 BIORETENTION 0.54 0.31 0.10 0.41 38.79461136 -77.16497069 Y 4.81 0.29 171.63 0.42 0.52 0.56 2.02 0.15 96.11
BR0065 BMP 12/22/2008 BIORETENTION 1.00 0.32 0.68 1.00 38.74880708 -77.16724086 Y 14.69 1.23 852.75 0.42 0.52 0.56 6.17 0.64 477.54
BR0066 BMP 1/7/2009 BIORETENTION 0.12 0.02 0.10 0.12 38.87072291 -77.15509928 Y 1.84 0.17 119.77 0.42 0.52 0.56 0.77 0.09 67.07
BR0067 BMP 2/18/2009 BIORETENTION 1.46 1.07 0.39 1.46 38.82657048 -77.36410119 Y 17.35 1.07 644.92 0.42 0.52 0.56 7.29 0.56 361.16
BR0068 BMP 2/18/2009 BIORETENTION 1.54 0.73 0.81 1.54 38.82657163 -77.36448791 Y 21.01 1.61 1077.10 0.42 0.52 0.56 8.82 0.84 603.18
BR0069 BMP 2/24/2009 BIORETENTION 0.41 0.41 0.00 0.41 38.95915196 -77.41397350 Y 4.13 0.17 72.08 0.42 0.52 0.56 1.73 0.09 40.36
BR0071 BMP 3/10/2009 BIORETENTION 1.01 0.70 0.31 1.01 38.78604118 -77.12964881 Y 12.28 0.79 486.17 0.42 0.52 0.56 5.16 0.41 272.25
BR0072 BMP 3/10/2009 BIORETENTION 1.35 0.86 0.49 1.35 38.78660375 -77.13026905 Y 16.92 1.15 725.13 0.42 0.52 0.56 7.11 0.60 406.08
BR0017 BMP 7/10/2007 BIORETENTION 2.34 1.84 0.50 2.34 38.77554322 -77.15478069 Y 26.96 1.56 909.13 0.42 0.52 0.56 11.32 0.81 509.11
1514BR BMP 3/27/2009 BIORETENTION 1.02 0.58 0.44 1.02 38.84287461 -77.38750079 Y 13.26 0.95 617.34 0.42 0.52 0.56 5.57 0.49 345.71
1515BR BMP 3/27/2009 BIORETENTION 0.45 0.20 0.25 0.45 38.84302019 -77.38655903 Y 6.23 0.49 327.99 0.42 0.52 0.56 2.62 0.25 183.67
BR0073 BMP 4/14/2009 BIORETENTION 0.89 0.54 0.35 0.89 38.89754011 -77.22225947 Y 11.31 0.79 504.37 0.42 0.52 0.56 4.75 0.41 282.45
BR0075 BMP 5/1/2009 BIORETENTION 0.19 0.14 0.05 0.19 38.91745772 -77.15575580 Y 2.27 0.14 83.53 0.42 0.52 0.56 0.95 0.07 46.78
BR0086 BMP 5/28/2009 BIORETENTION 0.28 0.21 0.07 0.28 38.84667312 -77.21597836 Y 3.27 0.20 118.88 0.42 0.52 0.56 1.37 0.10 66.57
BR0030 BMP 10/16/2007 BIORETENTION 0.34 0.23 0.06 0.29 38.90935133 -77.23549422 Y 3.35 0.20 114.00 0.42 0.52 0.56 1.41 0.10 63.84
1296DP SWM 5/31/2006 DRY POND (PEAK SHAVER) 6.61 5.53 1.08 0.00 38.78754530 -77.41740283 Y 73.90 4.02 2237.20 0.00 0.00 0.00 0.00 0.00 0.00
1297DP SWM 5/31/2006 DRY POND (PEAK SHAVER) 12.56 12.10 0.46 0.00 38.78460120 -77.41744431 Y 129.60 5.71 2665.99 0.00 0.00 0.00 0.00 0.00 0.00
DP0559 SWM 8/29/2007 DRY POND (PEAK SHAVER) 5.36 4.48 0.88 0.00 38.93489911 -77.38912670 Y 59.95 3.26 1818.35 0.00 0.00 0.00 0.00 0.00 0.00
DP0566 SWM 10/2/2007 DRY POND (PEAK SHAVER) 2.33 1.82 0.51 0.00 38.82238335 -77.31561072 Y 26.93 1.57 917.33 0.00 0.00 0.00 0.00 0.00 0.00
DP0580 SWM 4/30/2008 DRY POND (PEAK SHAVER) 0.81 0.47 0.34 0.00 38.96459020 -77.34708769 Y 10.45 0.74 478.88 0.00 0.00 0.00 0.00 0.00 0.00
DP0584 SWM 6/11/2008 DRY POND (PEAK SHAVER) 5.00 1.01 3.99 0.00 38.87313442 -77.40866863 Y 77.44 6.88 4851.12 0.00 0.00 0.00 0.00 0.00 0.00
DP0643 SWM 2/18/2009 DRY POND (PEAK SHAVER) 6.51 4.97 1.54 0.00 38.82645872 -77.36430822 Y 76.00 4.53 2676.26 0.00 0.00 0.00 0.00 0.00 0.00
DP0647 SWM 5/22/2009 DRY POND (PEAK SHAVER) 4.13 1.73 2.40 0.00 38.90109982 -77.45187174 Y 57.89 4.60 3115.30 0.00 0.00 0.00 0.00 0.00 0.00
1226DP SWM 6/22/2009 DRY POND (PEAK SHAVER) 2.69 1.47 1.22 0.00 38.73356181 -77.18194707 Y 35.39 2.58 1690.15 0.00 0.00 0.00 0.00 0.00 0.00
1320DP SWM 5/15/2006 DRY POND (PEAK SHAVER) 26.54 21.71 4.83 0.00 38.87721865 -77.37193813 Y 300.02 16.72 9469.57 0.00 0.00 0.00 0.00 0.00 0.00
1332DP SWM 6/12/2006 DRY POND (PEAK SHAVER) 32.48 26.57 5.91 0.00 39.00442898 -77.34759451 Y 367.20 20.47 11593.51 0.00 0.00 0.00 0.00 0.00 0.00
1248DP SWM 7/1/2006 DRY POND (PEAK SHAVER) 3.56 2.46 1.10 0.00 38.91955586 -77.28458365 Y 43.32 2.79 1721.28 0.00 0.00 0.00 0.00 0.00 0.00
1230DP SWM 11/15/2007 DRY POND (PEAK SHAVER) 16.00 5.82 10.18 0.00 38.80584211 -77.15490576 Y 230.25 18.88 12949.00 0.00 0.00 0.00 0.00 0.00 0.00
1231DP SWM 11/15/2007 DRY POND (PEAK SHAVER) 16.00 10.73 18.77 0.00 38.80726873 -77.14678399 Y 424.53 34.81 23874.73 0.00 0.00 0.00 0.00 0.00 0.00
DP0579 SWM 4/14/2008 DRY POND (PEAK SHAVER) 13.73 0.00 13.73 0.00 38.93002866 -77.25009123 Y 231.49 22.24 16082.22 0.00 0.00 0.00 0.00 0.00 0.00
1549DP SWM 5/19/2008 DRY POND (PEAK SHAVER) 13.06 10.45 2.61 0.00 38.69825594 -77.21123980 Y 149.24 8.51 4894.26 0.00 0.00 0.00 0.00 0.00 0.00
DP0587 SWM 5/19/2008 DRY POND (PEAK SHAVER) 5.63 1.74 3.89 0.00 38.73478639 -77.21415858 Y 83.11 7.02 4862.33 0.00 0.00 0.00 0.00 0.00 0.00
1507DP SWM 6/9/2008 DRY POND (PEAK SHAVER) 15.70 10.47 5.23 0.00 38.70798759 -77.18124238 Y 193.61 12.77 7966.63 0.00 0.00 0.00 0.00 0.00 0.00
DP0596 SWM 6/12/2008 DRY POND (PEAK SHAVER) 1.50 0.99 0.51 0.00 38.73966776 -77.20155294 Y 18.57 1.23 771.42 0.00 0.00 0.00 0.00 0.00 0.00
DP0635 SWM 9/22/2008 DRY POND (PEAK SHAVER) 1.14 0.64 0.50 0.00 38.91687376 -77.20368339 Y 14.84 1.07 697.44 0.00 0.00 0.00 0.00 0.00 0.00
1509DP SWM 6/3/2009 DRY POND (PEAK SHAVER) 18.50 16.39 2.11 0.00 38.88844237 -77.34631021 Y 200.62 10.14 5352.85 0.00 0.00 0.00 0.00 0.00 0.00
1229DP SWM 11/15/2007 DRY POND (PEAK SHAVER) 11.90 4.33 7.57 0.00 38.80656314 -77.14945649 Y 171.25 14.04 9630.82 0.00 0.00 0.00 0.00 0.00 0.00
1348DP SWM 11/19/2007 DRY POND (PEAK SHAVER) 12.12 6.54 5.58 0.00 38.94521919 -77.40893832 Y 159.90 11.72 7680.92 0.00 0.00 0.00 0.00 0.00 0.00
1347DP SWM 12/4/2007 DRY POND (PEAK SHAVER) 21.46 9.64 11.82 0.00 38.94485159 -77.41006968 Y 296.38 23.10 15542.21 0.00 0.00 0.00 0.00 0.00 0.00
1075DP SWM 7/29/2008 DRY POND (PEAK SHAVER) 5.71 5.19 0.52 0.00 39.01171902 -77.32611299 Y 61.02 2.97 1520.58 0.00 0.00 0.00 0.00 0.00 0.00
DP0610 SWM 8/15/2008 DRY POND (PEAK SHAVER) 0.24 0.00 0.24 0.00 38.93589225 -77.17494768 Y 4.05 0.39 281.12 0.00 0.00 0.00 0.00 0.00 0.00
1317DP SWM 2/27/2009 DRY POND (PEAK SHAVER) 3.46 2.89 0.57 0.00 38.89314215 -77.36412822 Y 38.69 2.10 1171.91 0.00 0.00 0.00 0.00 0.00 0.00
1319DP SWM 2/27/2009 DRY POND (PEAK SHAVER) 9.80 8.02 1.78 0.00 38.89209409 -77.36200582 Y 110.78 6.17 3496.68 0.00 0.00 0.00 0.00 0.00 0.00
DP0649 SWM 6/22/2009 DRY POND (PEAK SHAVER) 0.90 0.73 0.17 0.00 38.93619915 -77.23910567 Y 10.22 0.57 327.46 0.00 0.00 0.00 0.00 0.00 0.00
DP0648 SWM 6/23/2009 DRY POND (PEAK SHAVER) 29.74 25.95 3.79 0.00 38.93705858 -77.23887622 Y 325.22 16.78 9001.31 0.00 0.00 0.00 0.00 0.00 0.00
0802DP BMP1/1/2006
ENHANCED EXTENDED DETENTION
DRY POND10.99
0.68 0.07 0.7538.74914809 -77.05601800
Y 8.00 0.39 199.37 0.20 0.50 0.60 1.60 0.19 119.62
1358DP BMP6/26/2007
ENHANCED EXTENDED DETENTION
DRY POND7.32
3.52 1.71 5.2338.90485386 -77.38219755
Y 64.34 4.22 2625.49 0.20 0.50 0.60 12.87 2.11 1575.29
DP0581 BMP5/6/2008
ENHANCED EXTENDED DETENTION
DRY POND9.39
2.07 7.32 9.3938.78940607 -77.31971355
Y 144.26 12.71 8937.97 0.20 0.50 0.60 28.85 6.35 5362.78
Load Efficiency Reduction

1520DP BMP4/2/2009
ENHANCED EXTENDED DETENTION
DRY POND8.30
5.67 2.63 8.3038.99909072 -77.35586405
Y 101.44 6.59 4077.36 0.20 0.50 0.60 20.29 3.29 2446.41
1377DP BMP 1/13/2006 EXTENDED DETENTION DRY POND 4.52 3.01 0.51 3.52 38.85263321 -77.19500860 Y 38.91 2.06 1126.53 0.20 0.40 0.60 7.78 0.82 675.92
1061DP BMP 5/15/2006 EXTENDED DETENTION DRY POND 2.96 0.56 1.37 1.93 38.82346934 -77.17730994 Y 28.73 2.45 1701.71 0.20 0.40 0.60 5.75 0.98 1021.03
1178DP BMP 12/14/2006 EXTENDED DETENTION DRY POND 12.70 3.15 0.70 3.85 38.98839808 -77.33669544 Y 43.48 2.42 1372.27 0.20 0.40 0.60 8.70 0.97 823.36
DP0516 BMP 4/3/2007 EXTENDED DETENTION DRY POND 46.60 32.20 14.40 46.60 38.87221791 -77.32188185 Y 567.07 36.53 22531.75 0.20 0.40 0.60 113.41 14.61 13519.05
1233DP BMP 5/8/2007 EXTENDED DETENTION DRY POND 5.38 1.36 0.34 1.69 38.74530991 -77.22416084 Y 19.36 1.10 635.17 0.20 0.40 0.60 3.87 0.44 381.10
1179DP BMP 12/14/2006 EXTENDED DETENTION DRY POND 9.60 2.36 0.53 2.89 38.99194924 -77.33596948 Y 32.67 1.82 1031.16 0.20 0.40 0.60 6.53 0.73 618.70
1235DP BMP 12/16/2006 EXTENDED DETENTION DRY POND 5.10 1.25 0.13 1.38 38.87027738 -77.31324326 Y 14.72 0.72 366.81 0.20 0.40 0.60 2.94 0.29 220.08
DP0517 BMP 4/4/2007 EXTENDED DETENTION DRY POND 1.59 0.32 0.67 0.99 38.83138207 -77.19586758 Y 14.52 1.22 841.04 0.20 0.40 0.60 2.90 0.49 504.62
1155DP BMP 5/7/2007 EXTENDED DETENTION DRY POND 4.80 0.86 0.07 0.93 38.87814801 -77.29136260 Y 9.80 0.46 230.33 0.20 0.40 0.60 1.96 0.18 138.20
DP0530 BMP 7/25/2007 EXTENDED DETENTION DRY POND 15.29 3.29 3.58 6.88 38.95910753 -77.35172061 Y 93.57 7.15 4775.75 0.20 0.40 0.60 18.71 2.86 2865.45
DP0536 BMP 8/3/2007 EXTENDED DETENTION DRY POND 9.48 5.87 3.61 9.48 38.94535262 -77.39848759 Y 119.98 8.25 5260.41 0.20 0.40 0.60 24.00 3.30 3156.25
DP0548 BMP 8/14/2007 EXTENDED DETENTION DRY POND 9.50 3.11 6.39 9.50 38.73829032 -77.07809449 Y 139.05 11.63 8031.47 0.20 0.40 0.60 27.81 4.65 4818.88
DP0549 BMP 8/14/2007 EXTENDED DETENTION DRY POND 1.71 0.40 1.31 1.71 38.88670069 -77.43234964 Y 26.14 2.29 1605.28 0.20 0.40 0.60 5.23 0.91 963.17
DP0553 BMP 8/20/2007 EXTENDED DETENTION DRY POND 1.09 0.66 0.43 1.09 38.74157353 -77.07859777 Y 13.90 0.97 619.70 0.20 0.40 0.60 2.78 0.39 371.82
DP0563 BMP 9/10/2007 EXTENDED DETENTION DRY POND 12.40 4.83 1.20 6.03 39.00228777 -77.35415600 Y 68.87 3.92 2254.70 0.20 0.40 0.60 13.77 1.57 1352.82
1119DP BMP 12/10/2007 EXTENDED DETENTION DRY POND 16.50 4.26 1.32 5.58 38.92255570 -77.39434748 Y 65.13 3.88 2293.27 0.20 0.40 0.60 13.03 1.55 1375.96
1258DP BMP 12/19/2007 EXTENDED DETENTION DRY POND 3.20 0.95 0.50 1.46 38.79515020 -77.11237028 Y 18.10 1.21 757.66 0.20 0.40 0.60 3.62 0.48 454.59
DP0573 BMP 12/20/2007 EXTENDED DETENTION DRY POND 14.21 0.93 1.91 2.84 38.95269740 -77.34059236 Y 41.57 3.48 2400.72 0.20 0.40 0.60 8.31 1.39 1440.43
DP0574 BMP 1/2/2008 EXTENDED DETENTION DRY POND 24.39 14.64 9.75 24.39 38.90842281 -77.42308651 Y 311.81 21.80 13994.08 0.20 0.40 0.60 62.36 8.72 8396.45
DP0555 BMP 8/24/2007 EXTENDED DETENTION DRY POND 3.15 2.00 1.15 3.15 38.99931560 -77.31069597 Y 39.50 2.68 1694.14 0.20 0.40 0.60 7.90 1.07 1016.48
DP0601 BMP 6/13/2008 EXTENDED DETENTION DRY POND 16.79 2.14 14.65 16.79 38.73015939 -77.18981798 Y 268.55 24.61 17536.05 0.20 0.40 0.60 53.71 9.84 10521.63
DP0621 BMP 9/11/2008 EXTENDED DETENTION DRY POND 2.90 0.26 2.64 2.90 38.89280581 -77.44618725 Y 47.13 4.38 3137.99 0.20 0.40 0.60 9.43 1.75 1882.80
DP0572 BMP 12/8/2008 EXTENDED DETENTION DRY POND 2.14 0.82 1.32 2.14 38.74451900 -77.21370117 Y 30.51 2.47 1690.30 0.20 0.40 0.60 6.10 0.99 1014.18
0276DP BMP 5/8/2009 EXTENDED DETENTION DRY POND 19.85 17.55 2.30 19.85 38.87514868 -77.33450340 Y 215.51 10.92 5779.33 0.20 0.40 0.60 43.10 4.37 3467.60
1465DP BMP 6/9/2009 EXTENDED DETENTION DRY POND 13.83 8.90 0.89 9.79 38.89968229 -77.30739974 Y 104.63 5.09 2607.09 0.20 0.40 0.60 20.93 2.04 1564.26
1466DP BMP 6/9/2009 EXTENDED DETENTION DRY POND 8.09 7.35 0.74 8.09 38.89899255 -77.30587716 Y 86.49 4.21 2158.91 0.20 0.40 0.60 17.30 1.68 1295.34
1522DP BMP 6/24/2009 EXTENDED DETENTION DRY POND 12.01 8.73 3.28 12.01 38.85155823 -77.26949591 Y 143.21 8.89 5376.66 0.20 0.40 0.60 28.64 3.56 3226.00
1387DP BMP 6/25/2009 EXTENDED DETENTION DRY POND 13.12 7.93 0.79 8.72 38.92529840 -77.25966880 Y 93.17 4.53 2319.44 0.20 0.40 0.60 18.63 1.81 1391.66
1392DP BMP 1/26/2006 EXTENDED DETENTION DRY POND 9.54 1.70 0.64 2.34 38.94864184 -77.26411825 Y 27.91 1.73 1048.50 0.20 0.40 0.60 5.58 0.69 629.10
1177DP BMP 1/27/2006 EXTENDED DETENTION DRY POND 6.57 2.38 0.00 2.38 38.99085036 -77.33349510 Y 23.92 0.97 417.61 0.20 0.40 0.60 4.78 0.39 250.57
1366DP BMP 4/2/2006 EXTENDED DETENTION DRY POND 33.60 26.44 5.91 32.35 38.85362080 -77.48602824 Y 365.93 20.42 11573.69 0.20 0.40 0.60 73.19 8.17 6944.22
1343DP BMP 4/28/2006 EXTENDED DETENTION DRY POND 4.06 1.14 0.25 1.39 38.99004457 -77.37824151 Y 15.73 0.88 496.58 0.20 0.40 0.60 3.15 0.35 297.95
1501DP BMP 5/5/2006 EXTENDED DETENTION DRY POND 6.37 3.67 2.43 6.10 38.91345528 -77.23724870 Y 77.93 5.44 3491.49 0.20 0.40 0.60 15.59 2.18 2094.90
1259DP BMP 6/2/2006 EXTENDED DETENTION DRY POND 2.62 0.99 0.28 1.27 38.72562727 -77.09977623 Y 14.68 0.86 499.32 0.20 0.40 0.60 2.94 0.34 299.59
1265DP BMP 6/12/2006 EXTENDED DETENTION DRY POND 3.82 0.72 0.26 0.99 38.73746321 -77.08121089 Y 11.71 0.72 434.13 0.20 0.40 0.60 2.34 0.29 260.48
1309DP BMP 6/21/2006 EXTENDED DETENTION DRY POND 13.54 3.65 2.08 5.73 38.83799460 -77.40550039 Y 71.85 4.87 3081.50 0.20 0.40 0.60 14.37 1.95 1848.90
1006DP BMP 12/11/2006 EXTENDED DETENTION DRY POND 32.99 10.27 1.75 12.02 38.89450044 -77.37030463 Y 132.91 7.04 3853.65 0.20 0.40 0.60 26.58 2.82 2312.19
1308DP BMP 12/12/2006 EXTENDED DETENTION DRY POND 18.00 4.83 2.76 7.59 38.83375909 -77.40636783 Y 95.20 6.45 4083.19 0.20 0.40 0.60 19.04 2.58 2449.91
1341DP BMP 12/15/2006 EXTENDED DETENTION DRY POND 12.00 3.20 1.43 4.63 38.75830052 -77.20276728 Y 56.34 3.63 2238.63 0.20 0.40 0.60 11.27 1.45 1343.18
1361DP BMP 12/19/2006 EXTENDED DETENTION DRY POND 3.74 0.49 0.79 1.28 38.94479080 -77.39839813 Y 18.26 1.48 1012.75 0.20 0.40 0.60 3.65 0.59 607.65
1194DP BMP 12/30/2006 EXTENDED DETENTION DRY POND 19.60 4.30 0.43 4.72 38.98646426 -77.32971939 Y 50.49 2.46 1258.15 0.20 0.40 0.60 10.10 0.98 754.89
1349DP BMP 1/18/2007 EXTENDED DETENTION DRY POND 36.96 9.72 8.10 17.82 38.92635184 -77.40863648 Y 234.42 17.11 11195.33 0.20 0.40 0.60 46.88 6.84 6717.20
1165DP BMP 5/4/2007 EXTENDED DETENTION DRY POND 9.56 0.30 0.25 0.54 38.84699387 -77.33919001 Y 7.14 0.52 340.81 0.20 0.40 0.60 1.43 0.21 204.49
1254DP BMP 5/14/2007 EXTENDED DETENTION DRY POND 3.39 0.61 1.63 2.25 38.78725075 -77.31573594 Y 33.72 2.90 2021.73 0.20 0.40 0.60 6.74 1.16 1213.04
1373DP BMP 5/25/2007 EXTENDED DETENTION DRY POND 7.50 6.27 1.23 7.50 38.71085518 -77.06624434 Y 83.88 4.56 2542.99 0.20 0.40 0.60 16.78 1.83 1525.79
1169DP BMP 5/30/2007 EXTENDED DETENTION DRY POND 4.34 0.95 2.11 3.06 38.87142206 -77.26001905 Y 45.17 3.81 2642.66 0.20 0.40 0.60 9.03 1.53 1585.59
1368DP BMP 6/26/2007 EXTENDED DETENTION DRY POND 10.83 8.56 2.27 10.08 38.84836443 -77.35374458 Y 124.47 7.19 4163.74 0.20 0.40 0.60 24.89 2.87 2498.25
DP0519 BMP 6/28/2007 EXTENDED DETENTION DRY POND 9.37 3.18 2.79 5.97 38.90402377 -77.29137040 Y 79.08 5.83 3829.71 0.20 0.40 0.60 15.82 2.33 2297.83
1500DP BMP 6/29/2007 EXTENDED DETENTION DRY POND 12.56 2.97 8.80 11.77 38.87056960 -77.37760486 Y 178.28 15.47 10829.74 0.20 0.40 0.60 35.66 6.19 6497.85
DP0534 BMP 7/31/2007 EXTENDED DETENTION DRY POND 1.95 0.17 1.63 1.80 38.83789730 -77.42025731 Y 29.22 2.72 1943.12 0.20 0.40 0.60 5.84 1.09 1165.87
DP0554 BMP 8/21/2007 EXTENDED DETENTION DRY POND 4.25 1.42 2.68 4.10 38.90352764 -77.42797924 Y 59.48 4.92 3388.77 0.20 0.40 0.60 11.90 1.97 2033.26
DP0556 BMP 8/24/2007 EXTENDED DETENTION DRY POND 6.58 1.18 5.38 6.56 38.95311590 -77.35219668 Y 102.59 9.20 6509.15 0.20 0.40 0.60 20.52 3.68 3905.49
DP0567 BMP 9/21/2007 EXTENDED DETENTION DRY POND 8.50 0.00 1.81 1.81 38.88858941 -77.38006487 Y 30.52 2.93 2120.09 0.20 0.40 0.60 6.10 1.17 1272.05
1086DP BMP 11/15/2007 EXTENDED DETENTION DRY POND 3.15 0.73 0.33 1.06 38.89646691 -77.20571443 Y 12.87 0.83 511.48 0.20 0.40 0.60 2.57 0.33 306.89
1085DP BMP 11/15/2007 EXTENDED DETENTION DRY POND 5.99 1.59 0.40 1.98 38.89624914 -77.20291295 Y 22.67 1.29 743.61 0.20 0.40 0.60 4.53 0.52 446.17
1190DP BMP 12/7/2007 EXTENDED DETENTION DRY POND 12.20 2.02 0.18 2.20 39.00620245 -77.36535668 Y 23.44 1.13 570.27 0.20 0.40 0.60 4.69 0.45 342.16
1153DP BMP 12/11/2007 EXTENDED DETENTION DRY POND 4.29 1.12 0.94 2.06 38.78030765 -77.08266363 Y 27.10 1.98 1294.32 0.20 0.40 0.60 5.42 0.79 776.59
1353DP BMP 12/11/2007 EXTENDED DETENTION DRY POND 8.23 2.15 1.55 3.70 38.84103741 -77.28247634 Y 47.76 3.39 2190.80 0.20 0.40 0.60 9.55 1.36 1314.48
1394DP BMP 12/11/2007 EXTENDED DETENTION DRY POND 4.30 3.13 1.05 4.18 38.80264627 -77.29886599 Y 49.22 2.98 1780.14 0.20 0.40 0.60 9.84 1.19 1068.08
1381DP BMP 2/7/2008 EXTENDED DETENTION DRY POND 24.58 13.06 4.43 17.49 38.78195261 -77.28165733 Y 206.20 12.53 7484.90 0.20 0.40 0.60 41.24 5.01 4490.94
1388DP BMP 3/7/2008 EXTENDED DETENTION DRY POND 19.99 5.53 10.66 16.19 38.87065743 -77.24963044 Y 235.41 19.54 13458.45 0.20 0.40 0.60 47.08 7.81 8075.07
DP0577 BMP 3/25/2008 EXTENDED DETENTION DRY POND 20.83 2.43 10.91 13.34 38.67231815 -77.24007485 Y 208.44 18.68 13210.78 0.20 0.40 0.60 41.69 7.47 7926.47
1154DP BMP 4/25/2008 EXTENDED DETENTION DRY POND 5.33 1.47 0.33 1.79 38.84070609 -77.28345322 Y 20.24 1.13 638.90 0.20 0.40 0.60 4.05 0.45 383.34
1220DP BMP 5/10/2008 EXTENDED DETENTION DRY POND 6.36 1.39 2.44 3.83 38.87246660 -77.38091239 Y 55.17 4.52 3102.59 0.20 0.40 0.60 11.03 1.81 1861.55
1191DP BMP 12/7/2007 EXTENDED DETENTION DRY POND 5.90 0.98 0.09 1.07 39.00808127 -77.36526313 Y 11.34 0.54 275.87 0.20 0.40 0.60 2.27 0.22 165.52
DP0608 BMP 7/23/2008 EXTENDED DETENTION DRY POND 7.30 6.95 0.35 7.30 38.79554268 -77.42775335 Y 75.89 3.42 1631.77 0.20 0.40 0.60 15.18 1.37 979.06
1203DP BMP 7/29/2008 EXTENDED DETENTION DRY POND 15.88 4.57 2.61 7.18 38.87015917 -77.25351864 Y 90.05 6.10 3862.14 0.20 0.40 0.60 18.01 2.44 2317.28
1301DP BMP 12/10/2007 EXTENDED DETENTION DRY POND 17.25 4.49 4.33 8.82 38.95381110 -77.42220923 Y 118.25 8.86 5862.51 0.20 0.40 0.60 23.65 3.54 3517.51
1370DP BMP 7/29/2008 EXTENDED DETENTION DRY POND 33.90 7.54 7.10 14.64 38.76293116 -77.21556887 Y 195.63 14.59 9641.90 0.20 0.40 0.60 39.13 5.84 5785.14
1390DP BMP 7/29/2008 EXTENDED DETENTION DRY POND 14.17 6.18 1.55 7.73 38.81496520 -77.27210083 Y 88.37 5.04 2901.99 0.20 0.40 0.60 17.67 2.02 1741.19
DP0622 BMP 9/11/2008 EXTENDED DETENTION DRY POND 3.18 0.29 2.89 3.18 38.89294970 -77.44865727 Y 51.65 4.80 3436.10 0.20 0.40 0.60 10.33 1.92 2061.66
DP0618 BMP 10/1/2008 EXTENDED DETENTION DRY POND 12.50 5.12 1.58 6.70 38.83251761 -77.15240594 Y 78.22 4.66 2754.76 0.20 0.40 0.60 15.64 1.87 1652.86
1268DP BMP 11/4/2008 EXTENDED DETENTION DRY POND 14.90 4.03 0.87 4.90 38.76950497 -77.19543625 Y 55.31 3.07 1731.86 0.20 0.40 0.60 11.06 1.23 1039.12
1087DP BMP 12/17/2007 EXTENDED DETENTION DRY POND 9.61 2.39 0.53 2.92 38.98712023 -77.36125101 Y 33.01 1.84 1041.87 0.20 0.40 0.60 6.60 0.74 625.12
1350DP BMP 12/9/2008 EXTENDED DETENTION DRY POND 4.55 1.19 1.00 2.19 38.92844782 -77.40434250 Y 28.81 2.10 1376.00 0.20 0.40 0.60 5.76 0.84 825.60
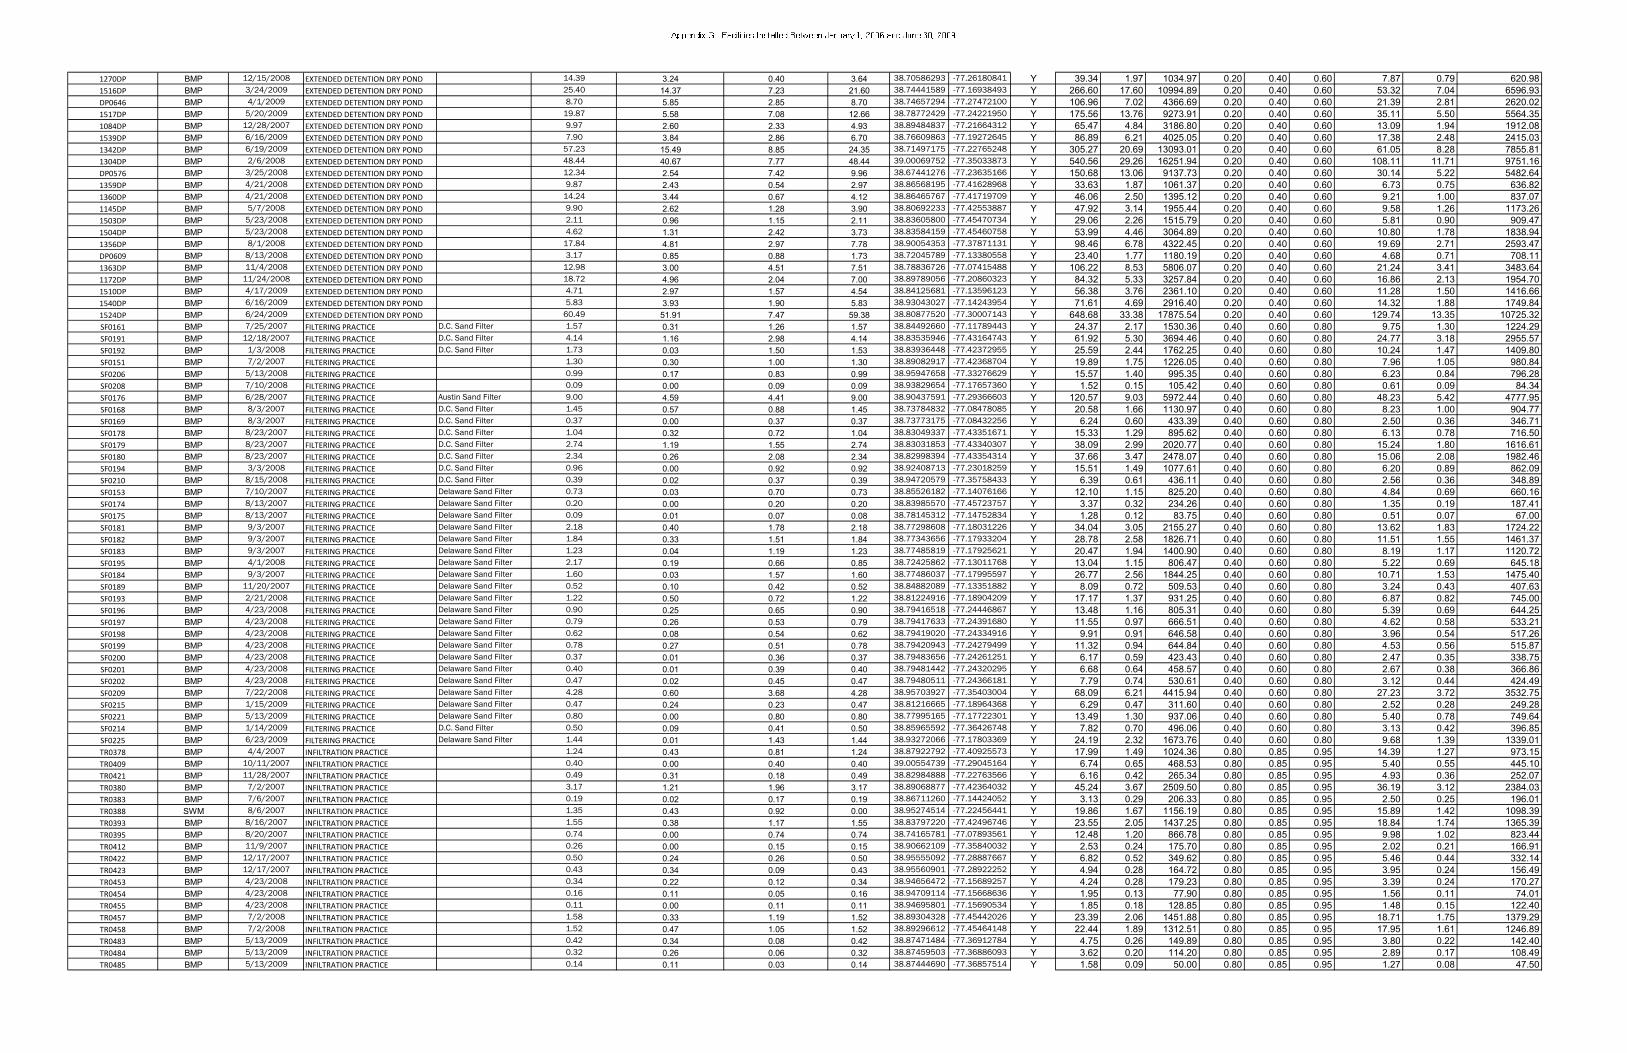
1270DP BMP 12/15/2008 EXTENDED DETENTION DRY POND 14.39 3.24 0.40 3.64 38.70586293 -77.26180841 Y 39.34 1.97 1034.97 0.20 0.40 0.60 7.87 0.79 620.98
1516DP BMP 3/24/2009 EXTENDED DETENTION DRY POND 25.40 14.37 7.23 21.60 38.74441589 -77.16938493 Y 266.60 17.60 10994.89 0.20 0.40 0.60 53.32 7.04 6596.93
DP0646 BMP 4/1/2009 EXTENDED DETENTION DRY POND 8.70 5.85 2.85 8.70 38.74657294 -77.27472100 Y 106.96 7.02 4366.69 0.20 0.40 0.60 21.39 2.81 2620.02
1517DP BMP 5/20/2009 EXTENDED DETENTION DRY POND 19.87 5.58 7.08 12.66 38.78772429 -77.24221950 Y 175.56 13.76 9273.91 0.20 0.40 0.60 35.11 5.50 5564.35
1084DP BMP 12/28/2007 EXTENDED DETENTION DRY POND 9.97 2.60 2.33 4.93 38.89484837 -77.21664312 Y 65.47 4.84 3186.80 0.20 0.40 0.60 13.09 1.94 1912.08
1539DP BMP 6/16/2009 EXTENDED DETENTION DRY POND 7.90 3.84 2.86 6.70 38.76609863 -77.19272645 Y 86.89 6.21 4025.05 0.20 0.40 0.60 17.38 2.48 2415.03
1342DP BMP 6/19/2009 EXTENDED DETENTION DRY POND 57.23 15.49 8.85 24.35 38.71497175 -77.22765248 Y 305.27 20.69 13093.01 0.20 0.40 0.60 61.05 8.28 7855.81
1304DP BMP 2/6/2008 EXTENDED DETENTION DRY POND 48.44 40.67 7.77 48.44 39.00069752 -77.35033873 Y 540.56 29.26 16251.94 0.20 0.40 0.60 108.11 11.71 9751.16
DP0576 BMP 3/25/2008 EXTENDED DETENTION DRY POND 12.34 2.54 7.42 9.96 38.67441276 -77.23635166 Y 150.68 13.06 9137.73 0.20 0.40 0.60 30.14 5.22 5482.64
1359DP BMP 4/21/2008 EXTENDED DETENTION DRY POND 9.87 2.43 0.54 2.97 38.86568195 -77.41628968 Y 33.63 1.87 1061.37 0.20 0.40 0.60 6.73 0.75 636.82
1360DP BMP 4/21/2008 EXTENDED DETENTION DRY POND 14.24 3.44 0.67 4.12 38.86465767 -77.41719709 Y 46.06 2.50 1395.12 0.20 0.40 0.60 9.21 1.00 837.07
1145DP BMP 5/7/2008 EXTENDED DETENTION DRY POND 9.90 2.62 1.28 3.90 38.80692233 -77.42553887 Y 47.92 3.14 1955.44 0.20 0.40 0.60 9.58 1.26 1173.26
1503DP BMP 5/23/2008 EXTENDED DETENTION DRY POND 2.11 0.96 1.15 2.11 38.83605800 -77.45470734 Y 29.06 2.26 1515.79 0.20 0.40 0.60 5.81 0.90 909.47
1504DP BMP 5/23/2008 EXTENDED DETENTION DRY POND 4.62 1.31 2.42 3.73 38.83584159 -77.45460758 Y 53.99 4.46 3064.89 0.20 0.40 0.60 10.80 1.78 1838.94
1356DP BMP 8/1/2008 EXTENDED DETENTION DRY POND 17.84 4.81 2.97 7.78 38.90054353 -77.37871131 Y 98.46 6.78 4322.45 0.20 0.40 0.60 19.69 2.71 2593.47
DP0609 BMP 8/13/2008 EXTENDED DETENTION DRY POND 3.17 0.85 0.88 1.73 38.72045789 -77.13380558 Y 23.40 1.77 1180.19 0.20 0.40 0.60 4.68 0.71 708.11
1363DP BMP 11/4/2008 EXTENDED DETENTION DRY POND 12.98 3.00 4.51 7.51 38.78836726 -77.07415488 Y 106.22 8.53 5806.07 0.20 0.40 0.60 21.24 3.41 3483.64
1172DP BMP 11/24/2008 EXTENDED DETENTION DRY POND 18.72 4.96 2.04 7.00 38.89789056 -77.20860323 Y 84.32 5.33 3257.84 0.20 0.40 0.60 16.86 2.13 1954.70
1510DP BMP 4/17/2009 EXTENDED DETENTION DRY POND 4.71 2.97 1.57 4.54 38.84125681 -77.13596123 Y 56.38 3.76 2361.10 0.20 0.40 0.60 11.28 1.50 1416.66
1540DP BMP 6/16/2009 EXTENDED DETENTION DRY POND 5.83 3.93 1.90 5.83 38.93043027 -77.14243954 Y 71.61 4.69 2916.40 0.20 0.40 0.60 14.32 1.88 1749.84
1524DP BMP 6/24/2009 EXTENDED DETENTION DRY POND 60.49 51.91 7.47 59.38 38.80877520 -77.30007143 Y 648.68 33.38 17875.54 0.20 0.40 0.60 129.74 13.35 10725.32
SF0161 BMP 7/25/2007 FILTERING PRACTICE D.C. Sand Filter 1.57 0.31 1.26 1.57 38.84492660 -77.11789443 Y 24.37 2.17 1530.36 0.40 0.60 0.80 9.75 1.30 1224.29
SF0191 BMP 12/18/2007 FILTERING PRACTICE D.C. Sand Filter 4.14 1.16 2.98 4.14 38.83535946 -77.43164743 Y 61.92 5.30 3694.46 0.40 0.60 0.80 24.77 3.18 2955.57
SF0192 BMP 1/3/2008 FILTERING PRACTICE D.C. Sand Filter 1.73 0.03 1.50 1.53 38.83936448 -77.42372955 Y 25.59 2.44 1762.25 0.40 0.60 0.80 10.24 1.47 1409.80
SF0151 BMP 7/2/2007 FILTERING PRACTICE 1.30 0.30 1.00 1.30 38.89082917 -77.42368704 Y 19.89 1.75 1226.05 0.40 0.60 0.80 7.96 1.05 980.84
SF0206 BMP 5/13/2008 FILTERING PRACTICE 0.99 0.17 0.83 0.99 38.95947658 -77.33276629 Y 15.57 1.40 995.35 0.40 0.60 0.80 6.23 0.84 796.28
SF0208 BMP 7/10/2008 FILTERING PRACTICE 0.09 0.00 0.09 0.09 38.93829654 -77.17657360 Y 1.52 0.15 105.42 0.40 0.60 0.80 0.61 0.09 84.34
SF0176 BMP 6/28/2007 FILTERING PRACTICE Austin Sand Filter 9.00 4.59 4.41 9.00 38.90437591 -77.29366603 Y 120.57 9.03 5972.44 0.40 0.60 0.80 48.23 5.42 4777.95
SF0168 BMP 8/3/2007 FILTERING PRACTICE D.C. Sand Filter 1.45 0.57 0.88 1.45 38.73784832 -77.08478085 Y 20.58 1.66 1130.97 0.40 0.60 0.80 8.23 1.00 904.77
SF0169 BMP 8/3/2007 FILTERING PRACTICE D.C. Sand Filter 0.37 0.00 0.37 0.37 38.73773175 -77.08432256 Y 6.24 0.60 433.39 0.40 0.60 0.80 2.50 0.36 346.71
SF0178 BMP 8/23/2007 FILTERING PRACTICE D.C. Sand Filter 1.04 0.32 0.72 1.04 38.83049337 -77.43351671 Y 15.33 1.29 895.62 0.40 0.60 0.80 6.13 0.78 716.50
SF0179 BMP 8/23/2007 FILTERING PRACTICE D.C. Sand Filter 2.74 1.19 1.55 2.74 38.83031853 -77.43340307 Y 38.09 2.99 2020.77 0.40 0.60 0.80 15.24 1.80 1616.61
SF0180 BMP 8/23/2007 FILTERING PRACTICE D.C. Sand Filter 2.34 0.26 2.08 2.34 38.82998394 -77.43354314 Y 37.66 3.47 2478.07 0.40 0.60 0.80 15.06 2.08 1982.46
SF0194 BMP 3/3/2008 FILTERING PRACTICE D.C. Sand Filter 0.96 0.00 0.92 0.92 38.92408713 -77.23018259 Y 15.51 1.49 1077.61 0.40 0.60 0.80 6.20 0.89 862.09
SF0210 BMP 8/15/2008 FILTERING PRACTICE D.C. Sand Filter 0.39 0.02 0.37 0.39 38.94720579 -77.35758433 Y 6.39 0.61 436.11 0.40 0.60 0.80 2.56 0.36 348.89
SF0153 BMP 7/10/2007 FILTERING PRACTICE Delaware Sand Filter 0.73 0.03 0.70 0.73 38.85526182 -77.14076166 Y 12.10 1.15 825.20 0.40 0.60 0.80 4.84 0.69 660.16
SF0174 BMP 8/13/2007 FILTERING PRACTICE Delaware Sand Filter 0.20 0.00 0.20 0.20 38.83985570 -77.45723757 Y 3.37 0.32 234.26 0.40 0.60 0.80 1.35 0.19 187.41
SF0175 BMP 8/13/2007 FILTERING PRACTICE Delaware Sand Filter 0.09 0.01 0.07 0.08 38.78145312 -77.14752834 Y 1.28 0.12 83.75 0.40 0.60 0.80 0.51 0.07 67.00
SF0181 BMP 9/3/2007 FILTERING PRACTICE Delaware Sand Filter 2.18 0.40 1.78 2.18 38.77298608 -77.18031226 Y 34.04 3.05 2155.27 0.40 0.60 0.80 13.62 1.83 1724.22
SF0182 BMP 9/3/2007 FILTERING PRACTICE Delaware Sand Filter 1.84 0.33 1.51 1.84 38.77343656 -77.17933204 Y 28.78 2.58 1826.71 0.40 0.60 0.80 11.51 1.55 1461.37
SF0183 BMP 9/3/2007 FILTERING PRACTICE Delaware Sand Filter 1.23 0.04 1.19 1.23 38.77485819 -77.17925621 Y 20.47 1.94 1400.90 0.40 0.60 0.80 8.19 1.17 1120.72
SF0195 BMP 4/1/2008 FILTERING PRACTICE Delaware Sand Filter 2.17 0.19 0.66 0.85 38.72425862 -77.13011768 Y 13.04 1.15 806.47 0.40 0.60 0.80 5.22 0.69 645.18
SF0184 BMP 9/3/2007 FILTERING PRACTICE Delaware Sand Filter 1.60 0.03 1.57 1.60 38.77486037 -77.17995597 Y 26.77 2.56 1844.25 0.40 0.60 0.80 10.71 1.53 1475.40
SF0189 BMP 11/20/2007 FILTERING PRACTICE Delaware Sand Filter 0.52 0.10 0.42 0.52 38.84882089 -77.13351882 Y 8.09 0.72 509.53 0.40 0.60 0.80 3.24 0.43 407.63
SF0193 BMP 2/21/2008 FILTERING PRACTICE Delaware Sand Filter 1.22 0.50 0.72 1.22 38.81224916 -77.18904209 Y 17.17 1.37 931.25 0.40 0.60 0.80 6.87 0.82 745.00
SF0196 BMP 4/23/2008 FILTERING PRACTICE Delaware Sand Filter 0.90 0.25 0.65 0.90 38.79416518 -77.24446867 Y 13.48 1.16 805.31 0.40 0.60 0.80 5.39 0.69 644.25
SF0197 BMP 4/23/2008 FILTERING PRACTICE Delaware Sand Filter 0.79 0.26 0.53 0.79 38.79417633 -77.24391680 Y 11.55 0.97 666.51 0.40 0.60 0.80 4.62 0.58 533.21
SF0198 BMP 4/23/2008 FILTERING PRACTICE Delaware Sand Filter 0.62 0.08 0.54 0.62 38.79419020 -77.24334916 Y 9.91 0.91 646.58 0.40 0.60 0.80 3.96 0.54 517.26
SF0199 BMP 4/23/2008 FILTERING PRACTICE Delaware Sand Filter 0.78 0.27 0.51 0.78 38.79420943 -77.24279499 Y 11.32 0.94 644.84 0.40 0.60 0.80 4.53 0.56 515.87
SF0200 BMP 4/23/2008 FILTERING PRACTICE Delaware Sand Filter 0.37 0.01 0.36 0.37 38.79483656 -77.24261251 Y 6.17 0.59 423.43 0.40 0.60 0.80 2.47 0.35 338.75
SF0201 BMP 4/23/2008 FILTERING PRACTICE Delaware Sand Filter 0.40 0.01 0.39 0.40 38.79481442 -77.24320295 Y 6.68 0.64 458.57 0.40 0.60 0.80 2.67 0.38 366.86
SF0202 BMP 4/23/2008 FILTERING PRACTICE Delaware Sand Filter 0.47 0.02 0.45 0.47 38.79480511 -77.24366181 Y 7.79 0.74 530.61 0.40 0.60 0.80 3.12 0.44 424.49
SF0209 BMP 7/22/2008 FILTERING PRACTICE Delaware Sand Filter 4.28 0.60 3.68 4.28 38.95703927 -77.35403004 Y 68.09 6.21 4415.94 0.40 0.60 0.80 27.23 3.72 3532.75
SF0215 BMP 1/15/2009 FILTERING PRACTICE Delaware Sand Filter 0.47 0.24 0.23 0.47 38.81216665 -77.18964368 Y 6.29 0.47 311.60 0.40 0.60 0.80 2.52 0.28 249.28
SF0221 BMP 5/13/2009 FILTERING PRACTICE Delaware Sand Filter 0.80 0.00 0.80 0.80 38.77995165 -77.17722301 Y 13.49 1.30 937.06 0.40 0.60 0.80 5.40 0.78 749.64
SF0214 BMP 1/14/2009 FILTERING PRACTICE D.C. Sand Filter 0.50 0.09 0.41 0.50 38.85965592 -77.36426748 Y 7.82 0.70 496.06 0.40 0.60 0.80 3.13 0.42 396.85
SF0225 BMP 6/23/2009 FILTERING PRACTICE Delaware Sand Filter 1.44 0.01 1.43 1.44 38.93272066 -77.17803369 Y 24.19 2.32 1673.76 0.40 0.60 0.80 9.68 1.39 1339.01
TR0378 BMP 4/4/2007 INFILTRATION PRACTICE 1.24 0.43 0.81 1.24 38.87922792 -77.40925573 Y 17.99 1.49 1024.36 0.80 0.85 0.95 14.39 1.27 973.15
TR0409 BMP 10/11/2007 INFILTRATION PRACTICE 0.40 0.00 0.40 0.40 39.00554739 -77.29045164 Y 6.74 0.65 468.53 0.80 0.85 0.95 5.40 0.55 445.10
TR0421 BMP 11/28/2007 INFILTRATION PRACTICE 0.49 0.31 0.18 0.49 38.82984888 -77.22763566 Y 6.16 0.42 265.34 0.80 0.85 0.95 4.93 0.36 252.07
TR0380 BMP 7/2/2007 INFILTRATION PRACTICE 3.17 1.21 1.96 3.17 38.89068877 -77.42364032 Y 45.24 3.67 2509.50 0.80 0.85 0.95 36.19 3.12 2384.03
TR0383 BMP 7/6/2007 INFILTRATION PRACTICE 0.19 0.02 0.17 0.19 38.86711260 -77.14424052 Y 3.13 0.29 206.33 0.80 0.85 0.95 2.50 0.25 196.01
TR0388 SWM 8/6/2007 INFILTRATION PRACTICE 1.35 0.43 0.92 0.00 38.95274514 -77.22456441 Y 19.86 1.67 1156.19 0.80 0.85 0.95 15.89 1.42 1098.39
TR0393 BMP 8/16/2007 INFILTRATION PRACTICE 1.55 0.38 1.17 1.55 38.83797220 -77.42496746 Y 23.55 2.05 1437.25 0.80 0.85 0.95 18.84 1.74 1365.39
TR0395 BMP 8/20/2007 INFILTRATION PRACTICE 0.74 0.00 0.74 0.74 38.74165781 -77.07893561 Y 12.48 1.20 866.78 0.80 0.85 0.95 9.98 1.02 823.44
TR0412 BMP 11/9/2007 INFILTRATION PRACTICE 0.26 0.00 0.15 0.15 38.90662109 -77.35840032 Y 2.53 0.24 175.70 0.80 0.85 0.95 2.02 0.21 166.91
TR0422 BMP 12/17/2007 INFILTRATION PRACTICE 0.50 0.24 0.26 0.50 38.95555092 -77.28887667 Y 6.82 0.52 349.62 0.80 0.85 0.95 5.46 0.44 332.14
TR0423 BMP 12/17/2007 INFILTRATION PRACTICE 0.43 0.34 0.09 0.43 38.95560901 -77.28922252 Y 4.94 0.28 164.72 0.80 0.85 0.95 3.95 0.24 156.49
TR0453 BMP 4/23/2008 INFILTRATION PRACTICE 0.34 0.22 0.12 0.34 38.94656472 -77.15689257 Y 4.24 0.28 179.23 0.80 0.85 0.95 3.39 0.24 170.27
TR0454 BMP 4/23/2008 INFILTRATION PRACTICE 0.16 0.11 0.05 0.16 38.94709114 -77.15668636 Y 1.95 0.13 77.90 0.80 0.85 0.95 1.56 0.11 74.01
TR0455 BMP 4/23/2008 INFILTRATION PRACTICE 0.11 0.00 0.11 0.11 38.94695801 -77.15690534 Y 1.85 0.18 128.85 0.80 0.85 0.95 1.48 0.15 122.40
TR0457 BMP 7/2/2008 INFILTRATION PRACTICE 1.58 0.33 1.19 1.52 38.89304328 -77.45442026 Y 23.39 2.06 1451.88 0.80 0.85 0.95 18.71 1.75 1379.29
TR0458 BMP 7/2/2008 INFILTRATION PRACTICE 1.52 0.47 1.05 1.52 38.89296612 -77.45464148 Y 22.44 1.89 1312.51 0.80 0.85 0.95 17.95 1.61 1246.89
TR0483 BMP 5/13/2009 INFILTRATION PRACTICE 0.42 0.34 0.08 0.42 38.87471484 -77.36912784 Y 4.75 0.26 149.89 0.80 0.85 0.95 3.80 0.22 142.40
TR0484 BMP 5/13/2009 INFILTRATION PRACTICE 0.32 0.26 0.06 0.32 38.87459503 -77.36886093 Y 3.62 0.20 114.20 0.80 0.85 0.95 2.89 0.17 108.49
TR0485 BMP 5/13/2009 INFILTRATION PRACTICE 0.14 0.11 0.03 0.14 38.87444690 -77.36857514 Y 1.58 0.09 50.00 0.80 0.85 0.95 1.27 0.08 47.50

TR0491 SWM 6/23/2009 INFILTRATION PRACTICE 2.86 0.99 1.87 0.00 38.84640426 -77.34176866 Y 41.50 3.44 2364.41 0.80 0.85 0.95 33.20 2.92 2246.19
TR0397 BMP 9/25/2007 INFILTRATION PRACTICE 0.05 0.01 0.04 0.05 38.89079154 -77.19887324 Y 0.79 0.07 51.30 0.80 0.85 0.95 0.63 0.06 48.73
TR0403 BMP 9/25/2007 INFILTRATION PRACTICE 0.39 0.18 0.21 0.39 38.89087713 -77.19879211 Y 5.35 0.41 277.62 0.80 0.85 0.95 4.28 0.35 263.74
TR0410 BMP 10/12/2007 INFILTRATION PRACTICE 0.64 0.32 0.33 0.65 38.88974133 -77.22456327 Y 8.72 0.66 440.23 0.80 0.85 0.95 6.98 0.56 418.22
TR0462 SWM 8/13/2008 INFILTRATION PRACTICE 0.70 0.12 0.58 0.00 38.83150438 -77.19855963 Y 10.98 0.99 699.57 0.80 0.85 0.95 8.78 0.84 664.59
TR0465 BMP 12/30/2008 INFILTRATION PRACTICE 0.16 0.12 0.04 0.16 38.88550568 -77.20008442 Y 1.88 0.11 67.95 0.80 0.85 0.95 1.51 0.10 64.55
TR0466 BMP 12/30/2008 INFILTRATION PRACTICE 0.25 0.17 0.08 0.25 38.88505865 -77.20006053 Y 3.06 0.20 123.59 0.80 0.85 0.95 2.45 0.17 117.41
TR0467 BMP 12/30/2008 INFILTRATION PRACTICE 0.17 0.11 0.06 0.17 38.88496997 -77.19957484 Y 2.12 0.14 89.62 0.80 0.85 0.95 1.70 0.12 85.14
TR0472 BMP 5/1/2009 INFILTRATION PRACTICE 0.18 0.09 0.09 0.18 38.90408497 -77.16787442 Y 2.41 0.18 119.81 0.80 0.85 0.95 1.93 0.15 113.82
TR0473 BMP 5/1/2009 INFILTRATION PRACTICE 0.14 0.05 0.09 0.14 38.95704922 -77.19661489 Y 1.99 0.17 113.68 0.80 0.85 0.95 1.59 0.14 108.00
TR0475 BMP 5/4/2009 INFILTRATION PRACTICE 0.17 0.08 0.09 0.17 38.93173933 -77.16989690 Y 2.32 0.18 118.56 0.80 0.85 0.95 1.85 0.15 112.63
TR0476 BMP 5/5/2009 INFILTRATION PRACTICE 0.17 0.08 0.10 0.17 38.93206547 -77.14411295 Y 2.41 0.19 127.66 0.80 0.85 0.95 1.92 0.16 121.27
TR0477 BMP 5/5/2009 INFILTRATION PRACTICE 0.13 0.04 0.09 0.13 38.93182078 -77.14337997 Y 1.84 0.16 107.49 0.80 0.85 0.95 1.47 0.13 102.12
TR0479 BMP 5/7/2009 INFILTRATION PRACTICE 0.11 0.03 0.08 0.11 38.92110206 -77.13785194 Y 1.63 0.14 98.63 0.80 0.85 0.95 1.30 0.12 93.70
TR0488 BMP 5/20/2009 INFILTRATION PRACTICE 0.06 0.02 0.04 0.06 38.90418667 -77.16705351 Y 0.88 0.07 48.29 0.80 0.85 0.95 0.70 0.06 45.87
TR0471 BMP 4/28/2009 INFILTRATION PRACTICE 0.09 0.02 0.07 0.09 38.91032456 -77.19691323 Y 1.41 0.12 87.48 0.80 0.85 0.95 1.13 0.11 83.10
MB0078 BMP7/10/2007
MANUFACTURED BMP
(PROPRIETARY)StormFilter 1.29
0.07 1.22 1.2938.80046504 -77.16651886
Y 21.19 2.00 1435.46 0.26 0.50 0.52 5.51 1.00 746.44
MB0079 BMP7/10/2007
MANUFACTURED BMP
(PROPRIETARY)StormFilter 1.29
0.07 1.22 1.2938.80051231 -77.16646959
Y 21.19 2.00 1435.46 0.26 0.50 0.52 5.51 1.00 746.44
MB0118 BMP12/11/2007
MANUFACTURED BMP
(PROPRIETARY)StormFilter 0.60
0.00 0.60 0.6038.79697194 -77.07405010
Y 10.12 0.97 702.79 0.26 0.50 0.52 2.63 0.49 365.45
MB0125 BMP1/2/2008
MANUFACTURED BMP
(PROPRIETARY)StormFilter 1.72
0.23 1.37 1.6038.71906281 -77.20888286
Y 25.41 2.31 1645.14 0.26 0.50 0.52 6.61 1.16 855.47
TF0040 BMP7/10/2007
MANUFACTURED BMP
(PROPRIETARY)Filterra 0.23
0.06 0.09 0.1538.85590306 -77.14030929
Y 2.12 0.17 115.97 0.26 0.50 0.52 0.55 0.09 60.30
TF0099 BMP8/15/2007
MANUFACTURED BMP
(PROPRIETARY)Filterra 0.11
0.00 0.11 0.1138.77389744 -77.18407099
Y 1.85 0.18 128.85 0.26 0.50 0.52 0.48 0.09 67.00
TF0010 BMP11/30/2007
MANUFACTURED BMP
(PROPRIETARY)Filterra 0.16
0.00 0.16 0.1638.77370136 -77.08385912
Y 2.70 0.26 187.41 0.26 0.50 0.52 0.70 0.13 97.45
TF0028 BMP2/4/2008
MANUFACTURED BMP
(PROPRIETARY)Filterra 0.22
0.00 0.22 0.2238.79278697 -77.20444540
Y 3.71 0.36 257.69 0.26 0.50 0.52 0.96 0.18 134.00
TF0029 BMP2/4/2008
MANUFACTURED BMP
(PROPRIETARY)Filterra 0.19
0.03 0.08 0.1138.79311085 -77.20360651
Y 1.65 0.14 98.98 0.26 0.50 0.52 0.43 0.07 51.47
TF0030 BMP4/23/2008
MANUFACTURED BMP
(PROPRIETARY)Filterra 0.50
0.02 0.48 0.5038.93887308 -77.32982375
Y 8.29 0.79 565.75 0.26 0.50 0.52 2.16 0.39 294.19
TF0031 BMP4/23/2008
MANUFACTURED BMP
(PROPRIETARY)Filterra 0.10
0.00 0.10 0.1038.93908562 -77.32976800
Y 1.69 0.16 117.13 0.26 0.50 0.52 0.44 0.08 60.91
TF0032 BMP4/23/2008
MANUFACTURED BMP
(PROPRIETARY)Filterra 0.24
0.07 0.17 0.2438.93940357 -77.32918440
Y 3.57 0.30 211.43 0.26 0.50 0.52 0.93 0.15 109.94
TF0033 BMP4/23/2008
MANUFACTURED BMP
(PROPRIETARY)Filterra 0.33
0.03 0.30 0.3338.93851357 -77.33003151
Y 5.36 0.50 356.67 0.26 0.50 0.52 1.39 0.25 185.47
TF0034 BMP4/23/2008
MANUFACTURED BMP
(PROPRIETARY)Filterra 0.25
0.05 0.20 0.2538.94000387 -77.33084072
Y 3.88 0.34 243.05 0.26 0.50 0.52 1.01 0.17 126.39
TF0035 BMP4/23/2008
MANUFACTURED BMP
(PROPRIETARY)Filterra 0.32
0.09 0.23 0.3238.94025525 -77.33019986
Y 4.78 0.41 285.23 0.26 0.50 0.52 1.24 0.20 148.32
TF0036 BMP4/23/2008
MANUFACTURED BMP
(PROPRIETARY)Filterra 0.20
0.09 0.11 0.2038.94031276 -77.32945131
Y 2.76 0.22 144.67 0.26 0.50 0.52 0.72 0.11 75.23
TF0037 BMP4/23/2008
MANUFACTURED BMP
(PROPRIETARY)Filterra 0.08
0.04 0.04 0.0838.94032160 -77.32967291
Y 1.08 0.08 53.88 0.26 0.50 0.52 0.28 0.04 28.02
TF0069 BMP6/18/2008
MANUFACTURED BMP
(PROPRIETARY)Filterra 0.57
0.03 0.54 0.5738.83734643 -77.42433878
Y 9.40 0.89 636.79 0.26 0.50 0.52 2.44 0.44 331.13
TF0070 BMP6/18/2008
MANUFACTURED BMP
(PROPRIETARY)Filterra 0.41
0.05 0.37 0.4138.83729075 -77.42432728
Y 6.61 0.61 435.44 0.26 0.50 0.52 1.72 0.30 226.43
TF0071 BMP6/18/2008
MANUFACTURED BMP
(PROPRIETARY)Filterra 0.58
0.26 0.32 0.5838.83683613 -77.42468957
Y 7.99 0.62 416.55 0.26 0.50 0.52 2.08 0.31 216.61
TF0012 BMP7/23/2008
MANUFACTURED BMP
(PROPRIETARY)Filterra 0.32
0.06 0.26 0.3238.77048720 -77.08207882
Y 4.99 0.45 315.09 0.26 0.50 0.52 1.30 0.22 163.85
TF0013 BMP7/23/2008
MANUFACTURED BMP
(PROPRIETARY)Filterra 0.50
0.04 0.46 0.5038.77091476 -77.08242326
Y 8.16 0.76 545.84 0.26 0.50 0.52 2.12 0.38 283.84
TF0038 BMP11/21/2008
MANUFACTURED BMP
(PROPRIETARY)Filterra 0.17
0.08 0.09 0.1738.96276466 -77.35184521
Y 2.32 0.18 119.48 0.26 0.50 0.52 0.60 0.09 62.13
TF0041 BMP5/22/2009
MANUFACTURED BMP
(PROPRIETARY)Filterra 0.18
0.03 0.15 0.1838.90185159 -77.45083815
Y 2.83 0.26 180.97 0.26 0.50 0.52 0.74 0.13 94.11
1528TF BMP6/10/2009
MANUFACTURED BMP
(PROPRIETARY)Filterra 0.28
0.03 0.25 0.2838.74300886 -77.07601687
Y 4.52 0.42 298.10 0.26 0.50 0.52 1.17 0.21 155.01
1529TF BMP6/10/2009
MANUFACTURED BMP
(PROPRIETARY)Filterra 0.27
0.02 0.25 0.2738.74317570 -77.07611473
Y 4.42 0.41 296.35 0.26 0.50 0.52 1.15 0.21 154.10
1530TF BMP6/10/2009
MANUFACTURED BMP
(PROPRIETARY)Filterra 0.31
0.06 0.25 0.3138.74333775 -77.07622549
Y 4.82 0.43 303.38 0.26 0.50 0.52 1.25 0.21 157.76
TR0415 BMP11/20/2007
MANUFACTURED BMP
(PROPRIETARY)RainStore 2.10
1.26 0.84 2.1038.92510388 -77.15175930
Y 26.88 1.88 1209.41 0.80 0.85 0.95 21.50 1.60 1148.94
TR0416 SWM11/20/2007
MANUFACTURED BMP
(PROPRIETARY)RainStore 0.01
0.00 0.01 0.0038.92514067 -77.15186158
Y 0.17 0.02 11.71 0.80 0.85 0.95 0.13 0.01 11.13
MB0099 BMP8/16/2007
MANUFACTURED BMP
(PROPRIETARY)Stormceptor 0.89
0.16 0.72 0.8938.83796575 -77.42513245
Y 13.83 1.24 876.34 0.26 0.20 0.52 3.60 0.25 455.70
MB0095 BMP8/14/2007
MANUFACTURED BMP
(PROPRIETARY)StormFilter 0.22
0.00 0.22 0.2238.92112075 -77.15201027
Y 3.71 0.36 257.69 0.26 0.50 0.52 0.96 0.18 134.00
MB0104 BMP9/7/2007
MANUFACTURED BMP
(PROPRIETARY)StormFilter 0.38
0.02 0.36 0.3838.84860317 -77.13433118
Y 6.27 0.59 425.19 0.26 0.50 0.52 1.63 0.30 221.10
MB0105 BMP9/7/2007
MANUFACTURED BMP
(PROPRIETARY)StormFilter 0.12
0.02 0.10 0.1238.84851180 -77.13423868
Y 1.89 0.17 120.65 0.26 0.50 0.52 0.49 0.09 62.74
MB0106 BMP9/7/2007
MANUFACTURED BMP
(PROPRIETARY)StormFilter 0.16
0.02 0.14 0.1638.84833520 -77.13453361
Y 2.56 0.24 167.50 0.26 0.50 0.52 0.67 0.12 87.10
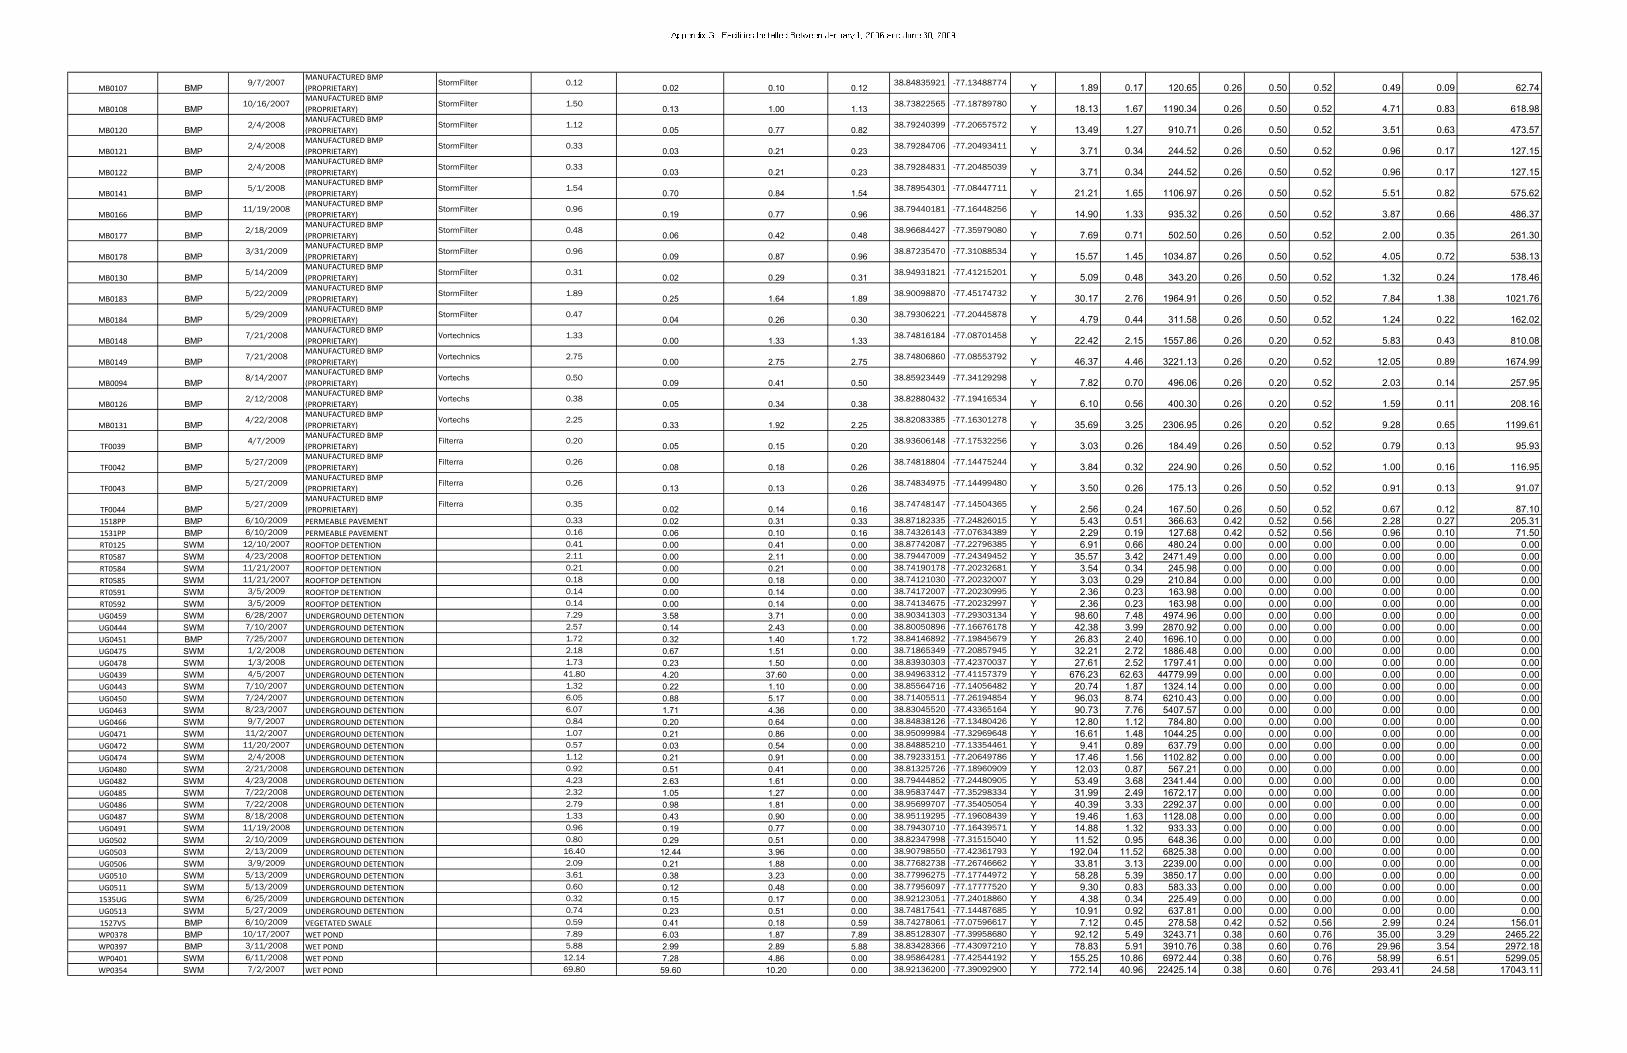
MB0107 BMP9/7/2007
MANUFACTURED BMP
(PROPRIETARY)StormFilter 0.12
0.02 0.10 0.1238.84835921 -77.13488774
Y 1.89 0.17 120.65 0.26 0.50 0.52 0.49 0.09 62.74
MB0108 BMP10/16/2007
MANUFACTURED BMP
(PROPRIETARY)StormFilter 1.50
0.13 1.00 1.1338.73822565 -77.18789780
Y 18.13 1.67 1190.34 0.26 0.50 0.52 4.71 0.83 618.98
MB0120 BMP2/4/2008
MANUFACTURED BMP
(PROPRIETARY)StormFilter 1.12
0.05 0.77 0.8238.79240399 -77.20657572
Y 13.49 1.27 910.71 0.26 0.50 0.52 3.51 0.63 473.57
MB0121 BMP2/4/2008
MANUFACTURED BMP
(PROPRIETARY)StormFilter 0.33
0.03 0.21 0.2338.79284706 -77.20493411
Y 3.71 0.34 244.52 0.26 0.50 0.52 0.96 0.17 127.15
MB0122 BMP2/4/2008
MANUFACTURED BMP
(PROPRIETARY)StormFilter 0.33
0.03 0.21 0.2338.79284831 -77.20485039
Y 3.71 0.34 244.52 0.26 0.50 0.52 0.96 0.17 127.15
MB0141 BMP5/1/2008
MANUFACTURED BMP
(PROPRIETARY)StormFilter 1.54
0.70 0.84 1.5438.78954301 -77.08447711
Y 21.21 1.65 1106.97 0.26 0.50 0.52 5.51 0.82 575.62
MB0166 BMP11/19/2008
MANUFACTURED BMP
(PROPRIETARY)StormFilter 0.96
0.19 0.77 0.9638.79440181 -77.16448256
Y 14.90 1.33 935.32 0.26 0.50 0.52 3.87 0.66 486.37
MB0177 BMP2/18/2009
MANUFACTURED BMP
(PROPRIETARY)StormFilter 0.48
0.06 0.42 0.4838.96684427 -77.35979080
Y 7.69 0.71 502.50 0.26 0.50 0.52 2.00 0.35 261.30
MB0178 BMP3/31/2009
MANUFACTURED BMP
(PROPRIETARY)StormFilter 0.96
0.09 0.87 0.9638.87235470 -77.31088534
Y 15.57 1.45 1034.87 0.26 0.50 0.52 4.05 0.72 538.13
MB0130 BMP5/14/2009
MANUFACTURED BMP
(PROPRIETARY)StormFilter 0.31
0.02 0.29 0.3138.94931821 -77.41215201
Y 5.09 0.48 343.20 0.26 0.50 0.52 1.32 0.24 178.46
MB0183 BMP5/22/2009
MANUFACTURED BMP
(PROPRIETARY)StormFilter 1.89
0.25 1.64 1.8938.90098870 -77.45174732
Y 30.17 2.76 1964.91 0.26 0.50 0.52 7.84 1.38 1021.76
MB0184 BMP5/29/2009
MANUFACTURED BMP
(PROPRIETARY)StormFilter 0.47
0.04 0.26 0.3038.79306221 -77.20445878
Y 4.79 0.44 311.58 0.26 0.50 0.52 1.24 0.22 162.02
MB0148 BMP7/21/2008
MANUFACTURED BMP
(PROPRIETARY)Vortechnics 1.33
0.00 1.33 1.3338.74816184 -77.08701458
Y 22.42 2.15 1557.86 0.26 0.20 0.52 5.83 0.43 810.08
MB0149 BMP7/21/2008
MANUFACTURED BMP
(PROPRIETARY)Vortechnics 2.75
0.00 2.75 2.7538.74806860 -77.08553792
Y 46.37 4.46 3221.13 0.26 0.20 0.52 12.05 0.89 1674.99
MB0094 BMP8/14/2007
MANUFACTURED BMP
(PROPRIETARY)Vortechs 0.50
0.09 0.41 0.5038.85923449 -77.34129298
Y 7.82 0.70 496.06 0.26 0.20 0.52 2.03 0.14 257.95
MB0126 BMP2/12/2008
MANUFACTURED BMP
(PROPRIETARY)Vortechs 0.38
0.05 0.34 0.3838.82880432 -77.19416534
Y 6.10 0.56 400.30 0.26 0.20 0.52 1.59 0.11 208.16
MB0131 BMP4/22/2008
MANUFACTURED BMP
(PROPRIETARY)Vortechs 2.25
0.33 1.92 2.2538.82083385 -77.16301278
Y 35.69 3.25 2306.95 0.26 0.20 0.52 9.28 0.65 1199.61
TF0039 BMP4/7/2009
MANUFACTURED BMP
(PROPRIETARY)Filterra 0.20
0.05 0.15 0.2038.93606148 -77.17532256
Y 3.03 0.26 184.49 0.26 0.50 0.52 0.79 0.13 95.93
TF0042 BMP5/27/2009
MANUFACTURED BMP
(PROPRIETARY)Filterra 0.26
0.08 0.18 0.2638.74818804 -77.14475244
Y 3.84 0.32 224.90 0.26 0.50 0.52 1.00 0.16 116.95
TF0043 BMP5/27/2009
MANUFACTURED BMP
(PROPRIETARY)Filterra 0.26
0.13 0.13 0.2638.74834975 -77.14499480
Y 3.50 0.26 175.13 0.26 0.50 0.52 0.91 0.13 91.07
TF0044 BMP5/27/2009
MANUFACTURED BMP
(PROPRIETARY)Filterra 0.35
0.02 0.14 0.1638.74748147 -77.14504365
Y 2.56 0.24 167.50 0.26 0.50 0.52 0.67 0.12 87.10
1518PP BMP 6/10/2009 PERMEABLE PAVEMENT 0.33 0.02 0.31 0.33 38.87182335 -77.24826015 Y 5.43 0.51 366.63 0.42 0.52 0.56 2.28 0.27 205.31
1531PP BMP 6/10/2009 PERMEABLE PAVEMENT 0.16 0.06 0.10 0.16 38.74326143 -77.07634389 Y 2.29 0.19 127.68 0.42 0.52 0.56 0.96 0.10 71.50
RT0125 SWM 12/10/2007 ROOFTOP DETENTION 0.41 0.00 0.41 0.00 38.87742087 -77.22796385 Y 6.91 0.66 480.24 0.00 0.00 0.00 0.00 0.00 0.00
RT0587 SWM 4/23/2008 ROOFTOP DETENTION 2.11 0.00 2.11 0.00 38.79447009 -77.24349452 Y 35.57 3.42 2471.49 0.00 0.00 0.00 0.00 0.00 0.00
RT0584 SWM 11/21/2007 ROOFTOP DETENTION 0.21 0.00 0.21 0.00 38.74190178 -77.20232681 Y 3.54 0.34 245.98 0.00 0.00 0.00 0.00 0.00 0.00
RT0585 SWM 11/21/2007 ROOFTOP DETENTION 0.18 0.00 0.18 0.00 38.74121030 -77.20232007 Y 3.03 0.29 210.84 0.00 0.00 0.00 0.00 0.00 0.00
RT0591 SWM 3/5/2009 ROOFTOP DETENTION 0.14 0.00 0.14 0.00 38.74172007 -77.20230995 Y 2.36 0.23 163.98 0.00 0.00 0.00 0.00 0.00 0.00
RT0592 SWM 3/5/2009 ROOFTOP DETENTION 0.14 0.00 0.14 0.00 38.74134675 -77.20232997 Y 2.36 0.23 163.98 0.00 0.00 0.00 0.00 0.00 0.00
UG0459 SWM 6/28/2007 UNDERGROUND DETENTION 7.29 3.58 3.71 0.00 38.90341303 -77.29303134 Y 98.60 7.48 4974.96 0.00 0.00 0.00 0.00 0.00 0.00
UG0444 SWM 7/10/2007 UNDERGROUND DETENTION 2.57 0.14 2.43 0.00 38.80050896 -77.16676178 Y 42.38 3.99 2870.92 0.00 0.00 0.00 0.00 0.00 0.00
UG0451 BMP 7/25/2007 UNDERGROUND DETENTION 1.72 0.32 1.40 1.72 38.84146892 -77.19845679 Y 26.83 2.40 1696.10 0.00 0.00 0.00 0.00 0.00 0.00
UG0475 SWM 1/2/2008 UNDERGROUND DETENTION 2.18 0.67 1.51 0.00 38.71865349 -77.20857945 Y 32.21 2.72 1886.48 0.00 0.00 0.00 0.00 0.00 0.00
UG0478 SWM 1/3/2008 UNDERGROUND DETENTION 1.73 0.23 1.50 0.00 38.83930303 -77.42370037 Y 27.61 2.52 1797.41 0.00 0.00 0.00 0.00 0.00 0.00
UG0439 SWM 4/5/2007 UNDERGROUND DETENTION 41.80 4.20 37.60 0.00 38.94963312 -77.41157379 Y 676.23 62.63 44779.99 0.00 0.00 0.00 0.00 0.00 0.00
UG0443 SWM 7/10/2007 UNDERGROUND DETENTION 1.32 0.22 1.10 0.00 38.85564716 -77.14056482 Y 20.74 1.87 1324.14 0.00 0.00 0.00 0.00 0.00 0.00
UG0450 SWM 7/24/2007 UNDERGROUND DETENTION 6.05 0.88 5.17 0.00 38.71405511 -77.26194854 Y 96.03 8.74 6210.43 0.00 0.00 0.00 0.00 0.00 0.00
UG0463 SWM 8/23/2007 UNDERGROUND DETENTION 6.07 1.71 4.36 0.00 38.83045520 -77.43365164 Y 90.73 7.76 5407.57 0.00 0.00 0.00 0.00 0.00 0.00
UG0466 SWM 9/7/2007 UNDERGROUND DETENTION 0.84 0.20 0.64 0.00 38.84838126 -77.13480426 Y 12.80 1.12 784.80 0.00 0.00 0.00 0.00 0.00 0.00
UG0471 SWM 11/2/2007 UNDERGROUND DETENTION 1.07 0.21 0.86 0.00 38.95099984 -77.32969648 Y 16.61 1.48 1044.25 0.00 0.00 0.00 0.00 0.00 0.00
UG0472 SWM 11/20/2007 UNDERGROUND DETENTION 0.57 0.03 0.54 0.00 38.84885210 -77.13354461 Y 9.41 0.89 637.79 0.00 0.00 0.00 0.00 0.00 0.00
UG0474 SWM 2/4/2008 UNDERGROUND DETENTION 1.12 0.21 0.91 0.00 38.79233151 -77.20649786 Y 17.46 1.56 1102.82 0.00 0.00 0.00 0.00 0.00 0.00
UG0480 SWM 2/21/2008 UNDERGROUND DETENTION 0.92 0.51 0.41 0.00 38.81325726 -77.18960909 Y 12.03 0.87 567.21 0.00 0.00 0.00 0.00 0.00 0.00
UG0482 SWM 4/23/2008 UNDERGROUND DETENTION 4.23 2.63 1.61 0.00 38.79444852 -77.24480905 Y 53.49 3.68 2341.44 0.00 0.00 0.00 0.00 0.00 0.00
UG0485 SWM 7/22/2008 UNDERGROUND DETENTION 2.32 1.05 1.27 0.00 38.95837447 -77.35298334 Y 31.99 2.49 1672.17 0.00 0.00 0.00 0.00 0.00 0.00
UG0486 SWM 7/22/2008 UNDERGROUND DETENTION 2.79 0.98 1.81 0.00 38.95699707 -77.35405054 Y 40.39 3.33 2292.37 0.00 0.00 0.00 0.00 0.00 0.00
UG0487 SWM 8/18/2008 UNDERGROUND DETENTION 1.33 0.43 0.90 0.00 38.95119295 -77.19608439 Y 19.46 1.63 1128.08 0.00 0.00 0.00 0.00 0.00 0.00
UG0491 SWM 11/19/2008 UNDERGROUND DETENTION 0.96 0.19 0.77 0.00 38.79430710 -77.16439571 Y 14.88 1.32 933.33 0.00 0.00 0.00 0.00 0.00 0.00
UG0502 SWM 2/10/2009 UNDERGROUND DETENTION 0.80 0.29 0.51 0.00 38.82347998 -77.31515040 Y 11.52 0.95 648.36 0.00 0.00 0.00 0.00 0.00 0.00
UG0503 SWM 2/13/2009 UNDERGROUND DETENTION 16.40 12.44 3.96 0.00 38.90798550 -77.42361793 Y 192.04 11.52 6825.38 0.00 0.00 0.00 0.00 0.00 0.00
UG0506 SWM 3/9/2009 UNDERGROUND DETENTION 2.09 0.21 1.88 0.00 38.77682738 -77.26746662 Y 33.81 3.13 2239.00 0.00 0.00 0.00 0.00 0.00 0.00
UG0510 SWM 5/13/2009 UNDERGROUND DETENTION 3.61 0.38 3.23 0.00 38.77996275 -77.17744972 Y 58.28 5.39 3850.17 0.00 0.00 0.00 0.00 0.00 0.00
UG0511 SWM 5/13/2009 UNDERGROUND DETENTION 0.60 0.12 0.48 0.00 38.77956097 -77.17777520 Y 9.30 0.83 583.33 0.00 0.00 0.00 0.00 0.00 0.00
1535UG SWM 6/25/2009 UNDERGROUND DETENTION 0.32 0.15 0.17 0.00 38.92123051 -77.24018860 Y 4.38 0.34 225.49 0.00 0.00 0.00 0.00 0.00 0.00
UG0513 SWM 5/27/2009 UNDERGROUND DETENTION 0.74 0.23 0.51 0.00 38.74817541 -77.14487685 Y 10.91 0.92 637.81 0.00 0.00 0.00 0.00 0.00 0.00
1527VS BMP 6/10/2009 VEGETATED SWALE 0.59 0.41 0.18 0.59 38.74278061 -77.07596617 Y 7.12 0.45 278.58 0.42 0.52 0.56 2.99 0.24 156.01
WP0378 BMP 10/17/2007 WET POND 7.89 6.03 1.87 7.89 38.85128307 -77.39958680 Y 92.12 5.49 3243.71 0.38 0.60 0.76 35.00 3.29 2465.22
WP0397 BMP 3/11/2008 WET POND 5.88 2.99 2.89 5.88 38.83428366 -77.43097210 Y 78.83 5.91 3910.76 0.38 0.60 0.76 29.96 3.54 2972.18
WP0401 SWM 6/11/2008 WET POND 12.14 7.28 4.86 0.00 38.95864281 -77.42544192 Y 155.25 10.86 6972.44 0.38 0.60 0.76 58.99 6.51 5299.05
WP0354 SWM 7/2/2007 WET POND 69.80 59.60 10.20 0.00 38.92136200 -77.39092900 Y 772.14 40.96 22425.14 0.38 0.60 0.76 293.41 24.58 17043.11
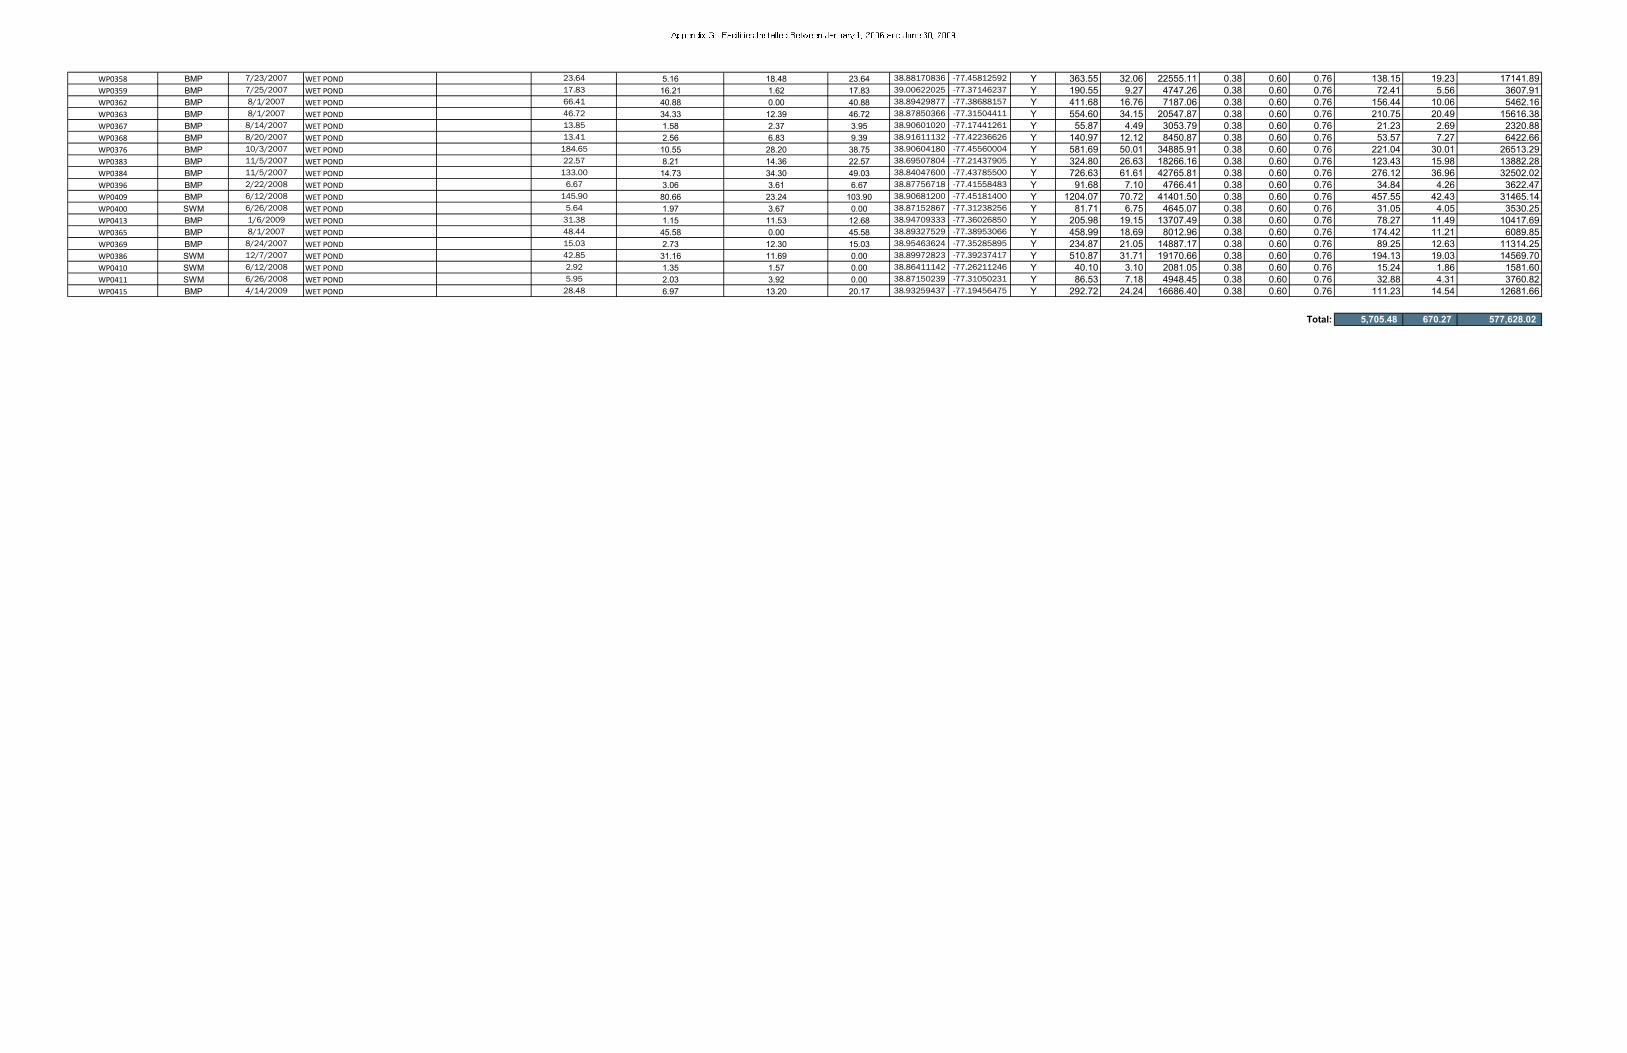
WP0358 BMP 7/23/2007 WET POND 23.64 5.16 18.48 23.64 38.88170836 -77.45812592 Y 363.55 32.06 22555.11 0.38 0.60 0.76 138.15 19.23 17141.89
WP0359 BMP 7/25/2007 WET POND 17.83 16.21 1.62 17.83 39.00622025 -77.37146237 Y 190.55 9.27 4747.26 0.38 0.60 0.76 72.41 5.56 3607.91
WP0362 BMP 8/1/2007 WET POND 66.41 40.88 0.00 40.88 38.89429877 -77.38688157 Y 411.68 16.76 7187.06 0.38 0.60 0.76 156.44 10.06 5462.16
WP0363 BMP 8/1/2007 WET POND 46.72 34.33 12.39 46.72 38.87850366 -77.31504411 Y 554.60 34.15 20547.87 0.38 0.60 0.76 210.75 20.49 15616.38
WP0367 BMP 8/14/2007 WET POND 13.85 1.58 2.37 3.95 38.90601020 -77.17441261 Y 55.87 4.49 3053.79 0.38 0.60 0.76 21.23 2.69 2320.88
WP0368 BMP 8/20/2007 WET POND 13.41 2.56 6.83 9.39 38.91611132 -77.42236626 Y 140.97 12.12 8450.87 0.38 0.60 0.76 53.57 7.27 6422.66
WP0376 BMP 10/3/2007 WET POND 184.65 10.55 28.20 38.75 38.90604180 -77.45560004 Y 581.69 50.01 34885.91 0.38 0.60 0.76 221.04 30.01 26513.29
WP0383 BMP 11/5/2007 WET POND 22.57 8.21 14.36 22.57 38.69507804 -77.21437905 Y 324.80 26.63 18266.16 0.38 0.60 0.76 123.43 15.98 13882.28
WP0384 BMP 11/5/2007 WET POND 133.00 14.73 34.30 49.03 38.84047600 -77.43785500 Y 726.63 61.61 42765.81 0.38 0.60 0.76 276.12 36.96 32502.02
WP0396 BMP 2/22/2008 WET POND 6.67 3.06 3.61 6.67 38.87756718 -77.41558483 Y 91.68 7.10 4766.41 0.38 0.60 0.76 34.84 4.26 3622.47
WP0409 BMP 6/12/2008 WET POND 145.90 80.66 23.24 103.90 38.90681200 -77.45181400 Y 1204.07 70.72 41401.50 0.38 0.60 0.76 457.55 42.43 31465.14
WP0400 SWM 6/26/2008 WET POND 5.64 1.97 3.67 0.00 38.87152867 -77.31238256 Y 81.71 6.75 4645.07 0.38 0.60 0.76 31.05 4.05 3530.25
WP0413 BMP 1/6/2009 WET POND 31.38 1.15 11.53 12.68 38.94709333 -77.36026850 Y 205.98 19.15 13707.49 0.38 0.60 0.76 78.27 11.49 10417.69
WP0365 BMP 8/1/2007 WET POND 48.44 45.58 0.00 45.58 38.89327529 -77.38953066 Y 458.99 18.69 8012.96 0.38 0.60 0.76 174.42 11.21 6089.85
WP0369 BMP 8/24/2007 WET POND 15.03 2.73 12.30 15.03 38.95463624 -77.35285895 Y 234.87 21.05 14887.17 0.38 0.60 0.76 89.25 12.63 11314.25
WP0386 SWM 12/7/2007 WET POND 42.85 31.16 11.69 0.00 38.89972823 -77.39237417 Y 510.87 31.71 19170.66 0.38 0.60 0.76 194.13 19.03 14569.70
WP0410 SWM 6/12/2008 WET POND 2.92 1.35 1.57 0.00 38.86411142 -77.26211246 Y 40.10 3.10 2081.05 0.38 0.60 0.76 15.24 1.86 1581.60
WP0411 SWM 6/26/2008 WET POND 5.95 2.03 3.92 0.00 38.87150239 -77.31050231 Y 86.53 7.18 4948.45 0.38 0.60 0.76 32.88 4.31 3760.82
WP0415 BMP 4/14/2009 WET POND 28.48 6.97 13.20 20.17 38.93259437 -77.19456475 Y 292.72 24.24 16686.40 0.38 0.60 0.76 111.23 14.54 12681.66
Total: 5,705.48 670.27 577,628.02

Appendix H
Appendix H
Redevelopment Facility Credit Beginning July 1, 2014
As noted in Section 5.4, the County is not reporting any post-July 1, 2014 redevelopment for credit at this
time. This appendix is reserved for future updates to this plan to account for redevelopment credit and to
document calculations.

Appendix H

Appendix I
Appendix I
More Stringent Water Quality Requirements for Single Family
Residential Development Beginning July 1, 2014

Appendix I

Appendix I: Single Family Residential Development July 1, 2009 to June 20, 2014
TN TP TSS TN TP TSS TN TP TSS TN TP TSS
000032-INF-16-3 MERIDIAN PARK LOT 2 (DR) 6/14/2013 INFILTRATION TRENCH - DESIGN 2 80% 85% 95% CBP Established Efficiencies - Infiltration
Practices w/o Sand, Veg.
0.14 0.41 Yes 0.75 0.11 60.18 0.22 0.03 15.02 0.52 0.08 45.16
000032-INF-18-2 MERIDIAN PARK LOT 3 (DR) 9/14/2010 INFILTRATION TRENCH - DESIGN 1 80% 85% 95% CBP Established Efficiencies - Infiltration
Practices w/o Sand, Veg.
0.08 0.38 Yes 0.39 0.06 31.51 0.09 0.01 6.07 0.30 0.05 25.45
000076-INF-02-2 CHESTERBROOK WOODS, MOSS 1ST ADD'N TO - LOT 4 (DR) 2/11/2011 INFILTRATION TRENCH - DESIGN 1 80% 85% 95% CBP Established Efficiencies - Infiltration
Practices w/o Sand, Veg.
0.23 0.39 Yes 1.17 0.18 94.55 0.30 0.04 20.60 0.87 0.14 73.95
000096-INF-02-4 WEST MCLEAN BLOCK 11 LOTS 54-56 (DR) 8/24/2012 INFILTRATION TRENCH - DESIGN 3 80% 85% 95% CBP Established Efficiencies - Infiltration
Practices w/o Sand, Veg.
0.21 0.52 Yes 1.38 0.21 111.32 0.53 0.08 36.06 0.85 0.14 75.26
000096-INF-03-2 WEST MCLEAN BLK 11 LOTS 51, 52, 53 (DR) 5/7/2012 INFILTRATION TRENCH - DESIGN 2 80% 85% 95% CBP Established Efficiencies - Infiltration
Practices w/o Sand, Veg.
0.12 0.62 Yes 0.92 0.14 74.06 0.60 0.09 40.68 0.32 0.05 33.38
000142-INF-03-2 ELMWOOD ESTATES SEC 3 LOT 50 (DR) 11/16/2012 INFILTRATION TRENCH - DESIGN 2 80% 85% 95% CBP Established Efficiencies - Infiltration
Practices w/o Sand, Veg.
0.49 0.45 Yes 2.81 0.43 227.05 0.50 0.07 34.04 2.31 0.36 193.02
000427-INF-05-3 BROYHILLS MCLEAN ESTATES SEC 1 LOT 59 (DR) 10/3/2012 BIORETENTION FILTER 42% 52% 56% CBP, Retrofit Curves - RR; 0.5" Runoff Depth
per Fairfax County PFM
0.17 0.48 Yes 0.56 0.10 49.75 0.50 0.07 34.21 0.05 0.03 15.54
000508-INF-06-3 RIVER OAKS SEC 1 LOT 20 - 6925 RIVER OAKS DRIVE 8/20/2010 INFILTRATION TRENCH - DESIGN 3 80% 85% 95% CBP Established Efficiencies - Infiltration
Practices w/o Sand, Veg.
0.20 0.59 Yes 1.50 0.23 121.51 0.74 0.11 50.51 0.76 0.12 71.00
000508-INF-07-2 RIVER OAKS SEC 1 LOT 18 - 6921 RIVER OAKS DRIVE (D 6/20/2011 INFILTRATION TRENCH - DESIGN 1 80% 85% 95% CBP Established Efficiencies - Infiltration
Practices w/o Sand, Veg.
0.29 0.36 Yes 1.37 0.21 110.30 0.62 0.09 41.83 0.75 0.12 68.47
000508-INF-08-1 RIVER OAKS SECTION 1 LOT 22 (DR) 6/13/2011 INFILTRATION TRENCH - DESIGN 1 80% 85% 95% CBP Established Efficiencies - Infiltration
Practices w/o Sand, Veg.
0.32 0.28 Yes 1.22 0.19 98.61 (0.19) (0.03) (12.71) 1.41 0.22 111.32
000517-INF-02-5 WOODSIDE ESTATES SECTION 9 LOT 5 (DR) 3/9/2012 INFILTRATION TRENCH - DESIGN 1 80% 85% 95% CBP Established Efficiencies - Infiltration
Practices w/o Sand, Veg.
0.67 0.41 Yes 3.57 0.55 288.62 1.38 0.20 93.98 2.19 0.35 194.64
000603-INF-03-3 SHIRLEY SPRINGS LOT 7 - 7217 NEUMAN STREET (LE) 9/10/2010 INFILTRATION TRENCH - DESIGN 1 80% 85% 95% CBP Established Efficiencies - Infiltration
Practices w/o Sand, Veg.
0.13 0.15 Yes 0.30 0.05 24.45 (0.11) (0.02) (7.76) 0.42 0.06 32.21
000729-INF-05-2 PROVIDENCE FOREST LOT 19 / 1230 PROVIDENCE TERRACE 8/11/2010 INFILTRATION TRENCH - DESIGN 1 80% 85% 95% CBP Established Efficiencies - Infiltration
Practices w/o Sand, Veg.
0.22 0.23 Yes 0.73 0.11 58.71 0.39 0.06 26.53 0.34 0.06 32.18
000796-INF-01-2 ROSEHAVEN ESTATES LOT 10 (PR) 8/4/2010 INFILTRATION TRENCH - DESIGN 2 80% 85% 95% CBP Established Efficiencies - Infiltration
Practices w/o Sand, Veg.
0.31 0.24 Yes 1.04 0.16 83.99 0.16 0.02 10.98 0.88 0.14 73.01
000804-INF-13-2 HANSBOROUGH LOT 71 - 1202 CAROL RAYE STREET (DR) 7/27/2011 INFILTRATION TRENCH - DESIGN 2 80% 85% 95% CBP Established Efficiencies - Infiltration
Practices w/o Sand, Veg.
0.33 0.26 Yes 1.20 0.19 97.09 0.46 0.07 31.55 0.74 0.12 65.54
000804-INF-14-1 HANSBOROUGH, LOT 46 - 7108 ELIZABETH DR (DR) 1/26/2011 INFILTRATION TRENCH - DESIGN 2 80% 85% 95% CBP Established Efficiencies - Infiltration
Practices w/o Sand, Veg.
0.26 0.33 Yes 1.14 0.18 91.90 0.16 0.02 10.98 0.98 0.15 80.92
000939-INF-09-2 6505 JOYCE RD - WALHAVEN SEC 1 LOT 20 (LE) 8/25/2009 INFILTRATION TRENCH - DESIGN 1 80% 85% 95% CBP Established Efficiencies - Infiltration
Practices w/o Sand, Veg.
0.14 0.50 Yes 0.88 0.14 71.16 0.04 0.01 2.97 0.84 0.13 68.20
000940-INF-03-1 OLD DOMINION GARDENS SEC 2 LOT 35 6/16/2010 BIORETENTION BASIN 42% 52% 56% CBP, Retrofit Curves - RR; 0.5" Runoff Depth
per Fairfax County PFM
0.34 0.19 Yes 0.50 0.09 45.04 0.63 0.09 43.15 (0.13) (0.00) 1.89
000940-INF-04-2 OLD DOMINION GARDENS LOT 38 (DR) 11/3/2010 INFILTRATION TRENCH - DESIGN 1 80% 85% 95% CBP Established Efficiencies - Infiltration
Practices w/o Sand, Veg.
0.18 0.34 Yes 0.83 0.13 66.94 0.49 0.07 33.07 0.34 0.06 33.87
000981-INF-03-1 FRANKLIN FOREST SECTION 3 LOT 40 (DR) 4/13/2011 INFILTRATION TRENCH - DESIGN 1 80% 85% 95% CBP Established Efficiencies - Infiltration
Practices w/o Sand, Veg.
0.43 0.24 Yes 1.42 0.22 114.93 0.20 0.03 13.75 1.22 0.19 101.17
012567-INF-01-3 INGLESIDE ADDITION TO PART OF LOT 29 (DR) 7/2/2009 BIORETENTION BASIN 42% 52% 56% CBP, Retrofit Curves - RR; 0.5" Runoff Depth
per Fairfax County PFM
0.28 0.36 Yes 0.69 0.12 61.98 0.50 0.07 34.32 0.19 0.05 27.66
001279-INF-21-2 CHURCHILL SUB SEC 1 AND 2 BLK D LOT 18 (DR) 11/20/2009 BIORETENTION BASIN 42% 52% 56% CBP, Retrofit Curves - RR; 0.5" Runoff Depth
per Fairfax County PFM
0.19 0.31 Yes 0.41 0.07 36.66 - - - 0.41 0.07 36.66
001279-INF-24-1 CHURCHILL SEC 1 BLK B LOT 12 (DR) 7/26/2010 INFILTRATION TRENCH - DESIGN 1 80% 85% 95% CBP Established Efficiencies - Infiltration
Practices w/o Sand, Veg.
0.16 0.38 Yes 0.79 0.12 63.94 0.04 0.01 2.60 0.75 0.12 61.34
001279-INF-26-1 CHURCHILL, SEC.1,BLK D, LT 22 - 2120 BOXWOOD DR (D 8/2/2010 BIORETENTION BASIN 42% 52% 56% CBP, Retrofit Curves - RR; 0.5" Runoff Depth
per Fairfax County PFM
0.15 0.35 Yes 0.38 0.07 33.56 0.33 0.05 22.39 0.05 0.02 11.16
013033-INF-01-3 RAVENWOOD SECTION 3 LOT 99 (MA) 11/16/2009 INFILTRATION TRENCH - DESIGN 2 80% 85% 95% CBP Established Efficiencies - Infiltration
Practices w/o Sand, Veg.
0.13 1.00 Yes 1.53 0.24 123.62 0.35 0.05 23.73 1.18 0.19 99.89
001317-INF-02-2 LANGLEY HILL LOT 6 - 1012 LANGLEY HILL DRIVE (DR) 5/5/2011 INFILTRATION TRENCH - DESIGN 1 80% 85% 95% CBP Established Efficiencies - Infiltration
Practices w/o Sand, Veg.
0.44 0.23 Yes 1.41 0.22 113.86 0.23 0.03 15.41 1.18 0.18 98.45
001337-INF-04-3 FRANKLIN PARK, BLK 6 LOT 7 - 2029 RHODE ISLAND AVE 10/2/2009 BIORETENTION BASIN 42% 52% 56% CBP, Retrofit Curves - RR; 0.5" Runoff Depth
per Fairfax County PFM
0.13 0.69 Yes 0.58 0.10 51.62 0.58 0.08 39.41 (0.00) 0.02 12.21
001337-INF-06-2 FRANKLIN PARK, BLK 7, LTS 42 THRU 44 (DR) 8/24/2009 INFILTRATION TRENCH - DESIGN 2 80% 85% 95% CBP Established Efficiencies - Infiltration
Practices w/o Sand, Veg.
0.10 0.53 Yes 0.64 0.10 51.54 0.36 0.05 24.48 0.28 0.05 27.06
001337-INF-07-3 FRANKLIN PARK, BLK 7, LTS 45 THRU 47 (DR) 9/29/2010 INFILTRATION TRENCH - DESIGN 2 80% 85% 95% CBP Established Efficiencies - Infiltration
Practices w/o Sand, Veg.
0.11 0.24 Yes 0.36 0.06 29.38 0.18 0.03 12.24 0.18 0.03 17.14
001346-INF-11-1 HANSBOROUGH LOT 78 - 7101 ELIZABETH DRIVE (DR) 6/7/2010 INFILTRATION TRENCH - DESIGN 1 80% 85% 95% CBP Established Efficiencies - Infiltration
Practices w/o Sand, Veg.
0.19 0.43 Yes 1.05 0.16 84.79 0.25 0.04 17.26 0.80 0.12 67.53
013857-INF-02-2 BROYHILL LANGLEY ESTATES SECTION 1 LOT 76 (DR) 11/4/2009 INFILTRATION TRENCH - DESIGN 1 80% 85% 95% CBP Established Efficiencies - Infiltration
Practices w/o Sand, Veg.
0.14 0.43 Yes 0.77 0.12 62.01 0.09 0.01 5.93 0.68 0.11 56.08
013857-INF-06-1 BROYHILL LANGLEY ESTATES SEC I LOT 69 (DR) 7/11/2011 INFILTRATION TRENCH - DESIGN 2 80% 85% 95% CBP Established Efficiencies - Infiltration
Practices w/o Sand, Veg.
0.17 0.38 Yes 0.82 0.13 66.38 0.26 0.04 17.80 0.56 0.09 48.58
001433-INF-05-2 WEST LEWINSVILLE HEIGHTS SEC 2 LOT 60 (DR) 9/22/2011 INFILTRATION TRENCH - DESIGN 1 80% 85% 95% CBP Established Efficiencies - Infiltration
Practices w/o Sand, Veg.
0.04 0.24 Yes 0.13 0.02 10.60 - - - 0.13 0.02 10.60
015414-INF-05-3 CHESTERBROOK GARDENS SEC 2 LOT 82 (DR) 9/30/2009 INFILTRATION TRENCH - DESIGN 2 80% 85% 95% CBP Established Efficiencies - Infiltration
Practices w/o Sand, Veg.
0.18 0.32 Yes 0.75 0.12 60.44 0.10 0.01 6.65 0.65 0.10 53.79
015414-INF-08-5 CHESTERBROOK GARDENS SECTION 2 LOT 62 (DR) 9/6/2011 BIORETENTION BASIN 42% 52% 56% CBP, Retrofit Curves - RR; 0.5" Runoff Depth
per Fairfax County PFM
0.44 0.30 Yes 0.93 0.16 82.92 0.42 0.06 28.65 0.51 0.10 54.27
Net POC ReductionsChange in POC Load Resulting from
Plan (lb/yr)Efficiency Source
Total Area
Treated (Ac) IA%
>0.05% of Parcel in
MS4 Regulated
Area
Total POC Reductions (lb/yr)
Plan Number Project NameDate
ApprovedFacility Type
Efficiency
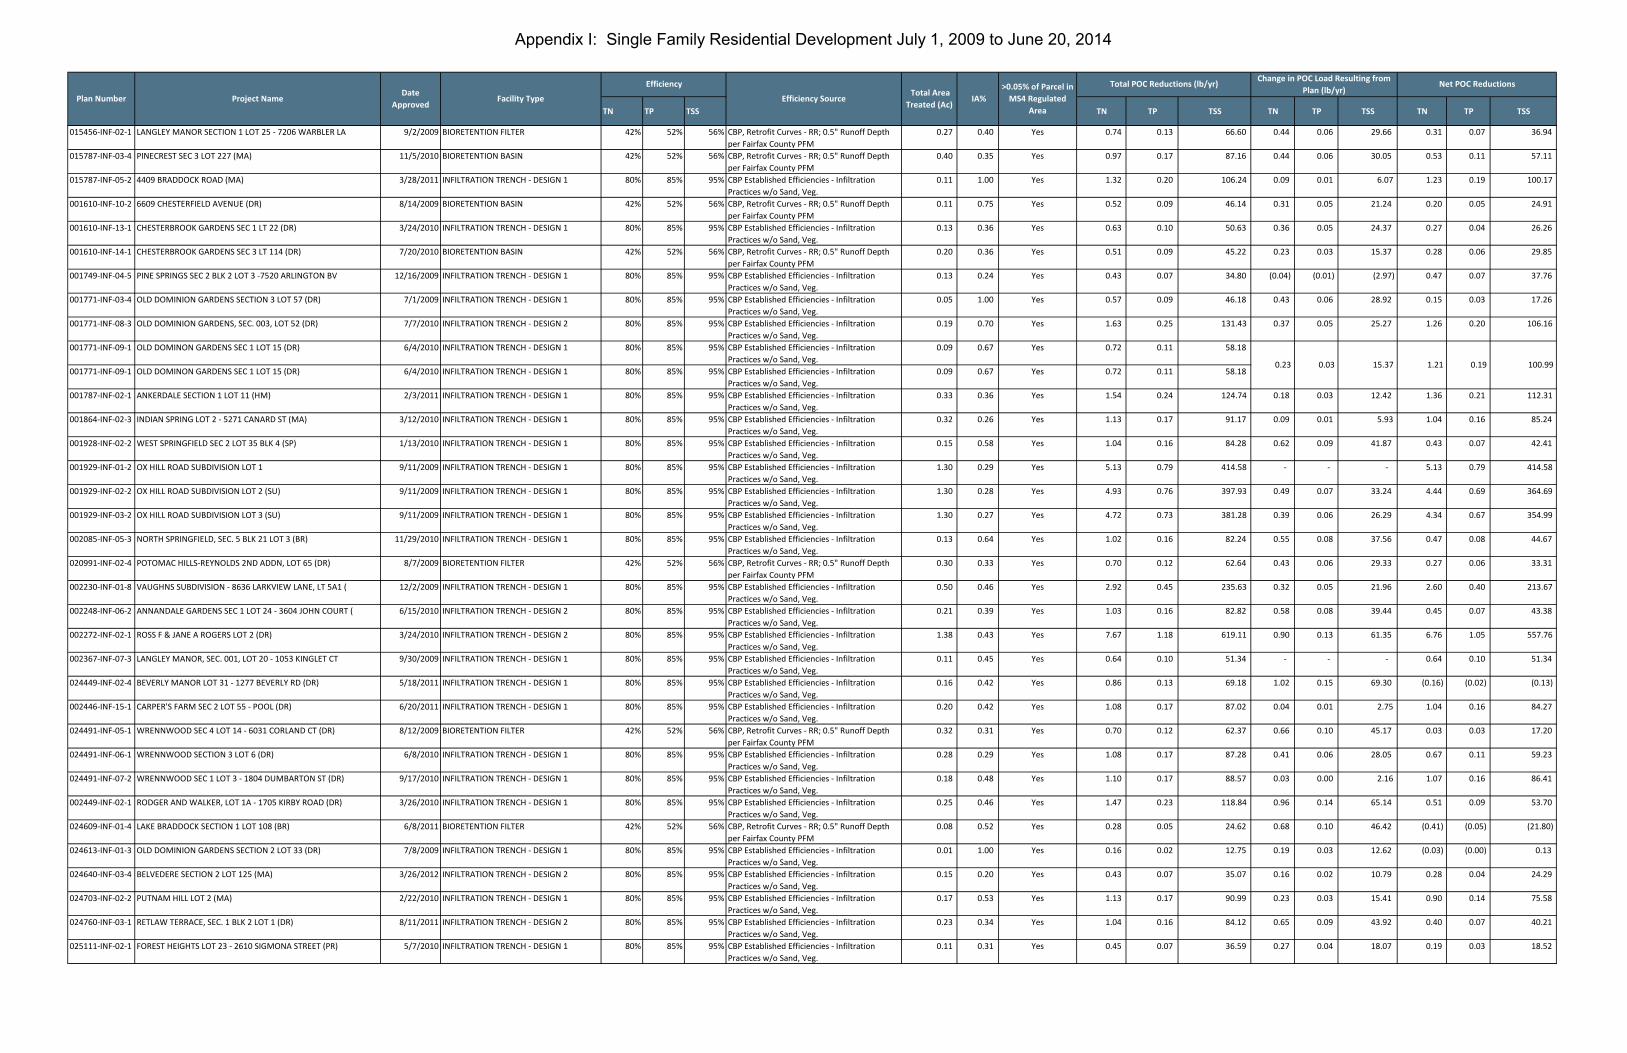
Appendix I: Single Family Residential Development July 1, 2009 to June 20, 2014
TN TP TSS TN TP TSS TN TP TSS TN TP TSS
Net POC ReductionsChange in POC Load Resulting from
Plan (lb/yr)Efficiency Source
Total Area
Treated (Ac) IA%
>0.05% of Parcel in
MS4 Regulated
Area
Total POC Reductions (lb/yr)
Plan Number Project NameDate
ApprovedFacility Type
Efficiency
015456-INF-02-1 LANGLEY MANOR SECTION 1 LOT 25 - 7206 WARBLER LA 9/2/2009 BIORETENTION FILTER 42% 52% 56% CBP, Retrofit Curves - RR; 0.5" Runoff Depth
per Fairfax County PFM
0.27 0.40 Yes 0.74 0.13 66.60 0.44 0.06 29.66 0.31 0.07 36.94
015787-INF-03-4 PINECREST SEC 3 LOT 227 (MA) 11/5/2010 BIORETENTION BASIN 42% 52% 56% CBP, Retrofit Curves - RR; 0.5" Runoff Depth
per Fairfax County PFM
0.40 0.35 Yes 0.97 0.17 87.16 0.44 0.06 30.05 0.53 0.11 57.11
015787-INF-05-2 4409 BRADDOCK ROAD (MA) 3/28/2011 INFILTRATION TRENCH - DESIGN 1 80% 85% 95% CBP Established Efficiencies - Infiltration
Practices w/o Sand, Veg.
0.11 1.00 Yes 1.32 0.20 106.24 0.09 0.01 6.07 1.23 0.19 100.17
001610-INF-10-2 6609 CHESTERFIELD AVENUE (DR) 8/14/2009 BIORETENTION BASIN 42% 52% 56% CBP, Retrofit Curves - RR; 0.5" Runoff Depth
per Fairfax County PFM
0.11 0.75 Yes 0.52 0.09 46.14 0.31 0.05 21.24 0.20 0.05 24.91
001610-INF-13-1 CHESTERBROOK GARDENS SEC 1 LT 22 (DR) 3/24/2010 INFILTRATION TRENCH - DESIGN 1 80% 85% 95% CBP Established Efficiencies - Infiltration
Practices w/o Sand, Veg.
0.13 0.36 Yes 0.63 0.10 50.63 0.36 0.05 24.37 0.27 0.04 26.26
001610-INF-14-1 CHESTERBROOK GARDENS SEC 3 LT 114 (DR) 7/20/2010 BIORETENTION BASIN 42% 52% 56% CBP, Retrofit Curves - RR; 0.5" Runoff Depth
per Fairfax County PFM
0.20 0.36 Yes 0.51 0.09 45.22 0.23 0.03 15.37 0.28 0.06 29.85
001749-INF-04-5 PINE SPRINGS SEC 2 BLK 2 LOT 3 -7520 ARLINGTON BV 12/16/2009 INFILTRATION TRENCH - DESIGN 1 80% 85% 95% CBP Established Efficiencies - Infiltration
Practices w/o Sand, Veg.
0.13 0.24 Yes 0.43 0.07 34.80 (0.04) (0.01) (2.97) 0.47 0.07 37.76
001771-INF-03-4 OLD DOMINION GARDENS SECTION 3 LOT 57 (DR) 7/1/2009 INFILTRATION TRENCH - DESIGN 1 80% 85% 95% CBP Established Efficiencies - Infiltration
Practices w/o Sand, Veg.
0.05 1.00 Yes 0.57 0.09 46.18 0.43 0.06 28.92 0.15 0.03 17.26
001771-INF-08-3 OLD DOMINION GARDENS, SEC. 003, LOT 52 (DR) 7/7/2010 INFILTRATION TRENCH - DESIGN 2 80% 85% 95% CBP Established Efficiencies - Infiltration
Practices w/o Sand, Veg.
0.19 0.70 Yes 1.63 0.25 131.43 0.37 0.05 25.27 1.26 0.20 106.16
001771-INF-09-1 OLD DOMINON GARDENS SEC 1 LOT 15 (DR) 6/4/2010 INFILTRATION TRENCH - DESIGN 1 80% 85% 95% CBP Established Efficiencies - Infiltration
Practices w/o Sand, Veg.
0.09 0.67 Yes 0.72 0.11 58.18
001771-INF-09-1 OLD DOMINON GARDENS SEC 1 LOT 15 (DR) 6/4/2010 INFILTRATION TRENCH - DESIGN 1 80% 85% 95% CBP Established Efficiencies - Infiltration
Practices w/o Sand, Veg.
0.09 0.67 Yes 0.72 0.11 58.18
001787-INF-02-1 ANKERDALE SECTION 1 LOT 11 (HM) 2/3/2011 INFILTRATION TRENCH - DESIGN 1 80% 85% 95% CBP Established Efficiencies - Infiltration
Practices w/o Sand, Veg.
0.33 0.36 Yes 1.54 0.24 124.74 0.18 0.03 12.42 1.36 0.21 112.31
001864-INF-02-3 INDIAN SPRING LOT 2 - 5271 CANARD ST (MA) 3/12/2010 INFILTRATION TRENCH - DESIGN 1 80% 85% 95% CBP Established Efficiencies - Infiltration
Practices w/o Sand, Veg.
0.32 0.26 Yes 1.13 0.17 91.17 0.09 0.01 5.93 1.04 0.16 85.24
001928-INF-02-2 WEST SPRINGFIELD SEC 2 LOT 35 BLK 4 (SP) 1/13/2010 INFILTRATION TRENCH - DESIGN 1 80% 85% 95% CBP Established Efficiencies - Infiltration
Practices w/o Sand, Veg.
0.15 0.58 Yes 1.04 0.16 84.28 0.62 0.09 41.87 0.43 0.07 42.41
001929-INF-01-2 OX HILL ROAD SUBDIVISION LOT 1 9/11/2009 INFILTRATION TRENCH - DESIGN 1 80% 85% 95% CBP Established Efficiencies - Infiltration
Practices w/o Sand, Veg.
1.30 0.29 Yes 5.13 0.79 414.58 - - - 5.13 0.79 414.58
001929-INF-02-2 OX HILL ROAD SUBDIVISION LOT 2 (SU) 9/11/2009 INFILTRATION TRENCH - DESIGN 1 80% 85% 95% CBP Established Efficiencies - Infiltration
Practices w/o Sand, Veg.
1.30 0.28 Yes 4.93 0.76 397.93 0.49 0.07 33.24 4.44 0.69 364.69
001929-INF-03-2 OX HILL ROAD SUBDIVISION LOT 3 (SU) 9/11/2009 INFILTRATION TRENCH - DESIGN 1 80% 85% 95% CBP Established Efficiencies - Infiltration
Practices w/o Sand, Veg.
1.30 0.27 Yes 4.72 0.73 381.28 0.39 0.06 26.29 4.34 0.67 354.99
002085-INF-05-3 NORTH SPRINGFIELD, SEC. 5 BLK 21 LOT 3 (BR) 11/29/2010 INFILTRATION TRENCH - DESIGN 1 80% 85% 95% CBP Established Efficiencies - Infiltration
Practices w/o Sand, Veg.
0.13 0.64 Yes 1.02 0.16 82.24 0.55 0.08 37.56 0.47 0.08 44.67
020991-INF-02-4 POTOMAC HILLS-REYNOLDS 2ND ADDN, LOT 65 (DR) 8/7/2009 BIORETENTION FILTER 42% 52% 56% CBP, Retrofit Curves - RR; 0.5" Runoff Depth
per Fairfax County PFM
0.30 0.33 Yes 0.70 0.12 62.64 0.43 0.06 29.33 0.27 0.06 33.31
002230-INF-01-8 VAUGHNS SUBDIVISION - 8636 LARKVIEW LANE, LT 5A1 ( 12/2/2009 INFILTRATION TRENCH - DESIGN 1 80% 85% 95% CBP Established Efficiencies - Infiltration
Practices w/o Sand, Veg.
0.50 0.46 Yes 2.92 0.45 235.63 0.32 0.05 21.96 2.60 0.40 213.67
002248-INF-06-2 ANNANDALE GARDENS SEC 1 LOT 24 - 3604 JOHN COURT ( 6/15/2010 INFILTRATION TRENCH - DESIGN 2 80% 85% 95% CBP Established Efficiencies - Infiltration
Practices w/o Sand, Veg.
0.21 0.39 Yes 1.03 0.16 82.82 0.58 0.08 39.44 0.45 0.07 43.38
002272-INF-02-1 ROSS F & JANE A ROGERS LOT 2 (DR) 3/24/2010 INFILTRATION TRENCH - DESIGN 2 80% 85% 95% CBP Established Efficiencies - Infiltration
Practices w/o Sand, Veg.
1.38 0.43 Yes 7.67 1.18 619.11 0.90 0.13 61.35 6.76 1.05 557.76
002367-INF-07-3 LANGLEY MANOR, SEC. 001, LOT 20 - 1053 KINGLET CT 9/30/2009 INFILTRATION TRENCH - DESIGN 1 80% 85% 95% CBP Established Efficiencies - Infiltration
Practices w/o Sand, Veg.
0.11 0.45 Yes 0.64 0.10 51.34 - - - 0.64 0.10 51.34
024449-INF-02-4 BEVERLY MANOR LOT 31 - 1277 BEVERLY RD (DR) 5/18/2011 INFILTRATION TRENCH - DESIGN 1 80% 85% 95% CBP Established Efficiencies - Infiltration
Practices w/o Sand, Veg.
0.16 0.42 Yes 0.86 0.13 69.18 1.02 0.15 69.30 (0.16) (0.02) (0.13)
002446-INF-15-1 CARPER'S FARM SEC 2 LOT 55 - POOL (DR) 6/20/2011 INFILTRATION TRENCH - DESIGN 1 80% 85% 95% CBP Established Efficiencies - Infiltration
Practices w/o Sand, Veg.
0.20 0.42 Yes 1.08 0.17 87.02 0.04 0.01 2.75 1.04 0.16 84.27
024491-INF-05-1 WRENNWOOD SEC 4 LOT 14 - 6031 CORLAND CT (DR) 8/12/2009 BIORETENTION FILTER 42% 52% 56% CBP, Retrofit Curves - RR; 0.5" Runoff Depth
per Fairfax County PFM
0.32 0.31 Yes 0.70 0.12 62.37 0.66 0.10 45.17 0.03 0.03 17.20
024491-INF-06-1 WRENNWOOD SECTION 3 LOT 6 (DR) 6/8/2010 INFILTRATION TRENCH - DESIGN 1 80% 85% 95% CBP Established Efficiencies - Infiltration
Practices w/o Sand, Veg.
0.28 0.29 Yes 1.08 0.17 87.28 0.41 0.06 28.05 0.67 0.11 59.23
024491-INF-07-2 WRENNWOOD SEC 1 LOT 3 - 1804 DUMBARTON ST (DR) 9/17/2010 INFILTRATION TRENCH - DESIGN 1 80% 85% 95% CBP Established Efficiencies - Infiltration
Practices w/o Sand, Veg.
0.18 0.48 Yes 1.10 0.17 88.57 0.03 0.00 2.16 1.07 0.16 86.41
002449-INF-02-1 RODGER AND WALKER, LOT 1A - 1705 KIRBY ROAD (DR) 3/26/2010 INFILTRATION TRENCH - DESIGN 1 80% 85% 95% CBP Established Efficiencies - Infiltration
Practices w/o Sand, Veg.
0.25 0.46 Yes 1.47 0.23 118.84 0.96 0.14 65.14 0.51 0.09 53.70
024609-INF-01-4 LAKE BRADDOCK SECTION 1 LOT 108 (BR) 6/8/2011 BIORETENTION FILTER 42% 52% 56% CBP, Retrofit Curves - RR; 0.5" Runoff Depth
per Fairfax County PFM
0.08 0.52 Yes 0.28 0.05 24.62 0.68 0.10 46.42 (0.41) (0.05) (21.80)
024613-INF-01-3 OLD DOMINION GARDENS SECTION 2 LOT 33 (DR) 7/8/2009 INFILTRATION TRENCH - DESIGN 1 80% 85% 95% CBP Established Efficiencies - Infiltration
Practices w/o Sand, Veg.
0.01 1.00 Yes 0.16 0.02 12.75 0.19 0.03 12.62 (0.03) (0.00) 0.13
024640-INF-03-4 BELVEDERE SECTION 2 LOT 125 (MA) 3/26/2012 INFILTRATION TRENCH - DESIGN 2 80% 85% 95% CBP Established Efficiencies - Infiltration
Practices w/o Sand, Veg.
0.15 0.20 Yes 0.43 0.07 35.07 0.16 0.02 10.79 0.28 0.04 24.29
024703-INF-02-2 PUTNAM HILL LOT 2 (MA) 2/22/2010 INFILTRATION TRENCH - DESIGN 1 80% 85% 95% CBP Established Efficiencies - Infiltration
Practices w/o Sand, Veg.
0.17 0.53 Yes 1.13 0.17 90.99 0.23 0.03 15.41 0.90 0.14 75.58
024760-INF-03-1 RETLAW TERRACE, SEC. 1 BLK 2 LOT 1 (DR) 8/11/2011 INFILTRATION TRENCH - DESIGN 2 80% 85% 95% CBP Established Efficiencies - Infiltration
Practices w/o Sand, Veg.
0.23 0.34 Yes 1.04 0.16 84.12 0.65 0.09 43.92 0.40 0.07 40.21
025111-INF-02-1 FOREST HEIGHTS LOT 23 - 2610 SIGMONA STREET (PR) 5/7/2010 INFILTRATION TRENCH - DESIGN 1 80% 85% 95% CBP Established Efficiencies - Infiltration
Practices w/o Sand, Veg.
0.11 0.31 Yes 0.45 0.07 36.59 0.27 0.04 18.07 0.19 0.03 18.52
0.23 0.03 15.37 1.21 0.19 100.99
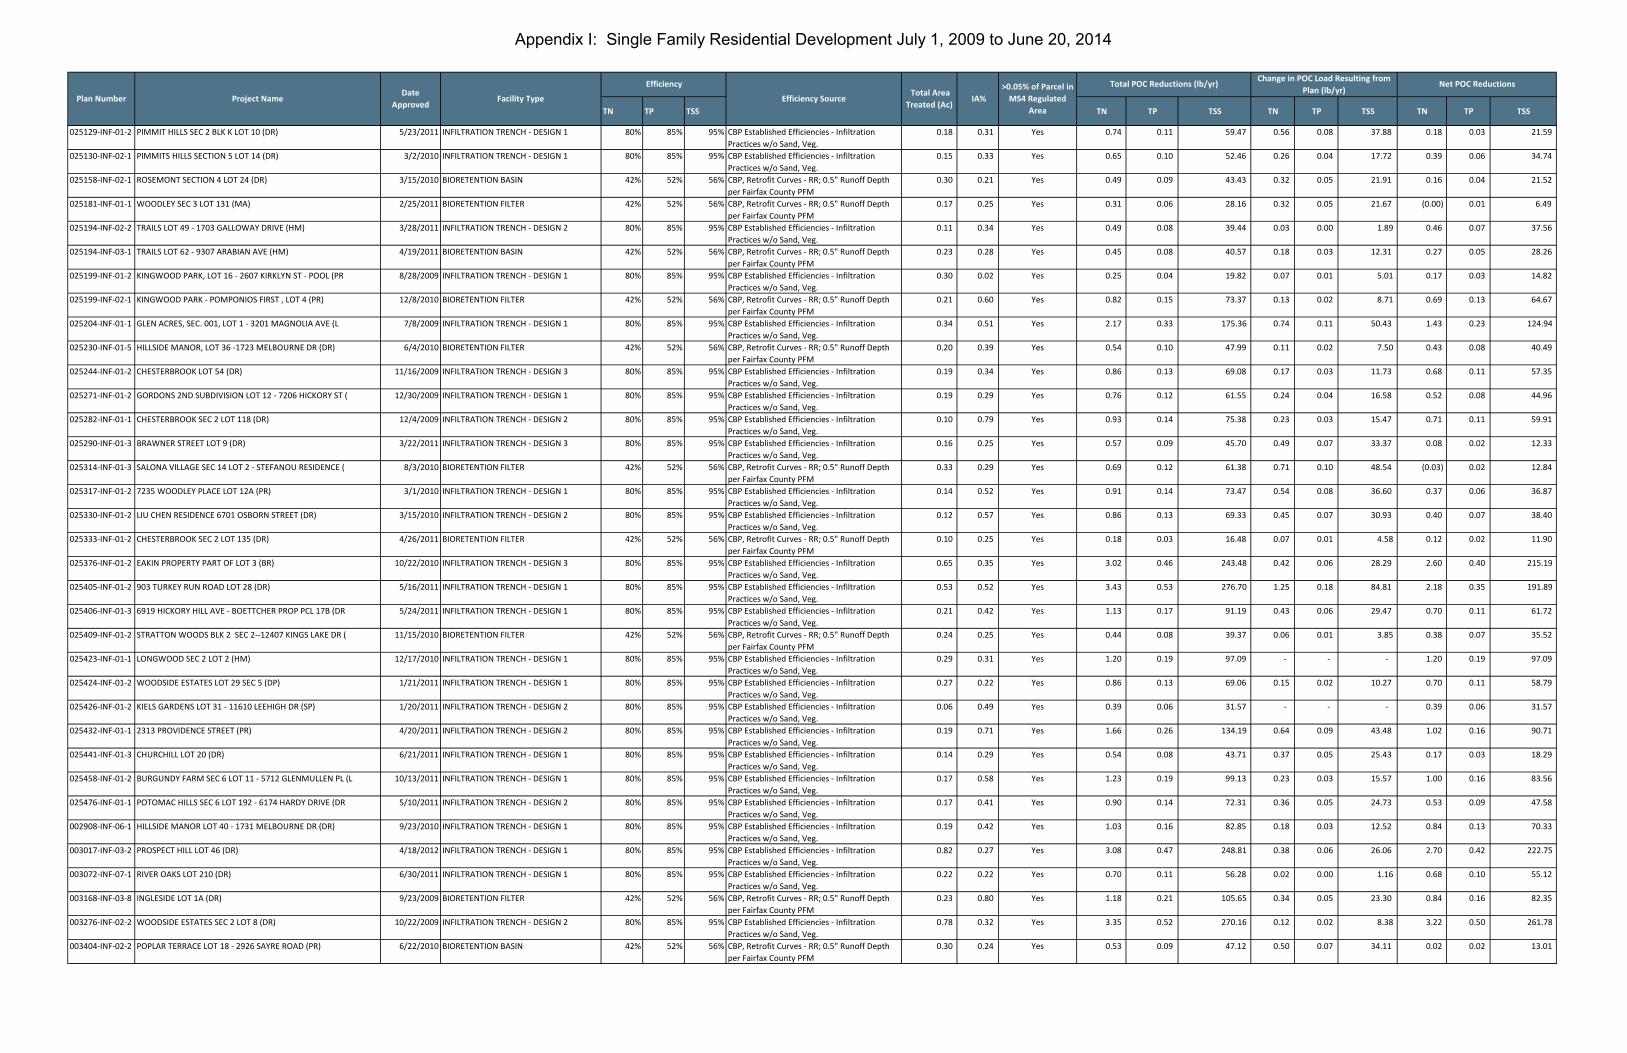
Appendix I: Single Family Residential Development July 1, 2009 to June 20, 2014
TN TP TSS TN TP TSS TN TP TSS TN TP TSS
Net POC ReductionsChange in POC Load Resulting from
Plan (lb/yr)Efficiency Source
Total Area
Treated (Ac) IA%
>0.05% of Parcel in
MS4 Regulated
Area
Total POC Reductions (lb/yr)
Plan Number Project NameDate
ApprovedFacility Type
Efficiency
025129-INF-01-2 PIMMIT HILLS SEC 2 BLK K LOT 10 (DR) 5/23/2011 INFILTRATION TRENCH - DESIGN 1 80% 85% 95% CBP Established Efficiencies - Infiltration
Practices w/o Sand, Veg.
0.18 0.31 Yes 0.74 0.11 59.47 0.56 0.08 37.88 0.18 0.03 21.59
025130-INF-02-1 PIMMITS HILLS SECTION 5 LOT 14 (DR) 3/2/2010 INFILTRATION TRENCH - DESIGN 1 80% 85% 95% CBP Established Efficiencies - Infiltration
Practices w/o Sand, Veg.
0.15 0.33 Yes 0.65 0.10 52.46 0.26 0.04 17.72 0.39 0.06 34.74
025158-INF-02-1 ROSEMONT SECTION 4 LOT 24 (DR) 3/15/2010 BIORETENTION BASIN 42% 52% 56% CBP, Retrofit Curves - RR; 0.5" Runoff Depth
per Fairfax County PFM
0.30 0.21 Yes 0.49 0.09 43.43 0.32 0.05 21.91 0.16 0.04 21.52
025181-INF-01-1 WOODLEY SEC 3 LOT 131 (MA) 2/25/2011 BIORETENTION FILTER 42% 52% 56% CBP, Retrofit Curves - RR; 0.5" Runoff Depth
per Fairfax County PFM
0.17 0.25 Yes 0.31 0.06 28.16 0.32 0.05 21.67 (0.00) 0.01 6.49
025194-INF-02-2 TRAILS LOT 49 - 1703 GALLOWAY DRIVE (HM) 3/28/2011 INFILTRATION TRENCH - DESIGN 2 80% 85% 95% CBP Established Efficiencies - Infiltration
Practices w/o Sand, Veg.
0.11 0.34 Yes 0.49 0.08 39.44 0.03 0.00 1.89 0.46 0.07 37.56
025194-INF-03-1 TRAILS LOT 62 - 9307 ARABIAN AVE (HM) 4/19/2011 BIORETENTION BASIN 42% 52% 56% CBP, Retrofit Curves - RR; 0.5" Runoff Depth
per Fairfax County PFM
0.23 0.28 Yes 0.45 0.08 40.57 0.18 0.03 12.31 0.27 0.05 28.26
025199-INF-01-2 KINGWOOD PARK, LOT 16 - 2607 KIRKLYN ST - POOL (PR 8/28/2009 INFILTRATION TRENCH - DESIGN 1 80% 85% 95% CBP Established Efficiencies - Infiltration
Practices w/o Sand, Veg.
0.30 0.02 Yes 0.25 0.04 19.82 0.07 0.01 5.01 0.17 0.03 14.82
025199-INF-02-1 KINGWOOD PARK - POMPONIOS FIRST , LOT 4 (PR) 12/8/2010 BIORETENTION FILTER 42% 52% 56% CBP, Retrofit Curves - RR; 0.5" Runoff Depth
per Fairfax County PFM
0.21 0.60 Yes 0.82 0.15 73.37 0.13 0.02 8.71 0.69 0.13 64.67
025204-INF-01-1 GLEN ACRES, SEC. 001, LOT 1 - 3201 MAGNOLIA AVE (L 7/8/2009 INFILTRATION TRENCH - DESIGN 1 80% 85% 95% CBP Established Efficiencies - Infiltration
Practices w/o Sand, Veg.
0.34 0.51 Yes 2.17 0.33 175.36 0.74 0.11 50.43 1.43 0.23 124.94
025230-INF-01-5 HILLSIDE MANOR, LOT 36 -1723 MELBOURNE DR (DR) 6/4/2010 BIORETENTION FILTER 42% 52% 56% CBP, Retrofit Curves - RR; 0.5" Runoff Depth
per Fairfax County PFM
0.20 0.39 Yes 0.54 0.10 47.99 0.11 0.02 7.50 0.43 0.08 40.49
025244-INF-01-2 CHESTERBROOK LOT 54 (DR) 11/16/2009 INFILTRATION TRENCH - DESIGN 3 80% 85% 95% CBP Established Efficiencies - Infiltration
Practices w/o Sand, Veg.
0.19 0.34 Yes 0.86 0.13 69.08 0.17 0.03 11.73 0.68 0.11 57.35
025271-INF-01-2 GORDONS 2ND SUBDIVISION LOT 12 - 7206 HICKORY ST ( 12/30/2009 INFILTRATION TRENCH - DESIGN 1 80% 85% 95% CBP Established Efficiencies - Infiltration
Practices w/o Sand, Veg.
0.19 0.29 Yes 0.76 0.12 61.55 0.24 0.04 16.58 0.52 0.08 44.96
025282-INF-01-1 CHESTERBROOK SEC 2 LOT 118 (DR) 12/4/2009 INFILTRATION TRENCH - DESIGN 2 80% 85% 95% CBP Established Efficiencies - Infiltration
Practices w/o Sand, Veg.
0.10 0.79 Yes 0.93 0.14 75.38 0.23 0.03 15.47 0.71 0.11 59.91
025290-INF-01-3 BRAWNER STREET LOT 9 (DR) 3/22/2011 INFILTRATION TRENCH - DESIGN 3 80% 85% 95% CBP Established Efficiencies - Infiltration
Practices w/o Sand, Veg.
0.16 0.25 Yes 0.57 0.09 45.70 0.49 0.07 33.37 0.08 0.02 12.33
025314-INF-01-3 SALONA VILLAGE SEC 14 LOT 2 - STEFANOU RESIDENCE ( 8/3/2010 BIORETENTION FILTER 42% 52% 56% CBP, Retrofit Curves - RR; 0.5" Runoff Depth
per Fairfax County PFM
0.33 0.29 Yes 0.69 0.12 61.38 0.71 0.10 48.54 (0.03) 0.02 12.84
025317-INF-01-2 7235 WOODLEY PLACE LOT 12A (PR) 3/1/2010 INFILTRATION TRENCH - DESIGN 1 80% 85% 95% CBP Established Efficiencies - Infiltration
Practices w/o Sand, Veg.
0.14 0.52 Yes 0.91 0.14 73.47 0.54 0.08 36.60 0.37 0.06 36.87
025330-INF-01-2 LIU CHEN RESIDENCE 6701 OSBORN STREET (DR) 3/15/2010 INFILTRATION TRENCH - DESIGN 2 80% 85% 95% CBP Established Efficiencies - Infiltration
Practices w/o Sand, Veg.
0.12 0.57 Yes 0.86 0.13 69.33 0.45 0.07 30.93 0.40 0.07 38.40
025333-INF-01-2 CHESTERBROOK SEC 2 LOT 135 (DR) 4/26/2011 BIORETENTION FILTER 42% 52% 56% CBP, Retrofit Curves - RR; 0.5" Runoff Depth
per Fairfax County PFM
0.10 0.25 Yes 0.18 0.03 16.48 0.07 0.01 4.58 0.12 0.02 11.90
025376-INF-01-2 EAKIN PROPERTY PART OF LOT 3 (BR) 10/22/2010 INFILTRATION TRENCH - DESIGN 3 80% 85% 95% CBP Established Efficiencies - Infiltration
Practices w/o Sand, Veg.
0.65 0.35 Yes 3.02 0.46 243.48 0.42 0.06 28.29 2.60 0.40 215.19
025405-INF-01-2 903 TURKEY RUN ROAD LOT 28 (DR) 5/16/2011 INFILTRATION TRENCH - DESIGN 1 80% 85% 95% CBP Established Efficiencies - Infiltration
Practices w/o Sand, Veg.
0.53 0.52 Yes 3.43 0.53 276.70 1.25 0.18 84.81 2.18 0.35 191.89
025406-INF-01-3 6919 HICKORY HILL AVE - BOETTCHER PROP PCL 17B (DR 5/24/2011 INFILTRATION TRENCH - DESIGN 1 80% 85% 95% CBP Established Efficiencies - Infiltration
Practices w/o Sand, Veg.
0.21 0.42 Yes 1.13 0.17 91.19 0.43 0.06 29.47 0.70 0.11 61.72
025409-INF-01-2 STRATTON WOODS BLK 2 SEC 2--12407 KINGS LAKE DR ( 11/15/2010 BIORETENTION FILTER 42% 52% 56% CBP, Retrofit Curves - RR; 0.5" Runoff Depth
per Fairfax County PFM
0.24 0.25 Yes 0.44 0.08 39.37 0.06 0.01 3.85 0.38 0.07 35.52
025423-INF-01-1 LONGWOOD SEC 2 LOT 2 (HM) 12/17/2010 INFILTRATION TRENCH - DESIGN 1 80% 85% 95% CBP Established Efficiencies - Infiltration
Practices w/o Sand, Veg.
0.29 0.31 Yes 1.20 0.19 97.09 - - - 1.20 0.19 97.09
025424-INF-01-2 WOODSIDE ESTATES LOT 29 SEC 5 (DP) 1/21/2011 INFILTRATION TRENCH - DESIGN 1 80% 85% 95% CBP Established Efficiencies - Infiltration
Practices w/o Sand, Veg.
0.27 0.22 Yes 0.86 0.13 69.06 0.15 0.02 10.27 0.70 0.11 58.79
025426-INF-01-2 KIELS GARDENS LOT 31 - 11610 LEEHIGH DR (SP) 1/20/2011 INFILTRATION TRENCH - DESIGN 2 80% 85% 95% CBP Established Efficiencies - Infiltration
Practices w/o Sand, Veg.
0.06 0.49 Yes 0.39 0.06 31.57 - - - 0.39 0.06 31.57
025432-INF-01-1 2313 PROVIDENCE STREET (PR) 4/20/2011 INFILTRATION TRENCH - DESIGN 2 80% 85% 95% CBP Established Efficiencies - Infiltration
Practices w/o Sand, Veg.
0.19 0.71 Yes 1.66 0.26 134.19 0.64 0.09 43.48 1.02 0.16 90.71
025441-INF-01-3 CHURCHILL LOT 20 (DR) 6/21/2011 INFILTRATION TRENCH - DESIGN 1 80% 85% 95% CBP Established Efficiencies - Infiltration
Practices w/o Sand, Veg.
0.14 0.29 Yes 0.54 0.08 43.71 0.37 0.05 25.43 0.17 0.03 18.29
025458-INF-01-2 BURGUNDY FARM SEC 6 LOT 11 - 5712 GLENMULLEN PL (L 10/13/2011 INFILTRATION TRENCH - DESIGN 1 80% 85% 95% CBP Established Efficiencies - Infiltration
Practices w/o Sand, Veg.
0.17 0.58 Yes 1.23 0.19 99.13 0.23 0.03 15.57 1.00 0.16 83.56
025476-INF-01-1 POTOMAC HILLS SEC 6 LOT 192 - 6174 HARDY DRIVE (DR 5/10/2011 INFILTRATION TRENCH - DESIGN 2 80% 85% 95% CBP Established Efficiencies - Infiltration
Practices w/o Sand, Veg.
0.17 0.41 Yes 0.90 0.14 72.31 0.36 0.05 24.73 0.53 0.09 47.58
002908-INF-06-1 HILLSIDE MANOR LOT 40 - 1731 MELBOURNE DR (DR) 9/23/2010 INFILTRATION TRENCH - DESIGN 1 80% 85% 95% CBP Established Efficiencies - Infiltration
Practices w/o Sand, Veg.
0.19 0.42 Yes 1.03 0.16 82.85 0.18 0.03 12.52 0.84 0.13 70.33
003017-INF-03-2 PROSPECT HILL LOT 46 (DR) 4/18/2012 INFILTRATION TRENCH - DESIGN 1 80% 85% 95% CBP Established Efficiencies - Infiltration
Practices w/o Sand, Veg.
0.82 0.27 Yes 3.08 0.47 248.81 0.38 0.06 26.06 2.70 0.42 222.75
003072-INF-07-1 RIVER OAKS LOT 210 (DR) 6/30/2011 INFILTRATION TRENCH - DESIGN 1 80% 85% 95% CBP Established Efficiencies - Infiltration
Practices w/o Sand, Veg.
0.22 0.22 Yes 0.70 0.11 56.28 0.02 0.00 1.16 0.68 0.10 55.12
003168-INF-03-8 INGLESIDE LOT 1A (DR) 9/23/2009 BIORETENTION FILTER 42% 52% 56% CBP, Retrofit Curves - RR; 0.5" Runoff Depth
per Fairfax County PFM
0.23 0.80 Yes 1.18 0.21 105.65 0.34 0.05 23.30 0.84 0.16 82.35
003276-INF-02-2 WOODSIDE ESTATES SEC 2 LOT 8 (DR) 10/22/2009 INFILTRATION TRENCH - DESIGN 2 80% 85% 95% CBP Established Efficiencies - Infiltration
Practices w/o Sand, Veg.
0.78 0.32 Yes 3.35 0.52 270.16 0.12 0.02 8.38 3.22 0.50 261.78
003404-INF-02-2 POPLAR TERRACE LOT 18 - 2926 SAYRE ROAD (PR) 6/22/2010 BIORETENTION BASIN 42% 52% 56% CBP, Retrofit Curves - RR; 0.5" Runoff Depth
per Fairfax County PFM
0.30 0.24 Yes 0.53 0.09 47.12 0.50 0.07 34.11 0.02 0.02 13.01

Appendix I: Single Family Residential Development July 1, 2009 to June 20, 2014
TN TP TSS TN TP TSS TN TP TSS TN TP TSS
Net POC ReductionsChange in POC Load Resulting from
Plan (lb/yr)Efficiency Source
Total Area
Treated (Ac) IA%
>0.05% of Parcel in
MS4 Regulated
Area
Total POC Reductions (lb/yr)
Plan Number Project NameDate
ApprovedFacility Type
Efficiency
003539-INF-01-4 BEVERLY MANOR BLK I LOT 2A - 1268 BEVERLY RD (DR) 11/7/2011 INFILTRATION TRENCH - DESIGN 2 80% 85% 95% CBP Established Efficiencies - Infiltration
Practices w/o Sand, Veg.
0.13 0.39 Yes 0.65 0.10 52.40 0.16 0.02 10.79 0.49 0.08 41.61
003658-INF-06-1 WESTMORELAND HEIGHTS SEC 1 LOT 3 - 6610 ORLAND ST 6/11/2010 BIORETENTION BASIN 42% 52% 56% CBP, Retrofit Curves - RR; 0.5" Runoff Depth
per Fairfax County PFM
0.10 0.63 Yes 0.42 0.08 37.97 0.30 0.04 20.61 0.12 0.03 17.36
003836-INF-04-2 HOLLY PARK, RESUB OF LOT 13 - 4200 BRUNING COURT ( 10/19/2009 INFILTRATION TRENCH - DESIGN 1 80% 85% 95% CBP Established Efficiencies - Infiltration
Practices w/o Sand, Veg.
0.09 1.00 Yes 1.09 0.17 88.18 0.24 0.03 16.18 0.85 0.13 72.00
004095-INF-03-2 CHESTERBOOK SECTION 1 LOT 34 (DR) 8/11/2010 INFILTRATION TRENCH - DESIGN 1 80% 85% 95% CBP Established Efficiencies - Infiltration
Practices w/o Sand, Veg.
0.17 0.29 Yes 0.67 0.10 54.39 0.30 0.04 20.38 0.37 0.06 34.01
004241-INF-06-2 CHESTERBROOK DIVINES BLK 4 LTS 27-29 1735 EAST AVE 1/20/2011 INFILTRATION TRENCH - DESIGN 1 80% 85% 95% CBP Established Efficiencies - Infiltration
Practices w/o Sand, Veg.
0.17 0.34 Yes 0.76 0.12 61.07 0.10 0.01 6.59 0.66 0.10 54.48
004283-INF-01-1 BESLEY LOT 5A (DR) 5/27/2010 INFILTRATION TRENCH - DESIGN 1 80% 85% 95% CBP Established Efficiencies - Infiltration
Practices w/o Sand, Veg.
0.15 0.40 Yes 0.77 0.12 62.52 0.35 0.05 23.46 0.43 0.07 39.06
004285-INF-09-1 MCLEAN MANOR LOT 119 SEC 3 (DR) 6/28/2011 INFILTRATION TRENCH - DESIGN 2 80% 85% 95% CBP Established Efficiencies - Infiltration
Practices w/o Sand, Veg.
0.14 0.40 Yes 0.72 0.11 58.35 0.10 0.02 7.09 0.62 0.10 51.26
004340-INF-02-2 SALONA VILLAGE SEC 2 LOT 8 - 6605 BRAWNER ST (DR) 8/4/2010 INFILTRATION TRENCH - DESIGN 1 80% 85% 95% CBP Established Efficiencies - Infiltration
Practices w/o Sand, Veg.
0.41 0.47 Yes 2.42 0.37 195.28 0.07 0.01 4.62 2.35 0.36 190.65
004342-INF-05-3 BROOKHAVEN BLOCK 4 LOT 6 - 1443 OAKVIEW DR (DR) 1/13/2011 BIORETENTION FILTER 42% 52% 56% CBP, Retrofit Curves - RR; 0.5" Runoff Depth
per Fairfax County PFM
0.24 0.46 Yes 0.74 0.13 66.22 0.66 0.10 44.83 0.08 0.04 21.38
004342-INF-07-3 BROOKHAVEN BLK 5 LOT 5 - 6445 JEFFERSON PLACE (DR) 8/28/2012 INFILTRATION TRENCH - DESIGN 1 80% 85% 95% CBP Established Efficiencies - Infiltration
Practices w/o Sand, Veg.
0.23 0.33 Yes 0.99 0.15 80.31 - - - 0.99 0.15 80.31
004800-INF-07-1 EL NIDO LOT 1 AND PARCEL 'A' (DR) 10/19/2009 BIORETENTION BASIN 42% 52% 56% CBP, Retrofit Curves - RR; 0.5" Runoff Depth
per Fairfax County PFM
0.30 0.36 Yes 0.73 0.13 65.74 0.49 0.07 33.23 0.25 0.06 32.52
004800-INF-08-2 ELNIDO ESTATES SEC 6 LOT 71 (DR) 8/27/2010 BIORETENTION FILTER 42% 52% 56% CBP, Retrofit Curves - RR; 0.5" Runoff Depth
per Fairfax County PFM
0.06 0.82 Yes 0.34 0.06 29.99 0.16 0.02 11.09 0.17 0.04 18.89
004800-INF-10-1 EL NIDO ESTATES SEC 3 LOT 26 - 1731 BARBEE STREET 5/4/2011 INFILTRATION TRENCH - DESIGN 1 80% 85% 95% CBP Established Efficiencies - Infiltration
Practices w/o Sand, Veg.
0.18 0.39 Yes 0.89 0.14 71.99 - - - 0.89 0.14 71.99
004821-INF-08-2 REIDS GROVE BLK B LOT 9 - 1105 INGLESIDE AVE (DR) 7/26/2010 INFILTRATION TRENCH - DESIGN 1 80% 85% 95% CBP Established Efficiencies - Infiltration
Practices w/o Sand, Veg.
0.23 0.35 Yes 1.06 0.16 85.72 0.31 0.05 21.41 0.75 0.12 64.31
004886-INF-04-3 FRANKLIN PARK LOTS 26 AND 27 (DR) 11/17/2010 INFILTRATION TRENCH - DESIGN 1 80% 85% 95% CBP Established Efficiencies - Infiltration
Practices w/o Sand, Veg.
0.52 0.27 Yes 1.91 0.29 154.52 - - - 1.91 0.29 154.52
004923-INF-14-2 WOODSIDE ESTATES SEC 5 LOT 38 (DR) 9/27/2010 INFILTRATION TRENCH - DESIGN 2 80% 85% 95% CBP Established Efficiencies - Infiltration
Practices w/o Sand, Veg.
0.77 0.24 Yes 2.61 0.40 210.74 0.25 0.04 16.78 2.36 0.37 193.96
004992-INF-02-2 GROVETON HEIGHTS LOT 21A (LE) 12/29/2010 BIORETENTION FILTER 42% 52% 56% CBP, Retrofit Curves - RR; 0.5" Runoff Depth
per Fairfax County PFM
0.11 0.44 Yes 0.32 0.06 29.05 0.48 0.07 32.94 (0.16) (0.01) (3.89)
005023-INF-01-2 LAURELMONT LOT 54A - 7527 OLD DOMINION DRIVE (DR) 2/24/2011 BIORETENTION BASIN 42% 52% 56% CBP, Retrofit Curves - RR; 0.5" Runoff Depth
per Fairfax County PFM
0.27 0.54 Yes 0.94 0.17 84.22 0.04 0.01 2.89 0.90 0.16 81.33
005134-INF-17-4 PIMMIT HILLS SEC 7 LOT 203 - 1822 ANDERSON ROAD (D 7/7/2011 INFILTRATION TRENCH - DESIGN 1 80% 85% 95% CBP Established Efficiencies - Infiltration
Practices w/o Sand, Veg.
0.19 0.63 Yes 1.48 0.23 119.45 0.62 0.09 41.89 0.86 0.14 77.56
005134-INF-23-5 PIMMIT HILLS SEC 5 LT 64 - 7141 TAYLOR RD (DR) 9/22/2009 INFILTRATION TRENCH - DESIGN 2 80% 85% 95% CBP Established Efficiencies - Infiltration
Practices w/o Sand, Veg.
0.11 0.62 Yes 0.84 0.13 67.81 0.60 0.09 40.69 0.24 0.04 27.12
005134-INF-33-2 1823 GILSON STREET (DR) 4/16/2010 BIORETENTION FILTER 42% 52% 56% CBP, Retrofit Curves - RR; 0.5" Runoff Depth
per Fairfax County PFM
0.05 0.72 Yes 0.23 0.04 20.82 0.51 0.07 34.38 (0.27) (0.03) (13.56)
005134-INF-34-1 PIMMIT HILLS LOT 257 SECTION 6 (DR) 3/5/2010 INFILTRATION TRENCH - DESIGN 1 80% 85% 95% CBP Established Efficiencies - Infiltration
Practices w/o Sand, Veg.
0.16 0.31 Yes 0.66 0.10 52.97 0.51 0.07 34.67 0.15 0.03 18.29
005134-INF-35-1 PIMMIT HILLS SEC 6 LOT 483 (DR) 3/24/2010 INFILTRATION TRENCH - DESIGN 1 80% 85% 95% CBP Established Efficiencies - Infiltration
Practices w/o Sand, Veg.
0.18 0.42 Yes 0.96 0.15 77.83 0.32 0.05 21.50 0.65 0.10 56.33
005134-INF-36-2 PIMMIT HILLS, SEC. 3, LOT 9 - 2026 CHERRI DRIVE ( 8/18/2010 INFILTRATION TRENCH - DESIGN 1 80% 85% 95% CBP Established Efficiencies - Infiltration
Practices w/o Sand, Veg.
0.26 0.32 Yes 1.11 0.17 89.26 0.39 0.06 26.79 0.71 0.11 62.46
005134-INF-37-1 PIMMITT HILLS SECTION 6 LOT 381 (DR) 5/17/2010 INFILTRATION TRENCH - DESIGN 1 80% 85% 95% CBP Established Efficiencies - Infiltration
Practices w/o Sand, Veg.
0.17 0.22 Yes 0.53 0.08 42.49 0.51 0.07 34.67 0.02 0.01 7.82
005134-INF-39-2 PIMMIT HILLS SEC 6 BK 6 LOT 2 - 7800 MAGARITY ROAD 11/15/2010 INFILTRATION TRENCH - DESIGN 1 80% 85% 95% CBP Established Efficiencies - Infiltration
Practices w/o Sand, Veg.
0.14 0.27 Yes 0.52 0.08 42.19 0.16 0.02 10.75 0.36 0.06 31.45
005134-INF-40-1 PIMMIT HILLS SEC 6 LOT 223 (DR) 1/28/2011 INFILTRATION TRENCH - DESIGN 2 80% 85% 95% CBP Established Efficiencies - Infiltration
Practices w/o Sand, Veg.
0.12 0.65 Yes 0.98 0.15 79.45 0.16 0.02 10.65 0.83 0.13 68.80
005134-INF-41-3 PIMMIT HILLS SEC 6 LOT 333 - 1900 CHERRI DR (DR) 11/8/2011 INFILTRATION TRENCH - DESIGN 2 80% 85% 95% CBP Established Efficiencies - Infiltration
Practices w/o Sand, Veg.
0.13 0.40 Yes 0.65 0.10 52.15 0.32 0.05 21.98 0.32 0.05 30.17
005210-INF-14-1 HUNTING RIDGE LOT 71 (DR) 8/9/2010 BIORETENTION BASIN 42% 52% 56% CBP, Retrofit Curves - RR; 0.5" Runoff Depth
per Fairfax County PFM
0.12 0.38 Yes 0.30 0.05 27.05 0.18 0.03 12.57 0.12 0.03 14.48
005253-INF-17-3 SALONA VILLAGE LOT 18 (DR) 3/29/2011 INFILTRATION TRENCH - DESIGN 3 80% 85% 95% CBP Established Efficiencies - Infiltration
Practices w/o Sand, Veg.
0.06 0.39 Yes 0.30 0.05 24.19 0.44 0.06 29.93 (0.14) (0.02) (5.75)
005253-INF-23-1 SALONA VILLAGE SEC 4 LOT 11 - 1319 KURTZ RD (DR) 2/22/2011 INFILTRATION TRENCH - DESIGN 1 80% 85% 95% CBP Established Efficiencies - Infiltration
Practices w/o Sand, Veg.
0.43 0.38 Yes 2.13 0.33 172.09 0.19 0.03 13.14 1.94 0.30 158.95
005314-INF-07-1 PIMMIT HILLS SECTION 2 LOT 4 BLK L (DR) 1/7/2011 INFILTRATION TRENCH - DESIGN 1 80% 85% 95% CBP Established Efficiencies - Infiltration
Practices w/o Sand, Veg.
0.08 0.53 Yes 0.53 0.08 42.49 - - - 0.53 0.08 42.49
005321-INF-01-3 BRADDOCK ACRES SECTION 6 LOT 73 (MA) 7/2/2009 BIORETENTION BASIN 42% 52% 56% CBP, Retrofit Curves - RR; 0.5" Runoff Depth
per Fairfax County PFM
0.24 0.48 Yes 0.78 0.14 69.83 0.49 0.07 33.37 0.29 0.07 36.45
005349-INF-06-2 GUM SPRINGS LOT 13A (MV) 1/13/2011 BIORETENTION BASIN 42% 52% 56% CBP, Retrofit Curves - RR; 0.5" Runoff Depth
per Fairfax County PFM
0.35 0.24 No - - - 0.13 0.02 8.90 (0.13) (0.02) (8.90)
005387-INF-01-1 TIMBERLAKE ESTATES SECTION 1 LOT 11 (DR) 9/2/2010 INFILTRATION TRENCH - DESIGN 1 80% 85% 95% CBP Established Efficiencies - Infiltration
Practices w/o Sand, Veg.
0.25 0.20 Yes 0.72 0.11 58.45 0.04 0.01 2.97 0.68 0.11 55.49
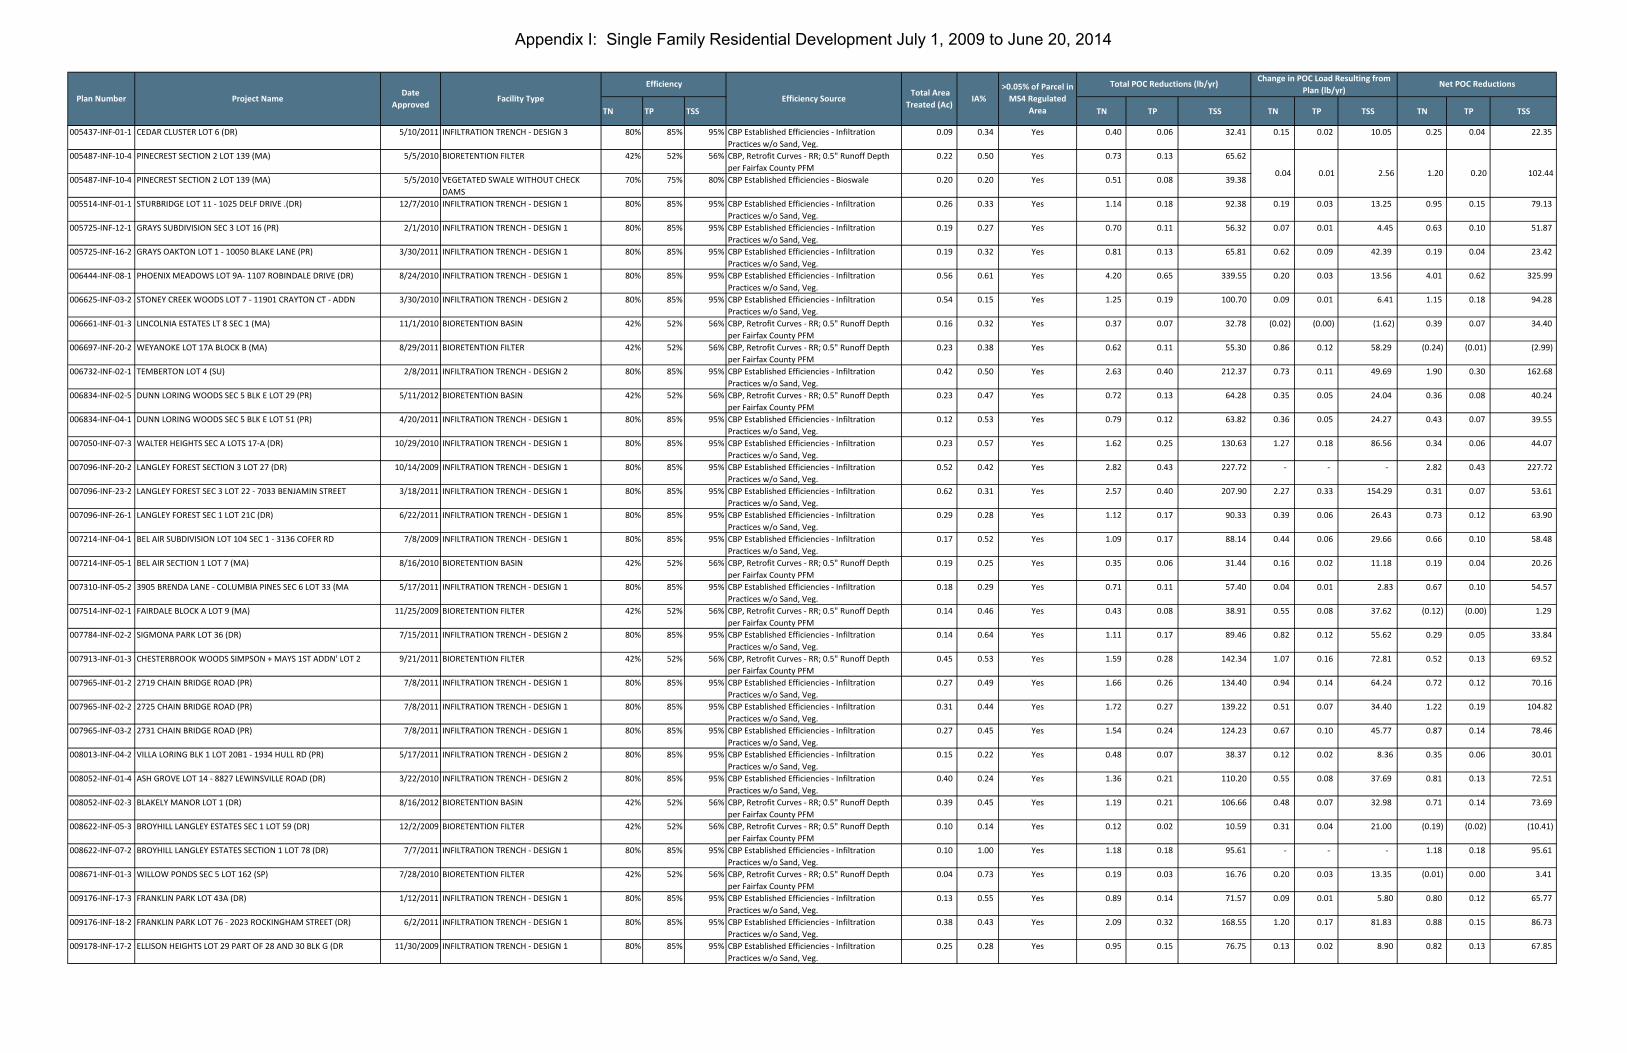
Appendix I: Single Family Residential Development July 1, 2009 to June 20, 2014
TN TP TSS TN TP TSS TN TP TSS TN TP TSS
Net POC ReductionsChange in POC Load Resulting from
Plan (lb/yr)Efficiency Source
Total Area
Treated (Ac) IA%
>0.05% of Parcel in
MS4 Regulated
Area
Total POC Reductions (lb/yr)
Plan Number Project NameDate
ApprovedFacility Type
Efficiency
005437-INF-01-1 CEDAR CLUSTER LOT 6 (DR) 5/10/2011 INFILTRATION TRENCH - DESIGN 3 80% 85% 95% CBP Established Efficiencies - Infiltration
Practices w/o Sand, Veg.
0.09 0.34 Yes 0.40 0.06 32.41 0.15 0.02 10.05 0.25 0.04 22.35
005487-INF-10-4 PINECREST SECTION 2 LOT 139 (MA) 5/5/2010 BIORETENTION FILTER 42% 52% 56% CBP, Retrofit Curves - RR; 0.5" Runoff Depth
per Fairfax County PFM
0.22 0.50 Yes 0.73 0.13 65.62
005487-INF-10-4 PINECREST SECTION 2 LOT 139 (MA) 5/5/2010 VEGETATED SWALE WITHOUT CHECK
DAMS
70% 75% 80% CBP Established Efficiencies - Bioswale 0.20 0.20 Yes 0.51 0.08 39.38
005514-INF-01-1 STURBRIDGE LOT 11 - 1025 DELF DRIVE .(DR) 12/7/2010 INFILTRATION TRENCH - DESIGN 1 80% 85% 95% CBP Established Efficiencies - Infiltration
Practices w/o Sand, Veg.
0.26 0.33 Yes 1.14 0.18 92.38 0.19 0.03 13.25 0.95 0.15 79.13
005725-INF-12-1 GRAYS SUBDIVISION SEC 3 LOT 16 (PR) 2/1/2010 INFILTRATION TRENCH - DESIGN 1 80% 85% 95% CBP Established Efficiencies - Infiltration
Practices w/o Sand, Veg.
0.19 0.27 Yes 0.70 0.11 56.32 0.07 0.01 4.45 0.63 0.10 51.87
005725-INF-16-2 GRAYS OAKTON LOT 1 - 10050 BLAKE LANE (PR) 3/30/2011 INFILTRATION TRENCH - DESIGN 1 80% 85% 95% CBP Established Efficiencies - Infiltration
Practices w/o Sand, Veg.
0.19 0.32 Yes 0.81 0.13 65.81 0.62 0.09 42.39 0.19 0.04 23.42
006444-INF-08-1 PHOENIX MEADOWS LOT 9A- 1107 ROBINDALE DRIVE (DR) 8/24/2010 INFILTRATION TRENCH - DESIGN 1 80% 85% 95% CBP Established Efficiencies - Infiltration
Practices w/o Sand, Veg.
0.56 0.61 Yes 4.20 0.65 339.55 0.20 0.03 13.56 4.01 0.62 325.99
006625-INF-03-2 STONEY CREEK WOODS LOT 7 - 11901 CRAYTON CT - ADDN 3/30/2010 INFILTRATION TRENCH - DESIGN 2 80% 85% 95% CBP Established Efficiencies - Infiltration
Practices w/o Sand, Veg.
0.54 0.15 Yes 1.25 0.19 100.70 0.09 0.01 6.41 1.15 0.18 94.28
006661-INF-01-3 LINCOLNIA ESTATES LT 8 SEC 1 (MA) 11/1/2010 BIORETENTION BASIN 42% 52% 56% CBP, Retrofit Curves - RR; 0.5" Runoff Depth
per Fairfax County PFM
0.16 0.32 Yes 0.37 0.07 32.78 (0.02) (0.00) (1.62) 0.39 0.07 34.40
006697-INF-20-2 WEYANOKE LOT 17A BLOCK B (MA) 8/29/2011 BIORETENTION FILTER 42% 52% 56% CBP, Retrofit Curves - RR; 0.5" Runoff Depth
per Fairfax County PFM
0.23 0.38 Yes 0.62 0.11 55.30 0.86 0.12 58.29 (0.24) (0.01) (2.99)
006732-INF-02-1 TEMBERTON LOT 4 (SU) 2/8/2011 INFILTRATION TRENCH - DESIGN 2 80% 85% 95% CBP Established Efficiencies - Infiltration
Practices w/o Sand, Veg.
0.42 0.50 Yes 2.63 0.40 212.37 0.73 0.11 49.69 1.90 0.30 162.68
006834-INF-02-5 DUNN LORING WOODS SEC 5 BLK E LOT 29 (PR) 5/11/2012 BIORETENTION BASIN 42% 52% 56% CBP, Retrofit Curves - RR; 0.5" Runoff Depth
per Fairfax County PFM
0.23 0.47 Yes 0.72 0.13 64.28 0.35 0.05 24.04 0.36 0.08 40.24
006834-INF-04-1 DUNN LORING WOODS SEC 5 BLK E LOT 51 (PR) 4/20/2011 INFILTRATION TRENCH - DESIGN 1 80% 85% 95% CBP Established Efficiencies - Infiltration
Practices w/o Sand, Veg.
0.12 0.53 Yes 0.79 0.12 63.82 0.36 0.05 24.27 0.43 0.07 39.55
007050-INF-07-3 WALTER HEIGHTS SEC A LOTS 17-A (DR) 10/29/2010 INFILTRATION TRENCH - DESIGN 1 80% 85% 95% CBP Established Efficiencies - Infiltration
Practices w/o Sand, Veg.
0.23 0.57 Yes 1.62 0.25 130.63 1.27 0.18 86.56 0.34 0.06 44.07
007096-INF-20-2 LANGLEY FOREST SECTION 3 LOT 27 (DR) 10/14/2009 INFILTRATION TRENCH - DESIGN 1 80% 85% 95% CBP Established Efficiencies - Infiltration
Practices w/o Sand, Veg.
0.52 0.42 Yes 2.82 0.43 227.72 - - - 2.82 0.43 227.72
007096-INF-23-2 LANGLEY FOREST SEC 3 LOT 22 - 7033 BENJAMIN STREET 3/18/2011 INFILTRATION TRENCH - DESIGN 1 80% 85% 95% CBP Established Efficiencies - Infiltration
Practices w/o Sand, Veg.
0.62 0.31 Yes 2.57 0.40 207.90 2.27 0.33 154.29 0.31 0.07 53.61
007096-INF-26-1 LANGLEY FOREST SEC 1 LOT 21C (DR) 6/22/2011 INFILTRATION TRENCH - DESIGN 1 80% 85% 95% CBP Established Efficiencies - Infiltration
Practices w/o Sand, Veg.
0.29 0.28 Yes 1.12 0.17 90.33 0.39 0.06 26.43 0.73 0.12 63.90
007214-INF-04-1 BEL AIR SUBDIVISION LOT 104 SEC 1 - 3136 COFER RD 7/8/2009 INFILTRATION TRENCH - DESIGN 1 80% 85% 95% CBP Established Efficiencies - Infiltration
Practices w/o Sand, Veg.
0.17 0.52 Yes 1.09 0.17 88.14 0.44 0.06 29.66 0.66 0.10 58.48
007214-INF-05-1 BEL AIR SECTION 1 LOT 7 (MA) 8/16/2010 BIORETENTION BASIN 42% 52% 56% CBP, Retrofit Curves - RR; 0.5" Runoff Depth
per Fairfax County PFM
0.19 0.25 Yes 0.35 0.06 31.44 0.16 0.02 11.18 0.19 0.04 20.26
007310-INF-05-2 3905 BRENDA LANE - COLUMBIA PINES SEC 6 LOT 33 (MA 5/17/2011 INFILTRATION TRENCH - DESIGN 1 80% 85% 95% CBP Established Efficiencies - Infiltration
Practices w/o Sand, Veg.
0.18 0.29 Yes 0.71 0.11 57.40 0.04 0.01 2.83 0.67 0.10 54.57
007514-INF-02-1 FAIRDALE BLOCK A LOT 9 (MA) 11/25/2009 BIORETENTION FILTER 42% 52% 56% CBP, Retrofit Curves - RR; 0.5" Runoff Depth
per Fairfax County PFM
0.14 0.46 Yes 0.43 0.08 38.91 0.55 0.08 37.62 (0.12) (0.00) 1.29
007784-INF-02-2 SIGMONA PARK LOT 36 (DR) 7/15/2011 INFILTRATION TRENCH - DESIGN 2 80% 85% 95% CBP Established Efficiencies - Infiltration
Practices w/o Sand, Veg.
0.14 0.64 Yes 1.11 0.17 89.46 0.82 0.12 55.62 0.29 0.05 33.84
007913-INF-01-3 CHESTERBROOK WOODS SIMPSON + MAYS 1ST ADDN' LOT 2 9/21/2011 BIORETENTION FILTER 42% 52% 56% CBP, Retrofit Curves - RR; 0.5" Runoff Depth
per Fairfax County PFM
0.45 0.53 Yes 1.59 0.28 142.34 1.07 0.16 72.81 0.52 0.13 69.52
007965-INF-01-2 2719 CHAIN BRIDGE ROAD (PR) 7/8/2011 INFILTRATION TRENCH - DESIGN 1 80% 85% 95% CBP Established Efficiencies - Infiltration
Practices w/o Sand, Veg.
0.27 0.49 Yes 1.66 0.26 134.40 0.94 0.14 64.24 0.72 0.12 70.16
007965-INF-02-2 2725 CHAIN BRIDGE ROAD (PR) 7/8/2011 INFILTRATION TRENCH - DESIGN 1 80% 85% 95% CBP Established Efficiencies - Infiltration
Practices w/o Sand, Veg.
0.31 0.44 Yes 1.72 0.27 139.22 0.51 0.07 34.40 1.22 0.19 104.82
007965-INF-03-2 2731 CHAIN BRIDGE ROAD (PR) 7/8/2011 INFILTRATION TRENCH - DESIGN 1 80% 85% 95% CBP Established Efficiencies - Infiltration
Practices w/o Sand, Veg.
0.27 0.45 Yes 1.54 0.24 124.23 0.67 0.10 45.77 0.87 0.14 78.46
008013-INF-04-2 VILLA LORING BLK 1 LOT 20B1 - 1934 HULL RD (PR) 5/17/2011 INFILTRATION TRENCH - DESIGN 2 80% 85% 95% CBP Established Efficiencies - Infiltration
Practices w/o Sand, Veg.
0.15 0.22 Yes 0.48 0.07 38.37 0.12 0.02 8.36 0.35 0.06 30.01
008052-INF-01-4 ASH GROVE LOT 14 - 8827 LEWINSVILLE ROAD (DR) 3/22/2010 INFILTRATION TRENCH - DESIGN 2 80% 85% 95% CBP Established Efficiencies - Infiltration
Practices w/o Sand, Veg.
0.40 0.24 Yes 1.36 0.21 110.20 0.55 0.08 37.69 0.81 0.13 72.51
008052-INF-02-3 BLAKELY MANOR LOT 1 (DR) 8/16/2012 BIORETENTION BASIN 42% 52% 56% CBP, Retrofit Curves - RR; 0.5" Runoff Depth
per Fairfax County PFM
0.39 0.45 Yes 1.19 0.21 106.66 0.48 0.07 32.98 0.71 0.14 73.69
008622-INF-05-3 BROYHILL LANGLEY ESTATES SEC 1 LOT 59 (DR) 12/2/2009 BIORETENTION FILTER 42% 52% 56% CBP, Retrofit Curves - RR; 0.5" Runoff Depth
per Fairfax County PFM
0.10 0.14 Yes 0.12 0.02 10.59 0.31 0.04 21.00 (0.19) (0.02) (10.41)
008622-INF-07-2 BROYHILL LANGLEY ESTATES SECTION 1 LOT 78 (DR) 7/7/2011 INFILTRATION TRENCH - DESIGN 1 80% 85% 95% CBP Established Efficiencies - Infiltration
Practices w/o Sand, Veg.
0.10 1.00 Yes 1.18 0.18 95.61 - - - 1.18 0.18 95.61
008671-INF-01-3 WILLOW PONDS SEC 5 LOT 162 (SP) 7/28/2010 BIORETENTION FILTER 42% 52% 56% CBP, Retrofit Curves - RR; 0.5" Runoff Depth
per Fairfax County PFM
0.04 0.73 Yes 0.19 0.03 16.76 0.20 0.03 13.35 (0.01) 0.00 3.41
009176-INF-17-3 FRANKLIN PARK LOT 43A (DR) 1/12/2011 INFILTRATION TRENCH - DESIGN 1 80% 85% 95% CBP Established Efficiencies - Infiltration
Practices w/o Sand, Veg.
0.13 0.55 Yes 0.89 0.14 71.57 0.09 0.01 5.80 0.80 0.12 65.77
009176-INF-18-2 FRANKLIN PARK LOT 76 - 2023 ROCKINGHAM STREET (DR) 6/2/2011 INFILTRATION TRENCH - DESIGN 1 80% 85% 95% CBP Established Efficiencies - Infiltration
Practices w/o Sand, Veg.
0.38 0.43 Yes 2.09 0.32 168.55 1.20 0.17 81.83 0.88 0.15 86.73
009178-INF-17-2 ELLISON HEIGHTS LOT 29 PART OF 28 AND 30 BLK G (DR 11/30/2009 INFILTRATION TRENCH - DESIGN 1 80% 85% 95% CBP Established Efficiencies - Infiltration
Practices w/o Sand, Veg.
0.25 0.28 Yes 0.95 0.15 76.75 0.13 0.02 8.90 0.82 0.13 67.85
102.44 0.04 0.01 2.56 1.20 0.20
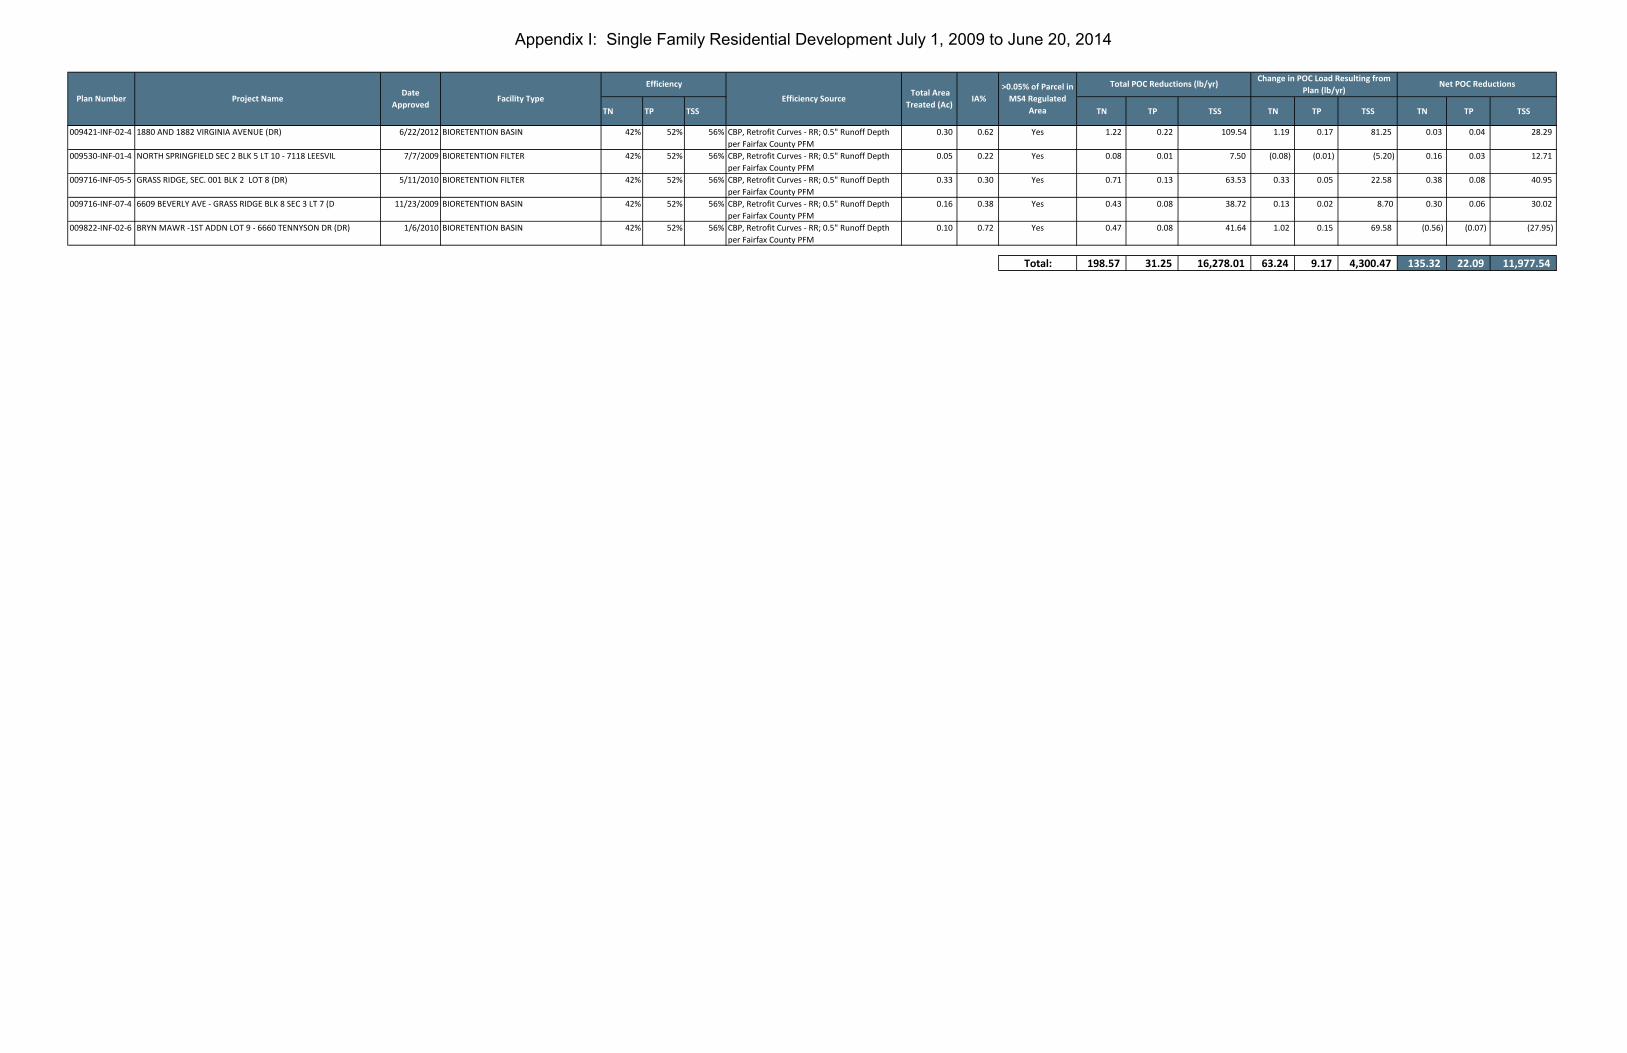
Appendix I: Single Family Residential Development July 1, 2009 to June 20, 2014
TN TP TSS TN TP TSS TN TP TSS TN TP TSS
Net POC ReductionsChange in POC Load Resulting from
Plan (lb/yr)Efficiency Source
Total Area
Treated (Ac) IA%
>0.05% of Parcel in
MS4 Regulated
Area
Total POC Reductions (lb/yr)
Plan Number Project NameDate
ApprovedFacility Type
Efficiency
009421-INF-02-4 1880 AND 1882 VIRGINIA AVENUE (DR) 6/22/2012 BIORETENTION BASIN 42% 52% 56% CBP, Retrofit Curves - RR; 0.5" Runoff Depth
per Fairfax County PFM
0.30 0.62 Yes 1.22 0.22 109.54 1.19 0.17 81.25 0.03 0.04 28.29
009530-INF-01-4 NORTH SPRINGFIELD SEC 2 BLK 5 LT 10 - 7118 LEESVIL 7/7/2009 BIORETENTION FILTER 42% 52% 56% CBP, Retrofit Curves - RR; 0.5" Runoff Depth
per Fairfax County PFM
0.05 0.22 Yes 0.08 0.01 7.50 (0.08) (0.01) (5.20) 0.16 0.03 12.71
009716-INF-05-5 GRASS RIDGE, SEC. 001 BLK 2 LOT 8 (DR) 5/11/2010 BIORETENTION FILTER 42% 52% 56% CBP, Retrofit Curves - RR; 0.5" Runoff Depth
per Fairfax County PFM
0.33 0.30 Yes 0.71 0.13 63.53 0.33 0.05 22.58 0.38 0.08 40.95
009716-INF-07-4 6609 BEVERLY AVE - GRASS RIDGE BLK 8 SEC 3 LT 7 (D 11/23/2009 BIORETENTION BASIN 42% 52% 56% CBP, Retrofit Curves - RR; 0.5" Runoff Depth
per Fairfax County PFM
0.16 0.38 Yes 0.43 0.08 38.72 0.13 0.02 8.70 0.30 0.06 30.02
009822-INF-02-6 BRYN MAWR -1ST ADDN LOT 9 - 6660 TENNYSON DR (DR) 1/6/2010 BIORETENTION BASIN 42% 52% 56% CBP, Retrofit Curves - RR; 0.5" Runoff Depth
per Fairfax County PFM
0.10 0.72 Yes 0.47 0.08 41.64 1.02 0.15 69.58 (0.56) (0.07) (27.95)
Total: 198.57 31.25 16,278.01 63.24 9.17 4,300.47 135.32 22.09 11,977.54
Appendix J
Appendix J
In-Lake Forebay Retrofit Calculations

Appendix J
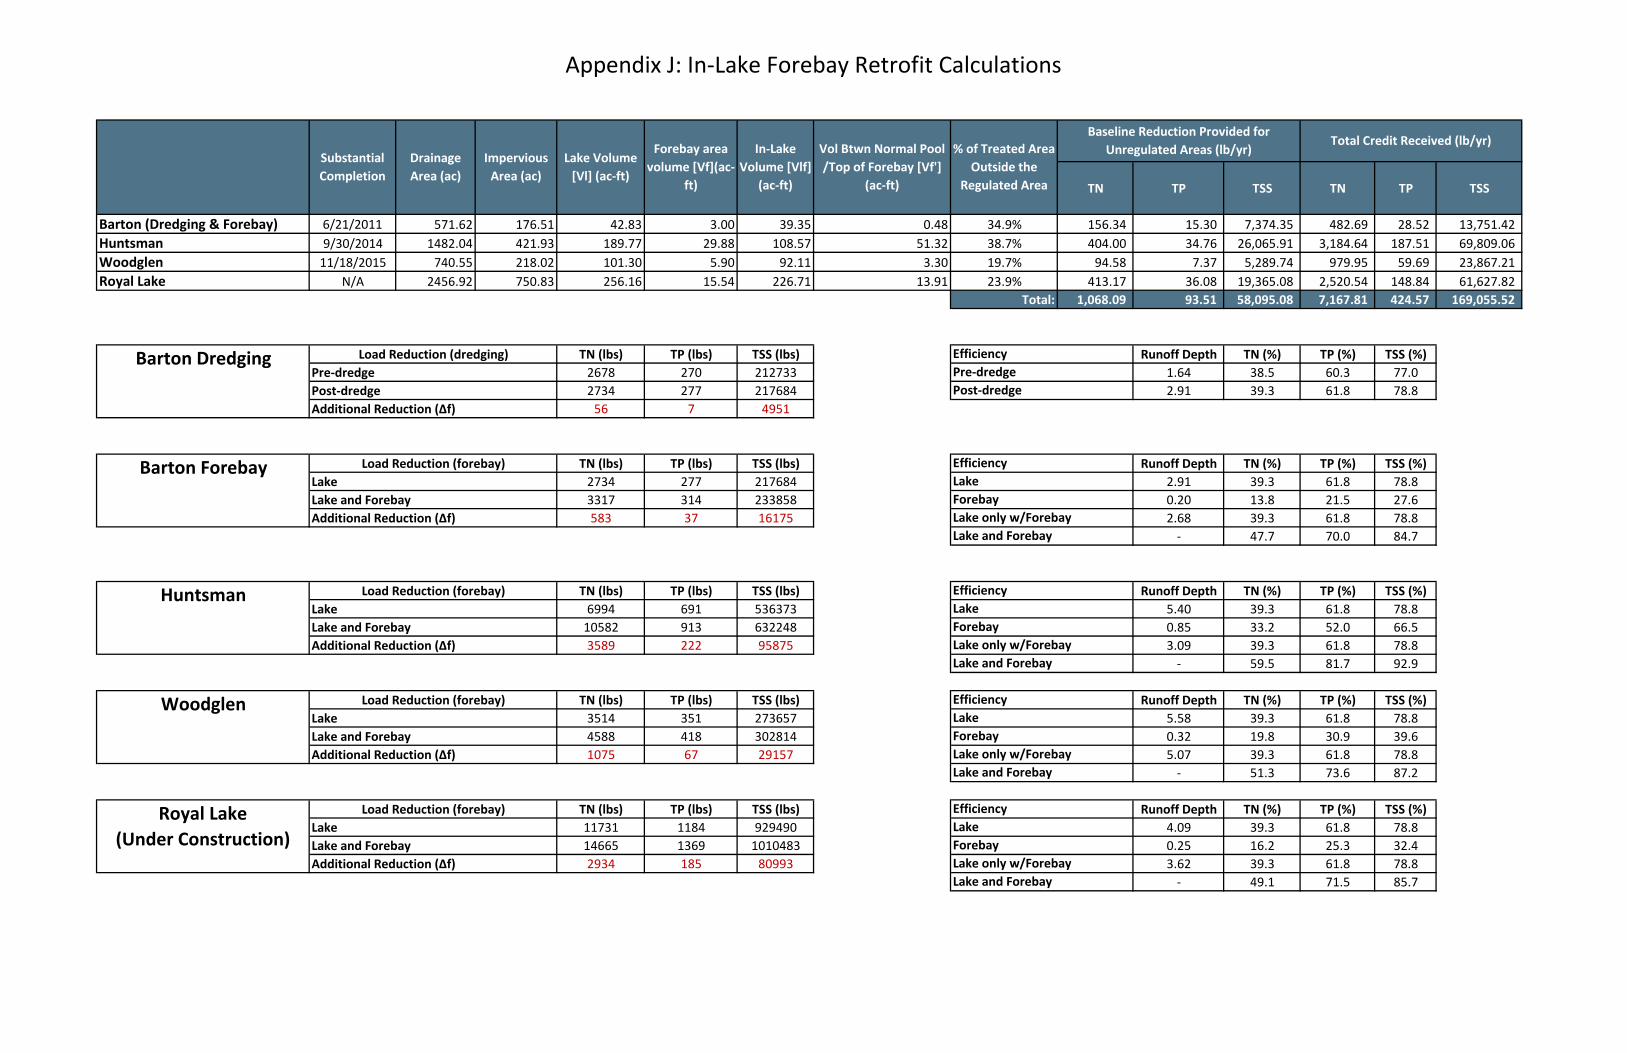
Appendix J: In-Lake Forebay Retrofit Calculations
TN TP TSS TN TP TSS
Barton (Dredging & Forebay) 6/21/2011 571.62 176.51 42.83 3.00 39.35 0.48 34.9% 156.34 15.30 7,374.35 482.69 28.52 13,751.42
Huntsman 9/30/2014 1482.04 421.93 189.77 29.88 108.57 51.32 38.7% 404.00 34.76 26,065.91 3,184.64 187.51 69,809.06
Woodglen 11/18/2015 740.55 218.02 101.30 5.90 92.11 3.30 19.7% 94.58 7.37 5,289.74 979.95 59.69 23,867.21
Royal Lake N/A 2456.92 750.83 256.16 15.54 226.71 13.91 23.9% 413.17 36.08 19,365.08 2,520.54 148.84 61,627.82
Total: 1,068.09 93.51 58,095.08 7,167.81 424.57 169,055.52
TN (lbs) TP (lbs) TSS (lbs) Runoff Depth TN (%) TP (%) TSS (%)
2678 270 212733 1.64 38.5 60.3 77.0
2734 277 217684 2.91 39.3 61.8 78.8
56 7 4951
TN (lbs) TP (lbs) TSS (lbs) Runoff Depth TN (%) TP (%) TSS (%)
2734 277 217684 2.91 39.3 61.8 78.8
3317 314 233858 0.20 13.8 21.5 27.6
583 37 16175 2.68 39.3 61.8 78.8
- 47.7 70.0 84.7
TN (lbs) TP (lbs) TSS (lbs) Runoff Depth TN (%) TP (%) TSS (%)
6994 691 536373 5.40 39.3 61.8 78.8
10582 913 632248 0.85 33.2 52.0 66.5
3589 222 95875 3.09 39.3 61.8 78.8
- 59.5 81.7 92.9
TN (lbs) TP (lbs) TSS (lbs) Runoff Depth TN (%) TP (%) TSS (%)
3514 351 273657 5.58 39.3 61.8 78.8
4588 418 302814 0.32 19.8 30.9 39.6
1075 67 29157 5.07 39.3 61.8 78.8
- 51.3 73.6 87.2
TN (lbs) TP (lbs) TSS (lbs) Runoff Depth TN (%) TP (%) TSS (%)
11731 1184 929490 4.09 39.3 61.8 78.8
14665 1369 1010483 0.25 16.2 25.3 32.4
2934 185 80993 3.62 39.3 61.8 78.8
- 49.1 71.5 85.7Lake and Forebay
Additional Reduction (∆f) Lake only w/Forebay
Lake and Forebay
Royal Lake
(Under Construction)
Load Reduction (forebay) Efficiency
Lake Lake
Lake and Forebay Forebay
Additional Reduction (∆f) Lake only w/Forebay
Lake and Forebay
Woodglen Load Reduction (forebay) Efficiency
Lake Lake
Lake and Forebay Forebay
Lake only w/Forebay
Lake and Forebay
Huntsman Load Reduction (forebay) Efficiency
Lake Lake
Lake and Forebay Forebay
Additional Reduction (∆f) Lake only w/Forebay
Post-dredge Post-dredge
Additional Reduction (∆f)
Barton Forebay Load Reduction (forebay) Efficiency
Lake Lake
Lake and Forebay Forebay
Barton Dredging Load Reduction (dredging) Efficiency
Pre-dredge Pre-dredge
Additional Reduction (∆f)
Vol Btwn Normal Pool
/Top of Forebay [Vf']
(ac-ft)
% of Treated Area
Outside the
Regulated Area
Baseline Reduction Provided for
Unregulated Areas (lb/yr)Total Credit Received (lb/yr)
In-Lake
Volume [Vlf]
(ac-ft)
Substantial
Completion
Drainage
Area (ac)
Impervious
Area (ac)
Lake Volume
[Vl] (ac-ft)
Forebay area
volume [Vf](ac-
ft)


Appendix K
Appendix K
List of Residential Septic Conversions and Commercial Septic
Conversion Calculations
PIN Street Name Street
Type
Address
Number Account Status Change
Type (Residential or
Commercial)
0194 01
0029A ALPS DR 1320 353179 6/12/2009 R
0372 09
0024 STRYKER AV 2311 400873 9/14/2012 R
0302 19
0007 SOTHORON RD 6538 203989 8/15/2013 R
0473 07
0203A JERMANTOWN RD 3309 400851 3/25/2014 R
0701 03
0060A SAINT JEROME DR 4212 355794 9/14/2012 R
0212 03
0020 RIVER OAKS DR 6925 353544 2/15/2012 R
0693 12
0013 MAURY RD 9819 202703 7/1/2015 R
0553 04
0029A CLIFTON RD 5539 356527 10/19/2007 R
0461 01
0080 WEST OX RD 3626 403020 9/14/2012 R
0782 02
0029 HALL ST 5810 402885 7/18/2012 R
0381 03
0010 LAUREL RIDGE RD 2223 202313 8/30/2006 R
0223 02
0001 TURKEY RUN RD 1007 402273 5/29/2013 R
0702 02
0055 WOODLARK DR 4316 204896 10/5/2011 R
0692
05080002 BURBANK RD 8909 401169 8/1/2008 R
0311 03
0025 WEST LANGLEY LA 6507 401851 2/7/2013 R
0714 10
0002A MONTGOMERY ST 5112 202814 7/1/2014 R
0473 07
0201 ROSEHAVEN ST 10712 403733 3/26/2014 R
0383 07
0028 FAIROAKS RD 9940 353134 5/5/2010 R
0893 01
0008 SYDENSTRICKER RD 7212 109220 11/5/2008 R
0311 03
0023 DARNALL DR 1321 401883 2/7/2013 R
0701 02
0185 RALEIGH AV 8505 203429 9/6/2008 R
0211 02
0065 BALLS HILL RD 801 356962 8/15/2013 R
0901 01
0042 LYLES RD 6526 202579 9/20/2007 R
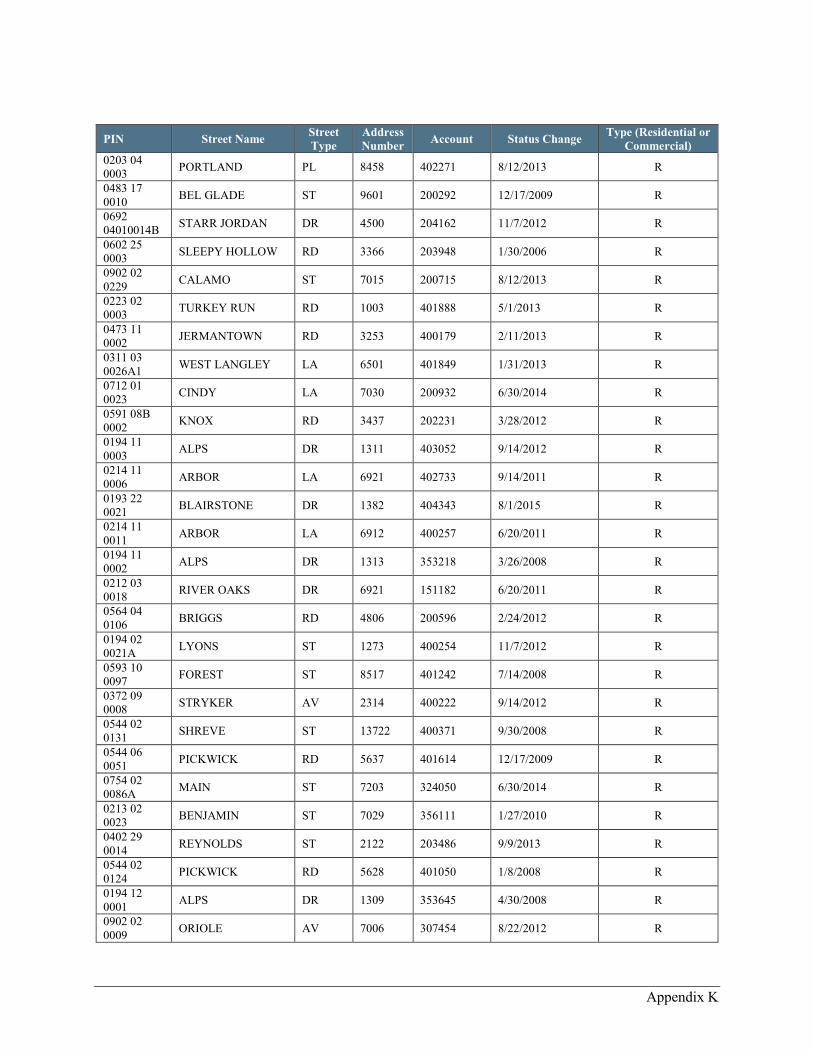
Appendix K
PIN Street Name Street
Type
Address
Number Account Status Change
Type (Residential or
Commercial)
0203 04
0003 PORTLAND PL 8458 402271 8/12/2013 R
0483 17
0010 BEL GLADE ST 9601 200292 12/17/2009 R
0692
04010014B STARR JORDAN DR 4500 204162 11/7/2012 R
0602 25
0003 SLEEPY HOLLOW RD 3366 203948 1/30/2006 R
0902 02
0229 CALAMO ST 7015 200715 8/12/2013 R
0223 02
0003 TURKEY RUN RD 1003 401888 5/1/2013 R
0473 11
0002 JERMANTOWN RD 3253 400179 2/11/2013 R
0311 03
0026A1 WEST LANGLEY LA 6501 401849 1/31/2013 R
0712 01
0023 CINDY LA 7030 200932 6/30/2014 R
0591 08B
0002 KNOX RD 3437 202231 3/28/2012 R
0194 11
0003 ALPS DR 1311 403052 9/14/2012 R
0214 11
0006 ARBOR LA 6921 402733 9/14/2011 R
0193 22
0021 BLAIRSTONE DR 1382 404343 8/1/2015 R
0214 11
0011 ARBOR LA 6912 400257 6/20/2011 R
0194 11
0002 ALPS DR 1313 353218 3/26/2008 R
0212 03
0018 RIVER OAKS DR 6921 151182 6/20/2011 R
0564 04
0106 BRIGGS RD 4806 200596 2/24/2012 R
0194 02
0021A LYONS ST 1273 400254 11/7/2012 R
0593 10
0097 FOREST ST 8517 401242 7/14/2008 R
0372 09
0008 STRYKER AV 2314 400222 9/14/2012 R
0544 02
0131 SHREVE ST 13722 400371 9/30/2008 R
0544 06
0051 PICKWICK RD 5637 401614 12/17/2009 R
0754 02
0086A MAIN ST 7203 324050 6/30/2014 R
0213 02
0023 BENJAMIN ST 7029 356111 1/27/2010 R
0402 29
0014 REYNOLDS ST 2122 203486 9/9/2013 R
0544 02
0124 PICKWICK RD 5628 401050 1/8/2008 R
0194 12
0001 ALPS DR 1309 353645 4/30/2008 R
0902 02
0009 ORIOLE AV 7006 307454 8/22/2012 R
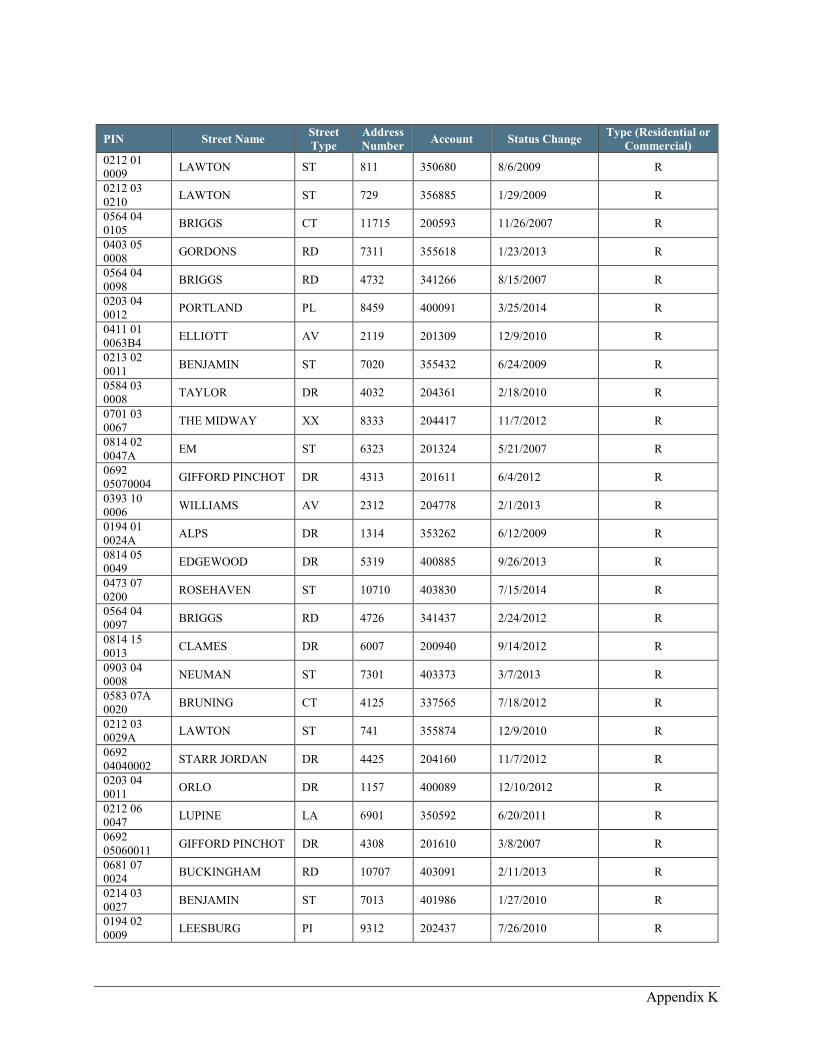
Appendix K
PIN Street Name Street
Type
Address
Number Account Status Change
Type (Residential or
Commercial)
0212 01
0009 LAWTON ST 811 350680 8/6/2009 R
0212 03
0210 LAWTON ST 729 356885 1/29/2009 R
0564 04
0105 BRIGGS CT 11715 200593 11/26/2007 R
0403 05
0008 GORDONS RD 7311 355618 1/23/2013 R
0564 04
0098 BRIGGS RD 4732 341266 8/15/2007 R
0203 04
0012 PORTLAND PL 8459 400091 3/25/2014 R
0411 01
0063B4 ELLIOTT AV 2119 201309 12/9/2010 R
0213 02
0011 BENJAMIN ST 7020 355432 6/24/2009 R
0584 03
0008 TAYLOR DR 4032 204361 2/18/2010 R
0701 03
0067 THE MIDWAY XX 8333 204417 11/7/2012 R
0814 02
0047A EM ST 6323 201324 5/21/2007 R
0692
05070004 GIFFORD PINCHOT DR 4313 201611 6/4/2012 R
0393 10
0006 WILLIAMS AV 2312 204778 2/1/2013 R
0194 01
0024A ALPS DR 1314 353262 6/12/2009 R
0814 05
0049 EDGEWOOD DR 5319 400885 9/26/2013 R
0473 07
0200 ROSEHAVEN ST 10710 403830 7/15/2014 R
0564 04
0097 BRIGGS RD 4726 341437 2/24/2012 R
0814 15
0013 CLAMES DR 6007 200940 9/14/2012 R
0903 04
0008 NEUMAN ST 7301 403373 3/7/2013 R
0583 07A
0020 BRUNING CT 4125 337565 7/18/2012 R
0212 03
0029A LAWTON ST 741 355874 12/9/2010 R
0692
04040002 STARR JORDAN DR 4425 204160 11/7/2012 R
0203 04
0011 ORLO DR 1157 400089 12/10/2012 R
0212 06
0047 LUPINE LA 6901 350592 6/20/2011 R
0692
05060011 GIFFORD PINCHOT DR 4308 201610 3/8/2007 R
0681 07
0024 BUCKINGHAM RD 10707 403091 2/11/2013 R
0214 03
0027 BENJAMIN ST 7013 401986 1/27/2010 R
0194 02
0009 LEESBURG PI 9312 202437 7/26/2010 R

Appendix K
PIN Street Name Street
Type
Address
Number Account Status Change
Type (Residential or
Commercial)
0483 01
0012J BLAKE LA 9730 159423 3/20/2014 R
0354 01
0048 BENNETT RD 12423 403744 7/2/2014 R
0212 06
0038 LUPINE LA 6703 403098 8/15/2013 R
0212 03
0030 LAWTON ST 743 356971 2/1/2013 R
0372 09
0025 STRYKER AV 2313 403039 9/14/2012 R
0583 07A
0016 BRUNING CT 4124 357129 7/31/2009 R
0472 56
0036 BLAKE LA 10300 200447 8/12/2013 R
0583 07A
0019 BRUNING CT 4123 337347 5/3/2013 R
0211 02
0061 ARBOR LA 7017 402644 7/25/2011 R
0213 02
0014 BENJAMIN ST 7032 403087 5/1/2013 R
0564 04
0104 BRIGGS CT 11719 200594 11/29/2011 R
0311 03
0027B WEST LANGLEY LA 6506 401865 2/7/2013 R
0912 04
0024 CLAMES DR 5958 200936 9/4/2012 R
0203 04
0002 PORTLAND PL 8452 400088 8/12/2013 R
0194 02
0003A LYONS ST 1300 400895 5/5/2010 R
0681 03
0013 KELLEY DR 10712 355889 5/3/2013 R
0723 03
0052 RIDGEWOOD RD 4901 203588 11/7/2012 R
0213 02
0012 BENJAMIN ST 7024 354830 6/20/2011 R
0582 04
0065 SOUTHWICK ST 9004 307232 11/9/2010 R
0472 04
0010 HIBBARD ST 2905 201887 1/29/2009 R
0544 06
0097 SHREVE ST 13721 349561 7/16/2007 R
0212 03
0031 LAWTON ST 801 143487 12/9/2010 R
1062 01
0007 OX RD 8905 313439 7/14/2008 R to C - Church
0213 02
0024 BENJAMIN ST 7025 350605 3/25/2014 R
0411
13070048A ROCKINGHAM ST 1970 203653 6/24/2009 R
0212 06
0042 LUPINE LA 6803 403022 1/31/2013 R
0284 10
0048 IRVIN ST 1643 202124 5/29/2013 R
0214 03
0032 BENJAMIN ST 6909 327506 2/7/2013 R
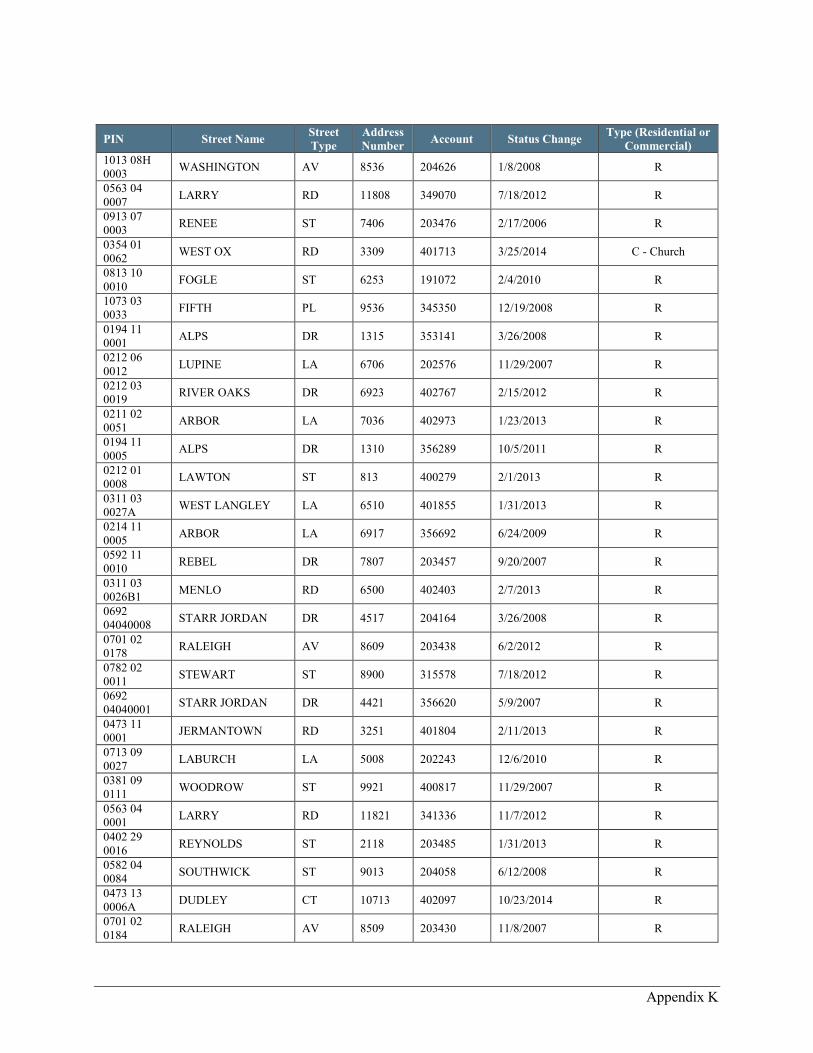
Appendix K
PIN Street Name Street
Type
Address
Number Account Status Change
Type (Residential or
Commercial)
1013 08H
0003 WASHINGTON AV 8536 204626 1/8/2008 R
0563 04
0007 LARRY RD 11808 349070 7/18/2012 R
0913 07
0003 RENEE ST 7406 203476 2/17/2006 R
0354 01
0062 WEST OX RD 3309 401713 3/25/2014 C - Church
0813 10
0010 FOGLE ST 6253 191072 2/4/2010 R
1073 03
0033 FIFTH PL 9536 345350 12/19/2008 R
0194 11
0001 ALPS DR 1315 353141 3/26/2008 R
0212 06
0012 LUPINE LA 6706 202576 11/29/2007 R
0212 03
0019 RIVER OAKS DR 6923 402767 2/15/2012 R
0211 02
0051 ARBOR LA 7036 402973 1/23/2013 R
0194 11
0005 ALPS DR 1310 356289 10/5/2011 R
0212 01
0008 LAWTON ST 813 400279 2/1/2013 R
0311 03
0027A WEST LANGLEY LA 6510 401855 1/31/2013 R
0214 11
0005 ARBOR LA 6917 356692 6/24/2009 R
0592 11
0010 REBEL DR 7807 203457 9/20/2007 R
0311 03
0026B1 MENLO RD 6500 402403 2/7/2013 R
0692
04040008 STARR JORDAN DR 4517 204164 3/26/2008 R
0701 02
0178 RALEIGH AV 8609 203438 6/2/2012 R
0782 02
0011 STEWART ST 8900 315578 7/18/2012 R
0692
04040001 STARR JORDAN DR 4421 356620 5/9/2007 R
0473 11
0001 JERMANTOWN RD 3251 401804 2/11/2013 R
0713 09
0027 LABURCH LA 5008 202243 12/6/2010 R
0381 09
0111 WOODROW ST 9921 400817 11/29/2007 R
0563 04
0001 LARRY RD 11821 341336 11/7/2012 R
0402 29
0016 REYNOLDS ST 2118 203485 1/31/2013 R
0582 04
0084 SOUTHWICK ST 9013 204058 6/12/2008 R
0473 13
0006A DUDLEY CT 10713 402097 10/23/2014 R
0701 02
0184 RALEIGH AV 8509 203430 11/8/2007 R
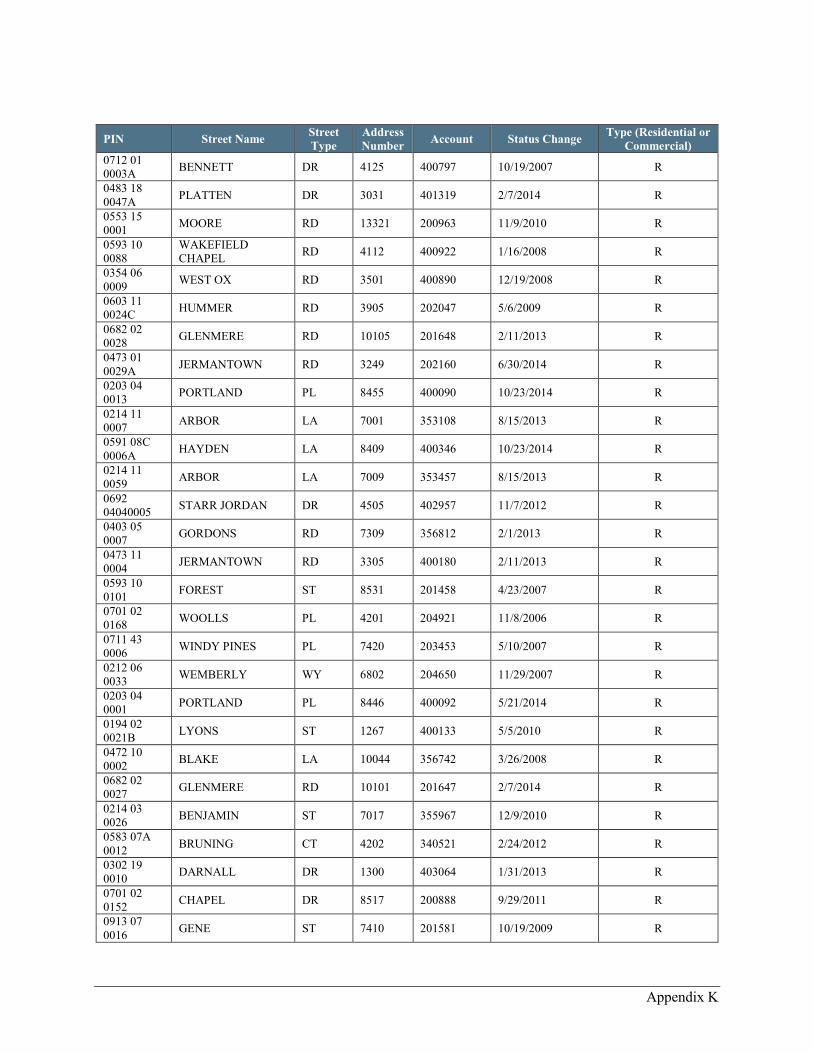
Appendix K
PIN Street Name Street
Type
Address
Number Account Status Change
Type (Residential or
Commercial)
0712 01
0003A BENNETT DR 4125 400797 10/19/2007 R
0483 18
0047A PLATTEN DR 3031 401319 2/7/2014 R
0553 15
0001 MOORE RD 13321 200963 11/9/2010 R
0593 10
0088
WAKEFIELD
CHAPEL RD 4112 400922 1/16/2008 R
0354 06
0009 WEST OX RD 3501 400890 12/19/2008 R
0603 11
0024C HUMMER RD 3905 202047 5/6/2009 R
0682 02
0028 GLENMERE RD 10105 201648 2/11/2013 R
0473 01
0029A JERMANTOWN RD 3249 202160 6/30/2014 R
0203 04
0013 PORTLAND PL 8455 400090 10/23/2014 R
0214 11
0007 ARBOR LA 7001 353108 8/15/2013 R
0591 08C
0006A HAYDEN LA 8409 400346 10/23/2014 R
0214 11
0059 ARBOR LA 7009 353457 8/15/2013 R
0692
04040005 STARR JORDAN DR 4505 402957 11/7/2012 R
0403 05
0007 GORDONS RD 7309 356812 2/1/2013 R
0473 11
0004 JERMANTOWN RD 3305 400180 2/11/2013 R
0593 10
0101 FOREST ST 8531 201458 4/23/2007 R
0701 02
0168 WOOLLS PL 4201 204921 11/8/2006 R
0711 43
0006 WINDY PINES PL 7420 203453 5/10/2007 R
0212 06
0033 WEMBERLY WY 6802 204650 11/29/2007 R
0203 04
0001 PORTLAND PL 8446 400092 5/21/2014 R
0194 02
0021B LYONS ST 1267 400133 5/5/2010 R
0472 10
0002 BLAKE LA 10044 356742 3/26/2008 R
0682 02
0027 GLENMERE RD 10101 201647 2/7/2014 R
0214 03
0026 BENJAMIN ST 7017 355967 12/9/2010 R
0583 07A
0012 BRUNING CT 4202 340521 2/24/2012 R
0302 19
0010 DARNALL DR 1300 403064 1/31/2013 R
0701 02
0152 CHAPEL DR 8517 200888 9/29/2011 R
0913 07
0016 GENE ST 7410 201581 10/19/2009 R
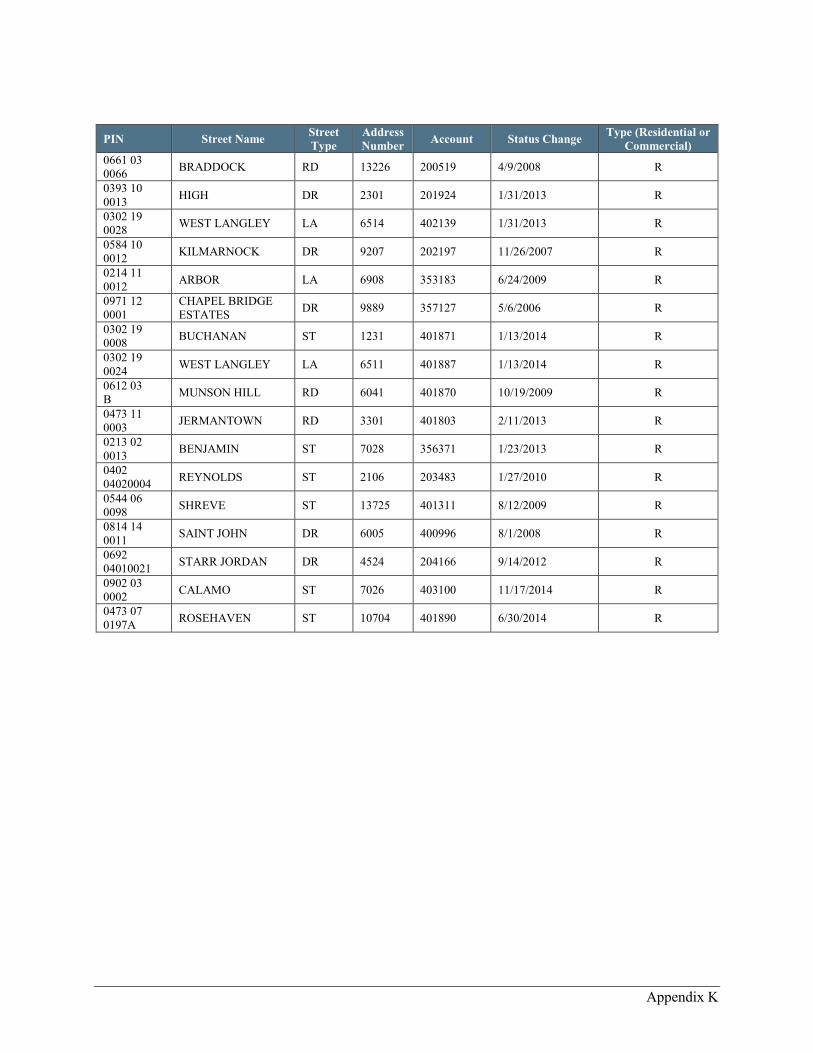
Appendix K
PIN Street Name Street
Type
Address
Number Account Status Change
Type (Residential or
Commercial)
0661 03
0066 BRADDOCK RD 13226 200519 4/9/2008 R
0393 10
0013 HIGH DR 2301 201924 1/31/2013 R
0302 19
0028 WEST LANGLEY LA 6514 402139 1/31/2013 R
0584 10
0012 KILMARNOCK DR 9207 202197 11/26/2007 R
0214 11
0012 ARBOR LA 6908 353183 6/24/2009 R
0971 12
0001
CHAPEL BRIDGE
ESTATES DR 9889 357127 5/6/2006 R
0302 19
0008 BUCHANAN ST 1231 401871 1/13/2014 R
0302 19
0024 WEST LANGLEY LA 6511 401887 1/13/2014 R
0612 03
B MUNSON HILL RD 6041 401870 10/19/2009 R
0473 11
0003 JERMANTOWN RD 3301 401803 2/11/2013 R
0213 02
0013 BENJAMIN ST 7028 356371 1/23/2013 R
0402
04020004 REYNOLDS ST 2106 203483 1/27/2010 R
0544 06
0098 SHREVE ST 13725 401311 8/12/2009 R
0814 14
0011 SAINT JOHN DR 6005 400996 8/1/2008 R
0692
04010021 STARR JORDAN DR 4524 204166 9/14/2012 R
0902 03
0002 CALAMO ST 7026 403100 11/17/2014 R
0473 07
0197A ROSEHAVEN ST 10704 401890 6/30/2014 R
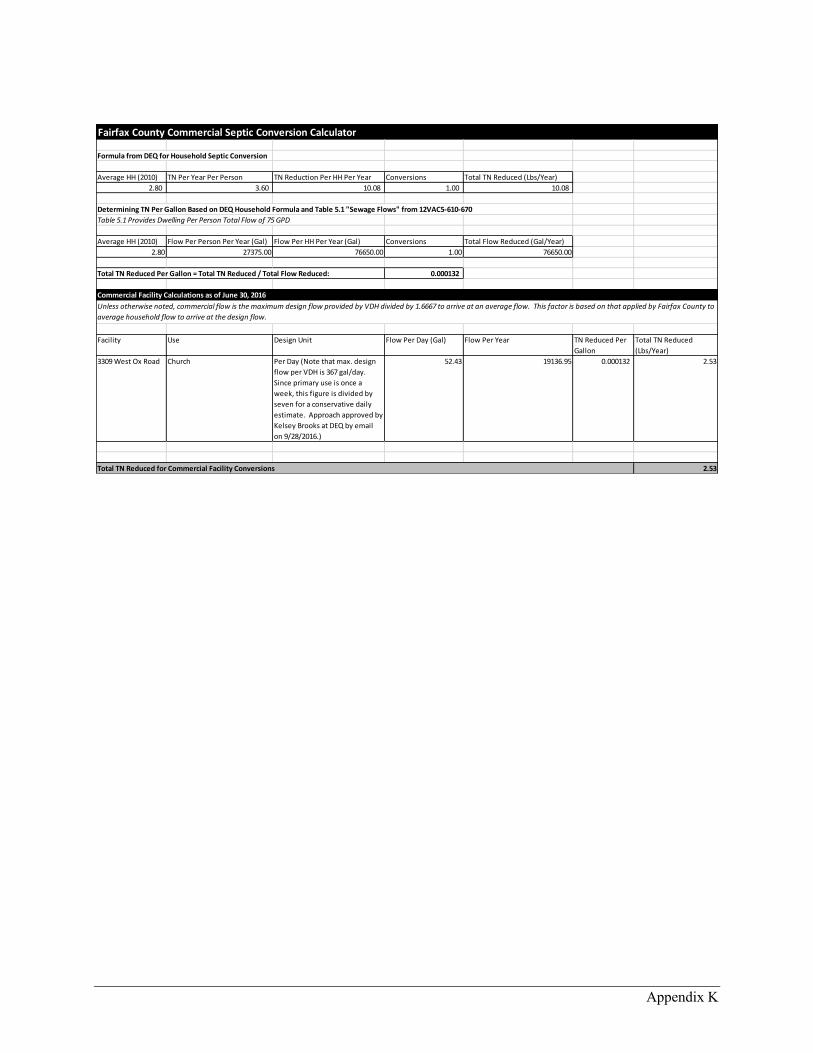
Appendix K
Fairfax County Commercial Septic Conversion Calculator
Formula from DEQ for Household Septic Conversion
Average HH (2010) TN Per Year Per Person TN Reduction Per HH Per Year Conversions Total TN Reduced (Lbs/Year)
2.80 3.60 10.08 1.00 10.08
Determining TN Per Gallon Based on DEQ Household Formula and Table 5.1 "Sewage Flows" from 12VAC5-610-670
Table 5.1 Provides Dwelling Per Person Total Flow of 75 GPD
Average HH (2010) Flow Per Person Per Year (Gal) Flow Per HH Per Year (Gal) Conversions Total Flow Reduced (Gal/Year)
2.80 27375.00 76650.00 1.00 76650.00
Total TN Reduced Per Gallon = Total TN Reduced / Total Flow Reduced: 0.000132
Commercial Facility Calculations as of June 30, 2016
Facility Use Design Unit Flow Per Day (Gal) Flow Per Year TN Reduced Per
Gallon
Total TN Reduced
(Lbs/Year)
3309 West Ox Road Church Per Day (Note that max. design
flow per VDH is 367 gal/day.
Since primary use is once a
week, this figure is divided by
seven for a conservative daily
estimate. Approach approved by
Kelsey Brooks at DEQ by email
on 9/28/2016.)
52.43 19136.95 0.000132 2.53
Total TN Reduced for Commercial Facility Conversions 2.53
Unless otherwise noted, commercial flow is the maximum design flow provided by VDH divided by 1.6667 to arrive at an average flow. This factor is based on that applied by Fairfax County to
average household flow to arrive at the design flow.

Appendix L
Appendix L
Nutrient Management Plans Beginning July 1, 2014

Appendix L

Appendix L: Nutrient Management Plans Beginning July 1, 2014
NMPs Developed for Lands < 1 acre
Facility Owner Acres Field Type Field Name Long Lat NMP Complete MS4TN Load
(lb/yr)
TP Load
(lb/yr)
TN Credit
(lb/yr)*
TP Credit
(lb/yr)**
Spring Hill RecCenter FCPA 0.639845 Rectangular 4 -77.227421 38.941271 Y Y 6.44 0.26 0.58 0.01
Franconia District FCPA 0.818433 Rectangular 5 -77.161509 38.789024 Y Y 8.24 0.34 0.74 0.02
Baron Cameron Park FCPA 0.885579 Rectangular 5 -77.336749 38.97387 Y Y 8.92 0.36 0.80 0.02
Baron Cameron Park FCPA 0.569206 Rectangular 8 -77.336823 38.978053 Y Y 5.73 0.23 0.52 0.01
Blake Lane Park FCPA 0.666074 Rectangular 1 -77.29229 38.875111 Y 6.71 0.27 0.31 0.01
South Run Rec Center FCPA 0.603772 Rectangular 8 -77.274827 38.748609 Y 6.08 0.25 0.28 0.01
South Run Rec Center FCPA 0.764486 Rectangular 7 -77.274796 38.749019 Y Y 7.70 0.31 0.69 0.01
Braddock Park FCPA 0.565595 Rectangular 8 -77.410817 38.827165 Y 5.70 0.23 0.27 0.01
Stringfellow Park FCPA 0.631357 Rectangular 1 -77.4016 38.845625 Y Y 6.36 0.26 0.57 0.01
Idylwood Park FCPA 0.81694 Baseball 2 -77.213826 38.891055 Y 8.23 0.33 0.39 0.01
Jefferson Village Park FCPA 0.839165 Baseball 1 -77.178244 38.869805 Y 8.45 0.34 0.40 0.01
Larry Graves Park FCPA 0.700779 Baseball 3 -77.170803 38.877362 Y 7.06 0.29 0.33 0.01
Larry Graves Park FCPA 0.660583 Baseball 2 -77.169861 38.877171 Y Y 6.65 0.27 0.60 0.01
Linway Terrace Park FCPA 0.654056 Baseball 2 -77.153877 38.925626 Y Y 6.59 0.27 0.59 0.01
Nottoway Park FCPA 0.927698 Baseball 1 -77.276463 38.883569 Y Y 9.34 0.38 0.84 0.02
Spring Hill RecCenter FCPA 0.807237 Baseball 1 -77.229692 38.941759 Y Y 8.13 0.33 0.73 0.01
Towers Park FCPA 0.860785 Baseball 1 -77.268441 38.865735 Y 8.67 0.35 0.41 0.01
Westgate Park FCPA 0.862849 Baseball 3 -77.207398 38.920053 Y Y 8.69 0.35 0.78 0.02
Westgate Park FCPA 0.879966 Baseball 2 -77.206328 38.919513 Y Y 8.86 0.36 0.80 0.02
Americana FCPA 0.820342 Baseball 1 -77.22088 38.832951 Y 8.26 0.34 0.39 0.01
Annandale Community Park FCPA 0.688581 Baseball 2 -77.211807 38.837146 Y 6.93 0.28 0.32 0.01
Annandale Community Park FCPA 0.755215 Baseball 1 -77.212586 38.837678 Y 7.61 0.31 0.36 0.01
Eakin Mantua Park FCPA 0.764012 Baseball 1 -77.252584 38.853649 Y 7.69 0.31 0.36 0.01
Howery Park FCPA 0.931225 Mutipurpose #2 & #3 -77.232475 38.812322 Y 9.38 0.38 0.44 0.01
Mason District Park FCPA 0.830585 Baseball 1 -77.172435 38.835975 Y Y 8.36 0.34 0.75 0.02
Pine Ridge Park FCPA 0.635019 Baseball 3 -77.226837 38.852946 Y Y 6.39 0.26 0.58 0.01
Pine Ridge Park FCPA 0.376005 Baseball 2 -77.226222 38.85344 Y Y 3.79 0.15 0.34 0.01
Pine Ridge Park FCPA 0.772814 Baseball 1 -77.226819 38.853879 Y Y 7.78 0.32 0.70 0.01
Roundtree Park FCPA 0.163394 Baseball 1 -77.190779 38.851937 Y 1.65 0.07 0.08 0.00
Wakefield FCPA 0.690132 Baseball 8 -77.223998 38.813536 Y Y 6.95 0.28 0.63 0.01
Wakefield FCPA 0.725453 Baseball 7 -77.223599 38.81462 Y Y 7.31 0.30 0.66 0.01
Wakefield FCPA 0.667519 Baseball 1 -77.22446 38.815549 Y Y 6.72 0.27 0.60 0.01
Clermont Park FCPA 0.824665 Baseball 1 -77.103489 38.792875 Y 8.30 0.34 0.39 0.01
Clermont Park FCPA 0.764646 Baseball 3 -77.104407 38.792161 Y 7.70 0.31 0.36 0.01
Clermont Park FCPA 0.713851 Baseball 2 -77.103492 38.792165 Y 7.19 0.29 0.34 0.01
Fort Hunt Park FCPA 0.986424 Mutipurpose 1 -77.06762 38.717971 Y 9.93 0.40 0.46 0.01
Grist Mill Park FCPA 0.407649 Baseball 2 -77.117222 38.70833 Y Y 4.11 0.17 0.37 0.01
Grist Mill Park FCPA 0.67001 Baseball 1 -77.116272 38.708185 Y Y 6.75 0.27 0.61 0.01
Groveton Heights Park FCPA 0.786054 Baseball 1 -77.091666 38.768583 Y 7.92 0.32 0.37 0.01
Huntington Park FCPA 0.708682 Baseball 1 -77.06972 38.796586 Y 7.14 0.29 0.33 0.01
Jefferson Manor Park FCPA 0.835845 Baseball 1 -77.08237 38.792324 Y 8.42 0.34 0.39 0.01
Lee High Park FCPA 0.494614 Baseball 2 -77.16891 38.782412 Y Y 4.98 0.20 0.45 0.01

Appendix L: Nutrient Management Plans Beginning July 1, 2014
Mt Vernon Manor Park FCPA 0.644938 Baseball 1 -77.111714 38.722123 Y Y 6.49 0.26 0.58 0.01
Kings Park FCPA 0.605293 Baseball 1 -77.246863 38.807668 Y 6.10 0.25 0.29 0.01
Laurel Hill Park FCPA 0.866597 Baseball 2 -77.251528 38.709162 Y 8.73 0.36 0.41 0.01
Newington Heights Park FCPA 0.962532 Baseball 2 -77.239181 38.724368 Y 9.69 0.39 0.45 0.01
Rutherford Park FCPA 0.733928 Baseball 2 -77.263264 38.822229 Y 7.39 0.30 0.35 0.01
Rutherford Park FCPA 0.790266 Baseball 1 -77.264078 38.822694 Y 7.96 0.32 0.37 0.01
South Run Rec Center FCPA 0.84141 Baseball 4 -77.273455 38.750061 Y 8.47 0.34 0.40 0.01
Chantilly Park FCPA 0.670438 Baseball 1 -77.409396 38.879771 Y Y 6.75 0.27 0.61 0.01
Chantilly Park FCPA 0.772474 Baseball 3 -77.408752 38.881164 Y Y 7.78 0.32 0.70 0.01
Chantilly Park FCPA 0.797139 Baseball 2 -77.409078 38.880526 Y Y 8.03 0.33 0.72 0.01
E.C. Lawrence Park FCPA 0.626428 Baseball 5 -77.438632 38.859781 Y Y 6.31 0.26 0.57 0.01
E.C. Lawrence Park FCPA 0.837722 Baseball 7 -77.43886 38.861983 Y Y 8.44 0.34 0.76 0.02
Franklin Farm Park FCPA 0.772974 Baseball 1 -77.415999 38.91138 Y 7.78 0.32 0.36 0.01
Greenbriar Park FCPA 0.761761 Baseball 2 -77.405942 38.866002 Y 7.67 0.31 0.36 0.01
Lincoln Lewis-Vannoy Park FCPA 0.844406 Baseball 1 -77.376455 38.829089 Y 8.50 0.35 0.40 0.01
Lincoln Lewis-Vannoy Park FCPA 0.828167 Baseball 2 -77.376424 38.830079 Y 8.34 0.34 0.39 0.01
Poplar Tree Park FCPA 0.514719 Baseball 6 -77.409409 38.861151 Y 5.18 0.21 0.24 0.00
Poplar Tree Park FCPA 0.313817 Baseball 7 -77.408571 38.861013 Y 3.16 0.13 0.15 0.00
Sully Highlands Park FCPA 0.866189 Baseball 4 -77.42453 38.921591 Y 8.72 0.36 0.41 0.01
Sully Highlands Park FCPA 0.825049 Baseball 3 -77.424525 38.920895 Y 8.31 0.34 0.39 0.01
Alabama Drive Park FCPA 0.760448 Baseball 2 -77.399196 38.968569 Y 7.66 0.31 0.36 0.01
Bruin Park FCPA 0.55025 Baseball 1 -77.387942 38.962852 Y 5.54 0.23 0.26 0.01
Fred Crabtree Park FCPA 0.759709 Baseball 1 -77.363814 38.917181 Y 7.65 0.31 0.36 0.01
Fred Crabtree Park FCPA 0.75523 Baseball 2 -77.363302 38.916631 Y 7.61 0.31 0.36 0.01
Great Falls Nike FCPA 0.764206 Baseball 3 -77.326313 38.993127 Y Y 7.70 0.31 0.69 0.01
Great Falls Nike FCPA 0.686253 Baseball 6 -77.327348 38.990135 Y Y 6.91 0.28 0.62 0.01
Reston North Park FCPA 0.590233 Baseball 1 -77.354713 38.97053 Y 5.94 0.24 0.28 0.01
South Lakes Park FCPA 0.602388 Baseball 2 -77.356613 38.939522 Y 6.07 0.25 0.28 0.01
Stratton Woods Park FCPA 0.792376 Baseball 1 -77.388094 38.943564 Y 7.98 0.32 0.37 0.01
* If in MS4 = Load x 0.09, If Outside MS4 = Load x 0.09 x 0.52 33.39 0.68
** If in MS4 = Load x 0.045, If Outside MS4 = Load x 0.045 x 0.52

Appendix L: Nutrient Management Plans Beginning July 1, 2014
NMPs Developed for Lands Outside the MS4 Service Area (> 1 acre)
Location Owner FieldName Field Type NMP Complete Acreage Longitude Latitude TN Load (lb/yr)TP Load
(lb/yr)
TN Credit
(lb/yr)*
TP Credit
(lb/yr)**
Langley Fork Park FCPA 4 Rectangular Y 1.77579 -77.152326 38.946620 17.88 0.73 0.84 0.02
Nottoway Park FCPA 4 Rectangular Y 1.43217 -77.276048 38.884490 14.42 0.59 0.67 0.01
Lake Braddock Park FCPA 1 Rectangular Y 1.82768 -77.270869 38.806496 18.40 0.75 0.86 0.02
Lake Braddock Park FCPA 2 Rectangular Y 1.42942 -77.270692 38.807549 14.39 0.59 0.67 0.01
Newington Heights Park FCPA 1 Rectangular Y 1.87295 -77.238070 38.725470 18.86 0.77 0.88 0.02
Arrowhead Park FCPA 2 Rectangular Y 1.25168 -77.406036 38.847838 12.60 0.51 0.59 0.01
E.C. Lawrence Park FCPA 1 Rectangular Y 1.67349 -77.435859 38.857458 16.85 0.69 0.79 0.02
Fred Crabtree Park FCPA 3 Rectangular Y 1.74571 -77.361359 38.912548 17.58 0.72 0.82 0.02
Lake Fairfax Park FCPA 2 Rectangular Y 1.66651 -77.318791 38.956266 16.78 0.68 0.79 0.02
Langley Fork Park FCPA 3 Rectangular Y 1.58622 -77.155231 38.948310 15.97 0.65 0.75 0.02
Mason District Park FCPA 4 Rectangular Y 1.41804 -77.171798 38.835217 14.28 0.58 0.67 0.01
Roundtree Park FCPA 2 Rectangular Y 1.08652 -77.190385 38.852859 10.94 0.45 0.51 0.01
GW RecCenter FCPA 2 Rectangular Y 1.34451 -77.099040 38.728869 13.54 0.55 0.63 0.01
Rolling Valley West Park FCPA 3 Rectangular Y 1.63720 -77.268039 38.772676 16.49 0.67 0.77 0.02
Franklin Farm Park FCPA 2 Rectangular Y 1.00067 -77.415904 38.912207 10.08 0.41 0.47 0.01
Alabama Drive Park FCPA 1 Rectangular Y 1.48298 -77.399797 38.969464 14.93 0.61 0.70 0.01
Lake Fairfax Park FCPA 8 Multipurpose Y 14.25510 -77.312071 38.960952 143.55 5.84 6.72 0.14
Lake Fairfax Park FCPA 7 Rectangular Y 1.68848 -77.320355 38.961061 17.00 0.69 0.80 0.02
Lake Fairfax Park FCPA 6 Rectangular Y 1.69380 -77.319980 38.960045 17.06 0.69 0.80 0.02
Cunningham Park FCPA 1 Multipurpose Y 1.80807 -77.251013 38.891602 18.21 0.74 0.85 0.02
Idylwood Park FCPA 3 Baseball Y 1.09277 -77.214058 38.890048 11.00 0.45 0.51 0.01
Langley Fork Park FCPA 1 Baseball Y 1.44127 -77.154451 38.946526 14.51 0.59 0.68 0.01
Langley Fork Park FCPA 2 Baseball Y 1.21760 -77.154455 38.947321 12.26 0.50 0.57 0.01
Nottoway Park FCPA 2 Baseball Y 1.40590 -77.277544 38.884120 14.16 0.58 0.66 0.01
Nottoway Park FCPA 3 Baseball Y 1.64631 -77.277317 38.883026 16.58 0.67 0.78 0.02
Nottoway Park FCPA 6 Baseball Y 2.82804 -77.272985 38.883090 28.48 1.16 1.33 0.03
Olney Park FCPA 1 Multipurpose Y 1.23355 -77.192076 38.915148 12.42 0.51 0.58 0.01
Eakin Community Park FCPA 1 Multipurpose Y 2.68046 -77.239882 38.852091 26.99 1.10 1.26 0.03
Howery Park FCPA 1 Multipurpose Y 1.75279 -77.232477 38.811715 17.65 0.72 0.83 0.02
Mason District Park FCPA 2 Baseball Y 1.49227 -77.172236 38.834183 15.03 0.61 0.70 0.01
Wakefield FCPA 2 Baseball Y 1.35740 -77.225916 38.814063 13.67 0.56 0.64 0.01
Beulah Park FCPA 2 Baseball Y 1.64164 -77.155399 38.761003 16.53 0.67 0.77 0.02
Beulah Park FCPA 1 Baseball Y 1.32848 -77.155800 38.761564 13.38 0.54 0.63 0.01
Bucknell Park FCPA 1 Multipurpose Y 2.67394 -77.070490 38.770263 26.93 1.10 1.26 0.03
Clermont Park FCPA 4 Baseball Y 1.60179 -77.104558 38.793001 16.13 0.66 0.75 0.02
Collingwood Park FCPA 2 Multipurpose Y 2.55153 -77.053392 38.735284 25.69 1.05 1.20 0.02
Collingwood Park FCPA 1 Multipurpose Y 1.79185 -77.052070 38.735141 18.04 0.73 0.84 0.02
Lee District RecCenter FCPA 2 Multipurpose Y 2.38403 -77.104060 38.774179 24.01 0.98 1.12 0.02
Lee District RecCenter FCPA 1 Multipurpose Y 2.40453 -77.104003 38.775201 24.21 0.99 1.13 0.02
Lee District RecCenter FCPA 3 Multipurpose Y 1.02435 -77.104792 38.776269 10.32 0.42 0.48 0.01
Mason Neck West Park FCPA 1 Baseball Y 1.05316 -77.227999 38.676382 10.61 0.43 0.50 0.01
MLK jr Park FCPA 1 Multipurpose Y 2.55835 -77.083158 38.737515 25.76 1.05 1.21 0.02
Pohick Estates Park FCPA 1 Baseball Y 1.07738 -77.200070 38.719330 10.85 0.44 0.51 0.01

Appendix L: Nutrient Management Plans Beginning July 1, 2014
Lakeside Park FCPA 1 Multipurpose Y 1.94365 -77.285558 38.806022 19.57 0.80 0.92 0.02
Laurel Hill Park FCPA 3 Baseball Y 4.14263 -77.233801 38.711195 41.72 1.70 1.95 0.04
South Run Rec Center FCPA 2 Baseball Y 1.38946 -77.271640 38.749469 13.99 0.57 0.65 0.01
South Run Rec Center FCPA 1 Baseball Y 2.13292 -77.272132 38.751055 21.48 0.87 1.01 0.02
Braddock Park FCPA 3 Baseball Y 1.65252 -77.408726 38.826475 16.64 0.68 0.78 0.02
Braddock Park FCPA 4 Baseball Y 1.65369 -77.408523 38.827116 16.65 0.68 0.78 0.02
Braddock Park FCPA 1 Baseball Y 1.61670 -77.410607 38.829057 16.28 0.66 0.76 0.02
Lincoln Lewis-Vannoy Park FCPA 3 Baseball Y 1.72016 -77.376655 38.831471 17.32 0.71 0.81 0.02
Poplar Tree Park FCPA 5 Baseball Y 2.04784 -77.410618 38.860952 20.62 0.84 0.97 0.02
Poplar Tree Park FCPA 4 Baseball Y 1.64223 -77.411097 38.859836 16.54 0.67 0.77 0.02
Sully Highlands Park FCPA 5 Baseball Y 2.17720 -77.426323 38.920070 21.92 0.89 1.03 0.02
Alabama Drive Park FCPA 3 Baseball Y 1.41478 -77.399900 38.967944 14.25 0.58 0.67 0.01
Chandon Park FCPA 1 Baseball Y 1.13697 -77.397284 38.959324 11.45 0.47 0.54 0.01
Dulles Corner Park FCPA 1 Baseball Y 1.99499 -77.427556 38.951922 20.09 0.82 0.94 0.02
Lake Fairfax Park FCPA 5 Baseball Y 1.40262 -77.319338 38.959211 14.12 0.58 0.66 0.01
Lake Fairfax Park FCPA 3 Baseball Y 1.43838 -77.318961 38.957455 14.48 0.59 0.68 0.01
Reston North Park FCPA 2 Multipurpose Y 2.04347 -77.353260 38.970305 20.58 0.84 0.96 0.02
Stratton Woods Park FCPA 3 Baseball Y 2.12397 -77.385217 38.941644 21.39 0.87 1.00 0.02
Braddock Park FCPA 5 Baseball Y 1.63340 -77.407253 38.827395 16.45 0.67 0.77 0.02
* Load x 0.09 x 0.52 56.19 1.14
** Load x 0.045 x 0.52
TN Credit
(lb/yr)
TP Credit
(lb/yr)
Credit for NMP <1 Acre 33.39 0.68
Credit for NMP >1 Acre, Not in MS4 56.19 1.14
89.58 1.82

Appendix M
Appendix M
Land Use Change Beginning July 1, 2009

Appendix M

Appendix M: Land Use Changes Beginning July 1, 2009
TN TP TSS TN TP TSS TN TP TSS
Construction Complete8/31/2010 -77.357254 38.980521 Land Use Change Pervious Forest 16,857 28,000$ 2.77 0.15 51.45 2.77 0.15 51.45
8/31/2010 -77.359320 38.980851 Land Use Change Pervious Forest 4,600 5,000$ 0.76 0.04 14.04 0.76 0.04 14.04
4/11/2013 -77.30035 38.823712 Land Use Change & Forest
Buffer Impervious Forest 26,500 264,171$ 8.46 1.10 761.67 3 0.4 2.6 8.23 0.86 462.80 16.69 1.95 1,224.47
4/11/2013 -77.30035 38.823712 Land Use Change Impervious Grass 22,000 83,000$ 6.34 0.68 314.79 6.34 0.68 314.79
4/30/2013 -77.138709 38.750259 Land Use Change Impervious Grass 4,792 60,602$ 1.38 0.15 68.56 1.38 0.15 68.56
4/30/2013 -77.138709 38.750259 Land Use Change Pervious Grass 13,939 176,298$ 1.86 - - 1.86 0.00 0.00
5/20/2013 -77.136199 38.931002 Land Use Change Pervious Grass 3,049 0.41 - - 0.41 0.00 0.00
5/20/2013 -77.136199 38.931002 Land Use Change Pervious Grass 11,761 1.57 - - 1.57 0.00 0.00
11/6/2013 -77.188664 38.928527 Land Use Change Pervious Forest 24,000 47,545$ 3.94 0.21 73.26 3.94 0.21 73.26
11/6/2013 -77.191322 38.928760 Land Use Change Pervious Grass 6,400 6,000$ 0.85 - - 0.85 0.00 0.00
12/17/2013 -77.276068 38.748811 Land Use Change Pervious Grass 17,500 12,903$ 2.33 - - 2.33 0.00 0.00
12/17/2013 -77.275376 38.748696 Land Use Change Pervious Grass 50,210 12,196$ 6.70 - - 6.70 0.00 0.00
12/17/2013 -77.274209 38.751962 Land Use Change Pervious Grass 19,216 41,608$ 2.56 - - 2.56 0.00 0.00
8/1/2014 -77.316595 38.875066 Land Use Change Pervious Grass 16,200 35,342$ 2.16 - - 2.16 0.00 0.00
8/1/2014 -77.315768 38.874972 Land Use Change Pervious Grass 6,480 14,375$ 0.86 - - 0.86 0.00 0.00
8 Americana Park 4/30/2015 -77.207031 38.832802 Land Use Change Pervious Grass 30,000 17,000$ 4.00 - - 4.00 0.00 0.00
9 Government Center Pollinator Meadow 5/15/2016 -77.354660 38.855184 Land Use Change Pervious Grass 38,333 35,000$ 5.11 - - 5.11 0.00 0.00
Total: 311,837 839,040 52.07 2.32 1,284 60.30 3.17 1,746.57
7 Oak Marr Rec Center Stormwater Enhancements
(DF87-0006)
5 Lewinsville Park Stormwater Enhancements
6 South Run Rec Center
3 7624 & 7626 Luton Place Demo(SD-000032-027
& SD-000032-014)
4 1447 Woodacre Drive
Pervious
Drainage
Area (Ac)
Estimated Pollutant
Reduction from Forest
Buffer (lb/yr)
Estimated Amount of Total
Pollutant Reduction (lb/yr) Estimated Cost
($)
Estimated Amount of
Pollutant Reduction from
Land Use Change (lb/yr)
Total
Drainage
Area (Ac)
Impervious
Drainage
Area (Ac)
Land Use
FromConversion
Area
Converted
(SF)
2 Kings Park West Swim Club
Substantial
CompletionLongitude Latitude
Pollutant Reduction
Calculation Method
1 Armstrong Elementary School
# Project Name


Appendix N
Appendix N
New Source Compliance Calculations
As noted in Section 6, this appendix is divided into two parts.
The first spreadsheet shows required offsets as a result of new sources between July 1, 2009 and June 30,
2014. In some instances, development resulted in a decrease in impervious surface area, which is shown
as a negative offset on the spreadsheet. Development projects located outside of the MS4 service area as
of July 1, 2009 are included for tracking purposes. However, offsets are not required for these
development projects and columns are designated as NA (not applicable) as appropriate.
The second spreadsheet shows credit as a result of stormwater management practices installed to comply
with the County’s water quality management requirements.

Appendix N

Appendix N: Offsets Required for Plans Between July 1, 2009 and June 30, 2014 Disturbing Greater than One Acre
TN TP TSS
OFFUTT HOME TRACT SEC 1 LOT 12B (DR) 5/25/2012 5.01 3.76 0.11 0.13 No NA NA NA
622 CHAIN BRIDGE RD (DR) 12/21/2011 3.22 1.32 0.20 0.25 No NA NA NA
734 LEIGH MILL ROAD (DR) 8/16/2010 10.42 7.71 0.16 0.20 No NA NA NA
7724 GEORGETOWN PIKE (DR) 2/12/2010 10.01 1.31 0.10 0.10 No NA NA NA
7720 GEORGETOWN PIKE (DR) 6/23/2010 5.00 1.50 0.07 0.11 No NA NA NA
VIRGINIA RUN, THE ESTATES - 15415 KENTWELL CI (SU) 9/13/2010 5.01 1.62 0.14 0.14 No NA NA NA
CARRWOOD ESTATES LOT 18 (DR) 2/18/2010 5.84 1.50 0.14 0.15 No NA NA NA
ENGLISH HILLS ESTATE 3, SEC 2 (SP) 11/9/2010 5.11 1.33 0.16 0.20 No NA NA NA
KNOLLWOOD ESTATES LOT 6 9/23/2010 5.21 1.38 0.13 0.15 No NA NA NA
SUGARLAND LOT 3 (HM) 12/13/2011 2.10 1.74 0.22 0.28 No NA NA NA
BALLANTRAE FARMS LOT 1 (DR) 10/16/2009 1.89 1.27 0.07 0.17 No NA NA NA
EDGELEA LOT 12 - 13104 JOHNNY MOORE LANE (SP) 9/22/2010 5.00 2.44 0.09 0.15 No NA NA NA
9133 OLD COURTHOUSE ROAD (HM) 5/14/2010 3.61 1.93 0.10 0.25 No NA NA NA
BRAGPATCH LOT 2 1143 TOWLSTON ROAD (DR) 3/26/2010 2.50 2.01 0.19 0.28 Yes 2.65 0.38 180.03
SUMMERWIND SECTION 1 LOT 7 (SP) 7/21/2010 5.11 1.42 0.12 0.16 No NA NA NA
9946 VALE ROAD (HM) 6/11/2010 1.67 1.41 0.10 0.17 Yes 0.28 0.04 19.01
BULL RUN ESTATES LOT 16A (SU) 2/11/2011 5.01 3.67 0.07 0.14 No NA NA NA
SOUTHDOWN SECTION 1 LOT D1A1 9/30/2009 6.44 1.43 0.11 0.12 No NA NA NA
C R ORRISON PROP LOT 26A (DR) 5/13/2011 3.70 1.74 0.19 0.20 No NA NA NA
WINDSTONE LOT 1B (DR) 11/3/2011 5.00 1.48 0.14 0.10 No NA NA NA
JASPER PROPERTY LOT 2 (SP) 3/28/2011 5.00 5.44 0.15 0.19 No NA NA NA
WOODSFIELD, LOT 15 - 10706 MILKWEED DR (DR) 7/20/2010 5.59 2.40 0.10 0.16 No NA NA NA
WOODSFIELD LOT 19A (DR) 4/11/2011 5.00 2.00 0.11 0.17 No NA NA NA
WOODSFIELD LOT 18A (DR) 6/13/2011 5.00 2.11 0.10 0.45 No NA NA NA
MARY EDELIN SUBDIVISION (PR) 6/28/2010 2.00 1.20 0.10 0.24 No NA NA NA
CASPERSON, LOT 1A - 6434 CASPERSON ROAD (LE) 10/26/2010 2.00 1.32 0.19 0.28 Yes 1.74 0.25 118.23
8202 RIDING RIDGE PL - GLAMB PROPERTY LOT 46B (DR) 9/12/2012 5.00 1.24 0.19 0.22 Yes 0.67 0.10 45.38
PROSPECT HILL LOT 1B (DR) 12/3/2012 0.00 1.46 0.24 0.45 No NA NA NA
GREAT FALLS RIVER BEND ESTATES LOT 9 (DR) 1/5/2011 1.98 1.27 0.10 0.15 Yes NA NA NA
831 SPRINGVALE RD - FORESTVILLE EST SEC 2 LOT 2 (D 2/17/2011 6.00 1.23 0.11 0.12 Yes NA NA NA
RIVER BEND LANDING LOT 17A 7/19/2010 3.95 1.15 0.37 0.32 No NA NA NA
LINCOLN PARK LOT 12 BLK 4 (SP) 7/19/2011 3.44 1.84 0.07 0.12 No NA NA NA
LINCOLN PARK LOT 4 - 11721 AND 11725 WASHINGTON ST 8/23/2010 2.41 2.36 0.15 0.25 No NA NA NA
SAIGON SEC 5 LOT 30A - 989 SAIGON RD (DR) 11/3/2011 5.64 1.34 0.08 0.10 No NA NA NA
POLO PLACE LOT 1 - 2132 POLO POINTE DR (SU) 1/6/2011 12.36 1.03 0.15 0.20 No NA NA NA
LOTH LORIAN LOT 2 (SP) 11/17/2010 5.00 1.43 0.10 0.15 No NA NA NA
7241 DELL AVE - LOT 8 - TOWN OF CLIFTON (SP) 5/31/2012 3.70 1.04 0.22 0.24 Yes 0.19 0.03 13.02
JACKSON MILL LOT 85 - 814 LEIGH MILL ROAD (DR) 3/5/2013 3.50 1.70 0.11 0.20 No NA NA NA
1133 CREST LANE LOT 19 (DR) 8/13/2009 5.21 1.64 0.10 0.19 Yes 0.60 0.09 41.07
FRANKLIN PARK LOT 101 (DR) 9/5/2013 1.50 1.18 0.13 0.13 Yes (0.50) (0.07) (34.09)
CORNWELL FARM LOT 26 (DR) 3/22/2012 5.03 2.05 0.11 0.15 No NA NA NA
HOMESTEAD BUILDERS LLC LOT 3 (SP) 1/13/2010 5.19 1.10 0.19 0.20 No NA NA NA
7726 GEORGETOWN PIKE (DR) 7/1/2013 6.77 1.68 0.05 0.07 No NA NA NA
450 SPRINGVALE RD LOT 28 (DR) 3/14/2011 1.73 1.04 0.22 0.28 No NA NA NA
FALLS POINTE LOT 8 (DR) 3/19/2010 1.78 1.58 0.17 0.29 Yes 2.66 0.39 181.08
620 BOYLE LANE - MAIN HOUSE (DR) 8/21/2012 5.00 1.00 0.20 0.20 No NA NA NA
BEECHTREE AT THE PARK ESTATES III SEC 1 LOT 12 1/4/2012 5.76 1.73 0.16 0.20 No NA NA NA
CROOKED CREEK LOT 3 (SU) 2/6/2012 5.03 1.45 0.05 0.07 No NA NA NA
HEIRS OF STEVEN D ETTRIDGE LOT 35A1 (PR) 7/22/2011 3.77 3.77 0.12 0.14 No NA NA NA
CHAPEL TRAILS LOT 1 (SP) 7/10/2009 2.00 1.16 0.20 0.27 No NA NA NA
Post-I %
>0.05% of parcel
in MS4 Regulated
Area
Increase/Decrease (lb/yr)
Pre-I %Plan NamePlan Approval
Date
Site Area
(Ac)
Disturbed Area
(Ac)
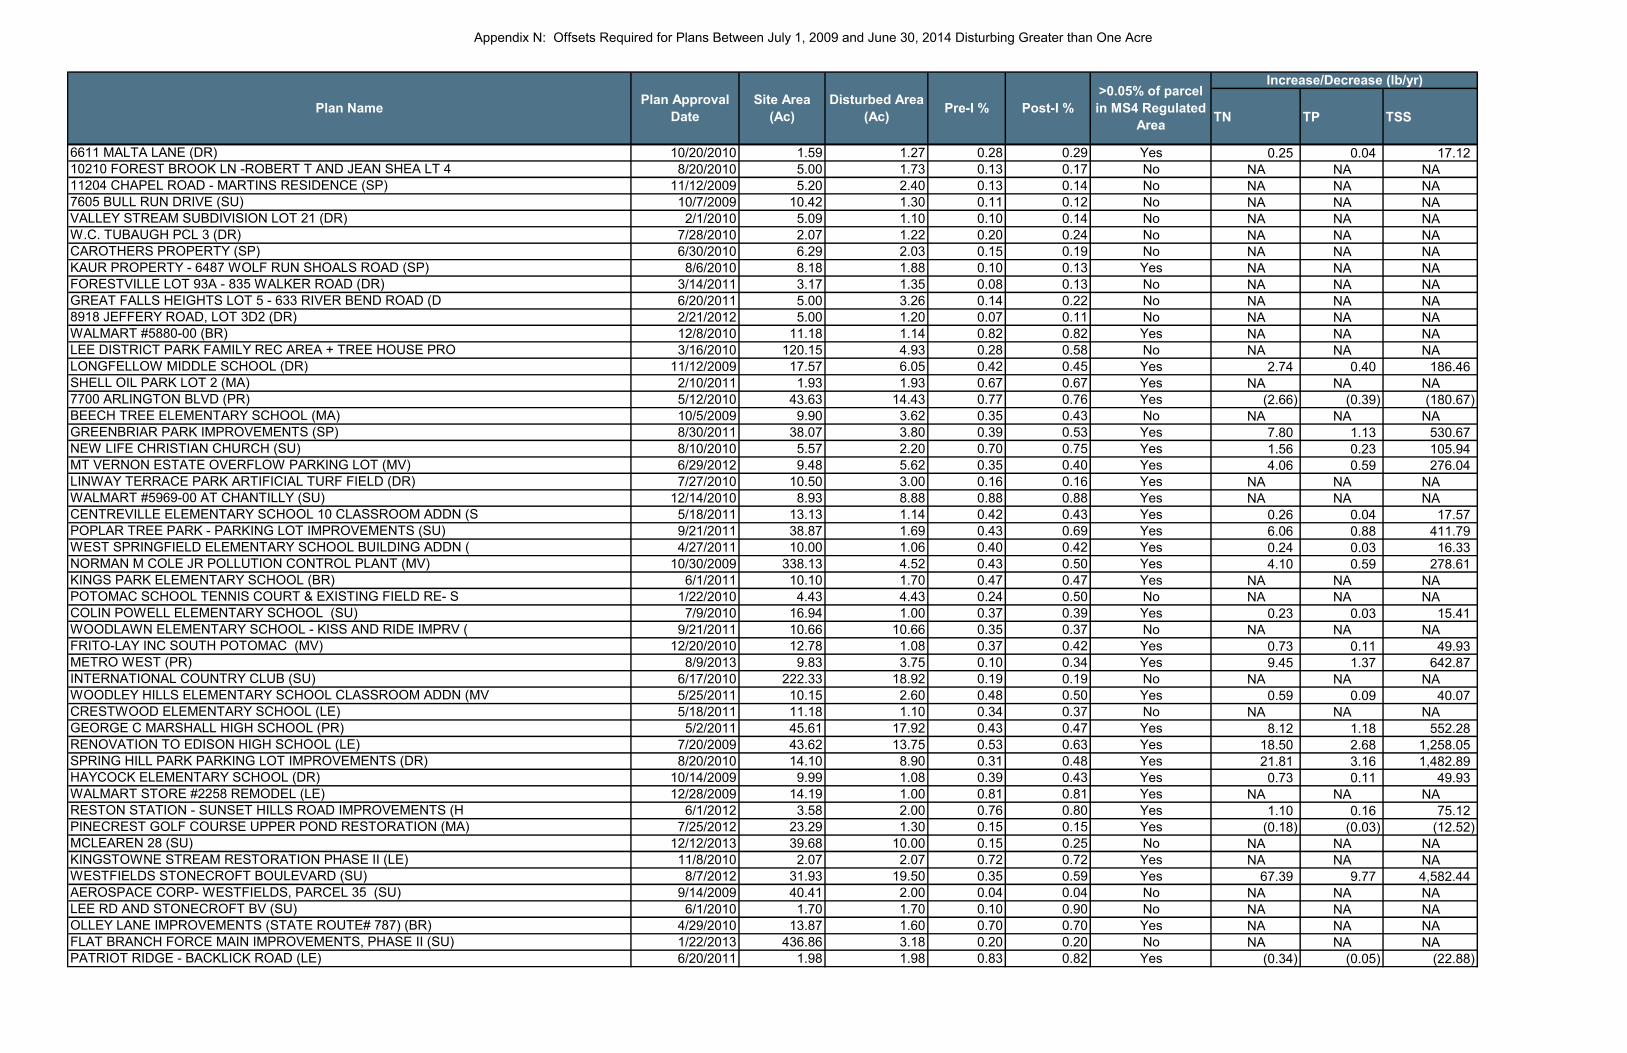
Appendix N: Offsets Required for Plans Between July 1, 2009 and June 30, 2014 Disturbing Greater than One Acre
TN TP TSSPost-I %
>0.05% of parcel
in MS4 Regulated
Area
Increase/Decrease (lb/yr)
Pre-I %Plan NamePlan Approval
Date
Site Area
(Ac)
Disturbed Area
(Ac)
6611 MALTA LANE (DR) 10/20/2010 1.59 1.27 0.28 0.29 Yes 0.25 0.04 17.12
10210 FOREST BROOK LN -ROBERT T AND JEAN SHEA LT 4 8/20/2010 5.00 1.73 0.13 0.17 No NA NA NA
11204 CHAPEL ROAD - MARTINS RESIDENCE (SP) 11/12/2009 5.20 2.40 0.13 0.14 No NA NA NA
7605 BULL RUN DRIVE (SU) 10/7/2009 10.42 1.30 0.11 0.12 No NA NA NA
VALLEY STREAM SUBDIVISION LOT 21 (DR) 2/1/2010 5.09 1.10 0.10 0.14 No NA NA NA
W.C. TUBAUGH PCL 3 (DR) 7/28/2010 2.07 1.22 0.20 0.24 No NA NA NA
CAROTHERS PROPERTY (SP) 6/30/2010 6.29 2.03 0.15 0.19 No NA NA NA
KAUR PROPERTY - 6487 WOLF RUN SHOALS ROAD (SP) 8/6/2010 8.18 1.88 0.10 0.13 Yes NA NA NA
FORESTVILLE LOT 93A - 835 WALKER ROAD (DR) 3/14/2011 3.17 1.35 0.08 0.13 No NA NA NA
GREAT FALLS HEIGHTS LOT 5 - 633 RIVER BEND ROAD (D 6/20/2011 5.00 3.26 0.14 0.22 No NA NA NA
8918 JEFFERY ROAD, LOT 3D2 (DR) 2/21/2012 5.00 1.20 0.07 0.11 No NA NA NA
WALMART #5880-00 (BR) 12/8/2010 11.18 1.14 0.82 0.82 Yes NA NA NA
LEE DISTRICT PARK FAMILY REC AREA + TREE HOUSE PRO 3/16/2010 120.15 4.93 0.28 0.58 No NA NA NA
LONGFELLOW MIDDLE SCHOOL (DR) 11/12/2009 17.57 6.05 0.42 0.45 Yes 2.74 0.40 186.46
SHELL OIL PARK LOT 2 (MA) 2/10/2011 1.93 1.93 0.67 0.67 Yes NA NA NA
7700 ARLINGTON BLVD (PR) 5/12/2010 43.63 14.43 0.77 0.76 Yes (2.66) (0.39) (180.67)
BEECH TREE ELEMENTARY SCHOOL (MA) 10/5/2009 9.90 3.62 0.35 0.43 No NA NA NA
GREENBRIAR PARK IMPROVEMENTS (SP) 8/30/2011 38.07 3.80 0.39 0.53 Yes 7.80 1.13 530.67
NEW LIFE CHRISTIAN CHURCH (SU) 8/10/2010 5.57 2.20 0.70 0.75 Yes 1.56 0.23 105.94
MT VERNON ESTATE OVERFLOW PARKING LOT (MV) 6/29/2012 9.48 5.62 0.35 0.40 Yes 4.06 0.59 276.04
LINWAY TERRACE PARK ARTIFICIAL TURF FIELD (DR) 7/27/2010 10.50 3.00 0.16 0.16 Yes NA NA NA
WALMART #5969-00 AT CHANTILLY (SU) 12/14/2010 8.93 8.88 0.88 0.88 Yes NA NA NA
CENTREVILLE ELEMENTARY SCHOOL 10 CLASSROOM ADDN (S 5/18/2011 13.13 1.14 0.42 0.43 Yes 0.26 0.04 17.57
POPLAR TREE PARK - PARKING LOT IMPROVEMENTS (SU) 9/21/2011 38.87 1.69 0.43 0.69 Yes 6.06 0.88 411.79
WEST SPRINGFIELD ELEMENTARY SCHOOL BUILDING ADDN ( 4/27/2011 10.00 1.06 0.40 0.42 Yes 0.24 0.03 16.33
NORMAN M COLE JR POLLUTION CONTROL PLANT (MV) 10/30/2009 338.13 4.52 0.43 0.50 Yes 4.10 0.59 278.61
KINGS PARK ELEMENTARY SCHOOL (BR) 6/1/2011 10.10 1.70 0.47 0.47 Yes NA NA NA
POTOMAC SCHOOL TENNIS COURT & EXISTING FIELD RE- S 1/22/2010 4.43 4.43 0.24 0.50 No NA NA NA
COLIN POWELL ELEMENTARY SCHOOL (SU) 7/9/2010 16.94 1.00 0.37 0.39 Yes 0.23 0.03 15.41
WOODLAWN ELEMENTARY SCHOOL - KISS AND RIDE IMPRV ( 9/21/2011 10.66 10.66 0.35 0.37 No NA NA NA
FRITO-LAY INC SOUTH POTOMAC (MV) 12/20/2010 12.78 1.08 0.37 0.42 Yes 0.73 0.11 49.93
METRO WEST (PR) 8/9/2013 9.83 3.75 0.10 0.34 Yes 9.45 1.37 642.87
INTERNATIONAL COUNTRY CLUB (SU) 6/17/2010 222.33 18.92 0.19 0.19 No NA NA NA
WOODLEY HILLS ELEMENTARY SCHOOL CLASSROOM ADDN (MV 5/25/2011 10.15 2.60 0.48 0.50 Yes 0.59 0.09 40.07
CRESTWOOD ELEMENTARY SCHOOL (LE) 5/18/2011 11.18 1.10 0.34 0.37 No NA NA NA
GEORGE C MARSHALL HIGH SCHOOL (PR) 5/2/2011 45.61 17.92 0.43 0.47 Yes 8.12 1.18 552.28
RENOVATION TO EDISON HIGH SCHOOL (LE) 7/20/2009 43.62 13.75 0.53 0.63 Yes 18.50 2.68 1,258.05
SPRING HILL PARK PARKING LOT IMPROVEMENTS (DR) 8/20/2010 14.10 8.90 0.31 0.48 Yes 21.81 3.16 1,482.89
HAYCOCK ELEMENTARY SCHOOL (DR) 10/14/2009 9.99 1.08 0.39 0.43 Yes 0.73 0.11 49.93
WALMART STORE #2258 REMODEL (LE) 12/28/2009 14.19 1.00 0.81 0.81 Yes NA NA NA
RESTON STATION - SUNSET HILLS ROAD IMPROVEMENTS (H 6/1/2012 3.58 2.00 0.76 0.80 Yes 1.10 0.16 75.12
PINECREST GOLF COURSE UPPER POND RESTORATION (MA) 7/25/2012 23.29 1.30 0.15 0.15 Yes (0.18) (0.03) (12.52)
MCLEAREN 28 (SU) 12/12/2013 39.68 10.00 0.15 0.25 No NA NA NA
KINGSTOWNE STREAM RESTORATION PHASE II (LE) 11/8/2010 2.07 2.07 0.72 0.72 Yes NA NA NA
WESTFIELDS STONECROFT BOULEVARD (SU) 8/7/2012 31.93 19.50 0.35 0.59 Yes 67.39 9.77 4,582.44
AEROSPACE CORP- WESTFIELDS, PARCEL 35 (SU) 9/14/2009 40.41 2.00 0.04 0.04 No NA NA NA
LEE RD AND STONECROFT BV (SU) 6/1/2010 1.70 1.70 0.10 0.90 No NA NA NA
OLLEY LANE IMPROVEMENTS (STATE ROUTE# 787) (BR) 4/29/2010 13.87 1.60 0.70 0.70 Yes NA NA NA
FLAT BRANCH FORCE MAIN IMPROVEMENTS, PHASE II (SU) 1/22/2013 436.86 3.18 0.20 0.20 No NA NA NA
PATRIOT RIDGE - BACKLICK ROAD (LE) 6/20/2011 1.98 1.98 0.83 0.82 Yes (0.34) (0.05) (22.88)
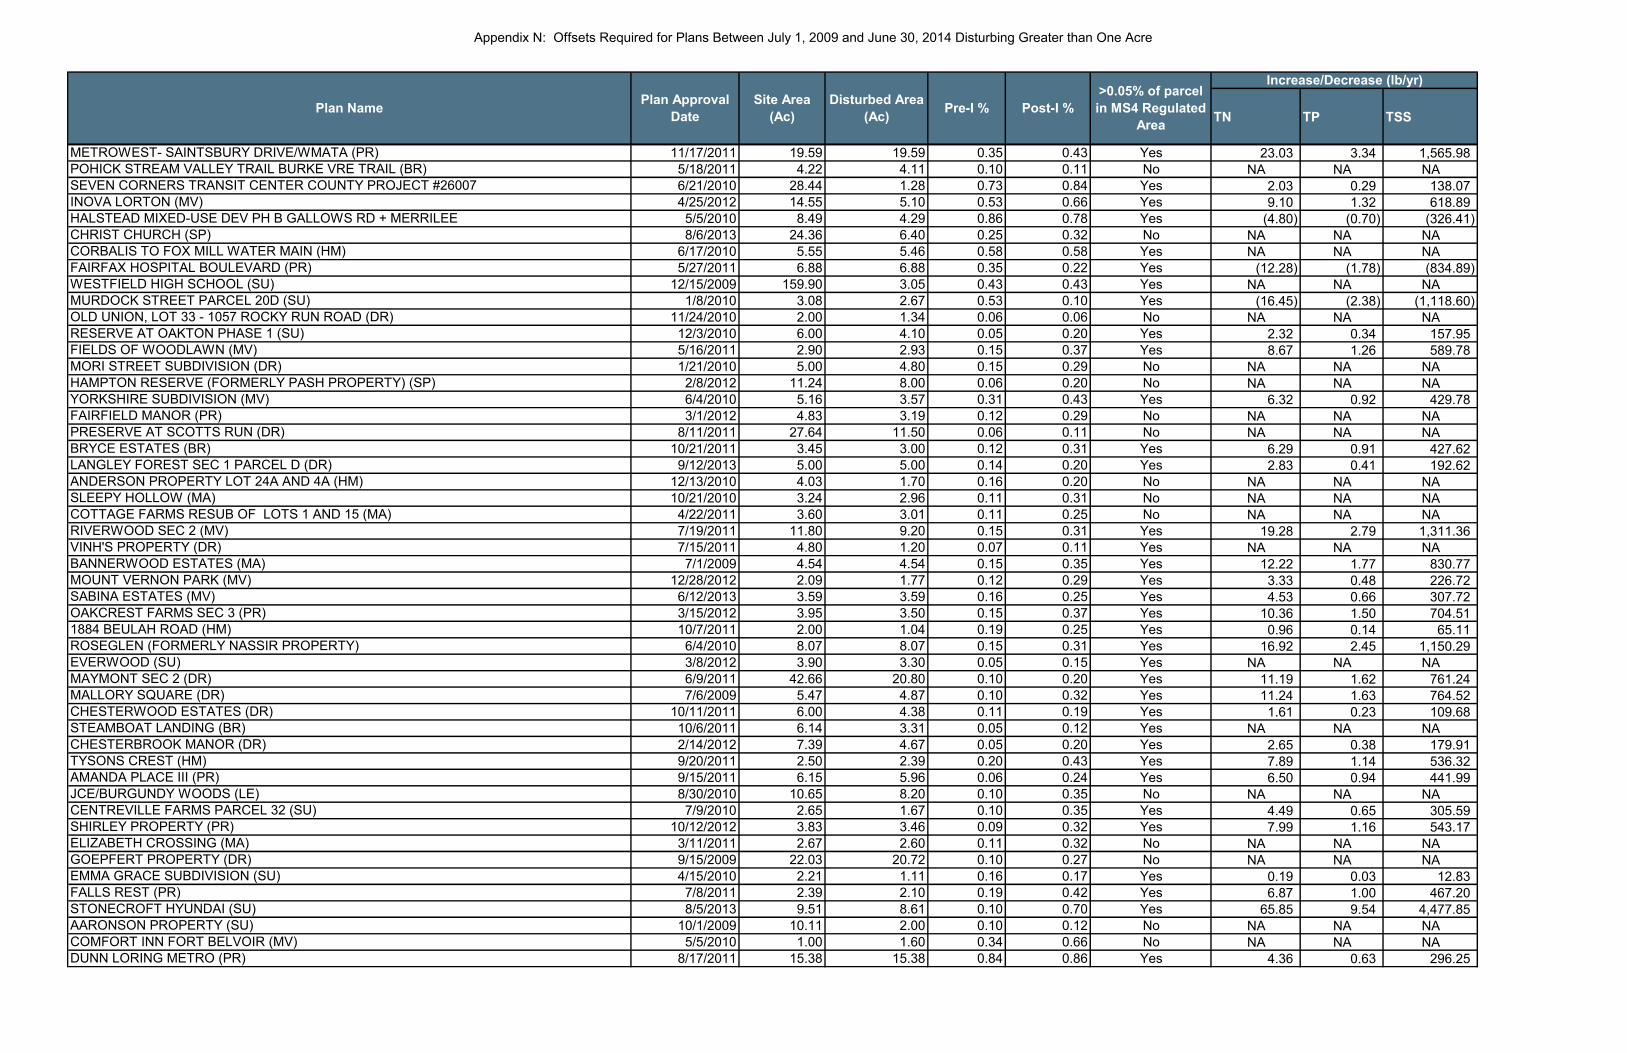
Appendix N: Offsets Required for Plans Between July 1, 2009 and June 30, 2014 Disturbing Greater than One Acre
TN TP TSSPost-I %
>0.05% of parcel
in MS4 Regulated
Area
Increase/Decrease (lb/yr)
Pre-I %Plan NamePlan Approval
Date
Site Area
(Ac)
Disturbed Area
(Ac)
METROWEST- SAINTSBURY DRIVE/WMATA (PR) 11/17/2011 19.59 19.59 0.35 0.43 Yes 23.03 3.34 1,565.98
POHICK STREAM VALLEY TRAIL BURKE VRE TRAIL (BR) 5/18/2011 4.22 4.11 0.10 0.11 No NA NA NA
SEVEN CORNERS TRANSIT CENTER COUNTY PROJECT #26007 6/21/2010 28.44 1.28 0.73 0.84 Yes 2.03 0.29 138.07
INOVA LORTON (MV) 4/25/2012 14.55 5.10 0.53 0.66 Yes 9.10 1.32 618.89
HALSTEAD MIXED-USE DEV PH B GALLOWS RD + MERRILEE 5/5/2010 8.49 4.29 0.86 0.78 Yes (4.80) (0.70) (326.41)
CHRIST CHURCH (SP) 8/6/2013 24.36 6.40 0.25 0.32 No NA NA NA
CORBALIS TO FOX MILL WATER MAIN (HM) 6/17/2010 5.55 5.46 0.58 0.58 Yes NA NA NA
FAIRFAX HOSPITAL BOULEVARD (PR) 5/27/2011 6.88 6.88 0.35 0.22 Yes (12.28) (1.78) (834.89)
WESTFIELD HIGH SCHOOL (SU) 12/15/2009 159.90 3.05 0.43 0.43 Yes NA NA NA
MURDOCK STREET PARCEL 20D (SU) 1/8/2010 3.08 2.67 0.53 0.10 Yes (16.45) (2.38) (1,118.60)
OLD UNION, LOT 33 - 1057 ROCKY RUN ROAD (DR) 11/24/2010 2.00 1.34 0.06 0.06 No NA NA NA
RESERVE AT OAKTON PHASE 1 (SU) 12/3/2010 6.00 4.10 0.05 0.20 Yes 2.32 0.34 157.95
FIELDS OF WOODLAWN (MV) 5/16/2011 2.90 2.93 0.15 0.37 Yes 8.67 1.26 589.78
MORI STREET SUBDIVISION (DR) 1/21/2010 5.00 4.80 0.15 0.29 No NA NA NA
HAMPTON RESERVE (FORMERLY PASH PROPERTY) (SP) 2/8/2012 11.24 8.00 0.06 0.20 No NA NA NA
YORKSHIRE SUBDIVISION (MV) 6/4/2010 5.16 3.57 0.31 0.43 Yes 6.32 0.92 429.78
FAIRFIELD MANOR (PR) 3/1/2012 4.83 3.19 0.12 0.29 No NA NA NA
PRESERVE AT SCOTTS RUN (DR) 8/11/2011 27.64 11.50 0.06 0.11 No NA NA NA
BRYCE ESTATES (BR) 10/21/2011 3.45 3.00 0.12 0.31 Yes 6.29 0.91 427.62
LANGLEY FOREST SEC 1 PARCEL D (DR) 9/12/2013 5.00 5.00 0.14 0.20 Yes 2.83 0.41 192.62
ANDERSON PROPERTY LOT 24A AND 4A (HM) 12/13/2010 4.03 1.70 0.16 0.20 No NA NA NA
SLEEPY HOLLOW (MA) 10/21/2010 3.24 2.96 0.11 0.31 No NA NA NA
COTTAGE FARMS RESUB OF LOTS 1 AND 15 (MA) 4/22/2011 3.60 3.01 0.11 0.25 No NA NA NA
RIVERWOOD SEC 2 (MV) 7/19/2011 11.80 9.20 0.15 0.31 Yes 19.28 2.79 1,311.36
VINH'S PROPERTY (DR) 7/15/2011 4.80 1.20 0.07 0.11 Yes NA NA NA
BANNERWOOD ESTATES (MA) 7/1/2009 4.54 4.54 0.15 0.35 Yes 12.22 1.77 830.77
MOUNT VERNON PARK (MV) 12/28/2012 2.09 1.77 0.12 0.29 Yes 3.33 0.48 226.72
SABINA ESTATES (MV) 6/12/2013 3.59 3.59 0.16 0.25 Yes 4.53 0.66 307.72
OAKCREST FARMS SEC 3 (PR) 3/15/2012 3.95 3.50 0.15 0.37 Yes 10.36 1.50 704.51
1884 BEULAH ROAD (HM) 10/7/2011 2.00 1.04 0.19 0.25 Yes 0.96 0.14 65.11
ROSEGLEN (FORMERLY NASSIR PROPERTY) 6/4/2010 8.07 8.07 0.15 0.31 Yes 16.92 2.45 1,150.29
EVERWOOD (SU) 3/8/2012 3.90 3.30 0.05 0.15 Yes NA NA NA
MAYMONT SEC 2 (DR) 6/9/2011 42.66 20.80 0.10 0.20 Yes 11.19 1.62 761.24
MALLORY SQUARE (DR) 7/6/2009 5.47 4.87 0.10 0.32 Yes 11.24 1.63 764.52
CHESTERWOOD ESTATES (DR) 10/11/2011 6.00 4.38 0.11 0.19 Yes 1.61 0.23 109.68
STEAMBOAT LANDING (BR) 10/6/2011 6.14 3.31 0.05 0.12 Yes NA NA NA
CHESTERBROOK MANOR (DR) 2/14/2012 7.39 4.67 0.05 0.20 Yes 2.65 0.38 179.91
TYSONS CREST (HM) 9/20/2011 2.50 2.39 0.20 0.43 Yes 7.89 1.14 536.32
AMANDA PLACE III (PR) 9/15/2011 6.15 5.96 0.06 0.24 Yes 6.50 0.94 441.99
JCE/BURGUNDY WOODS (LE) 8/30/2010 10.65 8.20 0.10 0.35 No NA NA NA
CENTREVILLE FARMS PARCEL 32 (SU) 7/9/2010 2.65 1.67 0.10 0.35 Yes 4.49 0.65 305.59
SHIRLEY PROPERTY (PR) 10/12/2012 3.83 3.46 0.09 0.32 Yes 7.99 1.16 543.17
ELIZABETH CROSSING (MA) 3/11/2011 2.67 2.60 0.11 0.32 No NA NA NA
GOEPFERT PROPERTY (DR) 9/15/2009 22.03 20.72 0.10 0.27 No NA NA NA
EMMA GRACE SUBDIVISION (SU) 4/15/2010 2.21 1.11 0.16 0.17 Yes 0.19 0.03 12.83
FALLS REST (PR) 7/8/2011 2.39 2.10 0.19 0.42 Yes 6.87 1.00 467.20
STONECROFT HYUNDAI (SU) 8/5/2013 9.51 8.61 0.10 0.70 Yes 65.85 9.54 4,477.85
AARONSON PROPERTY (SU) 10/1/2009 10.11 2.00 0.10 0.12 No NA NA NA
COMFORT INN FORT BELVOIR (MV) 5/5/2010 1.00 1.60 0.34 0.66 No NA NA NA
DUNN LORING METRO (PR) 8/17/2011 15.38 15.38 0.84 0.86 Yes 4.36 0.63 296.25
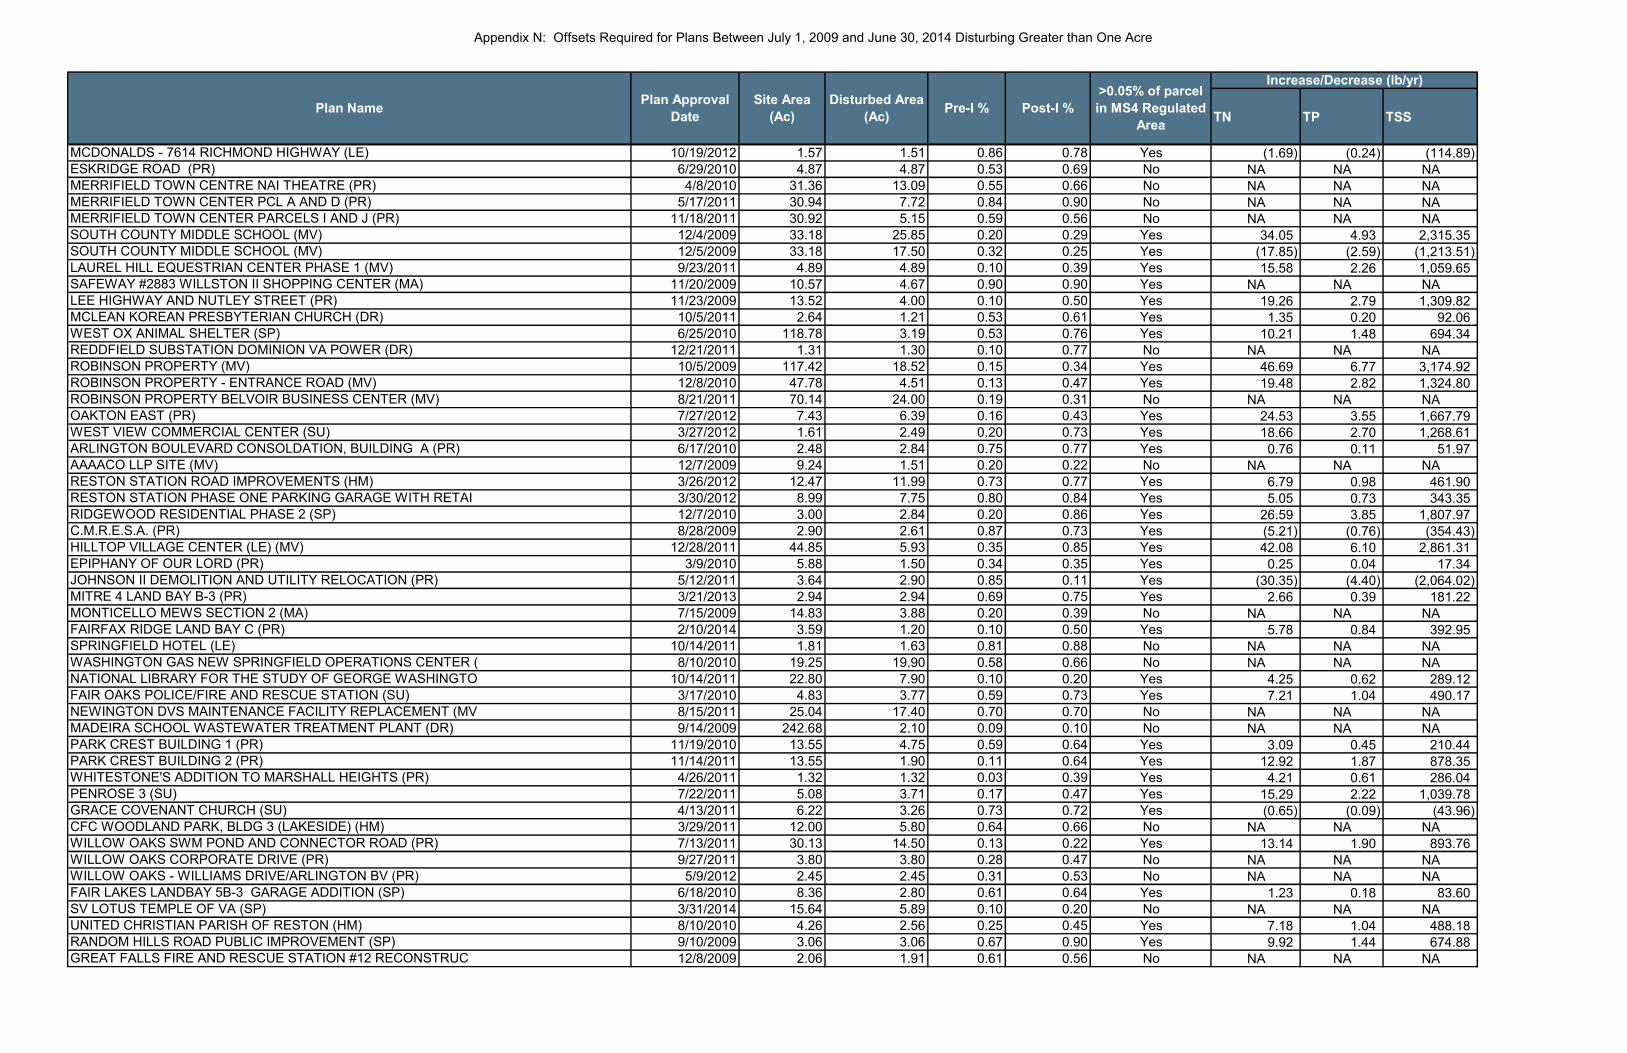
Appendix N: Offsets Required for Plans Between July 1, 2009 and June 30, 2014 Disturbing Greater than One Acre
TN TP TSSPost-I %
>0.05% of parcel
in MS4 Regulated
Area
Increase/Decrease (lb/yr)
Pre-I %Plan NamePlan Approval
Date
Site Area
(Ac)
Disturbed Area
(Ac)
MCDONALDS - 7614 RICHMOND HIGHWAY (LE) 10/19/2012 1.57 1.51 0.86 0.78 Yes (1.69) (0.24) (114.89)
ESKRIDGE ROAD (PR) 6/29/2010 4.87 4.87 0.53 0.69 No NA NA NA
MERRIFIELD TOWN CENTRE NAI THEATRE (PR) 4/8/2010 31.36 13.09 0.55 0.66 No NA NA NA
MERRIFIELD TOWN CENTER PCL A AND D (PR) 5/17/2011 30.94 7.72 0.84 0.90 No NA NA NA
MERRIFIELD TOWN CENTER PARCELS I AND J (PR) 11/18/2011 30.92 5.15 0.59 0.56 No NA NA NA
SOUTH COUNTY MIDDLE SCHOOL (MV) 12/4/2009 33.18 25.85 0.20 0.29 Yes 34.05 4.93 2,315.35
SOUTH COUNTY MIDDLE SCHOOL (MV) 12/5/2009 33.18 17.50 0.32 0.25 Yes (17.85) (2.59) (1,213.51)
LAUREL HILL EQUESTRIAN CENTER PHASE 1 (MV) 9/23/2011 4.89 4.89 0.10 0.39 Yes 15.58 2.26 1,059.65
SAFEWAY #2883 WILLSTON II SHOPPING CENTER (MA) 11/20/2009 10.57 4.67 0.90 0.90 Yes NA NA NA
LEE HIGHWAY AND NUTLEY STREET (PR) 11/23/2009 13.52 4.00 0.10 0.50 Yes 19.26 2.79 1,309.82
MCLEAN KOREAN PRESBYTERIAN CHURCH (DR) 10/5/2011 2.64 1.21 0.53 0.61 Yes 1.35 0.20 92.06
WEST OX ANIMAL SHELTER (SP) 6/25/2010 118.78 3.19 0.53 0.76 Yes 10.21 1.48 694.34
REDDFIELD SUBSTATION DOMINION VA POWER (DR) 12/21/2011 1.31 1.30 0.10 0.77 No NA NA NA
ROBINSON PROPERTY (MV) 10/5/2009 117.42 18.52 0.15 0.34 Yes 46.69 6.77 3,174.92
ROBINSON PROPERTY - ENTRANCE ROAD (MV) 12/8/2010 47.78 4.51 0.13 0.47 Yes 19.48 2.82 1,324.80
ROBINSON PROPERTY BELVOIR BUSINESS CENTER (MV) 8/21/2011 70.14 24.00 0.19 0.31 No NA NA NA
OAKTON EAST (PR) 7/27/2012 7.43 6.39 0.16 0.43 Yes 24.53 3.55 1,667.79
WEST VIEW COMMERCIAL CENTER (SU) 3/27/2012 1.61 2.49 0.20 0.73 Yes 18.66 2.70 1,268.61
ARLINGTON BOULEVARD CONSOLDATION, BUILDING A (PR) 6/17/2010 2.48 2.84 0.75 0.77 Yes 0.76 0.11 51.97
AAAACO LLP SITE (MV) 12/7/2009 9.24 1.51 0.20 0.22 No NA NA NA
RESTON STATION ROAD IMPROVEMENTS (HM) 3/26/2012 12.47 11.99 0.73 0.77 Yes 6.79 0.98 461.90
RESTON STATION PHASE ONE PARKING GARAGE WITH RETAI 3/30/2012 8.99 7.75 0.80 0.84 Yes 5.05 0.73 343.35
RIDGEWOOD RESIDENTIAL PHASE 2 (SP) 12/7/2010 3.00 2.84 0.20 0.86 Yes 26.59 3.85 1,807.97
C.M.R.E.S.A. (PR) 8/28/2009 2.90 2.61 0.87 0.73 Yes (5.21) (0.76) (354.43)
HILLTOP VILLAGE CENTER (LE) (MV) 12/28/2011 44.85 5.93 0.35 0.85 Yes 42.08 6.10 2,861.31
EPIPHANY OF OUR LORD (PR) 3/9/2010 5.88 1.50 0.34 0.35 Yes 0.25 0.04 17.34
JOHNSON II DEMOLITION AND UTILITY RELOCATION (PR) 5/12/2011 3.64 2.90 0.85 0.11 Yes (30.35) (4.40) (2,064.02)
MITRE 4 LAND BAY B-3 (PR) 3/21/2013 2.94 2.94 0.69 0.75 Yes 2.66 0.39 181.22
MONTICELLO MEWS SECTION 2 (MA) 7/15/2009 14.83 3.88 0.20 0.39 No NA NA NA
FAIRFAX RIDGE LAND BAY C (PR) 2/10/2014 3.59 1.20 0.10 0.50 Yes 5.78 0.84 392.95
SPRINGFIELD HOTEL (LE) 10/14/2011 1.81 1.63 0.81 0.88 No NA NA NA
WASHINGTON GAS NEW SPRINGFIELD OPERATIONS CENTER ( 8/10/2010 19.25 19.90 0.58 0.66 No NA NA NA
NATIONAL LIBRARY FOR THE STUDY OF GEORGE WASHINGTO 10/14/2011 22.80 7.90 0.10 0.20 Yes 4.25 0.62 289.12
FAIR OAKS POLICE/FIRE AND RESCUE STATION (SU) 3/17/2010 4.83 3.77 0.59 0.73 Yes 7.21 1.04 490.17
NEWINGTON DVS MAINTENANCE FACILITY REPLACEMENT (MV 8/15/2011 25.04 17.40 0.70 0.70 No NA NA NA
MADEIRA SCHOOL WASTEWATER TREATMENT PLANT (DR) 9/14/2009 242.68 2.10 0.09 0.10 No NA NA NA
PARK CREST BUILDING 1 (PR) 11/19/2010 13.55 4.75 0.59 0.64 Yes 3.09 0.45 210.44
PARK CREST BUILDING 2 (PR) 11/14/2011 13.55 1.90 0.11 0.64 Yes 12.92 1.87 878.35
WHITESTONE'S ADDITION TO MARSHALL HEIGHTS (PR) 4/26/2011 1.32 1.32 0.03 0.39 Yes 4.21 0.61 286.04
PENROSE 3 (SU) 7/22/2011 5.08 3.71 0.17 0.47 Yes 15.29 2.22 1,039.78
GRACE COVENANT CHURCH (SU) 4/13/2011 6.22 3.26 0.73 0.72 Yes (0.65) (0.09) (43.96)
CFC WOODLAND PARK, BLDG 3 (LAKESIDE) (HM) 3/29/2011 12.00 5.80 0.64 0.66 No NA NA NA
WILLOW OAKS SWM POND AND CONNECTOR ROAD (PR) 7/13/2011 30.13 14.50 0.13 0.22 Yes 13.14 1.90 893.76
WILLOW OAKS CORPORATE DRIVE (PR) 9/27/2011 3.80 3.80 0.28 0.47 No NA NA NA
WILLOW OAKS - WILLIAMS DRIVE/ARLINGTON BV (PR) 5/9/2012 2.45 2.45 0.31 0.53 No NA NA NA
FAIR LAKES LANDBAY 5B-3 GARAGE ADDITION (SP) 6/18/2010 8.36 2.80 0.61 0.64 Yes 1.23 0.18 83.60
SV LOTUS TEMPLE OF VA (SP) 3/31/2014 15.64 5.89 0.10 0.20 No NA NA NA
UNITED CHRISTIAN PARISH OF RESTON (HM) 8/10/2010 4.26 2.56 0.25 0.45 Yes 7.18 1.04 488.18
RANDOM HILLS ROAD PUBLIC IMPROVEMENT (SP) 9/10/2009 3.06 3.06 0.67 0.90 Yes 9.92 1.44 674.88
GREAT FALLS FIRE AND RESCUE STATION #12 RECONSTRUC 12/8/2009 2.06 1.91 0.61 0.56 No NA NA NA
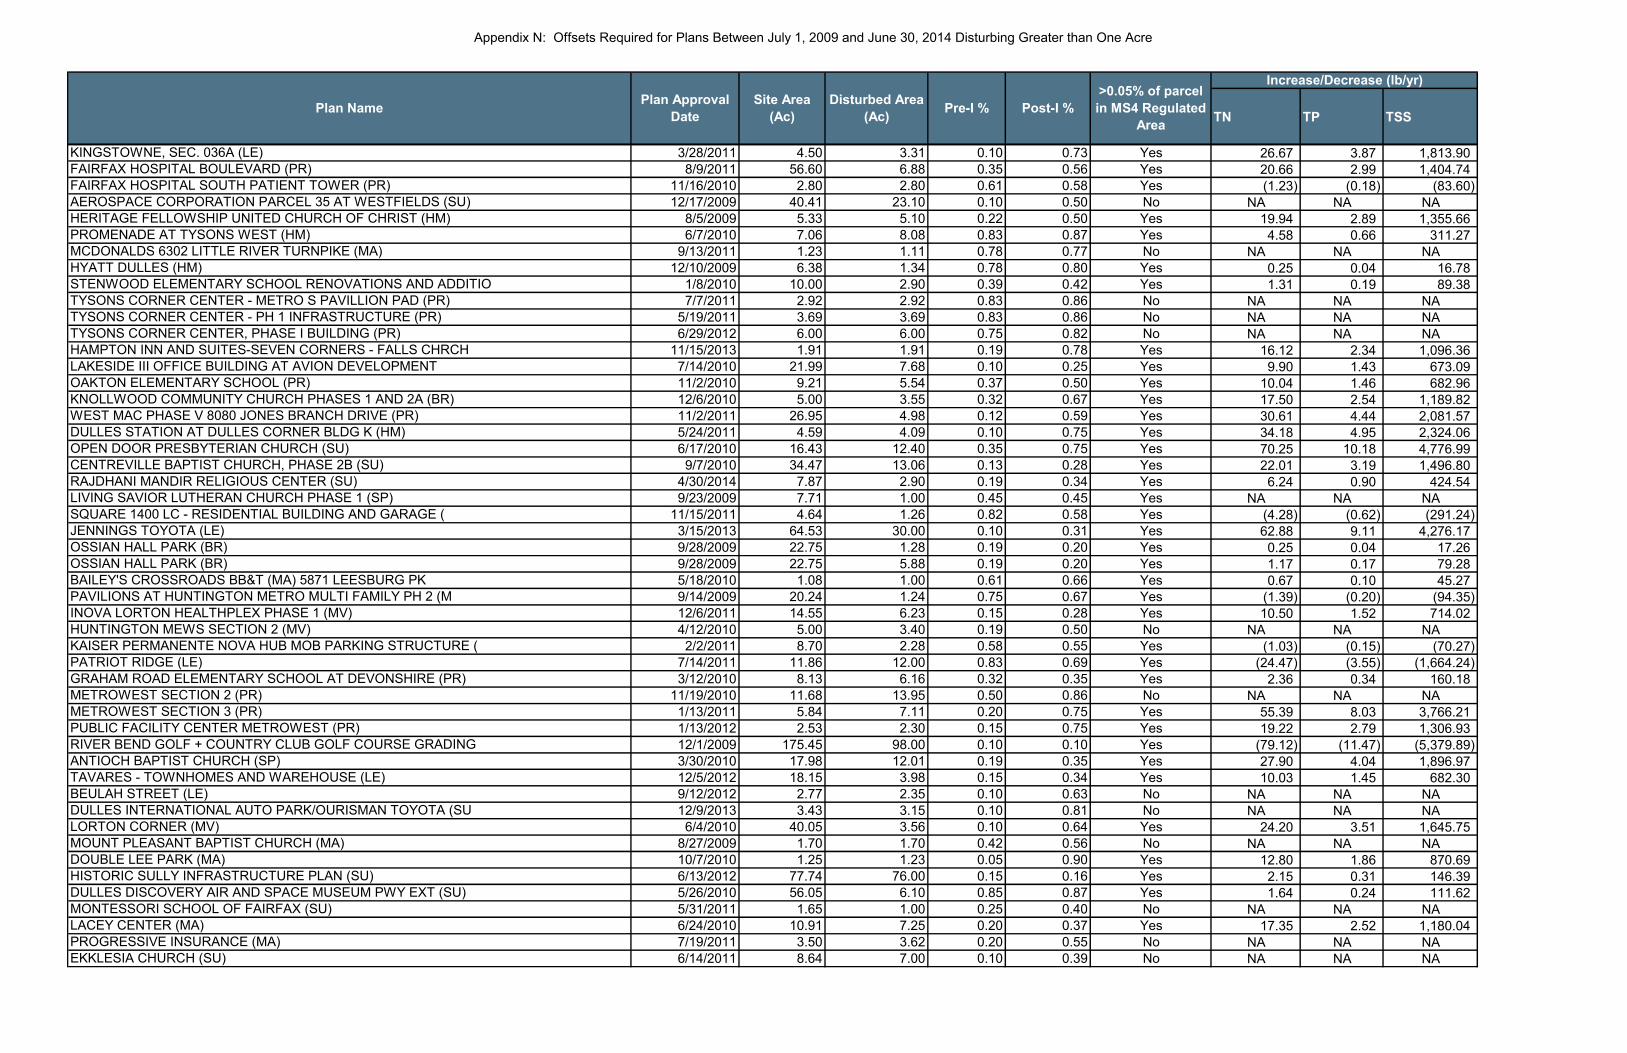
Appendix N: Offsets Required for Plans Between July 1, 2009 and June 30, 2014 Disturbing Greater than One Acre
TN TP TSSPost-I %
>0.05% of parcel
in MS4 Regulated
Area
Increase/Decrease (lb/yr)
Pre-I %Plan NamePlan Approval
Date
Site Area
(Ac)
Disturbed Area
(Ac)
KINGSTOWNE, SEC. 036A (LE) 3/28/2011 4.50 3.31 0.10 0.73 Yes 26.67 3.87 1,813.90
FAIRFAX HOSPITAL BOULEVARD (PR) 8/9/2011 56.60 6.88 0.35 0.56 Yes 20.66 2.99 1,404.74
FAIRFAX HOSPITAL SOUTH PATIENT TOWER (PR) 11/16/2010 2.80 2.80 0.61 0.58 Yes (1.23) (0.18) (83.60)
AEROSPACE CORPORATION PARCEL 35 AT WESTFIELDS (SU) 12/17/2009 40.41 23.10 0.10 0.50 No NA NA NA
HERITAGE FELLOWSHIP UNITED CHURCH OF CHRIST (HM) 8/5/2009 5.33 5.10 0.22 0.50 Yes 19.94 2.89 1,355.66
PROMENADE AT TYSONS WEST (HM) 6/7/2010 7.06 8.08 0.83 0.87 Yes 4.58 0.66 311.27
MCDONALDS 6302 LITTLE RIVER TURNPIKE (MA) 9/13/2011 1.23 1.11 0.78 0.77 No NA NA NA
HYATT DULLES (HM) 12/10/2009 6.38 1.34 0.78 0.80 Yes 0.25 0.04 16.78
STENWOOD ELEMENTARY SCHOOL RENOVATIONS AND ADDITIO 1/8/2010 10.00 2.90 0.39 0.42 Yes 1.31 0.19 89.38
TYSONS CORNER CENTER - METRO S PAVILLION PAD (PR) 7/7/2011 2.92 2.92 0.83 0.86 No NA NA NA
TYSONS CORNER CENTER - PH 1 INFRASTRUCTURE (PR) 5/19/2011 3.69 3.69 0.83 0.86 No NA NA NA
TYSONS CORNER CENTER, PHASE I BUILDING (PR) 6/29/2012 6.00 6.00 0.75 0.82 No NA NA NA
HAMPTON INN AND SUITES-SEVEN CORNERS - FALLS CHRCH 11/15/2013 1.91 1.91 0.19 0.78 Yes 16.12 2.34 1,096.36
LAKESIDE III OFFICE BUILDING AT AVION DEVELOPMENT 7/14/2010 21.99 7.68 0.10 0.25 Yes 9.90 1.43 673.09
OAKTON ELEMENTARY SCHOOL (PR) 11/2/2010 9.21 5.54 0.37 0.50 Yes 10.04 1.46 682.96
KNOLLWOOD COMMUNITY CHURCH PHASES 1 AND 2A (BR) 12/6/2010 5.00 3.55 0.32 0.67 Yes 17.50 2.54 1,189.82
WEST MAC PHASE V 8080 JONES BRANCH DRIVE (PR) 11/2/2011 26.95 4.98 0.12 0.59 Yes 30.61 4.44 2,081.57
DULLES STATION AT DULLES CORNER BLDG K (HM) 5/24/2011 4.59 4.09 0.10 0.75 Yes 34.18 4.95 2,324.06
OPEN DOOR PRESBYTERIAN CHURCH (SU) 6/17/2010 16.43 12.40 0.35 0.75 Yes 70.25 10.18 4,776.99
CENTREVILLE BAPTIST CHURCH, PHASE 2B (SU) 9/7/2010 34.47 13.06 0.13 0.28 Yes 22.01 3.19 1,496.80
RAJDHANI MANDIR RELIGIOUS CENTER (SU) 4/30/2014 7.87 2.90 0.19 0.34 Yes 6.24 0.90 424.54
LIVING SAVIOR LUTHERAN CHURCH PHASE 1 (SP) 9/23/2009 7.71 1.00 0.45 0.45 Yes NA NA NA
SQUARE 1400 LC - RESIDENTIAL BUILDING AND GARAGE ( 11/15/2011 4.64 1.26 0.82 0.58 Yes (4.28) (0.62) (291.24)
JENNINGS TOYOTA (LE) 3/15/2013 64.53 30.00 0.10 0.31 Yes 62.88 9.11 4,276.17
OSSIAN HALL PARK (BR) 9/28/2009 22.75 1.28 0.19 0.20 Yes 0.25 0.04 17.26
OSSIAN HALL PARK (BR) 9/28/2009 22.75 5.88 0.19 0.20 Yes 1.17 0.17 79.28
BAILEY'S CROSSROADS BB&T (MA) 5871 LEESBURG PK 5/18/2010 1.08 1.00 0.61 0.66 Yes 0.67 0.10 45.27
PAVILIONS AT HUNTINGTON METRO MULTI FAMILY PH 2 (M 9/14/2009 20.24 1.24 0.75 0.67 Yes (1.39) (0.20) (94.35)
INOVA LORTON HEALTHPLEX PHASE 1 (MV) 12/6/2011 14.55 6.23 0.15 0.28 Yes 10.50 1.52 714.02
HUNTINGTON MEWS SECTION 2 (MV) 4/12/2010 5.00 3.40 0.19 0.50 No NA NA NA
KAISER PERMANENTE NOVA HUB MOB PARKING STRUCTURE ( 2/2/2011 8.70 2.28 0.58 0.55 Yes (1.03) (0.15) (70.27)
PATRIOT RIDGE (LE) 7/14/2011 11.86 12.00 0.83 0.69 Yes (24.47) (3.55) (1,664.24)
GRAHAM ROAD ELEMENTARY SCHOOL AT DEVONSHIRE (PR) 3/12/2010 8.13 6.16 0.32 0.35 Yes 2.36 0.34 160.18
METROWEST SECTION 2 (PR) 11/19/2010 11.68 13.95 0.50 0.86 No NA NA NA
METROWEST SECTION 3 (PR) 1/13/2011 5.84 7.11 0.20 0.75 Yes 55.39 8.03 3,766.21
PUBLIC FACILITY CENTER METROWEST (PR) 1/13/2012 2.53 2.30 0.15 0.75 Yes 19.22 2.79 1,306.93
RIVER BEND GOLF + COUNTRY CLUB GOLF COURSE GRADING 12/1/2009 175.45 98.00 0.10 0.10 Yes (79.12) (11.47) (5,379.89)
ANTIOCH BAPTIST CHURCH (SP) 3/30/2010 17.98 12.01 0.19 0.35 Yes 27.90 4.04 1,896.97
TAVARES - TOWNHOMES AND WAREHOUSE (LE) 12/5/2012 18.15 3.98 0.15 0.34 Yes 10.03 1.45 682.30
BEULAH STREET (LE) 9/12/2012 2.77 2.35 0.10 0.63 No NA NA NA
DULLES INTERNATIONAL AUTO PARK/OURISMAN TOYOTA (SU 12/9/2013 3.43 3.15 0.10 0.81 No NA NA NA
LORTON CORNER (MV) 6/4/2010 40.05 3.56 0.10 0.64 Yes 24.20 3.51 1,645.75
MOUNT PLEASANT BAPTIST CHURCH (MA) 8/27/2009 1.70 1.70 0.42 0.56 No NA NA NA
DOUBLE LEE PARK (MA) 10/7/2010 1.25 1.23 0.05 0.90 Yes 12.80 1.86 870.69
HISTORIC SULLY INFRASTRUCTURE PLAN (SU) 6/13/2012 77.74 76.00 0.15 0.16 Yes 2.15 0.31 146.39
DULLES DISCOVERY AIR AND SPACE MUSEUM PWY EXT (SU) 5/26/2010 56.05 6.10 0.85 0.87 Yes 1.64 0.24 111.62
MONTESSORI SCHOOL OF FAIRFAX (SU) 5/31/2011 1.65 1.00 0.25 0.40 No NA NA NA
LACEY CENTER (MA) 6/24/2010 10.91 7.25 0.20 0.37 Yes 17.35 2.52 1,180.04
PROGRESSIVE INSURANCE (MA) 7/19/2011 3.50 3.62 0.20 0.55 No NA NA NA
EKKLESIA CHURCH (SU) 6/14/2011 8.64 7.00 0.10 0.39 No NA NA NA

Appendix N: Offsets Required for Plans Between July 1, 2009 and June 30, 2014 Disturbing Greater than One Acre
TN TP TSSPost-I %
>0.05% of parcel
in MS4 Regulated
Area
Increase/Decrease (lb/yr)
Pre-I %Plan NamePlan Approval
Date
Site Area
(Ac)
Disturbed Area
(Ac)
MERRIFIELD GARDEN CENTER (PR) 6/14/2011 8.52 1.02 0.75 0.76 Yes 0.09 0.01 5.89
CVS PHARMACY - 3921 PROSPERITY AVE (MA) 11/8/2011 1.81 2.06 0.73 0.75 Yes 0.61 0.09 41.66
5321 SHAWNEE ROAD (MA) 7/1/2009 3.64 3.33 0.67 0.59 No NA NA NA
RICHMOND HIGHWAY HOTEL (MV) 5/11/2011 2.22 2.52 0.20 0.75 Yes 19.63 2.84 1,334.86
HEIGHTS AT GROVETON (LE) 1/25/2011 4.59 5.04 0.22 0.80 Yes 40.76 5.91 2,771.65
FOSTERS CREST (LE) 8/2/2011 4.33 4.70 0.13 0.55 Yes 25.70 3.72 1,747.26
DOLLEY MADISON LIBRARY (DR) 3/9/2010 3.90 2.51 0.50 0.50 Yes (0.11) (0.02) (7.25)
HALSTEAD MIXED USE DEVELOPMENT PHASE B (PR) 5/13/2010 4.33 4.00 0.84 0.81 Yes (1.93) (0.28) (130.98)
HALSTEAD PHASE B BUILDINGS 1 AND 2 (PR) 4/4/2011 4.14 5.00 0.81 0.85 Yes 3.12 0.45 211.88
CHRIST CHURCH PHASE 1 (SP) 8/8/2013 24.58 9.79 0.05 0.19 No NA NA NA
BURKE HEALTH AND REHABILITATION CENTER (BR) 10/25/2010 7.66 1.05 0.27 0.28 Yes 0.21 0.03 14.16
RADLEY MANAGEMENT LLC (MA) 1/31/2013 0.96 1.28 0.90 0.78 Yes (2.14) (0.31) (145.47)
RADLEY MANAGEMENT LLC PHASE II (MA) 8/8/2012 0.96 1.04 0.89 0.78 Yes (1.56) (0.23) (106.17)
AUTOZONE STORE NO. 4912 (MV) 8/12/2010 1.79 1.12 0.35 0.45 No NA NA NA
MCLEAN PERSONAL STORAGE (DR) 11/18/2011 2.66 1.60 0.83 0.83 Yes NA NA NA
COSTCO MOUNT VERNON (LE) 11/7/2012 11.88 12.73 0.81 0.81 Yes NA NA NA
DOGWOOD POOL RENOVATION (HM) 3/8/2012 2.64 2.00 0.20 0.28 Yes 2.24 0.32 152.17
Total Offset: 1,202.69 174.30 81,782.93
Offset Minus
Credit:(408.00) (229.81) (114,820.29)
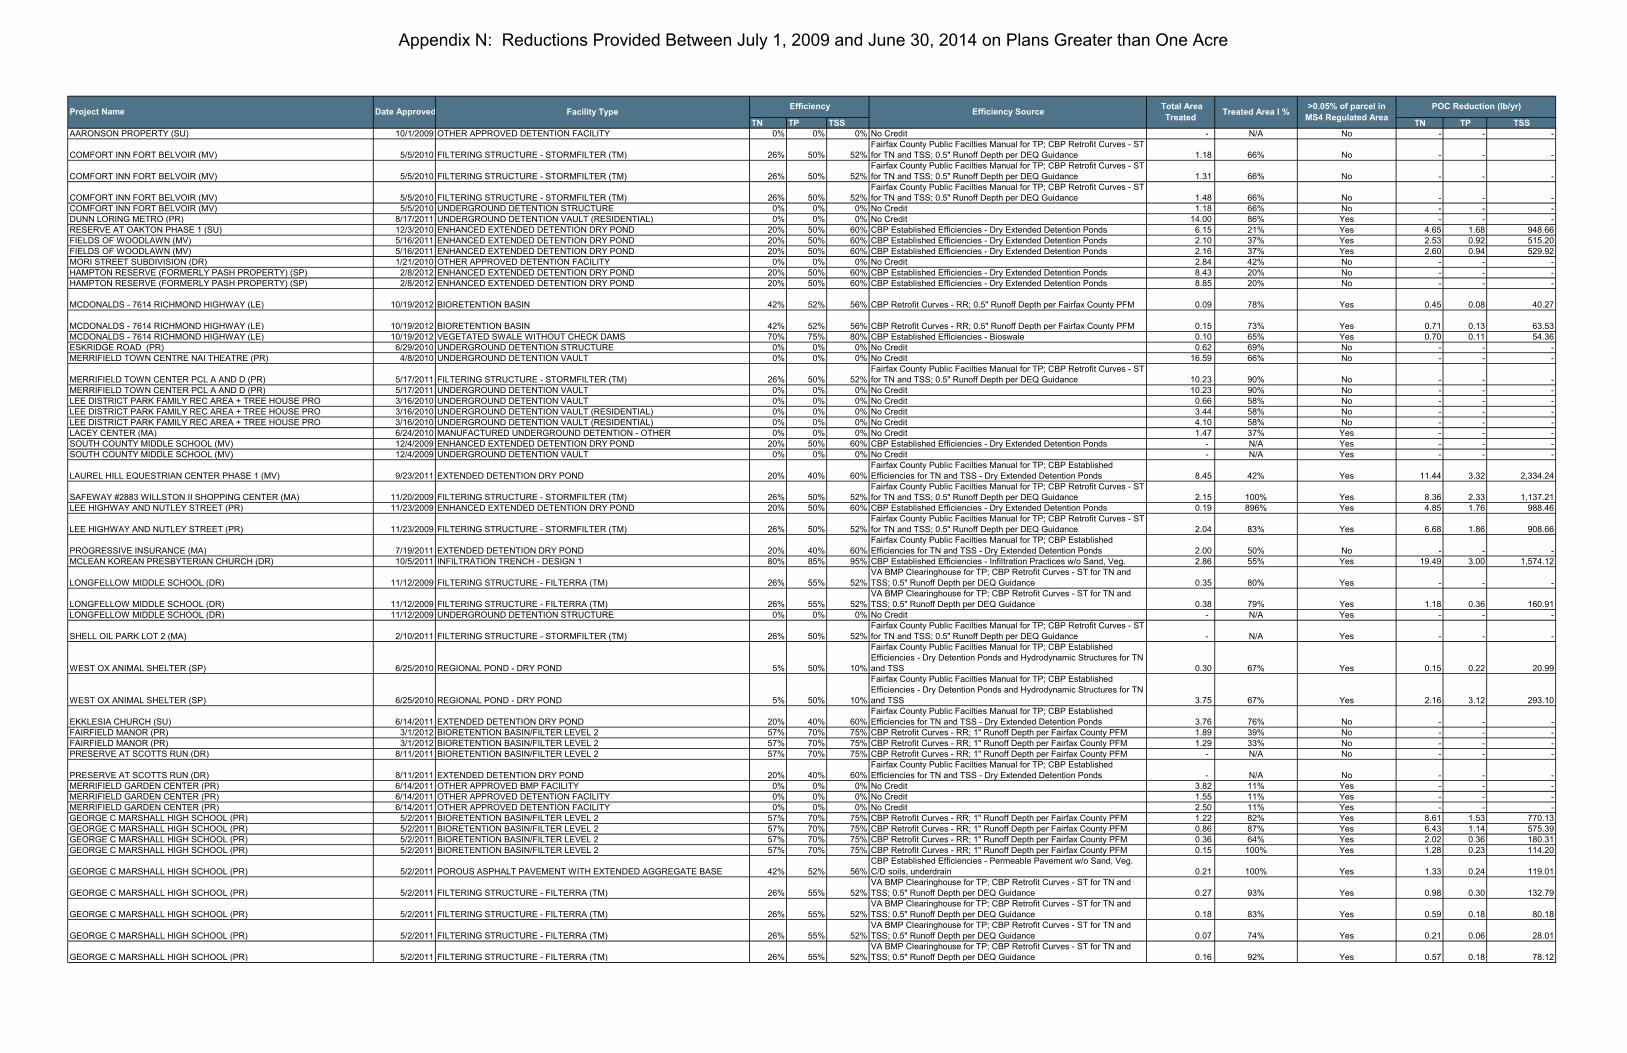
Appendix N: Reductions Provided Between July 1, 2009 and June 30, 2014 on Plans Greater than One Acre
TN TP TSS TN TP TSS
AARONSON PROPERTY (SU) 10/1/2009 OTHER APPROVED DETENTION FACILITY 0% 0% 0% No Credit - N/A No - - -
COMFORT INN FORT BELVOIR (MV) 5/5/2010 FILTERING STRUCTURE - STORMFILTER (TM) 26% 50% 52%
Fairfax County Public Facilties Manual for TP; CBP Retrofit Curves - ST
for TN and TSS; 0.5" Runoff Depth per DEQ Guidance 1.18 66% No - - -
COMFORT INN FORT BELVOIR (MV) 5/5/2010 FILTERING STRUCTURE - STORMFILTER (TM) 26% 50% 52%
Fairfax County Public Facilties Manual for TP; CBP Retrofit Curves - ST
for TN and TSS; 0.5" Runoff Depth per DEQ Guidance 1.31 66% No - - -
COMFORT INN FORT BELVOIR (MV) 5/5/2010 FILTERING STRUCTURE - STORMFILTER (TM) 26% 50% 52%
Fairfax County Public Facilties Manual for TP; CBP Retrofit Curves - ST
for TN and TSS; 0.5" Runoff Depth per DEQ Guidance 1.48 66% No - - -
COMFORT INN FORT BELVOIR (MV) 5/5/2010 UNDERGROUND DETENTION STRUCTURE 0% 0% 0% No Credit 1.18 66% No - - -
DUNN LORING METRO (PR) 8/17/2011 UNDERGROUND DETENTION VAULT (RESIDENTIAL) 0% 0% 0% No Credit 14.00 86% Yes - - -
RESERVE AT OAKTON PHASE 1 (SU) 12/3/2010 ENHANCED EXTENDED DETENTION DRY POND 20% 50% 60% CBP Established Efficiencies - Dry Extended Detention Ponds 6.15 21% Yes 4.65 1.68 948.66
FIELDS OF WOODLAWN (MV) 5/16/2011 ENHANCED EXTENDED DETENTION DRY POND 20% 50% 60% CBP Established Efficiencies - Dry Extended Detention Ponds 2.10 37% Yes 2.53 0.92 515.20
FIELDS OF WOODLAWN (MV) 5/16/2011 ENHANCED EXTENDED DETENTION DRY POND 20% 50% 60% CBP Established Efficiencies - Dry Extended Detention Ponds 2.16 37% Yes 2.60 0.94 529.92
MORI STREET SUBDIVISION (DR) 1/21/2010 OTHER APPROVED DETENTION FACILITY 0% 0% 0% No Credit 2.84 42% No - - -
HAMPTON RESERVE (FORMERLY PASH PROPERTY) (SP) 2/8/2012 ENHANCED EXTENDED DETENTION DRY POND 20% 50% 60% CBP Established Efficiencies - Dry Extended Detention Ponds 8.43 20% No - - -
HAMPTON RESERVE (FORMERLY PASH PROPERTY) (SP) 2/8/2012 ENHANCED EXTENDED DETENTION DRY POND 20% 50% 60% CBP Established Efficiencies - Dry Extended Detention Ponds 8.85 20% No - - -
MCDONALDS - 7614 RICHMOND HIGHWAY (LE) 10/19/2012 BIORETENTION BASIN 42% 52% 56% CBP Retrofit Curves - RR; 0.5" Runoff Depth per Fairfax County PFM 0.09 78% Yes 0.45 0.08 40.27
MCDONALDS - 7614 RICHMOND HIGHWAY (LE) 10/19/2012 BIORETENTION BASIN 42% 52% 56% CBP Retrofit Curves - RR; 0.5" Runoff Depth per Fairfax County PFM 0.15 73% Yes 0.71 0.13 63.53
MCDONALDS - 7614 RICHMOND HIGHWAY (LE) 10/19/2012 VEGETATED SWALE WITHOUT CHECK DAMS 70% 75% 80% CBP Established Efficiencies - Bioswale 0.10 65% Yes 0.70 0.11 54.36
ESKRIDGE ROAD (PR) 6/29/2010 UNDERGROUND DETENTION STRUCTURE 0% 0% 0% No Credit 0.62 69% No - - -
MERRIFIELD TOWN CENTRE NAI THEATRE (PR) 4/8/2010 UNDERGROUND DETENTION VAULT 0% 0% 0% No Credit 16.59 66% No - - -
MERRIFIELD TOWN CENTER PCL A AND D (PR) 5/17/2011 FILTERING STRUCTURE - STORMFILTER (TM) 26% 50% 52%
Fairfax County Public Facilties Manual for TP; CBP Retrofit Curves - ST
for TN and TSS; 0.5" Runoff Depth per DEQ Guidance 10.23 90% No - - -
MERRIFIELD TOWN CENTER PCL A AND D (PR) 5/17/2011 UNDERGROUND DETENTION VAULT 0% 0% 0% No Credit 10.23 90% No - - -
LEE DISTRICT PARK FAMILY REC AREA + TREE HOUSE PRO 3/16/2010 UNDERGROUND DETENTION VAULT 0% 0% 0% No Credit 0.66 58% No - - -
LEE DISTRICT PARK FAMILY REC AREA + TREE HOUSE PRO 3/16/2010 UNDERGROUND DETENTION VAULT (RESIDENTIAL) 0% 0% 0% No Credit 3.44 58% No - - -
LEE DISTRICT PARK FAMILY REC AREA + TREE HOUSE PRO 3/16/2010 UNDERGROUND DETENTION VAULT (RESIDENTIAL) 0% 0% 0% No Credit 4.10 58% No - - -
LACEY CENTER (MA) 6/24/2010 MANUFACTURED UNDERGROUND DETENTION - OTHER 0% 0% 0% No Credit 1.47 37% Yes - - -
SOUTH COUNTY MIDDLE SCHOOL (MV) 12/4/2009 ENHANCED EXTENDED DETENTION DRY POND 20% 50% 60% CBP Established Efficiencies - Dry Extended Detention Ponds - N/A Yes - - -
SOUTH COUNTY MIDDLE SCHOOL (MV) 12/4/2009 UNDERGROUND DETENTION VAULT 0% 0% 0% No Credit - N/A Yes - - -
LAUREL HILL EQUESTRIAN CENTER PHASE 1 (MV) 9/23/2011 EXTENDED DETENTION DRY POND 20% 40% 60%
Fairfax County Public Facilties Manual for TP; CBP Established
Efficiencies for TN and TSS - Dry Extended Detention Ponds 8.45 42% Yes 11.44 3.32 2,334.24
SAFEWAY #2883 WILLSTON II SHOPPING CENTER (MA) 11/20/2009 FILTERING STRUCTURE - STORMFILTER (TM) 26% 50% 52%
Fairfax County Public Facilties Manual for TP; CBP Retrofit Curves - ST
for TN and TSS; 0.5" Runoff Depth per DEQ Guidance 2.15 100% Yes 8.36 2.33 1,137.21
LEE HIGHWAY AND NUTLEY STREET (PR) 11/23/2009 ENHANCED EXTENDED DETENTION DRY POND 20% 50% 60% CBP Established Efficiencies - Dry Extended Detention Ponds 0.19 896% Yes 4.85 1.76 988.46
LEE HIGHWAY AND NUTLEY STREET (PR) 11/23/2009 FILTERING STRUCTURE - STORMFILTER (TM) 26% 50% 52%
Fairfax County Public Facilties Manual for TP; CBP Retrofit Curves - ST
for TN and TSS; 0.5" Runoff Depth per DEQ Guidance 2.04 83% Yes 6.68 1.86 908.66
PROGRESSIVE INSURANCE (MA) 7/19/2011 EXTENDED DETENTION DRY POND 20% 40% 60%
Fairfax County Public Facilties Manual for TP; CBP Established
Efficiencies for TN and TSS - Dry Extended Detention Ponds 2.00 50% No - - -
MCLEAN KOREAN PRESBYTERIAN CHURCH (DR) 10/5/2011 INFILTRATION TRENCH - DESIGN 1 80% 85% 95% CBP Established Efficiencies - Infiltration Practices w/o Sand, Veg. 2.86 55% Yes 19.49 3.00 1,574.12
LONGFELLOW MIDDLE SCHOOL (DR) 11/12/2009 FILTERING STRUCTURE - FILTERRA (TM) 26% 55% 52%
VA BMP Clearinghouse for TP; CBP Retrofit Curves - ST for TN and
TSS; 0.5" Runoff Depth per DEQ Guidance 0.35 80% Yes - - -
LONGFELLOW MIDDLE SCHOOL (DR) 11/12/2009 FILTERING STRUCTURE - FILTERRA (TM) 26% 55% 52%
VA BMP Clearinghouse for TP; CBP Retrofit Curves - ST for TN and
TSS; 0.5" Runoff Depth per DEQ Guidance 0.38 79% Yes 1.18 0.36 160.91
LONGFELLOW MIDDLE SCHOOL (DR) 11/12/2009 UNDERGROUND DETENTION STRUCTURE 0% 0% 0% No Credit - N/A Yes - - -
SHELL OIL PARK LOT 2 (MA) 2/10/2011 FILTERING STRUCTURE - STORMFILTER (TM) 26% 50% 52%
Fairfax County Public Facilties Manual for TP; CBP Retrofit Curves - ST
for TN and TSS; 0.5" Runoff Depth per DEQ Guidance - N/A Yes - - -
WEST OX ANIMAL SHELTER (SP) 6/25/2010 REGIONAL POND - DRY POND 5% 50% 10%
Fairfax County Public Facilties Manual for TP; CBP Established
Efficiencies - Dry Detention Ponds and Hydrodynamic Structures for TN
and TSS 0.30 67% Yes 0.15 0.22 20.99
WEST OX ANIMAL SHELTER (SP) 6/25/2010 REGIONAL POND - DRY POND 5% 50% 10%
Fairfax County Public Facilties Manual for TP; CBP Established
Efficiencies - Dry Detention Ponds and Hydrodynamic Structures for TN
and TSS 3.75 67% Yes 2.16 3.12 293.10
EKKLESIA CHURCH (SU) 6/14/2011 EXTENDED DETENTION DRY POND 20% 40% 60%
Fairfax County Public Facilties Manual for TP; CBP Established
Efficiencies for TN and TSS - Dry Extended Detention Ponds 3.76 76% No - - -
FAIRFIELD MANOR (PR) 3/1/2012 BIORETENTION BASIN/FILTER LEVEL 2 57% 70% 75% CBP Retrofit Curves - RR; 1" Runoff Depth per Fairfax County PFM 1.89 39% No - - -
FAIRFIELD MANOR (PR) 3/1/2012 BIORETENTION BASIN/FILTER LEVEL 2 57% 70% 75% CBP Retrofit Curves - RR; 1" Runoff Depth per Fairfax County PFM 1.29 33% No - - -
PRESERVE AT SCOTTS RUN (DR) 8/11/2011 BIORETENTION BASIN/FILTER LEVEL 2 57% 70% 75% CBP Retrofit Curves - RR; 1" Runoff Depth per Fairfax County PFM - N/A No - - -
PRESERVE AT SCOTTS RUN (DR) 8/11/2011 EXTENDED DETENTION DRY POND 20% 40% 60%
Fairfax County Public Facilties Manual for TP; CBP Established
Efficiencies for TN and TSS - Dry Extended Detention Ponds - N/A No - - -
MERRIFIELD GARDEN CENTER (PR) 6/14/2011 OTHER APPROVED BMP FACILITY 0% 0% 0% No Credit 3.82 11% Yes - - -
MERRIFIELD GARDEN CENTER (PR) 6/14/2011 OTHER APPROVED DETENTION FACILITY 0% 0% 0% No Credit 1.55 11% Yes - - -
MERRIFIELD GARDEN CENTER (PR) 6/14/2011 OTHER APPROVED DETENTION FACILITY 0% 0% 0% No Credit 2.50 11% Yes - - -
GEORGE C MARSHALL HIGH SCHOOL (PR) 5/2/2011 BIORETENTION BASIN/FILTER LEVEL 2 57% 70% 75% CBP Retrofit Curves - RR; 1" Runoff Depth per Fairfax County PFM 1.22 82% Yes 8.61 1.53 770.13
GEORGE C MARSHALL HIGH SCHOOL (PR) 5/2/2011 BIORETENTION BASIN/FILTER LEVEL 2 57% 70% 75% CBP Retrofit Curves - RR; 1" Runoff Depth per Fairfax County PFM 0.86 87% Yes 6.43 1.14 575.39
GEORGE C MARSHALL HIGH SCHOOL (PR) 5/2/2011 BIORETENTION BASIN/FILTER LEVEL 2 57% 70% 75% CBP Retrofit Curves - RR; 1" Runoff Depth per Fairfax County PFM 0.36 64% Yes 2.02 0.36 180.31
GEORGE C MARSHALL HIGH SCHOOL (PR) 5/2/2011 BIORETENTION BASIN/FILTER LEVEL 2 57% 70% 75% CBP Retrofit Curves - RR; 1" Runoff Depth per Fairfax County PFM 0.15 100% Yes 1.28 0.23 114.20
GEORGE C MARSHALL HIGH SCHOOL (PR) 5/2/2011 POROUS ASPHALT PAVEMENT WITH EXTENDED AGGREGATE BASE 42% 52% 56%
CBP Established Efficiencies - Permeable Pavement w/o Sand, Veg.
C/D soils, underdrain 0.21 100% Yes 1.33 0.24 119.01
GEORGE C MARSHALL HIGH SCHOOL (PR) 5/2/2011 FILTERING STRUCTURE - FILTERRA (TM) 26% 55% 52%
VA BMP Clearinghouse for TP; CBP Retrofit Curves - ST for TN and
TSS; 0.5" Runoff Depth per DEQ Guidance 0.27 93% Yes 0.98 0.30 132.79
GEORGE C MARSHALL HIGH SCHOOL (PR) 5/2/2011 FILTERING STRUCTURE - FILTERRA (TM) 26% 55% 52%
VA BMP Clearinghouse for TP; CBP Retrofit Curves - ST for TN and
TSS; 0.5" Runoff Depth per DEQ Guidance 0.18 83% Yes 0.59 0.18 80.18
GEORGE C MARSHALL HIGH SCHOOL (PR) 5/2/2011 FILTERING STRUCTURE - FILTERRA (TM) 26% 55% 52%
VA BMP Clearinghouse for TP; CBP Retrofit Curves - ST for TN and
TSS; 0.5" Runoff Depth per DEQ Guidance 0.07 74% Yes 0.21 0.06 28.01
GEORGE C MARSHALL HIGH SCHOOL (PR) 5/2/2011 FILTERING STRUCTURE - FILTERRA (TM) 26% 55% 52%
VA BMP Clearinghouse for TP; CBP Retrofit Curves - ST for TN and
TSS; 0.5" Runoff Depth per DEQ Guidance 0.16 92% Yes 0.57 0.18 78.12
Total Area
Treated Treated Area I %
>0.05% of parcel in
MS4 Regulated Area
POC Reduction (lb/yr)Project Name Date Approved Facility Type
EfficiencyEfficiency Source
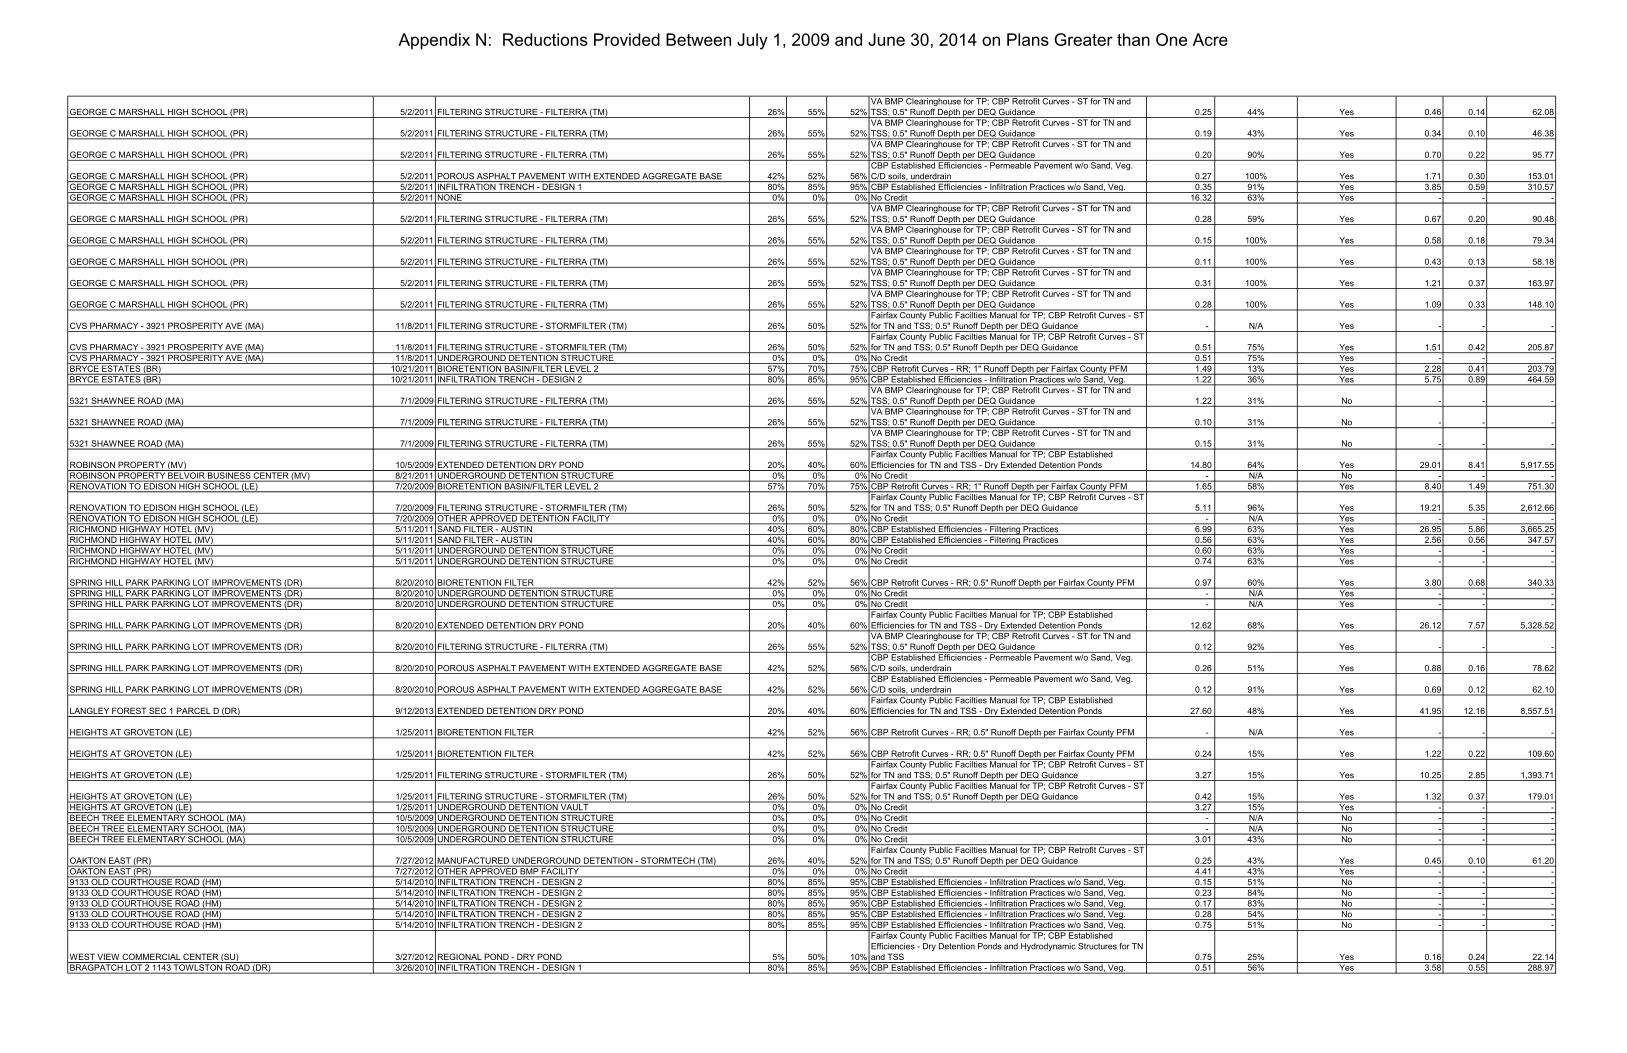
Appendix N: Reductions Provided Between July 1, 2009 and June 30, 2014 on Plans Greater than One Acre
GEORGE C MARSHALL HIGH SCHOOL (PR) 5/2/2011 FILTERING STRUCTURE - FILTERRA (TM) 26% 55% 52%
VA BMP Clearinghouse for TP; CBP Retrofit Curves - ST for TN and
TSS; 0.5" Runoff Depth per DEQ Guidance 0.25 44% Yes 0.46 0.14 62.08
GEORGE C MARSHALL HIGH SCHOOL (PR) 5/2/2011 FILTERING STRUCTURE - FILTERRA (TM) 26% 55% 52%
VA BMP Clearinghouse for TP; CBP Retrofit Curves - ST for TN and
TSS; 0.5" Runoff Depth per DEQ Guidance 0.19 43% Yes 0.34 0.10 46.38
GEORGE C MARSHALL HIGH SCHOOL (PR) 5/2/2011 FILTERING STRUCTURE - FILTERRA (TM) 26% 55% 52%
VA BMP Clearinghouse for TP; CBP Retrofit Curves - ST for TN and
TSS; 0.5" Runoff Depth per DEQ Guidance 0.20 90% Yes 0.70 0.22 95.77
GEORGE C MARSHALL HIGH SCHOOL (PR) 5/2/2011 POROUS ASPHALT PAVEMENT WITH EXTENDED AGGREGATE BASE 42% 52% 56%
CBP Established Efficiencies - Permeable Pavement w/o Sand, Veg.
C/D soils, underdrain 0.27 100% Yes 1.71 0.30 153.01
GEORGE C MARSHALL HIGH SCHOOL (PR) 5/2/2011 INFILTRATION TRENCH - DESIGN 1 80% 85% 95% CBP Established Efficiencies - Infiltration Practices w/o Sand, Veg. 0.35 91% Yes 3.85 0.59 310.57
GEORGE C MARSHALL HIGH SCHOOL (PR) 5/2/2011 NONE 0% 0% 0% No Credit 16.32 63% Yes - - -
GEORGE C MARSHALL HIGH SCHOOL (PR) 5/2/2011 FILTERING STRUCTURE - FILTERRA (TM) 26% 55% 52%
VA BMP Clearinghouse for TP; CBP Retrofit Curves - ST for TN and
TSS; 0.5" Runoff Depth per DEQ Guidance 0.28 59% Yes 0.67 0.20 90.48
GEORGE C MARSHALL HIGH SCHOOL (PR) 5/2/2011 FILTERING STRUCTURE - FILTERRA (TM) 26% 55% 52%
VA BMP Clearinghouse for TP; CBP Retrofit Curves - ST for TN and
TSS; 0.5" Runoff Depth per DEQ Guidance 0.15 100% Yes 0.58 0.18 79.34
GEORGE C MARSHALL HIGH SCHOOL (PR) 5/2/2011 FILTERING STRUCTURE - FILTERRA (TM) 26% 55% 52%
VA BMP Clearinghouse for TP; CBP Retrofit Curves - ST for TN and
TSS; 0.5" Runoff Depth per DEQ Guidance 0.11 100% Yes 0.43 0.13 58.18
GEORGE C MARSHALL HIGH SCHOOL (PR) 5/2/2011 FILTERING STRUCTURE - FILTERRA (TM) 26% 55% 52%
VA BMP Clearinghouse for TP; CBP Retrofit Curves - ST for TN and
TSS; 0.5" Runoff Depth per DEQ Guidance 0.31 100% Yes 1.21 0.37 163.97
GEORGE C MARSHALL HIGH SCHOOL (PR) 5/2/2011 FILTERING STRUCTURE - FILTERRA (TM) 26% 55% 52%
VA BMP Clearinghouse for TP; CBP Retrofit Curves - ST for TN and
TSS; 0.5" Runoff Depth per DEQ Guidance 0.28 100% Yes 1.09 0.33 148.10
CVS PHARMACY - 3921 PROSPERITY AVE (MA) 11/8/2011 FILTERING STRUCTURE - STORMFILTER (TM) 26% 50% 52%
Fairfax County Public Facilties Manual for TP; CBP Retrofit Curves - ST
for TN and TSS; 0.5" Runoff Depth per DEQ Guidance - N/A Yes - - -
CVS PHARMACY - 3921 PROSPERITY AVE (MA) 11/8/2011 FILTERING STRUCTURE - STORMFILTER (TM) 26% 50% 52%
Fairfax County Public Facilties Manual for TP; CBP Retrofit Curves - ST
for TN and TSS; 0.5" Runoff Depth per DEQ Guidance 0.51 75% Yes 1.51 0.42 205.87
CVS PHARMACY - 3921 PROSPERITY AVE (MA) 11/8/2011 UNDERGROUND DETENTION STRUCTURE 0% 0% 0% No Credit 0.51 75% Yes - - -
BRYCE ESTATES (BR) 10/21/2011 BIORETENTION BASIN/FILTER LEVEL 2 57% 70% 75% CBP Retrofit Curves - RR; 1" Runoff Depth per Fairfax County PFM 1.49 13% Yes 2.28 0.41 203.79
BRYCE ESTATES (BR) 10/21/2011 INFILTRATION TRENCH - DESIGN 2 80% 85% 95% CBP Established Efficiencies - Infiltration Practices w/o Sand, Veg. 1.22 36% Yes 5.75 0.89 464.59
5321 SHAWNEE ROAD (MA) 7/1/2009 FILTERING STRUCTURE - FILTERRA (TM) 26% 55% 52%
VA BMP Clearinghouse for TP; CBP Retrofit Curves - ST for TN and
TSS; 0.5" Runoff Depth per DEQ Guidance 1.22 31% No - - -
5321 SHAWNEE ROAD (MA) 7/1/2009 FILTERING STRUCTURE - FILTERRA (TM) 26% 55% 52%
VA BMP Clearinghouse for TP; CBP Retrofit Curves - ST for TN and
TSS; 0.5" Runoff Depth per DEQ Guidance 0.10 31% No - - -
5321 SHAWNEE ROAD (MA) 7/1/2009 FILTERING STRUCTURE - FILTERRA (TM) 26% 55% 52%
VA BMP Clearinghouse for TP; CBP Retrofit Curves - ST for TN and
TSS; 0.5" Runoff Depth per DEQ Guidance 0.15 31% No - - -
ROBINSON PROPERTY (MV) 10/5/2009 EXTENDED DETENTION DRY POND 20% 40% 60%
Fairfax County Public Facilties Manual for TP; CBP Established
Efficiencies for TN and TSS - Dry Extended Detention Ponds 14.80 64% Yes 29.01 8.41 5,917.55
ROBINSON PROPERTY BELVOIR BUSINESS CENTER (MV) 8/21/2011 UNDERGROUND DETENTION STRUCTURE 0% 0% 0% No Credit - N/A No - - -
RENOVATION TO EDISON HIGH SCHOOL (LE) 7/20/2009 BIORETENTION BASIN/FILTER LEVEL 2 57% 70% 75% CBP Retrofit Curves - RR; 1" Runoff Depth per Fairfax County PFM 1.65 58% Yes 8.40 1.49 751.30
RENOVATION TO EDISON HIGH SCHOOL (LE) 7/20/2009 FILTERING STRUCTURE - STORMFILTER (TM) 26% 50% 52%
Fairfax County Public Facilties Manual for TP; CBP Retrofit Curves - ST
for TN and TSS; 0.5" Runoff Depth per DEQ Guidance 5.11 96% Yes 19.21 5.35 2,612.66
RENOVATION TO EDISON HIGH SCHOOL (LE) 7/20/2009 OTHER APPROVED DETENTION FACILITY 0% 0% 0% No Credit - N/A Yes - - -
RICHMOND HIGHWAY HOTEL (MV) 5/11/2011 SAND FILTER - AUSTIN 40% 60% 80% CBP Established Efficiencies - Filtering Practices 6.99 63% Yes 26.95 5.86 3,665.25
RICHMOND HIGHWAY HOTEL (MV) 5/11/2011 SAND FILTER - AUSTIN 40% 60% 80% CBP Established Efficiencies - Filtering Practices 0.56 63% Yes 2.56 0.56 347.57
RICHMOND HIGHWAY HOTEL (MV) 5/11/2011 UNDERGROUND DETENTION STRUCTURE 0% 0% 0% No Credit 0.60 63% Yes - - -
RICHMOND HIGHWAY HOTEL (MV) 5/11/2011 UNDERGROUND DETENTION STRUCTURE 0% 0% 0% No Credit 0.74 63% Yes - - -
SPRING HILL PARK PARKING LOT IMPROVEMENTS (DR) 8/20/2010 BIORETENTION FILTER 42% 52% 56% CBP Retrofit Curves - RR; 0.5" Runoff Depth per Fairfax County PFM 0.97 60% Yes 3.80 0.68 340.33
SPRING HILL PARK PARKING LOT IMPROVEMENTS (DR) 8/20/2010 UNDERGROUND DETENTION STRUCTURE 0% 0% 0% No Credit - N/A Yes - - -
SPRING HILL PARK PARKING LOT IMPROVEMENTS (DR) 8/20/2010 UNDERGROUND DETENTION STRUCTURE 0% 0% 0% No Credit - N/A Yes - - -
SPRING HILL PARK PARKING LOT IMPROVEMENTS (DR) 8/20/2010 EXTENDED DETENTION DRY POND 20% 40% 60%
Fairfax County Public Facilties Manual for TP; CBP Established
Efficiencies for TN and TSS - Dry Extended Detention Ponds 12.62 68% Yes 26.12 7.57 5,328.52
SPRING HILL PARK PARKING LOT IMPROVEMENTS (DR) 8/20/2010 FILTERING STRUCTURE - FILTERRA (TM) 26% 55% 52%
VA BMP Clearinghouse for TP; CBP Retrofit Curves - ST for TN and
TSS; 0.5" Runoff Depth per DEQ Guidance 0.12 92% Yes - - -
SPRING HILL PARK PARKING LOT IMPROVEMENTS (DR) 8/20/2010 POROUS ASPHALT PAVEMENT WITH EXTENDED AGGREGATE BASE 42% 52% 56%
CBP Established Efficiencies - Permeable Pavement w/o Sand, Veg.
C/D soils, underdrain 0.26 51% Yes 0.88 0.16 78.62
SPRING HILL PARK PARKING LOT IMPROVEMENTS (DR) 8/20/2010 POROUS ASPHALT PAVEMENT WITH EXTENDED AGGREGATE BASE 42% 52% 56%
CBP Established Efficiencies - Permeable Pavement w/o Sand, Veg.
C/D soils, underdrain 0.12 91% Yes 0.69 0.12 62.10
LANGLEY FOREST SEC 1 PARCEL D (DR) 9/12/2013 EXTENDED DETENTION DRY POND 20% 40% 60%
Fairfax County Public Facilties Manual for TP; CBP Established
Efficiencies for TN and TSS - Dry Extended Detention Ponds 27.60 48% Yes 41.95 12.16 8,557.51
HEIGHTS AT GROVETON (LE) 1/25/2011 BIORETENTION FILTER 42% 52% 56% CBP Retrofit Curves - RR; 0.5" Runoff Depth per Fairfax County PFM - N/A Yes - - -
HEIGHTS AT GROVETON (LE) 1/25/2011 BIORETENTION FILTER 42% 52% 56% CBP Retrofit Curves - RR; 0.5" Runoff Depth per Fairfax County PFM 0.24 15% Yes 1.22 0.22 109.60
HEIGHTS AT GROVETON (LE) 1/25/2011 FILTERING STRUCTURE - STORMFILTER (TM) 26% 50% 52%
Fairfax County Public Facilties Manual for TP; CBP Retrofit Curves - ST
for TN and TSS; 0.5" Runoff Depth per DEQ Guidance 3.27 15% Yes 10.25 2.85 1,393.71
HEIGHTS AT GROVETON (LE) 1/25/2011 FILTERING STRUCTURE - STORMFILTER (TM) 26% 50% 52%
Fairfax County Public Facilties Manual for TP; CBP Retrofit Curves - ST
for TN and TSS; 0.5" Runoff Depth per DEQ Guidance 0.42 15% Yes 1.32 0.37 179.01
HEIGHTS AT GROVETON (LE) 1/25/2011 UNDERGROUND DETENTION VAULT 0% 0% 0% No Credit 3.27 15% Yes - - -
BEECH TREE ELEMENTARY SCHOOL (MA) 10/5/2009 UNDERGROUND DETENTION STRUCTURE 0% 0% 0% No Credit - N/A No - - -
BEECH TREE ELEMENTARY SCHOOL (MA) 10/5/2009 UNDERGROUND DETENTION STRUCTURE 0% 0% 0% No Credit - N/A No - - -
BEECH TREE ELEMENTARY SCHOOL (MA) 10/5/2009 UNDERGROUND DETENTION STRUCTURE 0% 0% 0% No Credit 3.01 43% No - - -
OAKTON EAST (PR) 7/27/2012 MANUFACTURED UNDERGROUND DETENTION - STORMTECH (TM) 26% 40% 52%
Fairfax County Public Facilties Manual for TP; CBP Retrofit Curves - ST
for TN and TSS; 0.5" Runoff Depth per DEQ Guidance 0.25 43% Yes 0.45 0.10 61.20
OAKTON EAST (PR) 7/27/2012 OTHER APPROVED BMP FACILITY 0% 0% 0% No Credit 4.41 43% Yes - - -
9133 OLD COURTHOUSE ROAD (HM) 5/14/2010 INFILTRATION TRENCH - DESIGN 2 80% 85% 95% CBP Established Efficiencies - Infiltration Practices w/o Sand, Veg. 0.15 51% No - - -
9133 OLD COURTHOUSE ROAD (HM) 5/14/2010 INFILTRATION TRENCH - DESIGN 2 80% 85% 95% CBP Established Efficiencies - Infiltration Practices w/o Sand, Veg. 0.23 84% No - - -
9133 OLD COURTHOUSE ROAD (HM) 5/14/2010 INFILTRATION TRENCH - DESIGN 2 80% 85% 95% CBP Established Efficiencies - Infiltration Practices w/o Sand, Veg. 0.17 83% No - - -
9133 OLD COURTHOUSE ROAD (HM) 5/14/2010 INFILTRATION TRENCH - DESIGN 2 80% 85% 95% CBP Established Efficiencies - Infiltration Practices w/o Sand, Veg. 0.28 54% No - - -
9133 OLD COURTHOUSE ROAD (HM) 5/14/2010 INFILTRATION TRENCH - DESIGN 2 80% 85% 95% CBP Established Efficiencies - Infiltration Practices w/o Sand, Veg. 0.75 51% No - - -
WEST VIEW COMMERCIAL CENTER (SU) 3/27/2012 REGIONAL POND - DRY POND 5% 50% 10%
Fairfax County Public Facilties Manual for TP; CBP Established
Efficiencies - Dry Detention Ponds and Hydrodynamic Structures for TN
and TSS 0.75 25% Yes 0.16 0.24 22.14
BRAGPATCH LOT 2 1143 TOWLSTON ROAD (DR) 3/26/2010 INFILTRATION TRENCH - DESIGN 1 80% 85% 95% CBP Established Efficiencies - Infiltration Practices w/o Sand, Veg. 0.51 56% Yes 3.58 0.55 288.97

Appendix N: Reductions Provided Between July 1, 2009 and June 30, 2014 on Plans Greater than One Acre
BRAGPATCH LOT 2 1143 TOWLSTON ROAD (DR) 3/26/2010 INFILTRATION TRENCH - DESIGN 1 80% 85% 95% CBP Established Efficiencies - Infiltration Practices w/o Sand, Veg. 0.83 35% Yes 3.75 0.58 302.70
ELIZABETH CROSSING (MA) 3/11/2011 BIORETENTION BASIN/FILTER LEVEL 2 57% 70% 75% CBP Retrofit Curves - RR; 1" Runoff Depth per Fairfax County PFM 1.77 37% No - - -
ELIZABETH CROSSING (MA) 3/11/2011 BIORETENTION BASIN/FILTER LEVEL 2 57% 70% 75% CBP Retrofit Curves - RR; 1" Runoff Depth per Fairfax County PFM 1.41 48% No - - -
FOSTERS CREST (LE) 8/2/2011 ENHANCED EXTENDED DETENTION DRY POND 20% 50% 60% CBP Established Efficiencies - Dry Extended Detention Ponds 5.47 54% Yes 9.16 3.32 1,868.74
DOLLEY MADISON LIBRARY (DR) 3/9/2010 BIORETENTION FILTER 42% 52% 56% CBP Retrofit Curves - RR; 0.5" Runoff Depth per Fairfax County PFM 0.13 77% Yes 0.64 0.11 57.57
DOLLEY MADISON LIBRARY (DR) 3/9/2010 BIORETENTION FILTER 42% 52% 56% CBP Retrofit Curves - RR; 0.5" Runoff Depth per Fairfax County PFM 0.11 91% Yes 0.64 0.11 56.97
DOLLEY MADISON LIBRARY (DR) 3/9/2010 BIORETENTION FILTER 42% 52% 56% CBP Retrofit Curves - RR; 0.5" Runoff Depth per Fairfax County PFM 0.33 30% Yes 0.71 0.13 63.53
DOLLEY MADISON LIBRARY (DR) 3/9/2010 BIORETENTION FILTER 42% 52% 56% CBP Retrofit Curves - RR; 0.5" Runoff Depth per Fairfax County PFM 0.27 85% Yes 1.47 0.26 131.54
DOLLEY MADISON LIBRARY (DR) 3/9/2010 POROUS ASPHALT PAVEMENT WITH EXTENDED AGGREGATE BASE 42% 52% 56%
CBP Established Efficiencies - Permeable Pavement w/o Sand, Veg.
C/D soils, underdrain 0.09 44% Yes 0.27 0.05 24.16
DOLLEY MADISON LIBRARY (DR) 3/9/2010 POROUS ASPHALT PAVEMENT WITH EXTENDED AGGREGATE BASE 42% 52% 56%
CBP Established Efficiencies - Permeable Pavement w/o Sand, Veg.
C/D soils, underdrain 0.07 71% Yes 0.32 0.06 28.93
DOLLEY MADISON LIBRARY (DR) 3/9/2010 POROUS ASPHALT PAVEMENT WITH EXTENDED AGGREGATE BASE 42% 52% 56%
CBP Established Efficiencies - Permeable Pavement w/o Sand, Veg.
C/D soils, underdrain 0.21 24% Yes 0.37 0.07 33.11
DOLLEY MADISON LIBRARY (DR) 3/9/2010 REFORESTATION 0% 0% 0% No Credit 0.17 0% Yes - - -
DOLLEY MADISON LIBRARY (DR) 3/9/2010 VEGETATED ROOF - EXTENSIVE 0% 40% 0% Fairfax County Public Facilties Manual for TP 0.11 100% Yes - 0.10 -
DOLLEY MADISON LIBRARY (DR) 3/9/2010 POROUS ASPHALT PAVEMENT WITH EXTENDED AGGREGATE BASE 42% 52% 56%
CBP Established Efficiencies - Permeable Pavement w/o Sand, Veg.
C/D soils, underdrain 0.09 56% Yes - - -
DOLLEY MADISON LIBRARY (DR) 3/9/2010 VEGETATED SWALE WITHOUT CHECK DAMS 70% 75% 80% CBP Established Efficiencies - Bioswale - N/A Yes - - -
HALSTEAD MIXED USE DEVELOPMENT PHASE B (PR) 5/13/2010 FILTERING STRUCTURE - FILTERRA (TM) 26% 55% 52%
VA BMP Clearinghouse for TP; CBP Retrofit Curves - ST for TN and
TSS; 0.5" Runoff Depth per DEQ Guidance - N/A Yes - - -
HALSTEAD MIXED USE DEVELOPMENT PHASE B (PR) 5/13/2010 FILTERING STRUCTURE - FILTERRA (TM) 26% 55% 52%
VA BMP Clearinghouse for TP; CBP Retrofit Curves - ST for TN and
TSS; 0.5" Runoff Depth per DEQ Guidance 0.20 78% Yes 0.64 0.19 86.44
HALSTEAD MIXED USE DEVELOPMENT PHASE B (PR) 5/13/2010 FILTERING STRUCTURE - STORMFILTER (TM) 26% 50% 52%
Fairfax County Public Facilties Manual for TP; CBP Retrofit Curves - ST
for TN and TSS; 0.5" Runoff Depth per DEQ Guidance 0.44 78% Yes 1.40 0.39 190.18
CHRIST CHURCH PHASE 1 (SP) 8/8/2013 EXTENDED DETENTION DRY POND 20% 40% 60%
Fairfax County Public Facilties Manual for TP; CBP Established
Efficiencies for TN and TSS - Dry Extended Detention Ponds - N/A No - - -
GOEPFERT PROPERTY (DR) 9/15/2009 ENHANCED EXTENDED DETENTION DRY POND 20% 50% 60% CBP Established Efficiencies - Dry Extended Detention Ponds 8.89 19% No - - -
6611 MALTA LANE (DR) 10/20/2010 INFILTRATION TRENCH - DESIGN 1 80% 85% 95% CBP Established Efficiencies - Infiltration Practices w/o Sand, Veg. 0.99 32% Yes 4.26 0.66 343.94
AUTOZONE STORE NO. 4912 (MV) 8/12/2010 HYDRODYNAMIC STRUCTURE - BAYSAVER (TM) 26% 20% 52%
VA BMP Clearinghouse for TP; CBP Retrofit Curves - ST for TN and
TSS; 0.5" Runoff Depth per DEQ Guidance - N/A No - - -
ARLINGTON BOULEVARD CONSOLDATION, BUILDING A (PR) 6/17/2010 REGIONAL POND - DRY POND 5% 50% 10%
Fairfax County Public Facilties Manual for TP; CBP Established
Efficiencies - Dry Detention Ponds and Hydrodynamic Structures for TN
and TSS 88.00 45% Yes 31.44 45.57 4,276.26
ARLINGTON BOULEVARD CONSOLDATION, BUILDING A (PR) 6/17/2010 SAND FILTER - D.C. 40% 60% 80% CBP Established Efficiencies - Filtering Practices 0.91 100% Yes 5.44 1.18 740.09
EMMA GRACE SUBDIVISION (SU) 4/15/2010 BIORETENTION BASIN/FILTER LEVEL 2 57% 70% 75% CBP Retrofit Curves - RR; 1" Runoff Depth per Fairfax County PFM 0.84 37% Yes - - -
MCLEAN PERSONAL STORAGE (DR) 11/18/2011 FILTERING STRUCTURE - FILTERRA (TM) 26% 55% 52%
VA BMP Clearinghouse for TP; CBP Retrofit Curves - ST for TN and
TSS; 0.5" Runoff Depth per DEQ Guidance 0.12 90% Yes 0.42 0.13 57.46
MCLEAN PERSONAL STORAGE (DR) 11/18/2011 FILTERING STRUCTURE - STORMFILTER (TM) 26% 50% 52%
Fairfax County Public Facilties Manual for TP; CBP Retrofit Curves - ST
for TN and TSS; 0.5" Runoff Depth per DEQ Guidance 0.39 100% Yes 1.52 0.42 206.28
WALMART STORE #2258 REMODEL (LE) 12/28/2009 EXTENDED DETENTION DRY POND 20% 40% 60%
Fairfax County Public Facilties Manual for TP; CBP Established
Efficiencies for TN and TSS - Dry Extended Detention Ponds 0.39 83% Yes 0.98 0.28 199.57
WALMART STORE #2258 REMODEL (LE) 12/28/2009 EXTENDED DETENTION DRY POND 20% 40% 60%
Fairfax County Public Facilties Manual for TP; CBP Established
Efficiencies for TN and TSS - Dry Extended Detention Ponds 6.88 83% Yes 16.81 4.87 3,429.25
COSTCO MOUNT VERNON (LE) 11/7/2012 BIORETENTION BASIN 42% 52% 56% CBP Retrofit Curves - RR; 0.5" Runoff Depth per Fairfax County PFM 8.31 81% Yes 43.01 7.66 3,848.34
COSTCO MOUNT VERNON (LE) 11/7/2012 BIORETENTION BASIN 42% 52% 56% CBP Retrofit Curves - RR; 0.5" Runoff Depth per Fairfax County PFM 0.43 81% Yes 2.23 0.40 199.13
COSTCO MOUNT VERNON (LE) 11/7/2012 FILTERING STRUCTURE - FILTERRA (TM) 26% 55% 52%
VA BMP Clearinghouse for TP; CBP Retrofit Curves - ST for TN and
TSS; 0.5" Runoff Depth per DEQ Guidance 0.43 81% Yes 1.37 0.42 185.86
COSTCO MOUNT VERNON (LE) 11/7/2012 FILTERING STRUCTURE - STORMFILTER (TM) 26% 50% 52%
Fairfax County Public Facilties Manual for TP; CBP Retrofit Curves - ST
for TN and TSS; 0.5" Runoff Depth per DEQ Guidance 0.66 81% Yes 2.10 0.58 285.27
COSTCO MOUNT VERNON (LE) 11/7/2012 UNDERGROUND DETENTION STRUCTURE 0% 0% 0% No Credit 2.69 81% Yes - - -
FALLS REST (PR) 7/8/2011 MANUFACTURED UNDERGROUND DETENTION - RAINSTORE (TM) 80% 85% 95% CBP Established Efficiencies - Infiltration Practices w/o Sand, Veg. 1.40 46% Yes 8.25 1.27 665.88
DOGWOOD POOL RENOVATION (HM) 3/8/2012 FILTERING STRUCTURE - FILTERRA (TM) 26% 55% 52%
VA BMP Clearinghouse for TP; CBP Retrofit Curves - ST for TN and
TSS; 0.5" Runoff Depth per DEQ Guidance 0.23 83% Yes 0.75 0.23 101.61
DOGWOOD POOL RENOVATION (HM) 3/8/2012 FILTERING STRUCTURE - FILTERRA (TM) 26% 55% 52%
VA BMP Clearinghouse for TP; CBP Retrofit Curves - ST for TN and
TSS; 0.5" Runoff Depth per DEQ Guidance 0.16 100% Yes 0.62 0.19 84.63
DOGWOOD POOL RENOVATION (HM) 3/8/2012 UNDERGROUND DETENTION VAULT 0% 0% 0% No Credit - N/A Yes - - -
RESTON STATION - SUNSET HILLS ROAD IMPROVEMENTS (H 6/1/2012 REGIONAL POND - DRY POND 5% 50% 10%
Fairfax County Public Facilties Manual for TP; CBP Established
Efficiencies - Dry Detention Ponds and Hydrodynamic Structures for TN
and TSS 2.96 22% Yes 0.59 0.85 79.70
RESTON STATION ROAD IMPROVEMENTS (HM) 3/26/2012 FILTERING STRUCTURE - STORMFILTER (TM) 26% 50% 52%
Fairfax County Public Facilties Manual for TP; CBP Retrofit Curves - ST
for TN and TSS; 0.5" Runoff Depth per DEQ Guidance 48.00 80% Yes 150.43 41.90 20,458.12
RESTON STATION ROAD IMPROVEMENTS (HM) 3/26/2012 FILTERING STRUCTURE - STORMFILTER (TM) 26% 50% 52%
Fairfax County Public Facilties Manual for TP; CBP Retrofit Curves - ST
for TN and TSS; 0.5" Runoff Depth per DEQ Guidance 0.96 80% Yes 2.92 0.81 396.66
RESTON STATION ROAD IMPROVEMENTS (HM) 3/26/2012 UNDERGROUND DETENTION VAULT 0% 0% 0% No Credit 4.21 80% Yes - - -
RESTON STATION ROAD IMPROVEMENTS (HM) 3/26/2012 UNDERGROUND DETENTION VAULT 0% 0% 0% No Credit 6.14 80% Yes - - -
ANDERSON PROPERTY LOT 24A AND 4A (HM) 12/13/2010 BIORETENTION FILTER 42% 52% 56% CBP Retrofit Curves - RR; 0.5" Runoff Depth per Fairfax County PFM 0.71 15% No - - -
ANDERSON PROPERTY LOT 24A AND 4A (HM) 12/13/2010 BIORETENTION FILTER 42% 52% 56% CBP Retrofit Curves - RR; 0.5" Runoff Depth per Fairfax County PFM 0.63 29% No - - -
ANDERSON PROPERTY LOT 24A AND 4A (HM) 12/13/2010 MANUFACTURED UNDERGROUND DETENTION - OTHER 0% 0% 0% No Credit - N/A No - - -
ANDERSON PROPERTY LOT 24A AND 4A (HM) 12/13/2010 MANUFACTURED UNDERGROUND DETENTION - OTHER 0% 0% 0% No Credit - N/A No - - -
ANDERSON PROPERTY LOT 24A AND 4A (HM) 12/13/2010 VEGETATED SWALE WITH CHECK DAMS 70% 75% 80% CBP Established Efficiencies - Bioswale 0.12 23% No - - -
ANDERSON PROPERTY LOT 24A AND 4A (HM) 12/13/2010 REFORESTATION 0% 0% 0% No Credit 1.44 0% No - - -
C.M.R.E.S.A. (PR) 8/28/2009 HYDRODYNAMIC STRUCTURE - VORTECHS (TM) 26% 20% 52%
VA BMP Clearinghouse for TP; CBP Retrofit Curves - ST for TN and
TSS; 0.5" Runoff Depth per DEQ Guidance 0.08 20% Yes 0.07 0.01 10.16
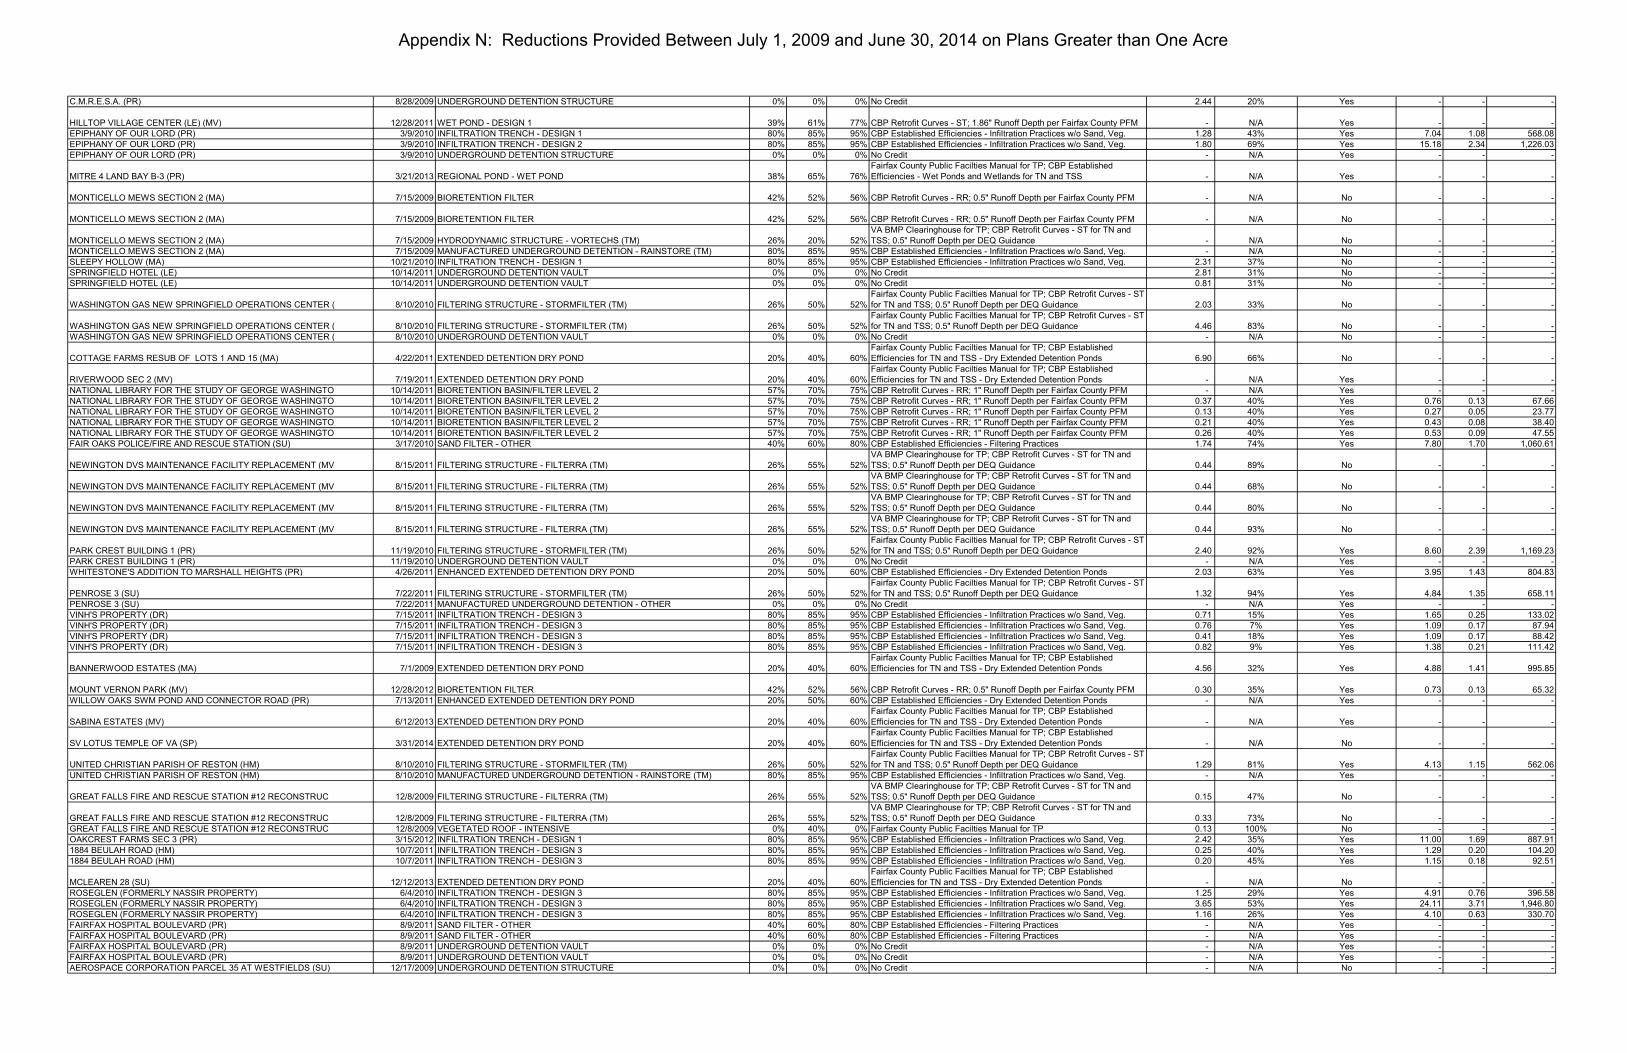
Appendix N: Reductions Provided Between July 1, 2009 and June 30, 2014 on Plans Greater than One Acre
C.M.R.E.S.A. (PR) 8/28/2009 UNDERGROUND DETENTION STRUCTURE 0% 0% 0% No Credit 2.44 20% Yes - - -
HILLTOP VILLAGE CENTER (LE) (MV) 12/28/2011 WET POND - DESIGN 1 39% 61% 77% CBP Retrofit Curves - ST; 1.86" Runoff Depth per Fairfax County PFM - N/A Yes - - -
EPIPHANY OF OUR LORD (PR) 3/9/2010 INFILTRATION TRENCH - DESIGN 1 80% 85% 95% CBP Established Efficiencies - Infiltration Practices w/o Sand, Veg. 1.28 43% Yes 7.04 1.08 568.08
EPIPHANY OF OUR LORD (PR) 3/9/2010 INFILTRATION TRENCH - DESIGN 2 80% 85% 95% CBP Established Efficiencies - Infiltration Practices w/o Sand, Veg. 1.80 69% Yes 15.18 2.34 1,226.03
EPIPHANY OF OUR LORD (PR) 3/9/2010 UNDERGROUND DETENTION STRUCTURE 0% 0% 0% No Credit - N/A Yes - - -
MITRE 4 LAND BAY B-3 (PR) 3/21/2013 REGIONAL POND - WET POND 38% 65% 76%
Fairfax County Public Facilties Manual for TP; CBP Established
Efficiencies - Wet Ponds and Wetlands for TN and TSS - N/A Yes - - -
MONTICELLO MEWS SECTION 2 (MA) 7/15/2009 BIORETENTION FILTER 42% 52% 56% CBP Retrofit Curves - RR; 0.5" Runoff Depth per Fairfax County PFM - N/A No - - -
MONTICELLO MEWS SECTION 2 (MA) 7/15/2009 BIORETENTION FILTER 42% 52% 56% CBP Retrofit Curves - RR; 0.5" Runoff Depth per Fairfax County PFM - N/A No - - -
MONTICELLO MEWS SECTION 2 (MA) 7/15/2009 HYDRODYNAMIC STRUCTURE - VORTECHS (TM) 26% 20% 52%
VA BMP Clearinghouse for TP; CBP Retrofit Curves - ST for TN and
TSS; 0.5" Runoff Depth per DEQ Guidance - N/A No - - -
MONTICELLO MEWS SECTION 2 (MA) 7/15/2009 MANUFACTURED UNDERGROUND DETENTION - RAINSTORE (TM) 80% 85% 95% CBP Established Efficiencies - Infiltration Practices w/o Sand, Veg. - N/A No - - -
SLEEPY HOLLOW (MA) 10/21/2010 INFILTRATION TRENCH - DESIGN 1 80% 85% 95% CBP Established Efficiencies - Infiltration Practices w/o Sand, Veg. 2.31 37% No - - -
SPRINGFIELD HOTEL (LE) 10/14/2011 UNDERGROUND DETENTION VAULT 0% 0% 0% No Credit 2.81 31% No - - -
SPRINGFIELD HOTEL (LE) 10/14/2011 UNDERGROUND DETENTION VAULT 0% 0% 0% No Credit 0.81 31% No - - -
WASHINGTON GAS NEW SPRINGFIELD OPERATIONS CENTER ( 8/10/2010 FILTERING STRUCTURE - STORMFILTER (TM) 26% 50% 52%
Fairfax County Public Facilties Manual for TP; CBP Retrofit Curves - ST
for TN and TSS; 0.5" Runoff Depth per DEQ Guidance 2.03 33% No - - -
WASHINGTON GAS NEW SPRINGFIELD OPERATIONS CENTER ( 8/10/2010 FILTERING STRUCTURE - STORMFILTER (TM) 26% 50% 52%
Fairfax County Public Facilties Manual for TP; CBP Retrofit Curves - ST
for TN and TSS; 0.5" Runoff Depth per DEQ Guidance 4.46 83% No - - -
WASHINGTON GAS NEW SPRINGFIELD OPERATIONS CENTER ( 8/10/2010 UNDERGROUND DETENTION VAULT 0% 0% 0% No Credit - N/A No - - -
COTTAGE FARMS RESUB OF LOTS 1 AND 15 (MA) 4/22/2011 EXTENDED DETENTION DRY POND 20% 40% 60%
Fairfax County Public Facilties Manual for TP; CBP Established
Efficiencies for TN and TSS - Dry Extended Detention Ponds 6.90 66% No - - -
RIVERWOOD SEC 2 (MV) 7/19/2011 EXTENDED DETENTION DRY POND 20% 40% 60%
Fairfax County Public Facilties Manual for TP; CBP Established
Efficiencies for TN and TSS - Dry Extended Detention Ponds - N/A Yes - - -
NATIONAL LIBRARY FOR THE STUDY OF GEORGE WASHINGTO 10/14/2011 BIORETENTION BASIN/FILTER LEVEL 2 57% 70% 75% CBP Retrofit Curves - RR; 1" Runoff Depth per Fairfax County PFM - N/A Yes - - -
NATIONAL LIBRARY FOR THE STUDY OF GEORGE WASHINGTO 10/14/2011 BIORETENTION BASIN/FILTER LEVEL 2 57% 70% 75% CBP Retrofit Curves - RR; 1" Runoff Depth per Fairfax County PFM 0.37 40% Yes 0.76 0.13 67.66
NATIONAL LIBRARY FOR THE STUDY OF GEORGE WASHINGTO 10/14/2011 BIORETENTION BASIN/FILTER LEVEL 2 57% 70% 75% CBP Retrofit Curves - RR; 1" Runoff Depth per Fairfax County PFM 0.13 40% Yes 0.27 0.05 23.77
NATIONAL LIBRARY FOR THE STUDY OF GEORGE WASHINGTO 10/14/2011 BIORETENTION BASIN/FILTER LEVEL 2 57% 70% 75% CBP Retrofit Curves - RR; 1" Runoff Depth per Fairfax County PFM 0.21 40% Yes 0.43 0.08 38.40
NATIONAL LIBRARY FOR THE STUDY OF GEORGE WASHINGTO 10/14/2011 BIORETENTION BASIN/FILTER LEVEL 2 57% 70% 75% CBP Retrofit Curves - RR; 1" Runoff Depth per Fairfax County PFM 0.26 40% Yes 0.53 0.09 47.55
FAIR OAKS POLICE/FIRE AND RESCUE STATION (SU) 3/17/2010 SAND FILTER - OTHER 40% 60% 80% CBP Established Efficiencies - Filtering Practices 1.74 74% Yes 7.80 1.70 1,060.61
NEWINGTON DVS MAINTENANCE FACILITY REPLACEMENT (MV 8/15/2011 FILTERING STRUCTURE - FILTERRA (TM) 26% 55% 52%
VA BMP Clearinghouse for TP; CBP Retrofit Curves - ST for TN and
TSS; 0.5" Runoff Depth per DEQ Guidance 0.44 89% No - - -
NEWINGTON DVS MAINTENANCE FACILITY REPLACEMENT (MV 8/15/2011 FILTERING STRUCTURE - FILTERRA (TM) 26% 55% 52%
VA BMP Clearinghouse for TP; CBP Retrofit Curves - ST for TN and
TSS; 0.5" Runoff Depth per DEQ Guidance 0.44 68% No - - -
NEWINGTON DVS MAINTENANCE FACILITY REPLACEMENT (MV 8/15/2011 FILTERING STRUCTURE - FILTERRA (TM) 26% 55% 52%
VA BMP Clearinghouse for TP; CBP Retrofit Curves - ST for TN and
TSS; 0.5" Runoff Depth per DEQ Guidance 0.44 80% No - - -
NEWINGTON DVS MAINTENANCE FACILITY REPLACEMENT (MV 8/15/2011 FILTERING STRUCTURE - FILTERRA (TM) 26% 55% 52%
VA BMP Clearinghouse for TP; CBP Retrofit Curves - ST for TN and
TSS; 0.5" Runoff Depth per DEQ Guidance 0.44 93% No - - -
PARK CREST BUILDING 1 (PR) 11/19/2010 FILTERING STRUCTURE - STORMFILTER (TM) 26% 50% 52%
Fairfax County Public Facilties Manual for TP; CBP Retrofit Curves - ST
for TN and TSS; 0.5" Runoff Depth per DEQ Guidance 2.40 92% Yes 8.60 2.39 1,169.23
PARK CREST BUILDING 1 (PR) 11/19/2010 UNDERGROUND DETENTION VAULT 0% 0% 0% No Credit - N/A Yes - - -
WHITESTONE'S ADDITION TO MARSHALL HEIGHTS (PR) 4/26/2011 ENHANCED EXTENDED DETENTION DRY POND 20% 50% 60% CBP Established Efficiencies - Dry Extended Detention Ponds 2.03 63% Yes 3.95 1.43 804.83
PENROSE 3 (SU) 7/22/2011 FILTERING STRUCTURE - STORMFILTER (TM) 26% 50% 52%
Fairfax County Public Facilties Manual for TP; CBP Retrofit Curves - ST
for TN and TSS; 0.5" Runoff Depth per DEQ Guidance 1.32 94% Yes 4.84 1.35 658.11
PENROSE 3 (SU) 7/22/2011 MANUFACTURED UNDERGROUND DETENTION - OTHER 0% 0% 0% No Credit - N/A Yes - - -
VINH'S PROPERTY (DR) 7/15/2011 INFILTRATION TRENCH - DESIGN 3 80% 85% 95% CBP Established Efficiencies - Infiltration Practices w/o Sand, Veg. 0.71 15% Yes 1.65 0.25 133.02
VINH'S PROPERTY (DR) 7/15/2011 INFILTRATION TRENCH - DESIGN 3 80% 85% 95% CBP Established Efficiencies - Infiltration Practices w/o Sand, Veg. 0.76 7% Yes 1.09 0.17 87.94
VINH'S PROPERTY (DR) 7/15/2011 INFILTRATION TRENCH - DESIGN 3 80% 85% 95% CBP Established Efficiencies - Infiltration Practices w/o Sand, Veg. 0.41 18% Yes 1.09 0.17 88.42
VINH'S PROPERTY (DR) 7/15/2011 INFILTRATION TRENCH - DESIGN 3 80% 85% 95% CBP Established Efficiencies - Infiltration Practices w/o Sand, Veg. 0.82 9% Yes 1.38 0.21 111.42
BANNERWOOD ESTATES (MA) 7/1/2009 EXTENDED DETENTION DRY POND 20% 40% 60%
Fairfax County Public Facilties Manual for TP; CBP Established
Efficiencies for TN and TSS - Dry Extended Detention Ponds 4.56 32% Yes 4.88 1.41 995.85
MOUNT VERNON PARK (MV) 12/28/2012 BIORETENTION FILTER 42% 52% 56% CBP Retrofit Curves - RR; 0.5" Runoff Depth per Fairfax County PFM 0.30 35% Yes 0.73 0.13 65.32
WILLOW OAKS SWM POND AND CONNECTOR ROAD (PR) 7/13/2011 ENHANCED EXTENDED DETENTION DRY POND 20% 50% 60% CBP Established Efficiencies - Dry Extended Detention Ponds - N/A Yes - - -
SABINA ESTATES (MV) 6/12/2013 EXTENDED DETENTION DRY POND 20% 40% 60%
Fairfax County Public Facilties Manual for TP; CBP Established
Efficiencies for TN and TSS - Dry Extended Detention Ponds - N/A Yes - - -
SV LOTUS TEMPLE OF VA (SP) 3/31/2014 EXTENDED DETENTION DRY POND 20% 40% 60%
Fairfax County Public Facilties Manual for TP; CBP Established
Efficiencies for TN and TSS - Dry Extended Detention Ponds - N/A No - - -
UNITED CHRISTIAN PARISH OF RESTON (HM) 8/10/2010 FILTERING STRUCTURE - STORMFILTER (TM) 26% 50% 52%
Fairfax County Public Facilties Manual for TP; CBP Retrofit Curves - ST
for TN and TSS; 0.5" Runoff Depth per DEQ Guidance 1.29 81% Yes 4.13 1.15 562.06
UNITED CHRISTIAN PARISH OF RESTON (HM) 8/10/2010 MANUFACTURED UNDERGROUND DETENTION - RAINSTORE (TM) 80% 85% 95% CBP Established Efficiencies - Infiltration Practices w/o Sand, Veg. - N/A Yes - - -
GREAT FALLS FIRE AND RESCUE STATION #12 RECONSTRUC 12/8/2009 FILTERING STRUCTURE - FILTERRA (TM) 26% 55% 52%
VA BMP Clearinghouse for TP; CBP Retrofit Curves - ST for TN and
TSS; 0.5" Runoff Depth per DEQ Guidance 0.15 47% No - - -
GREAT FALLS FIRE AND RESCUE STATION #12 RECONSTRUC 12/8/2009 FILTERING STRUCTURE - FILTERRA (TM) 26% 55% 52%
VA BMP Clearinghouse for TP; CBP Retrofit Curves - ST for TN and
TSS; 0.5" Runoff Depth per DEQ Guidance 0.33 73% No - - -
GREAT FALLS FIRE AND RESCUE STATION #12 RECONSTRUC 12/8/2009 VEGETATED ROOF - INTENSIVE 0% 40% 0% Fairfax County Public Facilties Manual for TP 0.13 100% No - - -
OAKCREST FARMS SEC 3 (PR) 3/15/2012 INFILTRATION TRENCH - DESIGN 1 80% 85% 95% CBP Established Efficiencies - Infiltration Practices w/o Sand, Veg. 2.42 35% Yes 11.00 1.69 887.91
1884 BEULAH ROAD (HM) 10/7/2011 INFILTRATION TRENCH - DESIGN 3 80% 85% 95% CBP Established Efficiencies - Infiltration Practices w/o Sand, Veg. 0.25 40% Yes 1.29 0.20 104.20
1884 BEULAH ROAD (HM) 10/7/2011 INFILTRATION TRENCH - DESIGN 3 80% 85% 95% CBP Established Efficiencies - Infiltration Practices w/o Sand, Veg. 0.20 45% Yes 1.15 0.18 92.51
MCLEAREN 28 (SU) 12/12/2013 EXTENDED DETENTION DRY POND 20% 40% 60%
Fairfax County Public Facilties Manual for TP; CBP Established
Efficiencies for TN and TSS - Dry Extended Detention Ponds - N/A No - - -
ROSEGLEN (FORMERLY NASSIR PROPERTY) 6/4/2010 INFILTRATION TRENCH - DESIGN 3 80% 85% 95% CBP Established Efficiencies - Infiltration Practices w/o Sand, Veg. 1.25 29% Yes 4.91 0.76 396.58
ROSEGLEN (FORMERLY NASSIR PROPERTY) 6/4/2010 INFILTRATION TRENCH - DESIGN 3 80% 85% 95% CBP Established Efficiencies - Infiltration Practices w/o Sand, Veg. 3.65 53% Yes 24.11 3.71 1,946.80
ROSEGLEN (FORMERLY NASSIR PROPERTY) 6/4/2010 INFILTRATION TRENCH - DESIGN 3 80% 85% 95% CBP Established Efficiencies - Infiltration Practices w/o Sand, Veg. 1.16 26% Yes 4.10 0.63 330.70
FAIRFAX HOSPITAL BOULEVARD (PR) 8/9/2011 SAND FILTER - OTHER 40% 60% 80% CBP Established Efficiencies - Filtering Practices - N/A Yes - - -
FAIRFAX HOSPITAL BOULEVARD (PR) 8/9/2011 SAND FILTER - OTHER 40% 60% 80% CBP Established Efficiencies - Filtering Practices - N/A Yes - - -
FAIRFAX HOSPITAL BOULEVARD (PR) 8/9/2011 UNDERGROUND DETENTION VAULT 0% 0% 0% No Credit - N/A Yes - - -
FAIRFAX HOSPITAL BOULEVARD (PR) 8/9/2011 UNDERGROUND DETENTION VAULT 0% 0% 0% No Credit - N/A Yes - - -
AEROSPACE CORPORATION PARCEL 35 AT WESTFIELDS (SU) 12/17/2009 UNDERGROUND DETENTION STRUCTURE 0% 0% 0% No Credit - N/A No - - -

Appendix N: Reductions Provided Between July 1, 2009 and June 30, 2014 on Plans Greater than One Acre
AEROSPACE CORPORATION PARCEL 35 AT WESTFIELDS (SU) 12/17/2009 UNDERGROUND DETENTION STRUCTURE 0% 0% 0% No Credit - N/A No - - -
AEROSPACE CORPORATION PARCEL 35 AT WESTFIELDS (SU) 12/17/2009 UNDERGROUND DETENTION STRUCTURE 0% 0% 0% No Credit - N/A No - - -
HERITAGE FELLOWSHIP UNITED CHURCH OF CHRIST (HM) 8/5/2009 UNDERGROUND DETENTION STRUCTURE 0% 0% 0% No Credit 7.60 50% Yes - - -
PROMENADE AT TYSONS WEST (HM) 6/7/2010 FILTERING STRUCTURE - STORMFILTER (TM) 26% 50% 52%
Fairfax County Public Facilties Manual for TP; CBP Retrofit Curves - ST
for TN and TSS; 0.5" Runoff Depth per DEQ Guidance 2.24 95% Yes 8.27 2.30 1,124.68
PROMENADE AT TYSONS WEST (HM) 6/7/2010 MANUFACTURED UNDERGROUND DETENTION - OTHER 0% 0% 0% No Credit 0.99 97% Yes - - -
PROMENADE AT TYSONS WEST (HM) 6/7/2010 MANUFACTURED UNDERGROUND DETENTION - OTHER 0% 0% 0% No Credit 2.30 92% Yes - - -
PROMENADE AT TYSONS WEST (HM) 6/7/2010 MANUFACTURED UNDERGROUND DETENTION - OTHER 0% 0% 0% No Credit 1.39 100% Yes - - -
MCDONALDS 6302 LITTLE RIVER TURNPIKE (MA) 9/13/2011 TREE BOX FILTER 42% 52% 56% CBP Established Efficiencies - Bioretention C/D soils, underdrain 0.18 99% No - - -
STENWOOD ELEMENTARY SCHOOL RENOVATIONS AND ADDITIO 1/8/2010 BIORETENTION FILTER 42% 52% 56% CBP Retrofit Curves - RR; 0.5" Runoff Depth per Fairfax County PFM 0.25 72% Yes 1.16 0.21 104.10
STENWOOD ELEMENTARY SCHOOL RENOVATIONS AND ADDITIO 1/8/2010 BIORETENTION FILTER 42% 52% 56% CBP Retrofit Curves - RR; 0.5" Runoff Depth per Fairfax County PFM 0.31 87% Yes 1.72 0.31 154.21
STENWOOD ELEMENTARY SCHOOL RENOVATIONS AND ADDITIO 1/8/2010 BIORETENTION FILTER 42% 52% 56% CBP Retrofit Curves - RR; 0.5" Runoff Depth per Fairfax County PFM 0.23 96% Yes 1.40 0.25 124.98
STENWOOD ELEMENTARY SCHOOL RENOVATIONS AND ADDITIO 1/8/2010 BIORETENTION FILTER 42% 52% 56% CBP Retrofit Curves - RR; 0.5" Runoff Depth per Fairfax County PFM 0.51 71% Yes 2.33 0.41 208.49
TYSONS CORNER CENTER - METRO S PAVILLION PAD (PR) 7/7/2011 ENHANCED EXTENDED DETENTION DRY POND 20% 50% 60% CBP Established Efficiencies - Dry Extended Detention Ponds - N/A No - - -
TYSONS CORNER CENTER - PH 1 INFRASTRUCTURE (PR) 5/19/2011 ENHANCED EXTENDED DETENTION DRY POND 20% 50% 60% CBP Established Efficiencies - Dry Extended Detention Ponds - N/A No - - -
TYSONS CORNER CENTER, PHASE I BUILDING (PR) 6/29/2012 SAND FILTER - D.C. 40% 60% 80% CBP Established Efficiencies - Filtering Practices - N/A No - - -
TYSONS CORNER CENTER, PHASE I BUILDING (PR) 6/29/2012 SAND FILTER - D.C. 40% 60% 80% CBP Established Efficiencies - Filtering Practices - N/A No - - -
TYSONS CORNER CENTER, PHASE I BUILDING (PR) 6/29/2012 SAND FILTER - D.C. 40% 60% 80% CBP Established Efficiencies - Filtering Practices - N/A No - - -
TYSONS CORNER CENTER, PHASE I BUILDING (PR) 6/29/2012 SAND FILTER - D.C. 40% 60% 80% CBP Established Efficiencies - Filtering Practices - N/A No - - -
HAMPTON INN AND SUITES-SEVEN CORNERS - FALLS CHRCH 11/15/2013 FILTERING STRUCTURE - FILTERRA (TM) 26% 55% 52%
VA BMP Clearinghouse for TP; CBP Retrofit Curves - ST for TN and
TSS; 0.5" Runoff Depth per DEQ Guidance 1.67 82% Yes 5.38 1.65 731.02
HAMPTON INN AND SUITES-SEVEN CORNERS - FALLS CHRCH 11/15/2013 FILTERING STRUCTURE - FILTERRA (TM) 26% 55% 52%
VA BMP Clearinghouse for TP; CBP Retrofit Curves - ST for TN and
TSS; 0.5" Runoff Depth per DEQ Guidance 0.38 82% Yes 1.17 0.36 159.48
HAMPTON INN AND SUITES-SEVEN CORNERS - FALLS CHRCH 11/15/2013 HYDRODYNAMIC STRUCTURE - STORMCEPTOR (TM) 26% 20% 52%
VA BMP Clearinghouse for TP; CBP Retrofit Curves - ST for TN and
TSS; 0.5" Runoff Depth per DEQ Guidance 0.55 82% Yes 1.70 0.19 230.83
HAMPTON INN AND SUITES-SEVEN CORNERS - FALLS CHRCH 11/15/2013 SAND FILTER - OTHER 40% 60% 80% CBP Established Efficiencies - Filtering Practices 0.28 82% Yes 1.33 0.29 180.69
HAMPTON INN AND SUITES-SEVEN CORNERS - FALLS CHRCH 11/15/2013 UNDERGROUND DETENTION STRUCTURE 0% 0% 0% No Credit 0.71 82% Yes - - -
EVERWOOD (SU) 3/8/2012 EXTENDED DETENTION DRY POND 20% 40% 60%
Fairfax County Public Facilties Manual for TP; CBP Established
Efficiencies for TN and TSS - Dry Extended Detention Ponds 13.84 23% Yes 11.38 3.30 2,322.36
POTOMAC SCHOOL TENNIS COURT & EXISTING FIELD RE- S 1/22/2010 MANUFACTURED UNDERGROUND DETENTION - OTHER 0% 0% 0% No Credit 1.26 20% No - - -
POTOMAC SCHOOL TENNIS COURT & EXISTING FIELD RE- S 1/22/2010 UNDERGROUND DETENTION VAULT 0% 0% 0% No Credit 2.36 20% No - - -
OAKTON ELEMENTARY SCHOOL (PR) 11/2/2010 UNDERGROUND DETENTION STRUCTURE 0% 0% 0% No Credit 0.75 50% Yes - - -
KNOLLWOOD COMMUNITY CHURCH PHASES 1 AND 2A (BR) 12/6/2010 BIORETENTION BASIN 42% 52% 56% CBP Retrofit Curves - RR; 0.5" Runoff Depth per Fairfax County PFM 0.50 66% Yes 2.15 0.38 192.09
KNOLLWOOD COMMUNITY CHURCH PHASES 1 AND 2A (BR) 12/6/2010 BIORETENTION BASIN 42% 52% 56% CBP Retrofit Curves - RR; 0.5" Runoff Depth per Fairfax County PFM 0.10 83% Yes 0.53 0.09 47.54
KNOLLWOOD COMMUNITY CHURCH PHASES 1 AND 2A (BR) 12/6/2010 FILTERING STRUCTURE - FILTERRA (TM) 26% 55% 52%
VA BMP Clearinghouse for TP; CBP Retrofit Curves - ST for TN and
TSS; 0.5" Runoff Depth per DEQ Guidance 0.50 66% Yes 1.32 0.40 179.28
KNOLLWOOD COMMUNITY CHURCH PHASES 1 AND 2A (BR) 12/6/2010 FILTERING STRUCTURE - FILTERRA (TM) 26% 55% 52%
VA BMP Clearinghouse for TP; CBP Retrofit Curves - ST for TN and
TSS; 0.5" Runoff Depth per DEQ Guidance 0.32 100% Yes 1.24 0.38 169.26
KNOLLWOOD COMMUNITY CHURCH PHASES 1 AND 2A (BR) 12/7/2010 FILTERING STRUCTURE - FILTERRA (TM) 26% 55% 52%
VA BMP Clearinghouse for TP; CBP Retrofit Curves - ST for TN and
TSS; 0.5" Runoff Depth per DEQ Guidance 0.28 100% Yes 1.09 0.33 148.10
KNOLLWOOD COMMUNITY CHURCH PHASES 1 AND 2A (BR) 12/6/2010 UNDERGROUND DETENTION STRUCTURE 0% 0% 0% No Credit - N/A Yes - - -
WEST MAC PHASE V 8080 JONES BRANCH DRIVE (PR) 11/2/2011 UNDERGROUND DETENTION STRUCTURE 0% 0% 0% No Credit 3.14 67% Yes - - -
WEST MAC PHASE V 8080 JONES BRANCH DRIVE (PR) 11/2/2011 UNDERGROUND DETENTION STRUCTURE 0% 0% 0% No Credit 1.53 67% Yes - - -
OPEN DOOR PRESBYTERIAN CHURCH (SU) 6/17/2010 FILTERING STRUCTURE - FILTERRA (TM) 26% 55% 52%
VA BMP Clearinghouse for TP; CBP Retrofit Curves - ST for TN and
TSS; 0.5" Runoff Depth per DEQ Guidance - N/A Yes - - -
OPEN DOOR PRESBYTERIAN CHURCH (SU) 6/17/2010 MANUFACTURED UNDERGROUND DETENTION - STORMCHAMBER (TM) 80% 85% 95% CBP Established Efficiencies - Infiltration Practices w/o Sand, Veg. 10.67 75% Yes 97.39 15.00 7,864.23
OPEN DOOR PRESBYTERIAN CHURCH (SU) 6/17/2010 MANUFACTURED UNDERGROUND DETENTION - STORMCHAMBER (TM) 80% 85% 95% CBP Established Efficiencies - Infiltration Practices w/o Sand, Veg. 5.98 75% Yes 54.58 8.40 4,407.50
MALLORY SQUARE (DR) 7/6/2009 BIORETENTION FILTER 42% 52% 56% CBP Retrofit Curves - RR; 0.5" Runoff Depth per Fairfax County PFM 8.96 75% Yes 43.31 7.71 3,875.15
MALLORY SQUARE (DR) 7/6/2009 EXTENDED DETENTION DRY POND 20% 40% 60%
Fairfax County Public Facilties Manual for TP; CBP Established
Efficiencies for TN and TSS - Dry Extended Detention Ponds 0.91 75% Yes 0.98 0.28 199.06
CHESTERWOOD ESTATES (DR) 10/11/2011 INFILTRATION TRENCH - DESIGN 1 80% 85% 95% CBP Established Efficiencies - Infiltration Practices w/o Sand, Veg. - N/A Yes - - -
CHESTERWOOD ESTATES (DR) 10/11/2011 INFILTRATION TRENCH - DESIGN 1 80% 85% 95% CBP Established Efficiencies - Infiltration Practices w/o Sand, Veg. 0.82 12% Yes 2.24 0.35 181.23
CHESTERWOOD ESTATES (DR) 10/11/2011 INFILTRATION TRENCH - DESIGN 1 80% 85% 95% CBP Established Efficiencies - Infiltration Practices w/o Sand, Veg. 1.03 12% Yes 2.82 0.43 227.64
STEAMBOAT LANDING (BR) 10/6/2011 INFILTRATION TRENCH - DESIGN 3 80% 85% 95% CBP Established Efficiencies - Infiltration Practices w/o Sand, Veg. 1.79 23% Yes 5.77 0.89 465.87
RAJDHANI MANDIR RELIGIOUS CENTER (SU) 4/30/2014 DRY WELLS 80% 85% 95% CBP Established Efficiencies - Infiltration Practices w/o Sand, Veg. N/A Yes - - -
RAJDHANI MANDIR RELIGIOUS CENTER (SU) 4/30/2014 EXTENDED DETENTION DRY POND 20% 40% 60%
Fairfax County Public Facilties Manual for TP; CBP Established
Efficiencies for TN and TSS - Dry Extended Detention Ponds 2.49 70% Yes 2.78 0.80 566.28
RAJDHANI MANDIR RELIGIOUS CENTER (SU) 4/30/2014 OTHER APPROVED BMP FACILITY 0% 0% 0% No Credit 2.49 70% Yes - - -
RAJDHANI MANDIR RELIGIOUS CENTER (SU) 4/30/2014 POROUS ASPHALT PAVEMENT WITH EXTENDED AGGREGATE BASE 42% 52% 56%
CBP Established Efficiencies - Permeable Pavement w/o Sand, Veg.
C/D soils, underdrain 0.95 70% Yes 2.24 0.40 200.73
LIVING SAVIOR LUTHERAN CHURCH PHASE 1 (SP) 9/23/2009 UNDERGROUND DETENTION STRUCTURE 0% 0% 0% No Credit - N/A Yes - - -
CHESTERBROOK MANOR (DR) 2/14/2012 ENHANCED EXTENDED DETENTION DRY POND 20% 50% 60% CBP Established Efficiencies - Dry Extended Detention Ponds 2.56 39% Yes 1.85 0.67 378.05
WOODLAWN ELEMENTARY SCHOOL - KISS AND RIDE IMPRV ( 9/21/2011 FILTERING STRUCTURE - FILTERRA (TM) 26% 55% 52%
VA BMP Clearinghouse for TP; CBP Retrofit Curves - ST for TN and
TSS; 0.5" Runoff Depth per DEQ Guidance 0.34 100% No - - -
WOODLAWN ELEMENTARY SCHOOL - KISS AND RIDE IMPRV ( 9/21/2011 INFILTRATION TRENCH - DESIGN 1 80% 85% 95% CBP Established Efficiencies - Infiltration Practices w/o Sand, Veg. 0.78 36% No - - -
WOODLAWN ELEMENTARY SCHOOL - KISS AND RIDE IMPRV ( 9/21/2011 FILTERING STRUCTURE - FILTERRA (TM) 26% 55% 52%
VA BMP Clearinghouse for TP; CBP Retrofit Curves - ST for TN and
TSS; 0.5" Runoff Depth per DEQ Guidance 0.07 100% No - - -
WOODLAWN ELEMENTARY SCHOOL - KISS AND RIDE IMPRV ( 9/21/2011 FILTERING STRUCTURE - FILTERRA (TM) #N/A #N/A #N/A #N/A 0.15 100% No - - -
SQUARE 1400 LC - RESIDENTIAL BUILDING AND GARAGE ( 11/15/2011 BIORETENTION BASIN/FILTER LEVEL 2 57% 70% 75% CBP Retrofit Curves - RR; 1" Runoff Depth per Fairfax County PFM - N/A Yes - - -
JENNINGS TOYOTA (LE) 3/15/2013 FILTERING STRUCTURE - FILTERRA (TM) 26% 55% 52%
VA BMP Clearinghouse for TP; CBP Retrofit Curves - ST for TN and
TSS; 0.5" Runoff Depth per DEQ Guidance 8.80 58% Yes 11.79 3.61 1,603.15
JENNINGS TOYOTA (LE) 3/15/2013 OTHER APPROVED BMP FACILITY 0% 0% 0% No Credit 0.12 58% Yes - - -
JENNINGS TOYOTA (LE) 3/15/2013 UNDERGROUND DETENTION STRUCTURE 0% 0% 0% No Credit 1.69 58% Yes - - -
JENNINGS TOYOTA (LE) 3/15/2013 UNDERGROUND DETENTION STRUCTURE 0% 0% 0% No Credit 3.06 58% Yes - - -
JENNINGS TOYOTA (LE) 3/15/2013 VEGETATED SWALE WITHOUT CHECK DAMS 70% 75% 80% CBP Established Efficiencies - Bioswale 9.23 58% Yes 33.27 5.17 2,585.44
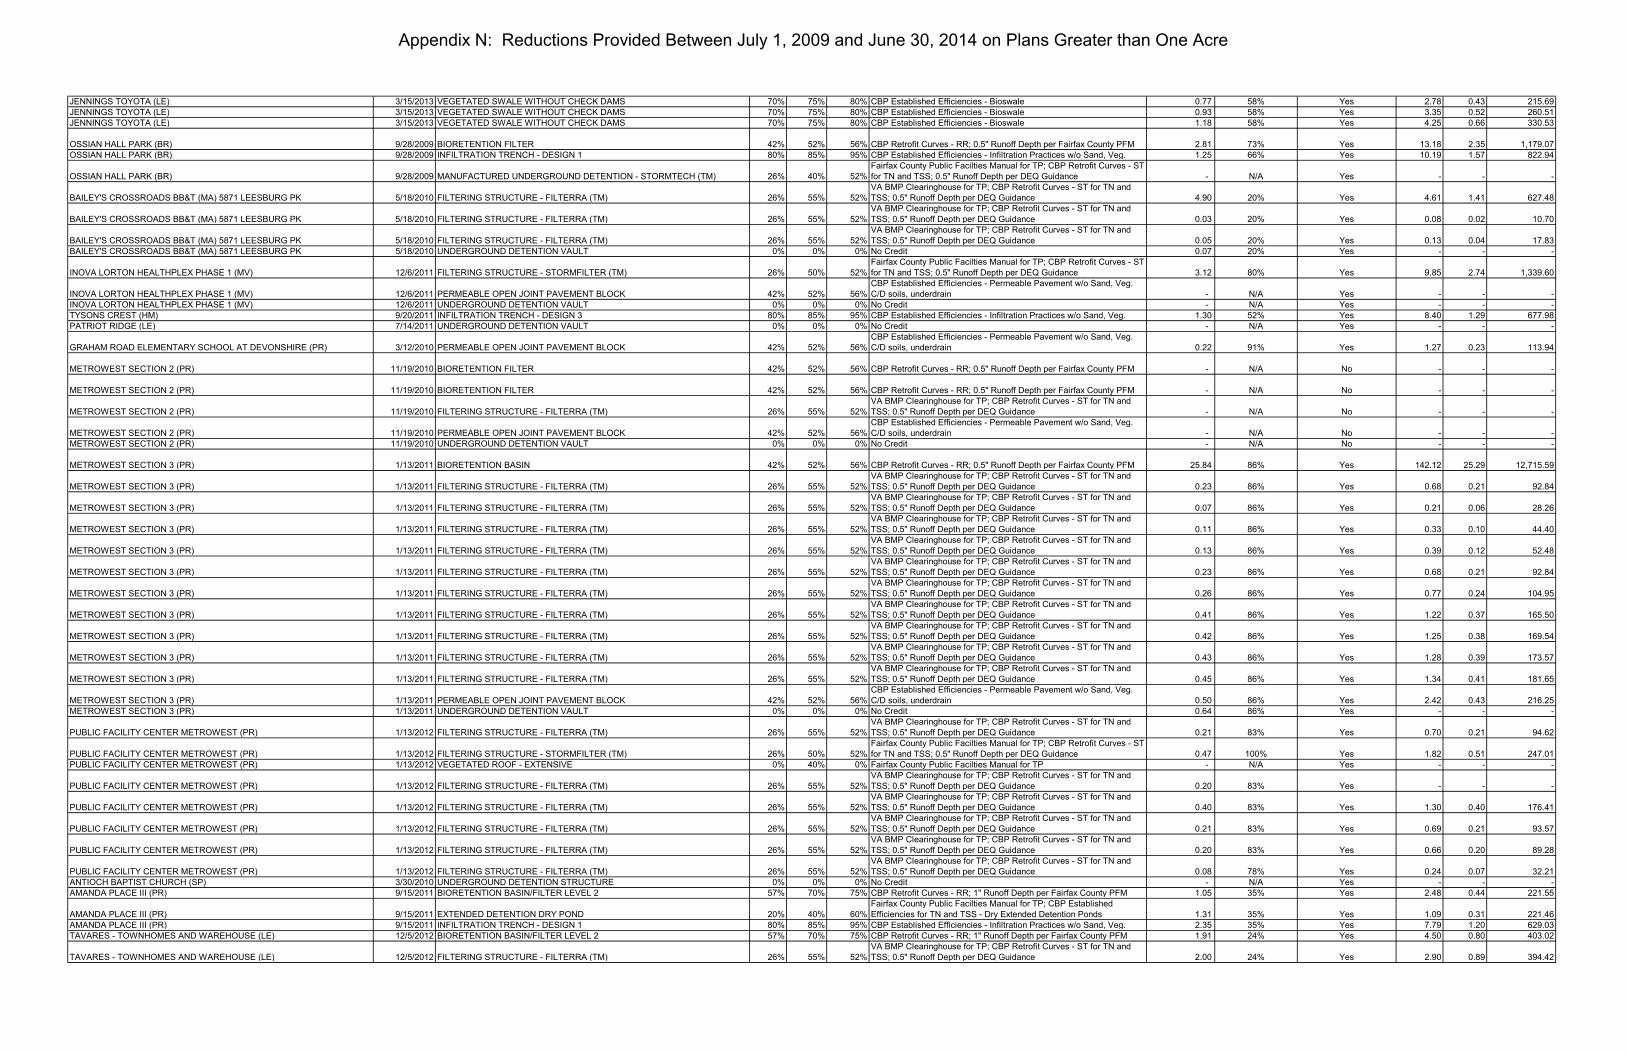
Appendix N: Reductions Provided Between July 1, 2009 and June 30, 2014 on Plans Greater than One Acre
JENNINGS TOYOTA (LE) 3/15/2013 VEGETATED SWALE WITHOUT CHECK DAMS 70% 75% 80% CBP Established Efficiencies - Bioswale 0.77 58% Yes 2.78 0.43 215.69
JENNINGS TOYOTA (LE) 3/15/2013 VEGETATED SWALE WITHOUT CHECK DAMS 70% 75% 80% CBP Established Efficiencies - Bioswale 0.93 58% Yes 3.35 0.52 260.51
JENNINGS TOYOTA (LE) 3/15/2013 VEGETATED SWALE WITHOUT CHECK DAMS 70% 75% 80% CBP Established Efficiencies - Bioswale 1.18 58% Yes 4.25 0.66 330.53
OSSIAN HALL PARK (BR) 9/28/2009 BIORETENTION FILTER 42% 52% 56% CBP Retrofit Curves - RR; 0.5" Runoff Depth per Fairfax County PFM 2.81 73% Yes 13.18 2.35 1,179.07
OSSIAN HALL PARK (BR) 9/28/2009 INFILTRATION TRENCH - DESIGN 1 80% 85% 95% CBP Established Efficiencies - Infiltration Practices w/o Sand, Veg. 1.25 66% Yes 10.19 1.57 822.94
OSSIAN HALL PARK (BR) 9/28/2009 MANUFACTURED UNDERGROUND DETENTION - STORMTECH (TM) 26% 40% 52%
Fairfax County Public Facilties Manual for TP; CBP Retrofit Curves - ST
for TN and TSS; 0.5" Runoff Depth per DEQ Guidance - N/A Yes - - -
BAILEY'S CROSSROADS BB&T (MA) 5871 LEESBURG PK 5/18/2010 FILTERING STRUCTURE - FILTERRA (TM) 26% 55% 52%
VA BMP Clearinghouse for TP; CBP Retrofit Curves - ST for TN and
TSS; 0.5" Runoff Depth per DEQ Guidance 4.90 20% Yes 4.61 1.41 627.48
BAILEY'S CROSSROADS BB&T (MA) 5871 LEESBURG PK 5/18/2010 FILTERING STRUCTURE - FILTERRA (TM) 26% 55% 52%
VA BMP Clearinghouse for TP; CBP Retrofit Curves - ST for TN and
TSS; 0.5" Runoff Depth per DEQ Guidance 0.03 20% Yes 0.08 0.02 10.70
BAILEY'S CROSSROADS BB&T (MA) 5871 LEESBURG PK 5/18/2010 FILTERING STRUCTURE - FILTERRA (TM) 26% 55% 52%
VA BMP Clearinghouse for TP; CBP Retrofit Curves - ST for TN and
TSS; 0.5" Runoff Depth per DEQ Guidance 0.05 20% Yes 0.13 0.04 17.83
BAILEY'S CROSSROADS BB&T (MA) 5871 LEESBURG PK 5/18/2010 UNDERGROUND DETENTION VAULT 0% 0% 0% No Credit 0.07 20% Yes - - -
INOVA LORTON HEALTHPLEX PHASE 1 (MV) 12/6/2011 FILTERING STRUCTURE - STORMFILTER (TM) 26% 50% 52%
Fairfax County Public Facilties Manual for TP; CBP Retrofit Curves - ST
for TN and TSS; 0.5" Runoff Depth per DEQ Guidance 3.12 80% Yes 9.85 2.74 1,339.60
INOVA LORTON HEALTHPLEX PHASE 1 (MV) 12/6/2011 PERMEABLE OPEN JOINT PAVEMENT BLOCK 42% 52% 56%
CBP Established Efficiencies - Permeable Pavement w/o Sand, Veg.
C/D soils, underdrain - N/A Yes - - -
INOVA LORTON HEALTHPLEX PHASE 1 (MV) 12/6/2011 UNDERGROUND DETENTION VAULT 0% 0% 0% No Credit - N/A Yes - - -
TYSONS CREST (HM) 9/20/2011 INFILTRATION TRENCH - DESIGN 3 80% 85% 95% CBP Established Efficiencies - Infiltration Practices w/o Sand, Veg. 1.30 52% Yes 8.40 1.29 677.98
PATRIOT RIDGE (LE) 7/14/2011 UNDERGROUND DETENTION VAULT 0% 0% 0% No Credit - N/A Yes - - -
GRAHAM ROAD ELEMENTARY SCHOOL AT DEVONSHIRE (PR) 3/12/2010 PERMEABLE OPEN JOINT PAVEMENT BLOCK 42% 52% 56%
CBP Established Efficiencies - Permeable Pavement w/o Sand, Veg.
C/D soils, underdrain 0.22 91% Yes 1.27 0.23 113.94
METROWEST SECTION 2 (PR) 11/19/2010 BIORETENTION FILTER 42% 52% 56% CBP Retrofit Curves - RR; 0.5" Runoff Depth per Fairfax County PFM - N/A No - - -
METROWEST SECTION 2 (PR) 11/19/2010 BIORETENTION FILTER 42% 52% 56% CBP Retrofit Curves - RR; 0.5" Runoff Depth per Fairfax County PFM - N/A No - - -
METROWEST SECTION 2 (PR) 11/19/2010 FILTERING STRUCTURE - FILTERRA (TM) 26% 55% 52%
VA BMP Clearinghouse for TP; CBP Retrofit Curves - ST for TN and
TSS; 0.5" Runoff Depth per DEQ Guidance - N/A No - - -
METROWEST SECTION 2 (PR) 11/19/2010 PERMEABLE OPEN JOINT PAVEMENT BLOCK 42% 52% 56%
CBP Established Efficiencies - Permeable Pavement w/o Sand, Veg.
C/D soils, underdrain - N/A No - - -
METROWEST SECTION 2 (PR) 11/19/2010 UNDERGROUND DETENTION VAULT 0% 0% 0% No Credit - N/A No - - -
METROWEST SECTION 3 (PR) 1/13/2011 BIORETENTION BASIN 42% 52% 56% CBP Retrofit Curves - RR; 0.5" Runoff Depth per Fairfax County PFM 25.84 86% Yes 142.12 25.29 12,715.59
METROWEST SECTION 3 (PR) 1/13/2011 FILTERING STRUCTURE - FILTERRA (TM) 26% 55% 52%
VA BMP Clearinghouse for TP; CBP Retrofit Curves - ST for TN and
TSS; 0.5" Runoff Depth per DEQ Guidance 0.23 86% Yes 0.68 0.21 92.84
METROWEST SECTION 3 (PR) 1/13/2011 FILTERING STRUCTURE - FILTERRA (TM) 26% 55% 52%
VA BMP Clearinghouse for TP; CBP Retrofit Curves - ST for TN and
TSS; 0.5" Runoff Depth per DEQ Guidance 0.07 86% Yes 0.21 0.06 28.26
METROWEST SECTION 3 (PR) 1/13/2011 FILTERING STRUCTURE - FILTERRA (TM) 26% 55% 52%
VA BMP Clearinghouse for TP; CBP Retrofit Curves - ST for TN and
TSS; 0.5" Runoff Depth per DEQ Guidance 0.11 86% Yes 0.33 0.10 44.40
METROWEST SECTION 3 (PR) 1/13/2011 FILTERING STRUCTURE - FILTERRA (TM) 26% 55% 52%
VA BMP Clearinghouse for TP; CBP Retrofit Curves - ST for TN and
TSS; 0.5" Runoff Depth per DEQ Guidance 0.13 86% Yes 0.39 0.12 52.48
METROWEST SECTION 3 (PR) 1/13/2011 FILTERING STRUCTURE - FILTERRA (TM) 26% 55% 52%
VA BMP Clearinghouse for TP; CBP Retrofit Curves - ST for TN and
TSS; 0.5" Runoff Depth per DEQ Guidance 0.23 86% Yes 0.68 0.21 92.84
METROWEST SECTION 3 (PR) 1/13/2011 FILTERING STRUCTURE - FILTERRA (TM) 26% 55% 52%
VA BMP Clearinghouse for TP; CBP Retrofit Curves - ST for TN and
TSS; 0.5" Runoff Depth per DEQ Guidance 0.26 86% Yes 0.77 0.24 104.95
METROWEST SECTION 3 (PR) 1/13/2011 FILTERING STRUCTURE - FILTERRA (TM) 26% 55% 52%
VA BMP Clearinghouse for TP; CBP Retrofit Curves - ST for TN and
TSS; 0.5" Runoff Depth per DEQ Guidance 0.41 86% Yes 1.22 0.37 165.50
METROWEST SECTION 3 (PR) 1/13/2011 FILTERING STRUCTURE - FILTERRA (TM) 26% 55% 52%
VA BMP Clearinghouse for TP; CBP Retrofit Curves - ST for TN and
TSS; 0.5" Runoff Depth per DEQ Guidance 0.42 86% Yes 1.25 0.38 169.54
METROWEST SECTION 3 (PR) 1/13/2011 FILTERING STRUCTURE - FILTERRA (TM) 26% 55% 52%
VA BMP Clearinghouse for TP; CBP Retrofit Curves - ST for TN and
TSS; 0.5" Runoff Depth per DEQ Guidance 0.43 86% Yes 1.28 0.39 173.57
METROWEST SECTION 3 (PR) 1/13/2011 FILTERING STRUCTURE - FILTERRA (TM) 26% 55% 52%
VA BMP Clearinghouse for TP; CBP Retrofit Curves - ST for TN and
TSS; 0.5" Runoff Depth per DEQ Guidance 0.45 86% Yes 1.34 0.41 181.65
METROWEST SECTION 3 (PR) 1/13/2011 PERMEABLE OPEN JOINT PAVEMENT BLOCK 42% 52% 56%
CBP Established Efficiencies - Permeable Pavement w/o Sand, Veg.
C/D soils, underdrain 0.50 86% Yes 2.42 0.43 216.25
METROWEST SECTION 3 (PR) 1/13/2011 UNDERGROUND DETENTION VAULT 0% 0% 0% No Credit 0.64 86% Yes - - -
PUBLIC FACILITY CENTER METROWEST (PR) 1/13/2012 FILTERING STRUCTURE - FILTERRA (TM) 26% 55% 52%
VA BMP Clearinghouse for TP; CBP Retrofit Curves - ST for TN and
TSS; 0.5" Runoff Depth per DEQ Guidance 0.21 83% Yes 0.70 0.21 94.62
PUBLIC FACILITY CENTER METROWEST (PR) 1/13/2012 FILTERING STRUCTURE - STORMFILTER (TM) 26% 50% 52%
Fairfax County Public Facilties Manual for TP; CBP Retrofit Curves - ST
for TN and TSS; 0.5" Runoff Depth per DEQ Guidance 0.47 100% Yes 1.82 0.51 247.01
PUBLIC FACILITY CENTER METROWEST (PR) 1/13/2012 VEGETATED ROOF - EXTENSIVE 0% 40% 0% Fairfax County Public Facilties Manual for TP - N/A Yes - - -
PUBLIC FACILITY CENTER METROWEST (PR) 1/13/2012 FILTERING STRUCTURE - FILTERRA (TM) 26% 55% 52%
VA BMP Clearinghouse for TP; CBP Retrofit Curves - ST for TN and
TSS; 0.5" Runoff Depth per DEQ Guidance 0.20 83% Yes - - -
PUBLIC FACILITY CENTER METROWEST (PR) 1/13/2012 FILTERING STRUCTURE - FILTERRA (TM) 26% 55% 52%
VA BMP Clearinghouse for TP; CBP Retrofit Curves - ST for TN and
TSS; 0.5" Runoff Depth per DEQ Guidance 0.40 83% Yes 1.30 0.40 176.41
PUBLIC FACILITY CENTER METROWEST (PR) 1/13/2012 FILTERING STRUCTURE - FILTERRA (TM) 26% 55% 52%
VA BMP Clearinghouse for TP; CBP Retrofit Curves - ST for TN and
TSS; 0.5" Runoff Depth per DEQ Guidance 0.21 83% Yes 0.69 0.21 93.57
PUBLIC FACILITY CENTER METROWEST (PR) 1/13/2012 FILTERING STRUCTURE - FILTERRA (TM) 26% 55% 52%
VA BMP Clearinghouse for TP; CBP Retrofit Curves - ST for TN and
TSS; 0.5" Runoff Depth per DEQ Guidance 0.20 83% Yes 0.66 0.20 89.28
PUBLIC FACILITY CENTER METROWEST (PR) 1/13/2012 FILTERING STRUCTURE - FILTERRA (TM) 26% 55% 52%
VA BMP Clearinghouse for TP; CBP Retrofit Curves - ST for TN and
TSS; 0.5" Runoff Depth per DEQ Guidance 0.08 78% Yes 0.24 0.07 32.21
ANTIOCH BAPTIST CHURCH (SP) 3/30/2010 UNDERGROUND DETENTION STRUCTURE 0% 0% 0% No Credit - N/A Yes - - -
AMANDA PLACE III (PR) 9/15/2011 BIORETENTION BASIN/FILTER LEVEL 2 57% 70% 75% CBP Retrofit Curves - RR; 1" Runoff Depth per Fairfax County PFM 1.05 35% Yes 2.48 0.44 221.55
AMANDA PLACE III (PR) 9/15/2011 EXTENDED DETENTION DRY POND 20% 40% 60%
Fairfax County Public Facilties Manual for TP; CBP Established
Efficiencies for TN and TSS - Dry Extended Detention Ponds 1.31 35% Yes 1.09 0.31 221.46
AMANDA PLACE III (PR) 9/15/2011 INFILTRATION TRENCH - DESIGN 1 80% 85% 95% CBP Established Efficiencies - Infiltration Practices w/o Sand, Veg. 2.35 35% Yes 7.79 1.20 629.03
TAVARES - TOWNHOMES AND WAREHOUSE (LE) 12/5/2012 BIORETENTION BASIN/FILTER LEVEL 2 57% 70% 75% CBP Retrofit Curves - RR; 1" Runoff Depth per Fairfax County PFM 1.91 24% Yes 4.50 0.80 403.02
TAVARES - TOWNHOMES AND WAREHOUSE (LE) 12/5/2012 FILTERING STRUCTURE - FILTERRA (TM) 26% 55% 52%
VA BMP Clearinghouse for TP; CBP Retrofit Curves - ST for TN and
TSS; 0.5" Runoff Depth per DEQ Guidance 2.00 24% Yes 2.90 0.89 394.42
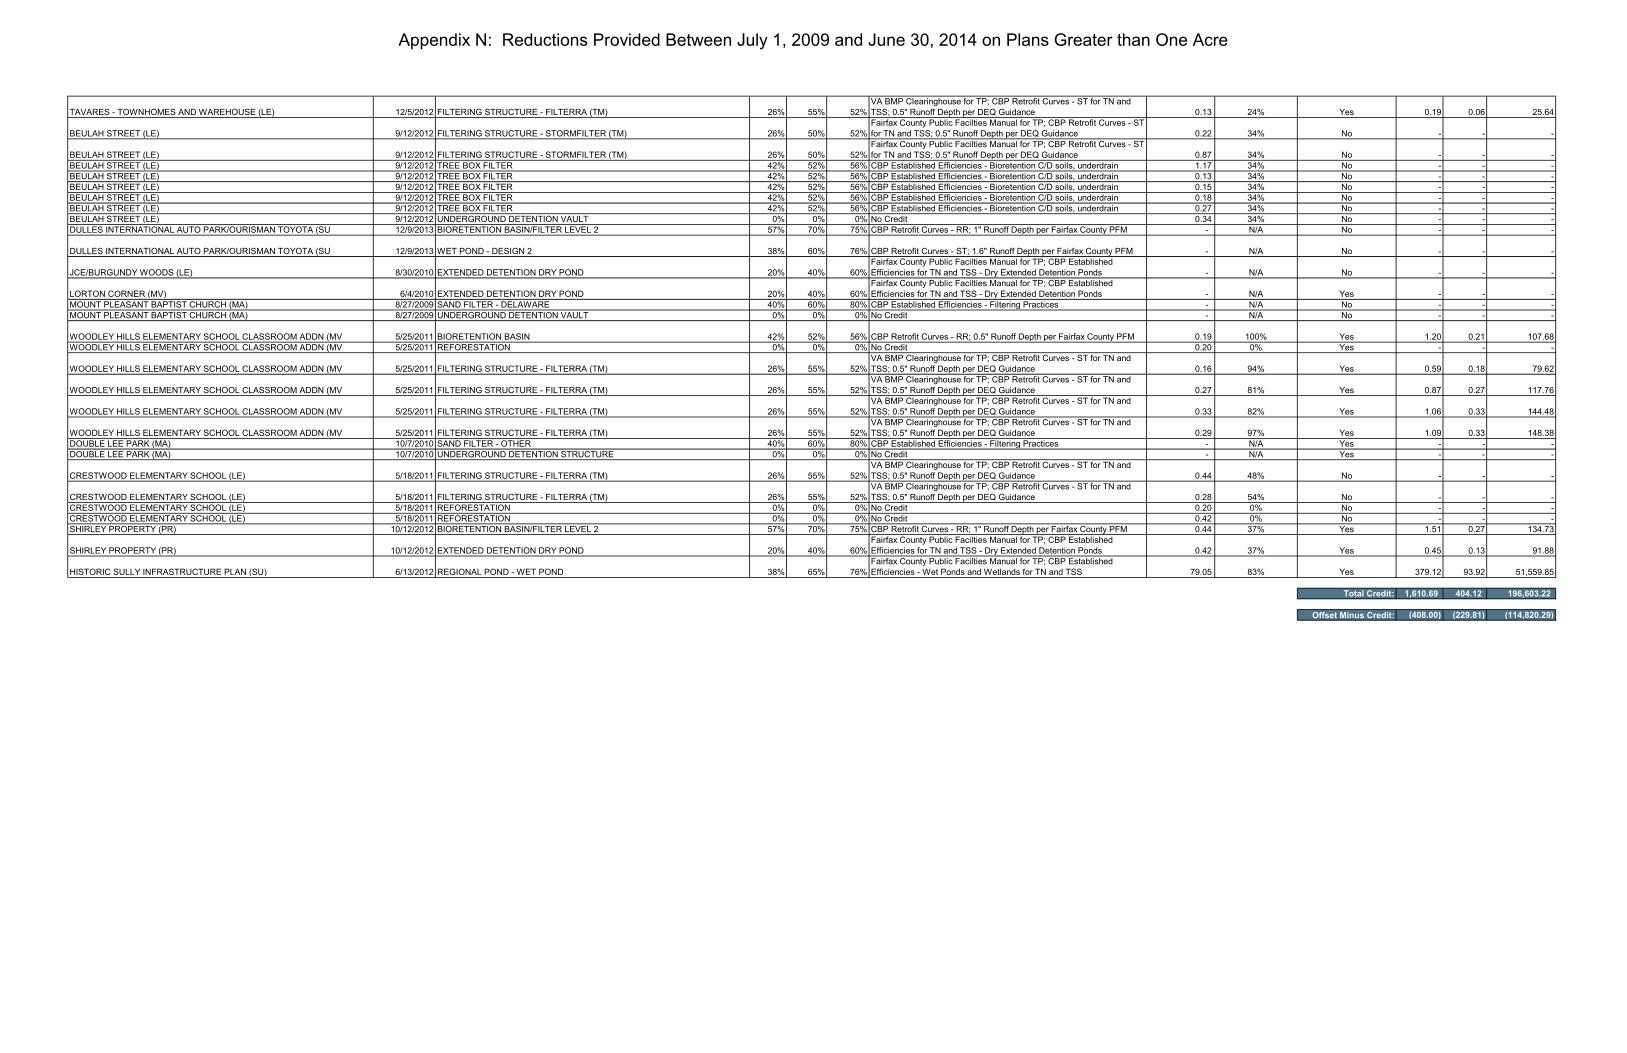
Appendix N: Reductions Provided Between July 1, 2009 and June 30, 2014 on Plans Greater than One Acre
TAVARES - TOWNHOMES AND WAREHOUSE (LE) 12/5/2012 FILTERING STRUCTURE - FILTERRA (TM) 26% 55% 52%
VA BMP Clearinghouse for TP; CBP Retrofit Curves - ST for TN and
TSS; 0.5" Runoff Depth per DEQ Guidance 0.13 24% Yes 0.19 0.06 25.64
BEULAH STREET (LE) 9/12/2012 FILTERING STRUCTURE - STORMFILTER (TM) 26% 50% 52%
Fairfax County Public Facilties Manual for TP; CBP Retrofit Curves - ST
for TN and TSS; 0.5" Runoff Depth per DEQ Guidance 0.22 34% No - - -
BEULAH STREET (LE) 9/12/2012 FILTERING STRUCTURE - STORMFILTER (TM) 26% 50% 52%
Fairfax County Public Facilties Manual for TP; CBP Retrofit Curves - ST
for TN and TSS; 0.5" Runoff Depth per DEQ Guidance 0.87 34% No - - -
BEULAH STREET (LE) 9/12/2012 TREE BOX FILTER 42% 52% 56% CBP Established Efficiencies - Bioretention C/D soils, underdrain 1.17 34% No - - -
BEULAH STREET (LE) 9/12/2012 TREE BOX FILTER 42% 52% 56% CBP Established Efficiencies - Bioretention C/D soils, underdrain 0.13 34% No - - -
BEULAH STREET (LE) 9/12/2012 TREE BOX FILTER 42% 52% 56% CBP Established Efficiencies - Bioretention C/D soils, underdrain 0.15 34% No - - -
BEULAH STREET (LE) 9/12/2012 TREE BOX FILTER 42% 52% 56% CBP Established Efficiencies - Bioretention C/D soils, underdrain 0.18 34% No - - -
BEULAH STREET (LE) 9/12/2012 TREE BOX FILTER 42% 52% 56% CBP Established Efficiencies - Bioretention C/D soils, underdrain 0.27 34% No - - -
BEULAH STREET (LE) 9/12/2012 UNDERGROUND DETENTION VAULT 0% 0% 0% No Credit 0.34 34% No - - -
DULLES INTERNATIONAL AUTO PARK/OURISMAN TOYOTA (SU 12/9/2013 BIORETENTION BASIN/FILTER LEVEL 2 57% 70% 75% CBP Retrofit Curves - RR; 1" Runoff Depth per Fairfax County PFM - N/A No - - -
DULLES INTERNATIONAL AUTO PARK/OURISMAN TOYOTA (SU 12/9/2013 WET POND - DESIGN 2 38% 60% 76% CBP Retrofit Curves - ST; 1.6" Runoff Depth per Fairfax County PFM - N/A No - - -
JCE/BURGUNDY WOODS (LE) 8/30/2010 EXTENDED DETENTION DRY POND 20% 40% 60%
Fairfax County Public Facilties Manual for TP; CBP Established
Efficiencies for TN and TSS - Dry Extended Detention Ponds - N/A No - - -
LORTON CORNER (MV) 6/4/2010 EXTENDED DETENTION DRY POND 20% 40% 60%
Fairfax County Public Facilties Manual for TP; CBP Established
Efficiencies for TN and TSS - Dry Extended Detention Ponds - N/A Yes - - -
MOUNT PLEASANT BAPTIST CHURCH (MA) 8/27/2009 SAND FILTER - DELAWARE 40% 60% 80% CBP Established Efficiencies - Filtering Practices - N/A No - - -
MOUNT PLEASANT BAPTIST CHURCH (MA) 8/27/2009 UNDERGROUND DETENTION VAULT 0% 0% 0% No Credit - N/A No - - -
WOODLEY HILLS ELEMENTARY SCHOOL CLASSROOM ADDN (MV 5/25/2011 BIORETENTION BASIN 42% 52% 56% CBP Retrofit Curves - RR; 0.5" Runoff Depth per Fairfax County PFM 0.19 100% Yes 1.20 0.21 107.68
WOODLEY HILLS ELEMENTARY SCHOOL CLASSROOM ADDN (MV 5/25/2011 REFORESTATION 0% 0% 0% No Credit 0.20 0% Yes - - -
WOODLEY HILLS ELEMENTARY SCHOOL CLASSROOM ADDN (MV 5/25/2011 FILTERING STRUCTURE - FILTERRA (TM) 26% 55% 52%
VA BMP Clearinghouse for TP; CBP Retrofit Curves - ST for TN and
TSS; 0.5" Runoff Depth per DEQ Guidance 0.16 94% Yes 0.59 0.18 79.62
WOODLEY HILLS ELEMENTARY SCHOOL CLASSROOM ADDN (MV 5/25/2011 FILTERING STRUCTURE - FILTERRA (TM) 26% 55% 52%
VA BMP Clearinghouse for TP; CBP Retrofit Curves - ST for TN and
TSS; 0.5" Runoff Depth per DEQ Guidance 0.27 81% Yes 0.87 0.27 117.76
WOODLEY HILLS ELEMENTARY SCHOOL CLASSROOM ADDN (MV 5/25/2011 FILTERING STRUCTURE - FILTERRA (TM) 26% 55% 52%
VA BMP Clearinghouse for TP; CBP Retrofit Curves - ST for TN and
TSS; 0.5" Runoff Depth per DEQ Guidance 0.33 82% Yes 1.06 0.33 144.48
WOODLEY HILLS ELEMENTARY SCHOOL CLASSROOM ADDN (MV 5/25/2011 FILTERING STRUCTURE - FILTERRA (TM) 26% 55% 52%
VA BMP Clearinghouse for TP; CBP Retrofit Curves - ST for TN and
TSS; 0.5" Runoff Depth per DEQ Guidance 0.29 97% Yes 1.09 0.33 148.38
DOUBLE LEE PARK (MA) 10/7/2010 SAND FILTER - OTHER 40% 60% 80% CBP Established Efficiencies - Filtering Practices - N/A Yes - - -
DOUBLE LEE PARK (MA) 10/7/2010 UNDERGROUND DETENTION STRUCTURE 0% 0% 0% No Credit - N/A Yes - - -
CRESTWOOD ELEMENTARY SCHOOL (LE) 5/18/2011 FILTERING STRUCTURE - FILTERRA (TM) 26% 55% 52%
VA BMP Clearinghouse for TP; CBP Retrofit Curves - ST for TN and
TSS; 0.5" Runoff Depth per DEQ Guidance 0.44 48% No - - -
CRESTWOOD ELEMENTARY SCHOOL (LE) 5/18/2011 FILTERING STRUCTURE - FILTERRA (TM) 26% 55% 52%
VA BMP Clearinghouse for TP; CBP Retrofit Curves - ST for TN and
TSS; 0.5" Runoff Depth per DEQ Guidance 0.28 54% No - - -
CRESTWOOD ELEMENTARY SCHOOL (LE) 5/18/2011 REFORESTATION 0% 0% 0% No Credit 0.20 0% No - - -
CRESTWOOD ELEMENTARY SCHOOL (LE) 5/18/2011 REFORESTATION 0% 0% 0% No Credit 0.42 0% No - - -
SHIRLEY PROPERTY (PR) 10/12/2012 BIORETENTION BASIN/FILTER LEVEL 2 57% 70% 75% CBP Retrofit Curves - RR; 1" Runoff Depth per Fairfax County PFM 0.44 37% Yes 1.51 0.27 134.73
SHIRLEY PROPERTY (PR) 10/12/2012 EXTENDED DETENTION DRY POND 20% 40% 60%
Fairfax County Public Facilties Manual for TP; CBP Established
Efficiencies for TN and TSS - Dry Extended Detention Ponds 0.42 37% Yes 0.45 0.13 91.88
HISTORIC SULLY INFRASTRUCTURE PLAN (SU) 6/13/2012 REGIONAL POND - WET POND 38% 65% 76%
Fairfax County Public Facilties Manual for TP; CBP Established
Efficiencies - Wet Ponds and Wetlands for TN and TSS 79.05 83% Yes 379.12 93.92 51,559.85
Total Credit: 1,610.69 404.12 196,603.22
Offset Minus Credit: (408.00) (229.81) (114,820.29)


Appendix O
Appendix O
Grandfathered Projects
This appendix is divided into two parts.
The first part is the list of known potential projects that qualify under the grandfathering provisions of the
VSMP regulations as discussed in Section 8. This list was also submitted to DEQ in Appendix R2 of the
Fairfax County 2016 MS4 Program Plan and Annual Report.
The second part contains the list of implemented grandfathered projects that the County must offset as
discussed in Section 7.
Name Tax Map Number Plan Number/ Rezoning Case
11717 Lee Highway 056-2 ((01) 0066 RZ 2008-SP-012
12219 Braddock Road Proposed
Church
067-1 ((01)) 0057, 0058 SP 2005-SP-012
3068 West Ox Road 035-2 ((01)) 0038 RZ 2007-SU-005
9400 GEORGETOWN PIKE (DR) 13-2 ((1)) 7 025155-PL -001-2
Arlington Boulevard Consolidation 049-3 ((01)) 0135; 049-3
((09)) 0011A
PCA 2004-PR-003
Boone Boulevard Tycon II and II 039-1 ((06)) 0069 SE 2007-PR-014
Boone Boulevard Tycon II and III 039-1 ((06)) B1, 0069A PCA -C -597-04
BROOKS PLACE (FORMERLY
WOO PROPERTY) (MA)
60-2 ((1)) 47 025047-SD -001-2
BUSH HILL PRESBYTERIAN
CHURCH (LE)
82-3 ((2)) (1) A; 82-3 ((3))
(B) 8
SPA 99-L -024
CARRICO CORNERS OFFICE
CONDOMINIUM
71-2 ((10)) 1, 2, 11 & 12 RZ 2005-MA-002
CENTERPOINTE CHURCH AT
FAIR OAKS (aka FAIRFAX
ASSEMBLY OF GOD)
46-3 ((1)) 45-50 006753-SP -004-3 RZ 2005-SP-
033
CINDER BED ROAD BUS
DIVISION (LE)
0992 03000001,2,3A,3B 003038-SP-002-4
Cornejo Properties 071-3 ((01)) 0024A, 071-4
((01)) 0020
SE 2009-MA-015

Appendix O
Name Tax Map Number Plan Number/ Rezoning Case
COSTCO FAIRFAX WHSE
EXPANSION - 4725 WEST OX
RD (SP)
56-1 ((1)) 5C; 56-3 ((1)) 5C
& 5D
006552-SP -007-2
CURTISS PROPERTY 81-4 ((1)) 37-39 RZ 2005-LE-021
DAIL PARK LOT 3 AND
MOUNT HEBRON PARK LOT 6
(LE)
81-1 ((2)) 6C and 81-1 ((3)) 3 002712-SD -001-3
DANBURY FOREST 79-1 ((1)) 1 FDPA -C -194
Dranesville United Methodist
Church
066-4 ((01)) 0066B, 006-4
((01)) 0070A, 006-4 ((14)) A
SPA 83-D -022-04
DULLES BUSINESS PARK
HILTON HOTEL
34-4 ((12)) 3A2 , 3A3, 3A4
& 3A5
SE 2004-SU-025
Dulles Executive Plaza 016-3 ((01)) 0004N1,
0031A1
RZ 2006-HM-019
Dulles Station at Dulles Corner
Hotels
15-4 ((15)) 3, 4, 5 FDPA -C -696-03
Exxon-Mobil Corporation 1818
Wiehle Avenue
017-4 ((05)) 0004 SEA 76-C -152-04
Fair Lakes – Land Bay VI-A 045-4 ((01)) 0025E1, 0025,
E2
CDPA 82P-069-01-01
FAIRFAX FARMS, RESUBD OF
LOT 25 (PR)
46-4 ((2)) 25 008672-PL -004-4
Fairfax Memorial Cemetery 069-1 ((01) 0001, 069-1 ((01)
0012, 069-1 ((01) 0012A
SPA 81-A -022-09
FD- Circle Towers 048-3 ((01)) 0053, 048-4
((01)) 0003, 048-4 ((01))
0003A1, 048-3 ((03)) 0003B,
048-4 ((01)) 0003B1
FDPA -B -993-02
FERGUSON WATERWORKS
CHANTILLY STORAGE YARD
(SU)
34-2 ((1)) 17E 000062-SP -002-3 SE 2006-SU-
04
Flint Hill Lower School (East
Campus)
047-2 ((01)) 0036A, 0037,
0038, 0052A
SEA 84-P -105-03
FLINT HILL SCHOOL 47-3 ((1)) 17A, 18, 19, 20,
20A, 21A, 22, 22A, 23, 24,
34A
SEA 99-P -046

Appendix O
Name Tax Map Number Plan Number/ Rezoning Case
FLORIS UNITED METHODIST
CHURCH (Phase III)
24-2 ((1)) 8; 25-1 ((1)) 2A SPA 01-H -011
Franconia Hills, Section 2, Lot 10 081-3 ((05)) 0010 RZ 2006-LE-010
FULL GOSPEL FIRST CHURCH
OF WASHINGTON
2-1 ((1)) 59, 59B, 59C & 59D SPA 89-M -041-02
GESHER JEWISH DAY
SCHOOL (Part)
56-4 ((1)) 19B; 56-4 ((3)) 1 SEA 01-S -028
Global Mission Village 046-3 ((01)) 0015A1, 046-3
((01)) 0015A2, 046-3 ((01))
0015A3
PCA 83-C -021-02
Good Shepherd Catholic Church 110-2 ((1)) 22A SPA 82-V -035-03
GRIST MILL PARK -
SYNTHETIC TURF FIELD #5 -
(MV)
1101 01 002298-MSP-002-1
GRUM WOODS SUBDIVISION
(SP)
90-3 ((1)) 2 007645-SD -001-7
HILLTOP GOLF COURSE
PHASE II
100-1 ((1)) 23A RZ 2006-LE-002
INOVA HEALTH CARE
SERVICES (FAIR OAKS
HOSPITAL)
45-2 ((1)) 41B1, 41L, 41L3,
41L4 & 41L5; 45-2 ((2)) 38,
39A, 39B, 46A1 & 51A1
SEA 84-C -076-09 PCA 2000-
SU-032-03 RZ 2011-SU-004
Islamic Saudi Academy 068-3 ((01)) 0061, 0062,
0063, 0064
SE 2008-SP-025
J. K. Investments, Inc. Property 109-2 ((01)) 0013A SEA 85-L -137 RZ 2008-MV-
007
Jerusalem Baptist Church 068-3 ((01)) 0052, 0054,
0055A
SPA 73-S -113
Lackawanna Drive (a.k.a.
Valentine Woods)
090-3 ((03)) 0006, 0007,
0008
RZ 2006-LE-026
LAUREL HILL CENTRAL
GREEN (MV)
107-3 ((1)) 19 001183-MSP -007-1
Lee Chapel Road 088-1 ((01)) 0028 PCA 2004-SP-036
LINCOLN PARK 4 BLOCK 8
(SU)
24-4 ((1)) 6B4 005810-SP -016-2.1 RZ 2006-
SU-007
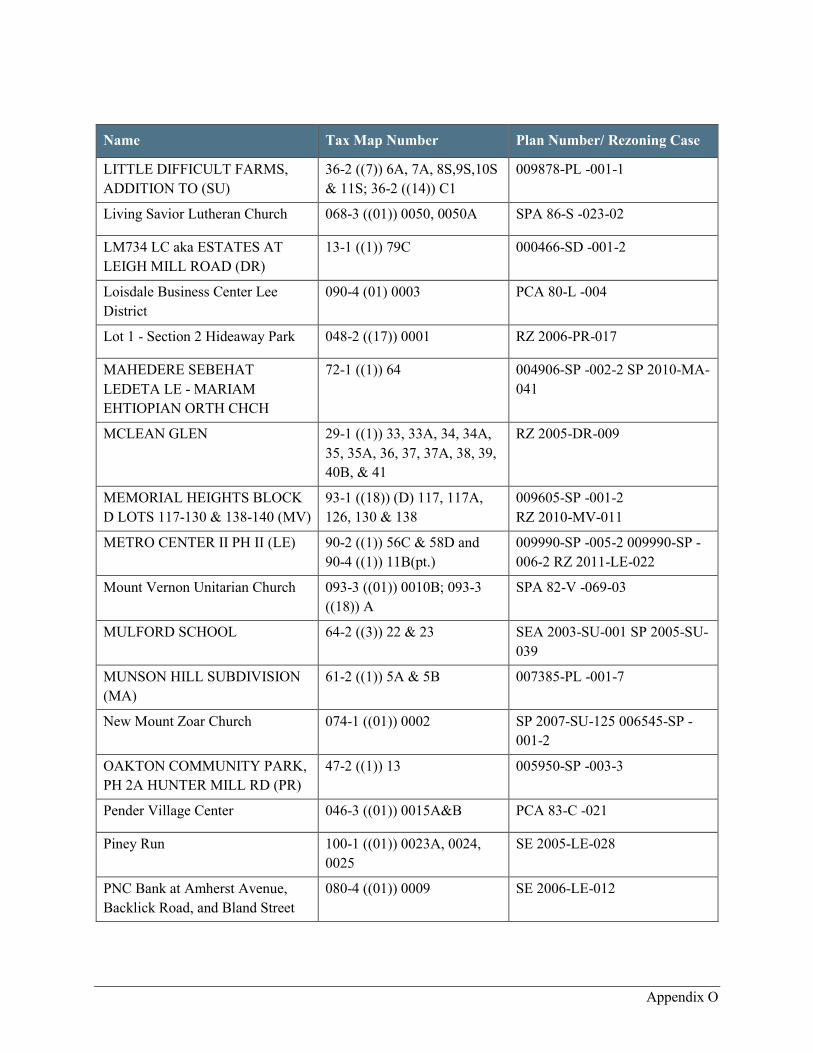
Appendix O
Name Tax Map Number Plan Number/ Rezoning Case
LITTLE DIFFICULT FARMS,
ADDITION TO (SU)
36-2 ((7)) 6A, 7A, 8S,9S,10S
& 11S; 36-2 ((14)) C1
009878-PL -001-1
Living Savior Lutheran Church 068-3 ((01)) 0050, 0050A SPA 86-S -023-02
LM734 LC aka ESTATES AT
LEIGH MILL ROAD (DR)
13-1 ((1)) 79C 000466-SD -001-2
Loisdale Business Center Lee
District
090-4 (01) 0003 PCA 80-L -004
Lot 1 - Section 2 Hideaway Park 048-2 ((17)) 0001 RZ 2006-PR-017
MAHEDERE SEBEHAT
LEDETA LE - MARIAM
EHTIOPIAN ORTH CHCH
72-1 ((1)) 64 004906-SP -002-2 SP 2010-MA-
041
MCLEAN GLEN 29-1 ((1)) 33, 33A, 34, 34A,
35, 35A, 36, 37, 37A, 38, 39,
40B, & 41
RZ 2005-DR-009
MEMORIAL HEIGHTS BLOCK
D LOTS 117-130 & 138-140 (MV)
93-1 ((18)) (D) 117, 117A,
126, 130 & 138
009605-SP -001-2
RZ 2010-MV-011
METRO CENTER II PH II (LE) 90-2 ((1)) 56C & 58D and
90-4 ((1)) 11B(pt.)
009990-SP -005-2 009990-SP -
006-2 RZ 2011-LE-022
Mount Vernon Unitarian Church 093-3 ((01)) 0010B; 093-3
((18)) A
SPA 82-V -069-03
MULFORD SCHOOL 64-2 ((3)) 22 & 23 SEA 2003-SU-001 SP 2005-SU-
039
MUNSON HILL SUBDIVISION
(MA)
61-2 ((1)) 5A & 5B 007385-PL -001-7
New Mount Zoar Church 074-1 ((01)) 0002 SP 2007-SU-125 006545-SP -
001-2
OAKTON COMMUNITY PARK,
PH 2A HUNTER MILL RD (PR)
47-2 ((1)) 13 005950-SP -003-3
Pender Village Center 046-3 ((01)) 0015A&B PCA 83-C -021
Piney Run 100-1 ((01)) 0023A, 0024,
0025
SE 2005-LE-028
PNC Bank at Amherst Avenue,
Backlick Road, and Bland Street
080-4 ((01)) 0009 SE 2006-LE-012

Appendix O
Name Tax Map Number Plan Number/ Rezoning Case
POHICK STREAM VALLEY
TRAIL - LIBERTY BELL TRAIL
(S
0783 07000000D; 0784
13000000D; 0784
20000000F; 0784
24000000D; 0784
24000000G; 0784
25000000B
007203-MSP -001-2
PRCD - Fairway Apartments 017-2 ((18)) 0001, 017-2
((19)) 0002
PRC -A -502-02
Property of James Hollingsworth 049-1 ((04)) 0016 RZ 2009-PR-022
RESIDENCES AT NORTH HILL
(MV)
92-4 ((1)) 82A 005563-SP -001-3
RESTON PRESBYTERIAN
CHURCH PH 1 EXPANSION
(HM)
18-3 ((1)) 6 004772-SP -002-1 SPA 82-D -
047-02
Riverside Gardens Recreation
Center
102-3 ((01)) 0042A, 0043 SPA 71-V -216-02
ROSE HILL MANOR aka ROSE
HILL FARM SUBDIVISION (LE)
82-3 ((1)) 38; 82-3 ((11)) 45
& 46; 82-3 ((24)) A & 10A
008945-PL -001-2
Springfield Metro Center II
(office)
090-2 ((01) 0056C pt. PCA 1998-LE-064-02
Spring Hill Demonstration Project
Part B
29-3 ((1)) 60C RZ 2010-PR-014B
ST MARK COPTIC CHURCH
EXPANSION PH1 (SP)
67-1 ((4)) 27A, 31-34 & 42 008271-SP -003-2 SPA 89-S -
013-02
ST. PAUL'S LUTHERAN
CHURCH
40-3 ((1)) 7A & 9 SPA 93-P -046-02
THE ELLIPSE AT WESTFIELDS 34-3 ((14)) 2 SE 2010-SU-012
THE ELLIPSE AT WESTFIELDS 34-3 ((14) 4 SE 2010-SU-013
The Potomac School 031-1 ((01)) 0005, 0007,
0008, 0010A, 0010B, 0010C,
0012A
SEA 85-D -097-05
Towers Crescent 039-2 ((29)) B, 0001A1,
0001E, 0001F
RZ 2006-PR-028
United Wesleyan Church 081-4 ((01)) 0091A, 0094A SP 2007-LE-029
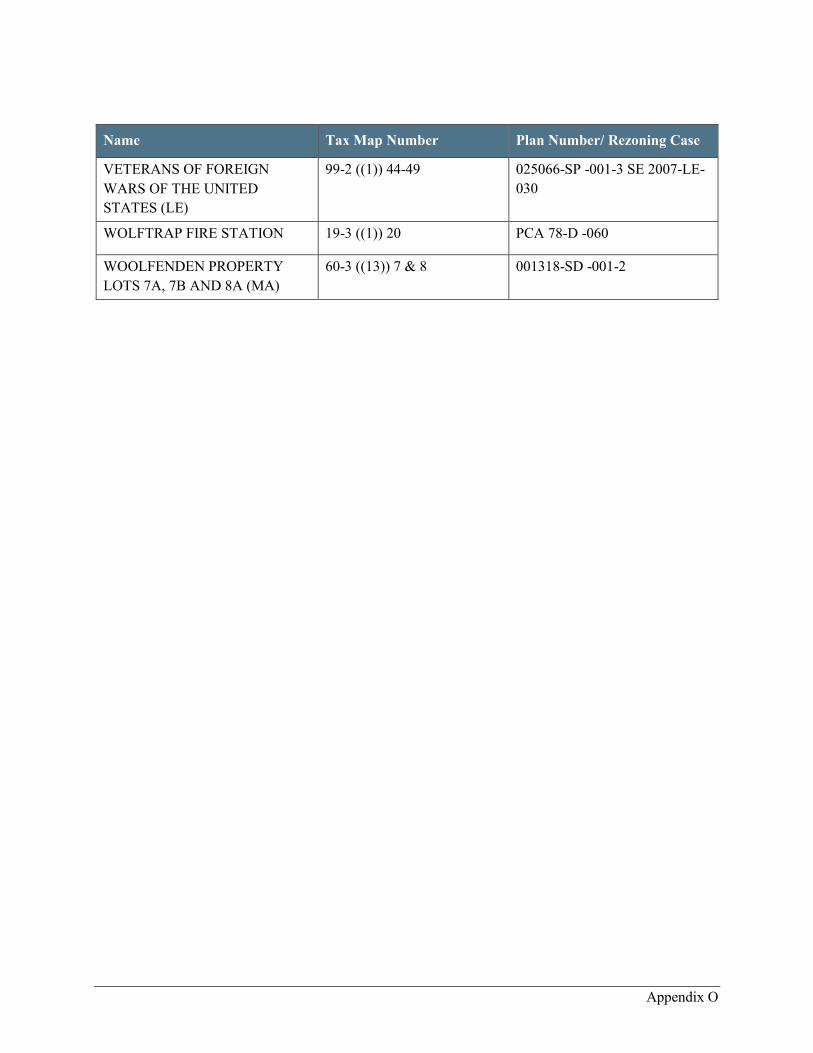
Appendix O
Name Tax Map Number Plan Number/ Rezoning Case
VETERANS OF FOREIGN
WARS OF THE UNITED
STATES (LE)
99-2 ((1)) 44-49 025066-SP -001-3 SE 2007-LE-
030
WOLFTRAP FIRE STATION 19-3 ((1)) 20 PCA 78-D -060
WOOLFENDEN PROPERTY
LOTS 7A, 7B AND 8A (MA)
60-3 ((13)) 7 & 8 001318-SD -001-2
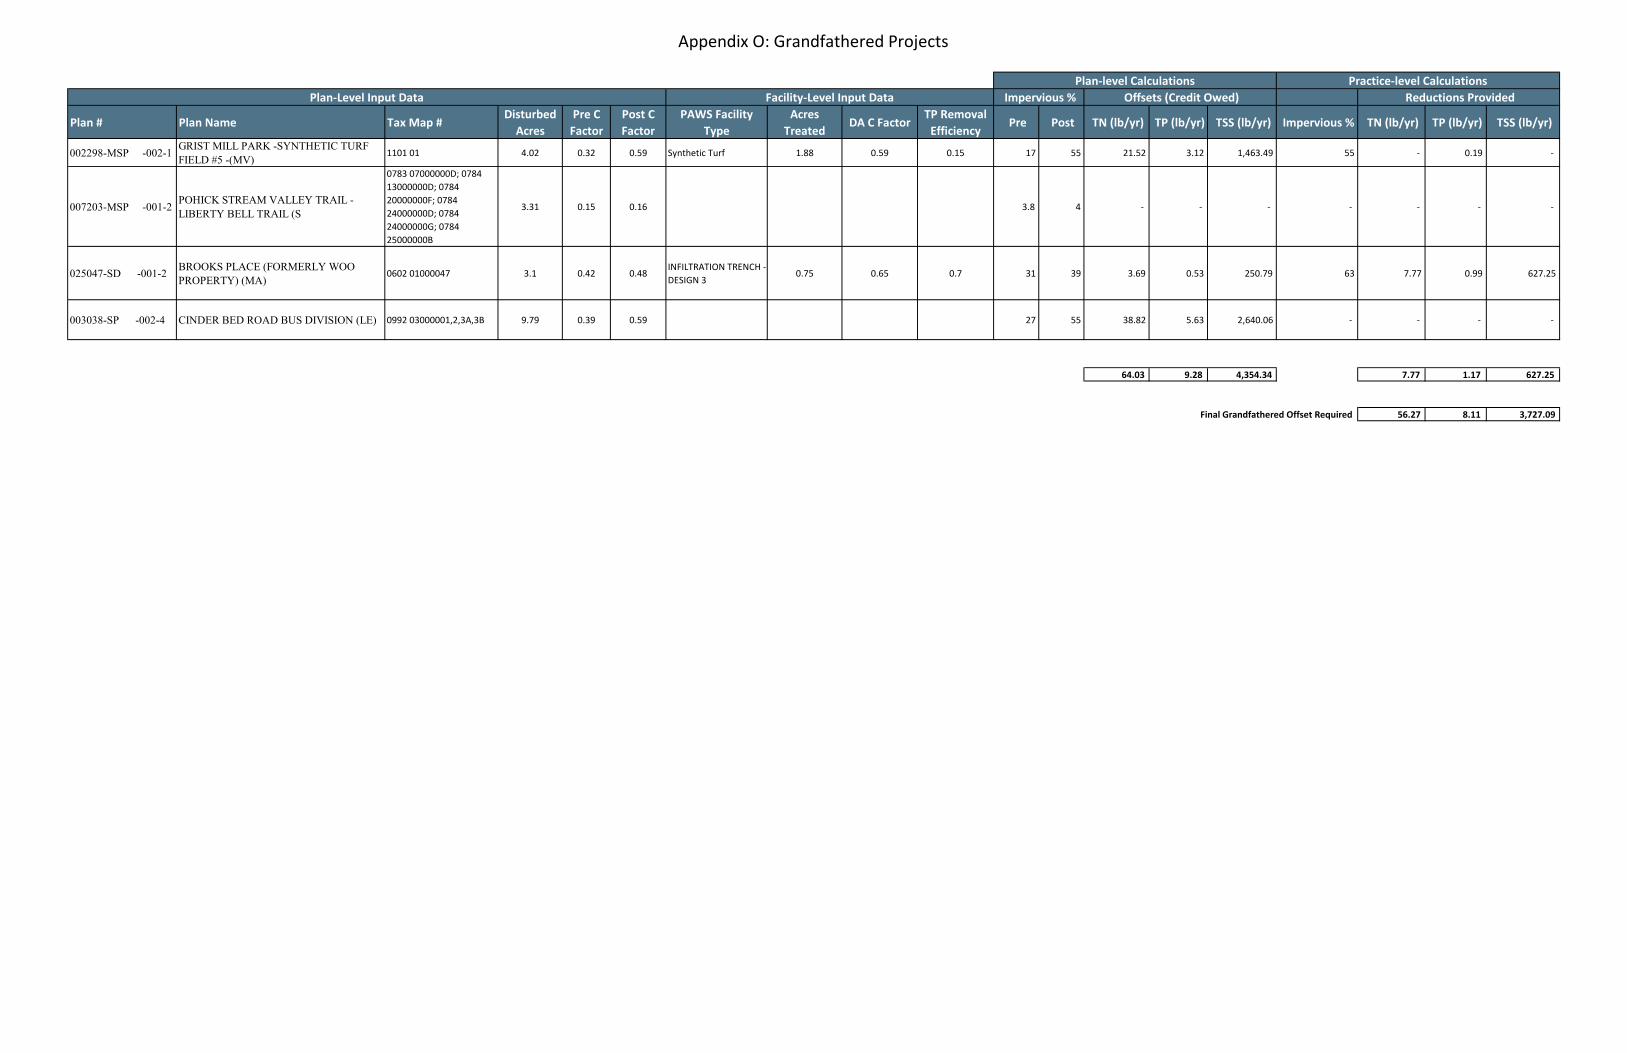
Appendix O: Grandfathered Projects
Plan # Plan Name Tax Map #Disturbed
Acres
Pre C
Factor
Post C
Factor
PAWS Facility
Type
Acres
TreatedDA C Factor
TP Removal
Efficiency Pre Post TN (lb/yr) TP (lb/yr) TSS (lb/yr) Impervious % TN (lb/yr) TP (lb/yr) TSS (lb/yr)
002298-MSP -002-1GRIST MILL PARK -SYNTHETIC TURF
FIELD #5 -(MV)1101 01 4.02 0.32 0.59 Synthetic Turf 1.88 0.59 0.15 17 55 21.52 3.12 1,463.49 55 - 0.19 -
007203-MSP -001-2POHICK STREAM VALLEY TRAIL -
LIBERTY BELL TRAIL (S
0783 07000000D; 0784
13000000D; 0784
20000000F; 0784
24000000D; 0784
24000000G; 0784
25000000B
3.31 0.15 0.16 3.8 4 - - - - - - -
025047-SD -001-2BROOKS PLACE (FORMERLY WOO
PROPERTY) (MA)0602 01000047 3.1 0.42 0.48
INFILTRATION TRENCH -
DESIGN 30.75 0.65 0.7 31 39 3.69 0.53 250.79 63 7.77 0.99 627.25
003038-SP -002-4 CINDER BED ROAD BUS DIVISION (LE) 0992 03000001,2,3A,3B 9.79 0.39 0.59 27 55 38.82 5.63 2,640.06 - - - -
64.03 9.28 4,354.34 7.77 1.17 627.25
Final Grandfathered Offset Required 56.27 8.11 3,727.09
Plan-Level Input Data Reductions Provided Facility-Level Input Data
Practice-level CalculationsPlan-level Calculations
Offsets (Credit Owed) Impervious %

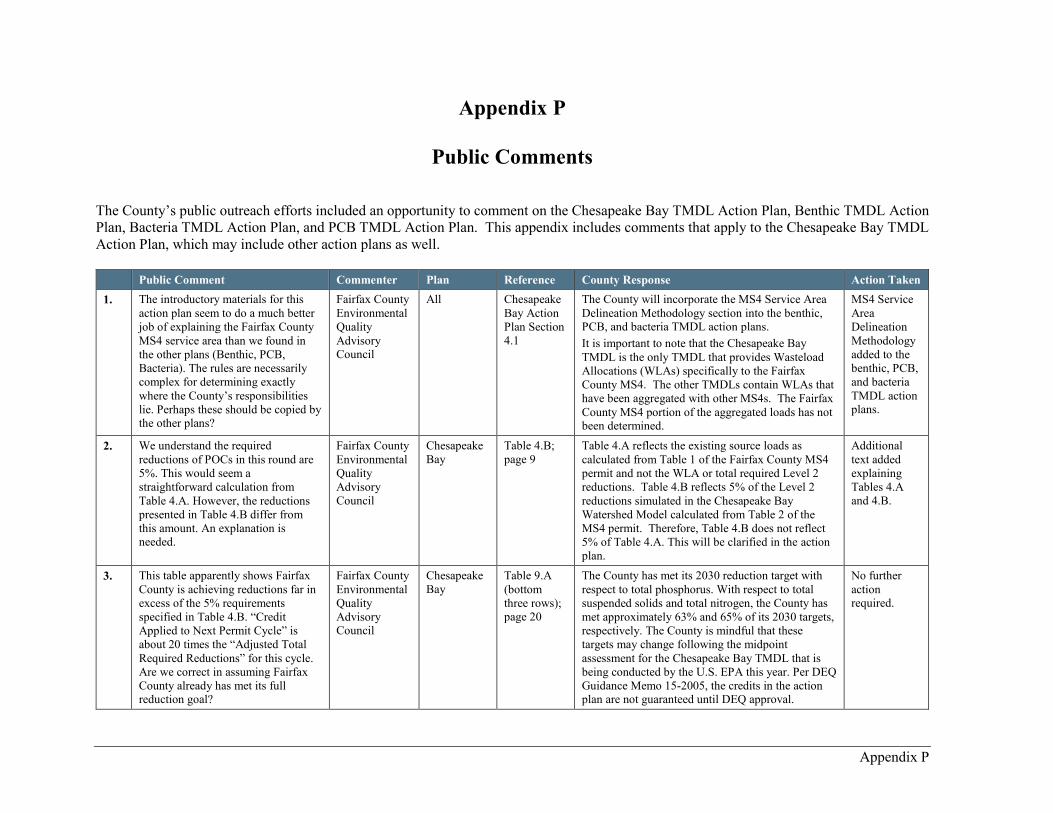
Appendix P
Appendix P
Public Comments
The County’s public outreach efforts included an opportunity to comment on the Chesapeake Bay TMDL Action Plan, Benthic TMDL Action
Plan, Bacteria TMDL Action Plan, and PCB TMDL Action Plan. This appendix includes comments that apply to the Chesapeake Bay TMDL
Action Plan, which may include other action plans as well.
Public Comment Commenter Plan Reference County Response Action Taken
1. The introductory materials for this
action plan seem to do a much better
job of explaining the Fairfax County
MS4 service area than we found in
the other plans (Benthic, PCB,
Bacteria). The rules are necessarily
complex for determining exactly
where the County’s responsibilities
lie. Perhaps these should be copied by the other plans?
Fairfax County
Environmental
Quality
Advisory Council
All Chesapeake
Bay Action
Plan Section
4.1
The County will incorporate the MS4 Service Area
Delineation Methodology section into the benthic, PCB, and bacteria TMDL action plans.
It is important to note that the Chesapeake Bay
TMDL is the only TMDL that provides Wasteload
Allocations (WLAs) specifically to the Fairfax
County MS4. The other TMDLs contain WLAs that
have been aggregated with other MS4s. The Fairfax
County MS4 portion of the aggregated loads has not been determined.
MS4 Service
Area
Delineation
Methodology
added to the
benthic, PCB,
and bacteria
TMDL action plans.
2. We understand the required
reductions of POCs in this round are
5%. This would seem a
straightforward calculation from
Table 4.A. However, the reductions
presented in Table 4.B differ from
this amount. An explanation is needed.
Fairfax County
Environmental
Quality
Advisory
Council
Chesapeake
Bay
Table 4.B;
page 9
Table 4.A reflects the existing source loads as
calculated from Table 1 of the Fairfax County MS4
permit and not the WLA or total required Level 2
reductions. Table 4.B reflects 5% of the Level 2
reductions simulated in the Chesapeake Bay
Watershed Model calculated from Table 2 of the
MS4 permit. Therefore, Table 4.B does not reflect
5% of Table 4.A. This will be clarified in the action
plan.
Additional
text added
explaining
Tables 4.A
and 4.B.
3. This table apparently shows Fairfax
County is achieving reductions far in
excess of the 5% requirements
specified in Table 4.B. “Credit
Applied to Next Permit Cycle” is
about 20 times the “Adjusted Total
Required Reductions” for this cycle.
Are we correct in assuming Fairfax
County already has met its full reduction goal?
Fairfax County
Environmental
Quality
Advisory Council
Chesapeake
Bay
Table 9.A
(bottom
three rows);
page 20
The County has met its 2030 reduction target with
respect to total phosphorus. With respect to total
suspended solids and total nitrogen, the County has
met approximately 63% and 65% of its 2030 targets,
respectively. The County is mindful that these
targets may change following the midpoint
assessment for the Chesapeake Bay TMDL that is
being conducted by the U.S. EPA this year. Per DEQ
Guidance Memo 15-2005, the credits in the action plan are not guaranteed until DEQ approval.
No further
action required.
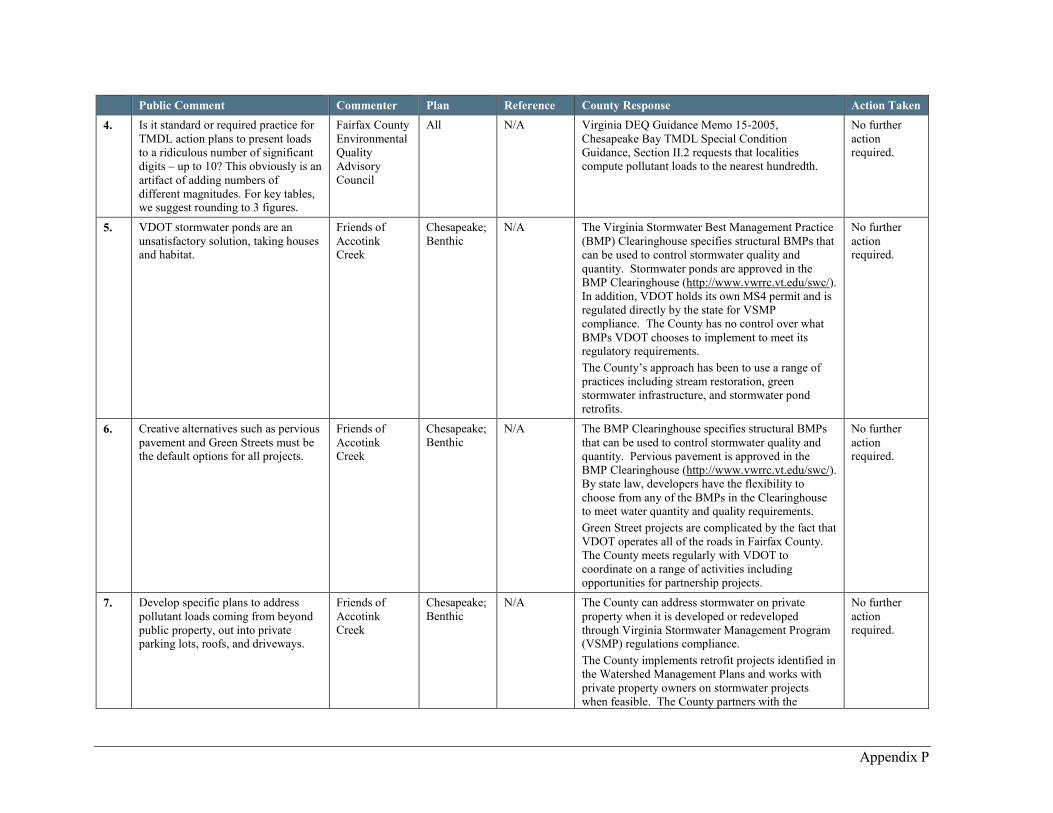
Appendix P
Public Comment Commenter Plan Reference County Response Action Taken
4. Is it standard or required practice for
TMDL action plans to present loads
to a ridiculous number of significant
digits – up to 10? This obviously is an
artifact of adding numbers of
different magnitudes. For key tables, we suggest rounding to 3 figures.
Fairfax County
Environmental
Quality
Advisory
Council
All N/A Virginia DEQ Guidance Memo 15-2005,
Chesapeake Bay TMDL Special Condition
Guidance, Section II.2 requests that localities compute pollutant loads to the nearest hundredth.
No further
action required.
5. VDOT stormwater ponds are an
unsatisfactory solution, taking houses and habitat.
Friends of
Accotink Creek
Chesapeake;
Benthic
N/A The Virginia Stormwater Best Management Practice
(BMP) Clearinghouse specifies structural BMPs that
can be used to control stormwater quality and
quantity. Stormwater ponds are approved in the
BMP Clearinghouse (http://www.vwrrc.vt.edu/swc/).
In addition, VDOT holds its own MS4 permit and is
regulated directly by the state for VSMP
compliance. The County has no control over what
BMPs VDOT chooses to implement to meet its regulatory requirements.
The County’s approach has been to use a range of
practices including stream restoration, green
stormwater infrastructure, and stormwater pond
retrofits.
No further
action required.
6. Creative alternatives such as pervious
pavement and Green Streets must be the default options for all projects.
Friends of
Accotink Creek
Chesapeake;
Benthic
N/A The BMP Clearinghouse specifies structural BMPs
that can be used to control stormwater quality and
quantity. Pervious pavement is approved in the
BMP Clearinghouse (http://www.vwrrc.vt.edu/swc/).
By state law, developers have the flexibility to
choose from any of the BMPs in the Clearinghouse to meet water quantity and quality requirements.
Green Street projects are complicated by the fact that
VDOT operates all of the roads in Fairfax County.
The County meets regularly with VDOT to
coordinate on a range of activities including
opportunities for partnership projects.
No further
action required.
7. Develop specific plans to address
pollutant loads coming from beyond
public property, out into private parking lots, roofs, and driveways.
Friends of
Accotink Creek
Chesapeake;
Benthic
N/A The County can address stormwater on private
property when it is developed or redeveloped
through Virginia Stormwater Management Program (VSMP) regulations compliance.
The County implements retrofit projects identified in
the Watershed Management Plans and works with
private property owners on stormwater projects
when feasible. The County partners with the
No further
action required.
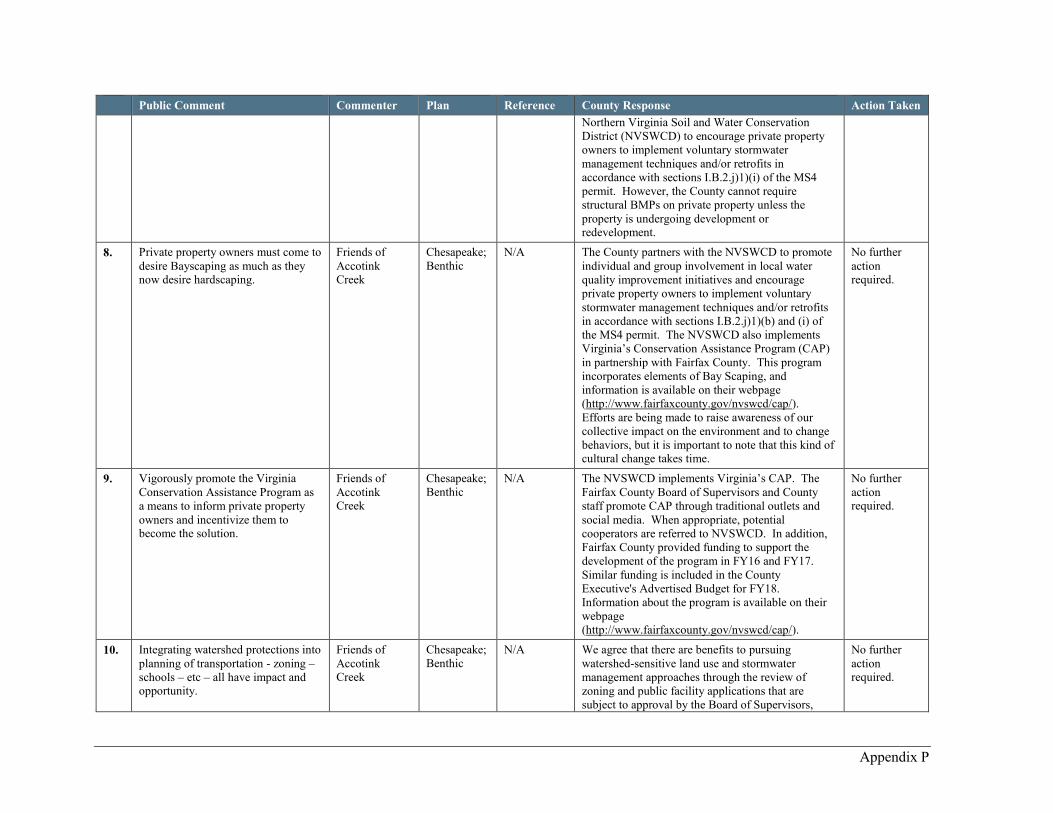
Appendix P
Public Comment Commenter Plan Reference County Response Action Taken
Northern Virginia Soil and Water Conservation
District (NVSWCD) to encourage private property
owners to implement voluntary stormwater
management techniques and/or retrofits in
accordance with sections I.B.2.j)1)(i) of the MS4
permit. However, the County cannot require
structural BMPs on private property unless the
property is undergoing development or redevelopment.
8. Private property owners must come to
desire Bayscaping as much as they now desire hardscaping.
Friends of
Accotink Creek
Chesapeake;
Benthic
N/A The County partners with the NVSWCD to promote
individual and group involvement in local water
quality improvement initiatives and encourage
private property owners to implement voluntary
stormwater management techniques and/or retrofits
in accordance with sections I.B.2.j)1)(b) and (i) of
the MS4 permit. The NVSWCD also implements
Virginia’s Conservation Assistance Program (CAP)
in partnership with Fairfax County. This program
incorporates elements of Bay Scaping, and
information is available on their webpage
(http://www.fairfaxcounty.gov/nvswcd/cap/).
Efforts are being made to raise awareness of our
collective impact on the environment and to change
behaviors, but it is important to note that this kind of cultural change takes time.
No further
action required.
9. Vigorously promote the Virginia
Conservation Assistance Program as
a means to inform private property
owners and incentivize them to become the solution.
Friends of
Accotink Creek
Chesapeake;
Benthic
N/A The NVSWCD implements Virginia’s CAP. The
Fairfax County Board of Supervisors and County
staff promote CAP through traditional outlets and
social media. When appropriate, potential
cooperators are referred to NVSWCD. In addition,
Fairfax County provided funding to support the
development of the program in FY16 and FY17.
Similar funding is included in the County
Executive's Advertised Budget for FY18.
Information about the program is available on their
webpage
(http://www.fairfaxcounty.gov/nvswcd/cap/).
No further
action required.
10. Integrating watershed protections into
planning of transportation - zoning –
schools – etc – all have impact and opportunity.
Friends of
Accotink Creek
Chesapeake;
Benthic
N/A We agree that there are benefits to pursuing
watershed-sensitive land use and stormwater
management approaches through the review of
zoning and public facility applications that are
subject to approval by the Board of Supervisors,
No further
action required.
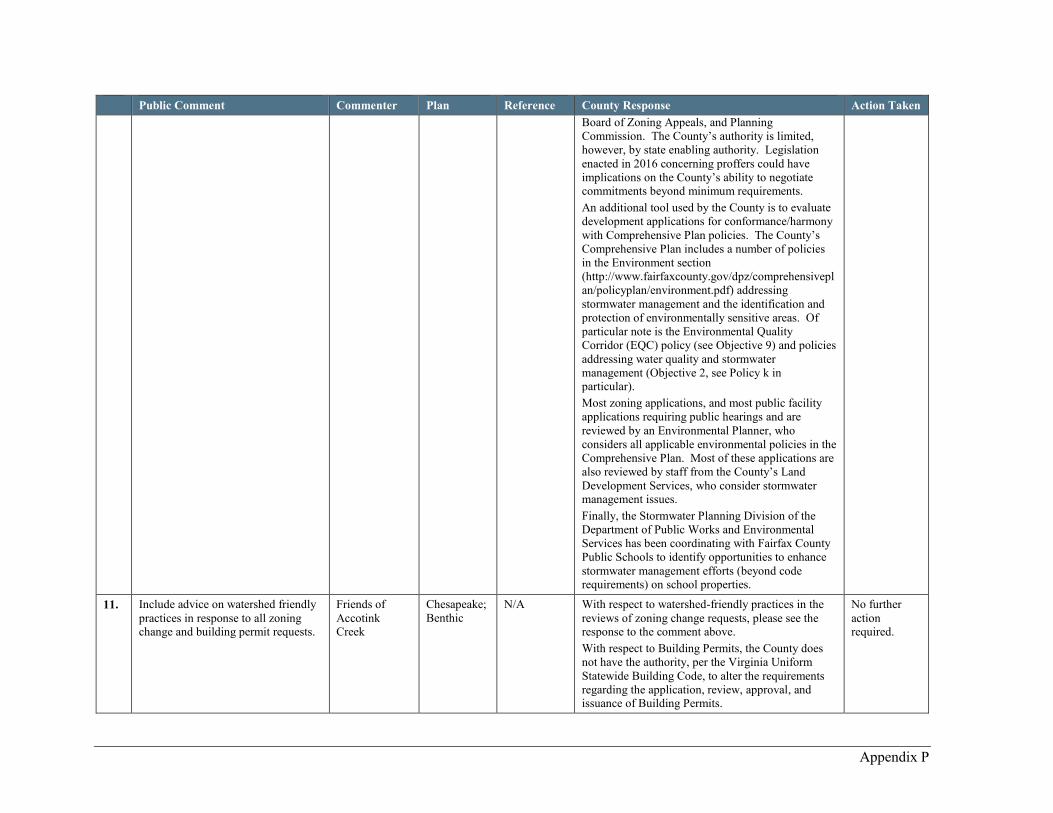
Appendix P
Public Comment Commenter Plan Reference County Response Action Taken
Board of Zoning Appeals, and Planning
Commission. The County’s authority is limited,
however, by state enabling authority. Legislation
enacted in 2016 concerning proffers could have
implications on the County’s ability to negotiate commitments beyond minimum requirements.
An additional tool used by the County is to evaluate
development applications for conformance/harmony
with Comprehensive Plan policies. The County’s
Comprehensive Plan includes a number of policies
in the Environment section
(http://www.fairfaxcounty.gov/dpz/comprehensivepl
an/policyplan/environment.pdf) addressing
stormwater management and the identification and
protection of environmentally sensitive areas. Of
particular note is the Environmental Quality
Corridor (EQC) policy (see Objective 9) and policies
addressing water quality and stormwater
management (Objective 2, see Policy k in particular).
Most zoning applications, and most public facility
applications requiring public hearings and are
reviewed by an Environmental Planner, who
considers all applicable environmental policies in the
Comprehensive Plan. Most of these applications are
also reviewed by staff from the County’s Land
Development Services, who consider stormwater management issues.
Finally, the Stormwater Planning Division of the
Department of Public Works and Environmental
Services has been coordinating with Fairfax County
Public Schools to identify opportunities to enhance
stormwater management efforts (beyond code requirements) on school properties.
11. Include advice on watershed friendly
practices in response to all zoning change and building permit requests.
Friends of
Accotink Creek
Chesapeake;
Benthic
N/A With respect to watershed-friendly practices in the
reviews of zoning change requests, please see the response to the comment above.
With respect to Building Permits, the County does
not have the authority, per the Virginia Uniform
Statewide Building Code, to alter the requirements
regarding the application, review, approval, and issuance of Building Permits.
No further
action required.
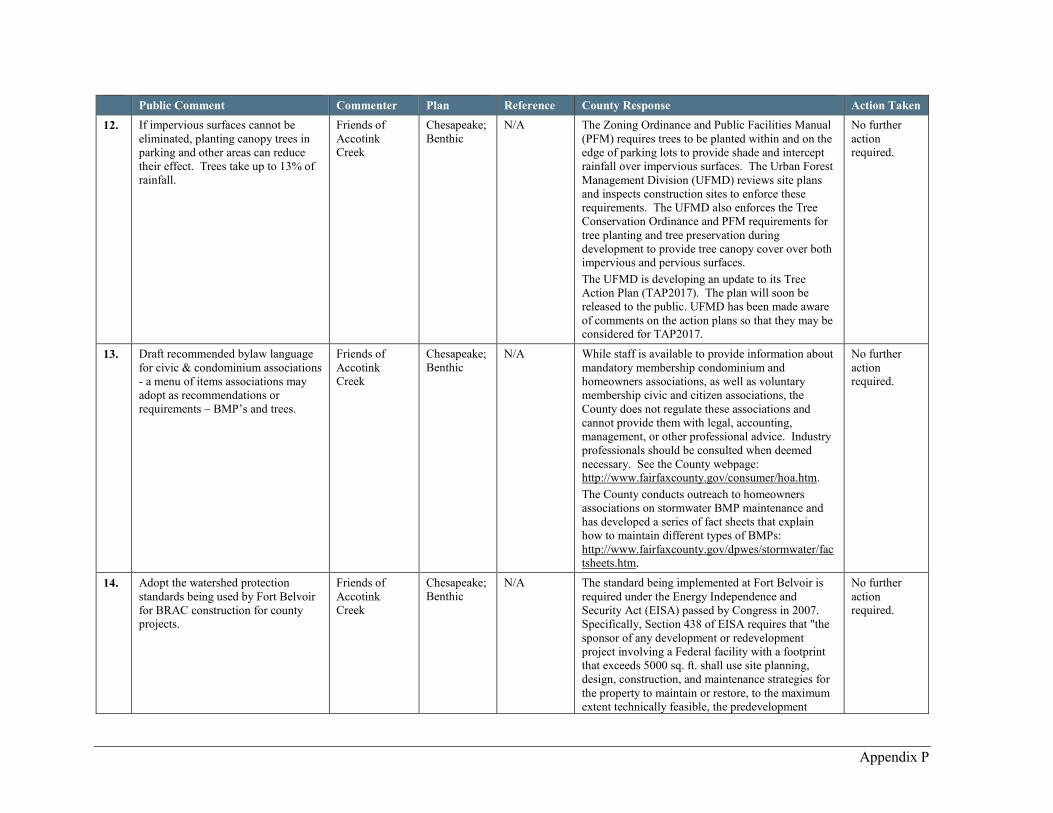
Appendix P
Public Comment Commenter Plan Reference County Response Action Taken
12. If impervious surfaces cannot be
eliminated, planting canopy trees in
parking and other areas can reduce
their effect. Trees take up to 13% of
rainfall.
Friends of
Accotink Creek
Chesapeake;
Benthic
N/A The Zoning Ordinance and Public Facilities Manual
(PFM) requires trees to be planted within and on the
edge of parking lots to provide shade and intercept
rainfall over impervious surfaces. The Urban Forest
Management Division (UFMD) reviews site plans
and inspects construction sites to enforce these
requirements. The UFMD also enforces the Tree
Conservation Ordinance and PFM requirements for
tree planting and tree preservation during
development to provide tree canopy cover over both
impervious and pervious surfaces.
The UFMD is developing an update to its Tree
Action Plan (TAP2017). The plan will soon be
released to the public. UFMD has been made aware
of comments on the action plans so that they may be considered for TAP2017.
No further
action required.
13. Draft recommended bylaw language
for civic & condominium associations
- a menu of items associations may
adopt as recommendations or
requirements – BMP’s and trees.
Friends of
Accotink Creek
Chesapeake;
Benthic
N/A While staff is available to provide information about
mandatory membership condominium and
homeowners associations, as well as voluntary
membership civic and citizen associations, the
County does not regulate these associations and
cannot provide them with legal, accounting,
management, or other professional advice. Industry
professionals should be consulted when deemed
necessary. See the County webpage: http://www.fairfaxcounty.gov/consumer/hoa.htm.
The County conducts outreach to homeowners
associations on stormwater BMP maintenance and
has developed a series of fact sheets that explain
how to maintain different types of BMPs:
http://www.fairfaxcounty.gov/dpwes/stormwater/factsheets.htm.
No further
action required.
14. Adopt the watershed protection
standards being used by Fort Belvoir
for BRAC construction for county
projects.
Friends of
Accotink Creek
Chesapeake;
Benthic
N/A The standard being implemented at Fort Belvoir is
required under the Energy Independence and
Security Act (EISA) passed by Congress in 2007.
Specifically, Section 438 of EISA requires that "the
sponsor of any development or redevelopment
project involving a Federal facility with a footprint
that exceeds 5000 sq. ft. shall use site planning,
design, construction, and maintenance strategies for
the property to maintain or restore, to the maximum
extent technically feasible, the predevelopment
No further
action required.
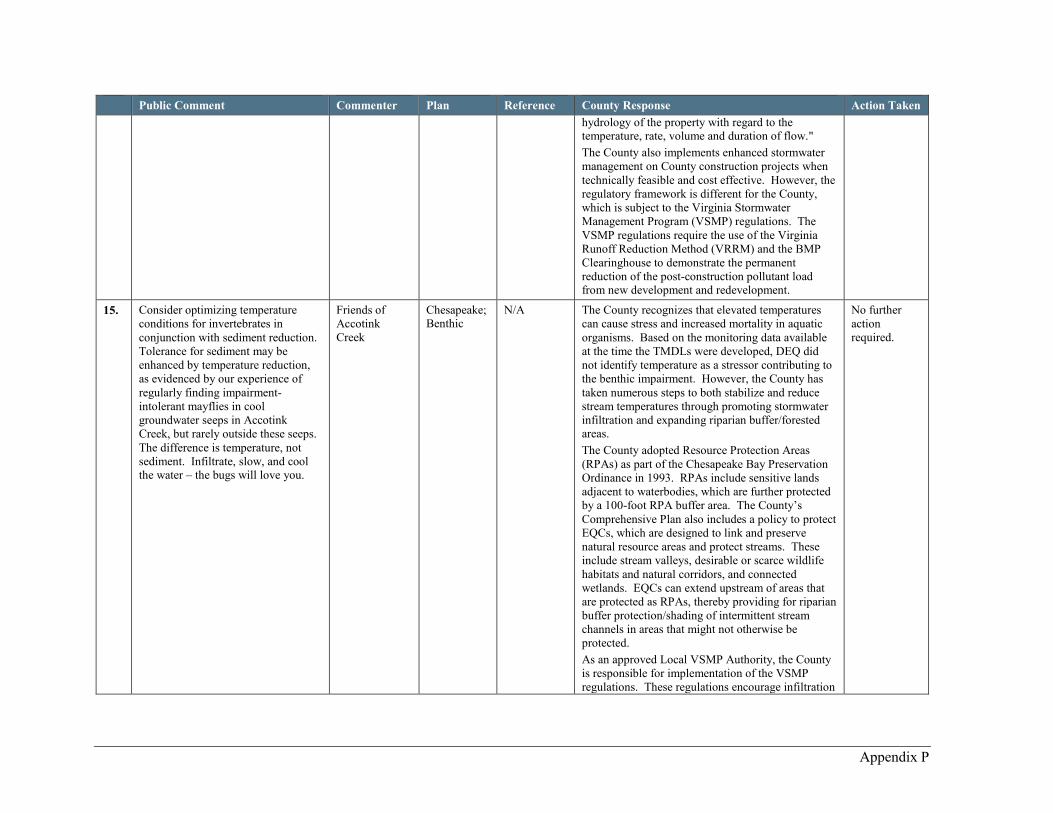
Appendix P
Public Comment Commenter Plan Reference County Response Action Taken
hydrology of the property with regard to the temperature, rate, volume and duration of flow."
The County also implements enhanced stormwater
management on County construction projects when
technically feasible and cost effective. However, the
regulatory framework is different for the County,
which is subject to the Virginia Stormwater
Management Program (VSMP) regulations. The
VSMP regulations require the use of the Virginia
Runoff Reduction Method (VRRM) and the BMP
Clearinghouse to demonstrate the permanent
reduction of the post-construction pollutant load from new development and redevelopment.
15. Consider optimizing temperature
conditions for invertebrates in
conjunction with sediment reduction.
Tolerance for sediment may be
enhanced by temperature reduction,
as evidenced by our experience of
regularly finding impairment-
intolerant mayflies in cool
groundwater seeps in Accotink
Creek, but rarely outside these seeps.
The difference is temperature, not
sediment. Infiltrate, slow, and cool the water – the bugs will love you.
Friends of
Accotink
Creek
Chesapeake; Benthic
N/A The County recognizes that elevated temperatures
can cause stress and increased mortality in aquatic
organisms. Based on the monitoring data available
at the time the TMDLs were developed, DEQ did
not identify temperature as a stressor contributing to
the benthic impairment. However, the County has
taken numerous steps to both stabilize and reduce
stream temperatures through promoting stormwater
infiltration and expanding riparian buffer/forested areas.
The County adopted Resource Protection Areas
(RPAs) as part of the Chesapeake Bay Preservation
Ordinance in 1993. RPAs include sensitive lands
adjacent to waterbodies, which are further protected
by a 100-foot RPA buffer area. The County’s
Comprehensive Plan also includes a policy to protect
EQCs, which are designed to link and preserve
natural resource areas and protect streams. These
include stream valleys, desirable or scarce wildlife
habitats and natural corridors, and connected
wetlands. EQCs can extend upstream of areas that
are protected as RPAs, thereby providing for riparian
buffer protection/shading of intermittent stream
channels in areas that might not otherwise be
protected.
As an approved Local VSMP Authority, the County
is responsible for implementation of the VSMP
regulations. These regulations encourage infiltration
No further
action
required.
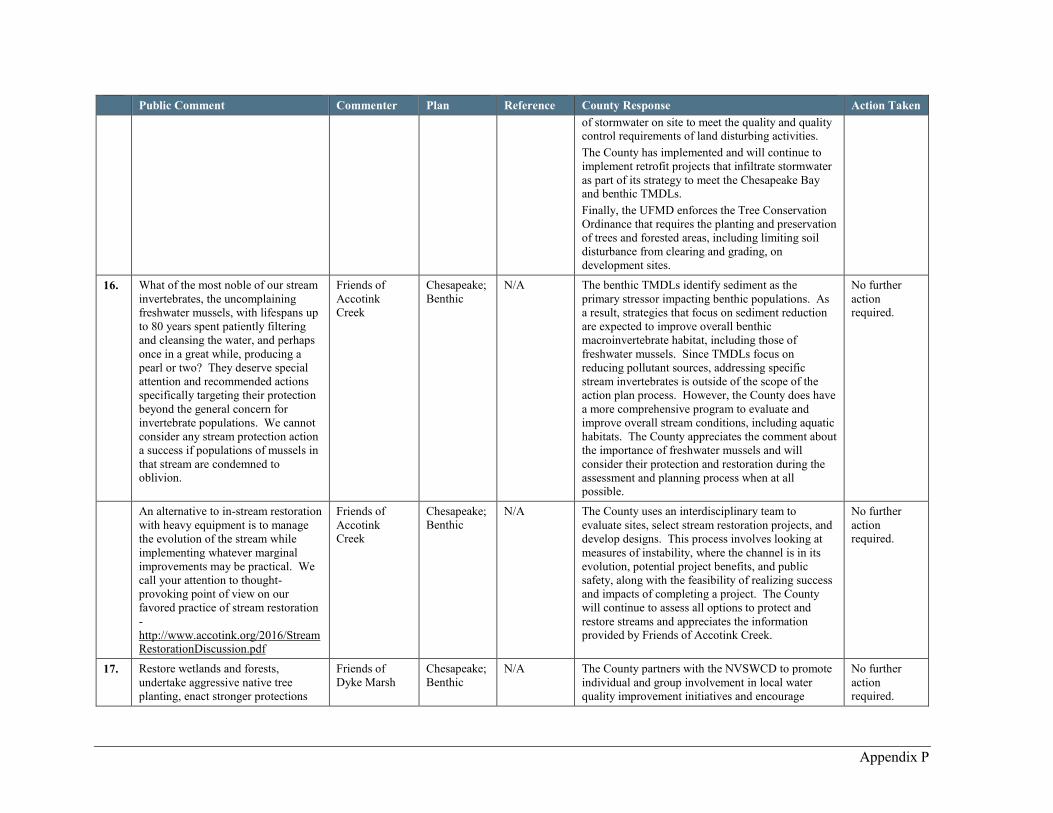
Appendix P
Public Comment Commenter Plan Reference County Response Action Taken
of stormwater on site to meet the quality and quality control requirements of land disturbing activities.
The County has implemented and will continue to
implement retrofit projects that infiltrate stormwater
as part of its strategy to meet the Chesapeake Bay and benthic TMDLs.
Finally, the UFMD enforces the Tree Conservation
Ordinance that requires the planting and preservation
of trees and forested areas, including limiting soil
disturbance from clearing and grading, on
development sites.
16. What of the most noble of our stream
invertebrates, the uncomplaining
freshwater mussels, with lifespans up
to 80 years spent patiently filtering
and cleansing the water, and perhaps
once in a great while, producing a
pearl or two? They deserve special
attention and recommended actions
specifically targeting their protection
beyond the general concern for
invertebrate populations. We cannot
consider any stream protection action
a success if populations of mussels in
that stream are condemned to oblivion.
Friends of
Accotink Creek
Chesapeake;
Benthic
N/A The benthic TMDLs identify sediment as the
primary stressor impacting benthic populations. As
a result, strategies that focus on sediment reduction
are expected to improve overall benthic
macroinvertebrate habitat, including those of
freshwater mussels. Since TMDLs focus on
reducing pollutant sources, addressing specific
stream invertebrates is outside of the scope of the
action plan process. However, the County does have
a more comprehensive program to evaluate and
improve overall stream conditions, including aquatic
habitats. The County appreciates the comment about
the importance of freshwater mussels and will
consider their protection and restoration during the
assessment and planning process when at all possible.
No further
action required.
An alternative to in-stream restoration
with heavy equipment is to manage
the evolution of the stream while
implementing whatever marginal
improvements may be practical. We
call your attention to thought-
provoking point of view on our
favored practice of stream restoration
-
http://www.accotink.org/2016/StreamRestorationDiscussion.pdf
Friends of
Accotink Creek
Chesapeake;
Benthic
N/A The County uses an interdisciplinary team to
evaluate sites, select stream restoration projects, and
develop designs. This process involves looking at
measures of instability, where the channel is in its
evolution, potential project benefits, and public
safety, along with the feasibility of realizing success
and impacts of completing a project. The County
will continue to assess all options to protect and
restore streams and appreciates the information provided by Friends of Accotink Creek.
No further
action required.
17. Restore wetlands and forests,
undertake aggressive native tree
planting, enact stronger protections
Friends of
Dyke Marsh
Chesapeake;
Benthic
N/A The County partners with the NVSWCD to promote
individual and group involvement in local water
quality improvement initiatives and encourage
No further
action required.
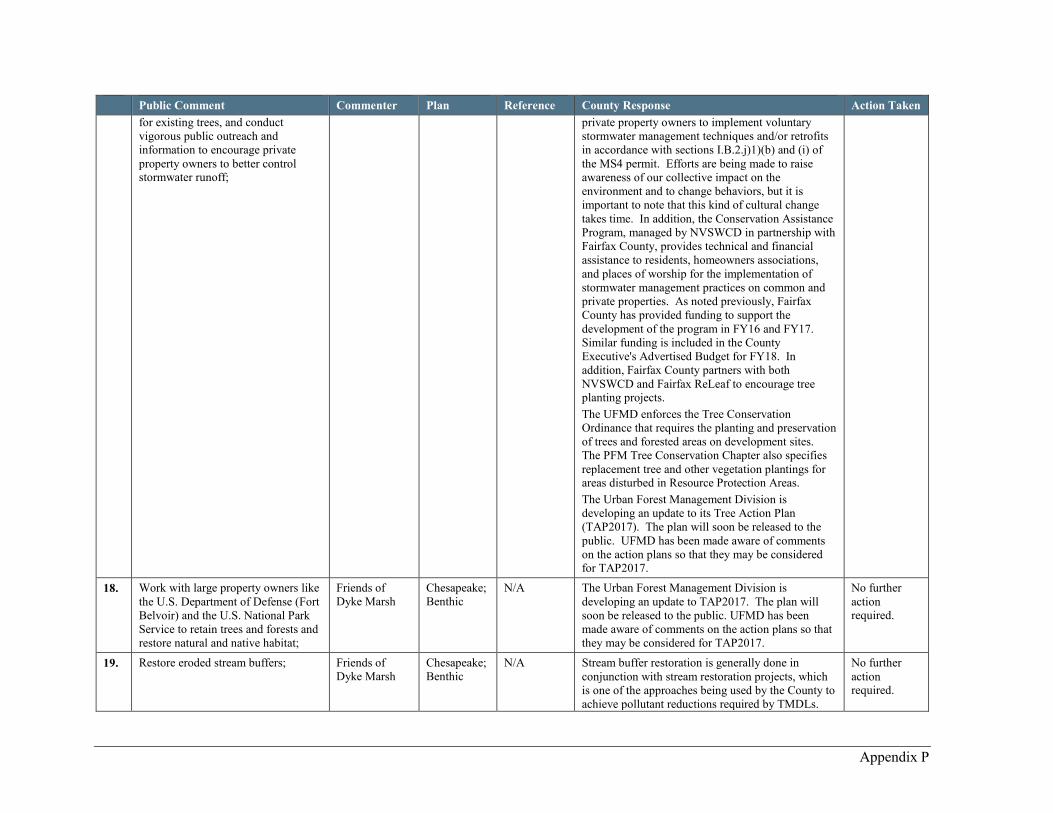
Appendix P
Public Comment Commenter Plan Reference County Response Action Taken
for existing trees, and conduct
vigorous public outreach and
information to encourage private
property owners to better control stormwater runoff;
private property owners to implement voluntary
stormwater management techniques and/or retrofits
in accordance with sections I.B.2.j)1)(b) and (i) of
the MS4 permit. Efforts are being made to raise
awareness of our collective impact on the
environment and to change behaviors, but it is
important to note that this kind of cultural change
takes time. In addition, the Conservation Assistance
Program, managed by NVSWCD in partnership with
Fairfax County, provides technical and financial
assistance to residents, homeowners associations,
and places of worship for the implementation of
stormwater management practices on common and
private properties. As noted previously, Fairfax
County has provided funding to support the
development of the program in FY16 and FY17.
Similar funding is included in the County
Executive's Advertised Budget for FY18. In
addition, Fairfax County partners with both
NVSWCD and Fairfax ReLeaf to encourage tree planting projects.
The UFMD enforces the Tree Conservation
Ordinance that requires the planting and preservation
of trees and forested areas on development sites.
The PFM Tree Conservation Chapter also specifies
replacement tree and other vegetation plantings for areas disturbed in Resource Protection Areas.
The Urban Forest Management Division is
developing an update to its Tree Action Plan
(TAP2017). The plan will soon be released to the
public. UFMD has been made aware of comments
on the action plans so that they may be considered for TAP2017.
18. Work with large property owners like
the U.S. Department of Defense (Fort
Belvoir) and the U.S. National Park
Service to retain trees and forests and
restore natural and native habitat;
Friends of
Dyke Marsh
Chesapeake;
Benthic
N/A The Urban Forest Management Division is
developing an update to TAP2017. The plan will
soon be released to the public. UFMD has been
made aware of comments on the action plans so that
they may be considered for TAP2017.
No further
action
required.
19. Restore eroded stream buffers; Friends of
Dyke Marsh
Chesapeake;
Benthic
N/A Stream buffer restoration is generally done in
conjunction with stream restoration projects, which
is one of the approaches being used by the County to
achieve pollutant reductions required by TMDLs.
No further
action required.

Appendix P
Public Comment Commenter Plan Reference County Response Action Taken
Stream restoration projects completed to date are
listed in both the Chesapeake Bay and benthic TMDL action plans.
20. Direct new growth and development
to existing disturbed and impervious
sites and near public transit;
Friends of
Dyke Marsh
Chesapeake;
Benthic
N/A Fairfax County’s Office of Community
Revitalization facilitates strategic redevelopment and
investment opportunities within targeted commercial
areas, such as Tysons, Merrifield, and Seven
Corners/Bailey’s Crossroads. See www.fcrevit.org for more information.
The land use policies of the County’s
Comprehensive Plan emphasize locating mixed uses
in existing activity centers (i.e., the Tysons Corner
Urban Center, suburban centers, community
business centers and transit station areas). Planned
development intensities are highest near transit
stations. Much of the County’s future growth is
anticipated to be in the form of redevelopment,
which presents an opportunity to improve water
quality. Redevelopment under an acre must achieve
a 10% reduction in total phosphorus loads while
redevelopment one acre or greater must achieve a 20% reduction in total phosphorus loads.
No further
action
required.
21. Use more low-impact development
approaches for controlling
stormwater runoff and require these
approaches for new development, including infill development;
Friends of
Dyke Marsh
Chesapeake;
Benthic
N/A The VSMP regulations require the County to adopt
the Virginia Runoff Reduction Method (VRRM) and
the use of the BMP Clearinghouse, which specifies
structural BMPs that can be used to control
stormwater quality and quantity. Low impact
development practices are approved in the
Clearinghouse (http://www.vwrrc.vt.edu/swc/). By
state law, developers have the flexibility to choose
from any of the BMPs in the Clearinghouse to meet
water quantity and quality requirements, provided the VRRM is implemented.
The County Stormwater Management Ordinance
(SWMO) went into effect on July 1, 2014 and has
stormwater quality requirements for single family
residential development under one acre that are more
stringent than the minimum VSMP requirements.
While the VSMP regulations and the Chesapeake
Bay Preservation Act regulate land-disturbing
activities 2,500 square feet and greater, localities
may exempt from the SWMO single family
No further
action required.

Appendix P
Public Comment Commenter Plan Reference County Response Action Taken
residential development that is under one acre and
not part of a common plan of development. County
Code Chapter 124, “Stormwater Management
Ordinance,” Section 124-1-7 applies the 0.41 pounds
of phosphorus per acre per year standard to single
family residential development except if (1) the
combined area of existing plus proposed impervious
surfaces does not exceed 2,500 square feet or 18% of
the total lot area, whichever is greater, or (2) no
more than 500 square feet of new impervious area is
being added to a lot that is one-half acre or less in
size.
22. Ensure that there is no degradation of
water quality with new development, including infill development;
Friends of
Dyke Marsh
Chesapeake;
Benthic
N/A In accordance with state requirements, the County’s
Erosion and Sediment Control Ordinance (County
Code Chapter 104) is designed to minimize soil
erosion during land disturbing activities while the
Stormwater Management Ordinance (County Code
Chapter 124) requires permanent controls for the
quality and quantity of stormwater runoff from new
development and redevelopment. The requirement
for all new development is that the total phosphorus
load must not exceed 0.41 lbs/acre/year. The
County is fully compliant with the Virginia Erosion
and Sediment Control Regulations and the Virginia Stormwater Management Program Regulations.
The County has adopted stormwater quality
requirements for single family residential
development under one acre that are more stringent
than the minimum VSMP requirements. See above comment response for more detail.
No further
action required.
23. Improve water quality when
redeveloping existing impervious sites;
Friends of
Dyke Marsh
Chesapeake;
Benthic
N/A In accordance with state requirements and with the
SWMO, all redevelopment must reduce the
phosphorus load by 20% if the land disturbance is
one acre or greater or by 10% if the land disturbance
is less than one acre, unless the 0.41 lbs/acre/year
(the standard that applies to new development) is achieved.
No further
action required.
24. Implement the county’s 2007 natural
landscaping/native plant plan on
county properties;
Friends of
Dyke Marsh
Chesapeake;
Benthic
N/A The UFMD promotes the use of natural landscaping
on County properties, consistent with the plan,
during presentations to the Building Design and
Construction Division of Capital Facilities. Natural
No further
action
required.

Appendix P
Public Comment Commenter Plan Reference County Response Action Taken
landscaping is incorporated into County projects when feasible.
25. Reduce large grassy areas on county
properties to reduce runoff, create
more native habitat and deter the
geese population;
Friends of
Dyke Marsh
Chesapeake;
Benthic; Bacteria
N/A County properties have been evaluated to identify
opportunities to reduce stormwater runoff and
improve habitat. Where practicable, trees and buffers
are planted to reduce managed turf areas.
The UFMD provides input to Capital Facilities on
tree planting and landscape plantings to reduce turf
grass areas and employ natural landscaping practices
during new project designs, including reducing
maintenance requirements and costs.
No further
action required.
26. Implement all of the watershed plans; Friends of Dyke Marsh
All N/A The County is actively implementing the watershed
management plans designed to cover each of the
County’s 30 watersheds. Potential projects
identified in these plans are implemented based on
an evaluation of project feasibility and cost/benefit
analysis. For a list of projects implemented by
watershed visit:
http://www.fairfaxcounty.gov/dpwes/stormwater/projects/project_list.htm
No further
action
required.
27. Create an aggressive public outreach
program to discourage large grassy
areas and use of fertilizers and lawn
chemicals, to encourage people to
create more native and natural habitat;
Friends of
Dyke Marsh
All N/A The County promotes and publicizes the proper use,
application, and disposal of pesticides, herbicides,
and fertilizers per Section I.B.2.j)1)(h) of the MS4
permit.
The County partners with the NVSWCD to promote
individual and group involvement in local water
quality improvement initiatives and encourage
private property owners to implement voluntary
stormwater management techniques and/or retrofits
in accordance with sections I.B.2.j)1)(b) and (i) of
the MS4 permit. One such program is the Home
Turf program, a Virginia Healthy Lawns program
that provides assistance for homeowners to
determine just what their lawn needs to be as healthy
as possible (see www.fairfaxgardening.org/home-turf/).
Efforts are being made to raise awareness of our
collective impact on the environment and to change
behaviors, but it is important to note that this kind of cultural change takes time.
No further
action required.
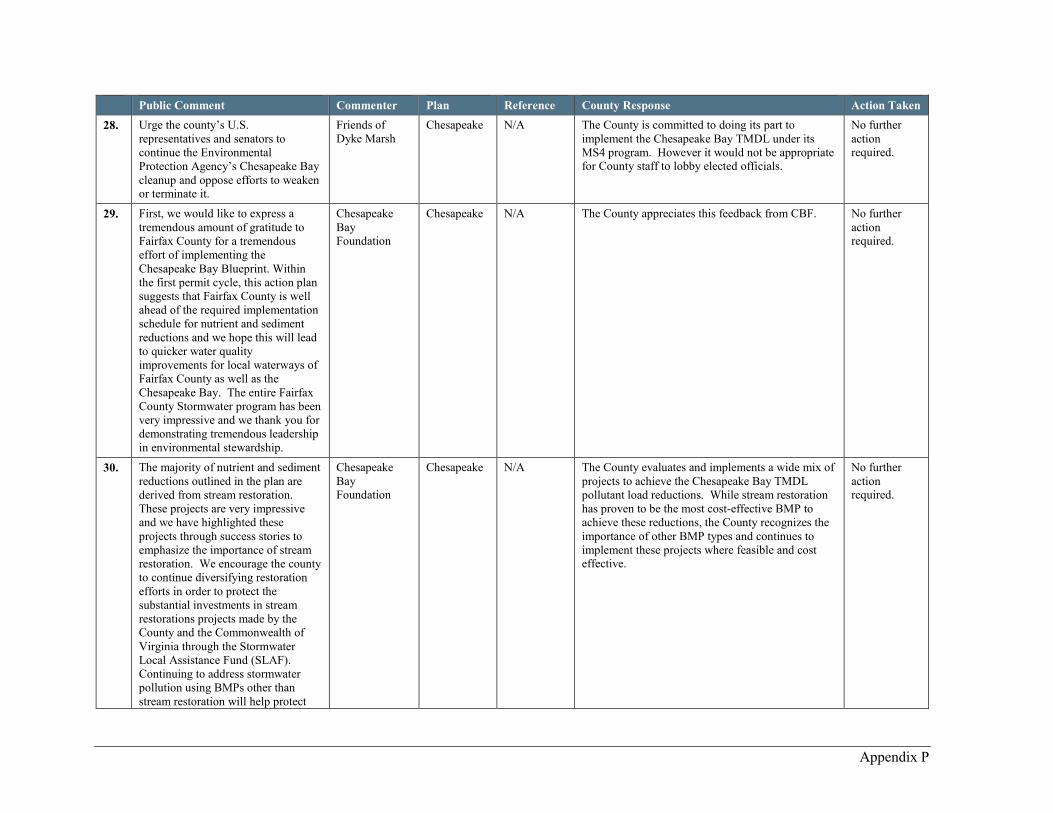
Appendix P
Public Comment Commenter Plan Reference County Response Action Taken
28. Urge the county’s U.S.
representatives and senators to
continue the Environmental
Protection Agency’s Chesapeake Bay
cleanup and oppose efforts to weaken or terminate it.
Friends of
Dyke Marsh
Chesapeake N/A The County is committed to doing its part to
implement the Chesapeake Bay TMDL under its
MS4 program. However it would not be appropriate for County staff to lobby elected officials.
No further
action required.
29. First, we would like to express a
tremendous amount of gratitude to
Fairfax County for a tremendous
effort of implementing the
Chesapeake Bay Blueprint. Within
the first permit cycle, this action plan
suggests that Fairfax County is well
ahead of the required implementation
schedule for nutrient and sediment
reductions and we hope this will lead
to quicker water quality
improvements for local waterways of
Fairfax County as well as the
Chesapeake Bay. The entire Fairfax
County Stormwater program has been
very impressive and we thank you for
demonstrating tremendous leadership
in environmental stewardship.
Chesapeake
Bay Foundation
Chesapeake N/A The County appreciates this feedback from CBF. No further
action required.
30. The majority of nutrient and sediment
reductions outlined in the plan are
derived from stream restoration.
These projects are very impressive
and we have highlighted these
projects through success stories to
emphasize the importance of stream
restoration. We encourage the county
to continue diversifying restoration
efforts in order to protect the
substantial investments in stream
restorations projects made by the
County and the Commonwealth of
Virginia through the Stormwater
Local Assistance Fund (SLAF).
Continuing to address stormwater
pollution using BMPs other than
stream restoration will help protect
Chesapeake
Bay Foundation
Chesapeake N/A The County evaluates and implements a wide mix of
projects to achieve the Chesapeake Bay TMDL
pollutant load reductions. While stream restoration
has proven to be the most cost-effective BMP to
achieve these reductions, the County recognizes the
importance of other BMP types and continues to
implement these projects where feasible and cost effective.
No further
action required.

Appendix P
Public Comment Commenter Plan Reference County Response Action Taken
the infrastructure of these projects
during high flow events as well as
make the program resilient to any
potential emerging science which
could influence the credits issuance for this BMP.