FailureAssessmentMethodologiesforPressure-Retaining ...
11
Hindawi Publishing Corporation Science and Technology of Nuclear Installations Volume 2012, Article ID 487371, 10 pages doi:10.1155/2012/487371 Research Article Failure Assessment Methodologies for Pressure-Retaining Components under Severe Accident Loading J. Arndt, H. Grebner, and J. Sievers Reactor Safety Research–Barrier Effectiveness, Gesellschaft f¨ ur Anlagen- und Reaktorsicherheit (GRS) mbH, Schwertnergasse 1, 50667 Cologne, Germany Correspondence should be addressed to J. Arndt, [email protected] Received 16 December 2011; Accepted 27 March 2012 Academic Editor: Llu´ ıs Batet Miracle Copyright © 2012 J. Arndt et al. This is an open access article distributed under the Creative Commons Attribution License, which permits unrestricted use, distribution, and reproduction in any medium, provided the original work is properly cited. During postulated high-pressure core melt accident scenarios, temperature values of more than 800 ◦ C can be reached in the reactor coolant line and the surge line of a pressurised water reactor (PWR), before the bottom of the reactor pressure vessel experiences a significant temperature increase due to core melting. For the assessment of components of the primary cooling circuit, two methods are used by GRS. One is the simplified method ASTOR (approximated structural time of rupture). This method employs the hypothesis of linear damage accumulation for modeling damage progression. A failure time surface which is generated by structural finite element (FE) analysis of varying pressure and temperature loads serves as a basis for estimations of failure times. The second method is to perform thermohydraulic and structure mechanic calculations for the accident scenario under consideration using complex calculation models. The paper shortly describes both assessment procedures. Validation of the ASTOR method concerning a large-scale test on a pipe section with geometric properties similar to a reactor coolant line is presented as well as severe accident scenarios investigated with both methods. 1. Introduction In face of severe accident scenarios with melted core material which occurred recently at Fukushima Daiichi and in 1979 at Three Mile Island-2 the integrity assessment of primary cir- cuit components requires a special concern. A best estimate simulation of components under severe accident loading scenarios may be complex and time consuming (see second part of the paper). For the accomplishment of a simplified analysis concerning integrity of the components during a severe accident and especially the question which component fails first in framework of thermohydraulic analysis with system codes, an efficient method has been developed which will be described in the following chapters. 2. Method ASTOR The method ASTOR is an easy applicable tool for fast esti- mation of failure times. Furthermore the reduced complexity enables the integration into thermohydraulic codes and may help to find results of structure mechanical properties which are required for coupled calculation of mechanical and thermohydraulic structure characteristics of primary circuit devices. Moreover the method ASTOR helps to determine the degree of structural damage after a history of load at the actual point of time. Therefore it is possible to determine the remaining durability of components under the assumption that the actual loads will continue at a constant level. The method ASTOR can be employed for failure time calculation without time intensive nonlinear structure- mechanical analysis. The analysis requires a suitable failure time surface. The method ASTOR published already in [1] has been developed further to have more accurate results. In the following the method and the further development will be displayed. During a high-pressure core melt accident a transient temperature and pressure load will occur on the inner surface of a pipe (see Figure 1). The load can be characterized by a range of temperature and pressure.
Transcript of FailureAssessmentMethodologiesforPressure-Retaining ...

Hindawi Publishing CorporationScience and Technology of Nuclear InstallationsVolume 2012, Article ID 487371, 10 pagesdoi:10.1155/2012/487371
Research Article
Failure Assessment Methodologies for Pressure-RetainingComponents under Severe Accident Loading
J. Arndt, H. Grebner, and J. Sievers
Reactor Safety Research–Barrier Effectiveness, Gesellschaft fur Anlagen- und Reaktorsicherheit (GRS) mbH,Schwertnergasse 1, 50667 Cologne, Germany
Correspondence should be addressed to J. Arndt, [email protected]
Received 16 December 2011; Accepted 27 March 2012
Academic Editor: Lluıs Batet Miracle
Copyright © 2012 J. Arndt et al. This is an open access article distributed under the Creative Commons Attribution License, whichpermits unrestricted use, distribution, and reproduction in any medium, provided the original work is properly cited.
During postulated high-pressure core melt accident scenarios, temperature values of more than 800◦C can be reached in thereactor coolant line and the surge line of a pressurised water reactor (PWR), before the bottom of the reactor pressure vesselexperiences a significant temperature increase due to core melting. For the assessment of components of the primary coolingcircuit, two methods are used by GRS. One is the simplified method ASTOR (approximated structural time of rupture). Thismethod employs the hypothesis of linear damage accumulation for modeling damage progression. A failure time surface whichis generated by structural finite element (FE) analysis of varying pressure and temperature loads serves as a basis for estimationsof failure times. The second method is to perform thermohydraulic and structure mechanic calculations for the accident scenariounder consideration using complex calculation models. The paper shortly describes both assessment procedures. Validation ofthe ASTOR method concerning a large-scale test on a pipe section with geometric properties similar to a reactor coolant line ispresented as well as severe accident scenarios investigated with both methods.
1. Introduction
In face of severe accident scenarios with melted core materialwhich occurred recently at Fukushima Daiichi and in 1979 atThree Mile Island-2 the integrity assessment of primary cir-cuit components requires a special concern. A best estimatesimulation of components under severe accident loadingscenarios may be complex and time consuming (see secondpart of the paper). For the accomplishment of a simplifiedanalysis concerning integrity of the components during asevere accident and especially the question which componentfails first in framework of thermohydraulic analysis withsystem codes, an efficient method has been developed whichwill be described in the following chapters.
2. Method ASTOR
The method ASTOR is an easy applicable tool for fast esti-mation of failure times. Furthermore the reduced complexity
enables the integration into thermohydraulic codes and mayhelp to find results of structure mechanical properties whichare required for coupled calculation of mechanical andthermohydraulic structure characteristics of primary circuitdevices. Moreover the method ASTOR helps to determinethe degree of structural damage after a history of loadat the actual point of time. Therefore it is possible todetermine the remaining durability of components under theassumption that the actual loads will continue at a constantlevel. The method ASTOR can be employed for failuretime calculation without time intensive nonlinear structure-mechanical analysis. The analysis requires a suitable failuretime surface. The method ASTOR published already in [1]has been developed further to have more accurate results.In the following the method and the further developmentwill be displayed. During a high-pressure core melt accidenta transient temperature and pressure load will occur onthe inner surface of a pipe (see Figure 1). The load can becharacterized by a range of temperature and pressure.

2 Science and Technology of Nuclear Installations
P(t)
Time t
Transient pressure
(a)
T(t)
Transient temperature
Time t
(b)
P(t) T(t)Pipe section
(c)
Figure 1: Transient loads on pipe.
Within the defined ranges, cascaded pressure steps andtemperature steps are defined. Failure times of the pipe struc-ture under combinations of pressure steps and temperaturesteps are determined by finite element analysis with the FE-program ADINA [2].
Performing several numerical analyses of this kind tocover the ranges of temperatures and pressures to be expectedin an accident yields a series of structural failure timeswhich can be regarded as discrete pivots of a continuousfailure time surface in the failure time-temperature-pressurespace (see Figure 2). In the next step of the procedure, thefailure time surface is used in connection with some damageaccumulation hypothesis to predict the time to failure of thestructure when subjected to loads which are varying in time.In these cases the characterizing parameters, that is, innersurface temperature and internal pressure, do change in thecourse of time. For each point of time which is characterizedby a temperature and a pressure value, a damage incrementcan be calculated. The result of the summation of damageincrements is a damage value D(t). The failure can beassumed when the damage value D(t) reaches a value of 1or a smaller value if safety factors are included.
In the framework of further development, a time-consuming method for the determination of failure sur-faces has been developed. The chain of software modulesconsists of three modules. The first module provides a filestructure and builds up the framework for forthcoming FEanalysis and failure assessment. The module requires inputdata about FE geometry, material data, data about failureassessment, and information about the number of nodesof the failure surface. After each simulation run, a failureassessment is accomplished by a software module. Failure
Time of failure tF
Pressure P (MPa)
Temperature T (◦C)
D(t) =∫
dt
t [T(t),P(t)]F
Figure 2: Linear damage accumulation hypothesis in ASTOR.
criteria for plastification and creep failure are used for failureassessment. After all simulation runs and failure assessmentsare accomplished, a final software module collects all avail-able output and failure data for compilation of the input filefor analysis by ASTOR.
3. Material Data and Approximation ofCreep Curves
Bases for the temperature-dependent stress-strain-relationsof the piping material steel 20 MnMoNi 55 used in GermanNPPs are data measured by the testing facility “Materi-alprufungsanstalt (MPA)” of the University of Stuttgart

Science and Technology of Nuclear Installations 3
0
100
200
300
400
500
600
700
800
0 0.02 0.04 0.06 0.08
Stre
ss (
MPa
)
400◦C500◦C600◦C700◦C
800◦C1000◦C1200◦C
0.01 0.03 0.05 0.07 0.09
Strain (absolute)
Figure 3: Steel 20 MnMoNi 55: true stress-strain curves up touniform elongation (400◦C–1200◦C) derived from measured data.
Cre
ep s
trai
n (
abso
lute
) 0.7
0.6
0.5
0.4
0.3
0.2
0.1
01 2 3 4
Approximation Measured
Time (h)
0 5
13 MPa15 MPa18 MPa21 MPa25 MPa28 MPa
13 MPa15 MPa18 MPa21 MPa25 MPa28 MPa
Figure 4: Linear approximation of measured creep curves (loadcontrolled) of steel 20 MnMoNi 55 at 1000◦C.
[3, 4]. Temperature-dependent stress-strain curves werederived for the temperatures up to 1200◦C (Figure 3) tobuild up the basis for the material model of the FE-ProgramADINA [2].
For the simulation of creep behaviour of components,the FE-codes usually include material models which describethe time dependence of creep strain with parameters stressand temperature. On the other hand the material characteri-sation is usually determined by load-controlled creep curves.Exemplary in Figure 4, the approximation of load-controlledcreep curves for a temperature level of 1000◦C is displayed.
For modeling of creep properties of the steel 20 MnMoNi55, a “Creep Law” of the FE program ADINA [2] wasemployed:
ec = a0σa1 ta2 , (1)
with temperature- and stress-dependent parameters a0, a1,and a2.
The steel 20 MnMoNi 55 does not show a pronouncedprimary creep phase. Therefore, the secondary phase, whichis important for the progress of creep, can be approximatedby a straight line determined by the stress- and temperature-dependent parameter a0 for the slope, a1 = 0, and a2 = 1.The tertiary creep phases of the load-controlled creep curvesare not considered because in that phase the stress levelincreases. According to this method, the approximated creepcurves of the steel 20 MnMoNi 55 were computed based on aspreadsheet analysis with MS Excel.
4. Failure Criteria
Both failures due to plastification and due to creep areemployed as failure criteria for an integrity assessment basedon FE analysis. Due to the higher level of stresses and strains,failure at the inside of the pipe structure is considered. Topredict the time to failure of a piping based on a FE analysisit is necessary to define criteria for failure. The analysisresults are assessed concerning failure on basis of a straincriterion. An ADINA material model is employed whichconsiders plastic strains as well as creep strains. The value ofstrain is determined by the temperature-dependent strengthand the temperature/stress-dependent creep characteristicof the relevant material. As the uniaxial strain limit forplastification, the uniform elongation is considered. Basedon calculations of large-scale creep experiments, the limitof uniaxial creep strain is determined by 60% of the creepfailure strain of the uniaxial creep tests for a safety-relatedassessment [5]. Especially for the question which componentof a primary circuit fails first, additionally an assessmentconcerning failure as a matter of fact is necessary. Thiskind of assessment employs a limit of uniaxial creep straindetermined by 100% of the creep failure strain of the uniaxialcreep tests. Figure 5 shows the temperature dependency ofthe uniaxial limit of creep strain for the 60% and the 100%,criterion.
For consideration of multiaxial stress and strain states itis common practice to reduce the strain limits by divisionwith a triaxial-factor TF which appears in the following form[6]:
TF = |σ1 + σ2 + σ3|σeffective
. (2)
The stresses σ1, σ2 and σ3 represent the principal stressesand σeffective the von Mises effective stress. The triaxial factormay reduce the strain limits for safety-related assessmentssignificantly.

4 Science and Technology of Nuclear Installations
2.5
2
1.5
1
0
0.5
500 600 700 800 900 1000 1100 1200
Temperature (◦C)
100% limit curve60% limit curve
20 MnMoNi 55-material data
Acc
um
ula
ted
cree
p st
rain
lim
it (
abso
lute
)
Figure 5: Steel 20 MnMoNi 55. Approach for definition of uniaxialcreep limit.
5. Simplified Finite Element Model ofa Pipe Structure
The abstraction from the pipe structure to the analysismodel is displayed in Figure 6. The rotational symmetryof the pipe can be used for a reduction of the model intoa 2D representation of the geometry. This helps to reducecomputation times significantly which is obligatory in caseof a high number of required computations.
Loads (forces and temperature) as well as boundaryconditions are defined. Because of the rotational symmetry,it is possible to define loads and boundaries on lines. Thetemperature is defined as a homogenous temperature loadon all elements.
6. Failure Surface
In the following a failure surface of a PWR reactor coolantline (RCL) with the geometry inner diameter 750 mmand wall thickness 62 mm is considered. In Figure 7 thecalculated times of failure due to different constant tem-perature/pressure loads are summarized. A total of 740 FEcomputations and failure assessments of a pipe structurewere performed. There are 10 pressure steps from 0.5 MPa upto 18 MPa. The temperature progression covers temperaturesfrom 100◦C up to 1300◦C. The correlation between increaseof failure time by decrease of pressure and temperature isobvious. Failure times above a time limit of 40000 s are notconsidered. Exemplary the load steps of 0.5, 2, 6, 10, 14, and18 MPa are displayed. The failure time surface is consideredas the surface which is spanned by the peaks of the columns.
7. Component Test and Simulation
For validation of the employed FE simulation and the failureassessment, procedure test data of a component test [7] areemployed. The question of the short-term creep behaviorat high temperatures was in the focus of this experimentalinvestigation. The endurance and the fracture openingbehavior of the reactor coolant piping were determined.For verification of the results from small specimen tests, acomponent test on a section of piping was carried out. Thereactor steel 20 MnMoNi 55 was used as the test material.The conduct of this test was to simulate specific accidentconditions; under a constant internal pressure of about16.6 MPa using air as the pressurizing medium, the vessel washeated from outside to about 730◦C to determine the time tofailure (see Figure 8). The component test was conducted ona pipe of about 8 m total length closed at its ends by dishedheads. The actual test pipe section which was welded intothe center had a length of 2700 mm, an internal diameterof 700 mm, and a wall thickness of 47 mm. The whole testassembly was freely suspended by means of welded-on lugs.Pronounced plastic deformation commenced about 780 sbefore failure, that is, about 320 s after begin of the holdingphase at a temperature of about 720◦C. Failure occurred bythe appearance of a longitudinal crack which after reachingthe circumferential weld seam of one of the two extensionpipes was deflected into the circumferential direction. Athermal FE analysis by ADINA [2] is accomplished to obtainthe temperature distribution of the structure. The output ofthermal FE analysis is used as temperature input data for thefollowing implicit FE analysis. A simulation model with thegeometrical properties of the test pipe was employed for aFE simulation with ADINA. The reduced 2D model revealedin Figure 6 was employed with modified dimensions. Thetest pipe has an inner diameter of Di = 700 mm and athickness t = 47 mm. A failure criterion which employs the60% of the creep failure strain of the uniaxial creep testsreduced by the calculated stress triaxiality factor was used fora safety-related assessment (see Figure 9). The used criterionpredicts a failure at 12470 s which is very close to the failuretime of the test (12469 s). The results of the component testsimulation have been presented on SMiRT 21 [8].
8. Simulation of Severe Accident Scenario
In the following section the results of an FE-based failureassessment and an ASTOR failure analysis for an RCLloaded during a severe accident scenario are compared.Due to an assumed station blackout scenario of a PWR,molten core material in the reactor pressure vessel-lowerhead (RPV-LH) may cause catastrophic consequences. Thetime of failure of the RCL is of special concern because afailure before the RPV-LH’s failure may enable a significantpressure decrease. In the following a reactor coolant line,as considered in Section 6 is assessed under high-pressureand temperature conditions. Table 1 gives an overviewof the relevant simulation runs and the employed failureassessment criteria.

Science and Technology of Nuclear Installations 5
Loads
• Homogenous temperature
• Inner pressure
• Axial forces due to pressure
Boundary conditions
Axial forces
Pre
ssu
re
Prescribedpressuretime 1000.
(Factor 2.79 is defined by ratio
33.52
ri: inner radius
ra: outer radius
ri
ra
of surfaces.)
defined on FE model
Upper nodes on horizontal plane
Lower nodes fixed in axial direction
Figure 6: 2D representation of pipe structure, dimensions, loads, and boundary conditions.
2
0
1018
10000
20000
30000
40000
6007008009001000110012001300
Pressu
re (M
Pa)
Temperature (◦C)
Failu
reti
me
(s)
110012001300
Figure 7: Failure time diagram for a RCL of 20 MnMoNi 55.
750
700
650
600
550
50011000 11500 12000 12500 13000
15.5
16
16.5
17
17.5
18
Tem
pera
ture
(◦ C
)
Time (s)
Pre
ssu
re (
MPa
)
Pressure
t =12470 s
Creep failure at t = 12470 s
Test failure at 12469 s
S1—outsideS301—inside
Stimulation 34A (60% accumulated creep strain curve, TF = var.)
Figure 8: Loading conditions in the test pipe.
0
0.15
0.2
0.25
0.3
05000 10000 15000
Cre
ep s
trai
n (
—)
Time (s)
Creep strain (—)Creep limit strain
Run 34a
0.05
0.1
t = 12470 s
Figure 9: Accumulated creep strain and strain limit curve (failureat 12470 s).
Figure 10 reveals the temperature and pressure pro-gression of the RCL calculated with MELCOR [9]. Thetemperatures reach a maximum of 969◦C at 66280 s. Thepressure oscillates at 12 MPa with an amplitude of 0.8 MPa.For simplification purposes up to a time of 40,000 s, themaximum value of the amplitude is assumed as inputdata for ADINA. This simplification is only applied at lowtemperature levels (<500◦C), where no significant failureprogression is expected.
In Run A the creep strains meet the limit strain prior tothe plastic strains based on the safety-related failure criterionwith consideration of the triaxial stress factor after about

6 Science and Technology of Nuclear Installations
Table 1: Failure assessment criteria.
Run #Creep failureassessment
Plastic failure assessment
A60% limit curve (seeFigure 5) withvariable TF
Uniformelongation/variable TF
B100% limit curve (seeFigure 5) withconstant TF = 1
Uniformelongation/constant TF
0
4
8
12
16
20
0
200
400
600
800
1000
01 2 3 4 5 6 7 8
Pre
ssu
re (
MPa
)
Tem
pera
ture
(◦ C
)
Time (s)
TemperaturePressure
×104
Figure 10: Temperature and pressure progression.
47471 s (see Figure 11). From safety-related point of viewfailure due to creep cannot be excluded after that time.
In Run B after about 47500 s, a strong increase of theplastic strains can be observed. The calculated plastic strainsmeet the criterion for failure as a matter of fact after about47656 s.
Figure 12 displays the summation of damage incrementswithin a calculation with ASTOR. For failure assessment,different damage values are considered. An accumulateddamage D = 1.0 is fulfilled at a time of 49118 s, D = 0.5is reached at 47750 s and D = 0.4 at 46760 s.
Figure 13 summarizes the failure times of all failureassessments. As one can see, the time gap between the safety-related assessment and the failure; as a matter of fact basedon FE analysis can be estimated by about 185 s. The failuretimes determined by ASTOR vary from 46760 s (D = 0.4)to 49118 s (D = 1.0). The investigation shows that ASTORresults for damage values of about 0.4-0.5 are close to the FEresults. Further work with different loading scenarios shouldbe performed to confirm this conclusion. The results of thesevere accident simulation have been presented on SMiRT 21[8].
9. Detailed Thermohydraulic andStructure Mechanic Calculationof a Severe Accident Scenario
As a further example, the integrity of components in theprimary circuit of a PWR loaded by a core-melt scenariowith remaining high-pressure in the primary cooling circuithas been investigated with a complex analysis model. Ther-mohydraulic evaluations for this case show that the reactorpressure vessel (RPV) bottom, the main coolant lines (MCL),
0 10000 20000 30000 40000 50000
Time (s)
0
0.05
0.1
0.15
0.2
0.25
0.3
Accumulated creep strain (%)Accumulated creep strain limit w/TF (%)
Run A
Acc
um
ula
ted
cree
p st
rain
(ab
solu
te)
(a)
0
0.05
0.1
0.15
0.2
0.25
0.3
47300 47400 47500 47600
Time (s)
Accumulated creep strain (%)Accumulated creep strain limit w/TF (%)
Acc
um
ula
ted
cree
p st
rain
(ab
solu
te)
(b)
Figure 11: Accumulated creep strain and strain limit curve (failureat 47471 s): overview and detailed view.
and the surge line can reach temperatures above 800◦C. Amain aim of the study was to clarify whether the pipe lineswill fail earlier than the RPV bottom or vice versa.
To estimate the failure temperatures and times, struc-ture mechanic calculations with the FE code ADINA [2]were performed with load assumptions concerning internalpressure and component temperatures which are gained byThermohydraulic calculations.
9.1. Essential Results of Thermohydraulic Calculations . Forthe Thermohydraulic calculation of the assumed accidentscenario, the program MELCOR [9] was used. The completeprimary circuit of a PWR was simulated. Some essentialresults of temperature and pressure distributions are pre-sented in Figures 14 and 15.
9.2. FE Model for Structure Mechanic Calculations. For the FEcalculations with ADINA [2], a model of the surge-line loop

Science and Technology of Nuclear Installations 7
0
0.2
0.4
0.6
0.8
1
1.2
0 10000 20000 30000 40000 50000
Zeit (s)
D = 1D = 0.5D = 0.4
Accumulated damage
Acc
um
ula
ted
dam
age
(abs
olu
te)
Figure 12: Summation of damage increments (ASTOR).
Time (s)
Tem
pera
ture
(◦ C
)
Pre
ssu
re (
MPa
)
0
2
4
6
12
14
16
20
6000055000500004500040000350000
100
200
300
400
500
600
700
800
900
1000(1)(2)(3)(4)(5)
10
8
18
Δt2,3 : 185 s
Δt1,4 : 990 s(1) D = 0.4 at 46760 s(4) D = 0.5 at 47750 s(5) D = 1 at 49118 s
FE analyses
(2) Run A failure at 47471 s
(3) Run B failure at 47656 s
D-damage factor (ASTOR)
Δt2tt ,3 : 185 s
Δt1,4 : 990 s(1) D = 0.4 at 46760 s(4) D = 0.5 at 47750 s(5) D = 1 at 49118 s
FE analyses
(2) Run A failure at 47471 s
(3) Run B failure at 47656 s
D-damage factor (ASTOR)
Figure 13: Failure times and load progression.
of a PWR was used. The model shown in Figure 16 was builtup during research projects at GRS; see for example, [10]. Italso contains feedwater and steam line from steam generatorto the containment penetration.
As the model is loaded by temperatures up to nearly1000◦C, corresponding high-temperature material data haveto be used. For the ferritic parts, the stress-strain curvesshown in Figure 3 are used. Similar data are provided for theaustenitic part of the model (surge line).
As mentioned already, the load functions for the FEmodel concerning the wall temperatures of the componentsand the internal pressure are delivered by results of MELCORcalculations (accident scenario “total station blackout”). At35 positions of the FE loop model, the temperature insideand outside the wall was evaluated. The temperature valuesbetween these positions are gained by interpolation. Also thetemperature values in the middle of the wall were found byinterpolation.
9.3. Estimation of Time of Failure. As described before astrain-based approach is used for the failure assessment.From the material side, the temperature-dependent strainvalue at uniform elongation is considered. To take constrainteffects into account, this value is divided by the stress
1 2 3 4200
300
400
500
600
700
800
900
1000
Tem
pera
ture
(◦ C
)
Inside RPVOutside RPV
Surge lineMCL
0
Time (h)
Figure 14: Temperatures versus transient time for different posi-tions.
20
18
16
14
12
10
8
6
4
2
043210
Time (h)
PrimarySecondary
Pre
ssu
re (
MPa
)
Figure 15: Pressures versus transient time for primary andsecondary circuit positions.
triaxiality factor TF as defined before. If the calculatedaccumulated effective plastic strain exceeds the strain limitat some integration point, the failure of the componentis assumed in the sense of a safety-related assessment.Furthermore an assessment concerning failure as a matter offact is performed with TF = 1.
9.4. Selected Results of the Structure Mechanic Calculation. Toshow how the estimation of failure time is carried out, twoselected evaluations are shown in Figures 17 and 18. The firstone is for a typical integration point in the main coolant line(hot leg) between RPV and steam generator; the second oneis an integration point in the surge line.
The intersection points of eg/TF and ep deliver thefailure times of a safety-related assessment. For the MCL thisgives a failure time of about 3.1 h of the transient time. Anassessment of the MCL with TF = 1, that is, failure as a matter
8 Science and Technology of Nuclear Installations
Pressurizer
Steam line
Steamgenerator
Feedwater
line
Surge
line
RPV
yx
z
RCL, h
RCL, c
Figure 16: FE model of the coolant loop including surge line and pressurizer.
Stra
in
Time (h)
egeg/TFep
3.532.520
0.1
0.2
0.3
0.4
0.5
0.6
MCL failure as matter of factMCL failure safety related
Figure 17: Structure mechanic assessment for a typical integrationpoint in the MCL (eg: strain at uniform elongation concerning therespective temperature, eg/TF: strain at uniform elongation dividedby stress triaxiality factor, ep: accumulated plastic strain).
of fact, gives a failure time of about 3.2 h. For the surge line afailure time of about 3.35 h is found based on a safety relatedassessment.
egeg/TF
ep
Stra
in
Time (h)
3.532.520
0.05
0.1
0.15
0.2
0.25
Surge line failure safety related
Figure 18: Structure mechanic assessment for a typical integrationpoint in the surge line (eg: strain at uniform elongation concerningthe respective temperature, eg/TF: strain at uniform elongationdivided by stress triaxiality factor, ep: calculated accumulated plasticstrain).
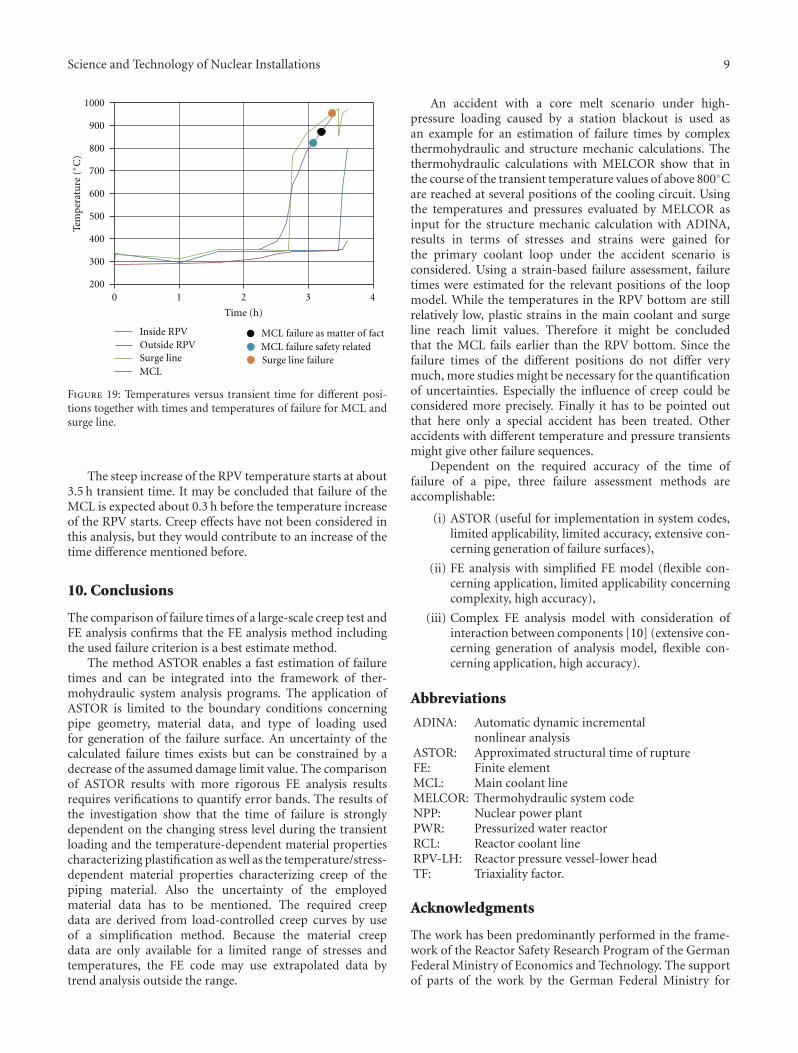
Additionally Figure 19 presents times and temperaturevalues at failure for MCL and surge line together with thetransient temperatures calculated by MELCOR.
Science and Technology of Nuclear Installations 9
Surge line failure
Tem
pera
ture
(◦ C
)
Time (h)
20 1 3 4
1000
900
800
700
600
500
400
300
200
Inside RPVOutside RPVSurge lineMCL
MCL failure as matter of factMCL failure safety related
Figure 19: Temperatures versus transient time for different posi-tions together with times and temperatures of failure for MCL andsurge line.
The steep increase of the RPV temperature starts at about3.5 h transient time. It may be concluded that failure of theMCL is expected about 0.3 h before the temperature increaseof the RPV starts. Creep effects have not been considered inthis analysis, but they would contribute to an increase of thetime difference mentioned before.
10. Conclusions
The comparison of failure times of a large-scale creep test andFE analysis confirms that the FE analysis method includingthe used failure criterion is a best estimate method.
The method ASTOR enables a fast estimation of failuretimes and can be integrated into the framework of ther-mohydraulic system analysis programs. The application ofASTOR is limited to the boundary conditions concerningpipe geometry, material data, and type of loading usedfor generation of the failure surface. An uncertainty of thecalculated failure times exists but can be constrained by adecrease of the assumed damage limit value. The comparisonof ASTOR results with more rigorous FE analysis resultsrequires verifications to quantify error bands. The results ofthe investigation show that the time of failure is stronglydependent on the changing stress level during the transientloading and the temperature-dependent material propertiescharacterizing plastification as well as the temperature/stress-dependent material properties characterizing creep of thepiping material. Also the uncertainty of the employedmaterial data has to be mentioned. The required creepdata are derived from load-controlled creep curves by useof a simplification method. Because the material creepdata are only available for a limited range of stresses andtemperatures, the FE code may use extrapolated data bytrend analysis outside the range.
An accident with a core melt scenario under high-pressure loading caused by a station blackout is used asan example for an estimation of failure times by complexthermohydraulic and structure mechanic calculations. Thethermohydraulic calculations with MELCOR show that inthe course of the transient temperature values of above 800◦Care reached at several positions of the cooling circuit. Usingthe temperatures and pressures evaluated by MELCOR asinput for the structure mechanic calculation with ADINA,results in terms of stresses and strains were gained forthe primary coolant loop under the accident scenario isconsidered. Using a strain-based failure assessment, failuretimes were estimated for the relevant positions of the loopmodel. While the temperatures in the RPV bottom are stillrelatively low, plastic strains in the main coolant and surgeline reach limit values. Therefore it might be concludedthat the MCL fails earlier than the RPV bottom. Since thefailure times of the different positions do not differ verymuch, more studies might be necessary for the quantificationof uncertainties. Especially the influence of creep could beconsidered more precisely. Finally it has to be pointed outthat here only a special accident has been treated. Otheraccidents with different temperature and pressure transientsmight give other failure sequences.
Dependent on the required accuracy of the time offailure of a pipe, three failure assessment methods areaccomplishable:
(i) ASTOR (useful for implementation in system codes,limited applicability, limited accuracy, extensive con-cerning generation of failure surfaces),
(ii) FE analysis with simplified FE model (flexible con-cerning application, limited applicability concerningcomplexity, high accuracy),
(iii) Complex FE analysis model with consideration ofinteraction between components [10] (extensive con-cerning generation of analysis model, flexible con-cerning application, high accuracy).
Abbreviations
ADINA: Automatic dynamic incrementalnonlinear analysis
ASTOR: Approximated structural time of ruptureFE: Finite elementMCL: Main coolant lineMELCOR: Thermohydraulic system codeNPP: Nuclear power plantPWR: Pressurized water reactorRCL: Reactor coolant lineRPV-LH: Reactor pressure vessel-lower headTF: Triaxiality factor.
Acknowledgments
The work has been predominantly performed in the frame-work of the Reactor Safety Research Program of the GermanFederal Ministry of Economics and Technology. The supportof parts of the work by the German Federal Ministry for

10 Science and Technology of Nuclear Installations
the Environment, Nature Conversation and Nuclear Safetyis also acknowledged.
References
[1] P. Eisert, P. Gruner, and W. Kuntze, “Estimation of PWR lowerhead failure times using the method ASTOR”.
[2] ADINA (Automatic Dynamic Incremental Nonlinear Analy-sis), “Version 8.7, Theory and Modeling Guide,” ADINA R&D,2010.
[3] “Determination and modeling of material behavior of reactorsteels under multiaxial loading in the temperature range from400◦C up to 1000◦C,” Reactor Safety Research Project 1501010, MPA-Stuttgart, 1999.
[4] “Description of the short-time rupture behavior at temper-atures up to 1200◦C exceeding usual design on the basis ofdamage mechanism,” Reactor Safety Research Project 1501257, MPA-Stuttgart, 2005.
[5] P. Eisert, P. Bachmann, and J. Sievers, “Further developmentof the structure mechanic analysis methods for the determi-nation of the creep behaviour of components,” Final Reporton Research project RS 1115, GRS-A- 3104, 2003.
[6] F. Ju and T. Buttler, “Review of proposed failure criteria forductile materials,” NUREG/CR 3644, 1984.
[7] K. Maile, A. Klenk, V. Obst, and D. Sturm, “Load carryingbehaviour of the primary system of PWRs for loads beyondthe design limits. Part 2: creep and failure behaviour of apiping section under internal pressure and high temperature,”Nuclear Engineering and Design, vol. 119, no. 2-3, pp. 131–137,1990.
[8] J. Arndt and J. Sievers, “Failure assessment methodology forpiping under high temperature and pressure due to creepand plastification,” in Proceedings of the 21st InternationalConference on Structure Mechanics in Reactor Technology(SMiRT ’21), New Delhi, India, November 2011.
[9] K. B. Cady, V. K. Dhir, and R. J. Witt, “Peer review ofmodels for lower vessel head heat transfer and larson-millerfailure criterion proposed for implementation into MELCOR,”ERI/NRC 94-202, 1994, MELCOR 1.86 Reference Manual(NUREG/CR-6119, Vol. 2, Rev. 3).
[10] H. Grebner and J. Sievers, “Limit load of a PWR coolant loopfor a hypothetical core melt scenario with high temperatureand high pressure,” 27. MPA-Seminar, Stuttgart, Germany,October 2001.

TribologyAdvances in
Hindawi Publishing Corporationhttp://www.hindawi.com Volume 2014
International Journal of
AerospaceEngineeringHindawi Publishing Corporationhttp://www.hindawi.com Volume 2010
FuelsJournal of
Hindawi Publishing Corporationhttp://www.hindawi.com Volume 2014
Journal ofPetroleum Engineering
Hindawi Publishing Corporationhttp://www.hindawi.com Volume 2014
Industrial EngineeringJournal of
Hindawi Publishing Corporationhttp://www.hindawi.com Volume 2014
Power ElectronicsHindawi Publishing Corporationhttp://www.hindawi.com Volume 2014
Advances in
CombustionJournal of
Hindawi Publishing Corporationhttp://www.hindawi.com Volume 2014
Journal of
Hindawi Publishing Corporationhttp://www.hindawi.com Volume 2014
Renewable Energy
Submit your manuscripts athttp://www.hindawi.com
Hindawi Publishing Corporationhttp://www.hindawi.com Volume 2014
StructuresJournal of
International Journal of
RotatingMachinery
Hindawi Publishing Corporationhttp://www.hindawi.com Volume 2014
EnergyJournal of
Hindawi Publishing Corporationhttp://www.hindawi.com Volume 2014
Hindawi Publishing Corporation http://www.hindawi.com
Journal ofEngineeringVolume 2014
Hindawi Publishing Corporation http://www.hindawi.com Volume 2014
International Journal ofPhotoenergy
Hindawi Publishing Corporationhttp://www.hindawi.com Volume 2014
Nuclear InstallationsScience and Technology of
Hindawi Publishing Corporationhttp://www.hindawi.com Volume 2014
Solar EnergyJournal of
Hindawi Publishing Corporationhttp://www.hindawi.com Volume 2014
Wind EnergyJournal of
Hindawi Publishing Corporationhttp://www.hindawi.com Volume 2014
Nuclear EnergyInternational Journal of
Hindawi Publishing Corporationhttp://www.hindawi.com Volume 2014
High Energy PhysicsAdvances in
The Scientific World JournalHindawi Publishing Corporation http://www.hindawi.com Volume 2014