Failure Mode - intra.itiltd-india.comintra.itiltd-india.com/quality/QulandRelTools\FMEA-N.pdf ·...
113
©Cayman Systems Revision N 980815 (513) 777-3394 www.qs9000.com Potential Failure Mode and Effects Analysis Slide 1, Printed: 10/12/98 Failure Mode and Effects Analysis
-
Upload
truongthien -
Category
Documents
-
view
215 -
download
0
Transcript of Failure Mode - intra.itiltd-india.comintra.itiltd-india.com/quality/QulandRelTools\FMEA-N.pdf ·...

©Cayman Systems Revision N 980815(513) 777-3394 www.qs9000.com
Potential Failure Mode and Effects Analysis Slide 1, Printed: 10/12/98
Failure Modeand
Effects Analysis
©Cayman Systems Revision N 980815(513) 777-3394 www.qs9000.com
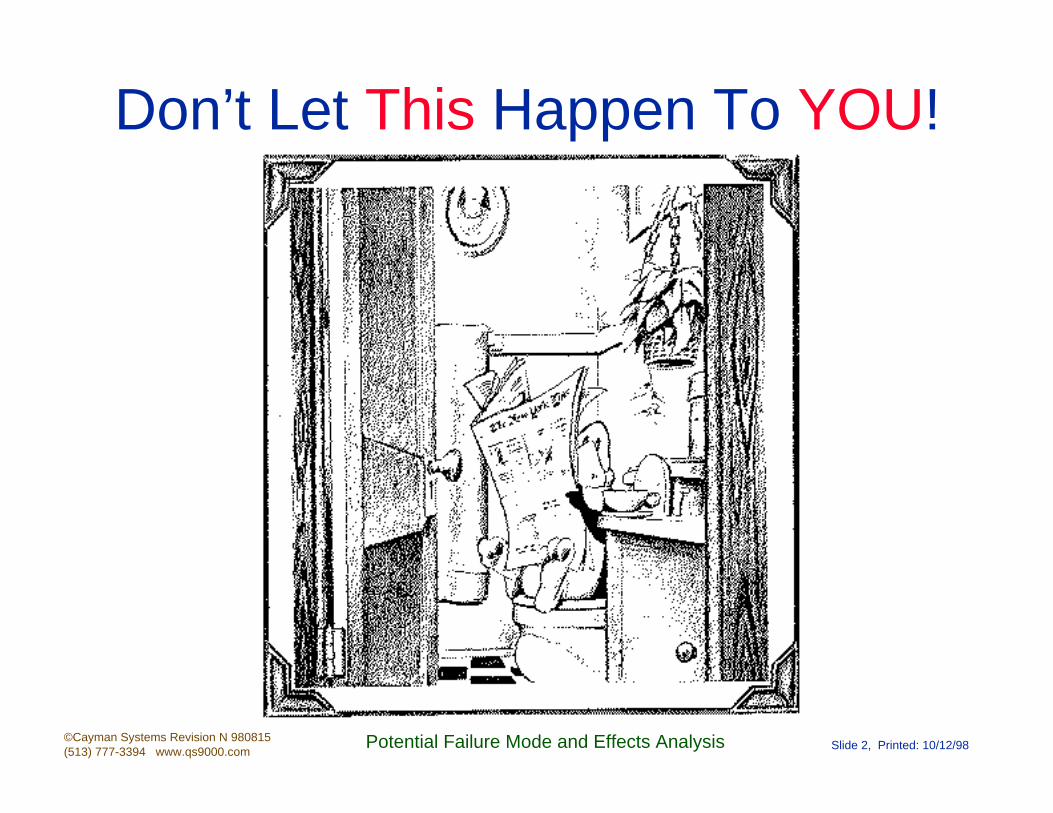
Potential Failure Mode and Effects Analysis Slide 2, Printed: 10/12/98
Don’t Let This Happen To YOU!
©Cayman Systems Revision N 980815(513) 777-3394 www.qs9000.com
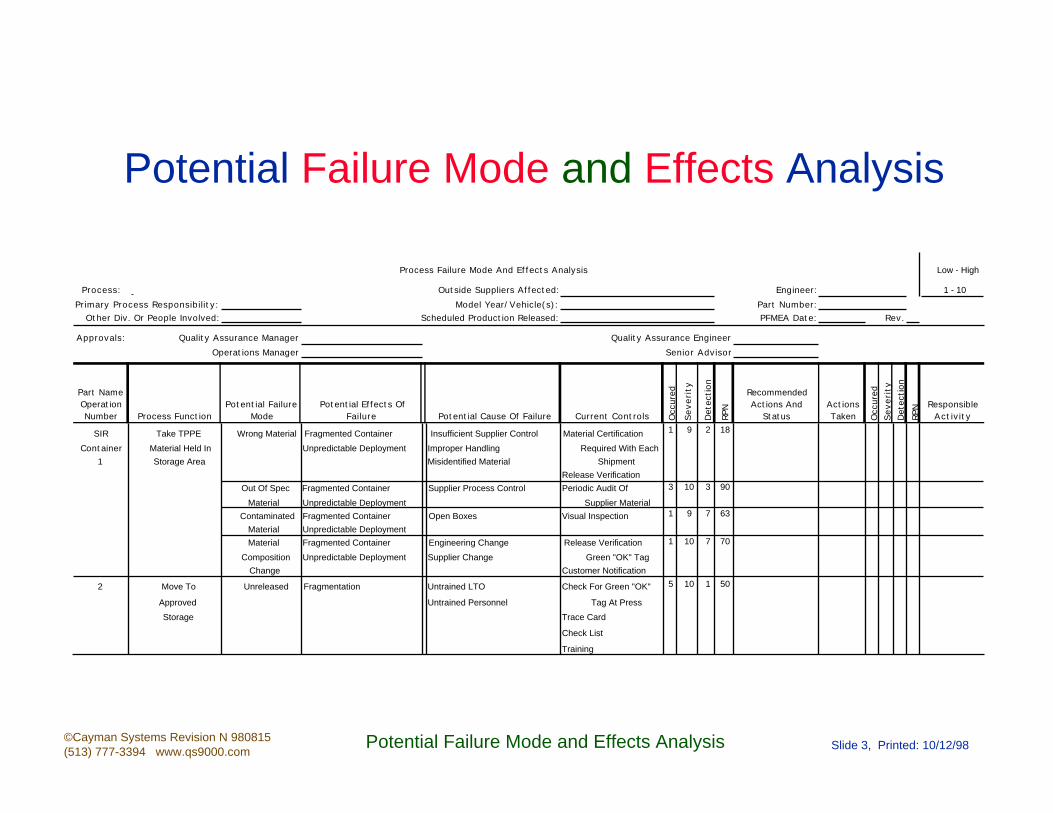
Potential Failure Mode and Effects Analysis Slide 3, Printed: 10/12/98
Potential Failure Mode and Effects Analysis
Process Failure Mode And Effects Analysis Low - High
Process: Outside Suppliers Affected: Engineer: 1 - 10
Primary Process Responsibility: Model Year/Vehicle(s): Part Number:Other Div. Or People Involved: Scheduled Production Released: PFMEA Date: Rev.
Approvals: Quality Assurance Manager Quality Assurance Engineer
Operations Manager Senior Advisor
Part Name Operation Number Process Function
Potential Failure Mode
Potential Effects Of Failure Potential Cause Of Failure Current Controls O
ccur
ed
Severi
ty
Det
ecti
on
RPN
Recommended Actions And
StatusActions Taken O
ccur
edS
everi
tyD
etec
tion
RPN Responsible
Activity
SIR Take TPPE Wrong Material Fragmented Container Insufficient Supplier Control Material Certification 1 9 2 18
Container Material Held In Unpredictable Deployment Improper Handling Required With Each
1 Storage Area Misidentified Material Shipment
Release Verification
Out Of Spec Fragmented Container Supplier Process Control Periodic Audit Of 3 10 3 90
Material Unpredictable Deployment Supplier Material
Contaminated Fragmented Container Open Boxes Visual Inspection 1 9 7 63
Material Unpredictable Deployment
Material Fragmented Container Engineering Change Release Verification 1 10 7 70
Composition Unpredictable Deployment Supplier Change Green "OK" Tag
Change Customer Notification
2 Move To Unreleased Fragmentation Untrained LTO Check For Green "OK" 5 10 1 50
Approved Untrained Personnel Tag At Press
Storage Trace Card
Check List
Training

©Cayman Systems Revision N 980815(513) 777-3394 www.qs9000.com
Potential Failure Mode and Effects Analysis Slide 4, Printed: 10/12/98
Potential Failure Mode and Effects Analysis
©Cayman Systems Revision N 980815(513) 777-3394 www.qs9000.com
Potential Failure Mode and Effects Analysis Slide 5, Printed: 10/12/98
Course Goals• To understand the role and function of the FMEA
• To understand the concepts and techniques of Design FMEA and how to apply it
• To understand the concepts and techniques of Process FMEA and how to apply it
• To understand the role and function of FTA• To understand the concepts of Zero Quality
Control or Mistake-Proofing (e.g. Poka-Yoke) and its implications for FMEA
©Cayman Systems Revision N 980815(513) 777-3394 www.qs9000.com
Potential Failure Mode and Effects Analysis Slide 6, Printed: 10/12/98
Liability Issues
©Cayman Systems Revision N 980815(513) 777-3394 www.qs9000.com
Potential Failure Mode and Effects Analysis Slide 7, Printed: 10/12/98
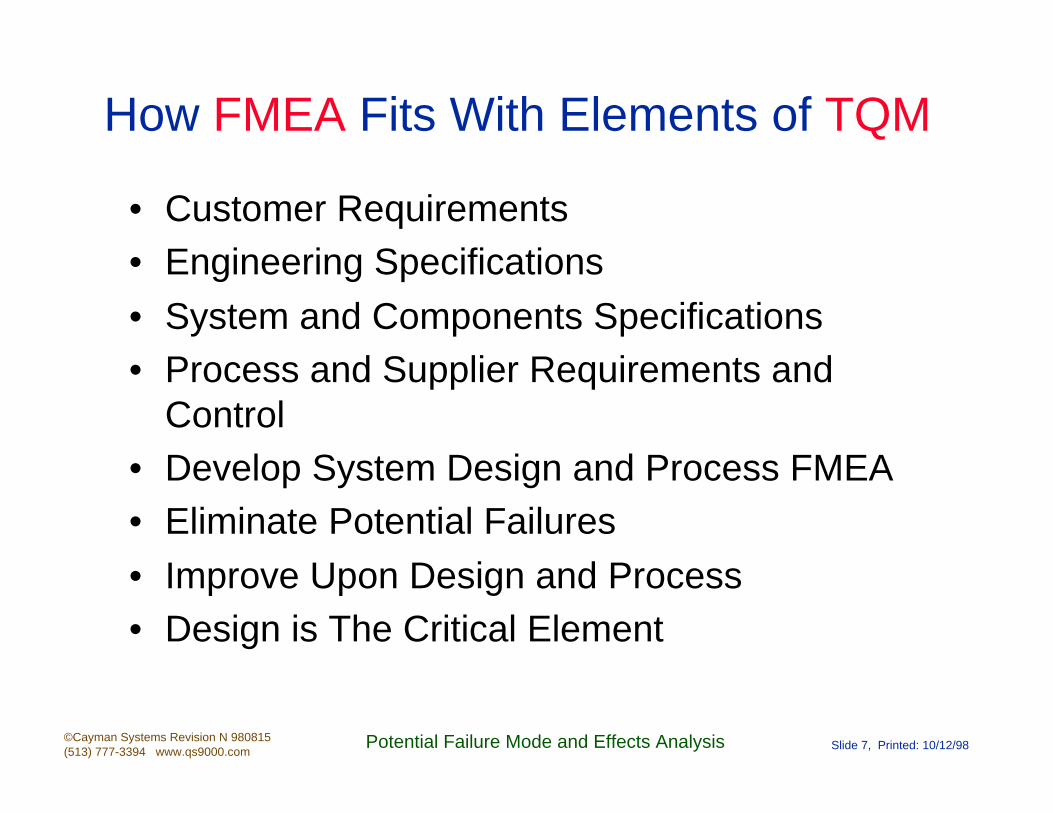
How FMEA Fits With Elements of TQM
• Customer Requirements• Engineering Specifications
• System and Components Specifications• Process and Supplier Requirements and
Control• Develop System Design and Process FMEA• Eliminate Potential Failures
• Improve Upon Design and Process• Design is The Critical Element
©Cayman Systems Revision N 980815(513) 777-3394 www.qs9000.com
Potential Failure Mode and Effects Analysis Slide 8, Printed: 10/12/98
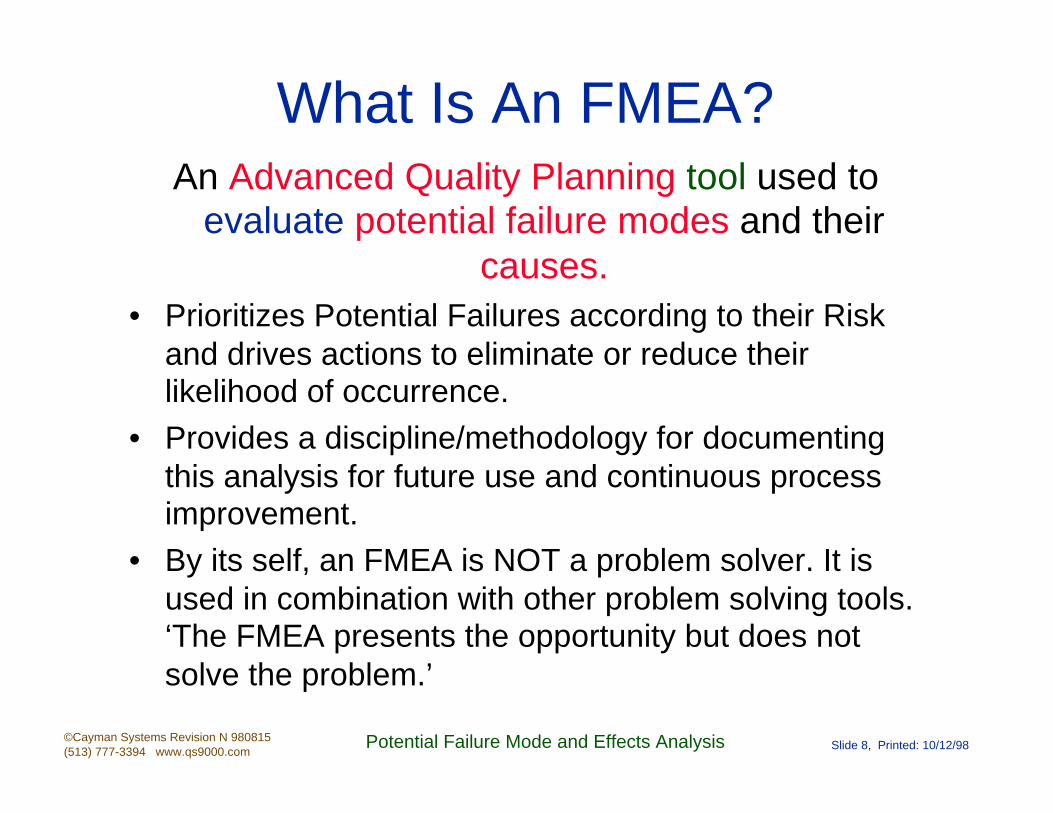
What Is An FMEA?An Advanced Quality Planning tool used to
evaluate potential failure modes and their causes.
• Prioritizes Potential Failures according to their Risk and drives actions to eliminate or reduce their likelihood of occurrence.
• Provides a discipline/methodology for documenting this analysis for future use and continuous process improvement.
• By its self, an FMEA is NOT a problem solver. It is used in combination with other problem solving tools. ‘The FMEA presents the opportunity but does not solve the problem.’
©Cayman Systems Revision N 980815(513) 777-3394 www.qs9000.com
Potential Failure Mode and Effects Analysis Slide 9, Printed: 10/12/98
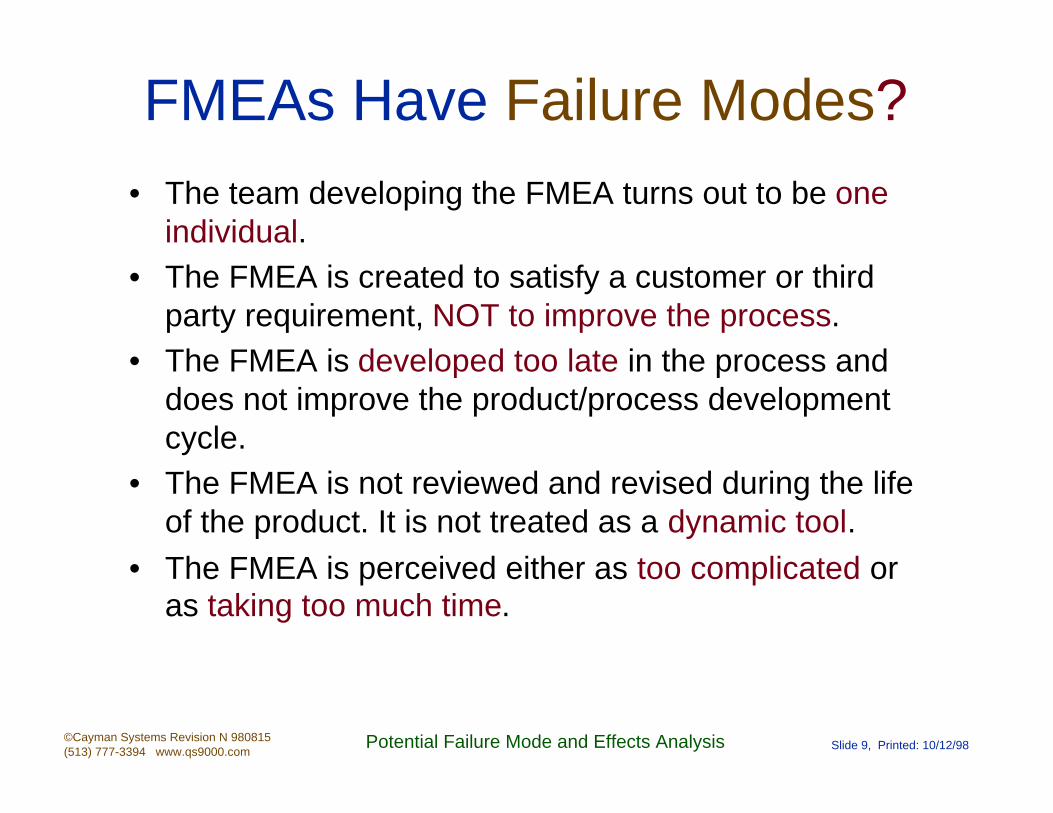
FMEAs Have Failure Modes?• The team developing the FMEA turns out to be one
individual.• The FMEA is created to satisfy a customer or third
party requirement, NOT to improve the process.• The FMEA is developed too late in the process and
does not improve the product/process development cycle.
• The FMEA is not reviewed and revised during the life of the product. It is not treated as a dynamic tool.
• The FMEA is perceived either as too complicated or as taking too much time.
©Cayman Systems Revision N 980815(513) 777-3394 www.qs9000.com
Potential Failure Mode and Effects Analysis Slide 10, Printed: 10/12/98
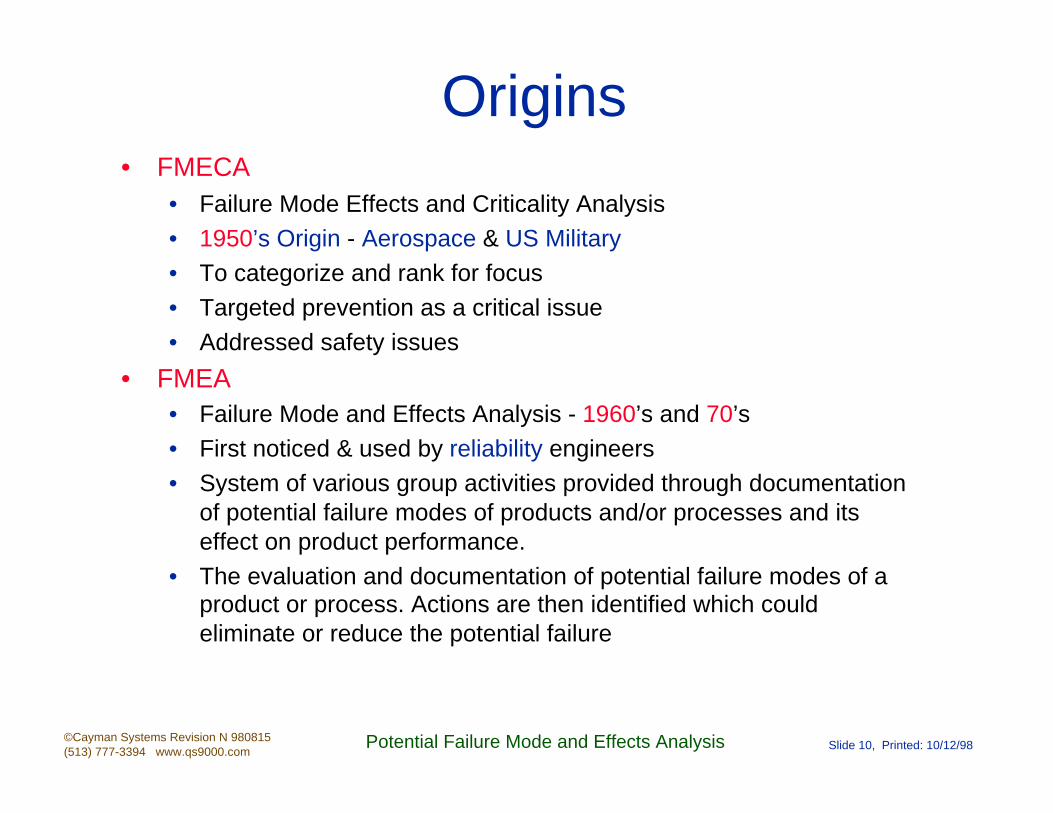
Origins• FMECA
• Failure Mode Effects and Criticality Analysis• 1950’s Origin - Aerospace & US Military• To categorize and rank for focus• Targeted prevention as a critical issue• Addressed safety issues
• FMEA• Failure Mode and Effects Analysis - 1960’s and 70’s• First noticed & used by reliability engineers• System of various group activities provided through documentation
of potential failure modes of products and/or processes and its effect on product performance.
• The evaluation and documentation of potential failure modes of a product or process. Actions are then identified which could eliminate or reduce the potential failure
©Cayman Systems Revision N 980815(513) 777-3394 www.qs9000.com
Potential Failure Mode and Effects Analysis Slide 11, Printed: 10/12/98
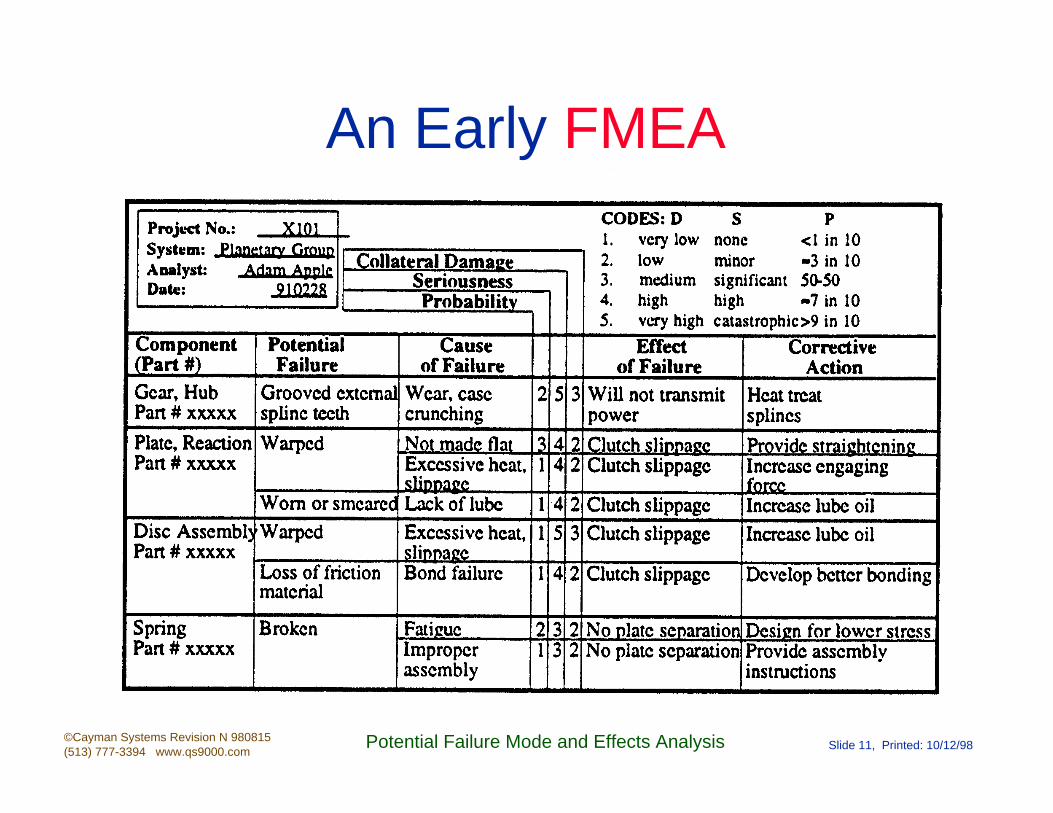
An Early FMEA
©Cayman Systems Revision N 980815(513) 777-3394 www.qs9000.com
Potential Failure Mode and Effects Analysis Slide 12, Printed: 10/12/98
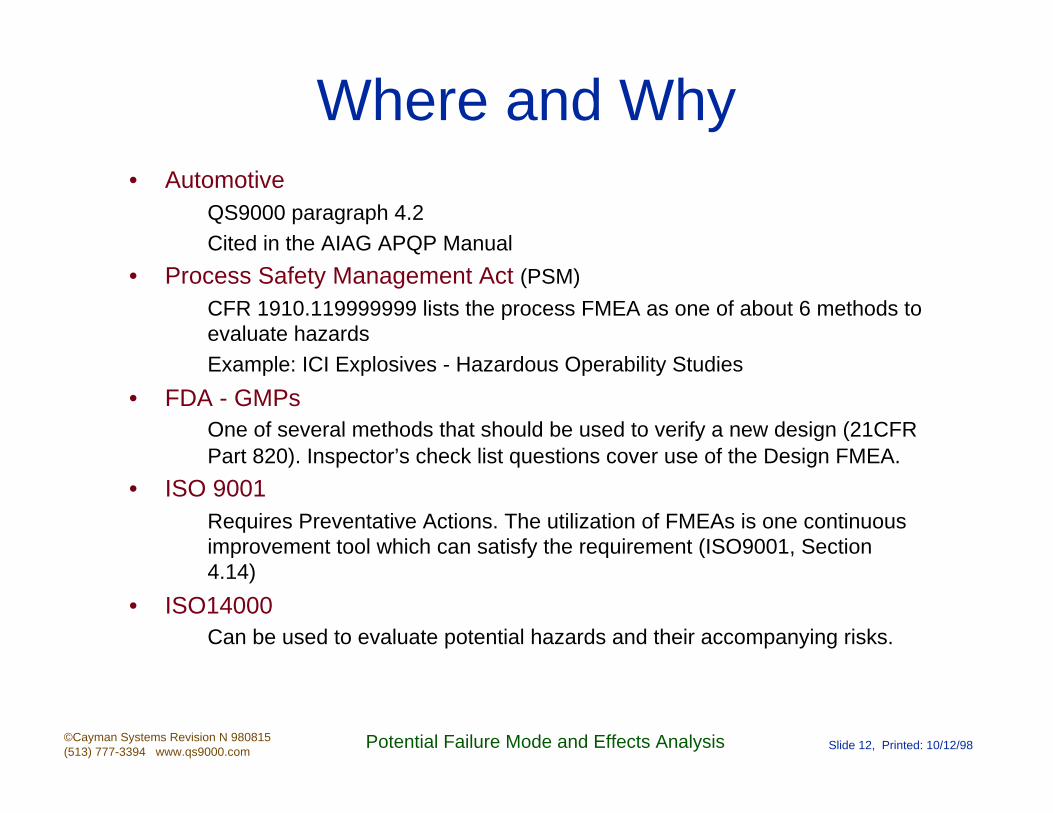
Where and Why• Automotive
QS9000 paragraph 4.2Cited in the AIAG APQP Manual
• Process Safety Management Act (PSM)
CFR 1910.119999999 lists the process FMEA as one of about 6 methods to evaluate hazardsExample: ICI Explosives - Hazardous Operability Studies
• FDA - GMPsOne of several methods that should be used to verify a new design (21CFR Part 820). Inspector’s check list questions cover use of the Design FMEA.
• ISO 9001Requires Preventative Actions. The utilization of FMEAs is one continuous improvement tool which can satisfy the requirement (ISO9001, Section 4.14)
• ISO14000Can be used to evaluate potential hazards and their accompanying risks.
©Cayman Systems Revision N 980815(513) 777-3394 www.qs9000.com
Potential Failure Mode and Effects Analysis Slide 13, Printed: 10/12/98
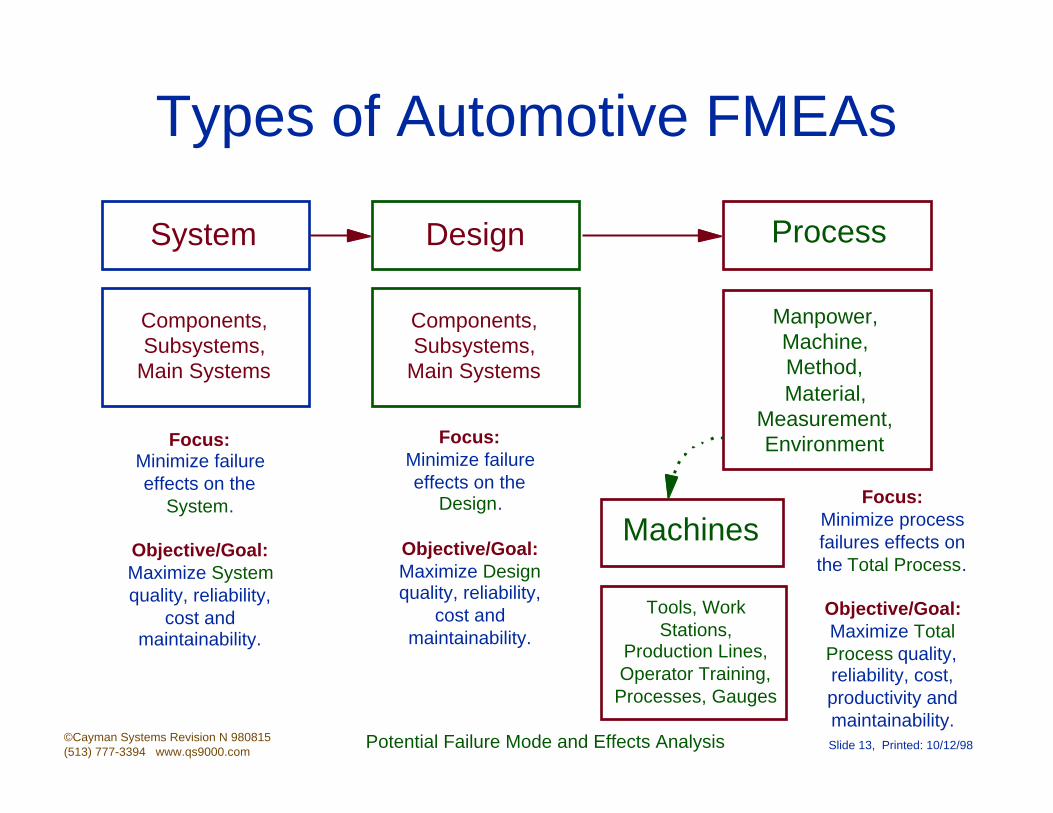
Types of Automotive FMEAs
Components, Subsystems,
Main Systems
System Design Process
Components, Subsystems,
Main Systems
Manpower, Machine, Method, Material,
Measurement, Environment
Machines
Tools, Work Stations,
Production Lines, Operator Training,
Processes, Gauges
Focus:Minimize failure effects on the
System.
Objective/Goal:Maximize System quality, reliability,
cost and maintainability.
Focus:Minimize failure effects on the
Design.
Objective/Goal:Maximize Design quality, reliability,
cost and maintainability.
Focus:Minimize process failures effects on the Total Process.
Objective/Goal:Maximize Total Process quality, reliability, cost, productivity and maintainability.

©Cayman Systems Revision N 980815(513) 777-3394 www.qs9000.com
Potential Failure Mode and Effects Analysis Slide 14, Printed: 10/12/98
Relationships of Automotive FMEAs
The Ramifications of the Problem
Failure Mode
The Problem
Effect
The Cause(s) of the Problem
Cause
The Cause(s) of the Problem from the
System FMEA
The Effect from the System FMEA with a
Better Definition
New Root Causes for the Design failure
Modes
The Causes of the Problem from the
Design FMEA
The Same Effect as the Design FMEA
Specific Root Causes for the Process Failure
Modes
System FMEA
Design FMEA
Process FMEA
©Cayman Systems Revision N 980815(513) 777-3394 www.qs9000.com
Potential Failure Mode and Effects Analysis Slide 15, Printed: 10/12/98
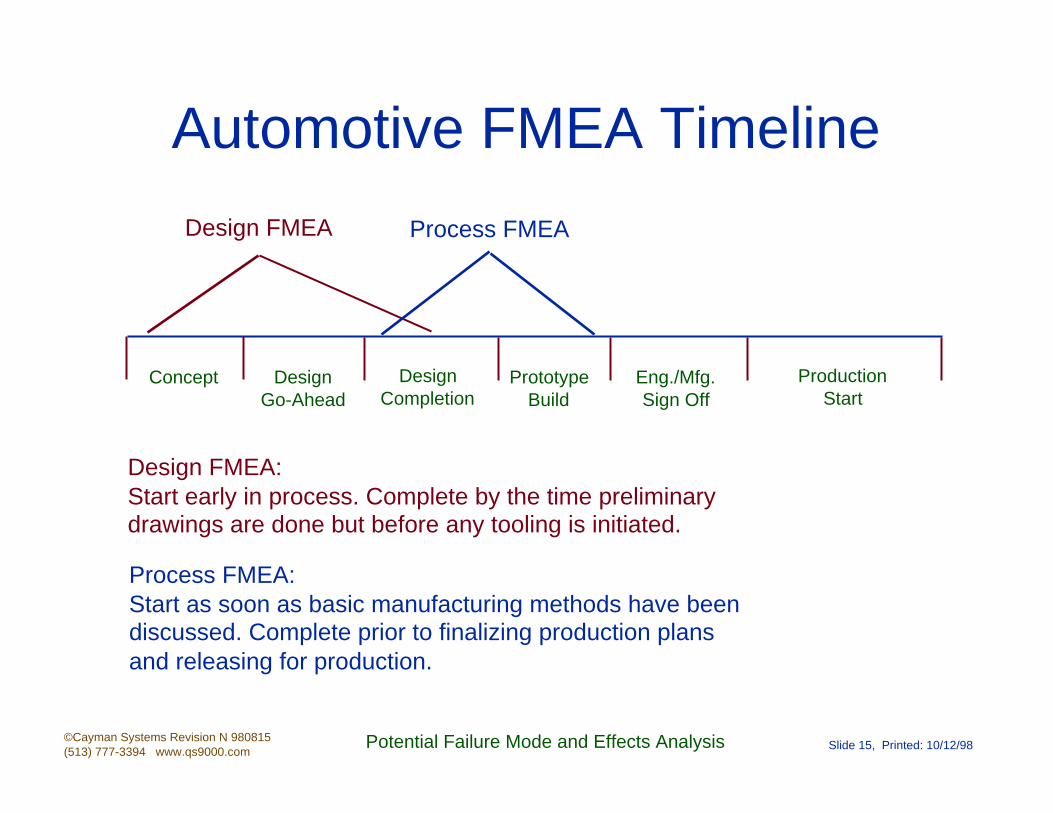
Automotive FMEA Timeline
Concept Design Go-Ahead
Design Completion
Prototype Build
Eng./Mfg. Sign Off
Production Start
Design FMEA Process FMEA
Design FMEA:Start early in process. Complete by the time preliminary drawings are done but before any tooling is initiated.
Process FMEA:Start as soon as basic manufacturing methods have been discussed. Complete prior to finalizing production plans and releasing for production.

©Cayman Systems Revision N 980815(513) 777-3394 www.qs9000.com
Potential Failure Mode and Effects Analysis Slide 16, Printed: 10/12/98
Some Key FMEA Terms
• Customer Input• Team - Team Selection (Cross-Functional)
• Ranking - Ranking of Decisions• Risk Priority Assessment• Design Process• Production Process
©Cayman Systems Revision N 980815(513) 777-3394 www.qs9000.com
Potential Failure Mode and Effects Analysis Slide 17, Printed: 10/12/98
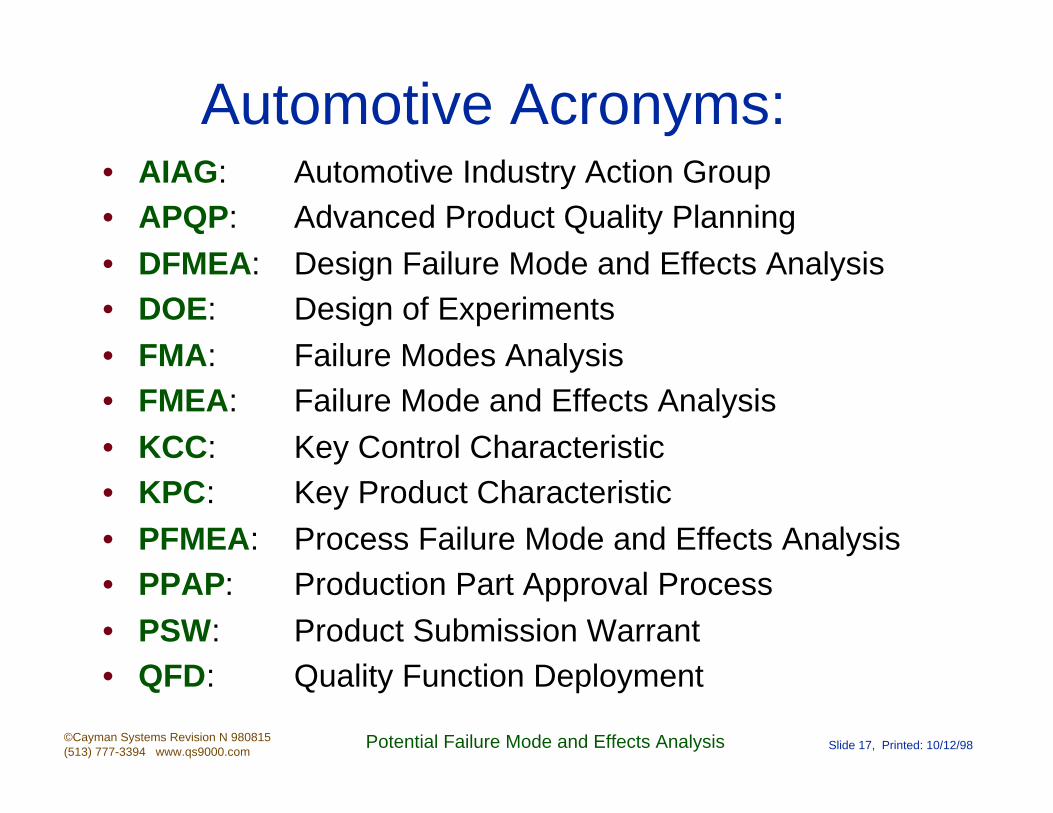
• AIAG: Automotive Industry Action Group• APQP: Advanced Product Quality Planning
• DFMEA: Design Failure Mode and Effects Analysis• DOE: Design of Experiments
• FMA: Failure Modes Analysis• FMEA: Failure Mode and Effects Analysis
• KCC: Key Control Characteristic• KPC: Key Product Characteristic
• PFMEA: Process Failure Mode and Effects Analysis• PPAP: Production Part Approval Process
• PSW: Product Submission Warrant• QFD: Quality Function Deployment
Automotive Acronyms:
©Cayman Systems Revision N 980815(513) 777-3394 www.qs9000.com
Potential Failure Mode and Effects Analysis Slide 18, Printed: 10/12/98
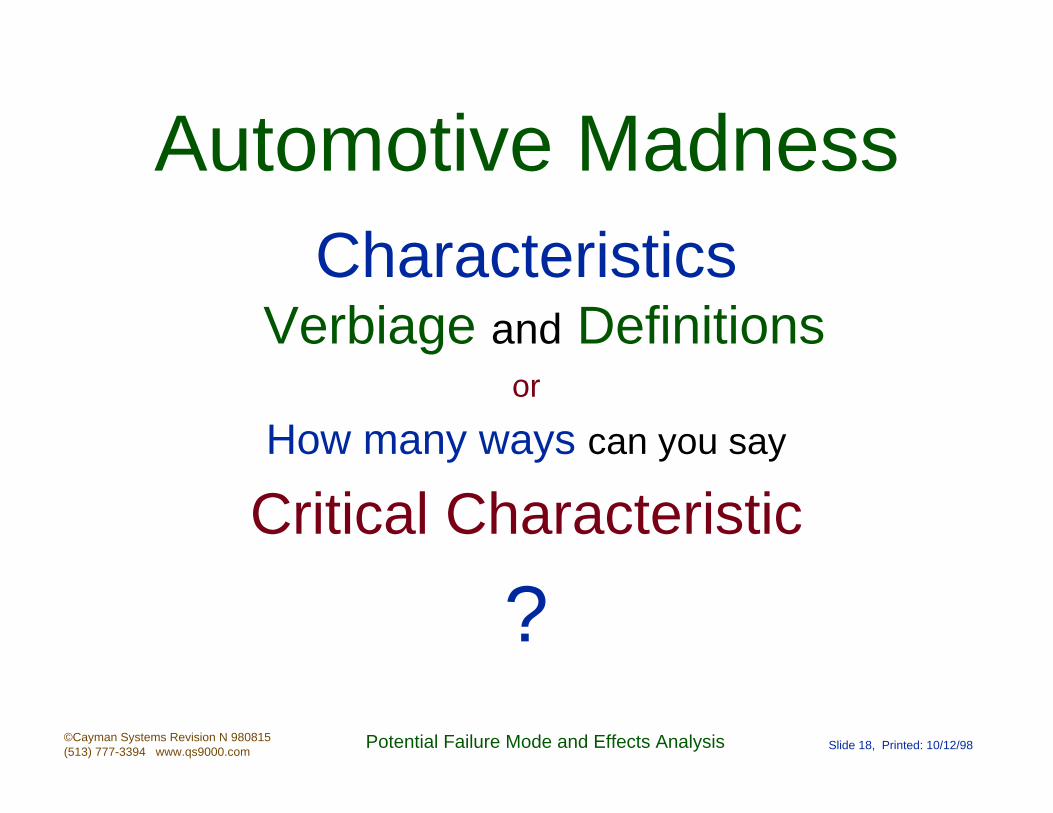
Automotive MadnessCharacteristics
Verbiage and Definitionsor
How many ways can you say
Critical Characteristic
?
©Cayman Systems Revision N 980815(513) 777-3394 www.qs9000.com
Potential Failure Mode and Effects Analysis Slide 19, Printed: 10/12/98
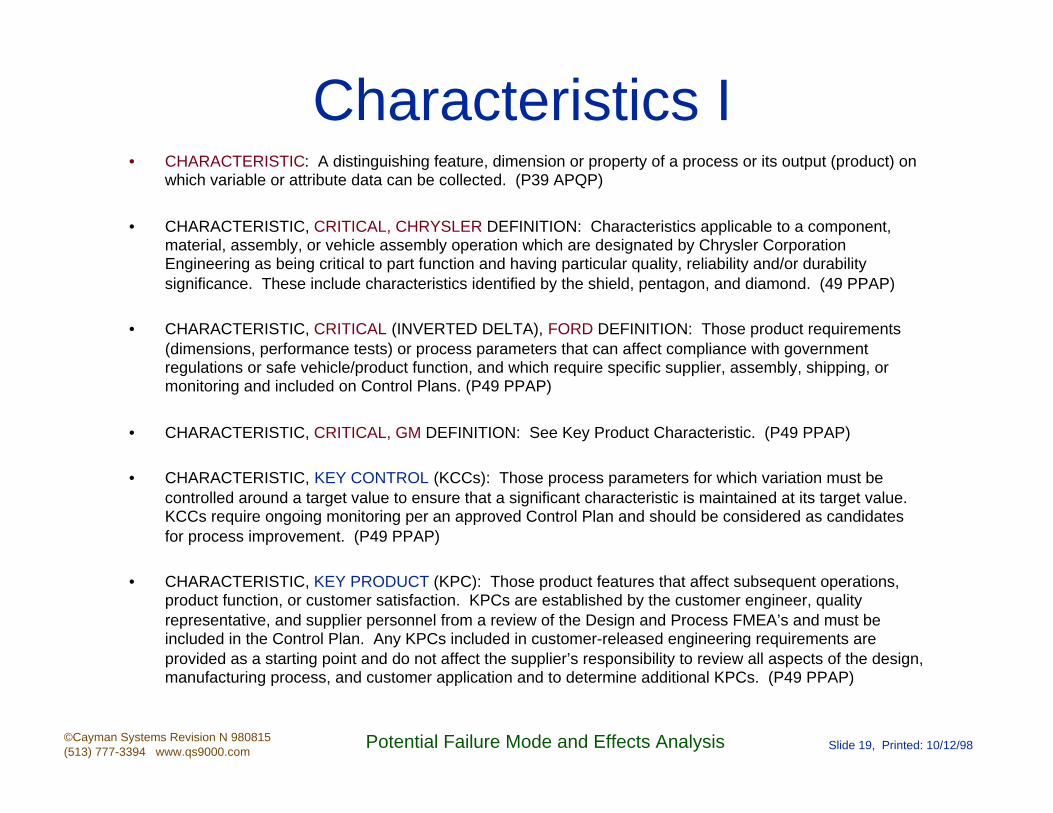
Characteristics I• CHARACTERISTIC: A distinguishing feature, dimension or property of a process or its output (product) on
which variable or attribute data can be collected. (P39 APQP)
• CHARACTERISTIC, CRITICAL, CHRYSLER DEFINITION: Characteristics applicable to a component, material, assembly, or vehicle assembly operation which are designated by Chrysler Corporation Engineering as being critical to part function and having particular quality, reliability and/or durability significance. These include characteristics identified by the shield, pentagon, and diamond. (49 PPAP)
• CHARACTERISTIC, CRITICAL (INVERTED DELTA), FORD DEFINITION: Those product requirements (dimensions, performance tests) or process parameters that can affect compliance with government regulations or safe vehicle/product function, and which require specific supplier, assembly, shipping, or monitoring and included on Control Plans. (P49 PPAP)
• CHARACTERISTIC, CRITICAL, GM DEFINITION: See Key Product Characteristic. (P49 PPAP)
• CHARACTERISTIC, KEY CONTROL (KCCs): Those process parameters for which variation must be controlled around a target value to ensure that a significant characteristic is maintained at its target value. KCCs require ongoing monitoring per an approved Control Plan and should be considered as candidates for process improvement. (P49 PPAP)
• CHARACTERISTIC, KEY PRODUCT (KPC): Those product features that affect subsequent operations, product function, or customer satisfaction. KPCs are established by the customer engineer, quality representative, and supplier personnel from a review of the Design and Process FMEA’s and must be included in the Control Plan. Any KPCs included in customer-released engineering requirements are provided as a starting point and do not affect the supplier’s responsibility to review all aspects of the design, manufacturing process, and customer application and to determine additional KPCs. (P49 PPAP)
©Cayman Systems Revision N 980815(513) 777-3394 www.qs9000.com
Potential Failure Mode and Effects Analysis Slide 20, Printed: 10/12/98
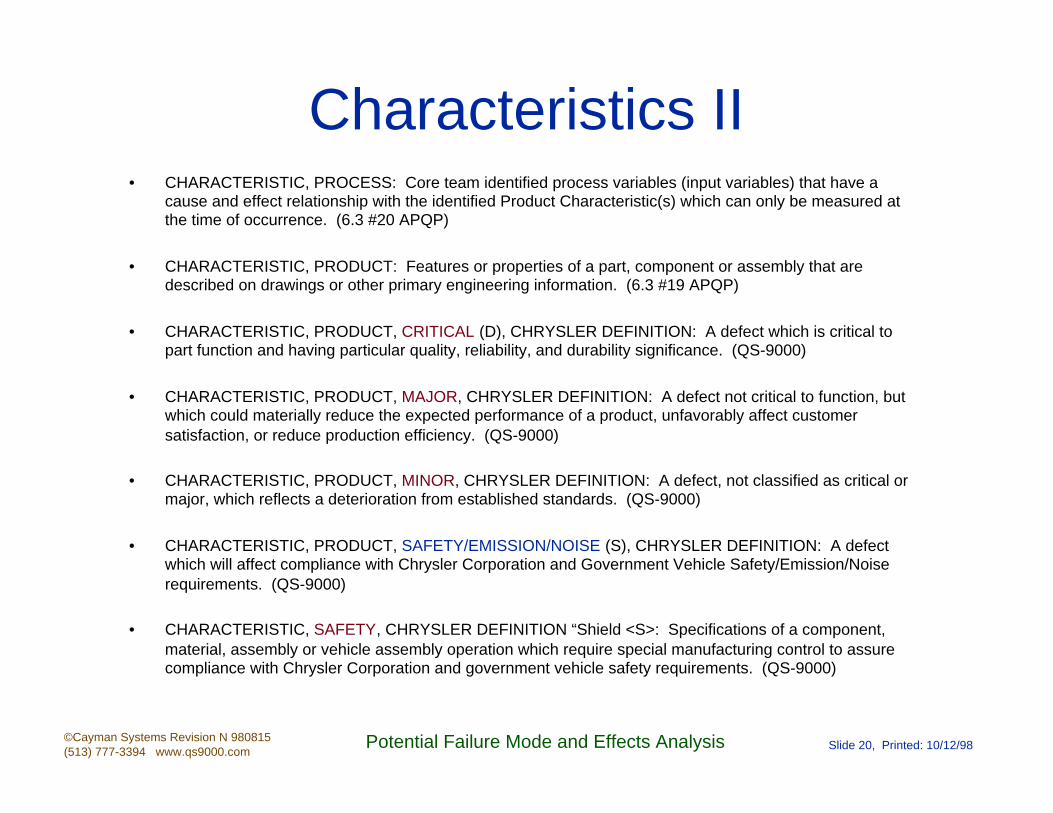
Characteristics II• CHARACTERISTIC, PROCESS: Core team identified process variables (input variables) that have a
cause and effect relationship with the identified Product Characteristic(s) which can only be measured at the time of occurrence. (6.3 #20 APQP)
• CHARACTERISTIC, PRODUCT: Features or properties of a part, component or assembly that are described on drawings or other primary engineering information. (6.3 #19 APQP)
• CHARACTERISTIC, PRODUCT, CRITICAL (D), CHRYSLER DEFINITION: A defect which is critical to part function and having particular quality, reliability, and durability significance. (QS-9000)
• CHARACTERISTIC, PRODUCT, MAJOR, CHRYSLER DEFINITION: A defect not critical to function, but which could materially reduce the expected performance of a product, unfavorably affect customer satisfaction, or reduce production efficiency. (QS-9000)
• CHARACTERISTIC, PRODUCT, MINOR, CHRYSLER DEFINITION: A defect, not classified as critical or major, which reflects a deterioration from established standards. (QS-9000)
• CHARACTERISTIC, PRODUCT, SAFETY/EMISSION/NOISE (S), CHRYSLER DEFINITION: A defect which will affect compliance with Chrysler Corporation and Government Vehicle Safety/Emission/Noise requirements. (QS-9000)
• CHARACTERISTIC, SAFETY, CHRYSLER DEFINITION “Shield <S>: Specifications of a component, material, assembly or vehicle assembly operation which require special manufacturing control to assure compliance with Chrysler Corporation and government vehicle safety requirements. (QS-9000)
©Cayman Systems Revision N 980815(513) 777-3394 www.qs9000.com
Potential Failure Mode and Effects Analysis Slide 21, Printed: 10/12/98
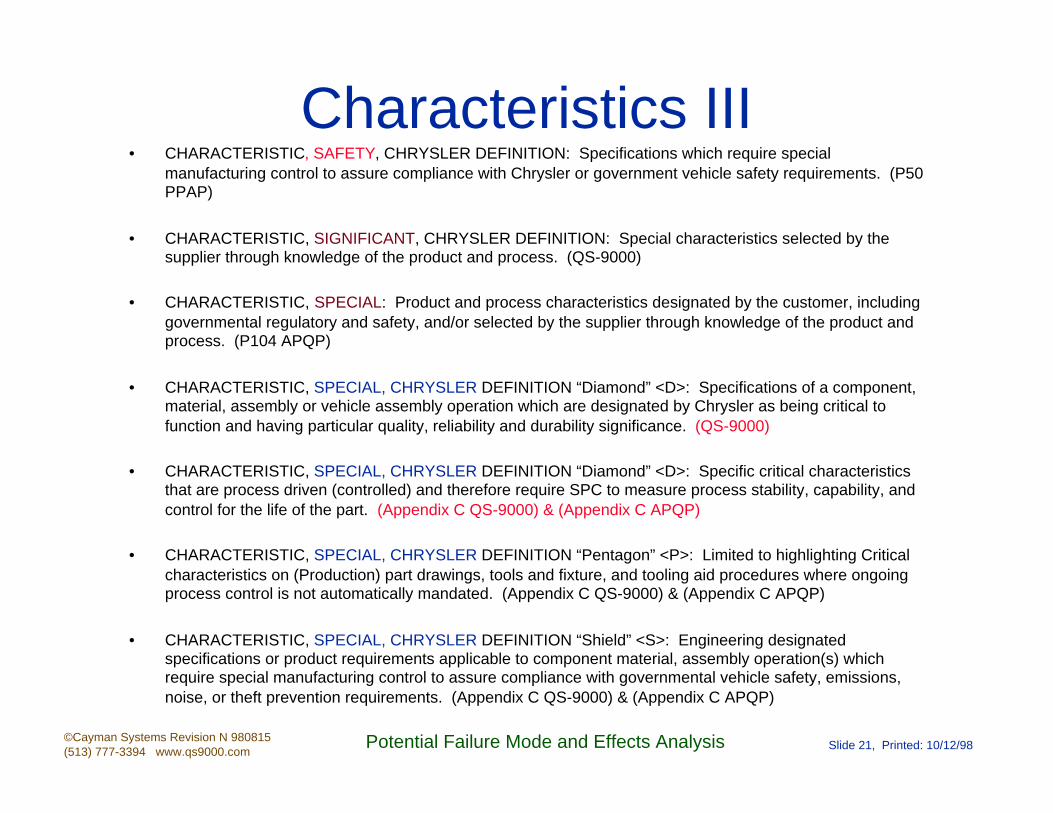
Characteristics III• CHARACTERISTIC, SAFETY, CHRYSLER DEFINITION: Specifications which require special
manufacturing control to assure compliance with Chrysler or government vehicle safety requirements. (P50 PPAP)
• CHARACTERISTIC, SIGNIFICANT, CHRYSLER DEFINITION: Special characteristics selected by the supplier through knowledge of the product and process. (QS-9000)
• CHARACTERISTIC, SPECIAL: Product and process characteristics designated by the customer, including governmental regulatory and safety, and/or selected by the supplier through knowledge of the product and process. (P104 APQP)
• CHARACTERISTIC, SPECIAL, CHRYSLER DEFINITION “Diamond” <D>: Specifications of a component, material, assembly or vehicle assembly operation which are designated by Chrysler as being critical to function and having particular quality, reliability and durability significance. (QS-9000)
• CHARACTERISTIC, SPECIAL, CHRYSLER DEFINITION “Diamond” <D>: Specific critical characteristics that are process driven (controlled) and therefore require SPC to measure process stability, capability, and control for the life of the part. (Appendix C QS-9000) & (Appendix C APQP)
• CHARACTERISTIC, SPECIAL, CHRYSLER DEFINITION “Pentagon” <P>: Limited to highlighting Critical characteristics on (Production) part drawings, tools and fixture, and tooling aid procedures where ongoing process control is not automatically mandated. (Appendix C QS-9000) & (Appendix C APQP)
• CHARACTERISTIC, SPECIAL, CHRYSLER DEFINITION “Shield” <S>: Engineering designated specifications or product requirements applicable to component material, assembly operation(s) which require special manufacturing control to assure compliance with governmental vehicle safety, emissions, noise, or theft prevention requirements. (Appendix C QS-9000) & (Appendix C APQP)

©Cayman Systems Revision N 980815(513) 777-3394 www.qs9000.com
Potential Failure Mode and Effects Analysis Slide 22, Printed: 10/12/98
Characteristics IV• CHARACTERISTIC, SPECIAL, FORD DEFINITION “Critical Characteristic” <Inverted Delta>: Those
product requirements (Dimensions, Specifications, Tests) or process parameters which can affect compliance with government regulations or safe Vehicle/Product Function and which require specific producer, assembly, shipping or monitoring actions and inclusion on the Control Plan. (Appendix C QS-9000) & (Appendix C APQP)
• CHARACTERISTIC, SPECIAL, FORD DEFINITION “Significant Characteristic - SC” <None>: Those product, process, and test requirements that are important to customer satisfaction and for which quality planning actions shall be included in the Control Plan. (Appendix C QS-9000)
• CHARACTERISTIC, SPECIAL, FORD DEFINITION “Significant/Characteristic - S/C” <None>: Characteristics that are important to the customer and that must be included on the Control Plan. (Appendix C APQP)
• CHARACTERISTIC, SPECIAL, GM DEFINITION “Fit/Function” <F/F>: Product characteristic for which reasonably anticipated variation is likely to significantly affect customer satisfaction with a product (other than S/C) such as its fits, function, mounting or appearance, or the ability to process or build the product. (Appendix C QS-9000) & (Appendix C APQP)
• CHARACTERISTIC, SPECIAL, GM DEFINITION “Safety/Compliance” <S/C>: Product characteristic for which reasonably anticipated variation could significantly affect customer the product’s safety or its compliance with government regulations (such as: flammability, occupant protection, steering control, braking, etc. . .), emissions, noise, radio frequency interference, etc. . . (Appendix C QS-9000)
• CHARACTERISTIC, SPECIAL, GM DEFINITION “Safety/Compliance” <S>: Product characteristic for which reasonably anticipated variation could significantly affect customer the product’s safety or its compliance with government regulations (such as: flammability, occupant protection, steering control, braking, etc. . .), emissions, noise, radio frequency interference, etc. . . (Appendix C APQP)
©Cayman Systems Revision N 980815(513) 777-3394 www.qs9000.com
Potential Failure Mode and Effects Analysis Slide 23, Printed: 10/12/98
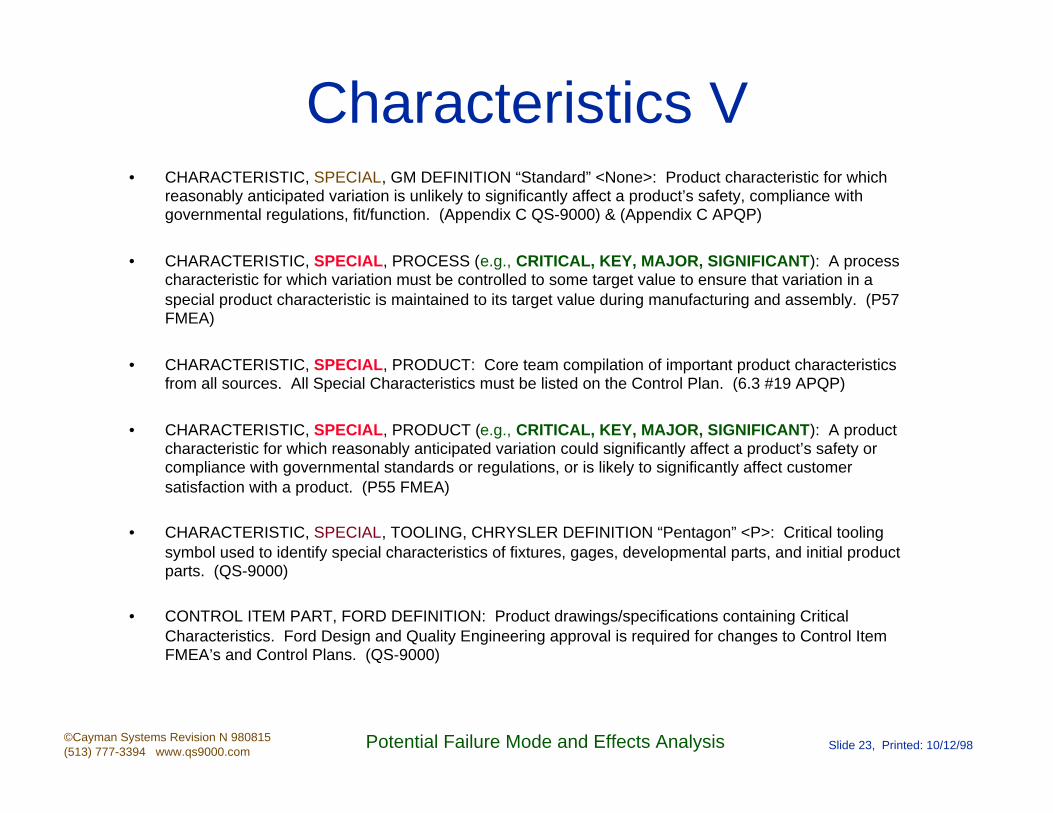
Characteristics V• CHARACTERISTIC, SPECIAL, GM DEFINITION “Standard” <None>: Product characteristic for which
reasonably anticipated variation is unlikely to significantly affect a product’s safety, compliance with governmental regulations, fit/function. (Appendix C QS-9000) & (Appendix C APQP)
• CHARACTERISTIC, SPECIAL, PROCESS (e.g., CRITICAL, KEY, MAJOR, SIGNIFICANT): A process characteristic for which variation must be controlled to some target value to ensure that variation in a special product characteristic is maintained to its target value during manufacturing and assembly. (P57 FMEA)
• CHARACTERISTIC, SPECIAL, PRODUCT: Core team compilation of important product characteristics from all sources. All Special Characteristics must be listed on the Control Plan. (6.3 #19 APQP)
• CHARACTERISTIC, SPECIAL, PRODUCT (e.g., CRITICAL, KEY, MAJOR, SIGNIFICANT): A product characteristic for which reasonably anticipated variation could significantly affect a product’s safety or compliance with governmental standards or regulations, or is likely to significantly affect customer satisfaction with a product. (P55 FMEA)
• CHARACTERISTIC, SPECIAL, TOOLING, CHRYSLER DEFINITION “Pentagon” <P>: Critical tooling symbol used to identify special characteristics of fixtures, gages, developmental parts, and initial product parts. (QS-9000)
• CONTROL ITEM PART, FORD DEFINITION: Product drawings/specifications containing Critical Characteristics. Ford Design and Quality Engineering approval is required for changes to Control Item FMEA’s and Control Plans. (QS-9000)
©Cayman Systems Revision N 980815(513) 777-3394 www.qs9000.com
Potential Failure Mode and Effects Analysis Slide 24, Printed: 10/12/98
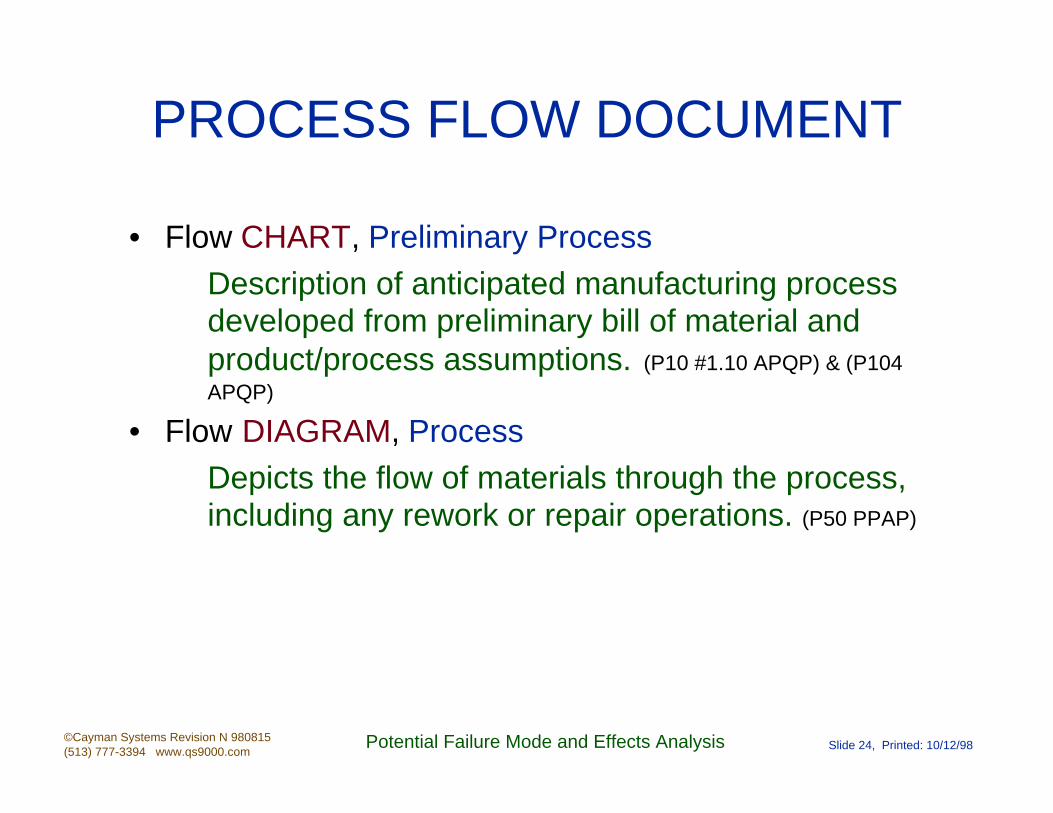
PROCESS FLOW DOCUMENT
• Flow CHART, Preliminary Process
Description of anticipated manufacturing process developed from preliminary bill of material and product/process assumptions. (P10 #1.10 APQP) & (P104 APQP)
• Flow DIAGRAM, Process
Depicts the flow of materials through the process, including any rework or repair operations. (P50 PPAP)

©Cayman Systems Revision N 980815(513) 777-3394 www.qs9000.com
Potential Failure Mode and Effects Analysis Slide 25, Printed: 10/12/98
FMEA & Failure terms• FMEA: FAILURE MODE and EFFECTS ANALYSIS - Systematized technique which identifies
and ranks the potential failure modes of a design or manufacturing process in order to prioritize improvement actions. (P22 SS) & (P49 PPAP)
• FAILURE CAUSE, POTENTIAL: How the failure could occur, described in terms of something that can be corrected or can be controlled. (P37 #14 FMEA)
• FAILURE MODES ANALYSIS (FMA): A formal, structured procedure used to analyze failure mode data from both current and prior processes to prevent occurrence of those failure modes in the future. (P103 APQP)
• FAILURE MODE, POTENTIAL: The manner in which the process could potentially fail to meet the process requirements and/or design intent. A description of the non-conformance at that specific operation. (P31 #10 FMEA)
• FMEA, DESIGN: Analytical technique used by a design responsible engineer/team as a means to assure, to the extent possible, that potential failure modes and their associated causes/mechanisms have been considered and addressed. (P103 APQP)
• FMEA, MACHINE/EQUIPMENT: Same as process FMEA, except machine/equipment being designed is considered the product. (P29 FMEA)
• FMEA, PROCESS: Analytical technique used by a manufacturing responsible engineer/team as a means to assure that, to the extent possible, potential failure modes and their associated causes/mechanisms have been considered and addressed. (P104 APQP)

©Cayman Systems Revision N 980815(513) 777-3394 www.qs9000.com
Potential Failure Mode and Effects Analysis Slide 26, Printed: 10/12/98
Control Plan Definitions• CONTROL PLAN: Written descriptions of the system for controlling production parts and
processes. They are written to address the important characteristics and engineering requirements of the product. Types of Control Plans include “family” , device or technology Control Plans which apply to a number of parts produced using a common process. Customer approval of Control Plans may be required prior to PSW submission. Refer to Section III for customer-specific requirement (see APQP & Control Plan reference manual and PPAP manual). (QS-9000), (P4 APQP), (P49 PPAP) & (P55 FMEA)
• CONTROL PLAN, PRE-LAUNCH: A description of the dimensional measurements and material and performance tests that will occur after Prototype and before full (normal) Production. (P4 APQP) & (6.3 #1 APQP)
• CONTROL PLAN, PRODUCTION: A comprehensive documentation of product/process characteristics, process controls, tests, and measurement systems occurring during mass (normal) production. (P4 APQP) & (6.3 #1 APQP)
• CONTROL PLAN, PROTOTYPE: A description of the dimensional measurements and material and performance tests that will occur during Prototype build. (P4 APQP)
©Cayman Systems Revision N 980815(513) 777-3394 www.qs9000.com
Potential Failure Mode and Effects Analysis Slide 27, Printed: 10/12/98
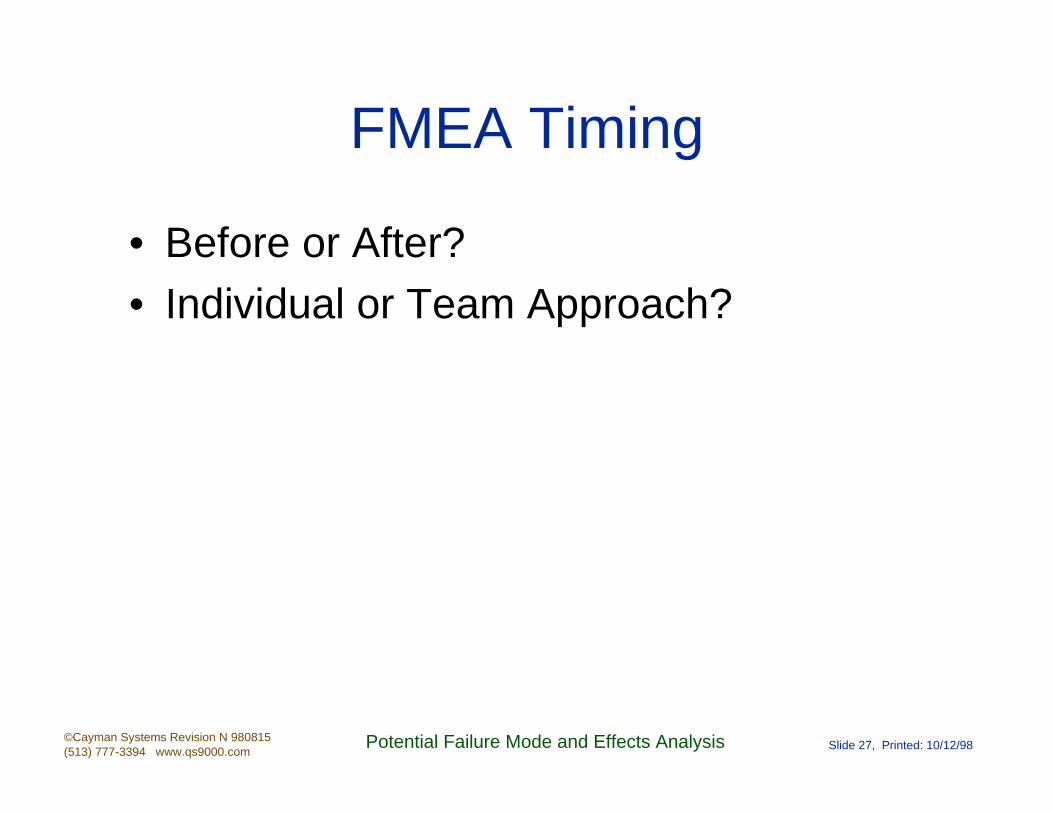
FMEA Timing
• Before or After?• Individual or Team Approach?
©Cayman Systems Revision N 980815(513) 777-3394 www.qs9000.com
Potential Failure Mode and Effects Analysis Slide 28, Printed: 10/12/98
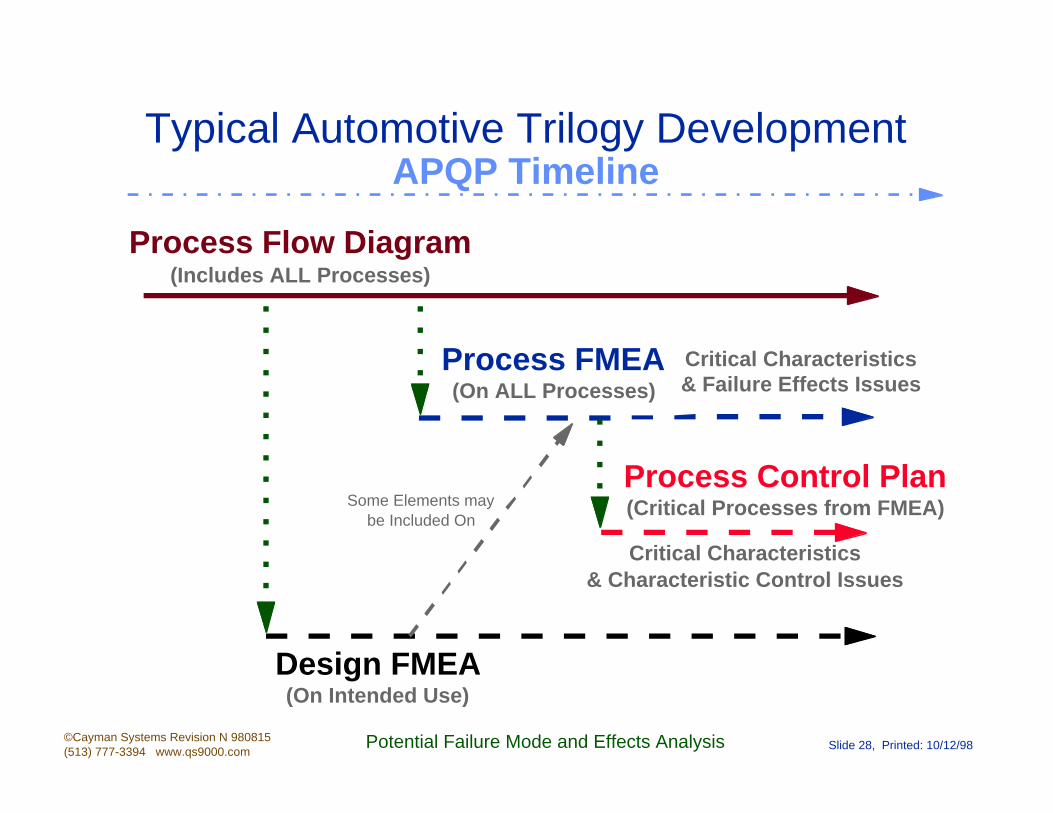
Typical Automotive Trilogy Development
Process Flow Diagram(Includes ALL Processes)
Process FMEA(On ALL Processes)
Process Control Plan(Critical Processes from FMEA)
Design FMEA(On Intended Use)
APQP Timeline
Some Elements may be Included On
Critical Characteristics& Characteristic Control Issues
Critical Characteristics& Failure Effects Issues
©Cayman Systems Revision N 980815(513) 777-3394 www.qs9000.com
Potential Failure Mode and Effects Analysis Slide 29, Printed: 10/12/98
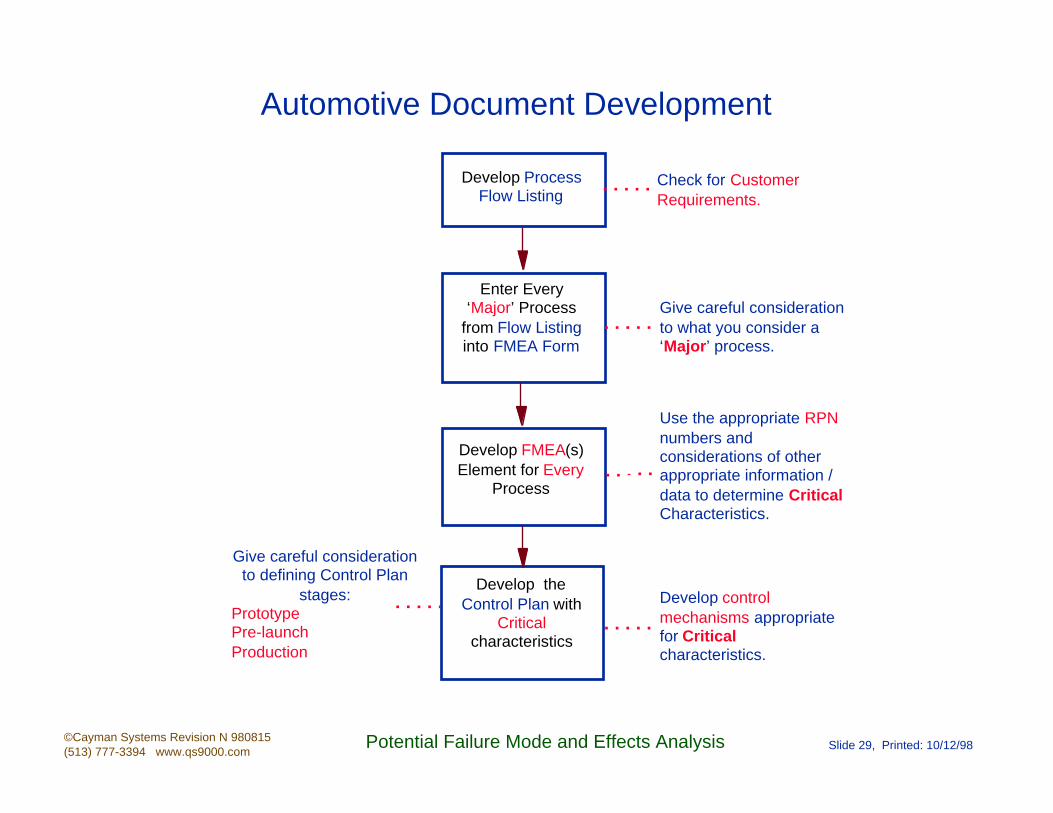
Automotive Document Development
Develop Process Flow Listing
Enter Every ‘Major’ Process
from Flow Listing into FMEA Form
Develop FMEA(s) Element for Every
Process
Check for Customer Requirements.
Give careful consideration to what you consider a ‘Major’ process.
Give careful consideration to defining Control Plan
stages:PrototypePre-launchProduction
Use the appropriate RPN numbers and considerations of other appropriate information /data to determine Critical Characteristics.
Develop the Control Plan with
Critical characteristics
Develop control mechanisms appropriate for Critical characteristics.
©Cayman Systems Revision N 980815(513) 777-3394 www.qs9000.com
Potential Failure Mode and Effects Analysis Slide 30, Printed: 10/12/98
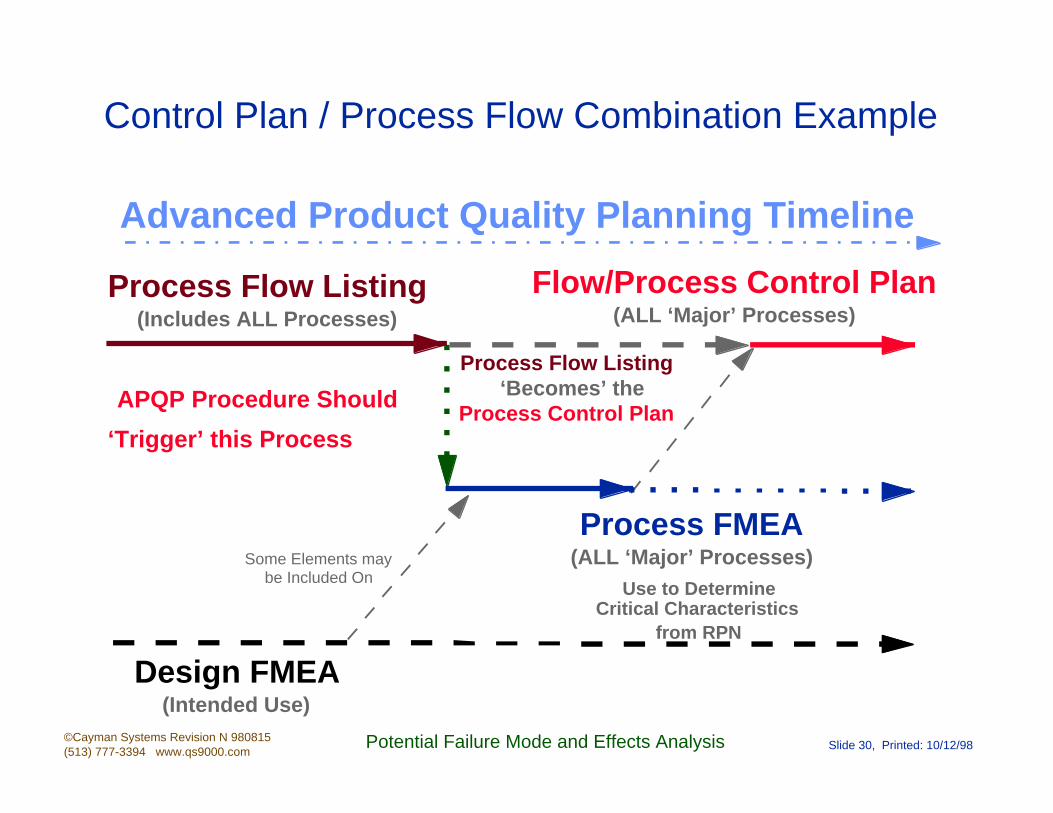
Advanced Product Quality Planning Timeline
Process Flow Listing(Includes ALL Processes)
Process FMEA(ALL ‘Major’ Processes)
Flow/Process Control Plan(ALL ‘Major’ Processes)
Design FMEA(Intended Use)
Some Elements may be Included On
Use to DetermineCritical Characteristics
from RPN
Process Flow Listing‘Becomes’ the
Process Control PlanAPQP Procedure Should
‘Trigger’ this Process
Control Plan / Process Flow Combination Example

©Cayman Systems Revision N 980815(513) 777-3394 www.qs9000.com
Potential Failure Mode and Effects Analysis Slide 31, Printed: 10/12/98
Control Plan / Process Flow Combination ExampleDocument Development
Develop Process Flow Listing
Enter Every ‘Major’ Process
from Flow Listing into Control Plan
Form
Develop FMEA(s) Element for Every
Process in the Control Plan
Give careful consideration to defining Control Plan
stages:PrototypePre-launchProduction
Check for Customer Requirements.
Give careful consideration to what you consider a ‘Major’ process.
Use the appropriate RPN numbers and considerations of other appropriate information /data to determine Critical Characteristics.
Develop control mechanisms appropriate for Critical characteristics.
Revise the Control Plan with
Critical characteristics

©Cayman Systems Revision N 980815(513) 777-3394 www.qs9000.com
Potential Failure Mode and Effects Analysis Slide 32, Printed: 10/12/98
One Document? Or More?
Device, Technology or Family = a flow of a ‘technology’ or ‘device’
Manufacturing Entity
Machine or Cell 1
‘Receiving’Machine or Cell 2
Machine or Cell 3
‘Pack
& Ship’
Internal or External
Customer
‘Receiving’‘Pack& Ship’
‘Segmented = By machine or ‘cell’

©Cayman Systems Revision N 980815(513) 777-3394 www.qs9000.com
Potential Failure Mode and Effects Analysis Slide 33, Printed: 10/12/98
QS9000:1996 - FMEAs4.2.3 - Quality Planning
Process Failure Mode and Effects Analysis (Process FMEAs)• Process FMEAs shall consider all special
characteristics. Efforts shall be taken to improve the process to achieve defect prevention rather than defect detection. Certain customers have FMEA review and approval requirements that shall be met prior to production part approval (see customer specific pages). Refer to the Potential Failure Mode and Effects Analysis reference manual.
©Cayman Systems Revision N 980815(513) 777-3394 www.qs9000.com
Potential Failure Mode and Effects Analysis Slide 34, Printed: 10/12/98
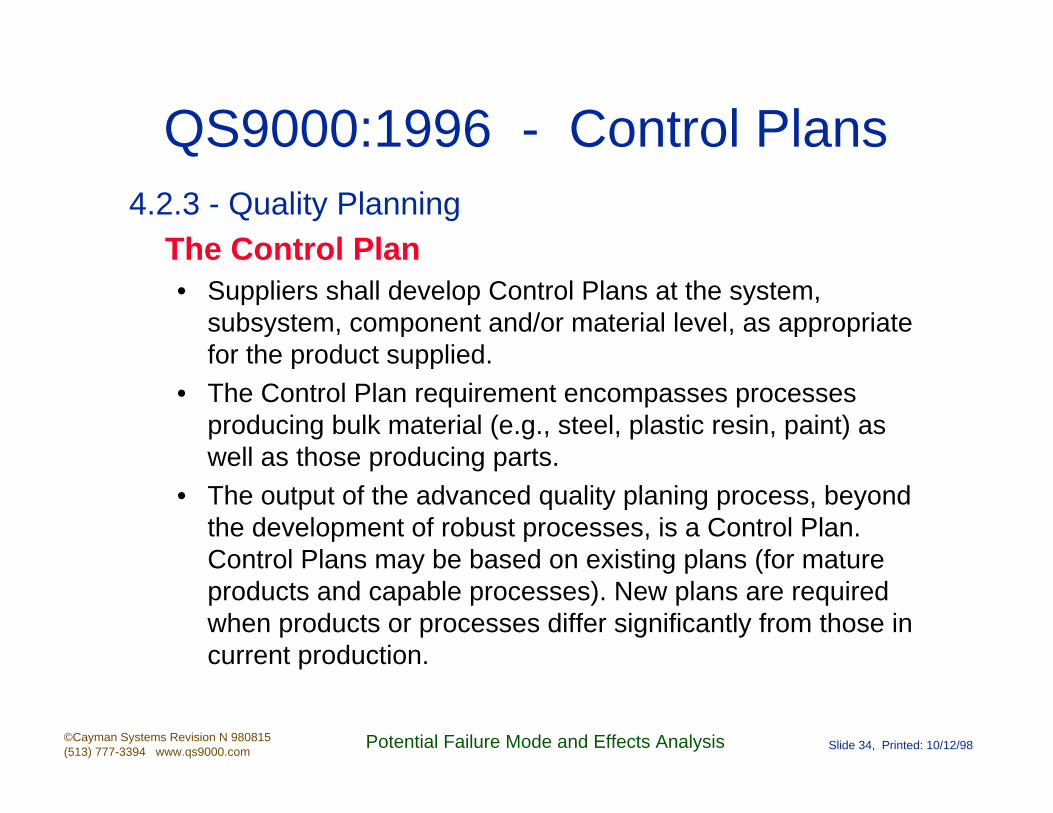
QS9000:1996 - Control Plans4.2.3 - Quality Planning
The Control Plan• Suppliers shall develop Control Plans at the system,
subsystem, component and/or material level, as appropriate for the product supplied.
• The Control Plan requirement encompasses processes producing bulk material (e.g., steel, plastic resin, paint) as well as those producing parts.
• The output of the advanced quality planing process, beyond the development of robust processes, is a Control Plan. Control Plans may be based on existing plans (for mature products and capable processes). New plans are required when products or processes differ significantly from those in current production.
©Cayman Systems Revision N 980815(513) 777-3394 www.qs9000.com
Potential Failure Mode and Effects Analysis Slide 35, Printed: 10/12/98
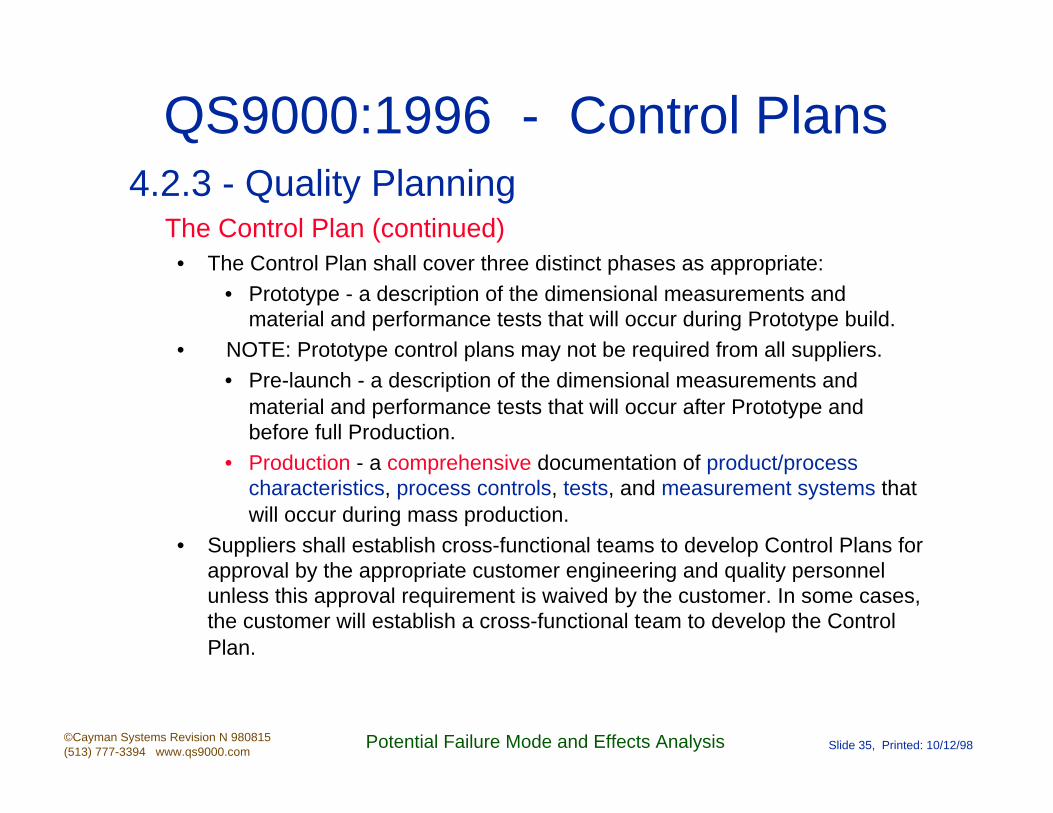
QS9000:1996 - Control Plans4.2.3 - Quality Planning
The Control Plan (continued)• The Control Plan shall cover three distinct phases as appropriate:
• Prototype - a description of the dimensional measurements and material and performance tests that will occur during Prototype build.
• NOTE: Prototype control plans may not be required from all suppliers.• Pre-launch - a description of the dimensional measurements and
material and performance tests that will occur after Prototype and before full Production.
• Production - a comprehensive documentation of product/process characteristics, process controls, tests, and measurement systems that will occur during mass production.
• Suppliers shall establish cross-functional teams to develop Control Plans for approval by the appropriate customer engineering and quality personnel unless this approval requirement is waived by the customer. In some cases, the customer will establish a cross-functional team to develop the Control Plan.
©Cayman Systems Revision N 980815(513) 777-3394 www.qs9000.com
Potential Failure Mode and Effects Analysis Slide 36, Printed: 10/12/98
Semiconductor Supplement
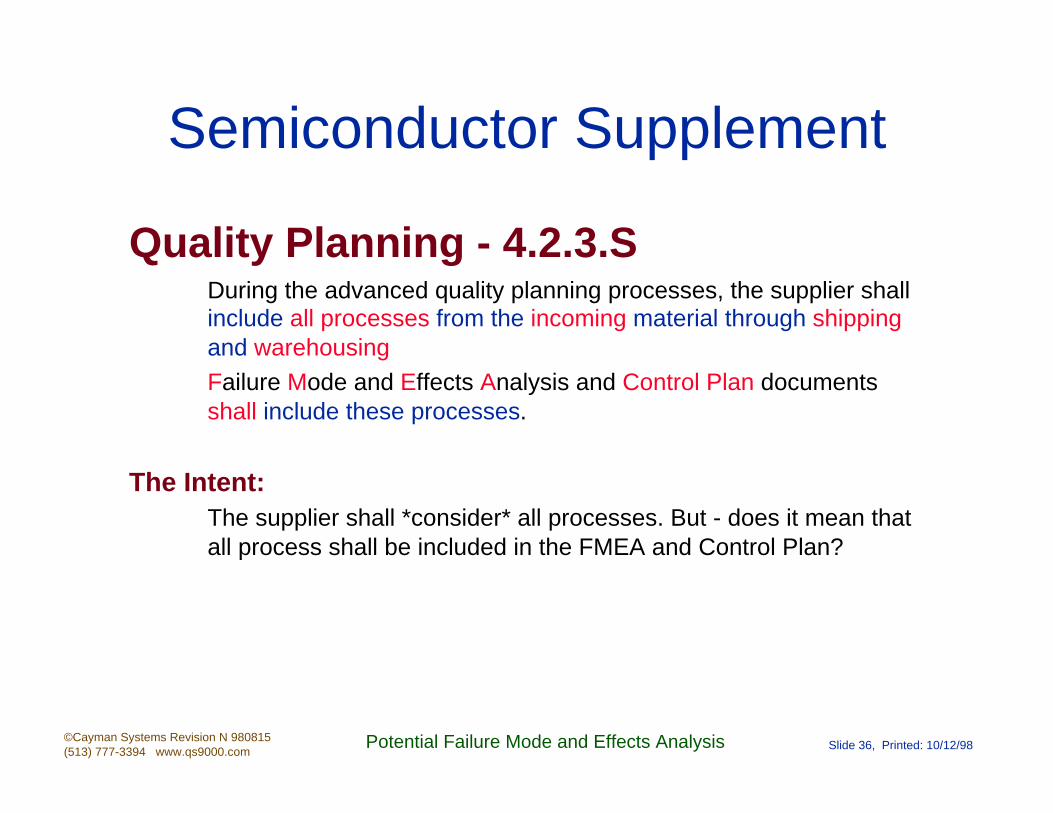
Quality Planning - 4.2.3.SDuring the advanced quality planning processes, the supplier shall include all processes from the incoming material through shipping and warehousingFailure Mode and Effects Analysis and Control Plan documents shall include these processes.
The Intent:The supplier shall *consider* all processes. But - does it mean that all process shall be included in the FMEA and Control Plan?
©Cayman Systems Revision N 980815(513) 777-3394 www.qs9000.com
Potential Failure Mode and Effects Analysis Slide 37, Printed: 10/12/98
APQP Manual : 1995
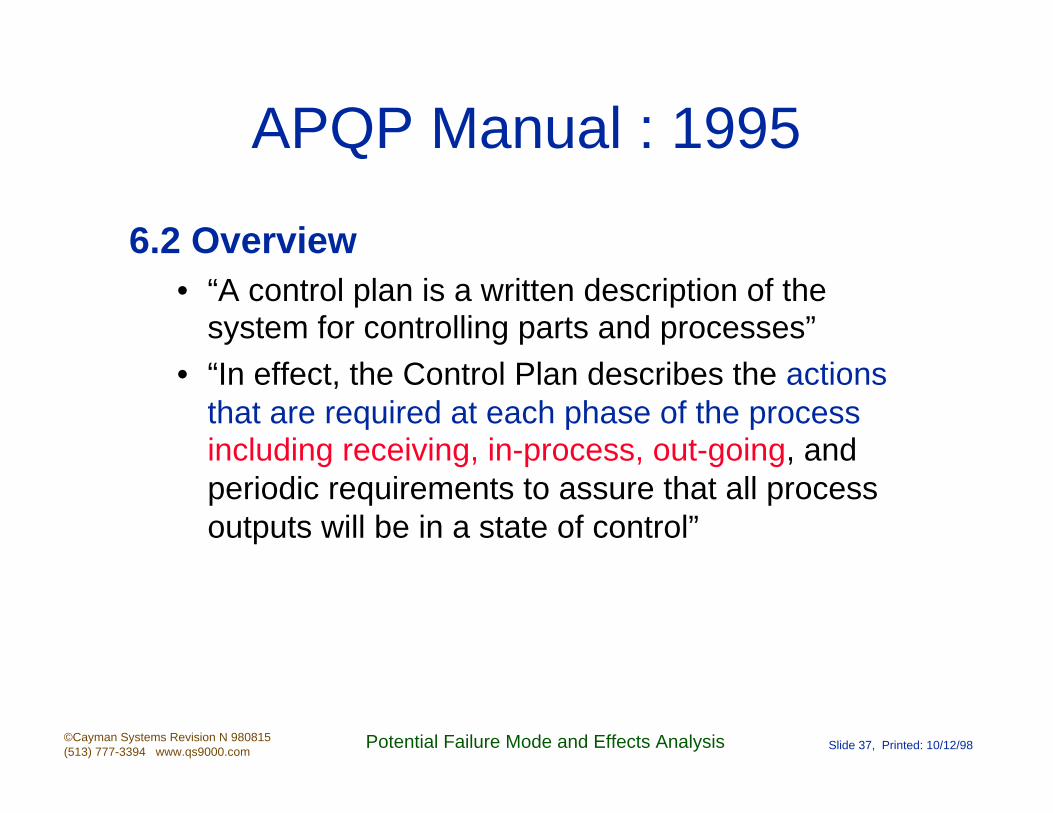
6.2 Overview• “A control plan is a written description of the
system for controlling parts and processes”
• “In effect, the Control Plan describes the actions that are required at each phase of the process including receiving, in-process, out-going, and periodic requirements to assure that all process outputs will be in a state of control”
©Cayman Systems Revision N 980815(513) 777-3394 www.qs9000.com
Potential Failure Mode and Effects Analysis Slide 38, Printed: 10/12/98
FMEA Manual : 1995
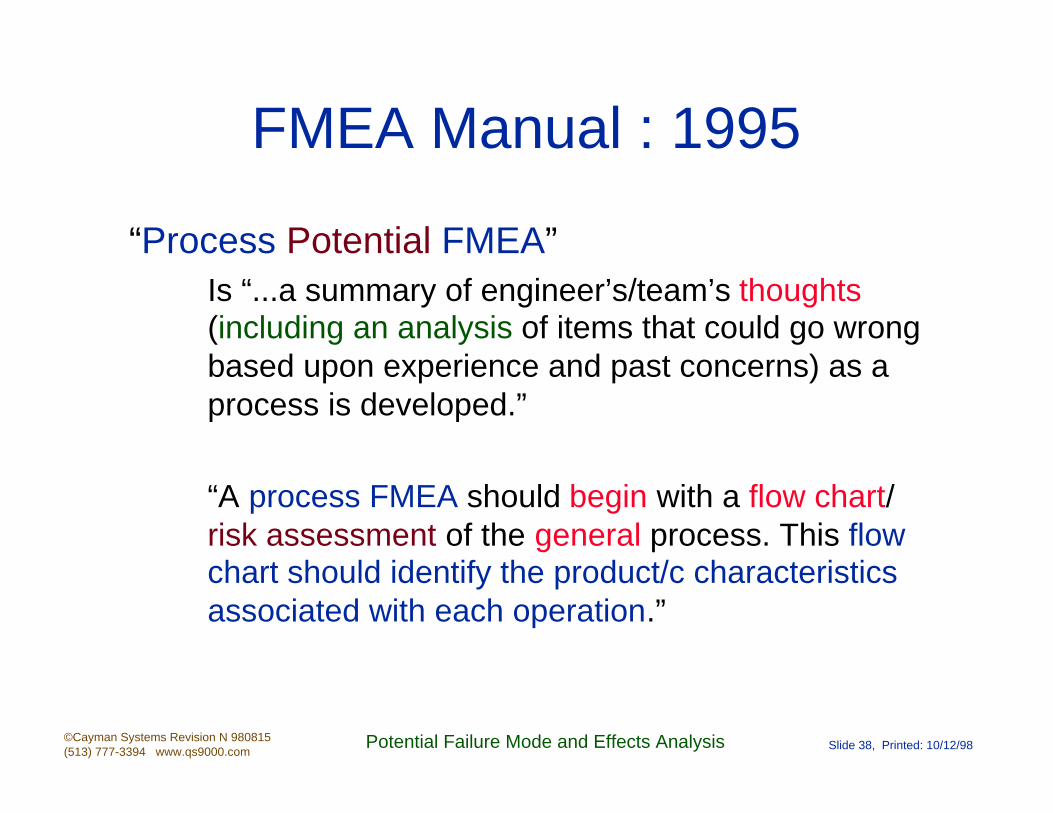
“Process Potential FMEA”Is “...a summary of engineer’s/team’s thoughts (including an analysis of items that could go wrong based upon experience and past concerns) as a process is developed.”
“A process FMEA should begin with a flow chart/risk assessment of the general process. This flow chart should identify the product/c characteristics associated with each operation.”

©Cayman Systems Revision N 980815(513) 777-3394 www.qs9000.com
Potential Failure Mode and Effects Analysis Slide 39, Printed: 10/12/98
Benefits of FMEAs
• Prevention Planning• Identifies change requirements• Cost reduction• Increased through-put• Decreased waste• Decreased warranty costs• Reduce non-value added operations

©Cayman Systems Revision N 980815(513) 777-3394 www.qs9000.com
Potential Failure Mode and Effects Analysis Slide 40, Printed: 10/12/98
FMEA Prerequisites
• Select proper team and organize members effectively
• Select teams for each product/service, process/system
• Create a ranking system
• Agree on format for FMEA matrix (Typically set by AIAG)
• Define the customer and customer needs/expectations
• Design/Process requirements
• Develop a process flow chart **
©Cayman Systems Revision N 980815(513) 777-3394 www.qs9000.com
Potential Failure Mode and Effects Analysis Slide 41, Printed: 10/12/98
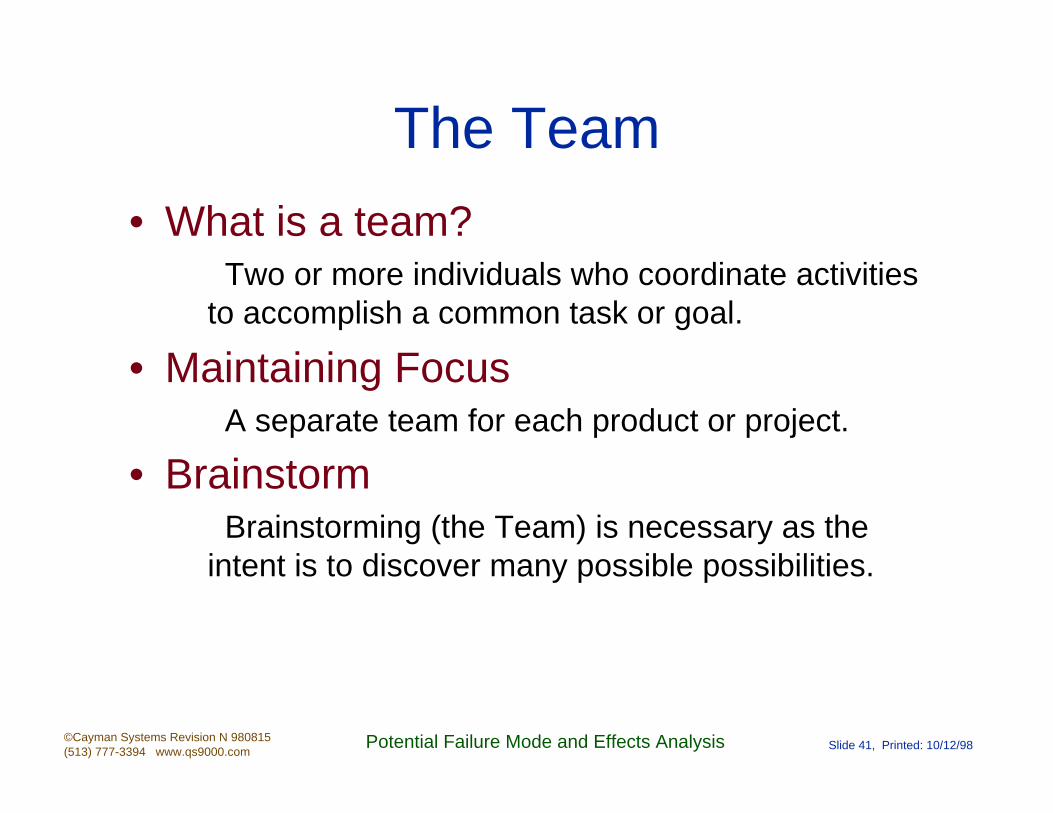
The Team
• What is a team?Two or more individuals who coordinate activities
to accomplish a common task or goal.
• Maintaining FocusA separate team for each product or project.
• BrainstormBrainstorming (the Team) is necessary as the
intent is to discover many possible possibilities.

©Cayman Systems Revision N 980815(513) 777-3394 www.qs9000.com
Potential Failure Mode and Effects Analysis Slide 42, Printed: 10/12/98
Team Structures
Two Types of Team StructuresNatural Work Group Task Team
MembershipWork area or unit.
Representatives from support groups on as-needed basis.
Representatives who have key information or are stakeholders.
Member Selection Participation is mandatory. Assigned by steering committee or uper management.
Project IdentificationAssigned by management or
identified by team and within its authority.
Assigned by or mnegotiated with steering committee or upper
management.Team Life Span Ongoing. Disbands when task is finished.
Leadership Leader appointed by management.
Leadership shared or delegated by members.

©Cayman Systems Revision N 980815(513) 777-3394 www.qs9000.com
Potential Failure Mode and Effects Analysis Slide 43, Printed: 10/12/98
Successful Teams
• Are management directed and focused• Build their own identity• Are accountable and use
measurements• Have corporate champions• Fit into the organization• Are cross-functional
Some teams just “Do Not
Work”
©Cayman Systems Revision N 980815(513) 777-3394 www.qs9000.com
Potential Failure Mode and Effects Analysis Slide 44, Printed: 10/12/98
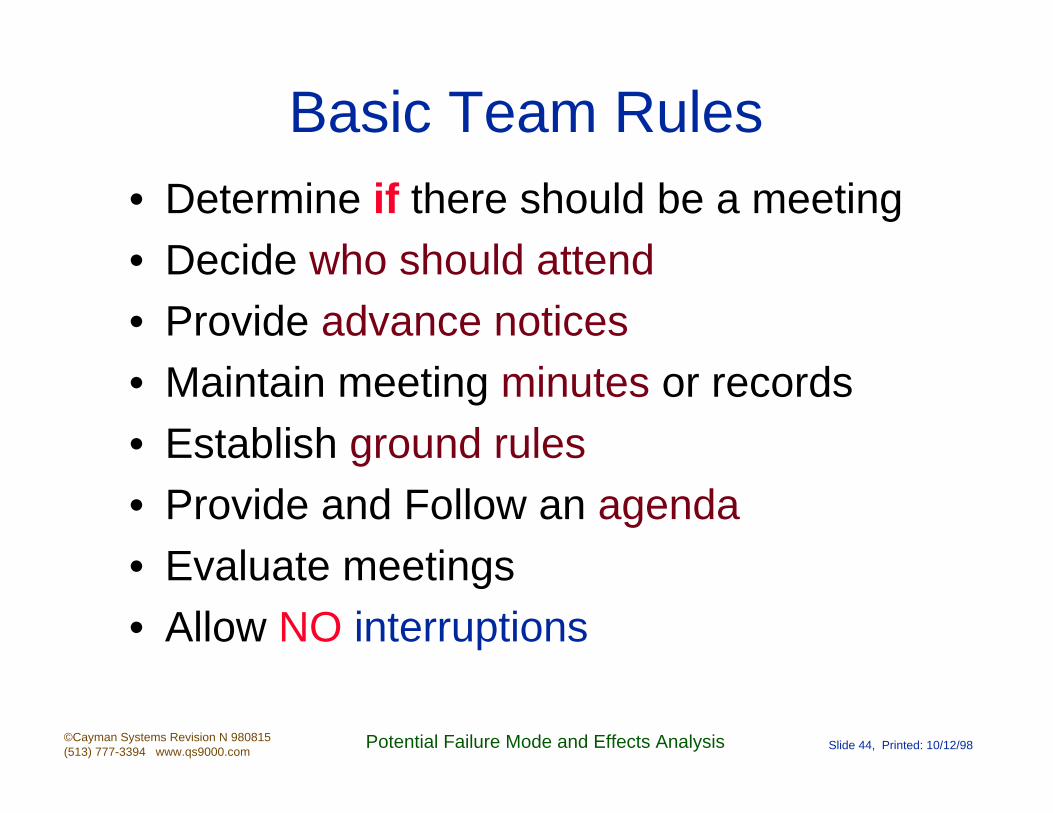
Basic Team Rules• Determine if there should be a meeting• Decide who should attend• Provide advance notices• Maintain meeting minutes or records• Establish ground rules• Provide and Follow an agenda• Evaluate meetings• Allow NO interruptions

©Cayman Systems Revision N 980815(513) 777-3394 www.qs9000.com
Potential Failure Mode and Effects Analysis Slide 45, Printed: 10/12/98
Team Ground Rules
• Ground Rules are an aid to “self-management”
• Team must develop their own ground rules• Once developed, everyone must live by them
• They can modify or enhance the rules as they continue to meet

©Cayman Systems Revision N 980815(513) 777-3394 www.qs9000.com
Potential Failure Mode and Effects Analysis Slide 46, Printed: 10/12/98
Team Meeting Responsibility• Clarify• Participate• Listen• Summarize• Stay on track• Manage time• Test for consensus• Evaluate meeting process

©Cayman Systems Revision N 980815(513) 777-3394 www.qs9000.com
Potential Failure Mode and Effects Analysis Slide 47, Printed: 10/12/98
Decision Criteria / Model
• One person makes the decision• One person consults the group, then
makes the final decision• Team or group makes decision based
upon majority rule or consensus
©Cayman Systems Revision N 980815(513) 777-3394 www.qs9000.com
Potential Failure Mode and Effects Analysis Slide 48, Printed: 10/12/98
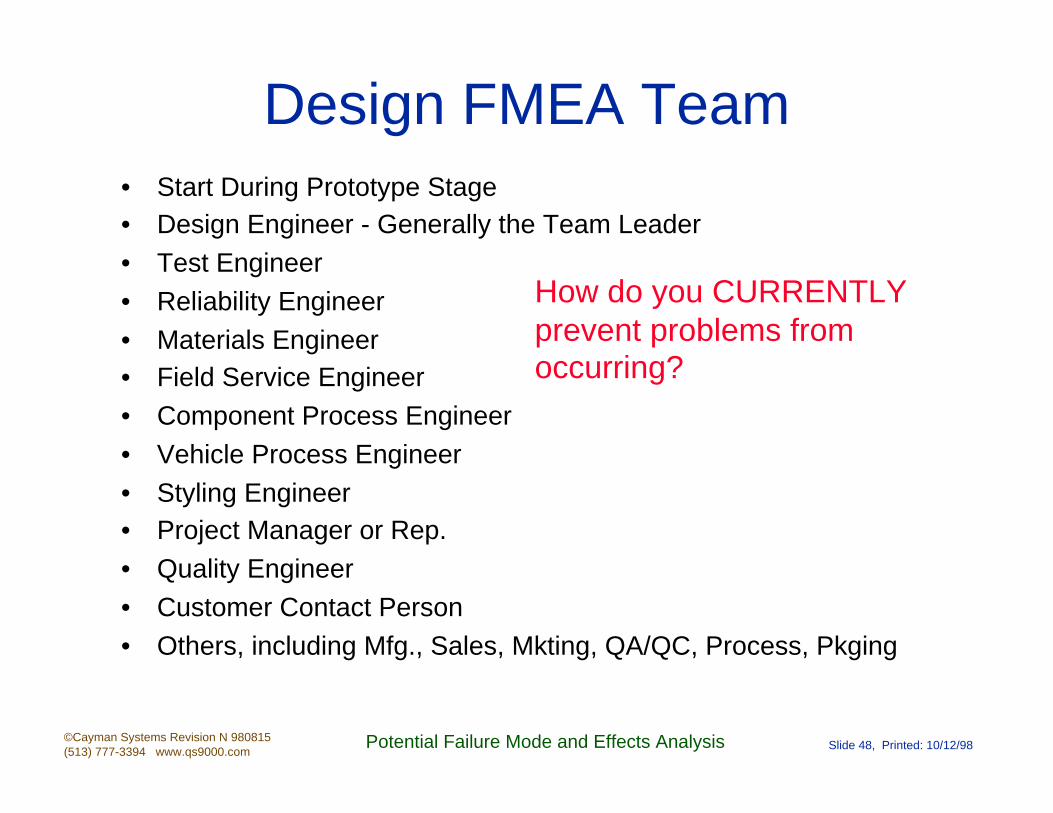
• Start During Prototype Stage• Design Engineer - Generally the Team Leader
• Test Engineer
• Reliability Engineer
• Materials Engineer• Field Service Engineer
• Component Process Engineer
• Vehicle Process Engineer
• Styling Engineer• Project Manager or Rep.
• Quality Engineer
• Customer Contact Person
• Others, including Mfg., Sales, Mkting, QA/QC, Process, Pkging
Design FMEA Team
How do you CURRENTLY prevent problems from occurring?

©Cayman Systems Revision N 980815(513) 777-3394 www.qs9000.com
Potential Failure Mode and Effects Analysis Slide 49, Printed: 10/12/98
Process FMEA Team Members• Process Engineer - Generally the Team Leader
• Production Operator• Industrial Engineer
• Design Engineer• Reliability Engineer
• Tooling Engineer• Maintenance Engineer
• Styling Engineer• Project Manager or Rep.
• Quality Engineer• Others including Supplier, Sales, QA/QC, Mfg.
How do you presently prevent problems?

©Cayman Systems Revision N 980815(513) 777-3394 www.qs9000.com
Potential Failure Mode and Effects Analysis Slide 50, Printed: 10/12/98
Defining the Customer
Design FMEA CustomerEnd User; person who uses the productUse Failure
This can help in Repair manuals & Field ServiceMore in the DFMEA section herein...
Process FMEA CustomerSubsequent operations
End User; person who uses the productMore in the DFMEA section herein...
©Cayman Systems Revision N 980815(513) 777-3394 www.qs9000.com
Potential Failure Mode and Effects Analysis Slide 51, Printed: 10/12/98
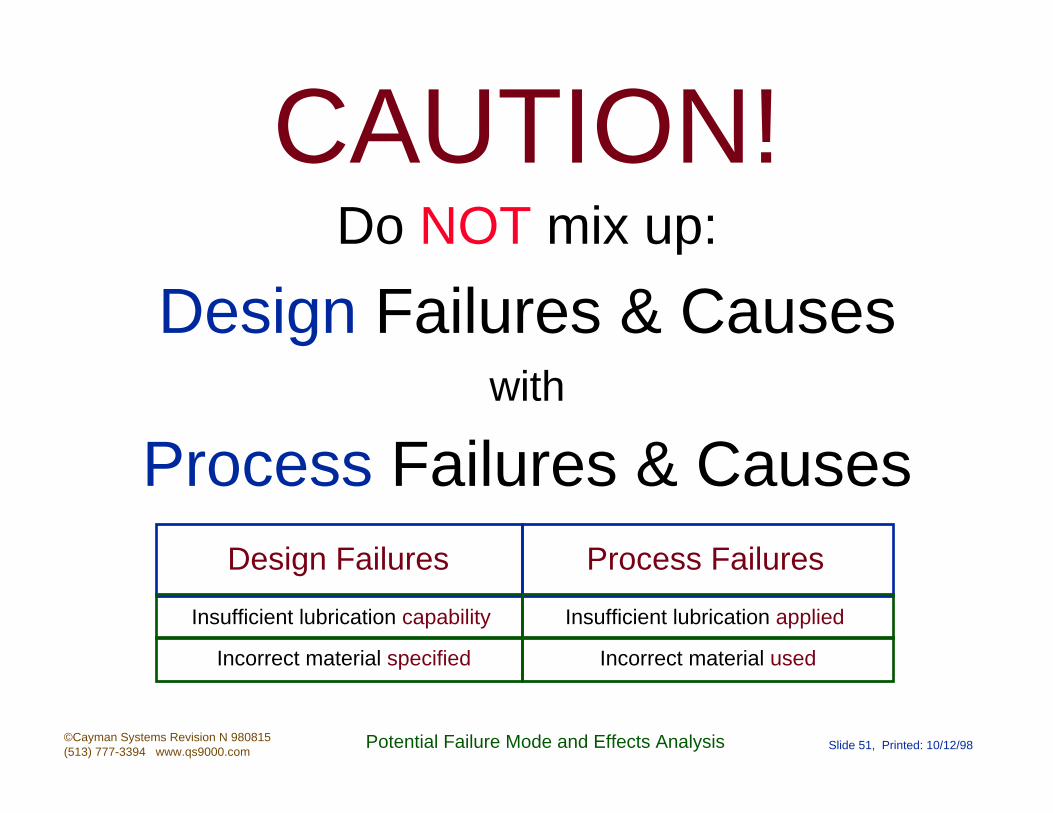
CAUTION!Do NOT mix up:
Design Failures & Causeswith
Process Failures & Causes
Insufficient lubrication capability
Design Failures
Insufficient lubrication applied
Process Failures
Incorrect material specified Incorrect material used
©Cayman Systems Revision N 980815(513) 777-3394 www.qs9000.com
Potential Failure Mode and Effects Analysis Slide 52, Printed: 10/12/98
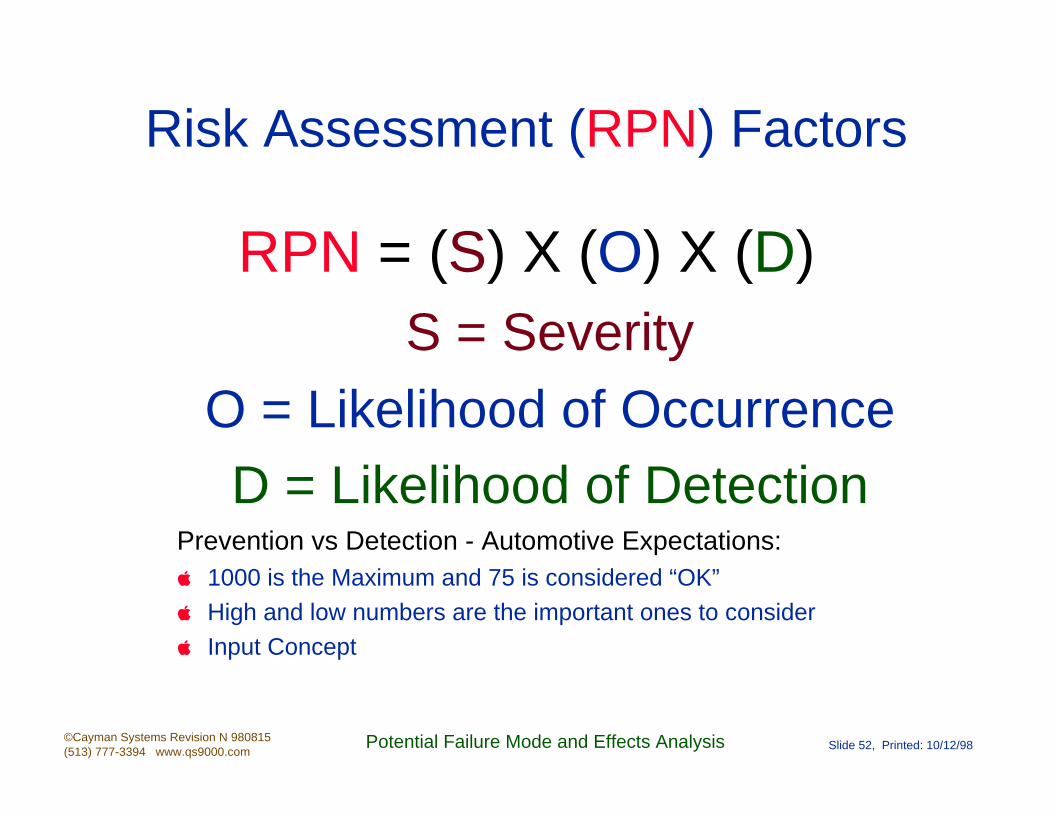
Risk Assessment (RPN) Factors
RPN = (S) X (O) X (D)S = Severity
O = Likelihood of OccurrenceD = Likelihood of Detection
Prevention vs Detection - Automotive Expectations:1000 is the Maximum and 75 is considered “OK”High and low numbers are the important ones to considerInput Concept

©Cayman Systems Revision N 980815(513) 777-3394 www.qs9000.com
Potential Failure Mode and Effects Analysis Slide 53, Printed: 10/12/98
RPN Flow
Device / Process Cause
Chance of Occurrence
Effect Control
Severity Chance Not Detected
Failure Mode
Process Function - Requirements
Potential Failure Mode
Potential Effects Of Failure S
everi
ty Potential Causes/Mechanism(s)
Of Failure Occura
nce
Current Process Controls D
ete
cti
on
RPN
Recommended Actions And
Status
Responsible Activity and
Target Completion
DateActions Taken O
ccure
d
Severi
ty
Dete
cti
on
RPN
Item - FunctionPotential Failure
ModePotential Effects Of
Failure Severi
ty Potential Causes/Mechanism(s) Of
Failure Occura
nce
Current Design Controls D
ete
cti
on
RPN
Recommended Actions And
Status
Responsible Activity and
Target Completion
Date Occure
dS
everi
tyD
ete
cti
on
RPN
Design FMEA
Process FMEA
From Guess
From Experience & Data
©Cayman Systems Revision N 980815(513) 777-3394 www.qs9000.com
Potential Failure Mode and Effects Analysis Slide 54, Printed: 10/12/98
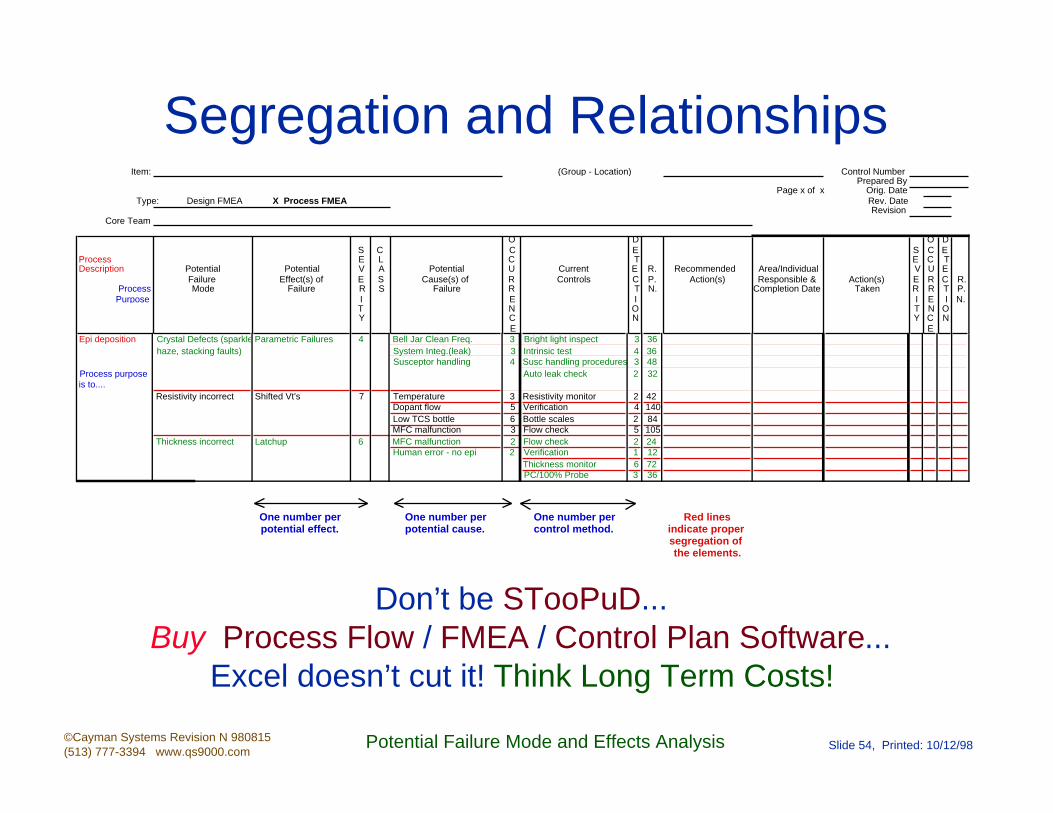
Segregation and Relationships
Don’t be STooPuD...Buy Process Flow / FMEA / Control Plan Software...
Excel doesn’t cut it! Think Long Term Costs!
Item: (Group - Location) Control NumberPrepared By
Page x of x Orig. Date Type: Design FMEA or X Process FMEA Rev. Date
RevisionCore Team
O D O DS C C E S C E
Process E L C T E C TDescription Potential Potential V A Potential U Current E R. Recommended Area/Individual V U E
Failure Effect(s) of E S Cause(s) of R Controls C P. Action(s) Responsible & Action(s) E R C R.Process Mode Failure R S Failure R T N. Completion Date Taken R R T P.Purpose I E I I E I N.
T N O T N OY C N Y C N
E EEpi deposition Crystal Defects (sparkles,Parametric Failures 4 Bell Jar Clean Freq. 3 Bright light inspect 3 36 haze, stacking faults) System Integ.(leak) 3 Intrinsic test 4 36
Susceptor handling 4 Susc handling procedures 3 48Process purpose is to....
Auto leak check 2 32
Resistivity incorrect Shifted Vt's 7 Temperature 3 Resistivity monitor 2 42Dopant flow 5 Verification 4 140Low TCS bottle 6 Bottle scales 2 84MFC malfunction 3 Flow check 5 105
Thickness incorrect Latchup 6 MFC malfunction 2 Flow check 2 24Human error - no epi 2 Verification 1 12
Thickness monitor 6 72 PC/100% Probe 3 36
One number per potential effect.
One number per potential cause.
One number per control method.
Red lines indicate proper segregation of the elements.
©Cayman Systems Revision N 980815(513) 777-3394 www.qs9000.com
Potential Failure Mode and Effects Analysis Slide 55, Printed: 10/12/98
Design FMEA
©Cayman Systems Revision N 980815(513) 777-3394 www.qs9000.com
Potential Failure Mode and Effects Analysis Slide 56, Printed: 10/12/98
Design FMEAA Design FMEA is an analytical
technique utilized primarily by a Design FMEA team to ensure potential failure
modes and their associated causes are identified, considered and addressed.
Reference page 8 in the AIAG FMEA Reference ManualThis systematic approach parallels, formalizes and documents the
mental discipline that an engineer normally goes through in any design process.
©Cayman Systems Revision N 980815(513) 777-3394 www.qs9000.com
Potential Failure Mode and Effects Analysis Slide 57, Printed: 10/12/98
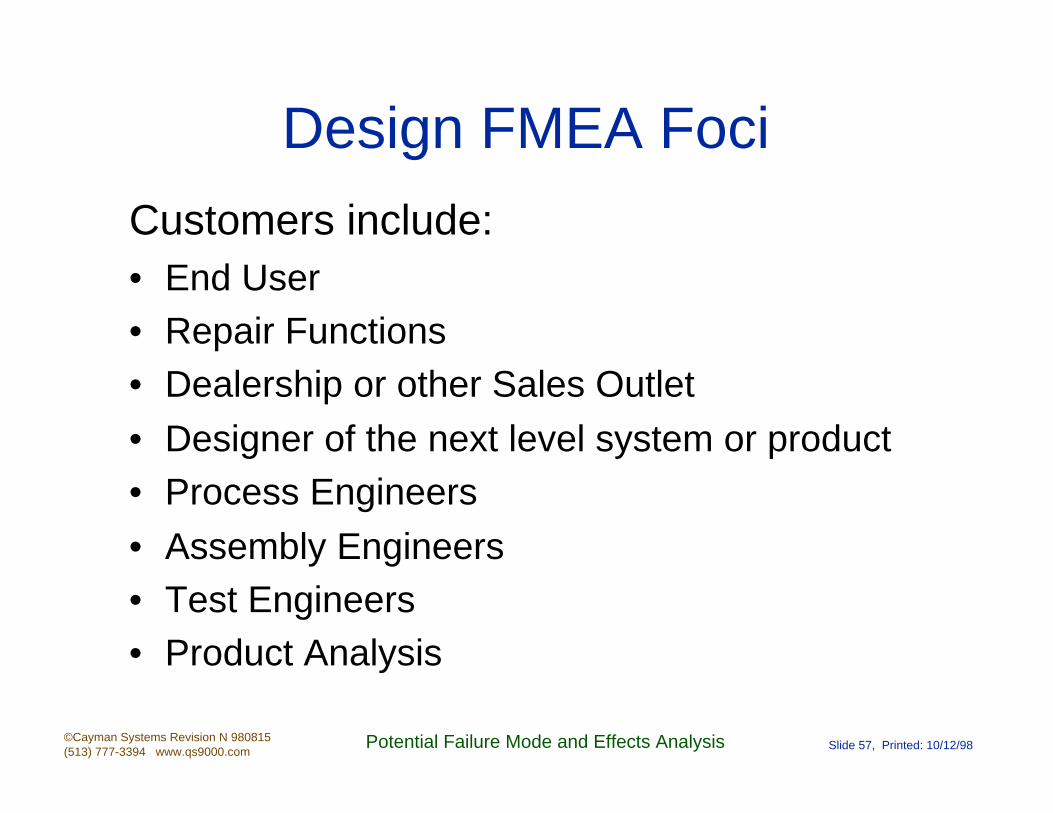
Design FMEA Foci
Customers include:• End User• Repair Functions• Dealership or other Sales Outlet
• Designer of the next level system or product• Process Engineers
• Assembly Engineers• Test Engineers• Product Analysis
©Cayman Systems Revision N 980815(513) 777-3394 www.qs9000.com
Potential Failure Mode and Effects Analysis Slide 58, Printed: 10/12/98
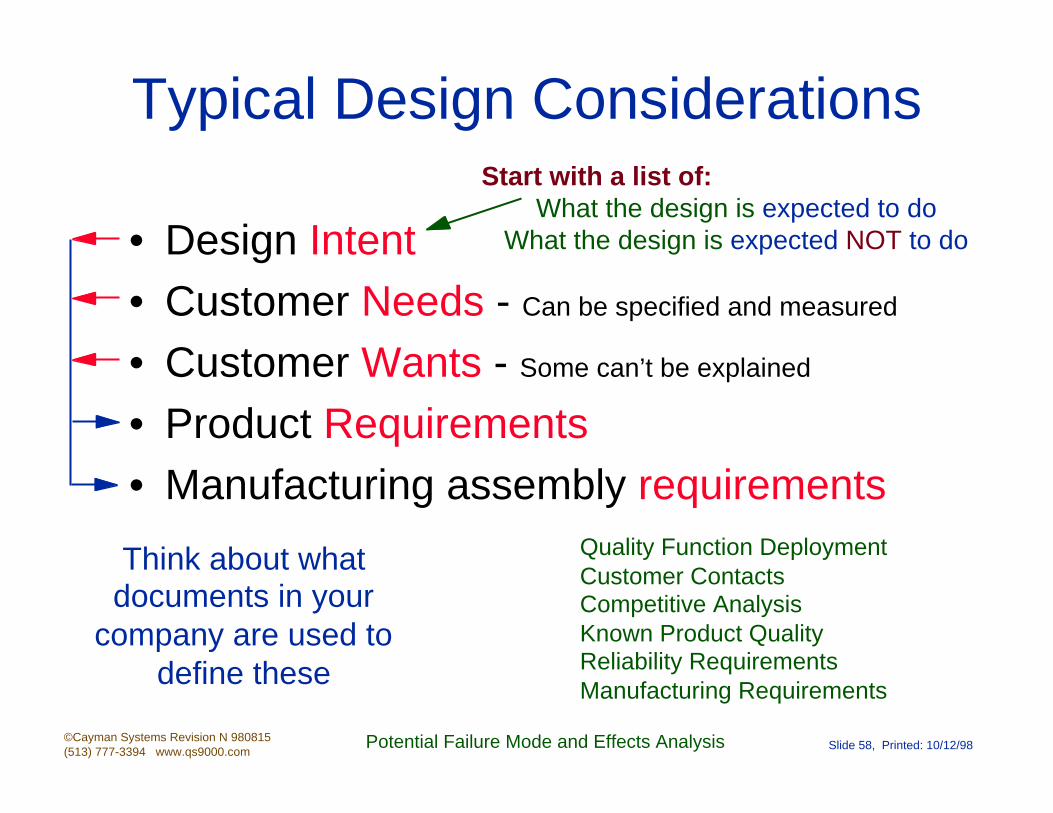
Typical Design Considerations
• Design Intent• Customer Needs - Can be specified and measured
• Customer Wants - Some can’t be explained
• Product Requirements• Manufacturing assembly requirements
Think about what documents in your
company are used to define these
Start with a list of:What the design is expected to do
What the design is expected NOT to do
Quality Function DeploymentCustomer ContactsCompetitive AnalysisKnown Product QualityReliability RequirementsManufacturing Requirements
©Cayman Systems Revision N 980815(513) 777-3394 www.qs9000.com
Potential Failure Mode and Effects Analysis Slide 59, Printed: 10/12/98
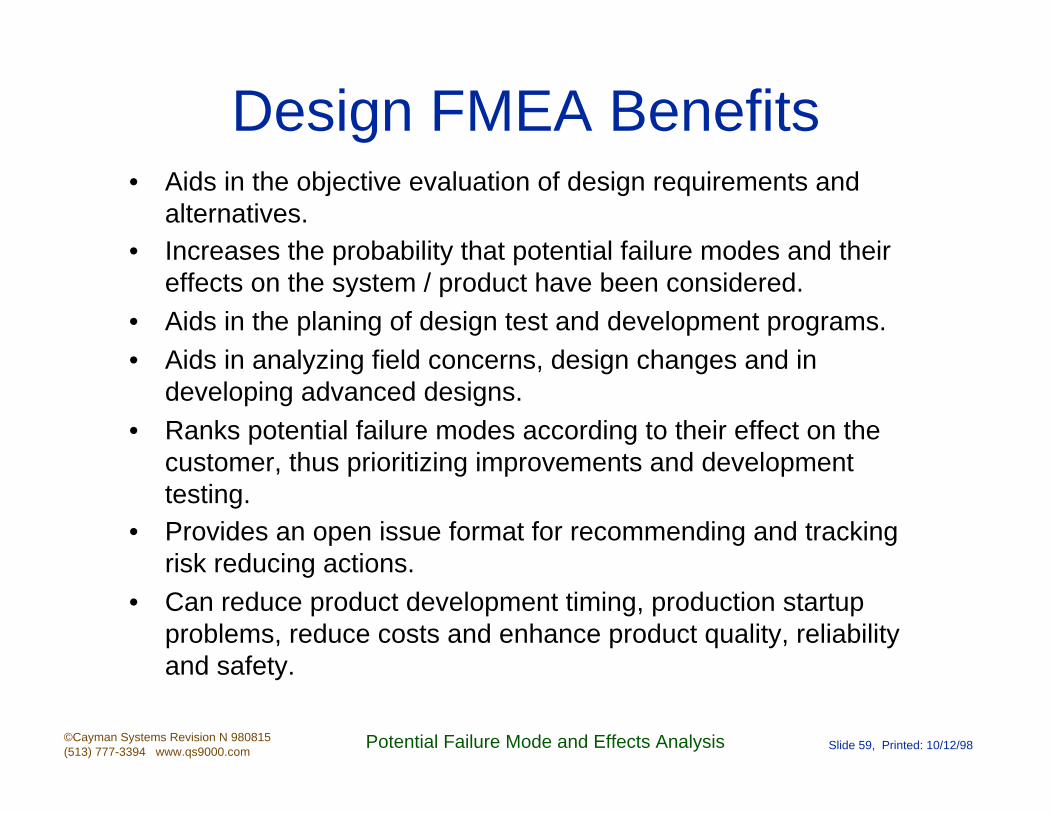
Design FMEA Benefits• Aids in the objective evaluation of design requirements and
alternatives.• Increases the probability that potential failure modes and their
effects on the system / product have been considered.
• Aids in the planing of design test and development programs.
• Aids in analyzing field concerns, design changes and in developing advanced designs.
• Ranks potential failure modes according to their effect on the customer, thus prioritizing improvements and development testing.
• Provides an open issue format for recommending and tracking risk reducing actions.
• Can reduce product development timing, production startup problems, reduce costs and enhance product quality, reliability and safety.

©Cayman Systems Revision N 980815(513) 777-3394 www.qs9000.com
Potential Failure Mode and Effects Analysis Slide 60, Printed: 10/12/98
More Design FMEA Considerations
• The Design FMEA is a living document and should be initiated at, or by, design concept completion.
• The Design FMEA should be continually updated as changes occur throughout all phases of product development.
• The Design FMEA should be fundamentally complete along with the final product drawings.
• The Design FMEA addresses the design intent and assumes the design will be manufactured / assembled to this intent.
• The Potential Failure Modes/Causes which can occur during manufacturing or assembly process are covered by the Process FMEA and therefore should NOT be included in a Design FMEA.

©Cayman Systems Revision N 980815(513) 777-3394 www.qs9000.com
Potential Failure Mode and Effects Analysis Slide 61, Printed: 10/12/98
Design Failure CausesCauses of design failure modes are those things that, from a designer’s perspective, would, by omission or
improper use, result in the failure mode.

©Cayman Systems Revision N 980815(513) 777-3394 www.qs9000.com
Potential Failure Mode and Effects Analysis Slide 62, Printed: 10/12/98
Design Failure Cause Examples
• Improper Tolerancing• Incorrect Stress Calculations
• Wrong Assumptions• Wrong Material Call Out• Lower Grade Component
• Lack of Design Standards• Improper Heat Treatment
• Improper Torque Call Out
©Cayman Systems Revision N 980815(513) 777-3394 www.qs9000.com
Potential Failure Mode and Effects Analysis Slide 63, Printed: 10/12/98
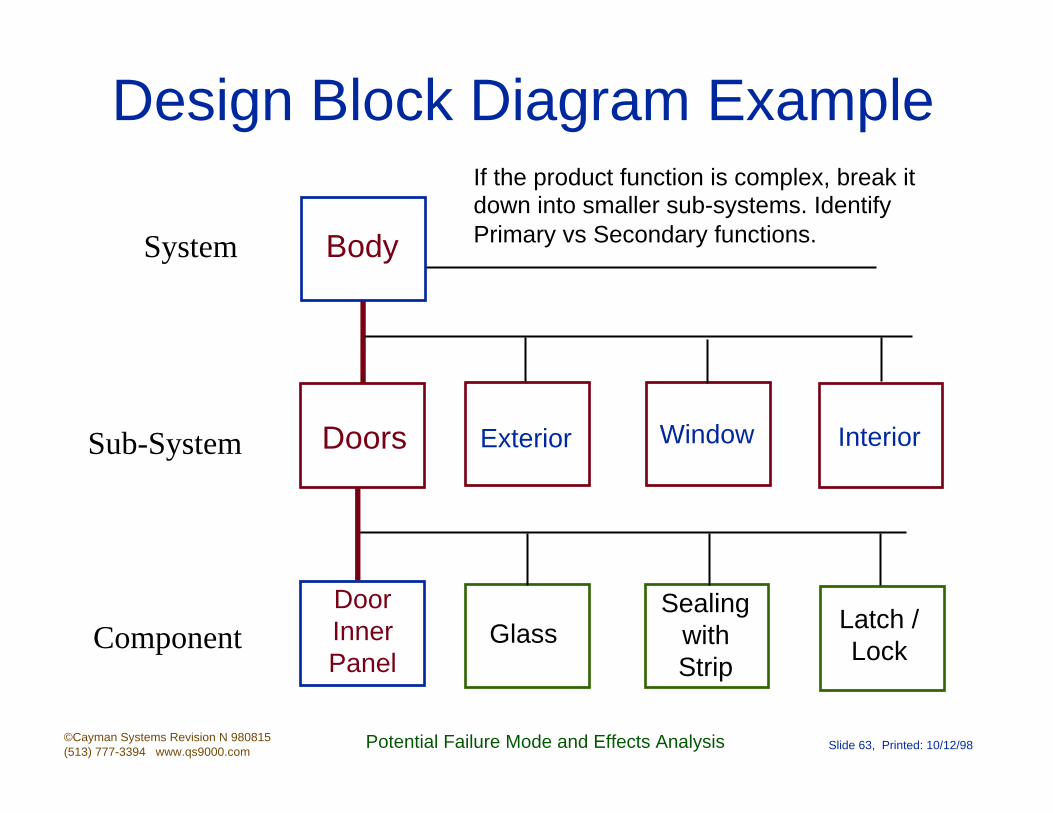
Design Block Diagram Example
System
Sub-System
Component
Body
Doors
Door Inner Panel
Sealing with Strip
Glass Latch / Lock
Exterior Window Interior
If the product function is complex, break it down into smaller sub-systems. Identify Primary vs Secondary functions.
©Cayman Systems Revision N 980815(513) 777-3394 www.qs9000.com
Potential Failure Mode and Effects Analysis Slide 64, Printed: 10/12/98
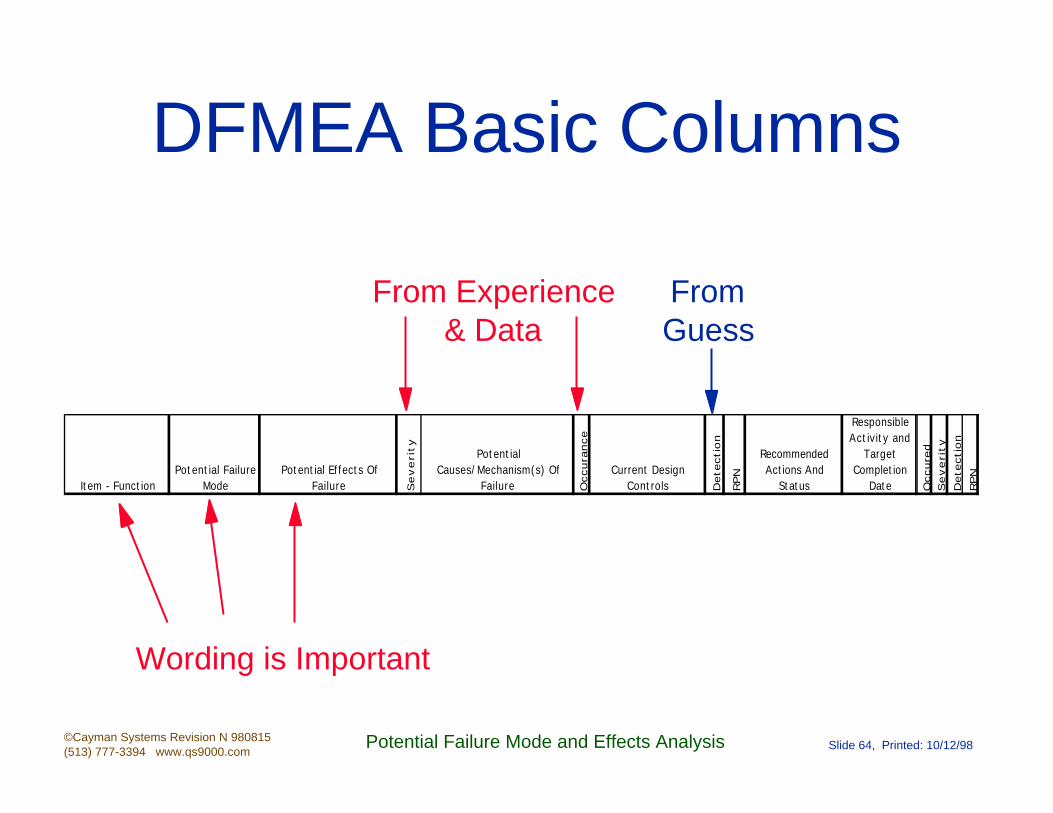
DFMEA Basic Columns
Wording is Important
From Guess
From Experience & Data
Item - FunctionPotential Failure
ModePotential Effects Of
Failure Severi
ty Potential Causes/Mechanism(s) Of
Failure Occura
nce
Current Design Controls D
ete
cti
on
RPN
Recommended Actions And
Status
Responsible Activity and
Target Completion
Date Occure
dS
everi
ty
Dete
cti
on
RPN

©Cayman Systems Revision N 980815(513) 777-3394 www.qs9000.com
Potential Failure Mode and Effects Analysis Slide 65, Printed: 10/12/98
Generic Design FMEA SeverityEffect Criteria: Severity of Effect Ranking
Hazardous Without Warning
Very high severity ranking when a potential failure mode affects safe vehilce operation and/or involves noncompliance with government regulation without warning.
10
Hazardous With
Warning
Very high severity ranking when a potential failure mode affects safe vehilce operation and/or involves noncompliance with government regulation with warning.
9
Very High Vehicle/item inoperable, with loss of primary function. 8
High Vehicle/item operable, but at a reduced level of performance. Customer dissatisfied.
7
Moderate Vehicle/item operable, but Comfort/Convenience item(s) inoperable. Customer experiences discomfort. 6
LowVehicle/item operable, but Comfort/Convenience item(s) operable at reduced level of performance. Customer experiences some dissatisfaction.
5
Very Low Fit & Finish/Squeak & Rattle item does not conform. Defect noticed by most customers. 4
Minor Fit & Finish/Squeak & Rattle item does not conform. Defect noticed by average customers. 3
Very Minor
Fit & Finish/Squeak & Rattle item does not conform. Defect noticed by discriminating customers.
2
None No effect. 1

©Cayman Systems Revision N 980815(513) 777-3394 www.qs9000.com
Potential Failure Mode and Effects Analysis Slide 66, Printed: 10/12/98
Generic DFMEA Occurrence
Probablity of Failure Possible Failure Rates RankingVery High: Failure is almost Inevitable ≥ 1 in 2 10
1 in 3 9High: Repeated Failures 1 in 8 8
1 in 20 7Moderate: Occasional Failures 1 in 80 6
1 in 400 51 in 2,000 4
Low: Relatively Few Failures 1 in 15,000 31 in 150,000 2
Remote: Failure Unlikely ≤ 1 in 1,500,000 1
©Cayman Systems Revision N 980815(513) 777-3394 www.qs9000.com
Potential Failure Mode and Effects Analysis Slide 67, Printed: 10/12/98
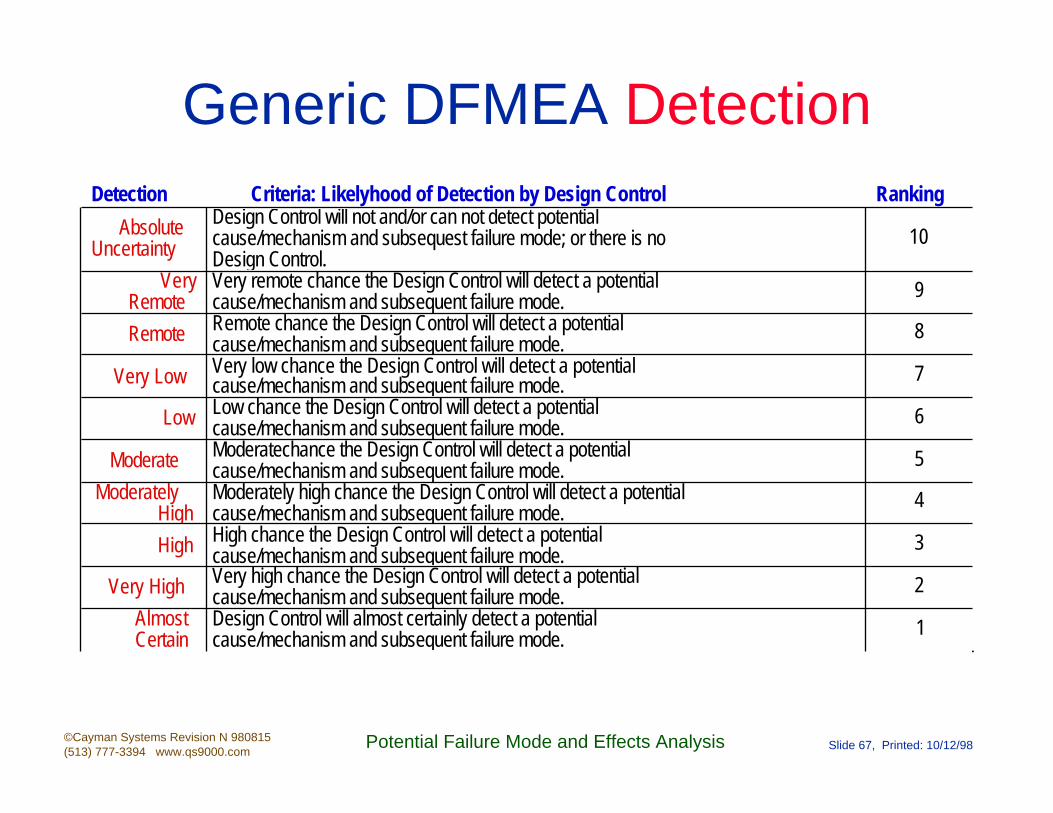
Generic DFMEA DetectionDetection Criteria: Likelyhood of Detection by Design Control Ranking
Absolute Uncertainty
Design Control will not and/or can not detect potential cause/mechanism and subsequest failure mode; or there is no Design Control.
10
Very Remote
Very remote chance the Design Control will detect a potential cause/mechanism and subsequent failure mode. 9
Remote Remote chance the Design Control will detect a potential cause/mechanism and subsequent failure mode.
8
Very Low Very low chance the Design Control will detect a potential cause/mechanism and subsequent failure mode. 7
Low Low chance the Design Control will detect a potential cause/mechanism and subsequent failure mode. 6
Moderate Moderatechance the Design Control will detect a potential cause/mechanism and subsequent failure mode. 5
Moderately High
Moderately high chance the Design Control will detect a potential cause/mechanism and subsequent failure mode.
4
High High chance the Design Control will detect a potential cause/mechanism and subsequent failure mode.
3
Very High Very high chance the Design Control will detect a potential cause/mechanism and subsequent failure mode. 2
Almost Certain
Design Control will almost certainly detect a potential cause/mechanism and subsequent failure mode. 1
©Cayman Systems Revision N 980815(513) 777-3394 www.qs9000.com
Potential Failure Mode and Effects Analysis Slide 68, Printed: 10/12/98
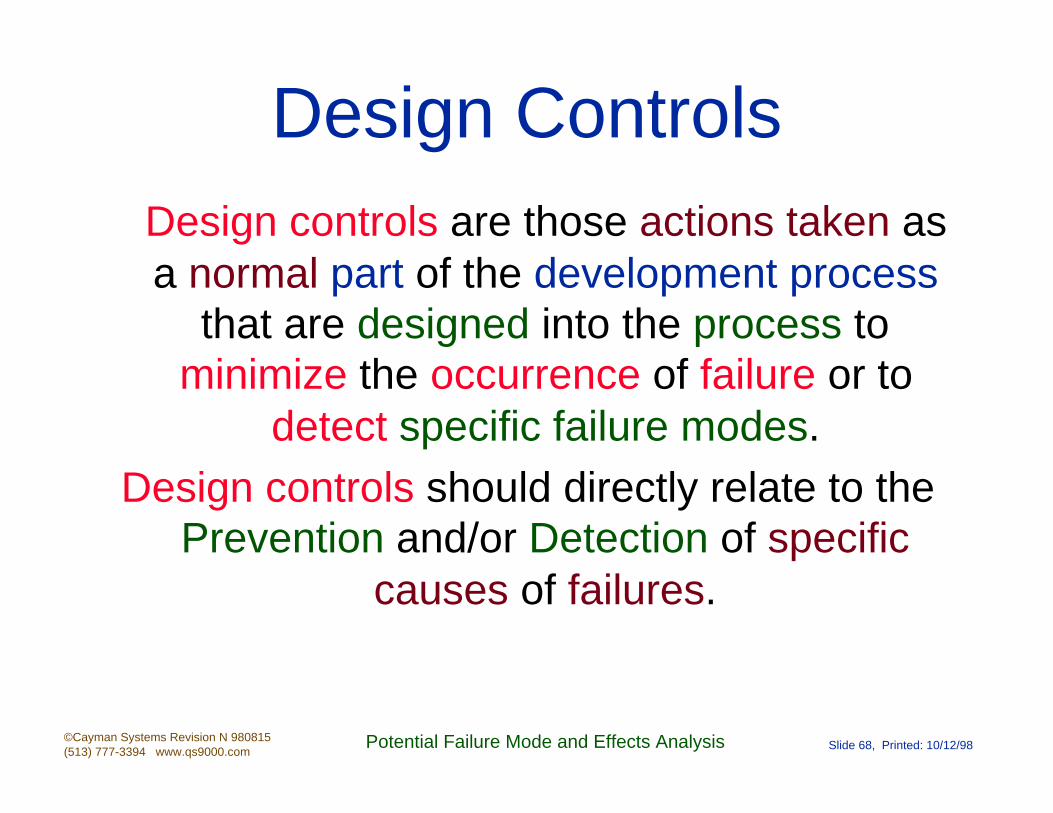
Design ControlsDesign controls are those actions taken as a normal part of the development process
that are designed into the process to minimize the occurrence of failure or to
detect specific failure modes.Design controls should directly relate to the
Prevention and/or Detection of specific causes of failures.
©Cayman Systems Revision N 980815(513) 777-3394 www.qs9000.com
Potential Failure Mode and Effects Analysis Slide 69, Printed: 10/12/98
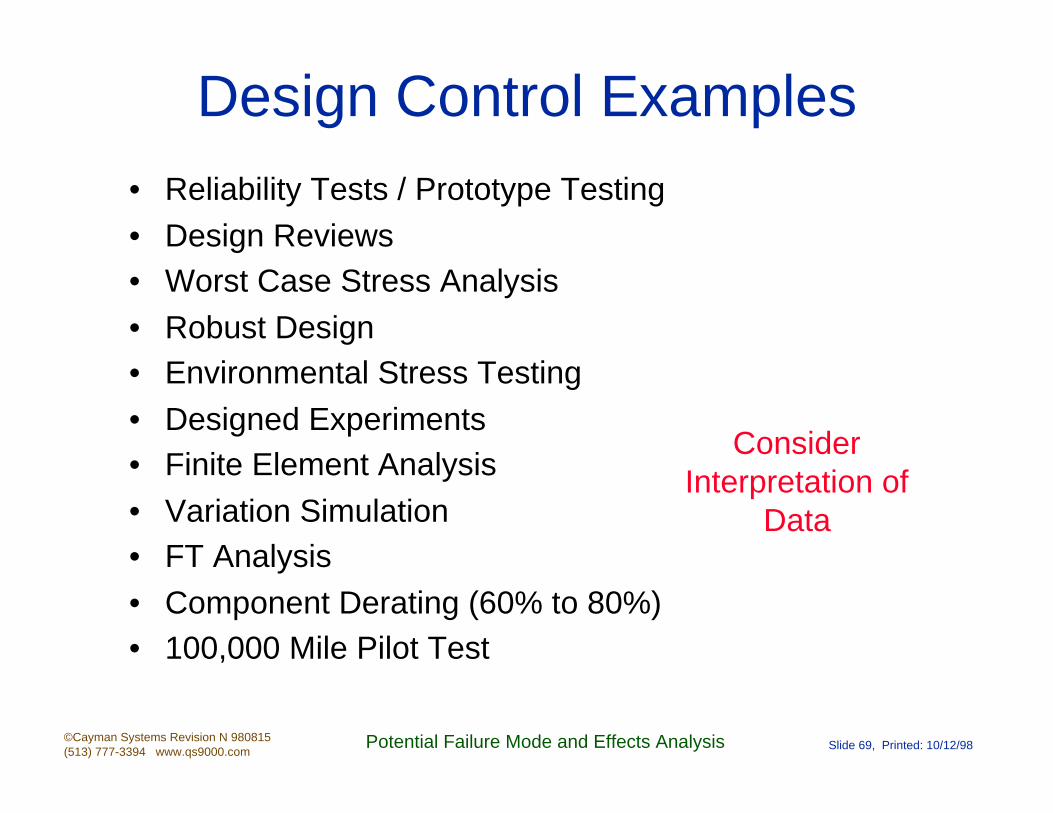
Design Control Examples• Reliability Tests / Prototype Testing
• Design Reviews• Worst Case Stress Analysis
• Robust Design• Environmental Stress Testing
• Designed Experiments• Finite Element Analysis
• Variation Simulation• FT Analysis
• Component Derating (60% to 80%)• 100,000 Mile Pilot Test
Consider Interpretation of
Data

©Cayman Systems Revision N 980815(513) 777-3394 www.qs9000.com
Potential Failure Mode and Effects Analysis Slide 70, Printed: 10/12/98
Recommended Actions• When the failure modes have been ranked by their RPN,
corrective actions should be first directed at the highest ranked concerns and critical items identified.
• The intent of any recommended action is to reduce one or more (or all) of the occurrence, severity and/or detection rankings.
• Only a design revision can bring about a reduction in the severity ranking. If no actions are recommended for a specific cause, this should be indicated.
• A reduction in the occurrence ranking can only be effected by removing or controlling one or more of the causes of the failure mode through a design revision.
• An increase in design verification actions will result in a reduction in the detection ranking ONLY.
• Design FMEA doesn’t rely on process controls to overcome potential weaknesses in the design; however, it does take technical and physical limitations of a process into consideration (Design Rules)
©Cayman Systems Revision N 980815(513) 777-3394 www.qs9000.com
Potential Failure Mode and Effects Analysis Slide 71, Printed: 10/12/98
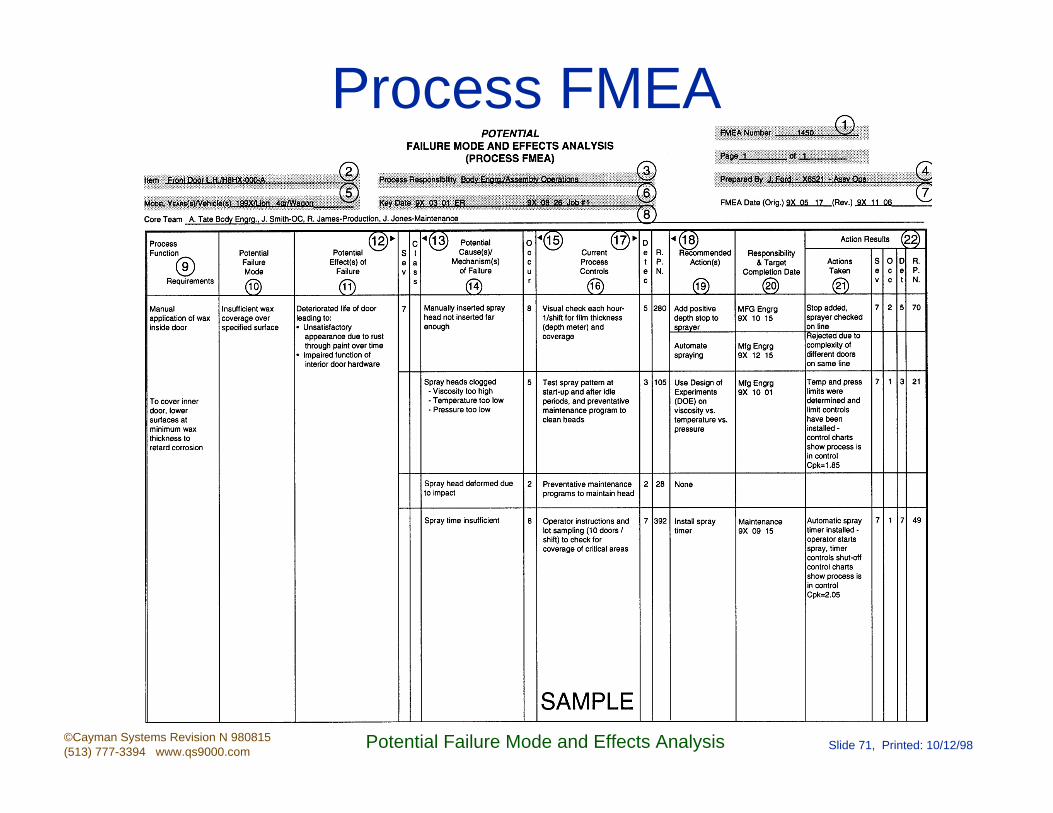
Process FMEA

©Cayman Systems Revision N 980815(513) 777-3394 www.qs9000.com
Potential Failure Mode and Effects Analysis Slide 72, Printed: 10/12/98
The Process FMEAIdentifies
Critical and Significant Characteristicsand is therefore the
Starting Pointfor the
Control Plan
Sample Sizes
Evaluation Frequency
Method of Evaluation
Out-of-Control Action Plan
(OCAP)

©Cayman Systems Revision N 980815(513) 777-3394 www.qs9000.com
Potential Failure Mode and Effects Analysis Slide 73, Printed: 10/12/98
Use a Process Flow Chart!Because:
• You want to understand your current process
• You are looking for opportunities to improve• You want to illustrate a potential solution
• You have improved a process and want to document the new process
Let’s Try A Process Flow Chart
©Cayman Systems Revision N 980815(513) 777-3394 www.qs9000.com
Potential Failure Mode and Effects Analysis Slide 74, Printed: 10/12/98
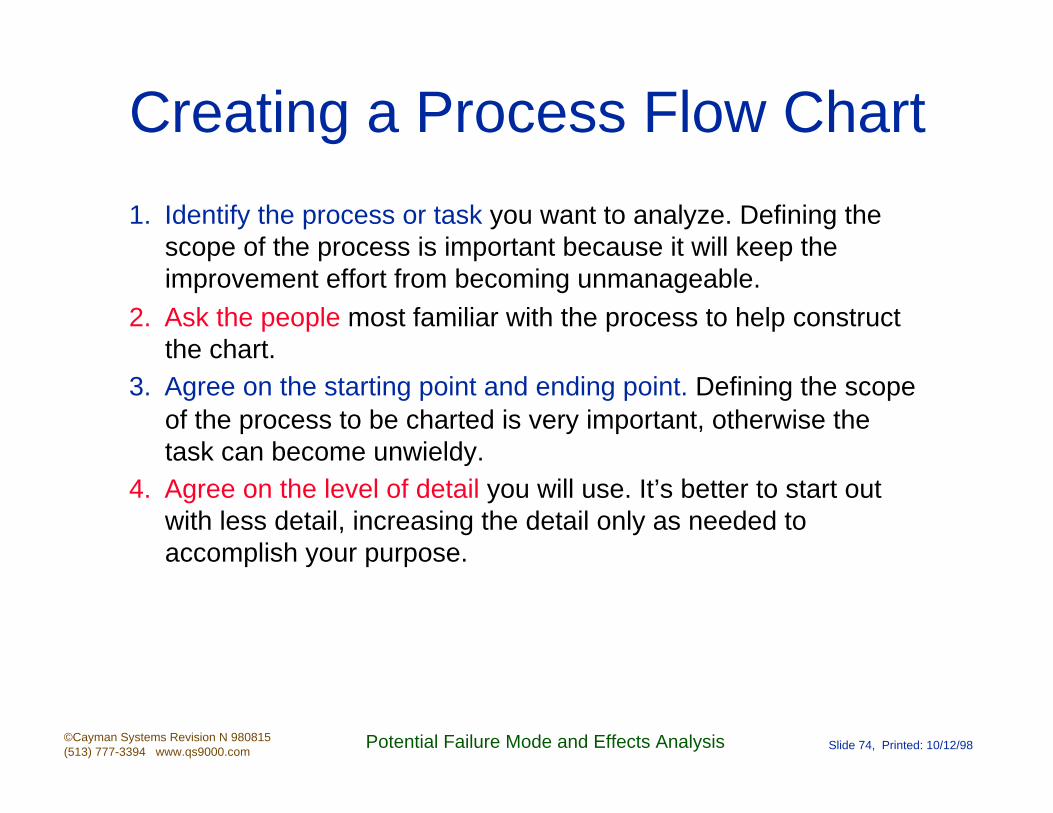
Creating a Process Flow Chart
1. Identify the process or task you want to analyze. Defining the scope of the process is important because it will keep the improvement effort from becoming unmanageable.
2. Ask the people most familiar with the process to help construct the chart.
3. Agree on the starting point and ending point. Defining the scope of the process to be charted is very important, otherwise the task can become unwieldy.
4. Agree on the level of detail you will use. It’s better to start out with less detail, increasing the detail only as needed to accomplish your purpose.
©Cayman Systems Revision N 980815(513) 777-3394 www.qs9000.com
Potential Failure Mode and Effects Analysis Slide 75, Printed: 10/12/98
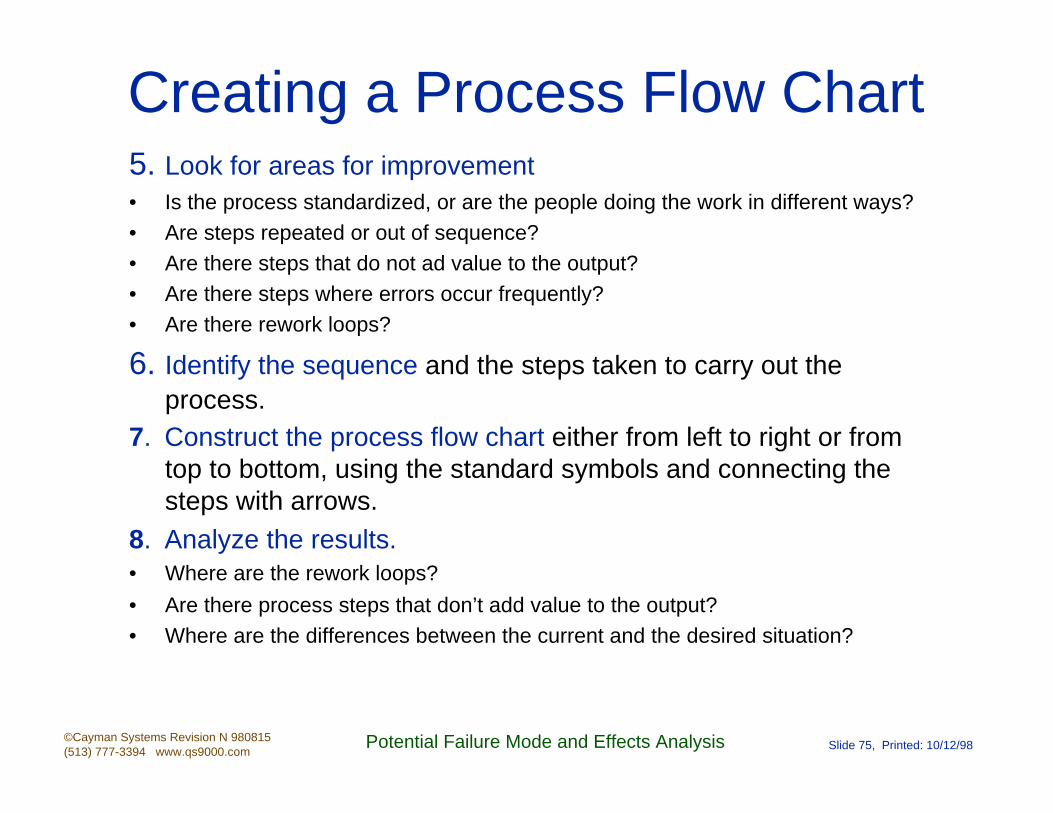
Creating a Process Flow Chart5. Look for areas for improvement• Is the process standardized, or are the people doing the work in different ways?• Are steps repeated or out of sequence?• Are there steps that do not ad value to the output?• Are there steps where errors occur frequently?• Are there rework loops?
6. Identify the sequence and the steps taken to carry out the process.
7. Construct the process flow chart either from left to right or from top to bottom, using the standard symbols and connecting the steps with arrows.
8. Analyze the results.• Where are the rework loops?
• Are there process steps that don’t add value to the output?• Where are the differences between the current and the desired situation?

©Cayman Systems Revision N 980815(513) 777-3394 www.qs9000.com
Potential Failure Mode and Effects Analysis Slide 76, Printed: 10/12/98
Early Process Flow Diagram
• Inspection Points
• Inspection Frequency
• Instrument
• Measurement Scale
• Sample Preparation
• Inspection/Test Method
• Inspector
• Method of Analysis

©Cayman Systems Revision N 980815(513) 777-3394 www.qs9000.com
Potential Failure Mode and Effects Analysis Slide 77, Printed: 10/12/98
GM Example Process Flow Chart
Process Flow Diagram Approved By:
Part Number: Date: 4/5/93 QA ManagerPart Description: Rev. : C Operations Manager
Prepared By: Senior AdvisorQA Engineer
Step Fabri
cati
on
Mov
e
Sto
re
Insp
ect
Operation Description Item # Key Product Characteristic Item # Key Control Characteristic
1 Move "OK" Vinyl Material 1.0 Material Specs 1.0 Material Certification TagFrom Storage Area andLoad Into Press.
2 Auto Injection Mold Cover 2.0 Tearstrip In Cover 2.1 Tool SetupIn Tool # 2.2 Machine Setup
3.0 Hole Diameter In Cover 2.1 Tool Setup2.2 Machine Setup
4.0 Flange Thickness In Cover 2.1 Tool Setup2.2 Machine Setup
5.0 Pressure Control Protrusions 2.1 Tool SetupHeight 2.2 Machine Setup
3 Visually Inspect Cover 6.0 Pressure Control Protrusions 2.1 Tool SetupFilled Out 2.2 Machine Setup

©Cayman Systems Revision N 980815(513) 777-3394 www.qs9000.com
Potential Failure Mode and Effects Analysis Slide 78, Printed: 10/12/98
Basic Flow Chart ExampleStart
Manufactured Parts Purchased PartsReceive Raw Materials
Inspect Inspect
Receive Parts
Move to Production
Move to Production
Process Material
Disposition
Start
Inspect
Bad
Bad
BadBad Bad
©Cayman Systems Revision N 980815(513) 777-3394 www.qs9000.com
Potential Failure Mode and Effects Analysis Slide 79, Printed: 10/12/98
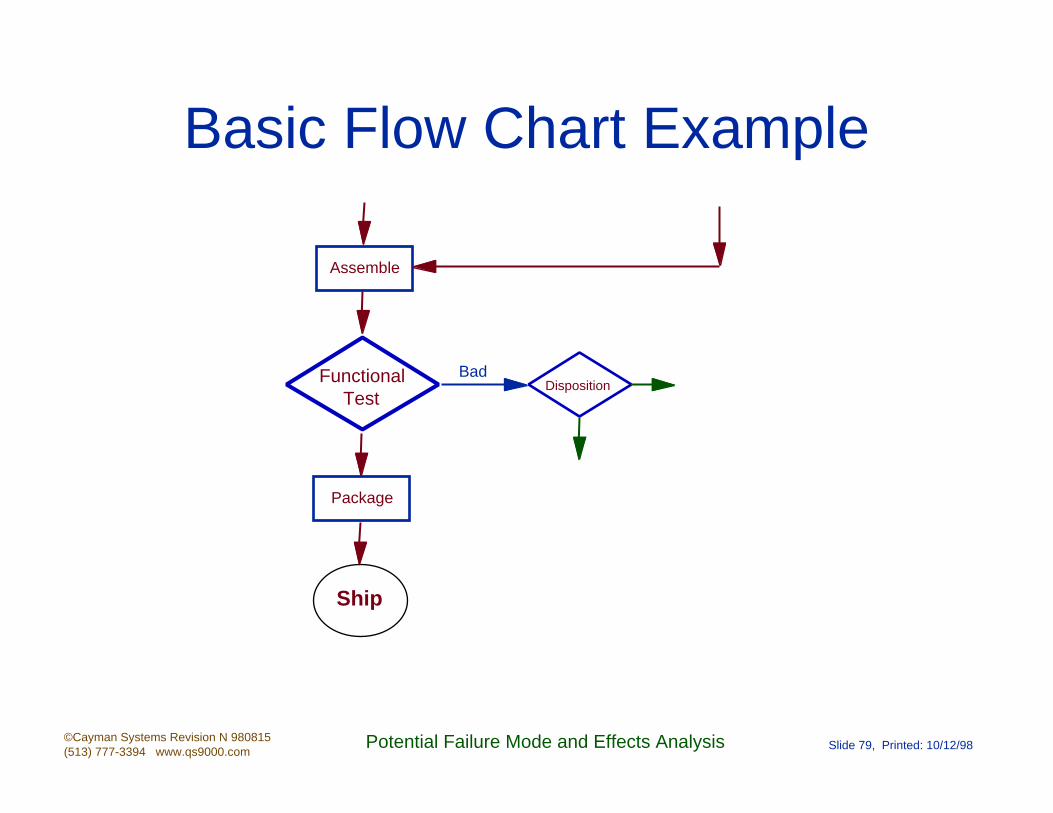
Basic Flow Chart Example
Assemble
Functional Test
Package
Ship
DispositionBad
©Cayman Systems Revision N 980815(513) 777-3394 www.qs9000.com
Potential Failure Mode and Effects Analysis Slide 80, Printed: 10/12/98
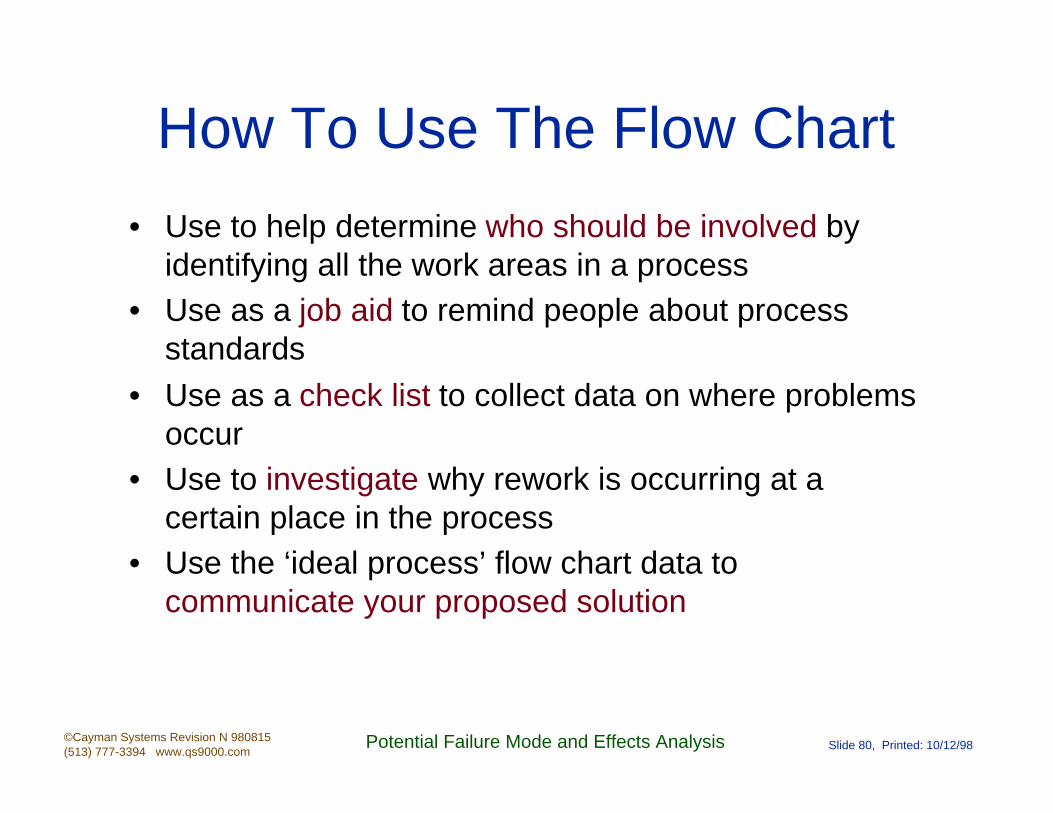
How To Use The Flow Chart
• Use to help determine who should be involved by identifying all the work areas in a process
• Use as a job aid to remind people about process standards
• Use as a check list to collect data on where problems occur
• Use to investigate why rework is occurring at a certain place in the process
• Use the ‘ideal process’ flow chart data to communicate your proposed solution

©Cayman Systems Revision N 980815(513) 777-3394 www.qs9000.com
Potential Failure Mode and Effects Analysis Slide 81, Printed: 10/12/98
Flow Chart Tips
• If a process step or box has two output arrows, consider whether a decision box is needed
• Remember that the people closest to the work know it best. Make sure people are involved in developing the flow chart
• Software packages make flow chart production easy.
©Cayman Systems Revision N 980815(513) 777-3394 www.qs9000.com
Potential Failure Mode and Effects Analysis Slide 82, Printed: 10/12/98
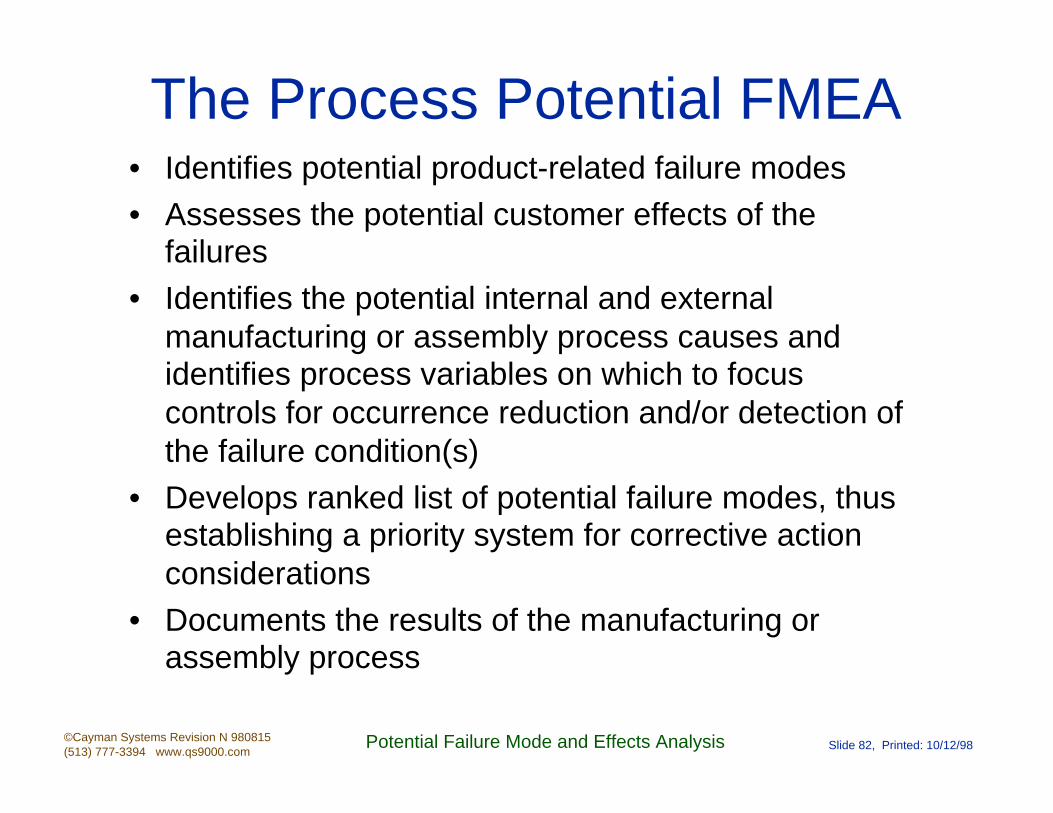
The Process Potential FMEA• Identifies potential product-related failure modes
• Assesses the potential customer effects of the failures
• Identifies the potential internal and external manufacturing or assembly process causes and identifies process variables on which to focus controls for occurrence reduction and/or detection of the failure condition(s)
• Develops ranked list of potential failure modes, thus establishing a priority system for corrective action considerations
• Documents the results of the manufacturing or assembly process
©Cayman Systems Revision N 980815(513) 777-3394 www.qs9000.com
Potential Failure Mode and Effects Analysis Slide 83, Printed: 10/12/98
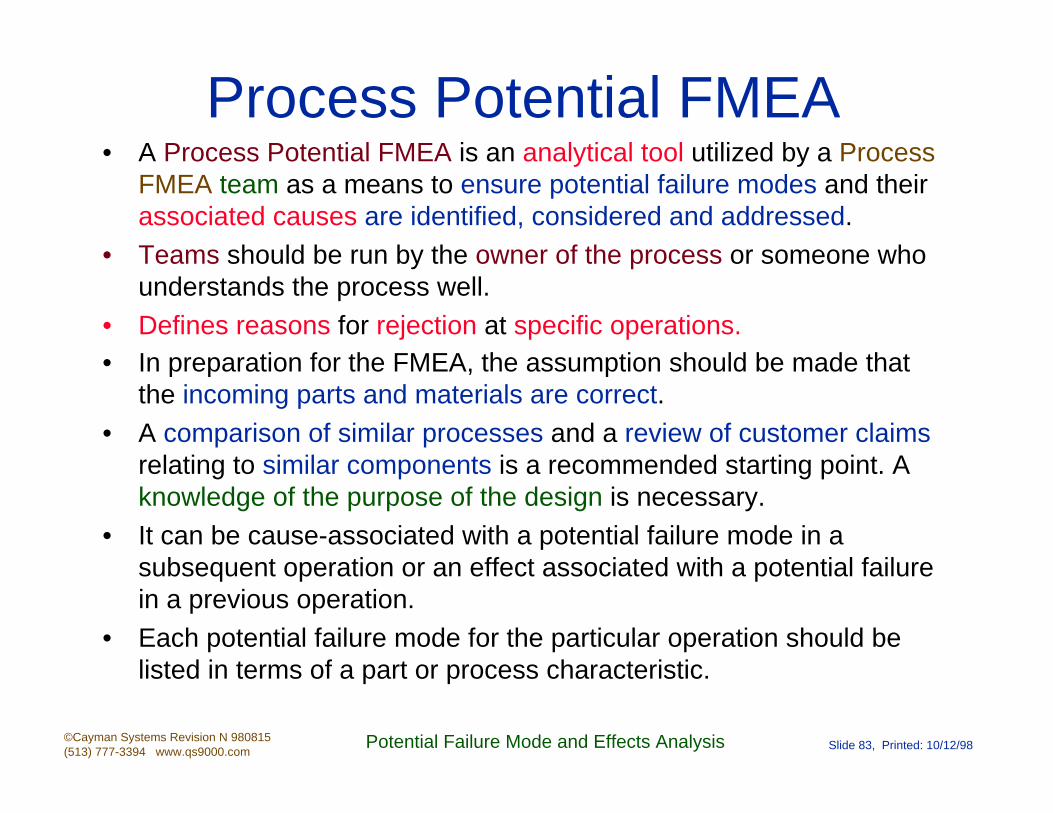
Process Potential FMEA• A Process Potential FMEA is an analytical tool utilized by a Process
FMEA team as a means to ensure potential failure modes and their associated causes are identified, considered and addressed.
• Teams should be run by the owner of the process or someone who understands the process well.
• Defines reasons for rejection at specific operations.• In preparation for the FMEA, the assumption should be made that
the incoming parts and materials are correct.
• A comparison of similar processes and a review of customer claims relating to similar components is a recommended starting point. A knowledge of the purpose of the design is necessary.
• It can be cause-associated with a potential failure mode in a subsequent operation or an effect associated with a potential failure in a previous operation.
• Each potential failure mode for the particular operation should be listed in terms of a part or process characteristic.

©Cayman Systems Revision N 980815(513) 777-3394 www.qs9000.com
Potential Failure Mode and Effects Analysis Slide 84, Printed: 10/12/98
FMEA White Space Issues
ShipFinal PackReceiving MOD 2 AssemblyMOD 1
Ctrl Plan & FMEA
Ctrl Plan & FMEA
Ctrl Plan & FMEA
WarehouseCustomer
Control Plan & FMEA
Responsibility=
MODResponsibility
=Materials?
SQA?
Responsibility=
MOD
Responsibility=
ASSY
White Space Issue
Control Plan & FMEA

©Cayman Systems Revision N 980815(513) 777-3394 www.qs9000.com
Potential Failure Mode and Effects Analysis Slide 85, Printed: 10/12/98
Process FMEA Foci
Customers include:• End User• Next Manufacturing or Process Step• Process Engineers
• Assembly Engineers• Repair Functions
• Test Engineers• Product Analysis• Dealership or other Sales Outlet
©Cayman Systems Revision N 980815(513) 777-3394 www.qs9000.com
Potential Failure Mode and Effects Analysis Slide 86, Printed: 10/12/98
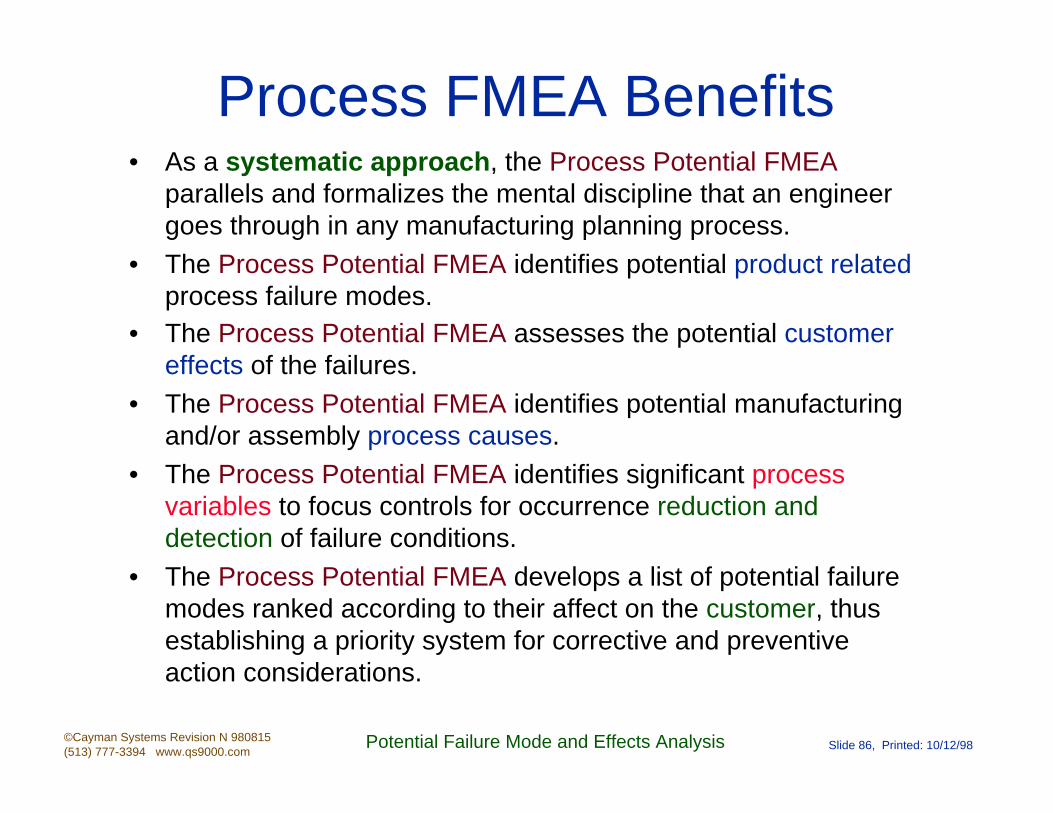
Process FMEA Benefits• As a systematic approach, the Process Potential FMEA
parallels and formalizes the mental discipline that an engineer goes through in any manufacturing planning process.
• The Process Potential FMEA identifies potential product related process failure modes.
• The Process Potential FMEA assesses the potential customer effects of the failures.
• The Process Potential FMEA identifies potential manufacturing and/or assembly process causes.
• The Process Potential FMEA identifies significant process variables to focus controls for occurrence reduction and detection of failure conditions.
• The Process Potential FMEA develops a list of potential failure modes ranked according to their affect on the customer, thus establishing a priority system for corrective and preventive action considerations.

©Cayman Systems Revision N 980815(513) 777-3394 www.qs9000.com
Potential Failure Mode and Effects Analysis Slide 87, Printed: 10/12/98
More Process FMEA Considerations
• The Process FMEA is a living document.
• The Process FMEA should be continually updated as changes occur throughout all phases of product development and on into and through to the end of production.
• The Process FMEA should begin with a flow chart of the processes - from receiving through shipping and warehousing.
• The Potential Failure Modes/Causes which can occur during manufacturing or assembly process are covered by the Process FMEA but some information (severity rankings, identification of some effects) may come from the Design FMEA.
A reduction in occurrence ranking can only be achieved by implementing a process change that controls or eliminates
one or more causes of the failure mode.
©Cayman Systems Revision N 980815(513) 777-3394 www.qs9000.com
Potential Failure Mode and Effects Analysis Slide 88, Printed: 10/12/98
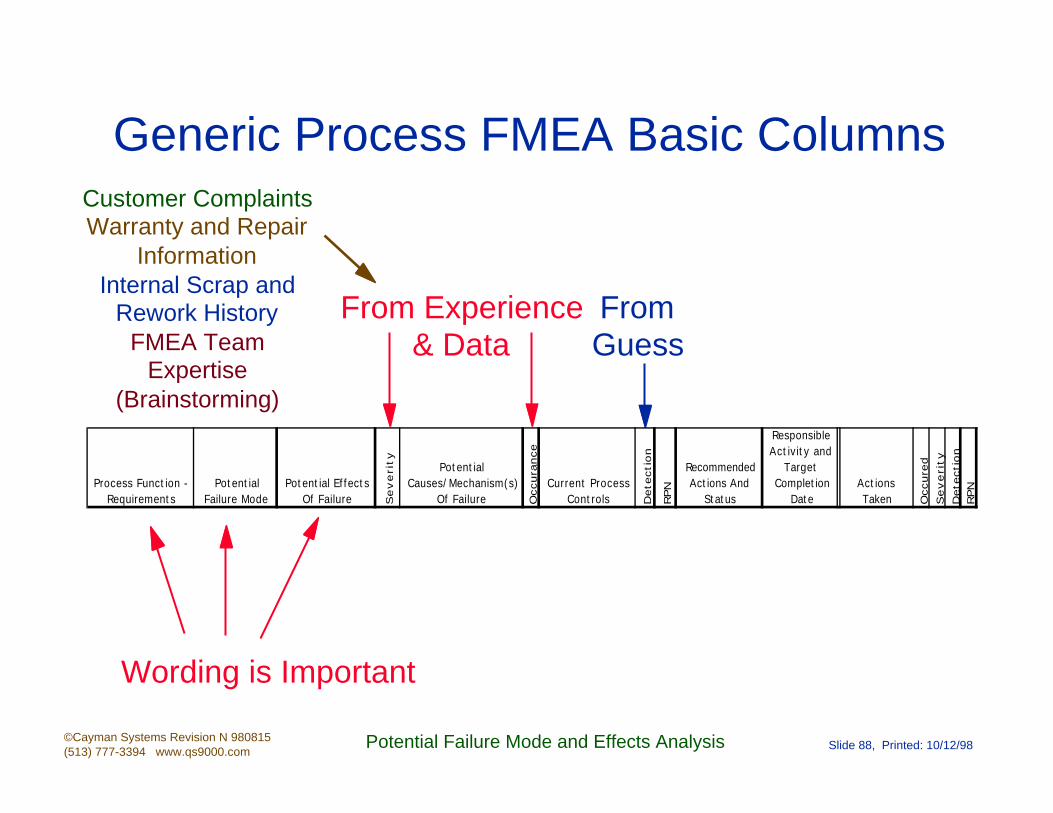
Generic Process FMEA Basic Columns
Wording is Important
From Guess
From Experience & Data
Process Function - Requirements
Potential Failure Mode
Potential Effects Of Failure S
everi
ty Potential Causes/Mechanism(s)
Of Failure Occura
nce
Current Process Controls D
ete
cti
on
RPN
Recommended Actions And
Status
Responsible Activity and
Target Completion
DateActions Taken O
ccure
d
Severi
ty
Dete
cti
on
RPN
Customer ComplaintsWarranty and Repair
InformationInternal Scrap and
Rework HistoryFMEA Team
Expertise (Brainstorming)

©Cayman Systems Revision N 980815(513) 777-3394 www.qs9000.com
Potential Failure Mode and Effects Analysis Slide 89, Printed: 10/12/98
Generic PFMEA SeverityEffect Criteria: Severity of Effect Ranking
Hazardous Without Warning
May endanger machine or assembly operator. Very high severity ranking when a potential failure mode affects safe vehicle operation and/or involves noncompliance with government regulation. Failure will occur without warning.
10
Hazardous With
Warning
May endanger machine or assembly operator. Very high severity ranking when a potential failure mode affects safe vehicle operation and/or involves noncompliance with government regulation. Failure will occur with warning.
9
Very HighMajor disruption to production line. 100% of product may have to be scrapped. Vehicle/item inoperable, loss of primary function. Customer very dissatisfied.
8
HighMinor disruption to production line. Product may have to be sorted and a portion (less than 100%) scrapped. Vehicle/item operable, but at a reduced level of performance. Customer dissatisfied.
7
Moderate
Minor disruption to production line. A portion (less than 100%) of the product may have to be scrapped (no sorting). Vehicle/item operable, but some mComfort/Convenience item(s) inoperable. Customers experiences discomfort.
6
Low
Minor disruption to production line. 100% of product may have to be reworked. Vehicle/item operable, but some Comfort/Convenience item(s) operable at reduced level of performance. Customer experiences some dissatifaction.
5
Very Low
Minor disruption to production line. The product may have to be sorted and a portion (less than 100%) reworked. Fit & Finish/Squeak & Rattle item does not conform. Defect noticed by most customers.
4
Minor
Minor disruption to production line. The product may have to be sorted and a portion (less than 100%) reworked on-line but out-of-station. Fit & Finish/Squeak & Rattle item does not conform. Defect noticed by average customers.
3
Very Minor
Minor disruption to production line. The product may have to be sorted and a portion (less than 100%) reworked on-line but in-station. Fit & Finish/Squeak & Rattle item does not conform. Defect noticed by adiscriminating customers.
2
None No effect. 1
©Cayman Systems Revision N 980815(513) 777-3394 www.qs9000.com
Potential Failure Mode and Effects Analysis Slide 90, Printed: 10/12/98
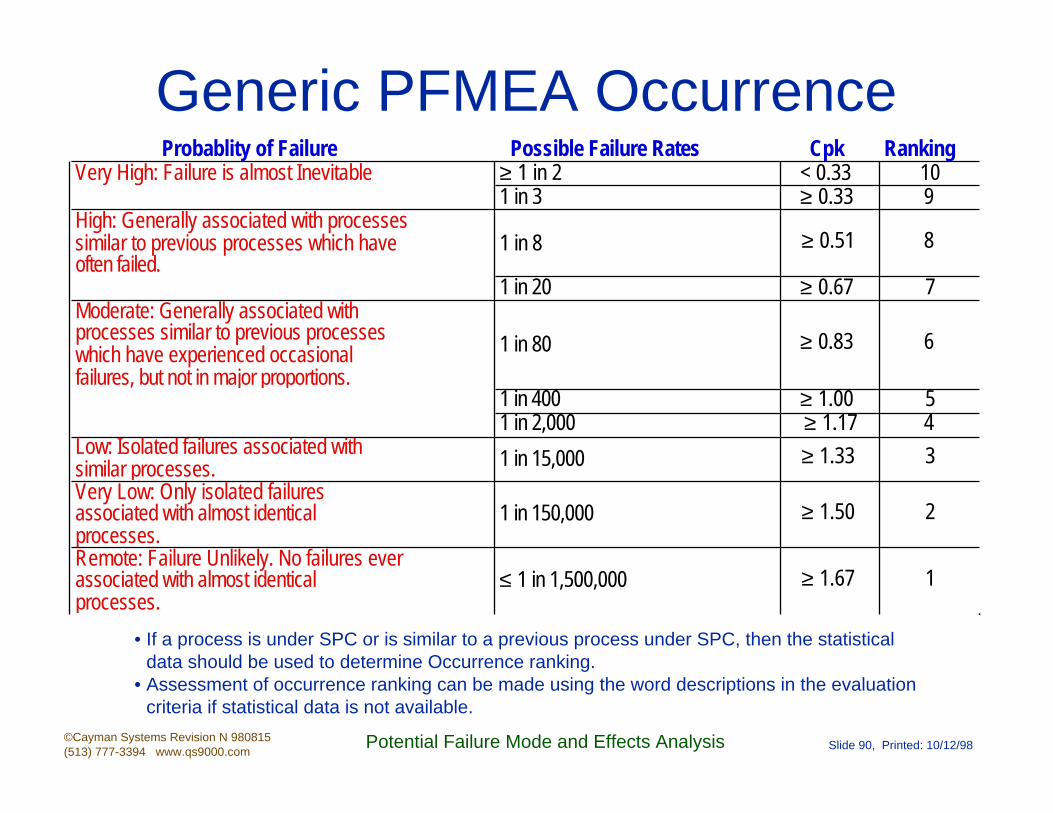
Generic PFMEA OccurrenceProbablity of Failure Possible Failure Rates Cpk Ranking
Very High: Failure is almost Inevitable ≥ 1 in 2 < 0.33 101 in 3 ≥ 0.33 9
High: Generally associated with processes similar to previous processes which have often failed.
1 in 8 ≥ 0.51 8
1 in 20 ≥ 0.67 7Moderate: Generally associated with processes similar to previous processes which have experienced occasional failures, but not in major proportions.
1 in 80 ≥ 0.83 6
1 in 400 ≥ 1.00 51 in 2,000 ≥ 1.17 4
Low: Isolated failures associated with similar processes. 1 in 15,000 ≥ 1.33 3
Very Low: Only isolated failures associated with almost identical processes.
1 in 150,000 ≥ 1.50 2
Remote: Failure Unlikely. No failures ever associated with almost identical processes.
≤ 1 in 1,500,000 ≥ 1.67 1
• If a process is under SPC or is similar to a previous process under SPC, then the statistical data should be used to determine Occurrence ranking.
• Assessment of occurrence ranking can be made using the word descriptions in the evaluation criteria if statistical data is not available.
©Cayman Systems Revision N 980815(513) 777-3394 www.qs9000.com
Potential Failure Mode and Effects Analysis Slide 91, Printed: 10/12/98
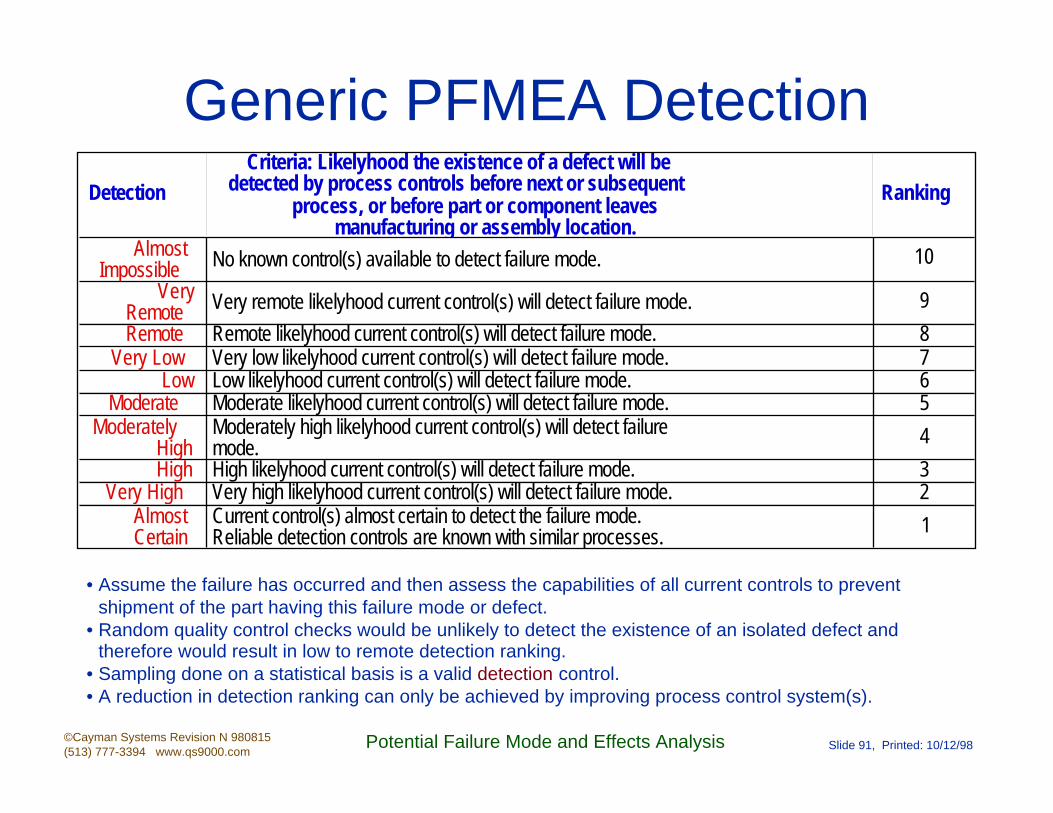
Generic PFMEA DetectionDetection
Criteria: Likelyhood the existence of a defect will be detected by process controls before next or subsequent
process, or before part or component leaves manufacturing or assembly location.
Ranking
Almost Impossible No known control(s) available to detect failure mode. 10
Very Remote Very remote likelyhood current control(s) will detect failure mode. 9
Remote Remote likelyhood current control(s) will detect failure mode. 8Very Low Very low likelyhood current control(s) will detect failure mode. 7
Low Low likelyhood current control(s) will detect failure mode. 6Moderate Moderate likelyhood current control(s) will detect failure mode. 5
Moderately High
Moderately high likelyhood current control(s) will detect failure mode. 4
High High likelyhood current control(s) will detect failure mode. 3Very High Very high likelyhood current control(s) will detect failure mode. 2
Almost Certain
Current control(s) almost certain to detect the failure mode. Reliable detection controls are known with similar processes. 1
• Assume the failure has occurred and then assess the capabilities of all current controls to prevent shipment of the part having this failure mode or defect.
• Random quality control checks would be unlikely to detect the existence of an isolated defect and therefore would result in low to remote detection ranking.
• Sampling done on a statistical basis is a valid detection control.• A reduction in detection ranking can only be achieved by improving process control system(s).
©Cayman Systems Revision N 980815(513) 777-3394 www.qs9000.com
Potential Failure Mode and Effects Analysis Slide 92, Printed: 10/12/98
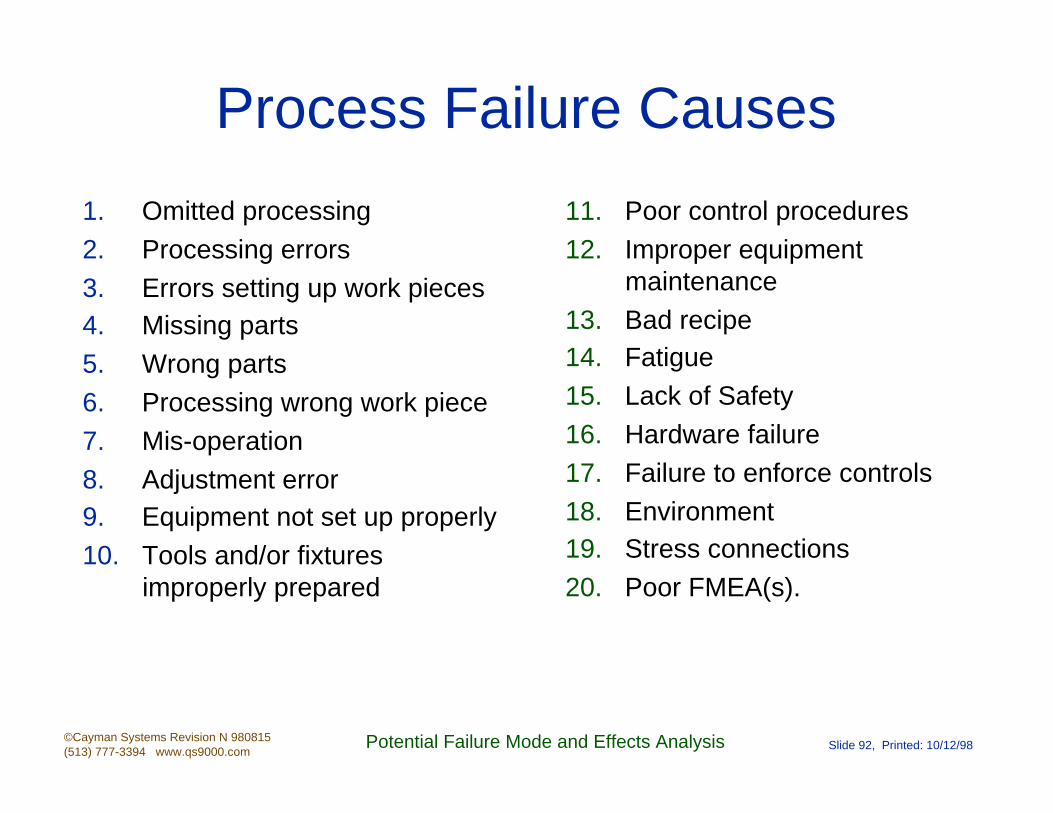
Process Failure Causes
1. Omitted processing
2. Processing errors
3. Errors setting up work pieces4. Missing parts
5. Wrong parts
6. Processing wrong work piece
7. Mis-operation
8. Adjustment error9. Equipment not set up properly
10. Tools and/or fixtures improperly prepared
11. Poor control procedures
12. Improper equipment maintenance
13. Bad recipe14. Fatigue
15. Lack of Safety
16. Hardware failure
17. Failure to enforce controls
18. Environment19. Stress connections
20. Poor FMEA(s).
©Cayman Systems Revision N 980815(513) 777-3394 www.qs9000.com
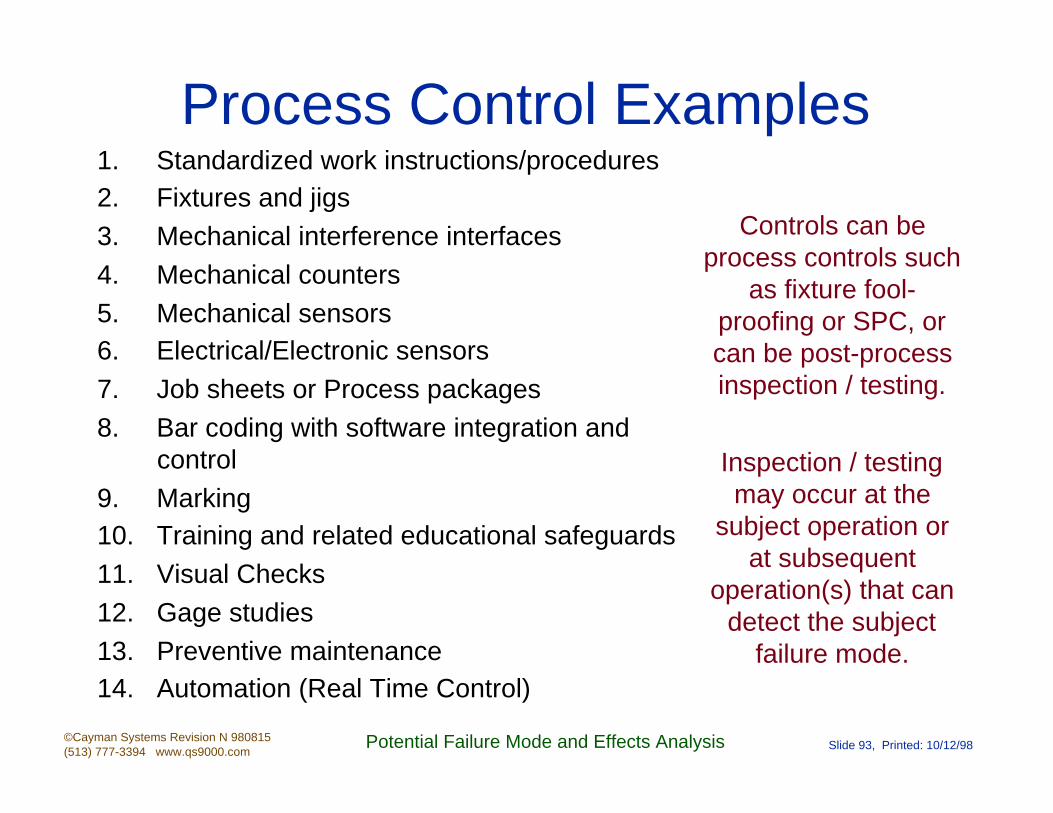
Potential Failure Mode and Effects Analysis Slide 93, Printed: 10/12/98
Process Control Examples1. Standardized work instructions/procedures2. Fixtures and jigs
3. Mechanical interference interfaces
4. Mechanical counters
5. Mechanical sensors6. Electrical/Electronic sensors
7. Job sheets or Process packages
8. Bar coding with software integration and control
9. Marking10. Training and related educational safeguards
11. Visual Checks
12. Gage studies
13. Preventive maintenance14. Automation (Real Time Control)
Controls can be process controls such
as fixture fool-proofing or SPC, or can be post-process inspection / testing.
Inspection / testing may occur at the
subject operation or at subsequent
operation(s) that can detect the subject
failure mode.

©Cayman Systems Revision N 980815(513) 777-3394 www.qs9000.com
Potential Failure Mode and Effects Analysis Slide 94, Printed: 10/12/98
Typical Process Documents
• SPC records• Visual aides• Work instructions• Inspection instructions/records• Equipment operating instructions• Training records• Traceability records

©Cayman Systems Revision N 980815(513) 777-3394 www.qs9000.com
Potential Failure Mode and Effects Analysis Slide 95, Printed: 10/12/98
Recommended Actions• Corrective Action should be first directed at the highest
concerns as rank ordered by RPN.
• The intent of any recommended action is to reduce the occurrence, severity and/or detection rankings.
• If no actions are recommended for a specific cause, then this should be indicated.
• Only a design revision can bring about a reduction in the severity ranking.
• To reduce the probability of occurrence, process and/or specification revisions are required.
• To increase the probability of detection, process control and/or inspection changes are required. Improving detection controls is typically costly. The emphasis should be placed on preventing, rather than detecting, defects.

©Cayman Systems Revision N 980815(513) 777-3394 www.qs9000.com
Potential Failure Mode and Effects Analysis Slide 96, Printed: 10/12/98
The Role and Function of FTA• Fault-tree
analysis is a deductive process especially useful for analyzing failures, when the causes of failures have not been identified
• Reliability engineering tool
Motor Failure

©Cayman Systems Revision N 980815(513) 777-3394 www.qs9000.com
Potential Failure Mode and Effects Analysis Slide 97, Printed: 10/12/98
FMEA vs FTA
FMEA FTAInductive Logic (bottom up) Deductive (top down)
Determines all possible ways equipment can fail. Determines the
effect of such failures on the system.
Assumes a system failure and determines the possible causes
Focus is on the parts of which the system is comprised. Focus is on the total system
©Cayman Systems Revision N 980815(513) 777-3394 www.qs9000.com
Potential Failure Mode and Effects Analysis Slide 98, Printed: 10/12/98
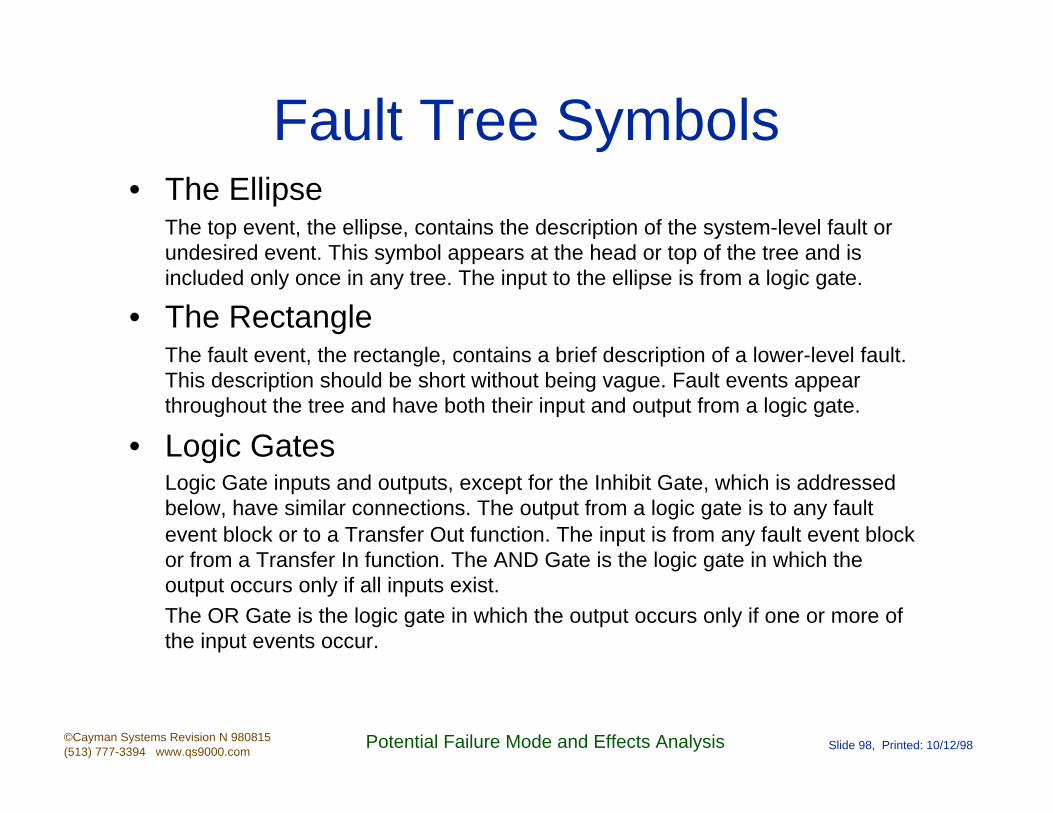
Fault Tree Symbols• The Ellipse
The top event, the ellipse, contains the description of the system-level fault or undesired event. This symbol appears at the head or top of the tree and is included only once in any tree. The input to the ellipse is from a logic gate.
• The RectangleThe fault event, the rectangle, contains a brief description of a lower-level fault. This description should be short without being vague. Fault events appear throughout the tree and have both their input and output from a logic gate.
• Logic GatesLogic Gate inputs and outputs, except for the Inhibit Gate, which is addressed below, have similar connections. The output from a logic gate is to any fault event block or to a Transfer Out function. The input is from any fault event block or from a Transfer In function. The AND Gate is the logic gate in which the output occurs only if all inputs exist.The OR Gate is the logic gate in which the output occurs only if one or more of the input events occur.
©Cayman Systems Revision N 980815(513) 777-3394 www.qs9000.com
Potential Failure Mode and Effects Analysis Slide 99, Printed: 10/12/98
Fault Tree Fundamentals1. Defining the Undesired Event(s) (Major Fault(s))
a. The undesired event is most often the fault which, upon occurrence, results in complete failure of the system, the failure of a back-up system, degradation, or an undetected failure. This is considered catastrophic failure. The major fault is a failure which causes loss of availability through the degradation or system shut-down and/or poses a safety hazard to operators and/or maintenance personnel. The undesired event, however, may be an unusual failure at a sub-system level, the root cause of which is unknown. Any observable event may be chosen as the “undesired event”. The analyst must recognize that the FTA will not identify failures unrelated to the chosen event.b. To define the undesired event, the normal system operation and environment must be known in order to allow the analysis to show the undesired event as a failure. When defining the undesired event, care must be taken to prevent the range of the faults from becoming too broad. For example, “Failure to complete trip”, for an automobile, is not specific enough to allow for ease of analysis. This is because failure could vary from an air conditioning fault, which caused discomfort, to loss of engine power, which caused loss of mobility. Both faults could be considered failure; however, loss of mobility is obviously a much more severe fault than losing air conditioning.

©Cayman Systems Revision N 980815(513) 777-3394 www.qs9000.com
Potential Failure Mode and Effects Analysis Slide 100, Printed: 10/12/98
Fault Tree Fundamentals (Continued 1)
2. Defining Types of FaultsFaults fall into two basic categories: operational and component.
Operation Fault
The operational fault is one which occurs when a component is operating as it was designed to, but at an inappropriate time or place. An example is a failure of a control valve to close or to interrupt the introduction of a reactant into a chemical process due to an inappropriate signal from another device.
Component FaultThe component fault can be further divided into two sub-categories: primary and secondary. A Primary component fault occurs when a component fails to function in its intended environment. Example: A radar unit designed for use in aircraft which fails due to vibration. A Secondary component failure occurs when a component fails to function in an environment other than the environment for which it is intended. Example: A radar unit designed for a cargo aircraft fails in a fighter aircraft due to vibration.
©Cayman Systems Revision N 980815(513) 777-3394 www.qs9000.com
Potential Failure Mode and Effects Analysis Slide 101, Printed: 10/12/98
Fault Tree Fundamentals (Continued 2)
3. Comparison of Fault Occurrence and Fault ExistenceThe term Fault Occurrence refers to the fact that an undesired event has taken place and may or may not still exist. Fault Existence, however, implies that the fault has occurred and continues to exist. Therefore, the fault can be described as being either transient or permanent.During the construction of the fault tree, all systems analysts should use Fault Occurrence, rather than Fault Existence, as the focus of interest.
4. Comparison of Failure Causes and Fault EffectsA failure is considered to be an inability to perform a normal function. Example: Valve does not open. A fault is a higher level Occurrence which is usually preceded by a lower-level failure, such as a casing cracking due to overheating because of a lack of coolant induction due to an inoperable valve (lower level of failure). However, a fault may also occur when no failure is present. Example: Coolant valve operates properly, but the signal to operate it encounters a delay. A fault has occurred, but there is no valve failure. Because of this, it can be stated that any failure causes a fault, but not every fault is caused by a failure.
Failure Categories: a. Component, b. Environment, c. Human, d. Software.
©Cayman Systems Revision N 980815(513) 777-3394 www.qs9000.com
Potential Failure Mode and Effects Analysis Slide 102, Printed: 10/12/98
Fault Tree Construction Steps Summary
• Determine the level to which the examination should be constructed
• Begin with the system-level fault
• Fully describe all events which immediately cause this event
• With each lower-level fault, continue describing its immediate causes until a component level failure or human error can be attributed to the fault

©Cayman Systems Revision N 980815(513) 777-3394 www.qs9000.com
Potential Failure Mode and Effects Analysis Slide 103, Printed: 10/12/98
Fault Tree Construction Steps Summary (continued)
• Fully define each branch of the tree before beginning another branch
• During the construction of the tree, it is advisable to use a block diagram of the system to simplify determining the main branches
• If the results of the FMECA on the system are available at the time of the FTA it is advisable to use the results in defining the top event(s)
©Cayman Systems Revision N 980815(513) 777-3394 www.qs9000.com
Potential Failure Mode and Effects Analysis Slide 104, Printed: 10/12/98
Analyzing the Fault Tree
1. Determine the minimal cut-sets to simplify the tree (qualitative analysis).
2. Determine the probability of each input event
3. Combine the probability inputs to logic gates as follows:a. AND Gate - The probability of output is the product of the probabilities of the inputs (P0=Pi1• Pi2...•Pin)
b. OR Gate - The probability of output is the sum of the probabilities of the inputs (P0=Pi1+ Pi2...•Pin)
4. Combine the gate input probabilities until the probability of the top event is determined.
©Cayman Systems Revision N 980815(513) 777-3394 www.qs9000.com
Potential Failure Mode and Effects Analysis Slide 105, Printed: 10/12/98
Fault-Tree Analysis Procedures
• Identify the system or equipment level fault state(s) [undesired event(s)]
• Construct the fault tree• Perform the analysis to the component
level
©Cayman Systems Revision N 980815(513) 777-3394 www.qs9000.com
Potential Failure Mode and Effects Analysis Slide 106, Printed: 10/12/98
Criteria for Identifying the Undesired Event
• The top event must be measurable and definable
• The top event must be inclusive of the lower events
• The top event is the result of the lower events

©Cayman Systems Revision N 980815(513) 777-3394 www.qs9000.com
Potential Failure Mode and Effects Analysis Slide 107, Printed: 10/12/98
Zero Quality Control
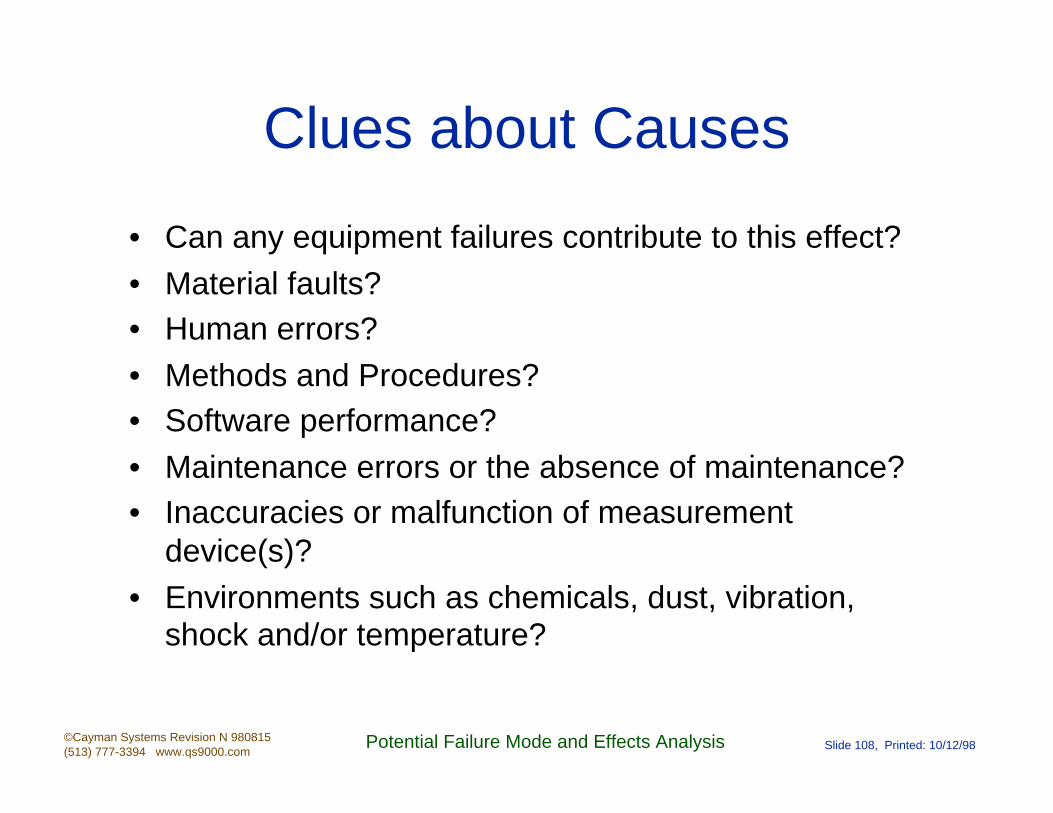
©Cayman Systems Revision N 980815(513) 777-3394 www.qs9000.com
Potential Failure Mode and Effects Analysis Slide 108, Printed: 10/12/98
Clues about Causes
• Can any equipment failures contribute to this effect?
• Material faults?• Human errors?
• Methods and Procedures?• Software performance?
• Maintenance errors or the absence of maintenance?• Inaccuracies or malfunction of measurement
device(s)?
• Environments such as chemicals, dust, vibration, shock and/or temperature?
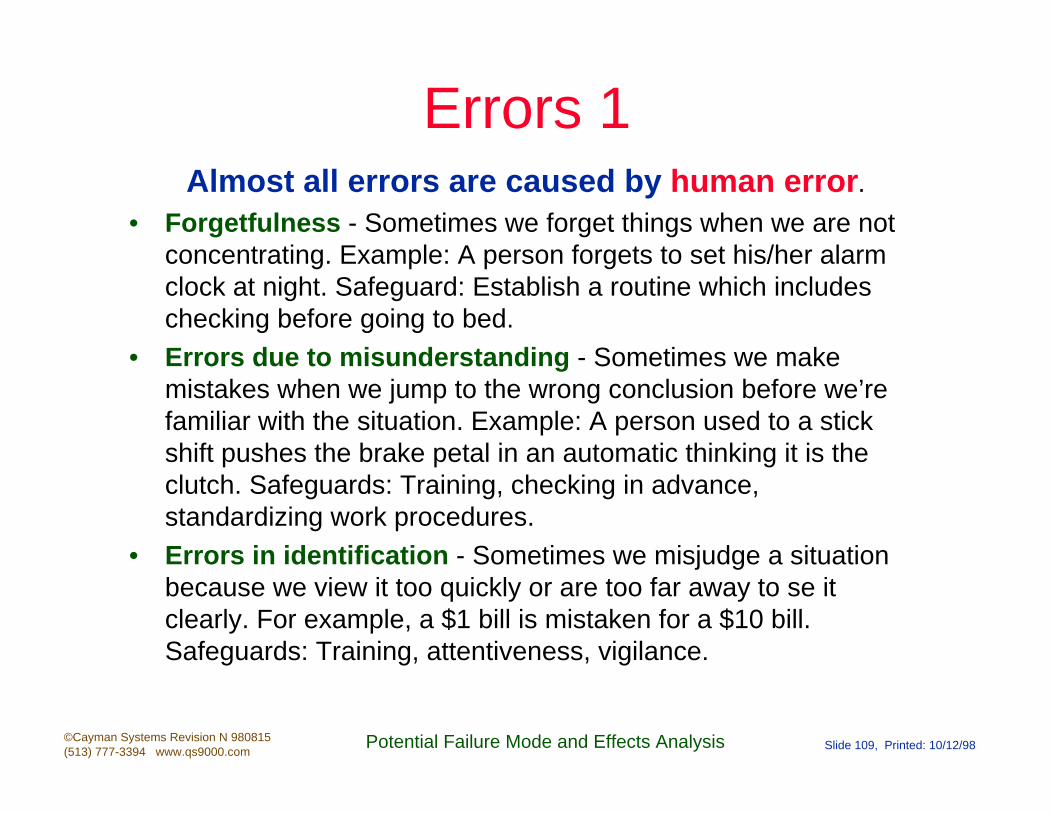
©Cayman Systems Revision N 980815(513) 777-3394 www.qs9000.com
Potential Failure Mode and Effects Analysis Slide 109, Printed: 10/12/98
Errors 1Almost all errors are caused by human error.
• Forgetfulness - Sometimes we forget things when we are not concentrating. Example: A person forgets to set his/her alarm clock at night. Safeguard: Establish a routine which includes checking before going to bed.
• Errors due to misunderstanding - Sometimes we make mistakes when we jump to the wrong conclusion before we’re familiar with the situation. Example: A person used to a stick shift pushes the brake petal in an automatic thinking it is the clutch. Safeguards: Training, checking in advance, standardizing work procedures.
• Errors in identification - Sometimes we misjudge a situation because we view it too quickly or are too far away to se it clearly. For example, a $1 bill is mistaken for a $10 bill. Safeguards: Training, attentiveness, vigilance.
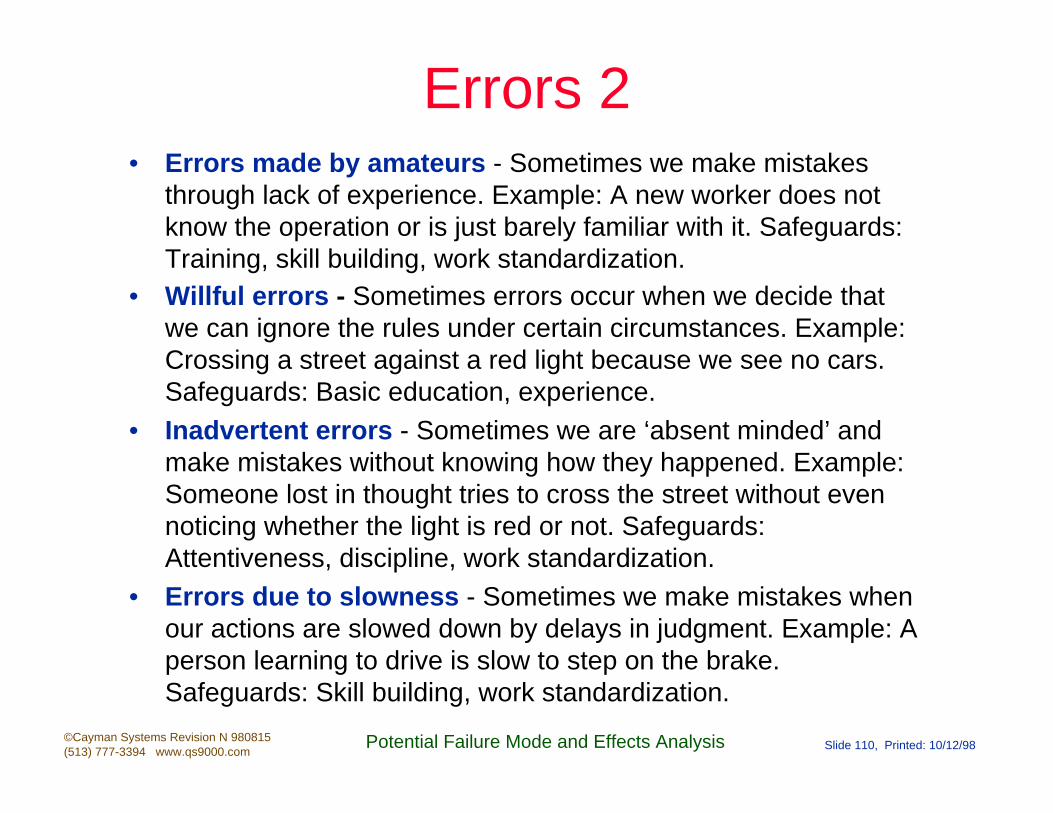
©Cayman Systems Revision N 980815(513) 777-3394 www.qs9000.com
Potential Failure Mode and Effects Analysis Slide 110, Printed: 10/12/98
Errors 2• Errors made by amateurs - Sometimes we make mistakes
through lack of experience. Example: A new worker does not know the operation or is just barely familiar with it. Safeguards: Training, skill building, work standardization.
• Willful errors - Sometimes errors occur when we decide that we can ignore the rules under certain circumstances. Example: Crossing a street against a red light because we see no cars. Safeguards: Basic education, experience.
• Inadvertent errors - Sometimes we are ‘absent minded’ and make mistakes without knowing how they happened. Example: Someone lost in thought tries to cross the street without even noticing whether the light is red or not. Safeguards: Attentiveness, discipline, work standardization.
• Errors due to slowness - Sometimes we make mistakes when our actions are slowed down by delays in judgment. Example: A person learning to drive is slow to step on the brake. Safeguards: Skill building, work standardization.

©Cayman Systems Revision N 980815(513) 777-3394 www.qs9000.com
Potential Failure Mode and Effects Analysis Slide 111, Printed: 10/12/98
Errors 3• Errors due to lack of standards - Some errors occur when
there are not suitable instructions or work standards. Example: A measurement may be left to an individual’s discretion. Safeguards: Work standardization, work instructions.
• Surprise errors - Errors sometimes occur when equipment runs differently than expected. Example: A Machine malfunction without warning. Safeguards: Total Productive Maintenance, work standardization.
• Intentional errors - Some people make mistakes deliberately. Crimes and sabotage are examples. Safeguards: Fundamental education, discipline.
Mistakes happen for many reasons, but almost all can be prevented if we take time to identify when and
why they happen and then take steps to prevent them by using Poka-Yoke methods with
consideration to other available safeguards.
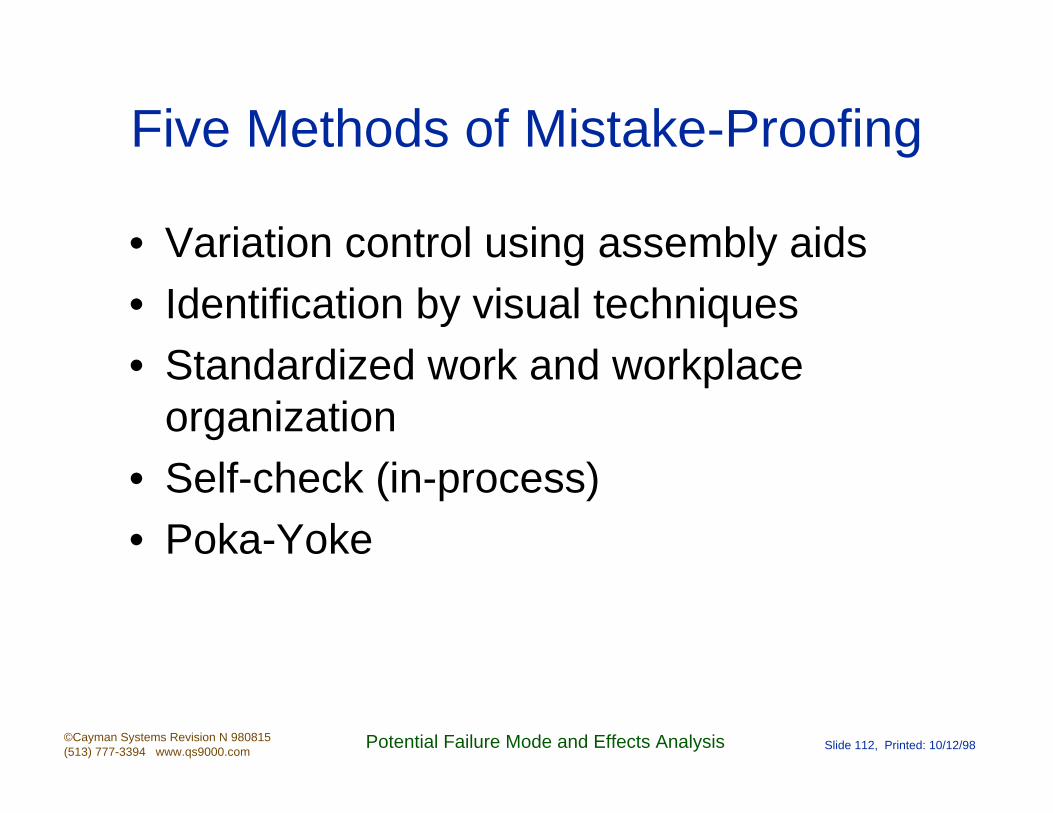
©Cayman Systems Revision N 980815(513) 777-3394 www.qs9000.com
Potential Failure Mode and Effects Analysis Slide 112, Printed: 10/12/98
Five Methods of Mistake-Proofing
• Variation control using assembly aids• Identification by visual techniques• Standardized work and workplace
organization• Self-check (in-process)• Poka-Yoke

©Cayman Systems Revision N 980815(513) 777-3394 www.qs9000.com
Potential Failure Mode and Effects Analysis Slide 113, Printed: 10/12/98
Mistake-Proofing• Emphasizes Prevention!• Principles
Build into processesEliminate inadvertent errorsStop doing it wrong - Do It Right!Work TogetherFind True Cause!
• ExamplesGuide for part (fixture)Error detection alarmLimit switchCounterCheck List


![Heart Failure Master [Compatibility Mode]](https://static.fdocuments.us/doc/165x107/577ccf1b1a28ab9e788ee487/heart-failure-master-compatibility-mode.jpg)