Failure mechanisms in cobalt welded with a silver–copper ...
15
See discussions, stats, and author profiles for this publication at: http://www.researchgate.net/publication/281827803 Failure mechanisms in cobalt welded with a silver–copper filler ARTICLE · OCTOBER 2015 DOI: 10.1016/j.msea.2015.07.094 READS 26 3 AUTHORS: Everett M. Criss University of California, San Diego 6 PUBLICATIONS 6 CITATIONS SEE PROFILE Richard Smith University of Nottingham 30 PUBLICATIONS 59 CITATIONS SEE PROFILE Marc A Meyers University of California, San Diego 484 PUBLICATIONS 11,198 CITATIONS SEE PROFILE All in-text references underlined in blue are linked to publications on ResearchGate, letting you access and read them immediately. Available from: Marc A Meyers Retrieved on: 15 December 2015
Transcript of Failure mechanisms in cobalt welded with a silver–copper ...
Seediscussions,stats,andauthorprofilesforthispublicationat:http://www.researchgate.net/publication/281827803
Failuremechanismsincobaltweldedwithasilver–copperfiller
ARTICLE·OCTOBER2015
DOI:10.1016/j.msea.2015.07.094
READS
26
3AUTHORS:
EverettM.Criss
UniversityofCalifornia,SanDiego
6PUBLICATIONS6CITATIONS
SEEPROFILE
RichardSmith
UniversityofNottingham
30PUBLICATIONS59CITATIONS
SEEPROFILE
MarcAMeyers
UniversityofCalifornia,SanDiego
484PUBLICATIONS11,198CITATIONS
SEEPROFILE
Allin-textreferencesunderlinedinbluearelinkedtopublicationsonResearchGate,
lettingyouaccessandreadthemimmediately.
Availablefrom:MarcAMeyers
Retrievedon:15December2015

Materials Science & Engineering A 645 (2015) 369–382
Contents lists available at ScienceDirect
Materials Science & Engineering A
http://d0921-50
n CorrE-m
journal homepage: www.elsevier.com/locate/msea
Failure mechanisms in cobalt welded with a silver–copper filler
Everett M. Criss a,n, Richard J. Smith d, Marc A. Meyers a,b,c
a Department of Mechanical and Aerospace Engineering, University of California, San Diego, La Jolla, USAb Materials Science and Engineering Program, University of California, San Diego, La Jolla, USAc Department of Nanoengineering, University of California, San Diego, La Jolla, USAd Electrical Systems and Optics Research Division, Faculty of Engineering, University of Nottingham, Nottingham, Nottinghamshire, United Kingdom
a r t i c l e i n f o
Article history:Received 16 April 2015Received in revised form28 July 2015Accepted 30 July 2015Available online 31 July 2015
Keywords:CobaltSilver–copperWelding surrogacyTungsten inert gas weldingResidual stressWeld fracture
x.doi.org/10.1016/j.msea.2015.07.09493/& 2015 Elsevier B.V. All rights reserved.
esponding author.ail address: [email protected] (E.M. Criss).
a b s t r a c t
Cobalt silver–copper (Co–AgCu) weldments approximate the stresses and failure mechanisms of ber-yllium aluminum–silicon (Be–AlSi) welds, which have strategic importance but are hazardous to study.Failure tests of these surrogate Co–AgCu welds, examined in tension and four-point bending, show thatresidual stresses and post-welding heat treatment have little or no effect on strength, whereas weldquality and geometry are extremely important. Scanning electron microscopy images reveal abundantdefects in poor welds, which usually fail through propagation of preexisting cracks. Fracture surfacesshow a variety of morphologies, ranging from dimples in the AgCu filler, to cleavage steps in the CoCuperitectic, and suspected intergranular fracture in the cobalt base. Spatially resolved acoustic spectro-scopy reveals significant changes in microstructure near the base–filler interface, whereas wavelengthdispersive analysis shows high Cu concentrations in this area.. Contrary to finite element predictions,these welds were found to be stronger during face bending than root bending, likely resulting from theincreased number of cracks and imperfections in the Co base. These computations correctly predict thatweld strength depends on geometry and that welds fail either in the cobalt base, or along the base–fillerinterface. Crack compliance measurements show that the largest residual stresses are located along thisinterface. However, these stresses are unlikely to influence failure due to their direction, whereas stressesin the weld root are too small to have observable effects on failure. The strength of Co–AgCu weldsdepends strongly on geometry, penetration, and weld quality, but little on residual stresses, and thisconclusion is tentatively extended to Be–AlSi welds.
& 2015 Elsevier B.V. All rights reserved.
1. Introduction and Goals
The cobalt silver–copper (Co–AgCu) welding system was de-veloped as a surrogate for beryllium aluminum–silicon (Be–AlSi)welds in order to improve understanding of the toxic Be–AlSisystem without use of special facilities and risk of illness [1,2]. Inthis surrogate concept, Co–AgCu must mimic, as accurately aspossible, the behavior of Be–AlSi, including the interactions be-tween the Be base and the AlSi filler. Cobalt is an ideal surrogatefor beryllium-based weldments, due to the mechanical, thermaland crystallographic similarities of the two elements. Both cobaltand beryllium have a hexagonally close packed crystal structure(HCP), which endows both elements with relatively high stiffnessand similar melting points [3–5]. Behavior of the Ag–Cu fillerduring welding is also of interest because silver–copper fillermetal in cobalt welds was found to best emulate the chemistry of
the Be–AlSi system, as both systems are characterized by a lack ofmiscibility between filler and base metals [1]. Furthermore, themismatches in the coefficient of thermal expansion (CTE) andYoung's modulus (E) between AgCu and Co are similar, althoughnot as extreme, as the mismatches of CTE and E in the Be–AlSisystem. Criss and Meyers [1] provide a detailed description ofsurrogate development, welding techniques, and why the Co–AgCu surrogate can simulate the behavior of Be–AlSi rings, PIGMAwelded at Los Alamos National Laboratory.
The study of Co and specifically its behavior during welding isimportant for other reasons. Cobalt is used as an alloying elementin a variety of steels, carbides, and corrosion resistant alloys [4],and is a primary constituent of batteries, magnets, and superalloys[6–8]. Cobalt–chromium–molybdenum alloys (e.g. Vitallium,Megallium) are used in dentistry and biomedical implants [9].Vitallium is usually joined via soldering or brazing [9], but may bejoined by torch [10] or TIG [11]. Cobalt–chromium base alloys(Stellite) are generally used as hardfacings, which are appliedusing a variety of welding, cladding and brazing techniques [12,

Fig. 1. A: Pass locations, directions, and weldment geometry used in the Co–AgCuTIG welds. Two cobalt samples sharing a single U-groove are joined by 5 passes inalternating directions. The final, oscillating pass is indicated by a wavy line. B:Approximate weld-bead locations. Dimensions are all 70.08 mm unless notedotherwise.
E.M. Criss et al. / Materials Science & Engineering A 645 (2015) 369–382370
13]. Heat resistant alloys, often consisting of Co–Cr–Ni–W, are alsowelded or brazed [4].
The eutectic, AgCu filler metal is commonly used as a filler forvacuum brazing [14]. Silver–copper alloys are also used in jewelryand tableware [e.g., sterling silver (92.5% Ag); 15], and as electricalcontact alloys [16].
Despite the diverse usage of the components of our Co–AgCusystem, information is lacking on the brazing of cobalt–copper,due to possible liquid metal embrittlement [17], and welding re-garding HCP cobalt base alloys. A majority of cobalt's structuralalloys (e.g. Stellite, Vitallium) utilize the high temperature facecentered cubic (fcc) phase [17], and differ structurally from purecobalt, which is HCP. Cobalt usage in batteries usually involvescobalt oxide, cobalt hydroxide or lithiated cobalt oxide (LixCoO2)[4,18], all of which differ from pure cobalt structurally and che-mically. Some samarium-cobalt magnets (SmCo5) do possess ahexagonal crystal structure [19], but are not welded. As such, thereis limited information regarding fabrication and welding of purecobalt. Because development of Co based superalloys is ongoing[20,21], understanding the behavior of the pure metal isimportant.
In this paper, the Co–AgCu system is used to investigate theeffects that residual stress, weld geometry, weld quality, and postwelding heat treatment have on weld failure, and it extrapolatesthese results to welded Be–AlSi. Geometric effects are expected tobe of importance, since their influence on weld failure is known(e.g., [22–24]). The welding techniques discussed in the previouswork [1], were used to create 11 new welds, which were analyzedalongside the single complete weld from the previous study.
The present work utilizes tension and 4-point bending toproduce weld failures in the Co–AgCu weldments, and combinesthese tests with the crack compliance (slitting) method to de-termine the effect of residual stresses. The weldments are furthercharacterized using scanning electron microscopy (SEM) and wa-velength dispersive analysis (WDS), by developing a novel use ofoptical microscopy, and by applying a recently developed method,spatially resolved acoustic spectroscopy (SRAS). SRAS is a laserultrasonic technique which produces maps of the surface acousticwave velocity (SAW) [25,26]. The SAW velocity for a particularpropagation direction depends strongly on the crystallographicorientation of the material and so can be used to map the mi-crostructure of a material. Combining a number of velocity mapswith different acoustic wave propagation directions can generateinformation about the c-axis orientation for hexagonal materials,or the complete grain orientation for some specific crystal-lographic symmetries [26].
Effects of low temperature heat treatment on weld strength areexamined, in order to determine whether residual stress ameli-oration is possible. Finite element models were constructed tounderstand our residual stress measurements and fracture results.This combination of measurements, images and quantitativemodels shows that residual stresses do not substantially impactfailure in Co–AgCu weldments, but that weld geometry, materialquality, and defects and imperfections govern weld strength andfailure. The insight provided by this report into the behavior ofwelded cobalt pertains to development and joining of new cobaltalloys, as well as the behavior of the original Be–AlSi system.
2. Experiments and techniques
2.1. Materials
The weld base was 99.95% pure cobalt, hot rolled to 7.6 mm(Sophisticated Alloys). The cobalt plate was then heat treated at325 °C for 100 h to homogenize the grain structure of our metal.
Some studies [27] have reported the persistence of the FCC phaseafter refining the grain structure by rolling, but our previous x-raymeasurements indicate that minimal FCC is present after this heattreatment [1].
The filler wire was 72–28% AgCu (obtained from Lucas Mil-haupt), which is at the eutectic point. It is available from a numberof sources, and is often referred to by its AWS specification, BAg-8[28].
2.2. Welding equipment, materials and parameters
Eleven additional welds were produced. Our welding setup,materials and geometry are identical to the previous study [1],where they are described in more detail. All welds were producedby a single ASME aerospace certified welder. He employed a TIGwelder with high frequency stabilization (Miller Aerowave), whichwas set to direct current electron negative (DCEN).
All welds utilized two standard parts, each consisting of a76 mm long, 25.4 mm wide, 6.25 mm thick block of 99.95% cobaltwith a 3.2 mm radius J-groove (Fig. 1). The thicknesses of theJ-groove and part were verified accurate to 0.08 mm.
Prior to welding, the parts were positioned above a heated,porous refractory substrate with a purpose built clamp. The clampwas furnace heated to above 300 °C, the parts were loaded atapproximately 250 °C, and welding occurred at a substrate tem-perature of approximately 230 °C.

Fig. 2. Tension test pieces, tension test, and FEA model. A: Locations and size of test pieces. B: Test piece being fractured in tension grips, showing location of filler pool, anduse of deflectometer. C: FEA model showing half symmetry test piece in tension. The large green area is our fixture, the test piece is dark due to the small size of its mesh.Colored area at the bottom are force vectors due to symmetric boundary conditions. (For interpretation of the references to color in this figure legend, the reader is referredto the web version of this article.)
Fig. 3. Traverse Root (A) and Face bending (B) orientations. AISI 304 steel rollers(dark), sample (medium) and filler (light).
E.M. Criss et al. / Materials Science & Engineering A 645 (2015) 369–382 371
All welds involve 5 passes, in alternating directions, with 0.25 l/s Ar back-gas and He or Ar top-gas (Fig. 1). Passes 1–4 were done at225 A, with 0.43 l/s He top-gas, while pass 5 was 150 Awith 0.25 l/s Ar top-gas. Passes 1 and 2 were centered, whereas passes 3 and4 were to either side of the original J-groove (Fig. 1B). The finalpass was done in an oscillating trajectory. The weldments wereallowed to cool to room temperature after passes 2, 3, and 4.
2.3. Fracture in tension and 4-point bending
Welds were fractured both in tension and in a 4-point bendingapparatus, using an Instron 3307 tensile tester. To perform thetension test, the weld was first precision ground until it had anorthogonal cross section. It was then sectioned in an electricaldischarge machine (EDM) into 8 test pieces (Fig. 2A), and loadedinto a specially made fixture (Fig. 2B).Displacement was measuredwith a deflectometer (Fig. 2B). Results were compared to finiteelement models (Fig. 2C).
Four-point bending was performed on 8 different welds, usingboth transverse root bending (Fig. 3A) and transverse face bending(Fig. 3B), on heat treated and as is weldments. These orientationscorrespond to the ASTM weld bending standard [29], although thetesting jig here differs by having 4 rollers (Fig. 3) rather than aguided bend fixture. For brevity, these tests will be referred to asroot bending and face bending, respectively. The root bending testis identical to the fracture tests performed previously [1], althoughthe samples are new. The tester was set to a 48 mm support span,and a 12 mm load span. No extensometer was fitted, which willresult in accurate load data, but overestimated displacement data.
One weld was EDM cut into 20 sections but not ground
(Fig. 4A). Fracture was performed in the root bending orientation,and compared to a sample from our previous work [1].
Three welds were ground until flat, and then cut with an EDMinto 21 sections (Fig. 4B). We alternately applied root and facebending to adjacent sections. Results were compared to finiteelement models.
Four welds were used in a combined residual stress and heattreatment study. These welds were also ground, before beingsectioned into 4 fracture and 4 residual stress specimens (Fig. 4B).Half of the fracture specimens and half of the residual stressspecimens were heat treated at 32572 °C for 100 h. Fracture was

Fig. 4. A: Schematic shows section positions and dimensions for the 20 section, unground root bending test. B: Schematic shows section positions and dimensions for the 21section alternating face and root bending test. C: Schematic shows section positions, dimensions and heat treatments for the crack compliance method and root bendingtests. Either sections 3–5, or 1–2, 6–8, were heat treated as indicated by the different shading.
E.M. Criss et al. / Materials Science & Engineering A 645 (2015) 369–382372
performed in the root bending orientation. Results were comparedto finite element models.
2.4. Scanning electron microscopy (SEM) and energy dispersiveX-ray spectroscopy (EDS)
Imaging and compositional analysis was performed on a Phil-lips XL30 ESEM with an Oxford EDS attachment. Images were ta-ken after fracture in tension and 4-point bending utilizing sec-ondary electrons. For face and root bending, only the strongest andweakest sections were examined. Prior to microscopy, these sec-tions were polished and coated with iridium. Fractography was
also performed after tension, on the uncoated failure surface of thestrongest test piece. Compositional analysis was performed atareas of interest utilizing the EDS attachment. Concentrations ofAg, C, Co, Cu and O were measured, but percentages of C and Owere removed during analysis.
2.5. Optical microscopy
To reveal machining inconsistency, as well as sufficiently largegrain structures, we developed a new method of sample pre-paration involving first grinding the weld to a high degree offlatness using a granite block and 1500 grit paper. Once this is

E.M. Criss et al. / Materials Science & Engineering A 645 (2015) 369–382 373
complete, a slurry is prepared from a mixture of silicon carbide,alumina, and water. Carefully removing the sample from the pol-ishing surface allowed surface tension to adhere the slurry to thesample, which revealed surface deviations during optical micro-scopy. Although this method does not reveal fine detail, it is fasterthan etching, and can be performed utilizing only sandpaper,polishing compound, a polishing block, and a camera with a macrolens.
2.6. Spatially resolved acoustic spectroscopy (SRAS)
Two welds were sectioned along the direction of welding, inthe weld center. Two SRAS scans were performed on each weld,one with the wave propagation direction aligned with the longedge of the sample and the other orthogonal to this. The projectedfringe pattern had a spacing of 23.6 μm and so the measuredacoustic frequency range was �100 to 140 MHz. The acousticgeneration patch size was 120 μm giving a spatial resolution onthe order of 60 μm.
The weldments studied have a predominantly hexagonallyclose packed cobalt base. Due to the geometry of this crystalstructure, SRAS can provide some indication of c-axis orientationby combining two maps with orthogonal propagation directions.Regions where the measured surface acoustic wave velocity is‘fast’ for both propagation directions are basal, for ‘fast/slow’ or‘slow/fast’ combinations the c-axis lies orthogonal or in line withthe scan direction respectively.
During the SRAS scan the amount of reflected probe light is alsorecorded, this allows a high contrast/high resolution optical imageto be obtained; these are high contrast images showing surfacefeatures such as the base–filler boundary and crack locations.
2.7. Electron microprobe and wavelength dispersive analysis (WDS)
A weld section from the previous study [1] was characterizedby wavelength dispersive analysis (WDS) and standard procedureson the JXA-8200 electron microprobe at Washington University,using “Probe for EPMA” for data reduction (see http//www.probesoftware.com/ ). The measured data were corrected with CITZAFafter [30]. Pure Ag and Co were used as standards for their re-spective elements, while cartridge brass (NIST) was used as our Custandard.
Locations of the WDS measurements are overlaid on micro-graphs of the weld section, created using electron backscatter aswell as optical microscopy. Optical micrographs were taken afterthe weldment was sequentially etched by an aqua regia basedmixture and nital. Full description of the methods used to producethese images is given in [1]. Electron backscatter images werecreated using the microprobe software described above.
2.8. Finite element analysis (FEA) of fracture
Three sets of finite element fracture models were created usingAbaqus. The first set of models consists of three dimensional re-presentations of the tension test. The second set are two-dimen-sional representations of the face and root bending tests. The thirdset are also 2d representations of the root bending tests used inthe residual stress study.
Fig. 5. Basic shape used in all of our FEA. This corresponds roughly to the observedshapes of our weld sections. Table 1 provides parameter values.
In order to develop models that are relevant to all of our re-sults, we assumed a generic filler shape for all computations(Fig. 5) that is typical of all our welds. Shape parameters weredetermined by a combination of mechanical and optical mea-surement over the sample set being investigated. Measurementsare accurate to 0.025 mm, but the variance across parts sig-nificantly exceeds that value. To estimate the uncertainties in ourpredictions, multiple models were produced per sample set, basedon these measurements (Table 1). For bending tests, these modelsrepresent what we believe are the average, weakest, and strongestpossible geometries. For the weakest FEA geometry, we utilizedmeasurements providing maximum filler area, and minimum basearea. For the strongest geometry, we utilized measurementsforming the smallest filler, and largest base. The average modelwas constructed by simple averaging our measurements. For ten-sion, only the average dimensions from the measured test pieceswere used in our models.
All of these FEA models utilize material properties for the base,filler and fixtures (Table 2) as previously discussed [1]. The base ofthe weld was assumed to be pure cobalt. Cobalt elastic parameterswere taken from [3], whereas plastic data was taken from [31] andmodified [1]. The rollers and tensile fixture were assumed to becompletely elastic, AISI 304 steel [1, 3]. The elastic properties ofthe filler were taken as a Voigt-Reuss-Hill average of data [3] asdescribed in [1]. The plastic properties of the filler were takenfrom tensile measurements [32] and corrected [1]. Basic metalplasticity, as defined by Abaqus based on the von Mises criterion,was used for the cobalt base and AgCu filler. Contact between thesample and fixtures was assumed to be frictionless, with the cobaltand filler being defined as the slave surfaces, and the steel fixturedefined as the master surface. As a result of the large deformationsand nonlinear behavior observed in our specimens, it was neces-sary to incorporate both plasticity and contact into our models.
All models were displacement, not force controlled, and usedthe standard, implicit problem solver.
2.8.1. Tension FEAThe two tension models were 3-dimensional, and utilized
mirror symmetry across the weld (Fig. 2). Each of these modelscorresponds to the different types of tension sample (Fig. 2).Geometry for the fixture was measured via calipers, as were thewidth, height and depth of these samples (Table 1). Filler geo-metry was measured optically from approximately 30 mm and45 mm from the weld start. All elements were hexagonal, corre-sponding to a seed size of between 0.1 mm and 0.125 mm (Ta-ble 3). In order to stabilize the FEA, a minimum of 250 steps wereused in both calculations.
2.8.2. Face and root 4 point bending FEAThe models used for 4-point bending were 2-dimensional, and
constructed of 5 parts consisting of a sample and 4 rollers. The faceand root 4-point bending tests are identical, with the exceptionthat the sample was flipped. Geometry of the rollers was mea-sured via caliper, as were the height and depth of all of the sam-ples. Width is approximate, and does not influence model beha-vior. The filler parameters were measured optically, from imagesoccurring approximately 13 mm and 66 mm from the weld start.Final values were created from the maximum, minimum andaverage dimensions from the three welds used in the corre-sponding study (Table 1). Basic finite element parameters areprovided (Table 3).
2.8.3. Root 4 point bending (residual stress study) FEAModels used for 4-point bending were 2-dimensional, and
constructed of 5 parts consisting of a sample and 4 rollers. Geo-metry of the rollers was measured via caliper, as were the height

Table 1FEA Geometry, 70.005 mm.
Finite element model Width (W), mm Height (H), mm Thickness into page, mm A, mm B, mm C, mm D, mm
Tension, average (long test piece) N/A 5.36 2.075 3.04 4.335 6.47 4.63Tension, average (short test piece) N/A 5.36 2.055 3.04 4.335 6.47 4.63Root and face bending, weakest 50.08 5.26 2.11 2.61 3.36 8.02 6.43Root and face bending, average 50.08 5.31 2.125 2.985 3.71 6.91 4.73Root and face bending, strongest 50.08 5.335 2.135 3.435 3.94 5.69 3.88Root bending and crack compliance, weakest 50.08 5.32 2.465 2.465 3.63 8.28 5.58Root bending and crack compliance, average 50.08 5.355 2.505 2.76 3.945 6.85 5.04Root bending and crack compliance, strongest 50.08 5.385 2.525 3.075 4.36 5.74 3.94
Table 2FEA material parameters (4 significant figures).
Material Location Young’s modulus (GPa) Poisson’s ratio Plasticity law UTS (MPa) Max equivalent plastic strain
AISI 316 Rollers/tensile fixture 215 0.283 N/A N/A N/ACobalt Weld base 211 0.32 Mises 949.1 0.172772/28 AgCu Weld filler 95.37 0.3593 Mises 302 0.3136
E.M. Criss et al. / Materials Science & Engineering A 645 (2015) 369–382374
and depth of all of the samples. Width is approximate, and doesnot influence model behavior. The filler parameters B and C weremeasured optically, while parameters A and D were measured viacaliper from images occurring approximately 28 mm and 52 mmfrom the weld start. Final values were created from the maximum,minimum and average dimensions from the four welds used in theresidual stress study (Table 1). Basic finite element parameters areprovided (Table 3).
2.9. Crack compliance method
Residual stress measurements were successful performed onsamples from three separate welds utilizing the crack compliance,or slitting method. This method combines incremental strainmeasurements with analytic or finite element analysis assisteddata reduction [33]. In our case, we combined incremental cutsusing a wire EDM, with FEA data reduction using Abaqus.
2.9.1. Strain measurementsTo perform the strain measurements, the welds were first cut into
eight sections using an EDM (Fig. 4). Half of these sections were heattreated, half were not. Three of these sections were used for residualstress measurements, the others were fractured (Fig. 4). This resultedin 12 total residual stress measurements. Of these 12 tests, only 5 weresuccessful, mainly due to water impinging on the strain gauge.
For all of these tests, a strain gauge (Micro-Measurements EA-06-062AK-120) was mounted on section, and protected via wa-tertight acrylic coating. The sections were degreased with methyl–ethyl–ketone, before being cleaned with a mild phosphoric-acidcompound (Conditioner A). This compound was then removedwith an ammonia-based neutralizer (Neutralizer 5A). The glueused to affix the samples was high purity cyanoacrylate (CN gen-eral purpose adhesive). The sections were then protected by awatertight acrylic coating (M-Coat D). Gauges were mounted onthe back face of the section, in the exact center, on the cobalt base.This is similar to the typical setup used at Los Alamos [34], withthe omission of a top gauge.
The sections were then loaded into a flushing type EDM. Afterthe machine was automatically zeroed, a crack was extended fromthe filler to the base, using 20 increments of 0.25 mm each. Uti-lizing any more increments would jeopardize the strain gauge bypotentially cutting the section in half.
The pressure of the jets, combined with the tight tolerances be-tween the gauge size and part width, contributed to the destruction ofthe first 6 gauges. The next 6 gauges were run under minimal
pressure; 1 additional gauge was lost due to poor sample-gaugeadhesion.
Residual stress measurements were taken after each increment.In order to account for EDM induced thermal expansion, mea-surements were taken after a time delay, or after observed tem-perature equilibration. The first 8 tests utilized a time delay;measurements were taken until no change was observed over a2 min period. This generally occurred after 6 or 8 min. The finalfour tests were temperature controlled via a mounted thermo-couple. Measurements were taken between 23.4 °C and 23.6 °C.
The procedure used during testing is very similar to the methodin use at Los Alamos [34]. Our procedure differs in our use oftemperature control, our omission of a top gauge, and our lack ofpost-test optical measurements.
2.9.2. Data reductionDue to the complex shape of our part it was necessary to utilize
FEA to analyze our strain data. Utilization of FEA for data reductionis typical for the crack compliance method [33]. FEA models forstrain data reduction were created using the same shape para-meters as earlier (Section 2.8, Table 1). Variance in calculated re-sidual stresses due to these shape parameters is not significant,with the peak tensile stresses generally within 75% of each other.This is a considerable under-representation of experimental un-certainties during strain measurement.
These models are 2-dimensional, and utilize weld symmetryfor stress computation. Element size is restricted due to the re-quirement that crack width (induced by the EDM wire) be effec-tively filled. This results in a seed size of 0.1 mm (Table 3).
In order to reduce the strain data, the model is started in a stressfree state. The crack is simulated through element removal. A se-quential, unit traction is then applied to every set of faces exposedthrough elemental removal. The change in displacement is then re-corded over the elements representing the strain gauge contact area.
This allows creation of a compliance matrix, relating relieved re-sidual stresses and measured strains. By solving for residual stressesusing this compliance matrix, our residual stress results were created.
3. Results and discussion
3.1. Spatially resolved acoustic spectroscopy, optical microscopy, andelectron microprobe on unfractured weldments
Co–AgCu welds possess five distinct regions: the eutectic AgCu

Table
3Finiteelem
entparam
eters.
Finiteelem
entmodel
Minim
um
seed
(mm)
Max
imum
seed
(mm)
Curvature
control
Max
step
defl
ection(m
m)
Max
totaldefl
ection(m
m)
Dominan
telem
enttype
Oth
erelem
enttype
Tension
,ave
rage
(lon
gtest
piece)
0.1
0.12
50.2
0.005
1.25
Hex
aN/A
Tension
,ave
rage
(shorttest
piece)
0.1
0.12
50.2
0.005
1Hex
N/A
Roo
tan
dface
bending,
wea
kest
0.1
0.1
0.1
0.001
7Quad
bTric
Roo
tan
dface
bending,
averag
e0.1
0.1
0.1
0.001
7Quad
Tri
Roo
tan
dface
bending,
stronge
st0.1
0.1
0.1
0.001
8Quad
Tri
Roo
tbe
nding(residual
stress
study),w
eake
st0.1
0.1
0.1
0.001
8Quad
Tri
Roo
tbe
nding(residual
stress
study),a
verage
0.1
0.1
0.1
0.001
8Quad
Tri
Roo
tbe
nding(residual
stress
study),
stronge
st0.1
0.1
0.1
0.001
8Quad
Tri
Crack
complia
nce,w
eake
st0.1
0.1
0.1
N/A
N/A
Quad
Tri
Crack
complia
nce,a
verage
0.1
0.1
0.1
N/A
N/A
Quad
Tri
Crack
complia
nce,s
tron
gest
0.1
0.1
0.1
N/A
N/A
Quad
Tri
aHex
ahed
ral.
bQuad
rilateral.
cTriangu
lar.
Fig. 6. (A) Weld Macrostructure (optical), (B) Microstructure (optical and back-scattered SEM), and WDS Sample Locations. A: Different weld regions, as well asthe location of the microprobe samples (red circles) and the magnified area to theright (green box). B: Expanded green box: AgCu filler (top), the CoCu peritectic(middle) and the Co base (bottom). The location of the WDS samples is given bypurple or red dots. (For interpretation of the references to color in this figure le-gend, the reader is referred to the web version of this article.)
E.M. Criss et al. / Materials Science & Engineering A 645 (2015) 369–382 375
filler, the peritectic CoCu region, the melted cobalt base, the heataffected zone (HAZ), and the unmelted base (Fig. 6A). SRAS, WDSand microscopy provide a better understanding of the micro-structure and origin of these zones.
The peritetic zone was originally distinguished by the presenceof small (�10 μm) aligned lamellar and cellular structures, be-lieved to be the result of Cu exsolution during cooling. Thesestructures exist inside larger macrozones (�500 μm), which arebelieved to be remnant Co grains, before Cu exsolution (process bywhich a solid solution phase unmixes into two separate phases inthe solid state).
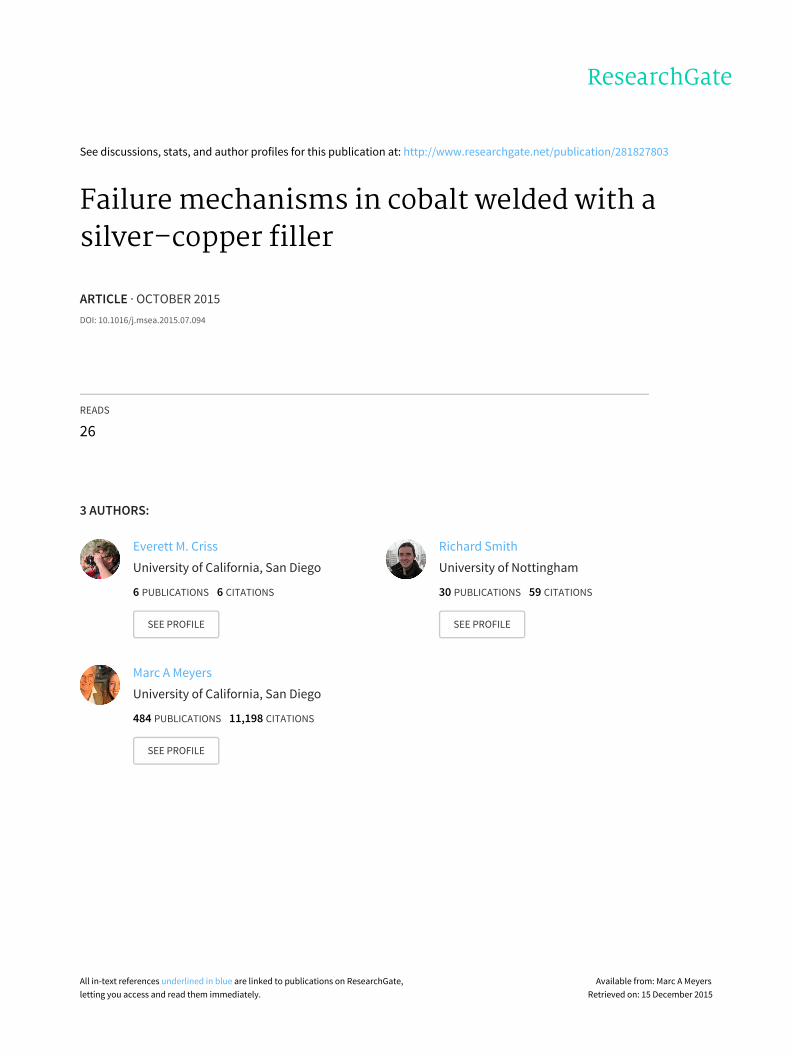
The presence of Cu has been confirmed by WDS, with sig-nificantly higher concentrations of Cu existing in the peritecticregion, which encompasses WDS measurements on spots 1–9(Figs. 6 and 7). Optical microscopy shows two different structuresinside the CoCu macrozones; close (�200 μm) to the filler thesestructures appear cellular, while farther away (�200–1000 μm)they are lamellar (Fig. 6). Although significant variations in Cu andAg content occur inside the peritectic region (Fig. 7), these che-mical variations are not well correlated with observed structural
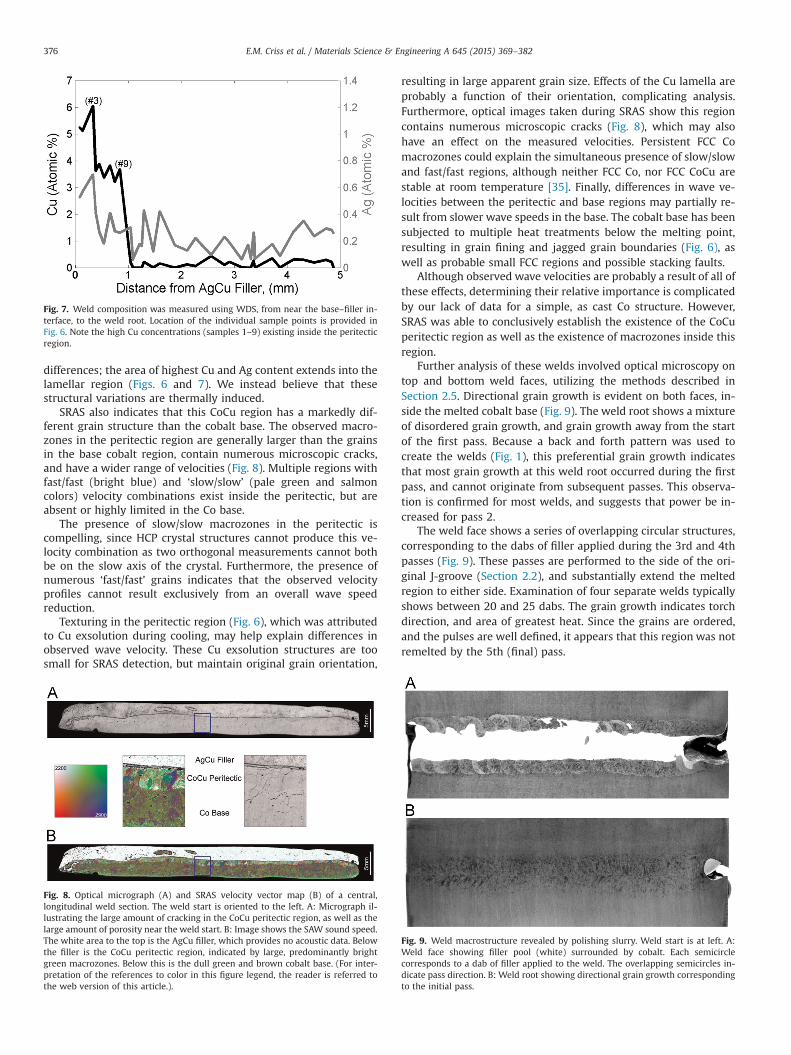
Fig. 7. Weld composition was measured using WDS, from near the base–filler in-terface, to the weld root. Location of the individual sample points is provided inFig. 6. Note the high Cu concentrations (samples 1–9) existing inside the peritecticregion.
E.M. Criss et al. / Materials Science & Engineering A 645 (2015) 369–382376
differences; the area of highest Cu and Ag content extends into thelamellar region (Figs. 6 and 7). We instead believe that thesestructural variations are thermally induced.
SRAS also indicates that this CoCu region has a markedly dif-ferent grain structure than the cobalt base. The observed macro-zones in the peritectic region are generally larger than the grainsin the base cobalt region, contain numerous microscopic cracks,and have a wider range of velocities (Fig. 8). Multiple regions withfast/fast (bright blue) and ‘slow/slow’ (pale green and salmoncolors) velocity combinations exist inside the peritectic, but areabsent or highly limited in the Co base.
The presence of slow/slow macrozones in the peritectic iscompelling, since HCP crystal structures cannot produce this ve-locity combination as two orthogonal measurements cannot bothbe on the slow axis of the crystal. Furthermore, the presence ofnumerous ‘fast/fast’ grains indicates that the observed velocityprofiles cannot result exclusively from an overall wave speedreduction.
Texturing in the peritectic region (Fig. 6), which was attributedto Cu exsolution during cooling, may help explain differences inobserved wave velocity. These Cu exsolution structures are toosmall for SRAS detection, but maintain original grain orientation,
Fig. 8. Optical micrograph (A) and SRAS velocity vector map (B) of a central,longitudinal weld section. The weld start is oriented to the left. A: Micrograph il-lustrating the large amount of cracking in the CoCu peritectic region, as well as thelarge amount of porosity near the weld start. B: Image shows the SAW sound speed.The white area to the top is the AgCu filler, which provides no acoustic data. Belowthe filler is the CoCu peritectic region, indicated by large, predominantly brightgreen macrozones. Below this is the dull green and brown cobalt base. (For inter-pretation of the references to color in this figure legend, the reader is referred tothe web version of this article.).
resulting in large apparent grain size. Effects of the Cu lamella areprobably a function of their orientation, complicating analysis.Furthermore, optical images taken during SRAS show this regioncontains numerous microscopic cracks (Fig. 8), which may alsohave an effect on the measured velocities. Persistent FCC Comacrozones could explain the simultaneous presence of slow/slowand fast/fast regions, although neither FCC Co, nor FCC CoCu arestable at room temperature [35]. Finally, differences in wave ve-locities between the peritectic and base regions may partially re-sult from slower wave speeds in the base. The cobalt base has beensubjected to multiple heat treatments below the melting point,resulting in grain fining and jagged grain boundaries (Fig. 6), aswell as probable small FCC regions and possible stacking faults.
Although observed wave velocities are probably a result of all ofthese effects, determining their relative importance is complicatedby our lack of data for a simple, as cast Co structure. However,SRAS was able to conclusively establish the existence of the CoCuperitectic region as well as the existence of macrozones inside thisregion.
Further analysis of these welds involved optical microscopy ontop and bottom weld faces, utilizing the methods described inSection 2.5. Directional grain growth is evident on both faces, in-side the melted cobalt base (Fig. 9). The weld root shows a mixtureof disordered grain growth, and grain growth away from the startof the first pass. Because a back and forth pattern was used tocreate the welds (Fig. 1), this preferential grain growth indicatesthat most grain growth at this weld root occurred during the firstpass, and cannot originate from subsequent passes. This observa-tion is confirmed for most welds, and suggests that power be in-creased for pass 2.
The weld face shows a series of overlapping circular structures,corresponding to the dabs of filler applied during the 3rd and 4thpasses (Fig. 9). These passes are performed to the side of the ori-ginal J-groove (Section 2.2), and substantially extend the meltedregion to either side. Examination of four separate welds typicallyshows between 20 and 25 dabs. The grain growth indicates torchdirection, and area of greatest heat. Since the grains are ordered,and the pulses are well defined, it appears that this region was notremelted by the 5th (final) pass.
Fig. 9. Weld macrostructure revealed by polishing slurry. Weld start is at left. A:Weld face showing filler pool (white) surrounded by cobalt. Each semicirclecorresponds to a dab of filler applied to the weld. The overlapping semicircles in-dicate pass direction. B: Weld root showing directional grain growth correspondingto the initial pass.

Fig. 10. Tension tests and finite element analysis. A: Horizontal dotted lines showpredicted failure for the long test piece (dark) and the shorter test piece (gray).Solid lines show the measured force/displacement curve during tensile failure. B:Plot showing ultimate tensile force vs. test piece position, and FEA predicted failure.Test pieces in the center of the weldment are significantly stronger, unlike mostother tests which show a quasi-steady region.
Fig. 11. Distribution and magnitude of von Mises stresses during tensile failure.Note the high stress concentration in the cobalt, immediately below the filler re-gion. This corresponds to the CoCu peritectic region on the actual welds.
E.M. Criss et al. / Materials Science & Engineering A 645 (2015) 369–382 377
3.2. SEM, FEA and fracture of tensile specimens
A single weld was sectioned into two long and five short testpieces for tensile testing (Fig. 2). Although the different test piecegeometries will effect displacements and observed stiffnesses,there should be little effect on ultimate failure strength. FEA ofthese two geometries confirms this assertion; predicted failurestrength of the shorter and longer test pieces were 5485 N and5544 N respectively. This 1% difference is likely due to slight dif-ferences in observed thickness (Table 1).
The models used in this section are all three dimensional, al-though it would have been appropriate to use two dimensionalmodels. This is a result of project history, rather than necessity.
Two predominant failure modes may be observed during ten-sile fracture (Fig. 10). We infer that the first type corresponds tothe primarily brittle failure of the cobalt base, which is followed bythe ductile failure of the AgCu filler (Fig. 10). The specific locationof the test piece inside the weldment has a large effect on failurestrength (Fig. 10). Tensile testing does not reveal the presence of awell-defined quasi-steady region. Instead, weld quality appears toincrease towards the center of the weldment, in contrast withobservations during 4-pt bending.
There is reasonable correlation of failure strength with FEA, inthat observed failures occur between 44% and 73% of the predicted
load (Fig. 10). This difference is larger than the discrepancies ob-served between FEA and 4-point bending. This discrepancy islikely due to both the lamellar structure of the CoCu peritectic(Fig. 6), and the large amount of cracking there (Fig. 8). This regionplays only a limited role in failure during face or root bending, butis subject to high stresses in tension, and is the predicted initiallocation of failure (Fig. 11).
Fractography of these tensile specimens further illustrates themicrostructural details of these failure types (Fig. 12). SEM of theAgCu filler shows primarily dimples (Fig. 12A) associated with voidinitiation, growth and coalescence, typical of ductile failure. Ad-ditionally, the filler possesses several smooth voids (Fig. 12, arrowsV). These structures are believed the result of cobalt nodules ob-served in the filler [1], generally close to the base–filler interface.EDS shows these dimples to be composed of silver rich AgCu(Table 4), when compared with the Ag–40 at%Cu wire. This dis-crepancy probably results from Cu diffusion across the base–fillerboundary; however, this observation is not definitive due to por-osity–induced uncertainties. Cu diffusion into the Co base is sup-ported by WDS (Fig. 6), and by the subsequent EDS measurementshaving a much higher Cu/Ag ratio than the filler wire.
In contrast with the AgCu filler, the CoCu peritectic possessesfeatures associated with both brittle and ductile failure (Fig. 12B).This region is characterized by cleavage steps, covered with shal-low dimples (Fig. 12B). The cleavage steps are consistent withbrittle failure of lamellar structures, such as those observed inother welds (Fig. 6B). The dimples suggest the presence of a duc-tile layer of AgCu, an observation supported by high concentra-tions of AgCu measured by EDS (Table 4). These concentrationsalong this failure surface greatly exceed the AgCu concentrationsmeasured by WDS of the weld section (Fig. 7), which also suggeststhat failure has occurred along a small AgCu layer, such as abackfilled crack.
The combination of brittle and ductile failure modes is alsoobserved further from the filler (Fig. 12C). This region is suspectedto consist of relatively pure cobalt (Fig. 7), with intermixed AgCucracks, although the fractograph does not permit definitively de-termining the border of the Co base and CoCu peritectic. Brittlefailure is evidenced by multiple facets, whereas dimples, like be-fore, indicate a ductile failure mechanism. EDS measurementsshow varying concentrations of AgCu; notably an area with nodimples (Table 4, #6) has a much lower AgCu concentration. Weagain ascribe the observed failure, as well as the high AgCu con-centrations, to the failure of a backfilled crack.
Failure mechanisms even further from the filler appear brittle(Fig. 12), corresponding to the general lack of backfilled cracks in
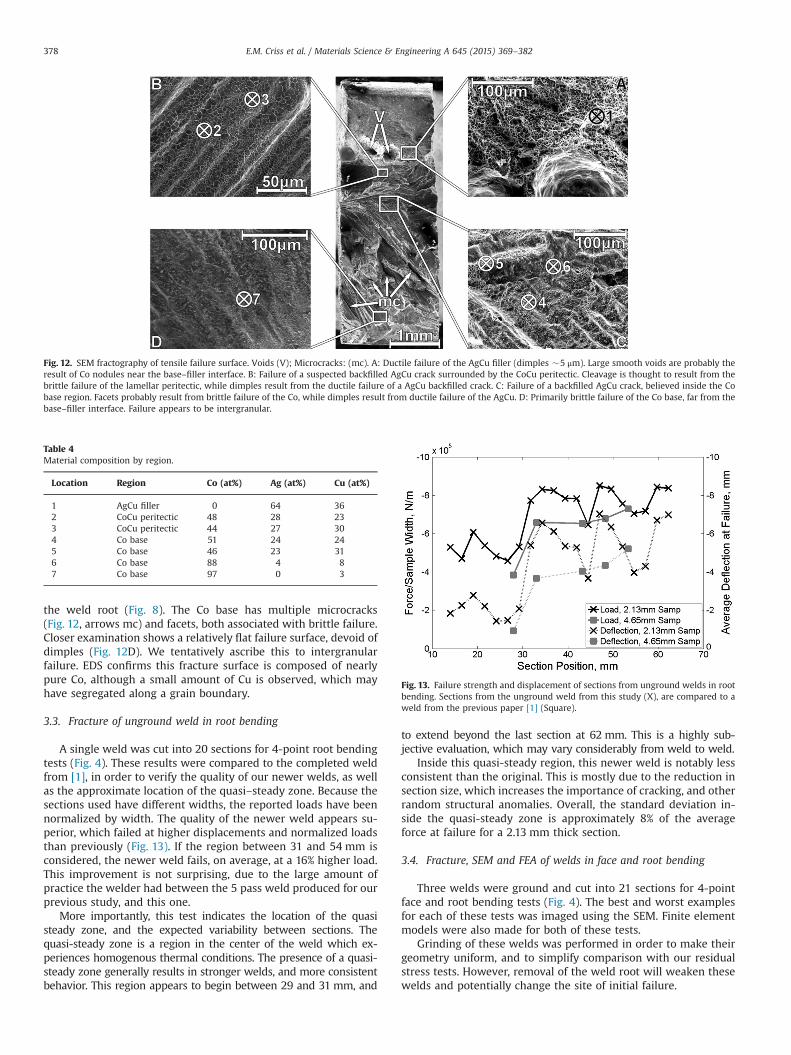
Fig. 12. SEM fractography of tensile failure surface. Voids (V); Microcracks: (mc). A: Ductile failure of the AgCu filler (dimples �5 μm). Large smooth voids are probably theresult of Co nodules near the base–filler interface. B: Failure of a suspected backfilled AgCu crack surrounded by the CoCu peritectic. Cleavage is thought to result from thebrittle failure of the lamellar peritectic, while dimples result from the ductile failure of a AgCu backfilled crack. C: Failure of a backfilled AgCu crack, believed inside the Cobase region. Facets probably result from brittle failure of the Co, while dimples result from ductile failure of the AgCu. D: Primarily brittle failure of the Co base, far from thebase–filler interface. Failure appears to be intergranular.
Table 4Material composition by region.
Location Region Co (at%) Ag (at%) Cu (at%)
1 AgCu filler 0 64 362 CoCu peritectic 48 28 233 CoCu peritectic 44 27 304 Co base 51 24 245 Co base 46 23 316 Co base 88 4 87 Co base 97 0 3
Fig. 13. Failure strength and displacement of sections from unground welds in rootbending. Sections from the unground weld from this study (X), are compared to aweld from the previous paper [1] (Square).
E.M. Criss et al. / Materials Science & Engineering A 645 (2015) 369–382378
the weld root (Fig. 8). The Co base has multiple microcracks(Fig. 12, arrows mc) and facets, both associated with brittle failure.Closer examination shows a relatively flat failure surface, devoid ofdimples (Fig. 12D). We tentatively ascribe this to intergranularfailure. EDS confirms this fracture surface is composed of nearlypure Co, although a small amount of Cu is observed, which mayhave segregated along a grain boundary.
3.3. Fracture of unground weld in root bending
A single weld was cut into 20 sections for 4-point root bendingtests (Fig. 4). These results were compared to the completed weldfrom [1], in order to verify the quality of our newer welds, as wellas the approximate location of the quasi–steady zone. Because thesections used have different widths, the reported loads have beennormalized by width. The quality of the newer weld appears su-perior, which failed at higher displacements and normalized loadsthan previously (Fig. 13). If the region between 31 and 54 mm isconsidered, the newer weld fails, on average, at a 16% higher load.This improvement is not surprising, due to the large amount ofpractice the welder had between the 5 pass weld produced for ourprevious study, and this one.
More importantly, this test indicates the location of the quasisteady zone, and the expected variability between sections. Thequasi-steady zone is a region in the center of the weld which ex-periences homogenous thermal conditions. The presence of a quasi-steady zone generally results in stronger welds, and more consistentbehavior. This region appears to begin between 29 and 31 mm, and
to extend beyond the last section at 62 mm. This is a highly sub-jective evaluation, which may vary considerably from weld to weld.
Inside this quasi-steady region, this newer weld is notably lessconsistent than the original. This is mostly due to the reduction insection size, which increases the importance of cracking, and otherrandom structural anomalies. Overall, the standard deviation in-side the quasi-steady zone is approximately 8% of the averageforce at failure for a 2.13 mm thick section.
3.4. Fracture, SEM and FEA of welds in face and root bending
Three welds were ground and cut into 21 sections for 4-pointface and root bending tests (Fig. 4). The best and worst examplesfor each of these tests was imaged using the SEM. Finite elementmodels were also made for both of these tests.
Grinding of these welds was performed in order to make theirgeometry uniform, and to simplify comparison with our residualstress tests. However, removal of the weld root will weaken thesewelds and potentially change the site of initial failure.

Fig. 14. Failure strength for sections in three ground welds in alternating face androot bending. Face bending (dotted line) is much more consistent then rootbending (solid line), and does not have an obvious dependency on section position.
Fig. 16. FEA predicted failure curves (outline) and observed curves (solid) for faceand root bending. The boundaries of the FEA curves were determined using our3 separate models. The middle division shows the onset of failure in the filler, dueto excessive plastic deformation. The solid regions were calculated using onlysections exhibiting cobalt failure.
E.M. Criss et al. / Materials Science & Engineering A 645 (2015) 369–382 379
Face bending results in fairly consistent behavior across theweld, with no significant positional dependence (Fig. 14). Rootbending exhibits a much higher degree of variability (Fig. 14), witha strong dependence on section position. The sections locatedclose to the weld start have a much lower strength than latersections for all three welds. This difference can be interpreted as aresult of the varying thermal fields at the beginning of the weldingprocess. The size of this weakened region varies, from approxi-mately 20–45 mm, depending on the particular weld. The stron-gest weld has another decrease in strength towards its end, whichis likely the result of higher temperatures at the end. The lack ofthis marked decrease for the other welds implies that their lowerstrength is caused by inadequate heating.
Finite element analysis reveals two possible mechanisms forfailure in root bending. Excessive stress at the center of the weldroot (Fig. 15A) can cause failure of the cobalt base in tension, orcontribute to the failure of preexisting cracks. Previous FEA pre-dicts weld failure to occur on one side of the weld root [1], thisdifference is believed due to the effects of grinding the weld prior
Fig. 15. FEA of Root and Face Bending showing only 2 of the 4 rollers (compare with Fig.arrow. A: FEA showing predicted von Mises stress at failure in root bending. B: FEA shpredicted von Mises stress at failure in face bending. D: FEA showing equivalent plastic
to fracture. FEA also predicts failure via excessive, compressivedeformation of the filler (Fig. 15B), however this mechanism doesnot appear to be as significant.
Predicted failure in face bending also occurs via two separatemechanisms. Excessive deformation of the filler adjacent to thebase/filler boundary (Fig. 15D) may contribute to weld delamina-tion, or tensile failure of the filler. Failure of the cobalt base incompression is also predicted (Fig. 15C).
Three separate models were created in order to estimate theuncertainties in the force vs. displacement curves (Tables 1 and 3).These models show slightly higher forces and displacements atfailure in root bending than face bending (Fig. 16). Trends closelyfollow predicted behavior for both face and root bending, if thepoorest quality root bending samples are excluded. However, ob-served displacements in root bending are generally lower thanface bending (Fig. 14), implying that failure is occurring prema-turely due to material quality.
3) All models utilize the average geometry (Table 2). Maximum values indicated byowing equivalent plastic strain (PEEQ) at failure in root bending. C: FEA showingstrain (PEEQ) at failure in face bending.

Fig. 17. SEM of failures in root and face bending. A: The weakest section in root bending. Note the number of backfilled cracks in the cobalt base. Examination of the failuresurface reveals porosity, and the presence of preexisting cracks without AgCu backfill. B: The strongest section in root bending. Note the matching failure surfaces of thecrack. The straight failure, under the filler region, implies intergranular fracture. C: The weakest section in face bending. Note the number of voids and imperfections,especially along the base/filler boundary. Failure appears predominantly by delamination. D: The strongest section in face bending. An outline showing the melted cobalt isalso observed. Failure is predominantly central, and excessive necking of the AgCu filler is observed. Some delamination occurs, but this does not appear to be predominant.Note also the shear failure of the cobalt root.
E.M. Criss et al. / Materials Science & Engineering A 645 (2015) 369–382380
SEM images of the strongest and weakest weld sections illus-trate the effects of defects and geometry (Fig. 17). The weakest rootbending section failed via cracking in the cobalt base (Fig. 17A),consistent with FEA predictions. However, failure occurred atsubstantially lower load than predicted, suggesting that materialquality of this specimen is low. Base–filler delamination also oc-curred, most likely after initial failure. This section also has largebackfilled cracks, evidence of voids along the failure surface, andsmaller, open cracks. It also has a large filler region, which willcontribute to a high stress concentration in the base. The failuresurface follows a small preexisting, backfilled crack close to thefiller. Although it is not possible to conclusively establish thepresence of cracking before flexure, the presence of other, opencracks suggests that failure followed a preexisting open crack.
In contrast, the strongest section (Fig. 17B) has a smaller thanaverage filler region, and only minimal backfilled cracks, towardthe side of the weld. As before, delamination has occurred afterfailure. Failure below the filler appears is centered and straight,suggesting that it has occurred along the centralized grainboundaries.
The weakest face bending section (Fig. 17D) also exhibits sig-nificant defects, as well as a larger than average filler region. In thiscase, failure occurred via base–filler delamination. The boundaryhas several significant voids which are directly along the path offailure. The filler pool also has several voids, which appear to playa minor role in failure, due to the presence of a horizontal crack.The presence of voids along the base–filler boundary suggestspoor base–filler adhesion. Furthermore, the shape of the left side isnot consistent with the general shape observed in these welds,indicating an error in welding technique.
The strongest face bending section (Fig. 17D) was imaged after0.03 μm polishing, revealing this weld's basic macrostructure.Overall, the geometry of this weld resembles the weld produced inthe previous study (Fig. 6A). The darker gray region indicates theextent of melting, which is roughly symmetric. The filler pool issmall, increasing the amount of cobalt available. Backfilled crack-ing is observed, but occurs only to the side of the filler pool. Somedelamination is also observed, as well as intergranular, tensile
failure and shear failure in the base. However, the main mode offailure involves necking of the filler. The high strength of this weldsection is due to a combination of favorable geometry, adequateadhesion, and high quality materials.
In all cases, weld quality is clearly influenced by geometricfactors and material imperfections. The large amount of dis-crepancy in the root bending test is due to the cobalt base beingprone to cracking. This behavior results in much greater sensitivityof the root bend test to thermal differences during weld manu-facture. The face bending test is also subject to similar effects, butthe ductile filler is unlikely to form cracks. The defects most likelyto cause poor performance are voids in the filler, and along thebase filler boundary.
3.5. Residual stress, heat treatment, and root bending
Four welds were ground and cut into 7 sections for heattreatment, residual stress measurement, and root bending tests(Fig. 4). Grinding our residual stress sections into a consistent crosssection is essential for analysis, but will potentially alter residualstresses. Two separate regions were defined for each weld; eachregion was either left as is, or subjected to a 325 °C heat treatmentfor 100 h. Five of these welds had their residual stresses measuredby crack compliance; data reduction was performed using FEA.
This low level heat treatment had no statistical effect onstrength. If all samples are considered, the t-test reveals a 24%likelihood strengths are influenced by heat treatment. If we re-move the Sections 1 and 2 from every weld, in order to reduce theeffect of material defects, the probability of this being a randomdistribution rises to 92%.
Residual stress measurements were successfully completed on5 sections (Fig. 18). Two of these sections have a slitting error atapproximately 0.1 mm. While this error is far from the area ofinterest, it does affect the trends at the beginning of the plot. Forthese samples we only report maximum stresses (Table 5).
Heat treatments do not appear to have affected the maximumstresses (Table 5). This conclusion correlates with earlier ob-servations in four-point bending. The welds are subjected to
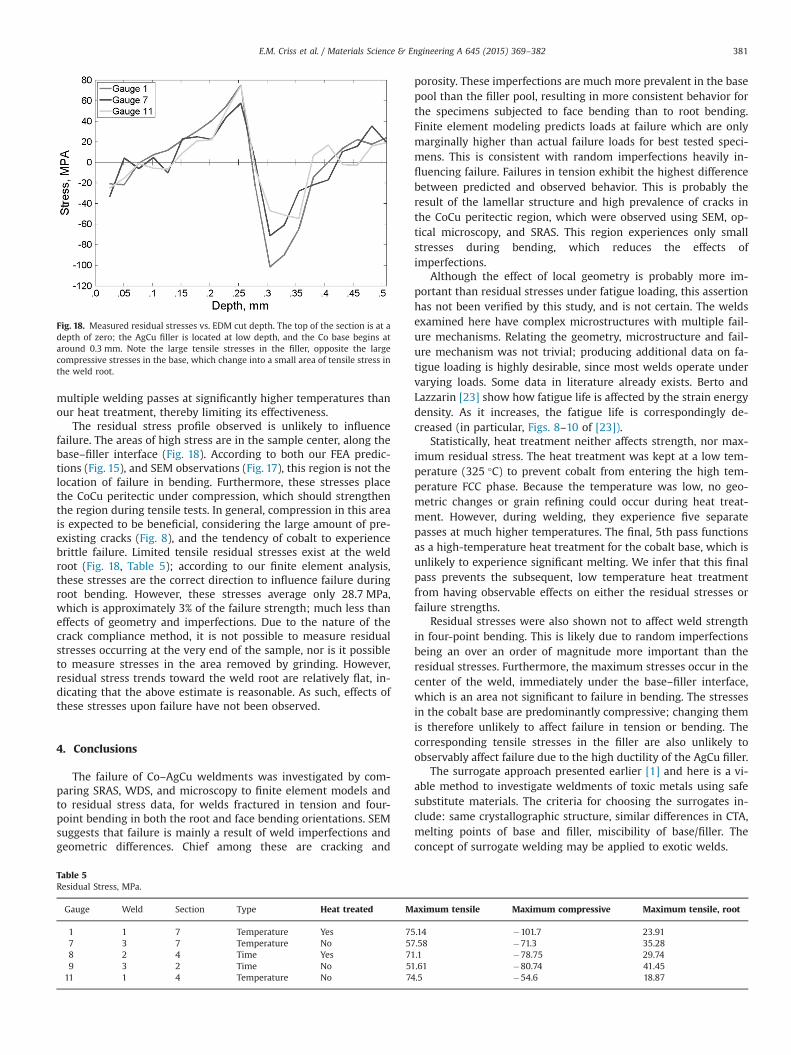
Fig. 18. Measured residual stresses vs. EDM cut depth. The top of the section is at adepth of zero; the AgCu filler is located at low depth, and the Co base begins ataround 0.3 mm. Note the large tensile stresses in the filler, opposite the largecompressive stresses in the base, which change into a small area of tensile stress inthe weld root.
E.M. Criss et al. / Materials Science & Engineering A 645 (2015) 369–382 381
multiple welding passes at significantly higher temperatures thanour heat treatment, thereby limiting its effectiveness.
The residual stress profile observed is unlikely to influencefailure. The areas of high stress are in the sample center, along thebase–filler interface (Fig. 18). According to both our FEA predic-tions (Fig. 15), and SEM observations (Fig. 17), this region is not thelocation of failure in bending. Furthermore, these stresses placethe CoCu peritectic under compression, which should strengthenthe region during tensile tests. In general, compression in this areais expected to be beneficial, considering the large amount of pre-existing cracks (Fig. 8), and the tendency of cobalt to experiencebrittle failure. Limited tensile residual stresses exist at the weldroot (Fig. 18, Table 5); according to our finite element analysis,these stresses are the correct direction to influence failure duringroot bending. However, these stresses average only 28.7 MPa,which is approximately 3% of the failure strength; much less thaneffects of geometry and imperfections. Due to the nature of thecrack compliance method, it is not possible to measure residualstresses occurring at the very end of the sample, nor is it possibleto measure stresses in the area removed by grinding. However,residual stress trends toward the weld root are relatively flat, in-dicating that the above estimate is reasonable. As such, effects ofthese stresses upon failure have not been observed.
4. Conclusions
The failure of Co–AgCu weldments was investigated by com-paring SRAS, WDS, and microscopy to finite element models andto residual stress data, for welds fractured in tension and four-point bending in both the root and face bending orientations. SEMsuggests that failure is mainly a result of weld imperfections andgeometric differences. Chief among these are cracking and
Table 5Residual Stress, MPa.
Gauge Weld Section Type Heat treated M
1 1 7 Temperature Yes 757 3 7 Temperature No 578 2 4 Time Yes 719 3 2 Time No 5111 1 4 Temperature No 74
porosity. These imperfections are much more prevalent in the basepool than the filler pool, resulting in more consistent behavior forthe specimens subjected to face bending than to root bending.Finite element modeling predicts loads at failure which are onlymarginally higher than actual failure loads for best tested speci-mens. This is consistent with random imperfections heavily in-fluencing failure. Failures in tension exhibit the highest differencebetween predicted and observed behavior. This is probably theresult of the lamellar structure and high prevalence of cracks inthe CoCu peritectic region, which were observed using SEM, op-tical microscopy, and SRAS. This region experiences only smallstresses during bending, which reduces the effects ofimperfections.
Although the effect of local geometry is probably more im-portant than residual stresses under fatigue loading, this assertionhas not been verified by this study, and is not certain. The weldsexamined here have complex microstructures with multiple fail-ure mechanisms. Relating the geometry, microstructure and fail-ure mechanism was not trivial; producing additional data on fa-tigue loading is highly desirable, since most welds operate undervarying loads. Some data in literature already exists. Berto andLazzarin [23] show how fatigue life is affected by the strain energydensity. As it increases, the fatigue life is correspondingly de-creased (in particular, Figs. 8–10 of [23]).
Statistically, heat treatment neither affects strength, nor max-imum residual stress. The heat treatment was kept at a low tem-perature (325 °C) to prevent cobalt from entering the high tem-perature FCC phase. Because the temperature was low, no geo-metric changes or grain refining could occur during heat treat-ment. However, during welding, they experience five separatepasses at much higher temperatures. The final, 5th pass functionsas a high-temperature heat treatment for the cobalt base, which isunlikely to experience significant melting. We infer that this finalpass prevents the subsequent, low temperature heat treatmentfrom having observable effects on either the residual stresses orfailure strengths.
Residual stresses were also shown not to affect weld strengthin four-point bending. This is likely due to random imperfectionsbeing an over an order of magnitude more important than theresidual stresses. Furthermore, the maximum stresses occur in thecenter of the weld, immediately under the base–filler interface,which is an area not significant to failure in bending. The stressesin the cobalt base are predominantly compressive; changing themis therefore unlikely to affect failure in tension or bending. Thecorresponding tensile stresses in the filler are also unlikely toobservably affect failure due to the high ductility of the AgCu filler.
The surrogate approach presented earlier [1] and here is a vi-able method to investigate weldments of toxic metals using safesubstitute materials. The criteria for choosing the surrogates in-clude: same crystallographic structure, similar differences in CTA,melting points of base and filler, miscibility of base/filler. Theconcept of surrogate welding may be applied to exotic welds.
aximum tensile Maximum compressive Maximum tensile, root
.14 �101.7 23.91
.58 �71.3 35.28
.1 �78.75 29.74
.61 �80.74 41.45
.5 �54.6 18.87

E.M. Criss et al. / Materials Science & Engineering A 645 (2015) 369–382382
Acknowledgments
We would like to thank Craig Hobson for his welding skill andexpertise, Bin Wang for her SEM images, and Anne Hofmeister andRobert Criss for valuable discussion. We would also like to thankLos Alamos National Laboratory for their support.
References
[1] E.M. Criss, M.A. Meyers, Braze welding of cobalt with a silver–copper filler, J.Mater. Res. Technol. 4 (1) (2015) 44–59.
[2] M.E. Kolanz, Introduction to beryllium: uses, regulatory history and disease,Appl. Occup. Environ. Hyg. 16 (5) (2001) 559–567.
[3] W.F. Gale, T.C. Totemeier (Eds.), Smithells Metals Reference Book, 8th ed.,Butterworth-Heinemann, Oxford, 2003.
[4] ASM specialty handbook, nickel, cobalt and their alloys, ASM, Materials Park,2000.
[5] Cobalt Monograph, Center D’Information du Cobalt, Brussels, 1960.[6] Cobalt Facts, Cobalt Development Institute, 2013.[7] K.B. Shedd, Minerals Yearbook, Cobalt (advance release) 2011, United States
Geological Survey, 2013.[8] P. Campbell, Permanent Magnet Materials and Their Application, Cambridge
University Press, Cambridge, 1996.[9] D.P. NaBadalung, J.I. Nicholls, Laser welding of a cobalt–chromium removable
partial denture alloy, J. Prosthet. Dent. 73 (3) (1998) 285–290.[10] M.I. MacEntee, E.B. Hawbolt, J.I. Zahel, The tensile and shear strength of a base
metal weld joint used in dentistry, J. Dent. Res. 66 (2) (1981) 154–158.[11] J. Black, G. Hastings (Eds.), Handbook of biomaterial properties, Chapman &
Hall, London, 1998.[12] E.R. Buchanan, An overview of hardfaced coatings for industrial use, in: Pro-
ceedings of the Third International Pump Symposium, College Station, Texas,May 1986 pp. 91–96.
[13] M. Riddihough, Stellite as a wear-resistant material, Tribology 3 (4) (1970)211–215.
[14] A. Roth, Vacuum Sealing Techniques, AIP Press, Woodbury, 1994.[15] O. Untracht, Jewelry Concepts & Technology, Doubleday, New York, 1985.[16] J.R. Davis (Ed.), Alloying: Understanding the Basics, ASM, Material Park, 2001.[17] M.J. Donachie, S.J. Donachie, Superalloys: a Technical Guide, 2nd ed., ASM,
Materials Park, 2002.[18] S.C. Levy, P. Bro, Battery Hazards and Accident Prevention, Plenum Press, New
York, 1994.
[19] M.A. Laughton, D.F. Warne, Electrical Engineer’s Reference Book, 16th ed.,Elsevier, Oxford, 2003.
[20] J. Sato, T. Omori, K. Oikawa, I. Ohnuma, R. Kainuma, K. Ishida, Cobalt-basehigh-temperature alloys, Science 312 (7) (2006) 90–91.
[21] H.-Y. Yan, V.A. Vorontsov, D. Dye, Alloying effects in polycrystalline γ'strengthened Co–Al–W base alloys, Intermetallics 48 (2014) 44–53.
[22] P. Lazzarin, F. Berto, Some expressions for the strain energy in a finite volumesurrounding the root of blunt V-notches, Int. J. Fract. 135 (1–4) (2005)161–185.
[23] F. Berto, P. Lazzarin, A review of the volume-based strain energy density ap-proach applied to V-notches and welded structures, Theor. Appl. Fract. Mech.52 (3) (2009) 183–194.
[24] F. Berto, P. Lazzarin, Recent developments in brittle and quasi-brittle failureassessment of engineering materials by means of local approaches, Mater. Sci.Eng.: R: Rep. 75 (2014) 1–48.
[25] R.J. Smith, W. Li, J. Coulson, M. Clark, M.G. Somekh, S.D. Sharples, Spatiallyresolved acoustic spectroscopy for rapid imaging of material microstructureand grain orientation, Meas. Sci. Technol. 25 (5) (2014) 055902 11 pp..
[26] W. Li, S.D. Sharples, R.J. Smith, M. Clark, M.G. Somekh, Determination ofcrystallographic orientation of large grain metals with surface acoustic waves,J. Acoust. Soc. Am. 132 (2) (2012) 738–745.
[27] J.T. Plewes, K.J. Bachmann, The effect of thermomechanical pretreatment onthe allotropic transformation in cobalt, Metall. Trans. 4 (1973) 1729–1734.
[28] Casti Metals Blue Book, Welding Filler Metals, 4th ed., Casti Publishing, Al-berta, 2003.
[29] Standard Test Method for Guided Bend Test for Ductility of Welds, Designa-tion: E190-92, ASTM International, 2008.
[30] J.T. Armstrong, Citzaf-a package of correction programs for the quantitativeelectron microbeam X-ray analysis of thick polished materials, thin films, andparticles, Microbeam Anal. 4 (3) (1995) 177–200.
[31] Q. Meng, S. Guo, X. Zhao, S. Veintemillas-Verdaguer, Bulk metastable cobalt infcc crystal structure, J. Alloy. Compd. 580 (2013) 187–190.
[32] Y.Z. Tian, S.D. Wu, Z.F. Zhang, R.B. Figueiredo, N. Gao, T.G. Langdon, Micro-structural evolution and mechanical properties of a two-phase Cu–Ag alloyprocessed by high-pressure torsion to ultrahigh strains, Acta Mater. 59 (2011)2783–2796.
[33] M.R. Hill, The slitting method, in: G.S. Schajer (Ed.), John Wiley & Sons Ltd,Chichester, 2013.
[34] M.B. Prime, Experimental Procedure for Crack Compliance (Slitting) Mea-surements of Residual Stress, LA-UR-03-8629, Los Alamos National Laboratory,2003.
[35] T. Nishizawa, K. Ishida, Co-Cu (cobalt–copper), in: 2nd ed.,in: T.B. Massalski(Ed.), Binary Alloy Phase Diagrams, vol. 2, ASM International, Materials Park,1990, pp. 1181–1183.