Failure Assessment of Cast Iron Water Mains Using Fracture ...
102
I Failure Assessment of Cast Iron Water Mains Using Fracture Mechanics by © Suborno Debnath A thesis submitted to the School of Graduate Studies in partial fulfillment of the requirement for the degree of Master of Engineering Faculty of Engineering & Applied Science Memorial University of Newfoundland June 2019 St. John’s, Newfoundland, Canada
Transcript of Failure Assessment of Cast Iron Water Mains Using Fracture ...
I
Failure Assessment of Cast Iron Water Mains Using Fracture Mechanics
by
© Suborno Debnath
A thesis submitted to the
School of Graduate Studies
in partial fulfillment of the requirement for the degree of
Master of Engineering
Faculty of Engineering & Applied Science
Memorial University of Newfoundland
June 2019
St. John’s, Newfoundland, Canada
II
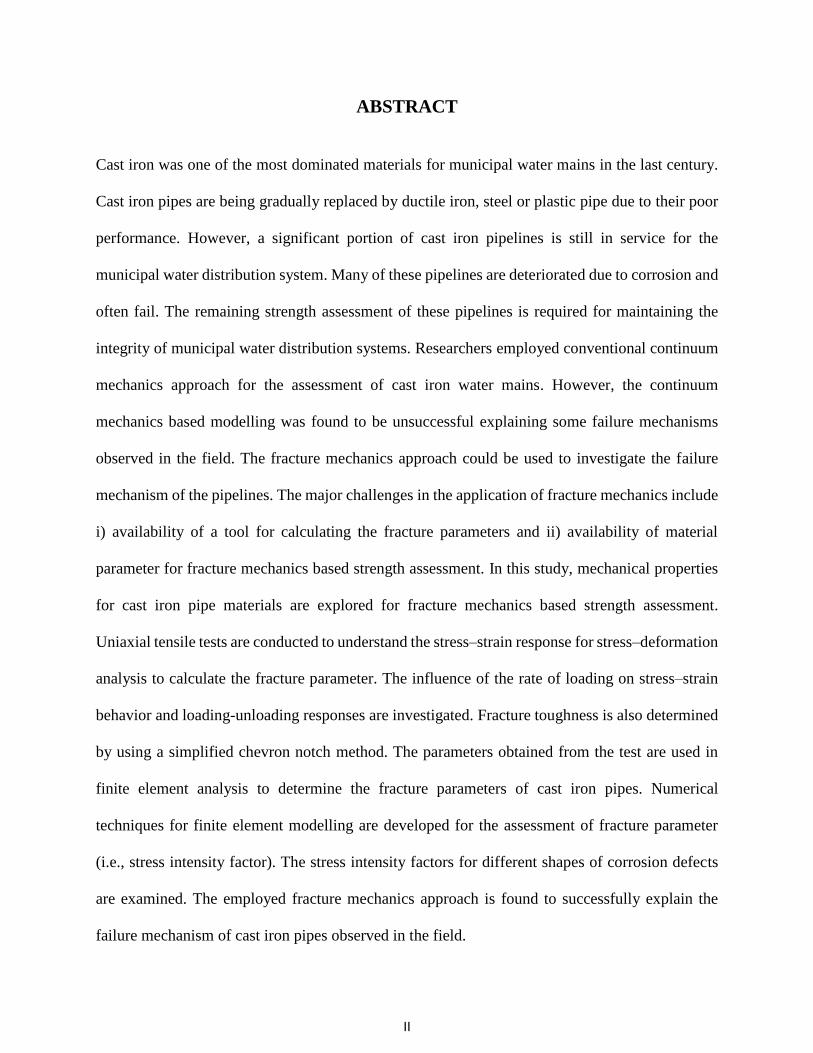
ABSTRACT
Cast iron was one of the most dominated materials for municipal water mains in the last century.
Cast iron pipes are being gradually replaced by ductile iron, steel or plastic pipe due to their poor
performance. However, a significant portion of cast iron pipelines is still in service for the
municipal water distribution system. Many of these pipelines are deteriorated due to corrosion and
often fail. The remaining strength assessment of these pipelines is required for maintaining the
integrity of municipal water distribution systems. Researchers employed conventional continuum
mechanics approach for the assessment of cast iron water mains. However, the continuum
mechanics based modelling was found to be unsuccessful explaining some failure mechanisms
observed in the field. The fracture mechanics approach could be used to investigate the failure
mechanism of the pipelines. The major challenges in the application of fracture mechanics include
i) availability of a tool for calculating the fracture parameters and ii) availability of material
parameter for fracture mechanics based strength assessment. In this study, mechanical properties
for cast iron pipe materials are explored for fracture mechanics based strength assessment.
Uniaxial tensile tests are conducted to understand the stress–strain response for stress–deformation
analysis to calculate the fracture parameter. The influence of the rate of loading on stress–strain
behavior and loading-unloading responses are investigated. Fracture toughness is also determined
by using a simplified chevron notch method. The parameters obtained from the test are used in
finite element analysis to determine the fracture parameters of cast iron pipes. Numerical
techniques for finite element modelling are developed for the assessment of fracture parameter
(i.e., stress intensity factor). The stress intensity factors for different shapes of corrosion defects
are examined. The employed fracture mechanics approach is found to successfully explain the
failure mechanism of cast iron pipes observed in the field.

III
ACKNOWLEDGEMENTS
First of all, I would like to take the opportunity to acknowledge the help and support of
several individuals who have contributed in many different ways to the work. I would like to
express my sincere and heartfelt gratitude to Dr. Ashutosh Sutra Dhar for his proper guidance and
valuable suggestions, sincere supervision, and co-operation throughout the research work. I have
been very fortunate that Dr. Dhar is my supervisor, and I have learnt many lessons in working
under his guidance that I will remember for the rest of my life. Thank you very much for being my
guide, mentor and role model.
I would also like to thank Dr. Kshama Roy, Dr. Rajib Dey, Mr. Abu Hena Muntakim, Mr.
Ripon Karmaker, Mr. Anan Morshed and Mr. Diponkar Saha for their invaluable suggestions,
insightful guidance and continuous encouragement throughout the program. I owe a debt of
gratitude to Dr. Kshama Roy, for encouraging me to hone my leadership skills by involving and
volunteering in different societies. He assisted me with every aspect of my graduate student life
and also with any kind of help that I needed.
I would also like to thank the staff and technicians, especially Mr. Steve Steele and Mr.
David Snook, who have helped me during my research. Furthermore, I highly appreciate the
support given by the research and administration staff of the Faculty of Engineering and Applied
Science, Memorial University who helped me in different ways.
I would not have been able to undertake this work without the financial support of the
Natural Sciences and Engineering Research Council of Canada (NSERC), the Faculty of
Engineering and Applied Science and the School of Graduate Studies.
I cannot express with words my gratitude towards my parents, brother and close friends,
for encouraging and supporting me throughout this journey.

IV
Table of Contents
ABSTRACT .................................................................................................................................... II
ACKNOWLEDGEMENTS .......................................................................................................... III
List of Figures .............................................................................................................................. VII
List of Tables ................................................................................................................................. X
CHAPTER 1
Introduction ..................................................................................................................................... 1
1.1 Background and Motivation ......................................................................... 1
1.2 Objectives ................................................................................................... 4
1.3 Outline of the thesis .................................................................................... 4
CHAPTER 2
Literature Review............................................................................................................................ 6
2.1 Introduction ................................................................................................ 6
2.2 Cast iron ..................................................................................................... 6
2.3 Failure Mechanisms of Cast Iron Pipelines ................................................. 11
2.3.1 Circumferential crack ................................................................................................... 11
2.3.2 Longitudinal crack ........................................................................................................ 11
2.3.3 Corrosion ...................................................................................................................... 11
2.3.4 Bell splitting ................................................................................................................. 12
2.3.5 Spiral Cracking ............................................................................................................. 12
2.3.6 Manufacturing defects .................................................................................................. 12
2.3.7 Human factors............................................................................................................... 13
2. 4. Fracture Mechanics Concepts ................................................................... 13
2.5 Summary ................................................................................................... 15

V
CHAPTER 3
Material Properties for Fracture Mechanics based Strength Assessment of Cast Iron Water
Mains............................................................................................................................................. 16
3.1. Introduction ............................................................................................. 16
3.2. Fracture parameters .................................................................................. 18
3.3. SEM Scanning .......................................................................................... 21
3.4. Tensile tests ............................................................................................. 26
3.4.1. Test description............................................................................................................ 26
3.4.2. Strain rate effect ........................................................................................................... 28
3.4.3. Loading-unloading-reloading responses...................................................................... 31
3.4.4. Modulus of elasticity and elastic limit ......................................................................... 32
3.4.5. Poisson’s ratio.............................................................................................................. 34
3.5. Determination of fracture toughness .......................................................... 35
3.5.1. Single-Edge Notch Beam (SENB) test ........................................................................ 35
3.5.2. Validation with FE analysis ......................................................................................... 37
3.6. Analysis of Pipes with a Corrosion Pit ...................................................... 39
3.7. Conclusion ............................................................................................... 44
CHAPTER 4
Assessment of Stress Intensity Factor for Buried Cast Iron Water Pipes Using Abaqus ............. 51
4.1 Introduction .............................................................................................. 51
4.2 Finite element (FE) modelling .................................................................... 52
4.2.1 FE model development ................................................................................................. 54
4.2.2 SIF calculation for buried pipeline ............................................................................... 62
4.3 SIF for buried pipes ................................................................................... 67
4.5 Conclusion ................................................................................................ 73

VI
CHAPTER 5
Conclusions and Recommendations for Future Research ............................................................ 77
5.1 Conclusions .............................................................................................. 77
5.1.1 Assessment of material parameter ................................................................................ 77
5.1.2 Method for calculating SIFs ......................................................................................... 79
5.2 Recommendations for Future Study ............................................................ 79
References (for Chapter 1 and 2) .................................................................................................. 81
APPENDIX A ............................................................................................................................... 85
VII
List of Figures
Figure 1.1: Distribution of failure mode (Folkman 2018) .............................................................. 2
Figure 1.2: Pipeline subjected to non-uniform bedding (Liyanage 2016) ...................................... 3
Figure 2.1. The tensile strength of cast iron (CES EduPack) ......................................................... 8
Figure 2.2. The compressive strength of cast iron (CES EduPack) ................................................ 8
Figure 2.3. The yield strength of cast iron (CES EduPack) ............................................................ 9
Figure 2.4. Young’s modulus of cast iron (CES EduPack) ............................................................ 9
Figure 2.5. Fracture toughness of cast iron (CES EduPack)......................................................... 10
Figure 2.6. Fatigue strength of cast iron (CES EduPack) ............................................................. 10
Figure 3.1. Struers TegraForce-5 machine for grinding and polishing ......................................... 21
Figure 3.2. Phenom ProX desktop scanning electron microscope” (Quanta 400)........................ 22
Figure 3.3. Microstructure spun cast iron after polishing (100x magnification ........................... 23
Figure 3.4. The selected area to determine the chemical composition ......................................... 25
Figure 3.5. ASTM E E8 / E8M –16a recommended tension specimen ........................................ 27
Figure 3.6. Tensile test by INSTRON (5585H) machine ............................................................. 28
Figure 3.7. Stress–strain response of Sample 1 at various strain rate (After Ali 2017) ................ 29
Figure 3.8. Stress–strain response of Sample 1 with the loading rate change .............................. 30
Figure 3.9. Stress–strain behaviour of Sample 2 .......................................................................... 30
Figure 3.10. Stress–strain behaviour in loading-unloading-reloading (Sample 2) ....................... 33
Figure 3.11. Poisson’s ratio .......................................................................................................... 35
Figure 3.12. Test specimen used ................................................................................................... 36
Figure 3.13. 3D finite element modeling of single-edge notch beam (SENB) test ...................... 38

VIII
Figure 3.14. Comparison of fracture toughness from test and Abaqus ........................................ 39
Figure 3.15. Symmetric void (90) with respect to pit hole ......................................................... 41
Figure 3.16. Major principal stress around a pit ........................................................................... 42
Figure 3.17. Crack extension direction in Contour integral method ............................................. 43
Figure 4.1: An example of crack only defect ................................................................................ 53
Figure 4.2: An example of crack in corrosion defect.................................................................... 53
Figure 4.3: Parametric angle () of an elliptical crack ................................................................. 54
Figure 4.4: Global model and sub-model ..................................................................................... 56
Figure 4.5: Crack extension direction of an elliptical crack (a/c = 1)........................................... 57
Figure 4.6: Crack front and seam location .................................................................................... 58
Figure 4.7: Five contours and crack location ................................................................................ 59
Figure 4.8: SIFs of four contour around the crack front ( = 0) ................................................... 60
Figure 4.9: SIF at various contour ( = 0) .................................................................................... 60
Figure 4.10: Comparison of SIFs (obtained from the equation of Raju and Newman (1982) and
current FEA) ................................................................................................................................. 62
Figure 4.11: Global model of a buried pipeline for the determination of SIFs for a crown or
invert crack.................................................................................................................................... 64
Figure 4.12: Global model of a buried pipeline for springline SIFs calculation .......................... 64
Figure 4.13: Sub-model boundary condition ................................................................................ 65
Figure 4.14: Crack front and corrosion location for a crack in corrosion defect .......................... 66
Figure 4.15: Crack propagation using XFEM............................................................................... 67
Figure 4.16: SIFs for a longitudinal and circumferential crack .................................................... 68
Figure 4.17: SIFs in springline and invert position, considering combined loading condition .... 69

IX
Figure 4.18: SIF for ‘crack only defect’ for a springline crack .................................................... 70
Figure 4.19: SIF for ‘crack in corrosion defect’ for a springline crack ........................................ 72
Figure 4.20: Comparison of ‘crack only defect’ and ‘crack in corrosion defect’ ......................... 72

X
List of Tables
Table 2.1. Comparison of mechanical properties of cast iron (Seica et. al. 2004) ......................... 7
Table 3.1. Description of Graphite Flakes (ASTM A 247 − 17, Marker et al. 2000)................... 24
Table 3.2. Chemical composition (% by weight) of Sample 1 and Sample 2 .............................. 26
Table 3.3: Mechanical parameter obtained from tensile test ........................................................ 31
Table 3.4. Fracture toughness, Kc from SENB tests .................................................................... 37
Table 3.5. Material Parameters for FE modelling ......................................................................... 41
Table 3.6. Stress intensity factor in MPa√m ................................................................................. 44
Table 4.1. Material Parameters ..................................................................................................... 62
Table 4.2. Pipe dimensions and defect geometries ....................................................................... 67
Table 4.3. Influence coefficient for external surface crack (t/R =1) ............................................. 71
1
CHAPTER 1
Introduction
1.1 Background and Motivation
Cast iron pipeline is found in all parts of the world that fulfill the basic needs by
transporting fluid. First authentically recorded cast iron pipe was laid at Langensalza, Germany in
1962, although its full-scale use was started long ago in 1664 at Versailles, France (Koeble and
Hogan 1967). It was first installed in the USA at the beginning of the nineteenth century that was
imported from England and Scotland and grew rapidly in the 1890s (Koeble and Hogan 1967). In
Canada, first cast iron pipeline was built in 1853, the largest pipeline in that time around the world
(Finkel 2018). Since then, the cast iron pipeline is one of the dominating infrastructures that
transmit fluid. At present, the age of cast iron pipe ranges from around fifty years to over hundred
years, many of which are in replacement era.
The aged pipelines require fitness-for-services (FFS) assessment as these are prone to
failure. However, failure assessment tools for FFS assessment of cast iron pipes are not well
developed and are not able to predict the failure modes observed in the field. Folkman (2018)
conducted a comprehensive survey of different municipalities in the USA and Canada to identify
the failure modes of water mains. Figure 1.1 provides a summary of different failure modes
observed (Folkman 2018). As seen in this figure, circumferential cracking is the major failure
mode for cast iron water mains. Circumferential cracking may occur due to bending stress
developed by the loss of bedding support, differential ground movement, or axial stress due to
temperature change.

2
Figure 1.1: Distribution of failure mode (Folkman 2018)
Pipelines are subjected to non-uniform bedding when the backfill material contains a significant
portion of fine soil that can be eroded under gravity or carried by the water flow and creates a void
around the pipe (Figure 1.2). If it continues and causes progressive volume loss, settlement may
occur (Kamel et al. 2008) leading to longitudinal bending. Balkaya et al. (2012) and Liyanage and
Dhar (2018) conducted continuum based finite element analysis and revealed that longitudinal
stress developed due to bending is insufficient to cause circumferential cracking of the water
mains. An erosion void along with localized concentrated support might cause a stress leading to
cracking (Liyanage and Dhar 2018).
Corrosion is identified as one of the major problems in the water transportation system,
which reduce the strength of the pipeline. Pipelines can corrode internally or externally. Soil-
pipeline system acts as an electrochemical cell and creates external corrosion. Internal corrosion
occurs due to the influence of water.
0
5
10
15
20
25
30
35
40
Circumferential
crack
Corrosion Longitudinal
crack
other Bell split Rock
Impingement
% o
f fa
ilure

3
Figure 1.2: Pipeline subjected to non-uniform bedding (Liyanage 2016)
Both types of corrosion lead to leakage that affect the safety of the pipe and causes water losses.
Marker et al. (2005) reveals that corrosion pit on the pipe wall may be the cause of circumferential
cracking of cast iron water mains observed in the field. Liyanage and Dhar (2017) employed finite
element modelling and showed that although corrosion pit causes redistribution of stresses around
the pit, the developed stress is not significant to cause circumferential cracking. A corrosion pit
along with an erosion void and a localized concentrated force can lead to circumferential cracking
(Liyanage and Dhar 2018). Corrosion of the pipe can lead to the development of sharper notch
and/or crack-like defects on the pipe wall (Conlin and Paker 1991). The effect of corrosion notch
and/or crack like defect can be modelled through the application of fracture mechanics. However,
fracture mechanics has not been applied extensively for studying the failure mechanism of cast
iron water main. The major challenges in the application of fracture mechanics include: i)
unavailability of the material parameter (fracture toughness) required for failure assessment ii)
unavailability of tools for assessing fracture parameter (i.e., stress intensity factor). This research
focuses on addressing the challenges for cast iron water mains.

4
1.2 Objectives
The major objective of the current research is to develop tools for fracture mechanics based failure
assessment of cast iron water mains. An experimental program is undertaken to develop material
parameters for fracture mechanics based assessment, and a three-dimensional finite element
modelling technique is used to develop fracture parameters for different shapes of defects. The
specific objectives of this research are:
Identify parameters for cast iron pipe materials for stress–deformation analysis to
calculate fracture parameters
Develop finite element (FE) modelling technique to determine the fracture parameter for
buried cast iron water mains
Assess the fracture parameters for different corrosion defects of a buried pipe.
Evaluate existing equation for fracture assessments for in-air pipe and develop improved
methods for buried pipes.
1.3 Outline of the thesis
This thesis is prepared in manuscript format. The outcome of the study is presented in five
chapters and one appendix (Appendix A). The outline is as follows:
Chapter 1 highlights the backgrounds, motivation and objectives of the research work.
Chapter 2 presents a brief review. However, as the thesis is prepared in manuscript format,
the problem-specific literature reviews are provided in Chapters 3 and 4.

5
Chapter 3 presents the material properties for fracture mechanics based strength assessment
of cast iron water mains. This chapter has been submitted to a journal paper as a technical
paper for review. A part of this research work has been published in the 71st Canadian
Geotechnical Conference, GeoEdmonton 2018, Edmonton, Alberta, Canada, September
23–26, 2018 (attached in Appendix A).
Chapter 4 presents the assessment of stress intensity factor for buried cast iron water pipes
using Abaqus FE software. This research work has been prepared for submission to the
72nd Canadian Geotechnical Conference.
Chapter 5 summarizes the outcomes of the research and recommendations for future
studies.
As the thesis is prepared in manuscript format, the references cited in Chapters 3 and 4 are listed
at the end of each chapter. The references cited in Chapters 1 and 2 are listed in the ‘Reference’
section at the end of the thesis.
Co-Authorship: The research presented in this thesis has been performed by the author of this
thesis, Mr. Suborno Debnath under the supervision of Dr. Ashutosh Sutra Dhar. He also prepared
the draft manuscript. Some test data from Ali are used for validation of FE model for SENB tests
and compare with some test data obtained from the current research. Ali’s data are properly cited
within the text and figures, as applicable.

6
CHAPTER 2
Literature Review
2.1 Introduction
As the thesis has been written in manuscript format, problem-specific literature review is
presented in Chapters 3 and 4. This chapter provides a brief overview of mechanical properties of
cast iron, theoretical background of fracture mechanics, failure mechanism of cast iron pipeline
and additional previous research relevant to the present study. In this thesis, unless stated
otherwise, pipelines refer to water main pipelines.
2.2 Cast iron
Cast iron is an iron alloy that has more than 2% carbon as the main alloying element and
1– 3% silicon with a wide variety of properties (Arias-Gonzalez et al. 2016). Mechanical properties
of cast iron, i.e., tensile and compressive strength, Poison’s ratio, ductility, Young’s modulus, and
fracture toughness depend strongly on its microstructure. Research undertaken to determine the
material parameters for cast iron materials, reveals the wide variation of the parameters
(Yamamoto et al. l983, Caproco Corrosion 1985, Conlin and Baker 1991, Ma and Yamada 1994,
Rajani et al. 2001, Seica et al. 2004). Table 2.1 shows a summary of the material parameter of cast
iron reported by different researchers. Variability in the material properties of cast iron are also
observed in the material database available in CES EduPack Software (Granta 2018). CES
EduPack has been developed by Granta Design Limited, a leading materials information
technology company in Cambridge, UK that includes material data collected for over twenty years
in collaboration with leading materials and process data providers (i.e., American Society of
Mechanical Engineers (ASME), ASM International, M-Base Engineering & Software GmBH,
7
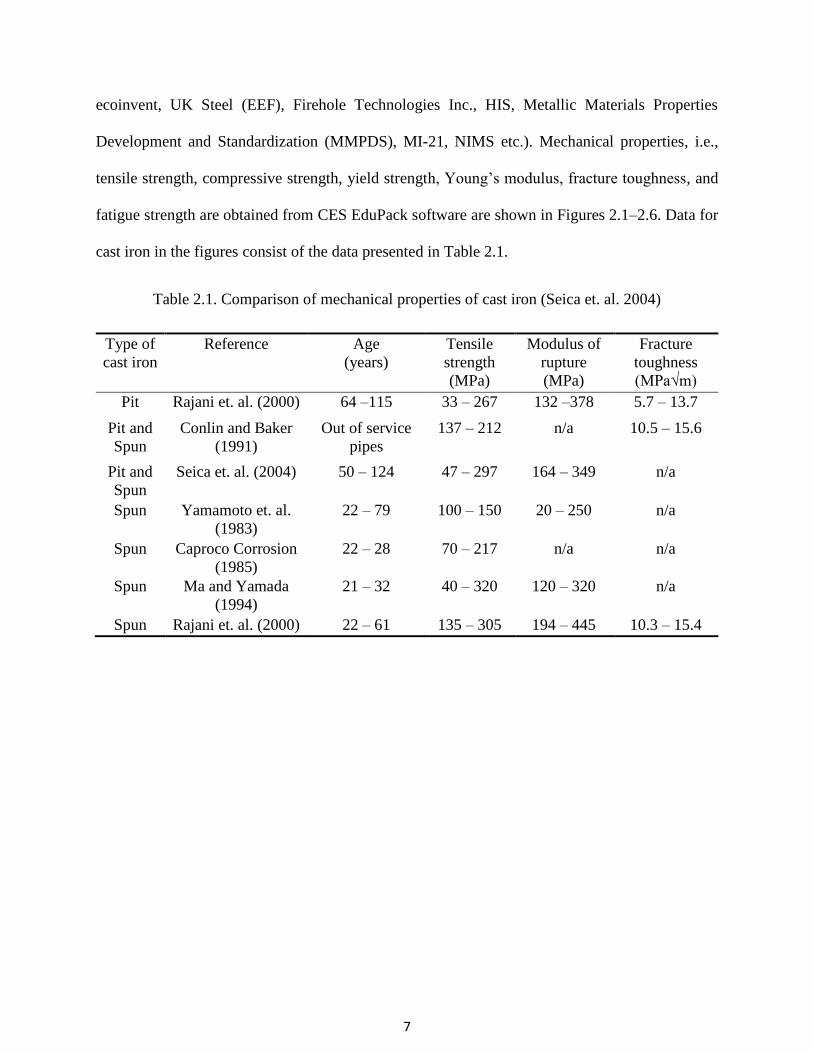
ecoinvent, UK Steel (EEF), Firehole Technologies Inc., HIS, Metallic Materials Properties
Development and Standardization (MMPDS), MI-21, NIMS etc.). Mechanical properties, i.e.,
tensile strength, compressive strength, yield strength, Young’s modulus, fracture toughness, and
fatigue strength are obtained from CES EduPack software are shown in Figures 2.1–2.6. Data for
cast iron in the figures consist of the data presented in Table 2.1.
Table 2.1. Comparison of mechanical properties of cast iron (Seica et. al. 2004)
Type of
cast iron
Reference Age
(years)
Tensile
strength
(MPa)
Modulus of
rupture
(MPa)
Fracture
toughness
(MPa√m)
Pit Rajani et. al. (2000) 64 –115 33 – 267 132 –378 5.7 – 13.7
Pit and
Spun
Conlin and Baker
(1991)
Out of service
pipes
137 – 212 n/a 10.5 – 15.6
Pit and
Spun
Seica et. al. (2004) 50 – 124 47 – 297 164 – 349 n/a
Spun Yamamoto et. al.
(1983)
22 – 79 100 – 150 20 – 250 n/a
Spun Caproco Corrosion
(1985)
22 – 28 70 – 217 n/a n/a
Spun Ma and Yamada
(1994)
21 – 32 40 – 320 120 – 320 n/a
Spun Rajani et. al. (2000) 22 – 61 135 – 305 194 – 445 10.3 – 15.4

8
Figure 2.1. The tensile strength of cast iron (CES EduPack)
Figure 2.2. The compressive strength of cast iron (CES EduPack)
Types of materials
Types of materials

9
Figure 2.3. The yield strength of cast iron (CES EduPack)
Figure 2.4. Young’s modulus of cast iron (CES EduPack)
Types of materials
Types of materials

10
Figure 2.5. Fracture toughness of cast iron (CES EduPack)
Figure 2.6. Fatigue strength of cast iron (CES EduPack)
Types of materials
Types of materials

11
2.3 Failure Mechanisms of Cast Iron Pipelines
Folkman (2018) conducted an extensive study on the failure mechanisms of pipeline in
North America. Folkman (2018) showed that circumferential crack, longitudinal crack, corrosion
(internal or external), bell splitting, manufacturing defects and human error are mainly responsible
for the failure of cast iron pipes. These pipe failures are briefly discussed below.
2.3.1 Circumferential crack
Circumferential crack occurs due to high longitudinal stress on the pipe wall that may be
caused by bending of the pipe (Talbot, 1926) and/or axial tension resulting from temperature
change (Jesson et al. 2010). The bending may be caused due to rock impingement, loss of bedding
support, ground movement, differential settlement, expansive soils or changes in water
temperature. Small diameter pipe (< 200 mm in diameter) is more vulnerable on circumferential
crack, responsible for up to 80% of the failures (Rajani and McDonald 1995). Corrosion pits and
graphitization may influence the circumferential crack. About 90% of the circumferential failures
are reported to occur with the presence of a corrosion pit (Makar et al. 2001).
2.3.2 Longitudinal crack
Excessive circumferential stress due to internal water pressure along with geostatic stress
causes a longitudinal crack. Large diameter pipes are mainly affected by longitudinal crack (Makar
et al. 2001). External loading like geostatic stress, snow load, and traffic load accelerate the process
of longitudinal cracking.
2.3.3 Corrosion
Corrosion is one of the predominate factors that reduces the service life of cast iron water
mains. Metal loss occurs due to an attack by the environment on pipeline materials. About 28% of
12
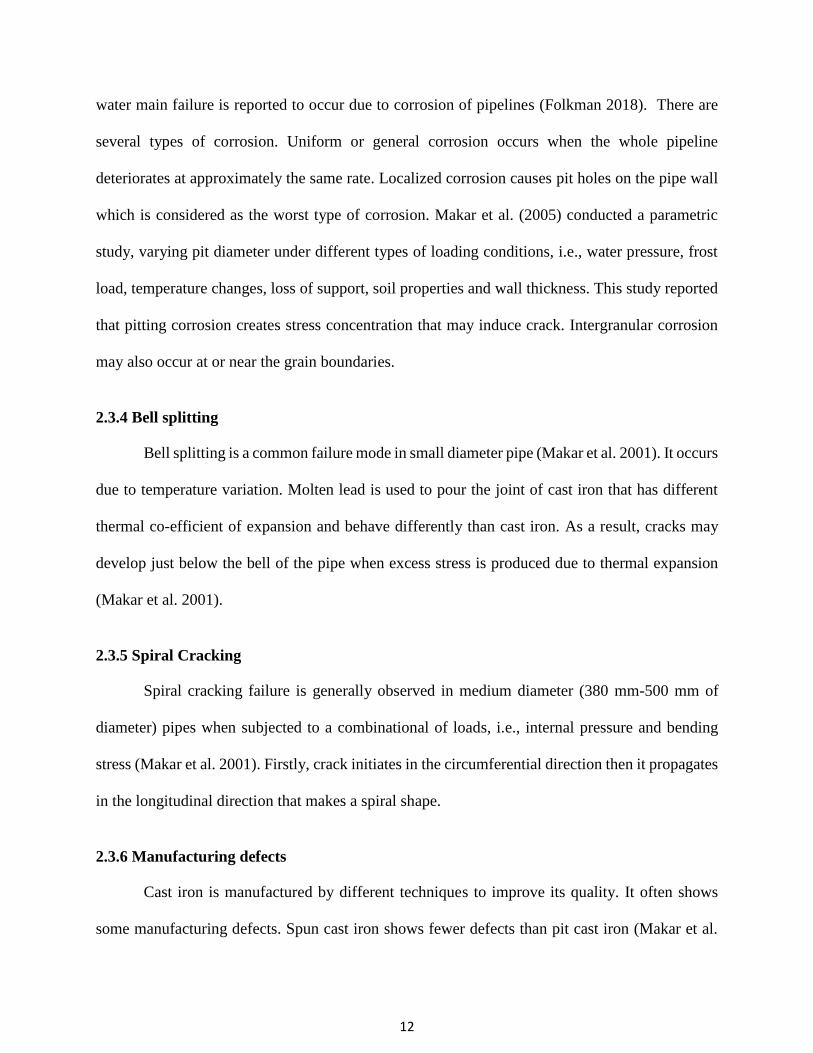
water main failure is reported to occur due to corrosion of pipelines (Folkman 2018). There are
several types of corrosion. Uniform or general corrosion occurs when the whole pipeline
deteriorates at approximately the same rate. Localized corrosion causes pit holes on the pipe wall
which is considered as the worst type of corrosion. Makar et al. (2005) conducted a parametric
study, varying pit diameter under different types of loading conditions, i.e., water pressure, frost
load, temperature changes, loss of support, soil properties and wall thickness. This study reported
that pitting corrosion creates stress concentration that may induce crack. Intergranular corrosion
may also occur at or near the grain boundaries.
2.3.4 Bell splitting
Bell splitting is a common failure mode in small diameter pipe (Makar et al. 2001). It occurs
due to temperature variation. Molten lead is used to pour the joint of cast iron that has different
thermal co-efficient of expansion and behave differently than cast iron. As a result, cracks may
develop just below the bell of the pipe when excess stress is produced due to thermal expansion
(Makar et al. 2001).
2.3.5 Spiral Cracking
Spiral cracking failure is generally observed in medium diameter (380 mm-500 mm of
diameter) pipes when subjected to a combinational of loads, i.e., internal pressure and bending
stress (Makar et al. 2001). Firstly, crack initiates in the circumferential direction then it propagates
in the longitudinal direction that makes a spiral shape.
2.3.6 Manufacturing defects
Cast iron is manufactured by different techniques to improve its quality. It often shows
some manufacturing defects. Spun cast iron shows fewer defects than pit cast iron (Makar et al.

13
2001). Porosity is one of the most common defects found in pit cast iron. Another manufacturing
defect is inclusions that weaken the pipe metal and may create stress concentration. Ferrosilicon
that is not fully dissolved creates spherical inclusion when it cools rapidly (Makar et al. 2001).
Pinholes, form by chemical reactions between oxidized metal and carbon which can affect the
strength of cast iron. Besides, foreign materials may be present due to insufficient cleaning of
molds.
2.3.7 Human factors
Several human factors were found to contribute toward the failure of cast iron water mains.
The human factor includes improper design, poor installation, third-party damage from excavation
or repairing and negligence in maintenance.
The current study has focused on assessing the cracking due to corrosion of cast iron water
mains.
2. 4. Fracture Mechanics Concepts
Pipeline failure occurs due to loss of strength and/or extreme loading. A failure occurs
when the pipe wall stress exceeds the strength of the pipe material. The conventional method
employs continuum theory to calculate wall stresses that is compared with the strength of
materials. Seica and Packer (2004), Makar and McDonald (2007), Ji et al. (2015), Zhang et al.
(2017), Liyanage and Dhar (2017 & 2018) and others employed different technique utilizing the
continuum mechanics theory to calculate the pipe wall stress for cast iron pipeline. However, a
higher circumferential stress was calculated using these methods, which does not explain the
reason for the circumferential cracking of water mains observed in the fieldPipe with corrosion
notches and crack-like defects, may fail at a stress, below its yield strength, where failure would
not normally be expected (Dowling 2013). Researchers are now employing fracture mechanics for

14
failure assessment of pipes. Fracture mechanics has been widely used in recent times and was
found as a more appropriate way to explain failure mechanism (Fahimi et al. 2016, Wang et al.
2017, Mondal 2017).
The concept of fracture mechanics initially introduced by Inglis (1913) and later developed
by Griffith (1921), Westergaard (1939) and Irwin (1957). The stress intensity factor (SIF) is
introduced as a measure of the severity of the stress near the crack. The SIF is defined by
K = lim𝑟,𝜃→0
σ√2𝜋𝑟 …………………………………………………………….. [2.1]
This equation is generally expressed as
K = F σ√𝜋𝑎…………………………………...…………………………….….. [2.2]
Where K is the stress intensity factor for a particular mode of cracking, a is the initial crack length,
F is a geometric factor, and is the nominal stress at failure.
Another parameter is also used for fracture assessment of linear elastic material, which is the strain
energy release rate. The strain energy release rate, G is related with K by the following equation,
G = K2
E′ ……………………………………………………………….……….. [2.3]
E′ can be obtained from the material’s elastic modulus E, and Poisson’s ratio, ν. If the thickness of
a structure in the z direction is small relative to other directions, the normal and shear stress and
their gradients are often assumed to be zero in the z-direction and the stress is defined as plane
stress. If the thickness in the z direction is large relative to other directions, plane strain condition
exists where the strain in z direction is zero (Terfas, 2010).
For plane stress condition
E′ = E ……………………………………………………………………….. [2.4]
For plane strain condition
15
E′ = E
1-ν2 ………………………………………………………….…….….. [2.5]
The above approach is applicable for linear elastic material and termed as linear elastic fracture
mechanics (LEFM). For low toughness materials, i.e., brittle material, the region of yielding
(plastic zone) is not excessively large and LEFM is applicable. For ductile material showing higher
toughness, LEFM may not be applicable. Elastic-plastic fracture mechanics (EPFM) is required
for assessing the ductile material. As cast iron is a brittle material, the LEFM approach is applicable
for the assessment of cast iron water main.
2.5 Summary
An overview of cast iron material, failure modes, and failure assessment technique is
presented in this chapter. The physical and mechanical properties of cast iron are reported to vary
significantly, which is due to the variation of metallurgy. It is thus important to understand the
microstructure to predict the strength behaviour of the pipe material. Failure of cast iron water
mains is found to be associated with corrosion and crack. The conventional continuum mechanics
is often not successful in predicting the failure mechanism in the cast iron pipe. Fracture mechanics
is being utilized to better understand the failure mechanism of the water mains. As cast iron is a
brittle material, LEFM can be used for assessing the cast iron pipes.

16
CHAPTER 3
Material Properties for Fracture Mechanics based Strength Assessment of
Cast Iron Water Mains
3.1. Introduction
Cast iron was extensively used as the dominant material for municipal water mains until
the middle of the twentieth century. Although cast iron pipes are no longer manufactured or used
for water mains, a huge volume of cast iron pipes exists in the water distribution system in North
America (Folkman 2018). These aged infrastructures are subjected to deterioration due to
corrosion and are susceptible to leakage and breakage. Determining the strength of the
deteriorating water mains which is required for developing a rehabilitation and replacement
strategy of these structures has been a challenge for municipalities. The conventional method of
assessing the strength of the pipes is to compare the ultimate tensile and compressive strengths
with the maximum stresses in the pipe wall. The stress experienced by the pipe wall is calculated
using the theory of continuum mechanics (Seica and Packer 2004, Makar and McDonald 2007, Ji
et al. 2015, Zhang et al. 2017a, Liyanage and Dhar 2017 & 2018).
Old cast iron pipe failures are associated with through-wall notches caused by corrosion
and sharper crack-like defects caused by a stress-dependent corrosion (Conlin and Baker 1991).
For the pipe with corrosion notches and crack-like defects, the stress to cause failure was reported
to be significantly less than the nominal tensile strength of the pipe material (Jesson et al. 2010).

17
Rajani and Kleiner (2010) applied the fracture mechanics approach to explain these failures in cast
iron pipes. Fracture mechanics-based strength assessment methods of deteriorating pipelines has
been widely explored in recent years and was found to reasonably explain the observed failure
mechanism (i.e., Fahimi et al. 2016, Wang et al. 2017, Mondal 2018). In fracture mechanics, the
strength of a material against crack initiation and crack propagation is expressed using the fracture
toughness of the material that is calculated using stress–deformation analyses of the structure.
However, very limited information is currently available for cast iron water main materials on the
fracture toughness and the parameters for stress–deformation analysis (i.e., Young’s modulus, E
and Poisson’s ratio,).
The objective of the current study is to address the existing gaps in the material properties
and develop an effective method for determination of parameters for fracture mechanics based
strength assessment of cast iron water mains. The properties for two cast iron water mains exhumed
from two nearby cities (City of St. John’s and City of Mount Pearl) in the Province of
Newfoundland and Labrador in Canada are determined through an experimental program. Uniaxial
tensile tests are performed with samples extracted from the pipe walls to examine the stress–strain
responses under monotonic loads and loading-unloading-reloading cycles applied at various strain
rates. Electronic strain gauges are used to measure the axial strain and lateral strain for calculation
of Poisson’s ratio during uniaxial tensile tests. For determination of the fracture toughness, a
simplified approach of the single-edge-notch bending (SENB) test is used through validation of
the method using finite element analysis. The specimens are scanned using a scanning electron
microscope (SEM) to examine the graphite flakes and chemical compositions of the pipe materials.
Finite element analysis is then performed for the fracture mechanics based strength assessment of

18
water mains subjected to pitting corrosions using the parameters determined from the experimental
program.
3.2. Fracture parameters
. The fracture toughness is a critical value of the parameters: the stress intensity factor (K),
strain energy release rate (G), J-integral (J) or crack tip opening displacement (δ), used to describe
the stress field around the crack tip. The stress intensity factor and strain energy release rate is
generally used for brittle materials that follow linear elastic fracture mechanics principles. The
stress intensity factor, K, is a measure of the stress field near a crack tip, which combines far-field
stress and crack dimensions as given in Eq. 3.1:
𝐾 = 𝑌𝜎√𝜋𝑎 (3.1)
where K = stress intensity factor for a particular mode of cracking
a = initial crack length
Y = a geometric factor
= nominal stress at failure
The strain energy release rate, G, is a measure of energy available for an increment of a crack and
is defined as in Eq. 3.2:
𝐺 = −𝜕𝜋
𝜕𝑎 (3.2)
where π indicates the potential energy under the applied loading.
The stress intensity factor (K) and/or the strain energy release rate (G) are calculated using
stress–deformation analyses of the structure. The calculated K or G are then compared with the
critical value of the parameters (Kc or Gc), i.e., the fracture toughness.

19
However, natural variations of the properties of cast iron are well recognized. The structure
of cast iron depends on its heterogeneous microstructure, alloying elements, cooling conditions,
the rate of the casting, casting method, and inoculants. Discontinuity of the matrix occurs due to
the presence of free graphites. Shape and dimension of the graphite play an important role in tensile
strength because these produce notch effect and exclude parts in the matrix (Collini et al. 2008).
The strength of cast iron is reported to be inversely proportional to the graphite contents (Angus
1976, Yamamoto et al. l983). Collini et al. (2008) showed that the stress intensity factor (SIF)
dramatically decreases with the increase of free graphite. The size and the shape of the free graphite
flakes depend on the cooling rate during the manufacture of cast iron pipes. These flakes act as a
void and form natural cracks which tend to produce a brittle fracture (Marker et al. 2000). A
moderate cooling rate forms a more pearlitic microstructure which has less tensile strength than
the ferritic microstructure that is formed by a fast cooling rate (Marker et al. 2000, Lacaze et al.
2016). The strength of cast iron also depends on whether it is vertically or horizontally cast.
Horizontally cast (spun) material has higher strength than vertically (pit) cast material (Marker et
al. 2007).
Collini et al. (2008) showed that tensile and fatigue strength of gray cast iron of the same
grade varies from foundry to foundry. Rajani et al. (2000) conducted an assessment of
microstructure, tensile strength, four-point bending strength, and fracture toughness of pit and spun
cast iron pipe materials, supplied by eight cities in Canada and eight cities in the USA. This study
reveals that tensile strength and fracture toughness varies extensively from one city to another.
Seica and Packer (2004) examined cast iron properties by conducting the tension test, compression
test, ring bearing test, and pipe bending test and came to the conclusion that mechanical properties
show significant variation and should not be assumed for the determination of pipe strength.

20
Mohebbi et al. (2010) studied the role of microstructure on the fracture toughness and fatigue
behavior and reported that fracture toughness remains almost constant for the same type of
microstructure, specifically the pearlite structure. Jesson et al. (2013) studied a 150-year-old
pipeline and showed that the strength of cast iron decreases with the increase of graphite depth.
For the strength assessment of cast iron water mains having extensively variable material
properties, a statistical characterization of the material properties can be performed with available
data. In this regard, tests of available pipe materials can be conducted to enrich the existing data
base with additional data.
Researchers examined uniaxial stress-strain behavior of cast iron pipe materials using
coupon samples extracted from pipes (Conlin and Baker 1991, Seica and Packer 2004, Makar and
McDonald 2007, Collini et al. 2008, Zhang et al. 2017a). The tensile strength and the compressive
strength are found to range from 125-246 MPa and 325-400 MPa, respectively. The stress–strain
responses of the material in both tensile and compressive loading were nonlinear. The modulus of
elasticity and Poisson’s ratio of the materials were not reported from these tests. However, these
parameters are required for stress–deformation analysis, particularly for application of linear
elastic fracture mechanics (LEFM). Water mains are also subjected to repeated loading and
unloading applied at different rates during pressure surge, temporary shut-down, temperature
change, and repeating surface loads. Information on cyclic stress–strain response is currently not
available for the assessment of pipes subjected to the repeated loading. While stress–strain
response of cast iron pipe materials are assumed to be independent on the rates of loading, no
experimental evidence is currently available to validate the assumption. In the current research, a
laboratory testing program is undertaken to investigate the stress-strain response of cast iron pipe
materials under monotonic and repeating loading with various rate of loading.

21
3.3. SEM Scanning
To investigate the graphite flakes, chemical composition, and the type of cast iron,
specimens are scanned by a scanning electron microscope (SEM) in the SEM lab at Memorial
University of Newfoundland, Canada. Firstly, specimens are sectioned by using a blade designed
for metallography work to ensure the least possible amount of damage. Grinding and polishing of
the surface are then completed by using a Struers TegraForce-5 machine (Figure 3.1).
Figure 3.1. Struers TegraForce-5 machine for grinding and polishing
A properly polished specimen is required for observation of inclusions of graphite in cast iron. The
samples are physically examined and scanned using the ‘Phenom ProX desktop scanning electron
microscope’ (Figure 3.2). Distributions of elements in the specimen are analyzed using ‘optional
elemental mapping and line scan’ software. Element identification is completed by fully integrated
energy dispersive spectrometer (EDS) of the SEM machine.

22
Figure 3.2. Phenom ProX desktop scanning electron microscope” (Quanta 400)
Types of graphite flakes vary between pit and spun cast iron because, during solidification,
carbon is separated from iron and produce different shapes of flakes. The graphite flake of cast
iron is divided into different types according to ASTM (2017), as shown in Table 3.1. SEM
scanning showed both of the specimens as type VII graphite form, i.e., long and individual flake,
which are gray cast iron. Generally, Type D graphite flakes are present in spun cast iron, formed
by rapidly cooling and type A (uniform distribution, random orientation) or C (superimposed flake
sizes, random orientation) graphite flakes are present in pit cast iron that is formed by slower
cooling rates. Type B flakes (rosette pattern) are found from fairly rapid cooling. In the SEM tests,
both of the specimens showed a very fine pattern of flakes with the surrounding areas without
graphite (Figure 3.3), similar to Type D, and therefore, are classified as a spun cast iron.

23
(a)
(b) (a) Sample 1 (b) Sample 2
Figure 3.3. Microstructure spun cast iron after polishing (100x magnification)
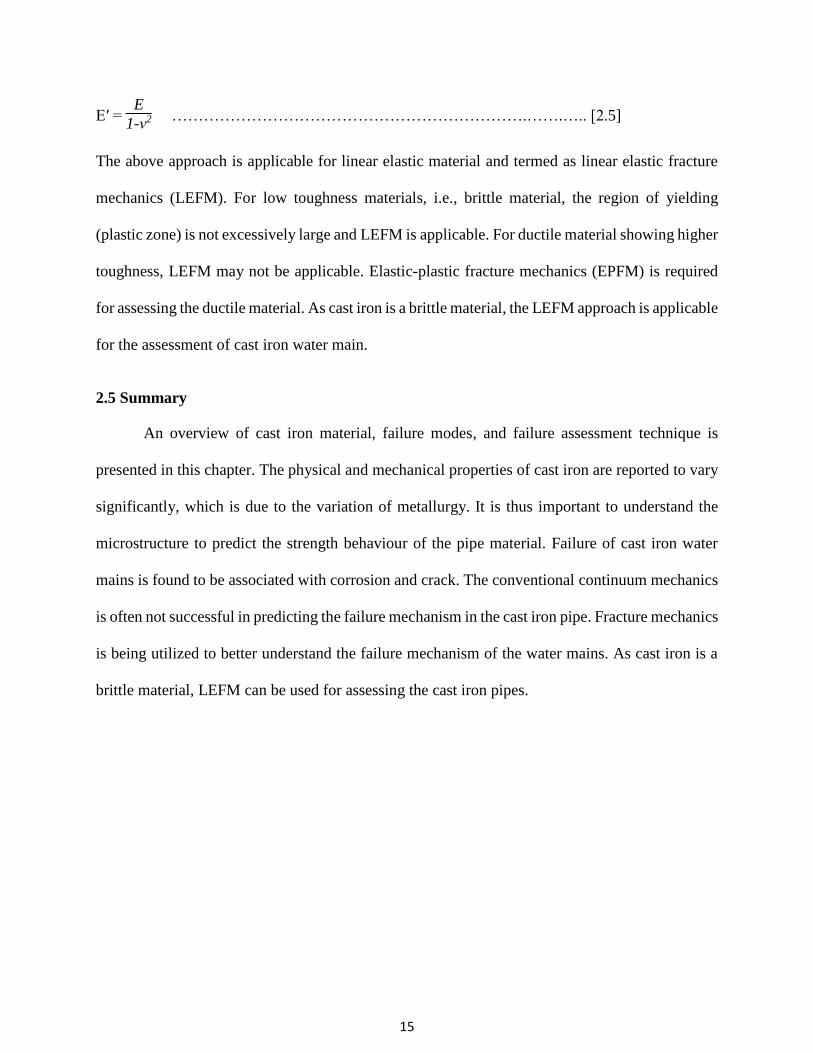
In each sample, four areas are selected to determine the chemical composition (Figure 3.4)
where three small areas or blocks (around 45 to 65 µm by 25 µm in size) containing different
observed patterns of graphite, denoted by Areas 1, 2 and 3, are used to understand the local
variabilities of material composition. Table 3.2 shows that for Sample 1 (supplied by the City of
Mount Pearl), the lowest amount of carbon (i.e., 4.43%) and the highest amount of iron (i.e.,
74.49%) is found in Area 1. However, in Area 2, the percentage of carbon is much higher (21.36%)
where the amount of iron is reduced to 64.17%. Sample 2 (collected from the City of St. John’s)
also shows similar patterns (Table 3.2). The test results show that the amount of iron compound
of Sample 1 is less than that in Sample 2. Due to the large variation in localized area, an
approximate 650 µm block, denoted as Area 4 is considered to obtain carbon equivalent over a
larger area. The carbon equivalent of Sample 1 and 2 obtained from Area 4 are 18.85% and 18.35%
respectively, which are very similar.

24
Table 3.1. Description of Graphite Flakes (ASTM A 247 − 17, Marker et al. 2000)
Graphite
Forma
Flake type Flake description
Type
VII
A Uniformly distributed, apparently randomly oriented flakes
B Rosette pattern of graphite flakes
C Randomly oriented flakes of widely varying sizes
D A very fine pattern of flakes surrounding areas without graphite
E Graphite flakes have preferred orientation and appear in quasi-
regular pattern
aIn ASTM A247 − 17, graphite form is classified as (1) spheroidal graphite; (2) imperfect
spheroidal graphite; (3) temper graphite; (4) compact graphite; (5) grab graphite; (6) exploded
graphite; or (7) flake graphite. Pictures of both flake types and forms can be found in ASTM A247
– 17.
25
(a) Sample 1 (b) Sample 2
Figure 3.4. The selected area to determine the chemical composition
Area 1 Area 3
Area 2
Area 1
Area 2
Area 3

26
Table 3.2. Chemical composition (% by weight) of Sample 1 and Sample 2
Foundry Spectrum Fe C Si Mn P S Cu Ca Ti K
Sample 1
Area-1 74.49 4.43 1.24 0.75 0.98 0.00 0.13 0.00 0.00 0.00
Area-2 64.17 21.36 1.18 1.48 0.00 0.55 0.14 0.02 0.05 0.01
Area-3 70.20 11.59 1.36 0.77 0.13 0.02 0.09 0.03 0.00 0.01
Mean value: 69.62 12.46 1.26 1.00 0.37 0.19 0.12 0.02 0.02 0.00
Sigma 5.19 8.50 0.10 0.41 0.54 0.31 0.03 0.01 0.03 0.00
Sigma mean 2.99 4.91 0.06 0.24 0.31 0.18 0.01 0.01 0.01 0.00 Area-4 73.65 18.28 1.31 1.61 0.39 0.06 0.18 0.02 0.09 0.01
Sample 2
Area-1 75.17 4.22 1.25 0.89 0.98 0.00 0.18 0.00 0.01 0.01
Area-2 72.77 15.03 1.30 0.96 0.00 0.00 0.19 0.00 0.02 0.00
Area-3 69.04 19.63 1.06 0.93 0.09 0.00 0.12 0.01 0.01 0.01
Mean value: 72.33 12.96 1.20 0.93 0.36 0.00 0.16 0.00 0.01 0.01
Sigma 3.09 7.91 0.13 0.04 0.54 0.00 0.04 0.00 0.00 0.01
Sigma mean 1.78 4.57 0.07 0.02 0.31 0.00 0.02 0.00 0.00 0.00
Area-4 75.27 17.85 1.33 1.66 0.15 0.07 0.27 0.00 0.02 0.00
3.4. Tensile tests
3.4.1. Test description
Tensile tests are performed on specimens extracted from the two separate exhumed cast
iron water mains (obtained from the City of Mount Pearl and the City of St. John’s). Multiple
tensile coupons are cut from the pipe by using a water jet. Corrosion (such as graphitization) and
other materials flaws (air inclusions, foreign body inclusions, etc.) visible on the coupons,
particularly within the gauge length, are removed. ASTM (2016) recommends two types of dog-
bone shaped specimens (flat and round) for the tension test. Seica and Packer (2004) showed that
both flat and round tensile coupons provide reliable results and therefore either type of coupons
can be used for the tensile test of cast iron. All the tensile tests in this study are performed on flat
coupon specimens prepared according to ASTM (2016) specifications (Figure 3.5).

27
Figure 3.5. ASTM E E8 / E8M –16a recommended tension specimen
The length of the test specimens is parallel to the length of the cast iron pipeline. An INSTRON
(5585H) (Figure 3.6) machine is used for the test. Thirteen coupons are exhumed from the pipe
supplied by the City of Mount Pearl (Sample 1) and thirty-three specimens are exhumed from the
pipe collected from the City of St. John’s (Sample 2). Dimensions of all specimens are measured
within the gauge length before the tests. The coupons are loaded in tension until failure and the
data are collected using a computer-controlled data acquisition system. Displacement control tests
are carried out by moving the crosshead of the INSTRON machine at various displacement rates
to examine the effects of the rate of loading. In a few tests, the load is applied up to a certain level
and unloaded and then reloaded to examine the loading-unloading-reloading responses. An
extensometer is attached to measure the axial deformation and strain. A biaxial strain gauge is also
used in a few specimens to verify the strain measured by the extensometer and for the examination
of Poisson’s ratio.

28
Figure 3.6. Tensile test by INSTRON (5585H) machine
3.4.2. Strain rate effect
Figure 3.7 presents the stress–strain responses obtained during the tests with specimens
extracted from different locations of Sample 1 (pipe extracted from the City of Mount Pearl). A
wide variation of stress–strain response is observed in this figure for tests conducted at various
loading rates. The variations in the stress–strain response could be due to variation in the materials
properties for the specimens extracted from different locations or could be due to the variation in
the rate of loading. However, as seen in Figure 3.7, the stress–strain responses for tests conducted
at the same loading rate are also different. Therefore, the differences in the responses are likely
due to the variability in the material properties. To validate this argument, two other tests are
conducted with specimens extracted from close vicinity of the same pipe (Sample 1). Tests are
conducted at different displacement rates (i.e., 0.5 mm/min and 1 mm/min), which are arbitrarily
chosen based on previous test results. For one of the specimens, the displacement rate is changed

29
during the test. A displacement rate of 0.5 mm/min is applied up to a stress level of 85 MPa and
then it is increased to 20 mm/min and continued until failure. Test results are plotted in Figure 3.8.
In this figure, the stress–strain responses are not affected by the change of displacing rate from 0.5
mm/min to 20 mm/min, indicating no effect of the rate of loading. The responses for the tests
conducted at 0.5 mm/min and 1 mm/min are also very close, which is due to extracting the
specimens from close vicinity. Therefore, it can be concluded that the stress–strain response of
cast iron pipe material is not affected by the rate of loading. The variability observed in Figure 3.7
is due to variation in the material property even for the same pipe. A similar conclusion regarding
the effect of rate of loading can be drawn for Sample 2 where the stress–strain responses with tests
conducted at various displacement rates are very close to each other (Figure 3.9).
Figure 3.7. Stress–strain response of Sample 1 at various strain rate (After Ali 2017)
The ultimate strength of Sample 1 was found to vary from around 150 MPa to around 230
MPa with the average and the standard deviation as 185 MPa and 27 MPa, respectively. Sample 2
shows almost similar ultimate strength which is around 250 MPa. The failure strains at the ultimate
0
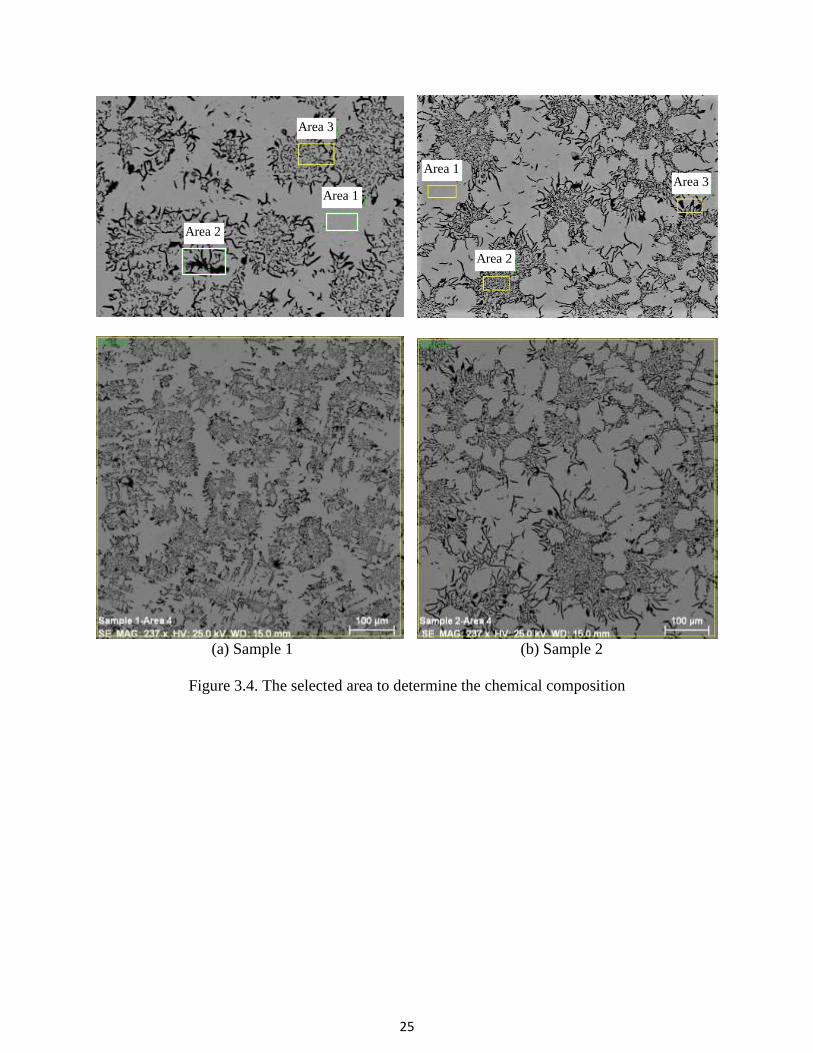
50
100
150
200
250
0 0.001 0.002 0.003 0.004 0.005 0.006 0.007
Str
ess
(MP
a)
Strain (mm/mm)
20 mm/min
20 mm/min
20 mm/min
10 mm/min
10 mm/min
10 mm/min
1 mm/min
1 mm/min
0.5 mm/min
30
strength vary from 0.002 to 0.007 for Sample 1 whereas the failure strain fluctuation in Sample 2
is very small (0.0034 to 0.0038). The result of SEM scanning (Table 3.2) reveals that the
percentage of iron compared to carbon equivalent is more in Sample 2 than Sample 1. As a result,
the tensile strength is expected to be higher in Sample 2, which is consistent with the test results.
Figure 3.8. Stress–strain response of Sample 1 with the loading rate change
Figure 3.9. Stress–strain behaviour of Sample 2
0
50
100
150
200
250
0 0.002 0.004 0.006 0.008
Str
ess
(MP
a)
Strain (mm/mm)
0.5mm/min & 20 mm/min
1 mm/min
0
50
100
150
200
250
300
0 0.001 0.002 0.003 0.004 0.005
Str
ess
(MP
a)
Strain (mm/mm)
0.5 mm/min
1 mm/min
10 mm/min
20 mm/min

31
Variabilities in the tensile strength of cast iron pipe materials were also identified earlier
(Seica and Packer 2004, Makar and McDonald 2007, Zhang et al. 2017a) where the tensile strength
was reported to vary from less than 50 MPa to over 300 MPa. Therefore, pipe specific material
parameters should be used for the structural integrity assessment of cast iron water mains. Failed
segments of pipes can be exhumed and tested to determine the material parameters and their
statistical distributions for the integrity assessment of pipes in existing water main networks.
The stress–strain response of cast iron pipe material is nonlinear. Hyperbolic relations were
used to capture the nonlinear relation for cast iron water mains (Rajani 2012, Zhang et al. 2017b).
The hyperbolic model as suggested by Attewell et al. (1986) is:
ε/σ = a + b ε (3.3)
Where ε and σ are strain and stress, respectively, and a is the reciprocal of the initial tangent
modulus, and b is the slope of strain/stress–strain curve. The hyperbolic parameters from the
stress–strain relation presented in Figures 3.8 and 3.9 are determined. Table 3.3 summaries the
mechanical parameters obtained from tensile tests along with hyperbolic model parameters.
Table 3.3: Mechanical parameter obtained from tensile test
Foundry Ultimate strength, σu
(MPa)
Failure strain, εu
(mm/mm)
a
*10-5 (MPa-1)
b
(MPa-1)
Sample 1 225 0.0065 0.8 0.0028
Sample 2 250 0.0036 0.8 0.0016
3.4.3. Loading-unloading-reloading responses
The uniaxial tensile test is performed to understand the loading-unloading-reloading
behavior of cast iron. The specimen is loaded to a ‘specified stress level’ and then unloaded to zero
loads and again loaded until failure. The loading, unloading, and reloading are performed at the
32
same displacement rates. Tests are conducted at various magnitudes of the ‘specified stress level’
to identify the elastic limit of the cast iron pipe material. Stress–strain diagrams with the unloading-
reloading cycle are illustrated in Figure 3.10. Ideally, at any increment of load, stress–strain
diagrams of cast iron show plastic deformation (Angus, 1960). However, the plastic deformation
is insignificant in Figures 3.10a to 3.10c, where unloading is applied at a stress level of less than
70 MPa. The reloading responses exactly follow the loading in Figures 3.10a to 3.10c, due to
negligible plastic deformation. At the stress levels for unloading of 75 MPa and beyond (Figures
3.10d to 3.10f), significant plastic deformations are observed. In Figures 3.10d to 3.10f, the
reloading paths closely follow the unloading path up to the maximum prior stress and then follows
the loading response. The maximum stress prior to unloading is reached at the same total strain
during unloading. Thus, the progressive damage due to elasto-plastic loading is apparently
negligible.
3.4.4. Modulus of elasticity and elastic limit
For cast iron with a nonlinear stress–strain behavior, the initial tangent modulus can be
calculated from the slope of the stress–strain curve at zero or near zero stress. The secant modulus
corresponding to a stress level is also used to obtain the response at that stress level. The initial
tangent modulus for the two samples is calculated as around 125 GPa (same for both samples).
The initial tangent modulus for cast iron was reported to vary from 56 MPa to 200 MPa (Seica and
Packer 2004, Makar and McDonald 2007). The calculated tangent modulus for the samples are
thus within the range reported in the literature.
As there is no exact proportional limit for cast iron, it is recommended to obtain the yield
strength using the 0.01% offset method (Angus 1960). Using the 0.01% offset method, the yield
stress of Sample 1 and 2 is estimated at around 100 MPa. However, significant plastic deformation

33
was observed at the stress level of 75 MPa during the test conducted here. The 0.01% offset method
can therefore, predict the yield stress which is slightly higher than the elastic limit obtained from
the tests.
(a) Unloaded at 15 MPa (b) Unloaded at 30 MPa
(c) Unloaded at 70 MPa (d) Unloaded at 75 MPa
(e) Unloaded at 150 MPa (f) Unloaded at 180 MPa
Figure 3.10. Stress–strain behaviour in loading-unloading-reloading (Sample 2)
0
50
100
150
200
250
300
0 0.001 0.002 0.003 0.004
Str
ess
(MP
a)
Strain (mm/mm)
Loading
Unloading
Reloading
0
50
100
150
200
250
300
0 0.001 0.002 0.003 0.004
Str
ess
(MP
a)Strain (mm/mm)
Loading
Unloading
Reloading
0
50
100
150
200
250
300
0 0.001 0.002 0.003 0.004
Str
ess
(MP
a)
Strain (mm/mm)
LoadingUnloadingReloading
0
50
100
150
200
250
300
0 0.001 0.002 0.003 0.004
Str
ess
(MP
a)
Strain (mm/mm)
Loading
Unloading
Reloading
0
50
100
150
200
250
300
0 0.001 0.002 0.003 0.004
Str
ess
(MP
a)
Strain (mm/mm)
Loading
Unload
Reloading0
50
100
150
200
250
300
0 0.001 0.002 0.003 0.004
Str
ess
(MP
a)
Strain (mm/mm)
Loading
Unloading
Reloading

34
3.4.5. Poisson’s ratio
Longitudinal and transverse strains are measured using a biaxial strain gauge in three of
the tests for calculation of Poisson’s ratio. An extensometer is also used to measure the longitudinal
strain. The longitudinal strains measured using the extensometer and strain gauge are close to each
other. Cast iron is not a purely linear elastic material and therefore a constant value of Poisson’s
ratio may not be applicable. Calculated Poisson’s ratio are plotted in Figure 3.11. In the initial
stage of loading, the lateral strain measurement shows some instability that results in fluctuation
on the calculated Poisson’s ratio. Beyond the initial fluctuation, the ratio decreases almost linearly
with the increase of longitudinal strain (hence, stress). A linear decrease of Poisson’s ratio with
stress level was also reported for cast iron in Angus (1960). The initial Poisson’s ratio obtained
from a backward extension of lines is 0.31 and 0.28 for Sample 1 and 2, respectively. In Figure
3.11, the Poisson’s ratio ranges from 0.28 to 0.14 for Sample 1 and 0.31 to 0.17 for Sample 2
within the ranges of stress considered during the tests. Within the elastic region (stress < 75 MPa)
the measured Poisson’s ratio ranges from 0.28 to 0.24 for Sample 1 and 0.31 to 0.27 for Sample
2. Therefore, a Poisson’s ratio of 0.25 to 0.3 can reasonably be used for elastic analysis of cast iron
pipes. However, the effects of the Poisson’s ratio on overall response should be investigated.

35
Figure 3.11. Poisson’s ratio
3.5. Determination of fracture toughness
3.5.1. Single-Edge Notch Beam (SENB) test
The Single-Edge Notch Beam (SENB) is used for fracture toughness determination of the
materials. In the SENB test, a sharp notch is created in the middle of the specimen and the specimen
is loaded under a 3-point beam configuration. It is believed that the SENB test provides reliable
results if the notch is sharp enough (Rudnayova et al. 1993). To ensure a sharp notch/crack, fatigue
pre-cracking of the specimen with a ‘straight through notch’ is recommended in the fracture
toughness test standard (ASTM 2001). However, for the specimen extracted from the pipe wall, it
is difficult to create the ‘straight through notch’. The application of fatigue pre-cracking is also not
feasible due to low fracture toughness of the brittle cast iron pipe material. Therefore, a chevron
(V) notch is used for the SENB tests. The obtained fracture toughness is then validated with the
calculation of the stress intensity factor at the failure load using FE analysis.
0.00
0.10
0.20
0.30
0.40
0.50
0.60
0 0.0005 0.001 0.0015 0.002 0.0025 0.003 0.0035
Po
isso
n's
Rat
io
Longitudinal Strain (mm/mm)
Sample 1
Sample 2

36
For the SENB tests, the specimens are prepared as a rectangular cross-section with the
length parallel to the length of the pipe. Corrosion and other foreign inclusions are removed. The
width to depth ratio (W/B) of the specimens is kept in the range of 1 < W/B < 2. Figure 3.12 shows
a schematic view of the specimen used in SENB tests. The clear span (S), depth (W) and thickness
(B) of the specimen are 84 mm, 14 mm and 7 mm, respectively. The width of the V notch is 2.4
mm. The depth of the notch is varied at 3.2 mm, 4.7 mm, and 6 mm to examine the effects. Three-
point loading was applied on the specimen until failure. A linear voltage displacement transducer
(LVDT) is attached to measure the displacement at the center of the beam. The failure load is
recorded from the load–displacement response (Ali 2017). The failure load and the crack length
are then used for the determination of fracture toughness Kc using the following equation Eq. (3.4)
(ASTM 2001):
Kc = PS
BW3/2 f (a/w) (3.4)
Here, f (a/w) = 3 (a/w)1/2
2 (1 + 2 a/w)(1 - a/w)3/2 1.99 - (a/w) (1 - a/w) (2.15 - 3.93 a/w + 2.7 a2/w2)] (3.5)
and P is the ultimate load, S is the clear span, B is the thickness, a is the crack length and w is the
depth.
Figure 3.12. Test specimen used
a
42 mm 42 mm
14
mm
2.4 mm
V notch
37
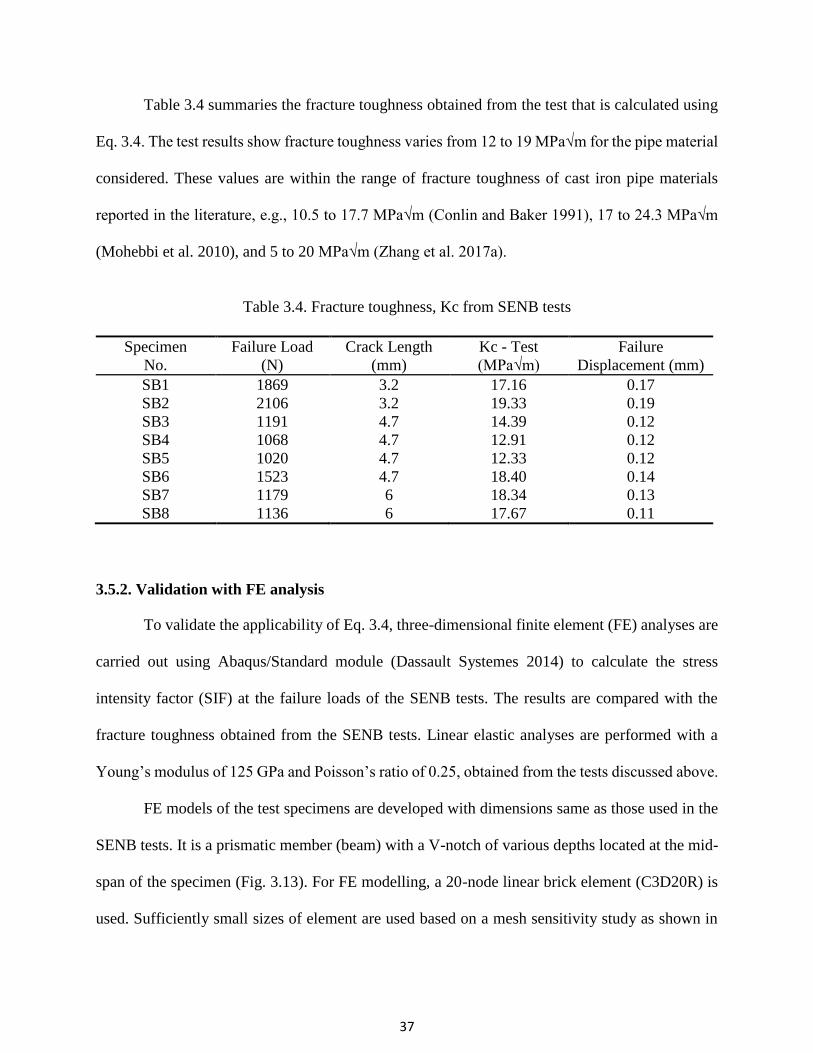
Table 3.4 summaries the fracture toughness obtained from the test that is calculated using
Eq. 3.4. The test results show fracture toughness varies from 12 to 19 MPa√m for the pipe material
considered. These values are within the range of fracture toughness of cast iron pipe materials
reported in the literature, e.g., 10.5 to 17.7 MPa√m (Conlin and Baker 1991), 17 to 24.3 MPa√m
(Mohebbi et al. 2010), and 5 to 20 MPa√m (Zhang et al. 2017a).
Table 3.4. Fracture toughness, Kc from SENB tests
Specimen
No.
Failure Load
(N)
Crack Length
(mm)
Kc - Test
(MPa√m)
Failure
Displacement (mm)
SB1 1869 3.2 17.16 0.17
SB2 2106 3.2 19.33 0.19
SB3 1191 4.7 14.39 0.12
SB4 1068 4.7 12.91 0.12
SB5 1020 4.7 12.33 0.12
SB6 1523 4.7 18.40 0.14
SB7 1179 6 18.34 0.13
SB8 1136 6 17.67 0.11
3.5.2. Validation with FE analysis
To validate the applicability of Eq. 3.4, three-dimensional finite element (FE) analyses are
carried out using Abaqus/Standard module (Dassault Systemes 2014) to calculate the stress
intensity factor (SIF) at the failure loads of the SENB tests. The results are compared with the
fracture toughness obtained from the SENB tests. Linear elastic analyses are performed with a
Young’s modulus of 125 GPa and Poisson’s ratio of 0.25, obtained from the tests discussed above.
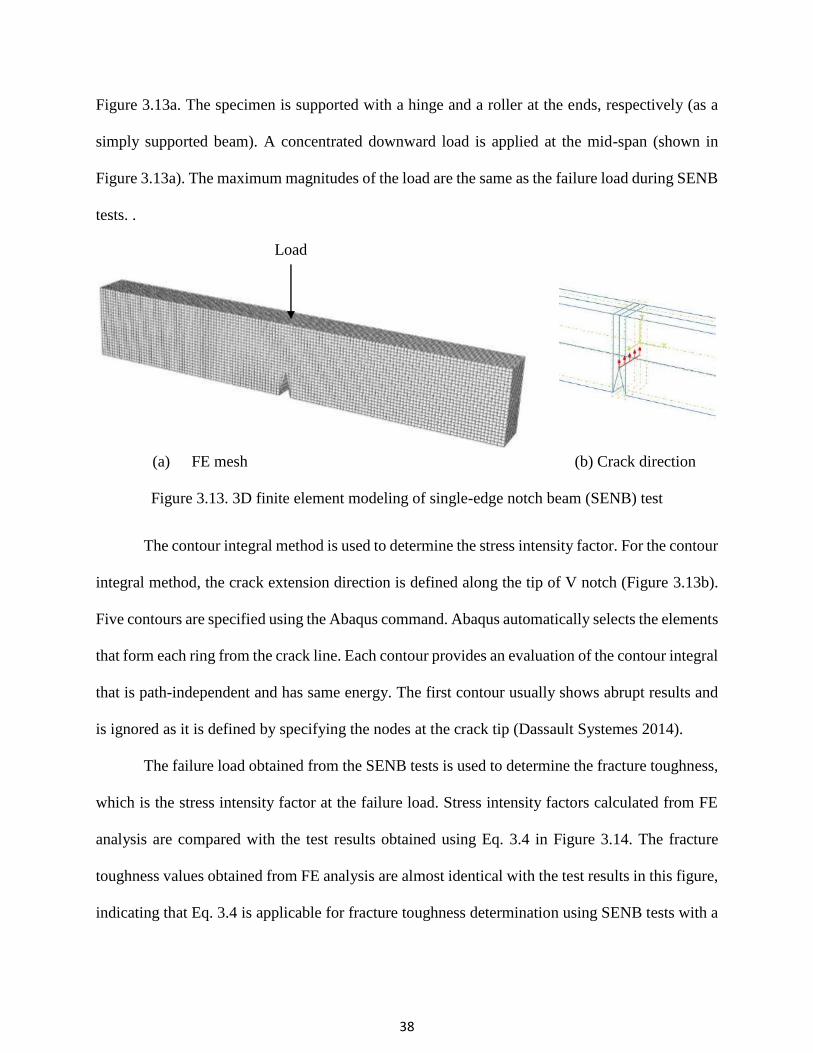
FE models of the test specimens are developed with dimensions same as those used in the
SENB tests. It is a prismatic member (beam) with a V-notch of various depths located at the mid-
span of the specimen (Fig. 3.13). For FE modelling, a 20-node linear brick element (C3D20R) is
used. Sufficiently small sizes of element are used based on a mesh sensitivity study as shown in
38
Figure 3.13a. The specimen is supported with a hinge and a roller at the ends, respectively (as a
simply supported beam). A concentrated downward load is applied at the mid-span (shown in
Figure 3.13a). The maximum magnitudes of the load are the same as the failure load during SENB
tests. .
(a) FE mesh (b) Crack direction
Figure 3.13. 3D finite element modeling of single-edge notch beam (SENB) test
The contour integral method is used to determine the stress intensity factor. For the contour
integral method, the crack extension direction is defined along the tip of V notch (Figure 3.13b).
Five contours are specified using the Abaqus command. Abaqus automatically selects the elements
that form each ring from the crack line. Each contour provides an evaluation of the contour integral
that is path-independent and has same energy. The first contour usually shows abrupt results and
is ignored as it is defined by specifying the nodes at the crack tip (Dassault Systemes 2014).
The failure load obtained from the SENB tests is used to determine the fracture toughness,
which is the stress intensity factor at the failure load. Stress intensity factors calculated from FE
analysis are compared with the test results obtained using Eq. 3.4 in Figure 3.14. The fracture
toughness values obtained from FE analysis are almost identical with the test results in this figure,
indicating that Eq. 3.4 is applicable for fracture toughness determination using SENB tests with a
Load

39
simple chevron (V) notch. Thus, the simple V notch can be used instead of the complex ‘straight
through notch’ for fracture toughness assessment of cast iron pipe material.
Figure 3.14. Comparison of fracture toughness from test and Abaqus
3.6. Analysis of Pipes with a Corrosion Pit
Fracture mechanics based failure assessment of buried cast iron pipes using the above
parameters is demonstrated through application to a pipe with a corrosion pit. Circumferential
cracking is the most common type of failure mode observed in cast iron water mains. Makar et al.
(2005) postulated that the circumferential cracking in the water main is associated with corrosion
pits in the pipe wall. Liyanage and Dhar (2017) employed three-dimensional FE modelling for
continuum based failure assessment of a water main with corrosion pit. However, for a pipe in
uniform soil, the calculated maximum longitudinal stress was much less than the circumferential
stress. Since the longitudinal stress was low, no circumferential cracking was predicted using the
method of assessment. Under the loading condition considered, the maximum longitudinal tension
was 3.9 MPa, occurring at a distance from the pit, whereas the maximum circumferential stress
was calculated as 25.4 MPa. Based on a significantly higher tensile strength of 225 MPa, the factor
0
5
10
15
20
25
SB SB1 SB2 SB3 SB4 SB5 SB6 SB7 SB8 SB9
Kc
(MP
a.√
m)
Specimens No.
Test Abaqus

40
of safety against circumferential cracking is 50, based on the continuum based assessment.
Liyanage and Dhar (2017) also investigated the effect of pitting corrosion considering a 180 wide,
1 m long void underneath the pipe subjected to an internal pressure (400 kPa) and geostatic stress,
and reported the maximum longitudinal and the maximum circumferential stresses as 20.2 MPa
and 10.4 MPa, respectively. With the calculated longitudinal stress, the factor of safety against
circumferential cracking is greater than 10. Thus, the continuum based modelling approach is not
successful in identifying the causes for circumferential cracking of the pipe. Here, a fracture
mechanics assessment is employed to investigate the problem from a different perspective.
Three-dimensional finite element analyses are carried out using Abaqus to obtain the pipe
stress distribution and stress intensity factor for the pipe with a corrosion pit. Pipe conditions
considered in Liyanage and Dhar (2017) are reanalysed using the fracture mechanics approach.
The diameter of the cast iron pipe considered is 175 mm and the thickness is 10 mm. The pipe is
buried in a medium dense soil with 2 m of soil cover. The pipe is subjected to 400 kN/m2 internal
pressure. Gravity load, snow load of 25 kN/m2 and a truck load (axle load 14400 kg) are also
considered. Gravity load is calculated manually and applied as a pressure at the top of the soil for
the calculation of SIF, as the option of gravity type loading is not available for application of
contour integral method in the current version of Abaqus.
The length of the pipe considered is 4 m. The corrosion pit is located at the invert position
of the pipe. Uniform bedding, as well as a non-uniform bedding condition, is considered. To
simulate the non-uniform bedding condition, a 1 m or 2 m long, 50 mm thick void is provided at
the invert of the pipe (Figure 3.15). Circular, elliptical and diamond types of corrosion pit are
considered, where the diameter of the circular pit is 50 mm, the length of the major axis is 50 mm
for the elliptical pit, and the diagonal length is 50 mm for the diamond-shaped corrosion pit. The

41
void at the bedding is symmetrical to the pit hole and extends 90 or 180 around the pipe
circumference. Soil parameters reported in Liyanage and Dhar (2017) are employed in the
analyses. Table 3.5 summarizes the material parameters used. Linear elastic material model is used
for the pipe material and elastic perfectly plastic model with Mohr-Coulomb plasticity is used for
the soil. A parametric study is conducted to investigate the influence of the dilation angle in order
to select a suitable dilation angle. The dilation angle is varied from 8º to 15º, and no significant
variation in SIF is found.
Figure 3.15. Symmetric void (90) with respect to pit hole
Table 3.5. Material Parameters for FE modelling
Material Properties Soil Cast Iron
Density (gm/cm3) 1.77 7.88
Young’s modulus (MPa) 24 125,000
Poisson’s Ratio 0.25 0.25
Friction Angle in () 38 -
Cohesion Yield Stress (kPa) 0.1 -
Eight-nodded linear brick elements (C3D8R) are used for both the pipe and the soil.
Longitudinal displacements of the soil and pipe are restrained at the end planes using roller
supports. The bottom surface is fixed in order to restrain horizontal and vertical movements.
Pipe
Soil
Void (90)

42
Figure 3.16. Major principal stress around a pit
Longitudinal direction of the pipe
Tension zone
Longitudinal direction of the pipe
Tension zone
(a) Circular Pit
(b) Elliptical Pit
Longitudinal direction of the pipe
Tension zone
(c) Diamond shaped Pit
Pipe
Corrosion Pit
Pipe
Corrosion Pit
Pipe
Corrosion Pit

43
To understand the direction of crack initiations and propagations, the contours of major
principal stress are first plotted around the pits of different shapes as shown in Figure 3.16.
Since cracking is generated by tension, the major principal stress from FE analysis provides
the direction of cracking. These figures show the highest tensile stress (marked by a dotted line)
along the circumferential direction of the pipe across the corrosion pit. Thus, cracking is expected
in the circumferential direction of the pipe due to high longitudinal stress. Therefore, crack
directions along the circumference are assigned in the contour integral method for calculating SIF.
Figure 3.17 shows an example of the crack propagation direction assigned for a circular pit.
Figure 3.17. Crack extension direction in Contour integral method
The stress intensity factors (SIFs) calculated using the FE analysis for different pipe burial
conditions are shown in Tables 3.6. The SIFs in the table suggest that the SIF is highest for a
diamond-shaped corrosion pit and lowest for the circular shape. The SIF for the elliptical corrosion
pit lies between the diamond and circular corrosion pits. The SIF increases with the decrease of
tip radius of the corrosion hole. As a result, the SIF is higher for the diamond shaped pit having

44
the sharper tip. However, the SIFs under the typical loading conditions of water mains considered
here are less than the fracture toughness determined for the cast iron pipe materials. The maximum
SIF for circular, elliptical, and diamond-shaped pits are 1.22 MPa√m, 3.67 MPa√m, and 6.65
MPa√m, respectively. Considering the average fracture toughness of 16.4 MPa√m, a factor of
safety against fractures of 2.5 to 10 are estimated. However, a crack may propagate at a SIF that
can be substantially less than the fracture toughness, due to the stresses in a corrosive environment
which is known as ‘subcritical crack growth’. Strained bonds at crack tips are weakened due to the
chemical action of environmental factors like water that facilitate crack growth during stress
corrosion (Atkinson 1984). Cullin et al. (2015) reported that subcritical corrosion fatigue is one of
the threats to gray cast iron water pipes, which is mainly due to the cyclic load. A casting defect
may cause a microscopic crack on the pipe’s interior that may accelerate crack propagation and
therefore, a failure may occur at a lower SIF.
Table 3.6. Stress intensity factor in MPa√m
Shape
Of the
pit
1m hole under the pit,
extending 90 around
the pit circumference
2m hole under the pit,
extending 90 around the
pit circumference
2m hole under the pit,
extending 180 around
the pit circumference
Circular
Elliptical
Diamond
0.72
1.79
3.29
0.66
1.97
3.64
1.22
3.67
6.65
3.7. Conclusion
This paper investigates the strength and deformation properties of cast iron water mains
that are required for fracture mechanics based failure assessment. SEM tests are performed to
determine the type of cast iron by analyzing the graphite flake shapes and orientations. Coupons
extracted from exhumed water mains are tested to determine the tensile strength and deformation
45
properties such as ultimate strength, yield strength, modulus of elasticity and Poisson’s ratio. Test
data reveal that mechanical properties of cast iron may vary significantly. The rate of loading is
found to have no influence on the stress–strain behavior. The cast iron pipe materials showed
negligible plastic strain at a stress less than 75 MPa beyond which the plastic strain is significant.
Thus, the elastic limit of the cast iron pipe material is 75 MPa which is around 25% less than the
yield strength calculated using the 0.01% offset method. Using the test data, hyperbolic model
parameters are developed to represent the nonlinear behavior of cast iron pipe materials. To
determine the fracture toughness, SENB tests with simple chevron (V) notch are performed. The
test results are evaluated using FE calculation of SIF. The results of FE analysis reveal that chevron
(V) notch can be used instead of the complex ‘straight through notch’ for fracture toughness
determination of cast iron pipe materials.
The material parameters determined from the tests are employed for fracture mechanics
based strength assessment of a buried water main. The study of the buried cast iron water mains
under various loading conditions demonstrates that the SIF is significantly affected by pit shape
and the erosion void at the bedding. The SIF is higher in the circumferential direction than in the
longitudinal direction across the corrosion pit. As a result, crack propagation is expected along the
circumferential direction. Three corrosion pit shapes (circular, diamond and elliptical) are
considered in this study where the diamond shaped pit with sharp tips caused the highest SIF.
Although the calculated SIF does not exceed the fracture toughness for the pipe material, it may
cause failure due to subcritical crack growth in a corrosive environment.
46
References
Ali, I. (2017). “Mechanical properties of an exhumed cast iron pipe material.” M.Eng. Thesis,
Memorial University of Newfoundland, St. John’s, NL, Canada.
ASTM. (2001). “Standard test method for measurement of fracture toughness.” ASTM E1820-01.
American Society for Testing and Materials, Philadelphia, Pennsylvania.
ASTM. (2016). “Standard test methods for tension testing of metallic materials.” ASTM E8 /
E8M –16a. American Society for Testing and Materials, Philadelphia, Pennsylvania. DOI:
10.1520/E0008_E0008M-16A
ASTM. (2017). “Standard test method for evaluating the microstructure of graphite in Iron
casting.” ASTM A247-17. American Society for Testing and Materials, Philadelphia,
Pennsylvania.
Angus, H. T. (1976). “Cast iron: Physical and engineering properties,” 2nd Ed., Butterworths,
London, UK.
Atkinson, B. K. (1984). “Subcritical crack growth in geological materials.” Journal of
Geophysical Research, 89(B6): 4077-4114.
Attewell, P. B., Yeates, J., and Selby, A. R. (1986). “Soil movements induced by tunnelling and
their effects on pipelines and structure,” Chapman & Hall, New York.
Collini, L., Nicoletto, G., and Konečná, R. (2008). “Microstructure and Mechanical Properties of
Pearlitic Gray Cast Iron.” Materials Science and Engineering: A, 488(1–2): 529–39.
Conlin, R. M., and Baker, T. J. (1991). “Application of fracture mechanics to the failure behaviour
of buried cast iron mains.” Contract Rep. No. 266, Transport and Road Research Laboratory,
London.

47
Cullin, M. J., Petersen, T.H. and Paris, A. P.E. (2015). “Corrosion Fatigue Failure of a Gray Cast
Iron Water Main.” Journal of Pipeline Systems Engineering and Practice,6(2):05014003
Dassault Systemes. (2014). “ABAQUS/CAE user’s guide.” Dassault Systemes Simulia Corp.
Providence, RI, USA.
Fahimi, A., Evans, T. S., Farrow, J., Jesson, D. A., Mulheron, M. J., and Smith, P. A. (2016). “On
the residual strength of aging cast iron trunk mains: Physically-based models for asset failure.”
Materials Science and Engineering: A, 663, 204–212.
Folkman, S. (2018). “Water Main Break Rates in USA and Canada: A Comprehensive Study”.
Mechanical and Aerospace Engineering Faculty Publications. Paper 174.
htps://digitalcommons.usu.edu/mae_facpub/174
Ji J., Zhang C., Kodikara, J., and Yang S. (2015). “Prediction of stress concentration factor of
corrosion pits on buried pipes by least squares support vector machine,” Engineering Failure
Analysis, Vol. 55 (2015), 131-138.
Jesson, D. A., Mohebbi, H., Farrow, J., Mulheron, M. J., and Smith, P. A. (2013). “On the
condition assessment of cast iron trunk main: The effect of microstructure and in-service
graphitisation on mechanical properties in flexure”. Materials Science and Engineering: A, 576,
192–201. doi:10.1016/j.msea.2013.03.061
Jesson, D.A., Le Page, B.H., Mulheron, M.J., Smith, P.A., Wallen, A., Cocks, R., Farrow, J., and
Whiter, J.T. (2010). “Thermally induced strains and stresses in cast iron water distribution
pipes: an experimental investigation”. Journal of Water Supply Research and Technology-
Aqua, 59. pp. 221-229.

48
Lacaze, J., Sertucha, J., and Åberg, L. M. (2016). “Microstructure of As-cast Ferritic-pearlitic
Nodular Cast Irons”. ISIJ International, 56(9), 1606–1615. doi:10.2355/isijinternational.isijint-
2016-108
Liyanage, K.T.H and Dhar, A.S. (2017) “Effects of corrosion pits on the wall stresses in cast iron
water mains”, ASCE Journal of Pipeline Systems - Engineering and Practice, 8(4): 04017023.
Liyanage, K.T.H and Dhar, A.S. (2018) “Stresses in Cast Iron Water Main Subjected to Non-
Uniform Bedding and Localized Concentrated Forces”, International Journal of Geotechnical
Engineering, 12(4), 368-376.
Makar, J. M., and Rajani, B. (2000). “Gray Cast-Iron Water Pipe Metallurgy”. Journal of
Materials in Civil Engineering, 12(3), 245–253. doi:10.1061/(asce)0899-1561(2000)12:3(245)
Makar, J. M., Rogge, R., McDonald, S., and Tesfamariam, S. (2005). “The Effect of Corrosion
Pitting on Circumferential Failures in Grey Iron Pipes.” American Water Works Association,
Denver.
Makar, J. M., and McDonald, S. E. (2007). “Mechanical Behavior of Spun-Cast Gray Iron Pipe”.
Journal of Materials in Civil Engineering, 19(10), 826–833. doi:10.1061/(asce)0899-
1561(2007)19:10(826)
Mohebbi, H., Jesson, D. A., Mulheron, M. J., and Smith, P. A. (2010). “The fracture and fatigue
properties of cast irons used for trunk mains in the water industry”. Materials Science and
Engineering: A, 527(21-22), 5915–5923. doi:10.1016/j.msea.2010.05.071
Mondal, B. (2018). “Remaining strength assessment of deteriorating energy pipeline”. PhD Thesis,
Memorial University of Newfoundland, St. John’s, NL, Canada.
49
Rajani, B. B., Makar, J. M., McDonald, S. E., Zhan, C., Kurakao, S., Jen, C.-K., and Viens, M.
(2000). “Investigation of grey cast iron water mains to develop a methodology for estimating
service life”. AwwaRF and AWWA, Denver.
Rajani, B., and Kleiner, Y. (2010) “Fatigue Failure of Large-Diameter Cast Iron Mains”, 12th
Annual Conference on Water Distribution Systems Analysis (WDSA), September 12-15, 2010,
Tucson, Arizona.
Rajani, B. (2012). "Nonlinear Stress–Strain Characterization of Cast Iron Used to Manufacture
Pipes for Water Supply". Journal of Engineering Materials and Technology, 134(4),
041005. doi:10.1115/1.4007213
Rudnayová, E., dusza, J., and kupková, M. (1993). "Comparison of fracture toughness measuring
methods applied on silicon nitride ceramics". Le Journal de Physique IV, 03(C7), C7–1273–
C7–1276.
Seica, M. V., and Packer, J. A. (2004). "Mechanical Properties and Strength of Aged Cast Iron
Water Pipes". Journal of Materials in Civil Engineering, 16(1), 69–77.
doi:10.1061/(asce)0899-1561(2004)16:1(69)
Wang, W., A. Zhou, G. Fu, C.-Q. Li, D. Robert, and Mahmoodian, M. (2017) “Evaluation of stress
intensity factor for cast iron pipes with sharp corrosion pits.” Eng. Fail. Anal. 81: 254–269.
https://doi.org/10.1016/j.engfailanal.2017.06.026.
Yamamoto, K., Mizoguti, S., Yoshimitsu, K., and Kawasaki, J. (1983). “Relation between
Graphitic Corrosion and Strength-degradation of Cast Iron Pipe”. CORROSION
ENGINEERING, 32(3), 157–162. doi:10.3323/jcorr1974.32.3_157
50
Zhang, C., Rathnayaka, S., Shannon, B., Ji, J., and Kodikara, J. (2017a). “Numerical interpretation
of pressurized corroded cast iron pipe tests”. International Journal of Mechanical Sciences,
128-129, 116–124.
Zhang, C., Ji, J., Kodikara, J., and Rajani, B. (2017b). “Hyperbolic constitutive model to study
cast iron pipes in 3-D nonlinear finite element analyses”. Engineering Failure Analysis, 75, 26–
36.

51
CHAPTER 4
Assessment of Stress Intensity Factor for Buried Cast Iron Water Pipes Using
Abaqus
4.1 Introduction
A sustainable water supply network plays a vital role in the development of a city. Cast
iron pipelines were one of the main components in this system in the past few decades and are still
functioning but show deterioration with passes of time. As a result, cast iron pipe failure increases
day by day that causes huge economical loss and affects public safety. Corrosion, construction
defects, land movement, and cracking are the main causes of pipelines failure. Internal and external
corrosion occurs in most of the buried pipeline which are the most predominant causes of pipe
incidents (Mohebbi et al. 2011). Corrosive soil is mainly responsible for the corrosion of buried
pipes. Most of the buried utilities are affected with moderate to high corrosion risk by the soil
(Folkman 2018). Folkman (2018) reported that cast iron pipeline breaks 20 times more in highly
corrosive soils than in low corrosive soils. Among the several types of corrosions identified in
water mains, pitting corrosion is considered as the most dangerous types. Irregular soil contact and
non-uniformities in the metal structure cause pitting corrosion when the pipes are in a hostile soil
environment. It is difficult to detect pitting corrosions, which may initiate stress corrosion cracking
and lead to failure.
Pipeline failure occurs either due to loss of strength or loss of toughness. Cast iron is a
brittle material and may fail due to loss of strength through cracking rather than yielding. Fracture
mechanics can be applied in failure (cracking) assessment of the pipe. For brittle material, stress
intensity factor (SIF) is used for assessment of crack initiation and crack propagation in fracture
mechanics. Several works have been conducted analytically and numerically to calculate the SIFs

52
for pipes with internal and external cracks. Raju and Newman (1982) determined different
influence coefficients and provided an empirical equation to calculate the SIFs for semi-elliptical
surface cracks in cylindrical pressure vessels with aspect ratios of defects ranging from 0.2 to 1.0.
Lambert et al. (1994) extended the work of Raju and Newman (1982) by conducting three-
dimensional finite element analysis (FEA) considering low aspect ratios (0.05 to 0.1) to calculate
the SIFs for semi-elliptical cracks. Lin and Smith (1998) worked with crack growth in pressure
vessels and revealed that after some cycles the crack forms a semi-elliptical shape. Li at al. (2012)
further conducted FEA to find SIFs with high aspect ratio for semi-elliptical cracks in pipes.
Similar research has been presented by Diamantoudis and Labeas (2005), Moulick and Sahu
(2012), Predan et al. (2013) and Li et al. (2016b). Li et al. (2016a) studies the effect of inclined
surface crack in pressurized pipes and determine SIF with mixed modes failure. Most of the studies
focused on the crack-only defect of the pipes. Randeniya et al. (2016) considered surface crack
along with corrosion for the determination of the influence coefficients. The SIF reported to date
considered in-air pipe only. No study is available on the SIF considering the soil effect for buried
pipe. In this paper, three-dimensional FE analyses are performed to investigate the SIF of buried
cast iron pipe, subjected to cracking or ‘corrosion with cracking’.
4.2 Finite element (FE) modelling
The Abaqus/Standard module (Dassault Systemes 2014) is used in this study for
calculating the fracture parameters for pipelines containing a crack defect (no metal loss) and a
‘cracks with corrosion’ defect. For the development of FE modelling, solution for the SIFs reported
in Raju and Newman (1982) is first simulated for validation. Pipelines are then analyzed under
buried condition subjected to either crack (Figure 4.1) or crack along with corrosion (Figure 4.2).

53
(a) Cross-section
(b) Longitudinal section
Figure 4.1: An example of crack only defect
(a) Cross-section (b) Longitudinal section
Figure 4.2: An example of crack in corrosion defect
Circular shaped crack
Crack only defect
Crack along with corrosion
Metal loss due to corrosion
Circular crack

54
4.2.1 FE model development
Using extensive FE analyses, Raju and Newman (1982) developed a simplified equation
(Equation 4.1) for the calculation of SIF at any point along an elliptical crack of a pipe subjected
to internal pressure.
K = PR
t √𝜋
𝑎
𝑄 Fe (a/c, a/t, t/R,) [4.1]
Where, PR/t is the average hoop stress of an uncracked pipe subjected to internal pressure, a is the
depth of crack, Q is the crack shape parameter, Fe is the boundary-correction factor, t is the pipe
wall thickness, c is the half-length of surface crack, R is the inner radius of the pipe and is the
parametric angle locating a point on the crack (Figure 4.3).
Figure 4.3: Parametric angle () of an elliptical crack
The boundary-correction factor, Fe is expressed using influence coefficients of a polynomial
function of the crack depth, a. For jth order polynomial (j = 0, 1, 2, 3) with influence coefficients
Gj, the Fe is given by
Fe = t
R (
R2
R02 - R2 ) [ 2 G0 + 2 (
a
R0 ) G1 + 3 (
a
R0 )2 G2 + 4 (
a
R0 )3 G3 ] [4.2]
Elliptical Crack
Section of a pipe
Imaginary
circle
55
Where R0 is the outer radius of the pipe and G0, G1, G2, G3 are the influence factors for four
polynomial terms for uniform, linear, quadratic and cubic distributions, respectively. The influence
coefficients are obtained from FEA. Crack shape parameter, Q in Eq. (4.1) can be found from Eq.
(4.3), Raju and Newman (1982):
Q = 1 + 1.464 ( a
c ) 1.65
for a ≤ c [4.3]
In this study, an elliptical external surface crack (a/c =1) on a pipe in the longitudinal direction is
considered for validation of the FE model developed using Abaqus. The outer diameter of the cast
iron is considered as 220 mm, and the thickness is 10 mm to satisfy the relative wall thickness
(t/R) and relative crack depth (a/t) mentioned in Raju and Newman (1982). The depth of crack (a)
is considered as 5 mm. During the analysis, an internal pressure of 600 kPa is applied. Although
cast iron shows nonlinear stress–strain behavior, it is assumed as a linear elastic material. A
Young’s modulus of 125 GPa and Poisson’s ratio of 0.25 are considered. The pipe is defined as
3D deformable solid bodies. For modelling of the crack, a partition is applied on the pipe’s crack
face. The crack is then defined using Abaqus command along the partition.
Calculation of SIF along a crack in pressure tube requires fine meshes around the crack tip
that result in a large number of elements in the FE model. This large number of elements increases
the computational time and the memory requirement of the computer. To overcome the problem,
a sub-model technique available in Abaqus is applied. In this approach, a global model is first run
with larger element sizes to calculate the stress and displacement fields. A sub-model with fine
mesh around the crack is then reanalyzed under the stress and displacement fields from the global
model.

56
Figure 4.4: Global model and sub-model
Sub-model
domain
Global model
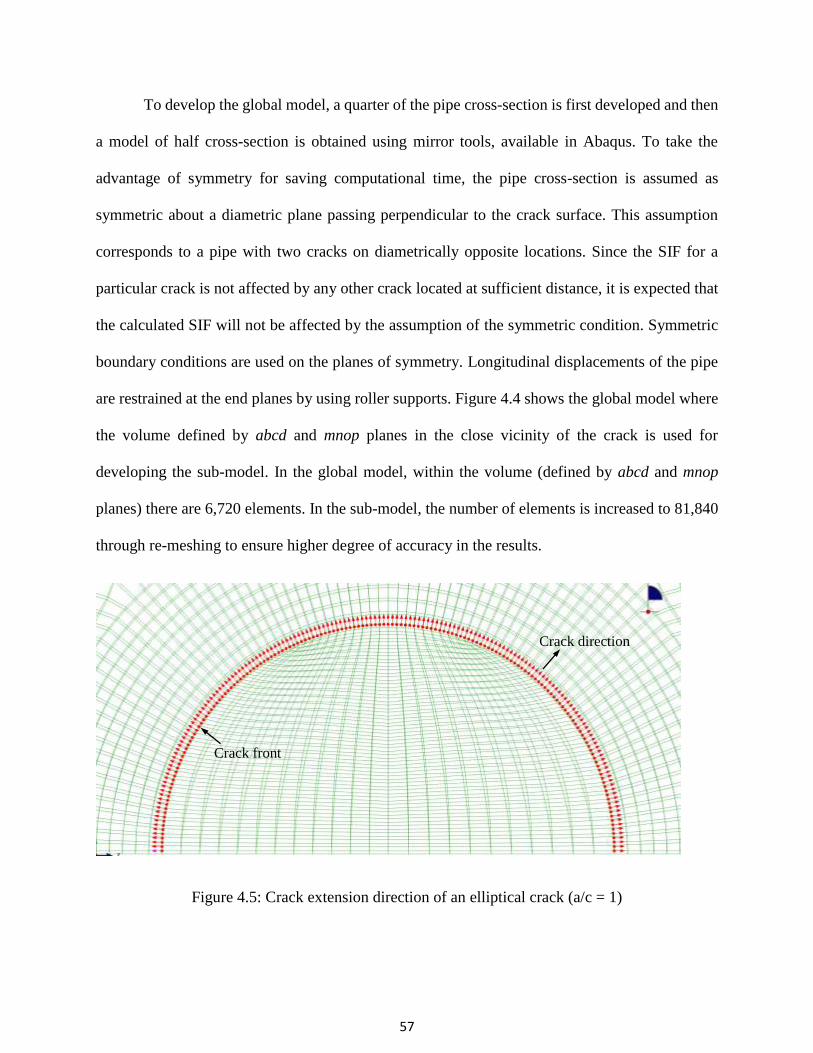
57
To develop the global model, a quarter of the pipe cross-section is first developed and then
a model of half cross-section is obtained using mirror tools, available in Abaqus. To take the
advantage of symmetry for saving computational time, the pipe cross-section is assumed as
symmetric about a diametric plane passing perpendicular to the crack surface. This assumption
corresponds to a pipe with two cracks on diametrically opposite locations. Since the SIF for a
particular crack is not affected by any other crack located at sufficient distance, it is expected that
the calculated SIF will not be affected by the assumption of the symmetric condition. Symmetric
boundary conditions are used on the planes of symmetry. Longitudinal displacements of the pipe
are restrained at the end planes by using roller supports. Figure 4.4 shows the global model where
the volume defined by abcd and mnop planes in the close vicinity of the crack is used for
developing the sub-model. In the global model, within the volume (defined by abcd and mnop
planes) there are 6,720 elements. In the sub-model, the number of elements is increased to 81,840
through re-meshing to ensure higher degree of accuracy in the results.
Figure 4.5: Crack extension direction of an elliptical crack (a/c = 1)
Crack front
Crack direction

58
For the sub model, the boundary condition option of sub-model, available in Abaqus, is applied at
the faces abcd and mnop and thus the stress and displacement fields from the global model are
transferred to these faces. Axially restrained boundary conditions are applied on faces abmn and
cdpo.
The contour integral method is used for calculating the SIFs along the crack tip. The
contour integral method requires defining the crack front, and specifying the virtual crack
extension direction. The crack extension direction is assigned orthogonal to the crack front
(perpendicular to the ellipse) which varies along the elliptical crack front. To specify the crack
extension direction in Abaqus, a single q vector is first defined. The input file data is then edited
to correct the q vectors at each node to make orthogonal to the crack front (Figure 4.5). A seam is
assigned that creates overlapping nodes and allows the crack to open when loaded (Figure 4.6).
Figure 4.6: Crack front and seam location

59
In the contour integral method, five contours are specified using the Abaqus command.
Abaqus automatically selects the elements that form each ring of contour from the crack line. Each
contour provides an evaluation of the contour integral that is path-independent and has same
energy. The first contour usually shows abrupt results as it is defined by specifying the nodes at
the crack tip and is ignored (Figure 4.7) (Dassault Systemes 2014). Figure 4.7 shows one-half
portions of the contours, which are symmetric about the crack plane.
Figure 4.7: Five contours and crack location
Twenty-nodded brick elements with reduced integration (C3D20R) and eight-nodded
linear brick elements (C3D8R) are used in the FE analysis to examine the suitability of elements
to be used in the analysis. Element size is determined through a mesh sensitivity analysis. The SIFs
at the location = 0 along the crack calculated using C3D20R elements are plotted in Figure 4.8
for four contours (except the first one). In Figure 4.8, the SIFs calculated from each of the contours
2nd contour
3rd contour
4th contour
1st contour
5th contour
Crack

60
Figure 4.8: SIFs of four contour around the crack front ( = 0)
Figure 4.9: SIF at various contour ( = 0)
0
0.1
0.2
0.3
0.4
0.5
0.6
0.7
0 100 200 300 400 500 600
Str
ess
inte
nsi
ty f
acto
r (M
pa√
m)
Internal pressure (kPa)
Contour 2
Contour 3
Contour 4
Contour 5
0
0.1
0.2
0.3
0.4
0.5
0.6
0.7
0.8
0 1 2 3 4 5 6
Str
ess
inte
nsi
ty f
acto
r (M
Pa.
√m
)
Contour number
SIFs obtained from backward extrapolation
Using C3D8R elements
Using C3D20R elements
Equation of Raju and Newman (1982)
Linear (Using C3D8R elements)

61
are the same. The FE analysis with C3D20R elements thus simulated successfully the path-
independent contour integrals. However, the use of C3D20R elements require higher calculation
effort and sometimes it is not possible to perform analysis due to lack of computational capacity
for complex problems involving a large number of elements. On the other hand, the use of C3D8R
elements provide constant strain in the elements and requires less computational effort. The SIFs
calculated using C3D8R elements is found to vary from contour to contour as shown in Figure 4.9,
which is potentially due to the errors in the calculated stress field in the vicinity of the crack tip.
However, the variation of SIFs in Figure 4.9 is not significant. Recognizing the limitations of FE
analysis in accurately calculating the stress field in the vicinity of crack tip, Fisher-Cripps (2007)
proposed to plot the SIF obtained for different contours located at various distances from the crack
tip against the distance from the tip and extrapolate the best fit curve backward to the tip (distance
= 0) to estimate the SIF. The SIF is obtained using the method proposed in Fisher-Cripps (2007)
as shown in Figure 4.9 from FE analysis with C3D8R elements. This SIF is around 4% less than
the SIF calculated using C3D20R elements and matched with the value calculated using the
equation of Raju and Newman (1982). The SIFs estimated from FE analysis using this method
throughout the crack length are compared with those calculated using the equation of Raju and
Newman (1982) in Figure 4.10. The comparison shows good agreement (<5% error) of the results
of FE analysis with those from the equation of Raju and Newman (1982). Randeniya et al. (2016)
also found FE calculations of SIFs within 5% of the values calculated using the equation of Raju
and Newman (1982). FE analysis with C3D8R elements is therefore used for buried pipes where
the method proposed in Fisher-Cripps (2007) is used for estimating the SIFs.

62
Figure 4.10: Comparison of SIFs (obtained from the equation of Raju and Newman (1982) and
current FEA)
4.2.2 SIF calculation for buried pipeline
Three-dimensional pipeline-soil interaction analysis is performed using Abaqus to assess
the SIFs for buried pipes with a wall crack. The soil and pipe are modelled as a 3D deformable
solid body. The pipeline and crack geometries similar to those discussed above for in-air pipe are
considered. Soil is assumed as an elasto-plastic material and defined by the Mohr–Coulomb failure
criteria. Material parameters typical for medium dense sand are used, as shown in Table 4.1.
Table 4.1. Material Parameters
Material Properties Soil Cast Iron
Density (gm/cm3) 1.77 7.88
Young’s modulus (MPa) 24 125,000
Poisson’s Ratio 0.25 0.25
Friction Angle in () 38 -
Dilation Angle in () 8 -
Cohesion Yield Stress (kPa) 0.1 -
0
0.1
0.2
0.3
0.4
0.5
0.6
0.7
0.8
0 50 100 150 200
Str
ess
inte
nsi
ty f
acto
r (M
Pa√
m)
Parametric angle (ϕ)
Equation of Raju and Newman (1982)
Current FEM Analysis
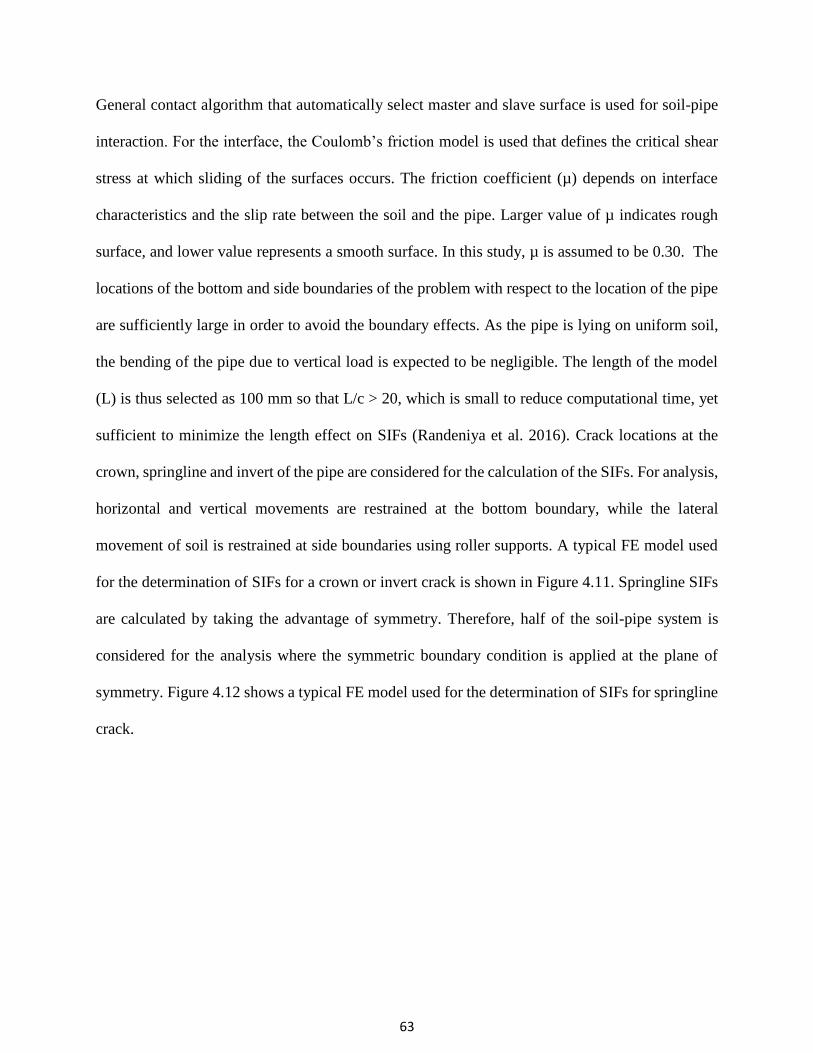
63
General contact algorithm that automatically select master and slave surface is used for soil-pipe
interaction. For the interface, the Coulomb’s friction model is used that defines the critical shear
stress at which sliding of the surfaces occurs. The friction coefficient (µ) depends on interface
characteristics and the slip rate between the soil and the pipe. Larger value of µ indicates rough
surface, and lower value represents a smooth surface. In this study, µ is assumed to be 0.30. The
locations of the bottom and side boundaries of the problem with respect to the location of the pipe
are sufficiently large in order to avoid the boundary effects. As the pipe is lying on uniform soil,
the bending of the pipe due to vertical load is expected to be negligible. The length of the model
(L) is thus selected as 100 mm so that L/c > 20, which is small to reduce computational time, yet
sufficient to minimize the length effect on SIFs (Randeniya et al. 2016). Crack locations at the
crown, springline and invert of the pipe are considered for the calculation of the SIFs. For analysis,
horizontal and vertical movements are restrained at the bottom boundary, while the lateral
movement of soil is restrained at side boundaries using roller supports. A typical FE model used
for the determination of SIFs for a crown or invert crack is shown in Figure 4.11. Springline SIFs
are calculated by taking the advantage of symmetry. Therefore, half of the soil-pipe system is
considered for the analysis where the symmetric boundary condition is applied at the plane of
symmetry. Figure 4.12 shows a typical FE model used for the determination of SIFs for springline
crack.

64
Figure 4.11: Global model of a buried pipeline for the determination of SIFs for a crown or
invert crack
Figure 4.12: Global model of a buried pipeline for springline SIFs calculation
4 m
4
0.1
m
4m
2m 0.1 m
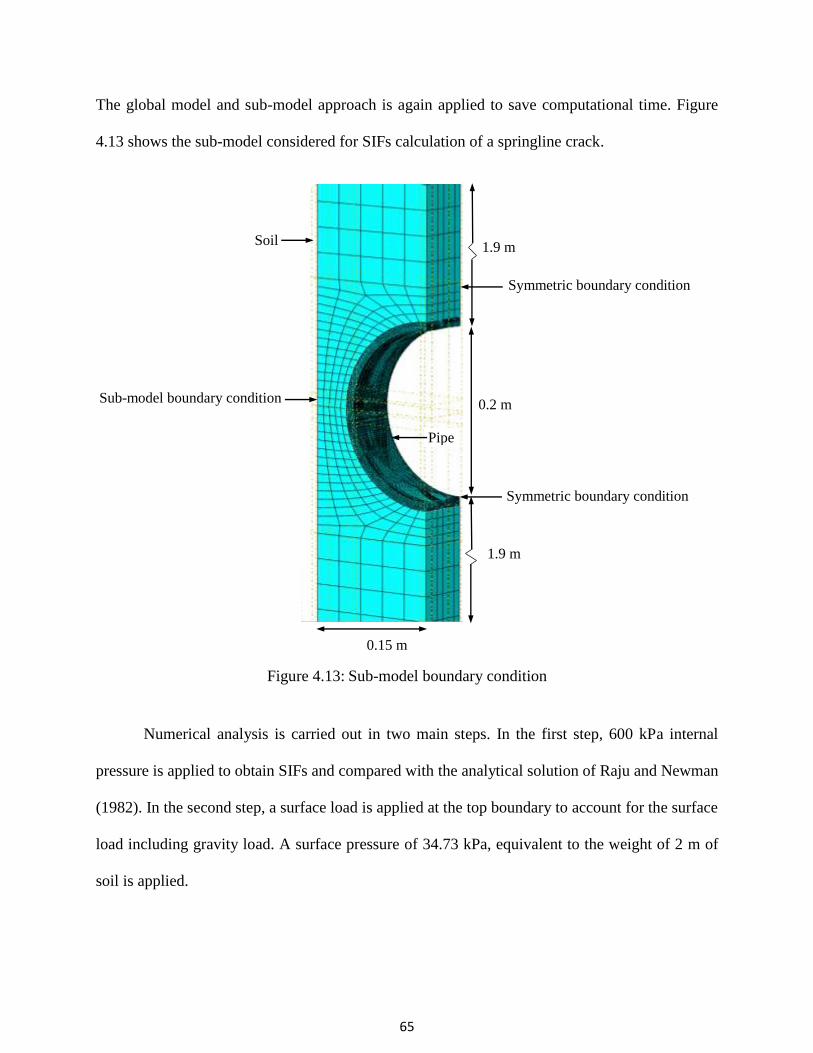
65
The global model and sub-model approach is again applied to save computational time. Figure
4.13 shows the sub-model considered for SIFs calculation of a springline crack.
Figure 4.13: Sub-model boundary condition
Numerical analysis is carried out in two main steps. In the first step, 600 kPa internal
pressure is applied to obtain SIFs and compared with the analytical solution of Raju and Newman
(1982). In the second step, a surface load is applied at the top boundary to account for the surface
load including gravity load. A surface pressure of 34.73 kPa, equivalent to the weight of 2 m of
soil is applied.
1.9 m
1.9 m
0.2 m
Symmetric boundary condition
Symmetric boundary condition
Soil
Sub-model boundary condition
Pipe
0.15 m

66
It is to be noted that SIFs for pipelines subjected to surface load has not been extensively
investigated earlier. Existing literature focused on calculating SIFs for pipelines subjected to
internal pressure only. In the current study, the SIFs of buried pipes under internal pressure and
surface load are examined at various locations of an elliptical crack. SIFs for a crack in corrosion
defect for a buried water main is also calculated considering half ellipsoidal shape of corrosion
(Figure 4.14).
Figure 4.14: Crack front and corrosion location for a crack in corrosion defect
To identify the crack propagation direction for assigning during application of contour
integral method, analyses with extended finite element method (XFEM), available in Abaqus, are
first performed. Figure 4.15 shows a crack predicted using the XFEM analysis, which is essentially
in the longitudinal direction. Therefore, longitudinal crack is assigned at the location determined
from XFEM in the SIF calculation using the contour integral method. Table 4.2 shows the pipe
dimensions and defect geometries considered.

67
Figure 4.15: Crack propagation using XFEM
Table 4.2. Pipe dimensions and defect geometries
Geometries Values
Pipe diameter, D (mm) 220
Wall thickness, t (mm) 10
Corrosion depth, d (mm) 3.3
Corrosion length, l (mm) 13
Corrosion width, w (mm) 6.5
Crack depth, dc (mm) 1.7
Crack length, lc (mm) 10
4.3 SIF for buried pipes
Numerical analysis is first performed to investigate the critical SIFs for longitudinal and
circumferential cracks of a buried cast iron pipeline. Figure 4.16 shows that SIFs is much higher
for longitudinal crack than the circumferential crack. As a result, longitudinal crack is considered
for further analysis.
Crack

68
Figure 4.16: SIFs for a longitudinal and circumferential crack
The SIFs calculated for a longitudinal crack located at the springline and crown/invert of a
buried pipeline are compared in Figure 4.17. Figure 4.17 shows that the SIF is higher for the
springline crack than for a crown or invert crack. The SIFs calculated using the equation of Raju
and Newman (1982) are also included in the figure. It is to be noted that the equation of Raju and
Newman (1982) is only applicable under the loading of internal pressure. Due to the application
of surface load, the SIFs at the springline is increased and SIFs at the crown/springline is decreased
from the values under the internal pressure load only (calculated using the equation of Raju and
Newman 1982).
0
0.1
0.2
0.3
0.4
0.5
0.6
0.7
0.8
0 50 100 150 200
Str
ess
inte
nsi
ty f
acto
r (M
Pa√
m)
Parametric angle (ϕ)
Longitudinal crack
Circumferential crack

69
Figure 4.17: SIFs in springline and invert position, considering combined loading condition
The contribution of the internal pressure and external load independently on the SIFs are
also obtained from FE calculations, as plotted in Figure 4.18. Figure 4.18 shows that FE calculation
of SIFs under internal pressure matches reasonably with the values calculated using the equation
of Raju and Newman (1982), which was developed for the in-air pipe. This implies that the
surrounding soil does not have a significant effect on the SIFs due to the internal pressure. The
equation of Raju and Newman (1982) can be used for calculation of SIFs under internal pressure
of buried pipe. The SIFs under the surface can be separately calculated and added to the SIFs under
the internal pressure to obtain the total SIFs. The SIFs for a buried pipe can be expressed as:
K = Kpressure + Ksurface [4.4]
0
0.1
0.2
0.3
0.4
0.5
0.6
0.7
0.8
0.9
1
0 50 100 150 200
Str
ess
inte
nsi
ty f
acto
r (M
Pa√
m)
Parametric angle (φ)
Equation of Raju and Newman (1982) (considering only internal pressure)
Springline SIFs (cosidering internal pressure & surface load)
Invert SIFs (considering internal pressure & surface load)

70
Figure 4.18: SIF for ‘crack only defect’ for a springline crack
Where, Kpressure corresponds to the SIF due to internal pressure and Ksurface corresponds to the SIFs
due to surface load. Kpressure can be calculated using the equation of Raju and Newman (1982). For
Ksurface, the results of FE analysis are used to develop a simplified equation as shown in Equation
(4.5).
Ksurface = q√𝜋𝑎
𝑄 Fs (a/c, a/t, t/R,) [4.5]
Where, q is the surface load, and Fs is the influence coefficient of soil. The crack shape
parameter, Q is recommended in Ichsan (1994) is assumed to be applicable for this case.
The parameter can be accurately approximated by Equation 4.6 and 4.7 (Ichsan 1994).
0
0.1
0.2
0.3
0.4
0.5
0.6
0.7
0.8
0.9
1
0 50 100 150 200
Str
ess
inte
nsi
ty f
acto
r (M
Pa√
m)
Parametric angle (φ)
Equation of Raju and Newman (1982) (considering only internal pressure)
Springline SIFs (cosidering internal pressure & 2 m soil cover pressure)
Springline SIFs (considering only internal pressure)
Springline SIFs (considering only 2 m soil pressure)
71
Q = 1 + 1.464 ( a
c ) 1.65
for a ≤ c [4.6]
Q = 1 + 1.464 ( c
a ) 1.65
for c ≤ a [4.7]
To simulate the gravity load, the surface load can be estimated as q = ρgh, where ρ, g, h is the
density, specific gravity, depth of soil cover, respectively.
The influence coefficients along the surface crack are determined using the results of FE
analysis and listed in Table 4.3 for the particular crack considered (a/c=1, t/R =1).
Table 4.3. Influence coefficient for external surface crack (t/R =1)
a/c
parametric angle ()
Springline influence
coefficient, Fs
Crown or invert influence
coefficient, Fs
0 135.783 - 168.209
π/8 115.350 - 120.583
1 π/4 97.711 - 83.598
3π/8 82.078 - 62.318
π/2 76.120 - 55.732
SIFs for corroded pipe subjected to crack (‘crack in corrosion defect’) are also calculated
and are presented in Figure 4.19. In this study, a total 5 mm defect depth is considered by assigning
3.3 mm of corrosion depth and 1.7 mm of crack depth. SIFs in Figure 4.19 are similar to those
obtained for the crack only defect (presented in Figure 4.18). SIFs for internal pressure calculated
using the equation of Raju and Newman (1982) with the crack depth as 5 mm (total of the corrosion
and crack depths) is included in Figure 4.19. The equation with a total depth of defect can therefore,
be used to calculate the SIFs for ‘crack in corrosion defect’ using the simplified equations.

72
Figure 4.19: SIF for ‘crack in corrosion defect’ for a springline crack
Figure 4.20: Comparison of ‘crack only defect’ and ‘crack in corrosion defect’
0
0.1
0.2
0.3
0.4
0.5
0.6
0.7
0.8
0.9
1
0 50 100 150 200
Str
ess
inte
nsi
ty f
acto
r (M
Pa√
m)
Parametric angle (φ)
Equation of Raju and Newman (1982) (considering only internal pressure)
Springline SIFs (cosidering internal pressure & 2 m soil cover pressure)
Springline SIFs (considering only internal pressure)
Springline SIFs (considering only 2 m soil pressure)
0
0.1
0.2
0.3
0.4
0.5
0.6
0.7
0.8
0.9
1
0 50 100 150 200
Str
ess
inte
nsi
ty f
acto
r (M
Pa√
m)
Parametric angle (φ)
Springline SIFs (Crack only defect)
Springline SIFs (crack in corrosion defect)
Invert SIFs (Crack only defect)
Invert SIFs (crack in corrosion defect)

73
Figure 4.20 compares the SIFs for ‘crack only defect’ and ‘crack in corrosion defect’
obtained from FE analysis. The calculated SIFs for the ‘crack only defect’ and the ‘crack in
corrosion defect’ are almost same in the figure. This reveals that the solution developed for crack
only defect (presented in Table 4.3) can be used for ‘crack in corrosion defect’ using total depth
of defect as the crack depth.
4.5 Conclusion
In this study, FEA is used to investigate SIFs for a buried pipeline subjected to wall crack
and ‘crack in corrosion’ defects. The analysis is performed using the contour integral method
available in Abaqus FE software. Major numerical issues for the application of the contour integral
method in calculating SIFs includes assignment of crack location, defining crack propagation
direction and the computational requirements to deal with fine mesh requirements. XFEM analysis
is performed to identify the crack location to assign during the analysis for calculation of SIFs. A
sub-model technique is used to deal with the computational requirement to use fine mesh in a
smaller region around the crack. The key finding from this study is presented below:
The proposed FE modelling technique can be used to calculate SIF for buried
pipeline. However, for properly calculating SIFs, one should be careful in
assigning crack propagation direction which must be perpendicular to the crack
face. The FE analysis with C3D8R elements successfully simulated the SIFs
obtained from the equation of Raju and Newman (1982) for the in-air pipe.
The SIFs due to internal pressure is not affected by the surrounding soil and
therefore can be calculated using the equation of Raju and Newman (1982).

74
A new equation is developed for calculating the SIFs due to the effect of surface
load, which can be added to the SIFs due to the internal pressure to calculate the
total SIFs.
For the pipe with ‘crack in corrosion defect’, the simplified equation for SIFs can
be used using the total depth of the defect (including corrosion depth and crack
depth) in the equation.
References
Dassault Systemes. (2014). ABAQUS/CAE user’s guide. Dassault Systemes Simulia Corp.
Providence, RI, USA.
Diamantoudis, A.T. & Labeas, G.N. (2005). “Stress intensity factors of semi-elliptical surface
cracks in pressure vessels by global-local finite element methodology.” Engineering Fracture
Mechanics, vol. 72, no. 9, pp. 1299-312.
Fisher-Cripps, C.A. (2007). “Introduction to Contact Mechanics,” 2nd Ed., New South Wales,
Australia.
Ichsan S.P. (1994). “Fatigue crack growth predictions of surface cracks under constant amplitude
and variable amplitude loading.” Faculty of Aerospace Engineering. Delft University of
Technology.
Folkman, S. (2018) “Water Main Break Rates in the USA and Canada: A Comprehensive Study”.
Mechanical and Aerospace Engineering Faculty Publications. Paper 174.
Li, C.Q., & Yang, S.T. (2012). “Stress intensity factors for high aspect ratio semi-elliptical internal
surface cracks in pipes”. International Journal of Pressure Vessels and Piping, vol. 96–97, pp.
13-23.

75
Li, C.Q., Fu, G., & Yang, W. (2016a). “Stress intensity factors for inclined external surface cracks
in pressurised pipes”. Engineering Fracture Mechanics, 165, 72–86.
doi:10.1016/j.engfracmech.2016.08.014
Li, Y., Hasegawa, K., & Udagawa, M. (2016b). “Development of Stress Intensity Factors for
Cracks with Large Aspect Ratios in Pipes and Plates”. Journal of Pressure Vessel Technology,
139(2), 021202.
Lin, X.B. and Smith, R.A. (1998). “Fatigue growth prediction of internal surface cracks in pressure
vessels.’’ Journal of Pressure Vessel Technology-Transactions of the ASME, Vol. 120, pp. 17–
23, 1998
Mohebbi, H., & Li, C. Q. (2011). “Experimental Investigation on Corrosion of Cast Iron Pipes”.
International Journal of Corrosion, 2011, 1–17. doi:10.1155/2011/506501
Moulick, S.K. & Sahu, Y.K. (2012). “Stress Intensity Factor for Cracks in Thick Pressure Vessels
using Weight Function Technique”. National Conference on Innovative Paradigms in
Engineering and Technology (NCIPET 2012)
Predan, J., Močilnik, V., & Gubeljak, N. (2013). “Stress intensity factors for circumferential semi-
elliptical surface cracks in a hollow cylinder subjected to pure torsion”. Engineering Fracture
Mechanics, vol. 105, pp. 152-68.
Raju, I. S., & Newman, J. C. (1982). “Stress-Intensity Factors for Internal and External Surface
Cracks in Cylindrical Vessels”. Journal of Pressure Vessel Technology, 104(4), 293.
doi:10.1115/1.3264220
Randeniya, C., Robert, D., Fu, G., and Li, C. (2016). “The effect of corrosion patch geometry on
stress intensity factors for external surface cracks in cast iron water mains”. Proceedings of the

76
4th International Conference on Sustainable Construction Materials and Technologies
(SCMT4), Nevada, United States, 7-11 August 2016, pp. 1673-1680.

77
CHAPTER 5
Conclusions and Recommendations for Future Research
5.1 Conclusions
Cast iron water mains cover a significant portion of the municipal water distribution
system. Assessing the structural strength of the deteriorating water mains has been a challenge for
the municipalities. Due to the limitations of existing continuum based analysis in the failure
assessment of the water main, a fracture mechanics approach is gaining attention for the failure
assessment of the pipes. However, the tools for applying the fracture mechanics approach such as
available material parameter and a method of assessing stress intensity factor (SIF) are not well
developed. This research focuses on developing a method for calculating stress intensity factors
for buried pipe and developing materials parameters for fracture mechanics based strength
assessment of municipal cast iron water mains. Finding from this research are summarized as
follow.
5.1.1 Assessment of material parameter
Two cast iron water mains exhumed from two nearby cities (City of St. John’s and City of
Mount Pearl) in the Province of Newfoundland and Labrador in Canada are considered to
investigate the properties of cast iron. The samples are first scanned with an electron beam to
produce a magnified image in SEM lab of Memorial University to determine the type of cast iron
by analyzing the graphite flake shapes and orientations. In the SEM tests, both of the specimens
show a very fine pattern of flakes with the surrounding areas without graphite and therefore, are
classified as a spun cast iron.
78
Flat coupons extracted from the two separate exhumed cast iron water mains are also tested
to determine the tensile strength and deformation properties such as ultimate strength, yield
strength, modulus of elasticity and Poisson’s ratio. Test data reveal that mechanical properties of
cast iron may vary significantly. The rate of loading is found to have no influence on the stress–
strain behavior. The cast iron pipe materials showed negligible plastic strain at a stress less than
75 MPa beyond which the plastic strain is significant. Thus, the elastic limit of the cast iron pipe
material is 75 MPa which is around 25% less than the yield strength calculated using the 0.01%
offset method. SENB tests are performed to determine the fracture toughness by using simple
chevron (V) notch instead of the complex ‘straight through notch’ as it is difficult to fabricate the
‘straight through notch’ and the application of fatigue pre-cracking is also not feasible due to low
fracture toughness of the brittle cast iron pipe material. The test results are evaluated using FE
calculation of SIF. The results of FE analysis reveal that chevron (V) notch can be used instead of
the complex ‘straight through notch’ for fracture toughness determination of cast iron pipe
materials. The material parameters determined from the tests are employed for fracture mechanics
based strength assessment of a buried water main. The study of the buried cast iron water mains
under various loading conditions demonstrates that the SIF is significantly affected by pit shape
and the erosion void at the bedding. The SIF is higher in the circumferential direction than in the
longitudinal direction across the corrosion pit. As a result, crack propagation is expected along the
circumferential direction. Three corrosion pit shapes (circular, diamond and elliptical) are
considered in this study where the diamond shaped pit with sharp tips caused the highest SIF.
Although the calculated SIF does not exceed the fracture toughness for the pipe material, it may
cause failure due to subcritical crack growth in a corrosive environment.

79
5.1.2 Method for calculating SIFs
In this study, fracture mechanics approach is used to investigate SIFs for a buried pipeline
subjected to ‘crack only defects’ and ‘crack in corrosion defects’. The contour integral method
available in Abaqus FE software is used for the analysis. Major numerical issues for the application
of the contour integral method in calculating SIFs includes assignment of crack location, defining
crack propagation direction and the computational requirements to deal with fine mesh
requirement. To identify the crack location and crack propagation direction, XFEM analysis is
performed as the contour integral method requires defining the crack front, and specifying the
virtual crack extension direction. The study shows that for properly calculating SIFs on an elliptical
crack, crack propagation direction must be assigned perpendicular to the crack face. A finer mesh
in a smaller region around the crack is created to deal with the computational requirement by using
sub-model technique, available in Abaqus. The FE analysis with C3D8R and C3D20R elements
are considered and the study reveals that C3D8R elements along with C3D20R elements
successfully simulated the SIFs obtained from the equation of Raju and Newman (1982) for the
in-air pipe. The FE analysis is also performed for a buried pipe and shows that the SIFs due to
internal pressure has no influence by the surrounding soil and therefore the equation of Raju and
Newman (1982) can be used. A new equation is developed for calculating the SIFs due to the effect
of surface load, which can be added to the SIFs due to the internal pressure to calculate the total
SIFs. For the pipe with ‘crack in corrosion defect’, the simplified equation for SIFs can be used
using the total depth of the defect (including corrosion depth and crack depth) in the equation.
5.2 Recommendations for Future Study
The study presented here investigates the mechanical properties for two cast iron water main
segments extracted from two municipalities in Canada. The study reveals that mechanical

80
properties vary significantly for cast iron pipe materials. Therefore, further laboratory
investigations are recommended to develop a more comprehensive database to examine the
variability in the material parameters. Some specific recommendation for future research in this
area included below:
i. Perform additional tests to determine the mechanical properties of a wide variety of cast
iron pipe material.
ii. Conduct a statistical analysis to determine the statistical distribution of the material
parameters.
iii. Conduct a reliability assessment of cast iron water main considering statistical distribution
of mechanical parameters and loads.
This research also develops numerical modelling techniques for the assessment of stress
intensity factors for buried pipelines. SIFs determined for a limited crack geometry (a/c =1)
are presented. The developed technique can be used to develop tools for SIF assessment of
wide variations of pipe and corrosion geometries. A few recommendations for future research
in this area are outlined below:
i. SIFs can be determined for the different shape of crack (a/c), relative wall thickness (t/R)
and relative crack depth (a/t) for external as well as internal surface crack.
ii. Fatigue failure may occur in cast iron pipeline that can be considered for future studies.
iii. Conduct field monitoring to obtain more information on corrosion geometries and develop
design tools for failure assessment for these geometries.

81
References (for Chapter 1 and 2)
Arias-González, F., del Val, J., Comesaña, R., Penide, J., Lusquiños, F., Quintero, F., Pou, J.
(2016). “Fiber laser cladding of nickel-based alloy on cast iron”. Applied Surface Science, 374,
197–205.doi:10.1016/j.apsusc.2015.11.023
Caproco Corrosion Prevention Ltd. (1985). Underground corrosion of water pipes in Canadian
cities. Case: The city of Calgary. Report prepared for CANMET, Ottawa, Canada.
CES Edupack 2013. Granta Design Limited, Cambridge.
Conlin, R. M., and Baker, T. J. (1991). “Application of fracture mechanics to the failure behaviour
of buried cast iron mains.” Contract Rep. No. 266, Transport and Road Research Laboratory,
London.
Dowling N.E. (2013). “Mechanical Behavior of Materials, Engineering Method for Deformation,
Fracture and Fatigue”. Fourth edition. Pearson Education Limited, Essex, England.Fahimi, A.,
Evans, T. S., Farrow, J., Jesson, D. A., Mulheron, M. J., & Smith, P. A. (2016). “On the residual
strength of aging cast iron trunk mains: Physically-based models for asset failure”. Materials
Science and Engineering: A, 663, 204–212. doi:10.1016/j.msea.2016.03.029
Granta (2018) “CES Edupack 2018 Installation Guide.” http:www.grantadesign.com/education/
Griffith, A.A., (1921). “The phenomena of rupture and flow in solids”. Philosophical Transactions.
Series A, 221, 163-198.
Jesson, D.A., Le Page, B.H., Mulheron, M.J., Smith, P.A., Wallen, A., Cocks, R., Farrow, J., and
Whiter, J.T. (2010). “Thermally induced strains and stresses in cast iron water distribution
pipes: an experimental investigation”. Journal of Water Supply Research and Technology-
Aqua, 59. pp. 221-229.

82
Ji J., Zhang C., Kodikara, J., and Yang S. (2015) “Prediction of stress concentration factor of
corrosion pits on buried pipes by least squares support vector machine”, Engineering Failure
Analysis, Vol. 55 (2015), 131-138.
Koeble, T. F. and Hogan, T.W. (1967). “Cast iron soil pipe and fittings handbook”. Cast iron soil
pipe institute, Chattanooga, Tennessee.
Finkel L. M. (2018). “Pipeline Politics: Assessing the Benefits and Harms of Energy Policy”. Santa
Barbarana, California.
Folkman, S. (2018). “Water Main Break Rates in USA and Canada: A Comprehensive Study”.
Mechanical and Aerospace Engineering Faculty Publications. Paper 174.
Inglis, C. E., (1913). “Stresses in a plate due to the presence of cracks and sharp corners”,
Transactions of the Institute of the Naval Architects 55, 219-241.
Irwin, G.R., (1957). “Analysis of stress and strain near the end of a crack traversing a plate”.
Journal of Applied Mechanics 24, 361-364.
Kamel S., Meguid M.A. (2008). “An experimental study of soil erosion around leaking pipes”.
North American Society for Trenchless Technology, Dallas, Texas.
Liyanage, K.T.H (2016). Numerical investigation of failure mechanics of cast iron water mains.
M.Eng. Thesis, Memorial University of Newfoundland, St. John’s, NL, Canada.
Liyanage, K.T.H and Dhar, A.S. (2017). “Effects of corrosion pits on the wall stresses in cast iron
water mains.” ASCE Journal of Pipeline Systems - Engineering and Practice, 8(4): 04017023
Liyanage, K.T.H and Dhar, A.S. (2018) “Stresses in Cast Iron Water Main Subjected to Non-
Uniform Bedding and Localized Concentrated Forces”, International Journal of Geotechnical
Engineering, 12(4), 368-376.

83
Ma, Z., and Yamada, K. (1994). “Durability evaluation of cast iron water supply pipes by sampling
tests” Proc., Structural Engineering, Japan Society of Civil Engineers, Tokyo, 40A.
Makar, J.M., Desnoyers, R. and McDonald, S.E. (2001). “Failure modes and mechanisms in gray
cast iron pipe.” Proceedings of the International Conference on Underground Infrastructure
Research, pp. 303-312. Netherlands.
Makar, J. M., Rogge, R., McDonald, S., and Tesfamariam, S. (2005). “The Effect of Corrosion
Pitting on Circumferential Failures in Grey Iron Pipes.” American Water Works Association,
Denver.
Makar, J. M., & McDonald, S. E. (2007). “Mechanical Behavior of Spun-Cast Gray Iron Pipe”.
Journal of Materials in Civil Engineering, 19(10), 826–833. doi:10.1061/(asce)0899-
1561(2007)19:10(826)
Mondal, B. (2018). “Remaining strength assessment of deteriorating energy pipeline”. PhD Thesis,
Memorial University of Newfoundland, St. John’s, NL, Canada.
Rajani, B. and McDonald, S., (1995) “Water main break data for different pipe materials
for 1992 and 1993”, Report A-7109.1, Ottawa, Ontario, National Research Council.
Rajani, B. B., Makar, J. M., McDonald, S. E., Zhan, C., Kurakao, S., Jen, C.-K., and Viens, M.
(2000). “Investigation of grey cast iron water mains to develop a methodology for estimating
service life”. AwwaRF and AWWA, Denver.
Seica, M. V., & Packer, J. A. (2004). “Mechanical Properties and Strength of Aged Cast Iron Water
Pipes”. Journal of Materials in Civil Engineering, 16(1), 69–77. doi:10.1061/(asce)0899-
1561(2004)16:1(69)
Talbot, A.N. (1926). “Strength Properties of Cast Iron Pipe Made by Different Processes as Found
by Tests”, Journal of the American Water Works Association, Vol. 16, July, pp.1- 44

84
Terfas, O. A. (2010). “Quantification of constraint in three-dimensional fracture mechanics”. PhD
thesis university of Glasgow.
Wang. W., Zhou. A., Robert. D.J. and Li.C.Q (2017). “Assessment of stress intensity factors for
cast iron pipes with pitting corrosion.” International Conference on Geomechanics, Geo-energy
and Geo-resources, Clayton, Monash University
Westergaard, H. M. (1939). “Bearing Pressures and crack”. Journal of Applied Mechanics 6, 49-
53
Yamamoto, K., Mizoguti, S., Yoshimitsu, K., & Kawasaki, J. (1983). Relation between Graphitic
Corrosion and Strength-degradation of Cast Iron Pipe. CORROSION ENGINEERING, 32(3),
157–162. doi:10.3323/jcorr1974.32.3_157
Zhang, C., Rathnayaka, S., Shannon, B., Ji, J., & Kodikara, J. (2017). “Numerical interpretation
of pressurized corroded cast iron pipe tests”. International Journal of Mechanical Sciences,
128-129, 116–124. doi:10.1016/j.ijmecsci.2017.04.015

85
APPENDIX A
Failure Analysis of Buried Cast Iron Water Main Using Fracture Mechanics
This research work has been published as Debnath S., and Dhar A. S. 2018. “Failure analysis of buried
cast iron water main using fracture mechanics” in the 71th Canadian Geotechnical Conference,
GeoEdmonton 2018, Alberta, Canada, September 23–26, 2018. Most of the research presented in this
chapter has been conducted by the first author. The other author, my supervisor Dr. Ashutosh Dhar
supervised the research by provided support in developing the idea, guidance on finite element
modelling and reviewed the manuscript.

86
Failure analysis of buried cast iron water main using fracture mechanics
Suborno Debnath, & Ashutosh Sutra Dhar Department of Civil Engineering – Memorial University of Newfoundland, St. John’s, NL, Canada ABSTRACT Water main failure, particularly for cast iron pipes, has been identified as a major concern for municipalities, as a number of water main breaks occur every year. Despite numerous past studies, pipe failure mechanisms observed in the field are not well understood. Conventional analyses using continuum based and Winkler spring based finite element methods calculate higher circumferential stress on the pipe wall which might lead to longitudinal wall cracking. However, circumferential cracking is the most commonly observed failure mode in water mains. In this paper, fracture mechanics is applied to study the stress concentrations in the buried pipe and offer new insights into the failure mechanisms of buried pipelines. Stress intensity factors for cast iron water mains with different shapes of corrosion defects are investigated using finite element analysis for crack assessment of the pipelines. The stress intensity factors are compared with the fracture toughness determined from laboratory tests. Keywords: Water main, Cast iron pipe, Stresses intensity factor, Failure mechanisms, Fracture mechanics, Finite-element analysis RÉSUMÉ La principale défaillance des conduites d'eau, en particulier pour les tuyaux en fonte, a été identifiée comme une préoccupation majeure pour les municipalités, étant donné qu'un certain nombre de bris de conduites d'eau se produisent chaque année. Malgré de nombreuses études antérieures, les mécanismes de rupture des conduites observés sur le terrain ne sont pas bien compris. Les analyses conventionnelles utilisant des méthodes d'éléments finis à base de continuum et de ressorts de Winkler calculent une contrainte circonférentielle plus élevée sur la paroi de la conduite, ce qui peut conduire à une fissuration de la paroi longitudinale. Cependant, la fissuration circonférentielle est le mode de rupture le plus couramment observé dans les conduites d'eau. Dans cet article, la mécanique de la rupture est appliquée pour étudier les concentrations de contraintes dans le tuyau enterré et offrir de nouvelles perspectives sur les mécanismes de défaillance des pipelines enfouis. Les facteurs d'intensité des contraintes pour les canalisations d'eau en fonte présentant différentes formes de défauts de corrosion sont étudiés à l'aide d'une analyse par éléments finis pour l'évaluation des fissures des canalisations. Les facteurs d'intensité de contrainte sont comparés à la ténacité à la rupture déterminée à partir d'essais en laboratoire. Mots clés: Conduite d'eau, Conduite en fonte, Facteur d'intensité des contraintes, Mécanismes de rupture, Mécanique de la rupture, Analyse par éléments finis INTRODUCTION Buried pipelines are used to transport drinking water, waste water or other fluids. There are different kinds of pipe materials used to carry water. Gray cast iron is one of them, which was generally installed in Canada in the middle of the 19th century. The aged pipes show deterioration and are prone to failure. Rajani et al. (1995) estimated that approximately 50% of water mains were gray cast iron, in their survey of 21 cities in Canada. Gray cast iron shows a tendency to corrode in the buried condition and may create corrosion pits which cause stress concentration around the pits. According to Folkman (2012), nearly 75 percent of all utilities have corrosive soil conditions. Corrosion is thus considered one of the main reasons for water main failure in Canada and the USA. Due to water main failure, 50% of the water has been reportedly lost in the city of Mount Pearl, Canada, which causes huge economic loss (Frick and Manuel, 2005). Cast iron water mains may fail due to
circumferential cracking, longitudinal cracking, joint failure or blowouts (Rajani et at, 1996). Circumferential failures mainly occur due to corrosion pits and it is the most common mode of failure for water distribution networks (Makar et al, 2005). Liyanage and Dhar (2015, 2017) showed that the stress concentration can be higher in the circumferential direction than the longitudinal direction around a pit of a pipe that is subjected to non-uniform bedding, which may create cracks in the longitudinal direction. The failure of the pipe occurs when the applied stresses in the pipe exceed the capacity of the pipe material (Gould et al, 2011). Trickey et al. (2016) showed that circumferential cracking in water mains may be caused due to longitudinal bending that results from non-uniform bedding support or a frost load in the soil above the pipe. Differential soil movement occurs due to frost penetration, which causes ring failure. The lack of ground support causes additional stresses on the pipe wall near the unsupported zone (Balkaya et al. 2012). Pipe stresses are

87
significantly affected by leaks opening, which may exceed the material strength and may fail in the vicinity of an opening where stress increases exponentially with the increase of crack length (Cassa et al, 2009). Dhar et al. (2004) revealed that the lack of soil support within a localized zone can lead to stress or strain concentration in flexible pipes. The stress or strain concentration was higher for pipes with higher stiffness relative to the soil (Dhar et al. 2004). Although these approaches are widely used to assess pipeline failure, fracture mechanics has not been extensively applied to investigate the failure of a pipeline. In fracture mechanics, the stress intensity factor (SIF) is generally used for the assessment of brittle fracture. The stress intensity factor was found to provide less error and is a more accurate way than using stress concentration for failure assessment (Dipen et al. 2015).
Limited research information is currently available in the literature on circumferential crack assessment in water mains using fracture mechanics. Some recent papers on stress intensity factor show that for a surface crack, the maximum stress intensity factor occurs at different points, leading to different modes of failure, because the type of loading affects the stress intensity factors (Li and Yang, 2012). However, no study on the effect of pit shape and non-uniform bedding with various lengths is available in the literature. In this paper, a three-dimensional finite element analysis is developed to determine the stress intensity factor for different shapes of corrosion pits of a cast iron water main that is supported by non-uniform bedding. A three-dimensional finite-element analysis is also performed to calculate the stress intensity factor of cast iron and compare it with the lab results, which helps to understand the failure mechanism. FRACTURE TOUGHNESS FROM LABORATORY TESTS Single-edge notch beam (SENB) tests were conducted in the lab by the research group at Memorial University of Newfoundland (Ali, 2017) with 3.2 mm, 4.7 mm and 6 mm pre-crack notches (V-notch) using ASTM E 1820-01(2001) where the width to depth ratio (W/B) of the specimens was kept in the range of 1 < W/B < 2. In those tests, a simple chevron (V) notch was used rather than a complex straight through notch, recommended in the ASTM standards (Figure 1). The main advantage of using a V notch is that the fabrication procedure is easier. Figure 2 shows the specimen used in SENB tests.
The clear span (S), depth (W) and thickness (B) of the specimen were 84 mm, 14 mm and 7 mm, respectively. Three-point loading was applied on the specimen and a linear voltage displacement transducer (LVDT) was attached to measure the displacement. The width of the V notch was 2.4 mm. The failure load was recorded for each specimen. Details of the test procedure are available in Ali, (2017). Fracture toughness Kc was then calculated from the failure load and crack length (ASTM E 1820-01, 2001) using the following equation Eq. (1).
Kc = PS
BW3/2 f (a/w) [1]
where f (a/w) = 3 (a/w)1/2
2 (1 + 2 a/w)(1 - a/w)3/2 * 1.99 - (a/w) *
(1 - a/w) * (2.15 - 3.93 * a/w + 2.7 * a2/w2) and P is the ultimate load, S is the clear span, B is the thickness, a is the crack length and w is the depth. Figure 1. ASTM E 1820-01 recommended specimen
Figure 2. Test specimen used
However, Eq. (1) is recommended in the ASTM standards for the specimen shape shown in Figure 1. To validate the applicability of Eq. (1), a 3D finite element model is developed using Abaqus to determine the fracture toughness of the specimen in the single-edge notch beam (SENB) tests. The cast iron specimen is defined as a 3D deformable solid body. For FE modeling, an 8-node linear brick element (C3D8R) is used. A Young’s modulus of 121 GPa and Poisson’s ratio of 0.25 are considered in this model, based on the data reported in Ali, (2017). The specimen is simply supported. The clear span (S), depth (W), and thickness (B) of the specimen are 84 mm, 14 mm and 7 mm, respectively. Pre-crack notches (V-notch) of 3.2 mm, 4.7 mm and 6 mm depth are considered as crack lengths. The width of the V notch is 2.4 mm. Figure 3 shows the finite element mesh considered in the model.
The contour integral method is used to determine the fracture toughness where the crack extension direction is along the normal to the crack plane. For each integral, five contours are specified. Figure 4 shows the crack extension direction.
2.25 W 2.25 W
W
0.1 W
Straight
through notch
a
42 mm 42 mm
14
m
m
2.4 mm
V notch
0.2 W

88
Figure 3. 3D finite element modeling of single-edge notch beam (SENB) test
Figure 4. Crack extension direction in Contour integral method
The failure load is taken from single-edge notch beam (SENB) tests to determine the fracture toughness and deflection using finite element analysis. In finite element modeling, a finer mesh typically results in a more accurate solution than coarser mesh. However, as a mesh is made finer, the computation time increases. Therefore, a mesh convergence analysis is performed to increase speed and obtain sufficient accuracy and to ensure that the result is no longer dependent on mesh size. The h-method (varying the element size) is implemented. Stress intensity factors calculated from finite element analysis are compared with the test results obtained using Eq. (1), as shown in Table 1 and Figure 5. Table 1. Fracture toughness, Kc from tests and Numerical model
Speci men
Failure Load (N)
Crack Length (mm)
Kc Test (MPa√m)
Kc Abaqus (MPa√m)
SB1 1869 3.2 17.16 16.80
SB2 2106 3.2 19.33 18.93
SB3 1191 4.7 14.39 14.81
SB4 1068 4.7 12.91 13.35
SB5 1020 4.7 12.33 12.70
SB6 1523 4.7 18.40 19.01
SB7 1179 6.0 18.34 18.75
SB8 1136 6.0 17.67 17.80
The fracture toughness of cast iron varies between 12 to 19 MPa√m (Figure 5) where the maximum deflection is
19 mm (Figure 6). The fracture toughness obtained from Abaqus is almost identical with the test value, indicating that Eq. (1) is applicable for a simple chevron (V) notch, which can be used instead of the complex straight through notch. Finite element calculations of deflections also match the measurements (Figure 6). Finite element models thus reasonably represent the test conditions.
Figure 5. Comparison of fracture toughness from test and Abaqus
Figure 6. Comparison of deflection from test and Abaqus FINITE ELEMENT MODELING OF CAST IRON WATER
MAIN Three-dimensional finite element analyses are carried out using Abaqus to obtain the pipe stress distribution and stress intensity factor of the pipe. The model is developed so that the pipeline and the soil model are defined as 3D deformable solid bodies. An 8-node linear brick element (C3D8R) is used. First, an extended finite element method is used to determine the crack propagation direction. The contour integral method is used to determine the stress intensity factor around the corrosion pit, for which the crack
0
5
10
15
20
25
SB SB2 SB4 SB6 SB8 SB10
Kc
(MP
a.√
m)
Specimens No.
Test Abaqus
0.00
0.02
0.04
0.06
0.08
0.10
0.12
0.14
0.16
0.18
0.20
SB SB2 SB4 SB6 SB8 SB10
Defle
ctio
n (
mm
)
Specimens No.
Test Abaqus

89
direction needs to be assigned. For the contour integral method, the crack extension direction is defined along the normal to the crack plane and for each integral, five contours are specified. Figure 7 shows the crack extension direction applied, obtained from finite element analysis, discussed later in this paper. Soil load, internal pressure, surcharge (snow load) and traffic load affect the cast iron pipeline, which is buried in an elastoplastic soil.
Figure 7. Crack extension direction in Contour integral method
Lack of ground support is also considered using a void (Figure 8). For soil, two boundary conditions are used and for pipeline, one boundary conditions is considered. Longitudinal displacements of soil and pipe are restrained at the end plane by roller support, because an infinite or semi-infinite medium of soil can be assumed to move in a vertical direction. The bottom surface of the 3D finite-element soil model is required to be completely fixed in order to restrain horizontal and vertical movement. The diameter of the cast iron is assumed to be 175 mm and the thickness is 10 mm, buried in a medium dense soil with 2 m of soil cover. The pipe is subjected to 400 kN/m2 internal pressure. Gravity load, snow load (25 kN/m2) and truck load (axle load 14400 kg) are also considered in the model. Gravity load is calculated manually and applied as a pressure at the top of the soil in the contour integral method.
The length of the pipe considered is 4 m. The corrosion pit is located at the invert position of the pipe. Uniform bedding, as well as a non-uniform bedding condition, are considered. To simulate the non-uniform bedding condition, a 1 m or 2 m long, 50 mm thick void is provided at the invert of the pipe. Circular, elliptical and diamond types of corrosion pit are considered, where the diameter of the circular pit is 50 mm, the length of the major axis is 50 mm for the elliptical pit and the diagonal length is 50 mm for the diamond shaped corrosion pit. The void at the bedding is
symmetrical to the pit hole and extends 90 or 180 around the pit circumference. The FE model is first validated through simulation of data available in the literature (Liyanage and Dhar, 2017). Soil parameters reported in Liyanage and Dhar (2017) are employed in the analyses. A parametric study is conducted to investigate the influence
of the dilation angle in order to select a suitable dilation angle. The dilation angle is varied from 8º to 15º and no
significant variation in SIF is found. Table 2 summarizes the material parameters used in the analysis.
Figure 8. Symmetric void (90) with respect to pit hole Table 2. Material Parameters
Material Properties Soil Cast Iron
Density (kN/m3) 1.77 7.88 Young’s modulus (MPa) 24 138,000 Poisson’s Ratio 0.25 0.21
Friction Angle in () 38 -
Dilation Angle in () Cohesion Yield Stress (kPa)
15 0.01
-
Max Principal Stress (MPa) - 180 Tolerance - 0.05
RESULTS As discussed earlier, in the contour integral method for calculating stress intensity factor, the direction of crack propagation has to be defined. To understand the direction of stress propagation, an extended finite element method (XFEM) is employed using Abaqus. In XFEM, the maximum principal stress criterion is used to identify the direction of crack propagation. Figure 9 shows the direction of crack propagation for a pipe with a circular corrosion pit. The pit is located at the invert of the pipe where a 2 m long void
which extends 90 around the pit circumference, in the bedding soil. To ensure initiation and propagation of the crack, a high pressure (i.e. 400 kPa) is applied at the ground surface. Figure 9 demonstrates that a crack initiates and propagates in the circumferential direction of the pipe.
Soil
Void (90)
Pipe

90
Figure 9. Crack propagation direction (philsm)
The distribution of major principal stress around the circular pit is plotted in Figure 10. Since cracking is generated by tension, the major principal stress from Abaqus provides the direction of cracking. Figure 10 shows the highest tensile stress along the circumferential direction of the pipe across the circular corrosion pit. Thus, cracking is expected in the circumferential direction of the pipe due to high longitudinal stress, which is consistent with the crack direction observed in Figure 9. Figure 10. Distribution of maximum principal stress around a circular pit
To determine the direction of crack initiations and propagations for different shapes of corrosion pits, the contours of major principal stress are plotted against the pit in Figures 11 to 13. These figures demonstrate high tensile stress (red colour in the figure) in the circumferential direction of the pipe. Therefore, crack directions along the
circumference are assigned in the contour integral method, as shown in Figure 7.
Figure 11. Maximum principal stress around a circular pit Figure 12. Maximum principal stress around an elliptical pit Figure 13. Maximum principal stress around a diamond shaped pit
The stress intensity factors (SIFs) calculated using
finite element analysis, for different pipe installation and loading conditions are shown in Tables 3 to 5. The SIFs in
Longitudinal direction of the pipe
Crack
Longitudinal direction of the pipe
Longitudinal direction of the pipe
220
170
120
70
20
30
80
130
180
220 170 120 70 20 30 80 130 180
Pit
0
Maximum principal stress distribution (MPa)
Longitudinal direction of the pipe
85 127.5
170
70
169.12 MPa
Longitudinal direction of the pipe

91
the tables suggest that the SIF is highest for a diamond shaped corrosion pit and lowest for the circular shape. The SIF for the elliptical corrosion pit lies between the diamond and circular corrosion pits. The SIF increases with the decrease of tip radius of the corrosion hole. SIF increases due to gravity, surcharge (snow load) and traffic load but decreases due to internal pressure. SIF increases 40 % due to traffic load and decreases 6% due to internal pressure for the 1 m hole under the pit. Thus, for fracture, the critical condition is when the cast iron water main is empty and has internal pressure.
However, the SIFs under typical loading conditions of water mains (Tables 3 to 5) are less than the fracture toughness determined for cast iron pipe materials shown in Table 1. The maximum calculated SIF (i.e. 6.80 MPa√m) is about 45% of the mean value of the fracture toughness (i.e. 15 MPa√m). A crack may propagate at values of SIF that can be substantially below fracture toughness, which is known as subcritical crack growth, stable cracking or quasi-static crack propagation, due to stress corrosion. Strained bonds at crack tips are weakened due to the chemical action of environmental factors like water that facilitate crack growth during stress corrosion (Atkinson, 1984). Cullin et al (2014) reported that subcritical corrosion fatigue is one of the threats to gray cast iron water pipes which is mainly due to the cyclic load. A casting defect may cause a microscopic crack on the pipe’s interior that may accelerate crack propagation and failure may occur before fracture toughness is reached. Table 3. Stress intensity factor in MPa√m (1m hole under
the pit and extending 90 around the pit circumference)
Shape of the pit
Gravity and Surcharge
Gravity, Surcharge and Traffic
Gravity, Surcharge, Traffic and Internal pressure
Circular Elliptical Diamond
0.56 1.37 2.49
0.77 1.91 3.48
0.72 1.79 3.29
Table 4. Stress intensity factor in MPa√m (2m hole under
the pit and extending 90 around the pit circumference)
Shape of the pit
Gravity and Surcharge
Gravity, Surcharge and Traffic
Gravity, Surcharge, Traffic and Internal pressure
Circular Elliptical Diamond
0.56 1.44 2.62
0.77 2.09 3.81
0.66 1.97 3.64
Table 5. Stress intensity factor in MPa√m (2m hole under
the pit and extending 180 around the pit circumference)
Shape of the pit
Gravity and Surcharge
Gravity, Surcharge and Traffic
Gravity, Surcharge, Traffic and Internal pressure
Circular Elliptical Diamond
0.99 2.71 4.91
1.38 3.77 6.80
1.22 3.67 6.65
CONCLUSION In this study, finite element analysis is used to calculate stress intensity factors for a pipeline subjected to corrosion pits. Stress intensity factors are compared with fracture toughness, determined from laboratory tests for fracture assessment of a cast iron water main. A finite element method is used to determine the fracture toughness of the cast iron specimen and compared with the single-edge notch beam (SEBN) tests results. In this study, a simple chevron (V) notch is used instead of a complex straight through notch, which is recommended by ASTM E 1820-01. From those results, the conclusion can be drawn that a complex straight through notch can be successfully replaced with a chevron (V) notch that will reduce fabrication difficulty.
The study of buried cast iron water mains under various loading conditions subjected to non-uniform bedding demonstrates that the pipe SIF is significantly affected by pit shape and the erosion void at the bedding. The SIF is higher in the circumferential direction than in the longitudinal direction across the corrosion pit. As a result, crack propagation is expected along the circumferential direction. Three corrosion pit shapes (circular, diamond and elliptical) are considered in this paper. The round hole corrosion pit is the safest among the three types of corrosion pits, and the diamond shape is the least safe. SIF increases with the gravity, surcharge (snow load) and traffic load but decreases due to internal pressure. Although the SIF does not exceed the fracture toughness for the pipe considered, it may fail due to subcritical crack growth. This study can be extended by investigating the effect of subcritical crack growth in a cast iron water main. ACKNOWLEDGEMENTS Funding of this research project was provided by the Natural Sciences and Engineering Research Council of Canada (NSERC) through its Collaborative Research and Development Grants and the city of Mount Pearl in the province of Newfoundland and Labrador. This financial support is gratefully acknowledged.

92
REFERENCES Ali I. 2017. “Mechanical properties of an exhumed cast iron
pipe material”. M.Sc. Thesis, Memorial University, Newfoundland and Labrador, Canada.
ASTM E1820-01 2001. “Standard test method for measurement of fracture toughness.” American society for testing and materials.
Atkinson B. K. 1984. “Subcritical crack growth in geological materials.” Journal of Geophysical Research, vol. 89, no. B6: 4077-4114.
Balkaya, M., Moore, I. D., and Sağlamer, A. 2012. “Study of Nonuniform Bedding Support Because of Erosion under Cast Iron Water Distribution Pipes.” Journal of Geotechnical and Geoenvironmental Engineering,
138(10): 1247–1256. Cassaa A.M., Zylb J.E. van and Laubsche R.F. 2010. “A
numerical investigation into the effect of pressure on holes and cracks in water supply pipes.” Urban Water Journal, Vol. 7, No. 2: 109–120.
Cullin M. J., Petersen T.H. and Paris A. P.E. 2015. “Corrosion Fatigue Failure of a Gray Cast Iron Water Main”. Journal of Pipeline Systems Engineering and Practice,6(2):05014003.DOI:10.1061/(ASCE)PS.19491204.0000188.
Dhar, A. S., Moore, I. D., & McGrath, T. J. 2004. “Two-dimensional analyses of thermoplastic culvert deformations and strains.” Journal of Geotechnical and Geoenvironmental Engineering, ASCE, 130(2): 199-208.
Dipen B., Ketul B. and Dipal P. 2015. “Stress Concentration Factor Converts Into Stress Intensity Factor Using ANSYS.” European Journal of Advances in Engineering and Technology, 2015, 2(1): 46-49.
Folkman S. 2012. “Water Main Break Rates in the USA and Canada: A Comprehensive Study.” Research Report, Utah State University Buried Structures Laboratory, Logan, UT, USA.
Frick, G.R. and Manuel, J. 2005. “Leak Detection Program: The City of Mount Pearl”, Proc. Leakage 2005, Halifax, NS, Canada
Gould, S.J.F., Boulaire, F.A., Burn, S., Zhao, X.L. & Kodikara, J.K., 2011, Seasonal factors influencing the failure of buried water reticulation pipes, Water Science & Technology: 2692-2699.
Li C.Q., Yang S.T. 2012. “Stress intensity factors for high aspect ratio semi-elliptical internal surface cracks in pipes.” International Journal of Pressure Vessels and Piping 96-97: 13-23.
Liyanage, K., and Dhar, A. S. 2015. “Three Dimensional Finite Element Analyses of Partially Supported Water Mains.” 68th Canadian Geotechnical Conference.
Quebec City, Canada. Liyanage, K., and Dhar, A. S. 2017. “Stresses in Cast Iron
Water Main Subjected to Non-Uniform Bedding and Localized Concentrated Forces”. In press.
Liyanage, K.T.H and Dhar, A.S. 2017. “Effects of corrosion pits on the wall stresses in cast iron water mains.” ASCE Journal of Pipeline Systems - Engineering and Practice, 8(4): 04017023.
Makar, J. M., Rogge, R., McDonald, S., and Tesfamariam, S. 2005. “The Effect of Corrosion Pitting on
Circumferential Failures in Grey Iron Pipes.” American Water Works Association, Denver.
Rajani B. and McDonald S. 1995. Water mains break data on different pipe materials for 1992 and 1993. Report No. A-7019.1, National Research Council, Ottawa, ON.
Rajani, B., Zhan, C. and Kuraoka, S. 1996. “Pipe Soil Interaction Analysis of Jointed Water Mains.” Canadian Geotechnical Journal 33 (3): 393–404. Doi: 10.1139/t96- 061.
Trickey, S. A., Moore, I.D. and Balkaya, M. 2016. “Parametric study of frost-induced bending moments in buried cast iron water pipes”, Tunnelling and Underground Space Technology 51: 291-300.