Reliability Analysis of Switches and Crossings – A Case Study in Swedish Railway

Failure Analysis of Railway Switches
and Crossings for the purpose of
Preventive Maintenance
Master Degree Project
Seyedahmad Jalili Hassankiadeh
Division of Highway and Railway Engineering
Department of Transport Science
School of Architecture and the Built Environment
Royal Institute of Technology
SE-100 44 Stockholm
TRITA-VBT 11:17
ISSN 1650-867X
ISRN KTH/VBT-11/17-SE
Stockholm 2011


i
Failure Analysis of Railway Switches and
Crossings for the purpose of Preventive
Maintenance
Seyedahmad Jalili Hassankiadeh
Graduate Student
Infrastructure Engineering
Division of Highway and Railway Engineering
School of Architecture and the Built Environment
Royal Institute of Technology (KTH)
SE- 100 44 Stockholm
Abstract: In the Swedish railway network there are about 12000 units of track
switches and crossings, which at 13000 Km, make up about 5.5 percent of the
total track length. However, the maintenance cost for S&C is more than 13
percent of the total maintenance cost which is high in comparison with their
proportion. The aim of the project is to conduct research into classification of
the different modes of failure in S&C components and to perform a statistical
analysis to converge the data in order to determine the most important failures
that occur in turnouts.
KEY WORDS: Turnout; Rail; Sleeper; Ballast; Sub grade; Failure Mode and
Effect Analysis (FMEA); Rectification; Risk Priority Number (RPN);

ii

iii
Acknowledgement
This Thesis project would not have been possible without the support of
many people.
I would like to show my gratitude to my Supervisor Dr. Elias Kassa for all
of his helpful advice and suggestions for my thesis. I would like to express my
gratitude to my family for their continuous support and encouragement
through the duration of my studies. Special thanks to Elaine Cantor for her
kindly help and being my source of inspiration. I would like to thank Adel
Abdi for sharing his time and for giving me helpful information. Also, I would
like to thank all my graduate friends.
Stockholm, November 2011
Seyedahmad Jalili Hassankiadeh

iv

v
List of Abbreviations
FMEA - Failure Modes and Effects Analysis
BR - British Railway
S & C - Switch and Crossing
UK - United Kingdom
FFD - Failures Frequency Distribution
OCCUR - Occurrence Number
SEV - Severity Number
DETEC - Detection Number
RPN - Risk Priority Number
RCF - Rolling Contact Fatigue
NDT - Nondestructive testing
GPR - Ground Penetration Radar
P-Way - Permanent Way

vi

vii
Table of Contents Abstract .............................................................................................................. i
Acknowledgement ............................................................................................ iii
List of Abbreviations ........................................................................................ v
Table of Contents ........................................................................................... vii
1. Introduction .................................................................................................. 1
1.1. Objectives .............................................................................................. 1
2. Turnout Definition ........................................................................................ 3
2.1. Turnout Function ................................................................................... 3
2.2. Turnout Components ............................................................................. 3
2.3. Turnout Classification ........................................................................... 4
2.3.1. Failure Classification Based on Components ................................ 4
2.3.2. Failure Classification Based on Nature of Failure ........................ 5
3. Failure mechanism in Rail ............................................................................ 7
3.1. Fatigue Cracks Failure in Rail .............................................................. 7
3.1.1. Kidney-Shaped Cracks .................................................................. 7
3.1.2. Transverse Rail Foot Cracks ......................................................... 8
3.1.3. Longitudinal Rail Foot Cracks ...................................................... 8
3.1.4. Longitudinal Vertical and Horizontal Cracks ............................... 9
3.1.5. Broken Stretcher Bar ................................................................... 10
3.1.6. Broken or Cracked Fishplate ....................................................... 10
3.1.7. Switch Anchor Loosing ............................................................... 10
3.1.8. Point and Splice Rails Separating ............................................... 11
3.1.9. Broken Bolt ................................................................................. 11
3.1.10. Broken Baseplate ....................................................................... 12
3.2. Rolling Contact Fatigue in Rail .......................................................... 13
3.2.1. Head checks ................................................................................ 13
3.2.2. Squats .......................................................................................... 13
3.3. Wear or Material Removal Failure in Rail ......................................... 14
3.3.1. Rail Corrugation .......................................................................... 14
3.3.2. Switch Rail Shelling .................................................................... 15
3.3.3. Stock Rail Head Wear ................................................................. 16

viii
3.3.4. Damage Crossing Nose ............................................................... 16
3.3.5. Dry Chair or Baseplate ................................................................ 17
3.4. Material Deformation in Rail ............................................................. 18
3.4.1. Plastic Flow ................................................................................. 18
3.4.2. Sharp Gauge Corner .................................................................... 18
3.5. Shear Failure in Rail ........................................................................... 19
3.5.1. Failed Stud .................................................................................. 19
4. Failure mechanism in Sleeper .................................................................... 21
4.1. Bending Cracks .................................................................................. 21
4.2. Concrete Spalling ............................................................................... 21
4.3. Fracture Cracks .................................................................................. 22
4.4. Split Concrete Sleeper ........................................................................ 22
4.5. Damage Concrete Bearers .................................................................. 23
4.6. Shear Cracks ....................................................................................... 24
4.7. Abrasion ............................................................................................. 24
4.8. Wet Spot ............................................................................................. 24
5. Failure mechanism in Ballast ..................................................................... 25
5.1. Crack Failure in Ballast ....................................................................... 26
5.1.1. Micro-Cracks and Particle Breakage ........................................... 26
5.2. Plastic Deformation in Ballast............................................................. 26
5.2.1. Ballast Pocket .............................................................................. 26
5.2.2. Erosion Pumping ......................................................................... 27
5.2.3. Ballast Settlement ........................................................................ 28
5.2.4. Ballast Fouling ............................................................................ 28
5.3. Shear Failure in Ballast ....................................................................... 29
5.3.1. Breakage of the Sharp Edge ........................................................ 29
6. Failure mechanism in Subgrade .................................................................. 31
6.1. Plastic Deformation in Subgrade ......................................................... 31
6.1.1. Accumulative Plastic Deformation ............................................. 31
6.1.2. Consolidation Settlement ............................................................ 31
6.1.3. Frost Action ................................................................................. 32
6.1.4. Attrition with Mud Pumping ....................................................... 32

ix
6.2. Shear Failure in Subgrade ................................................................... 32
6.2.1. Progressive Shear Failure ............................................................ 32
6.2.2. Massive Shear Failure ................................................................. 33
7. Failure Analysis ........................................................................................... 35
7.1. Failed Components Data ..................................................................... 35
7.2. Number of Potential Failure Modes .................................................... 37
7.3. Relationship between Weather and Failure Modes ............................ 39
7.4. Rectification of Failed Components .................................................... 41
8. Methodology ............................................................................................... 43
8.1. FMEA Procedure ................................................................................ 44
9. Results ......................................................................................................... 47
9.1. Discussion ........................................................................................... 48
9.2. Conclusion........................................................................................... 53
References ....................................................................................................... 55
Appendix A ..................................................................................................... 58
Appendix B ..................................................................................................... 66

x

1
1. Introduction
Provision of a reliable infrastructure plays a very important role in
achieving a reliable system. Railway Turnout consists of Switches and
Crossings with specific complexity which is exposed to several defects. A
high percentage of Railways infrastructure component failures occur in
turnouts. In order to understand the importance of Turnouts, one needs only to
be reminded of 10 May 2002 in the UK. Seven people lost their lives and a
further 76 were injured. Within an hour, the poor condition of the turnouts
would be identified as the cause. Their safe and reliable operation must be
assured by high levels of routine maintenance. Identification of possible
failure modes, determination of corresponding rectifications and an analysis of
their associations help us to identify the most critical components and the
likely failure mechanism. This finally leads to a better approach to preventive
maintenance of Turnouts.
1.1. Objectives
The main objective of this study is to develop a better categorization of
different modes of failure in Turnouts. This will enable us to understand
which components are most likely to fail, and which type of failure is more
likely to occur in each component. The objective of the present work is to
carry out a Statistical Analysis of a set of data collected. Data from 2458
failed S&C components were used to determine the failure distribution. All
data corresponded to occurrences in the year 2009 in the UK.
Turnout definition represents function of turnout and its failure
classification. Section 3 discusses the literature review of Failure mechanisms
in Rail. The failure mechanism in Sleeper is described in Section 4. The
failure mechanisms in Ballast and in the subgrade are explained in Section 5
and Section 6, respectively. Following the description of the different failure
mechanisms, failure analysis is discussed for a set of data used in analysis.
Methodology section, presents the methodology used to study the information.
The analysis of results, conclusions and recommendations will be discussed in
Result section. Appendix A and B present a complete data analysis and
corresponding graphs.

2

3
2. Turnout Definition
2.1. Turnout Function
Turnouts are the devices which use to divide one track into two or three tracks. They allow tracks to intersect at the same level. Also, they provide movement in a straight or divergent direction [1].
2.2. Turnout Components
Turnouts consist of the following major parts:
1. Rail - Set of switches
Two switch blades Two stock rails
- Closure rail
- Common crossing
Through rail Check rail Wing rail Nose
2. Sleepers (bearers)
3. Ballast
4. Substructure (subgrade)
The exact position of turnout components can be seen in Figure 1.

4
Figure 1. Standard right-hand Turnout
2.3. Classification of turnout failures
2.3.1. Failure Classification Based on Components’ Failure
Rail Failure Sleeper Failure Ballast Failure Subgrade Failure

5
Figure 2. Typical railway track system and its components [6]
2.3.2. Failure Classification based on Nature of Failure
Fatigue cracks failure Rolling contact fatigue cracks Wear failure Material deformation failure Shear failure

6

7
3. Failure Mechanism in Rail
3.1. Fatigue Cracks Failure in Rail
Rail head cracks with internal origin( Subsurface origin )
3.1.1. Kidney-Shaped Cracks
This type crack usually initiates from manufacturing defects which show
up when the rail starts to age. Accumulative tonnage borne or progressive cracking of the rail head leads to kidney-shape flaw. [2]
Figure 3. Illustration ‘Kidney-shaped’ crack in rail head [2]

8
Rail Foot Cracks
3.1.2. Transverse Rail Foot Cracks
This is described as a progressive fracture in the base of the rail which
develops substantially on a transverse plane. Transverse cracks are usually
initiated from the outer edge of the foot (Galling) due to wear and/or corrosion
at the rail support. As a result of relatively high bending, torsional and
residual stresses, very small underside foot cracks can lead to complete rail
fracture. [2]
Figure 4. Rail foot crack starting from a corrosion pit at a foot underside [2]
3.1.3. Longitudinal Rail Foot Cracks
This defect is thought to be caused by improper seating of the rail or poor
manufacturing. The defect usually starts as a vertical longitudinal split which
can be seen away from the center line of the foot that probably causes a piece
of the foot to break away, and more severe damages happen near the center
line of the foot by causing a complete fracture of the rail.[2]

9
Figure 5. Fracture due to a longitudinal crack. Left : Side view , Right : foot
underside [2]
Rail Web Cracks
3.1.4. Longitudinal Vertical and Horizontal Cracks
Cracks in the web usually originate from poor manufacturing. These can
be in a vertical (piping) or horizontal direction leading to rail fractures. They
are initiated at shrinkage cracks at the outer edge of the weld collar. Typically,
impact loading is a contributing factor. [22]
Figure 6. Left: vertical web crack, Right: Horizontal web crack [2]

10
3.1.5. Broken Stretcher Bar
The sharp bend in a stretcher bar is a weakness that can result in
many failures of spring steel stretcher bars. Similarly, the twist in the
stretcher bar brackets has proven to be a stress raiser. Stress
concentration in this area leads to many failures. Asymmetric force as a
result of switch movement or fatigue force due to loading and
unloading are known as the main causes of failure. A replacement
stretcher bar or bracket of the correct type should be fitted as soon as
possible. This may require the line to be blocked. [18]
Figure 7. Broken stretcher bar [18]
3.1.6. Broken or Cracked Fishplate
The cause of the majority of cracked fishplates lies in inadequate
support to the sleepers. Cracks may originate at either the upper or
lower edge of the fishplate. Transverse crack emanates from behind the
fishplate and extends to a position. [18]
3.1.7. Switch Anchor Loosing
Because of loose switch anchors, heel blocks, loose fastenings at the
switch heel or loose fishplate joints at the switch heel, an interference
between the first slide baseplate bolt and the switch rail extension

11
bracket occurs. This prevents the switch rail from closing against the
stock rail. [18]
3.1.8. Point and Splice Rails Separating
Due to failure to check fastenings and crossing bolts, or to control the rail
creep in abutting track and the effects of traction force, separation of the point
and splice rails of a fabricated common crossing is likely to occur. Prior to
installation of the new crossing, it will be necessary to find and correct the
underlying cause of the separation of the point and splice rails. [18]
Figure 8. Point and Splice Rails Separating [18]
3.1.9. Broken Bolts
Bolts may become broken as a result of excessive longitudinal forces
acting on the crossing. For this same reason, the crossing itself may
be pulled longitudinally. Often times, if the track is jointed,
regulating expansion gaps, fitting rail anchors, and repairing track
fastenings will be required. [18]

12
3.1.10. Broken baseplate
When a baseplate is seated incorrectly on the timber, a breakage in
the baseplate is likely to occur. Not only will castings be unable to
perform their design function when this happens, but they may also
cause damage to supporting timber. For this reason, it should be
replaced when found. [18]
Figure 9. Broken baseplate [18]

13
3.2. Rolling Contact Fatigue in Rail
3.2.1. Head Checks
Surface fatigue originates from the stress-exhausted surface layer of the
material. As wear rates on the rails are low, the metal remains in place longer
and finally reaches the fatigue limit which lead to head check cracks. Head
checks are groups of fine surface cracks at the running (gauge) corner of the
rail with a typical interspacing of 0.5–10 mm. They run initially into the
interior of the rail at an angle of 15-30° against traffic direction. Head check
cracks normally shallow and removed quite easily by rail grinding. [2]
Figure 10. Head Checks [19]
3.2.2. Squats
This type of failure is characterized by the appearance of micro cracks
below the surface of the tracks. Squat cracks occur due to high dynamic load

14
of track leading to rolling contact fatigue. At first, these cracks look like a
small dark dot. They then become enlarged from the bottom of the dot and
grow at a shallow angle in the longitudinal direction. Sometimes the growth
of cracks under the surface is in direction to the gauge corner that is common
in moving cross frogs. Cracks finally turn down vertically and can eventually
result in a rail breakage. The significant characteristic of squats usually
appears on the running surface and less commonly from the gauge corner.
Welding is known as common treatment of squats defect. [2]
Figure 11. Squat Defects [19]
3.3. Wear or Material Removal Failure in rail
3.3.1. Rail Corrugation
Rail corrugation is a frequently occurring rail wear pattern which appears
as an irregularity developing on the running surface of rail. The term
corrugation is considered with wavelengths of less than about 1 m. For the
purpose of maintenance, it can be convenient to categorize the corrugation
according to wavelength: short wave in the range of 0-100 mm, medium wave
in the range of 100-300 mm, and long wave in the range of 300-1000 mm.
Joints and weld are known to be a common source of excitation, especially if
there is acceleration or braking force in this area. Corrugation often propagates
from such irregularities. Plastic flow on mixed traffic railways which is due to
excessive wheel/rail contact stresses is one of the most common causes of
corrugation on heavy haul railways. Disturbed (white) ballast due to the
vibration of short wave corrugation and rough riding are known as the

15
consequences. A useful rectification would be to grind the existing corrugated
rail over a length of a few hundred meters. [19]
Figure 12. Rail Head Corrugation [19]
3.3.2. Switch Rail Shelling
Fine fatigue-induced cracks at the gauge corner of the rail, form a network
on the surface of the rail. These Specific cracks under the gauge corner lead to
a breaking out of material (gauge corner shelling). Remedial grinding is
known as a rectification. [18]
Figure 13. Transverse crack propagation starting from gauge corner shelling
[2]

16
3.3.3. Stock Rail Head Wear
Severe headwear, leading to lipping of the stock rail , could cause the
switch rail to stand proud of the stock rail, leading to a switch splitting type of
derailment, or at least failure of the switch and stock rail to provide correct
locking an detection to the signaling system. A remedial grinding is suggested
in primary stage and in sever headwear replacement could be as a
rectification. [18]
Figure 14. Stock Rail Headwear Associated with a Used Switch Rail [18]
3.3.4. Damaged Crossing Nose
Due to inherent defects in the casting or as a result of strikes because of
inadequate guidance from the check rails, some damages appear in crossing
nose. Depending upon the resulting shape of the crossing nose it might
remove excess lipping by means of an angle grinder and weld repair or
replacement of the crossing. [18]

17
Figure 15. Damage crossing nose [18]
3.3.5. Dry Slide Chair or Baseplate
When not properly lubricated, slide chairs can become desiccated, and
patches of rust may begin to appear on the slide table. Once this
problem is discovered, new lubricant should be applied to the slide
chairs immediately. Redistribution of existing lubricant taken from
other parts of the slide chair can also be an option in resolving the problem
before leading a switch blocked. [18]
Figure 16. Dry Slide Baseplate [18]

18
3.4. Material Deformation in Rail
3.4.1. Plastic Flow
Plastic flow refers to plastic deformation of the stock rail (near switch rail)
due to cyclic loads and high rail stresses called lipping. Plastic flow of rail
material appears often on the low rail in sharp curves. This could result in a
reduction of gauge width. Overall, Plastic flow and development of lip usually
occur in different components of turnout. In such a situation a remedial
grinding is suggested as a rectification. [19][21]
Figure 17. Lipping [21]
3.4.2. Sharp Gauge Corner
The sharp corner which has formed on the switch rail occurs most
commonly. It causes the wheel to subsequently derail. In addition, as a result
of a wheel strike, a deformed nose might form, which leads to a change in
check rail gauge dimension, especially when there is a loose bolt. Sharp
corners should be removed by grinding. [18]

19
Figure 18. Switch Rail with a Sharp Gauge Corner Profile [18]
3.5. Shear Failure in Rail
3.5.1. Failed Stud
Prior to fitting a stud, the stock rail has to be seated properly on
the slide baseplate. If this has not been done correctly, the stud
becomes increasingly unstable after being repeatedly subjected to both
shear and tensile force, and the end result will be a failed stud. Replacement of
Failed Stud should be undertaken after discovering.[18]
Figure 19. Failed stud [18]

20

21
4. Failure Mechanism in Sleeper
Sleepers or ties receive the load from the rail and distribute it over the
supporting ballast. They also hold the fastening system to maintain the proper
track gauge and restrain the rail movement. Failure mechanism in sleeper has
been followed in this section.
4.1. Bending Cracks
Bending cracks are often detected at the bottom of mid span of the sleepers
by allowing a sleeper to settle on the ballast packed under the center of the
sleeper. It also sometimes comes from the soffit underneath rail seat of the
sleepers. It eventually decreases flexural stiffness of the sleeper. Likewise
flexural failure appears as top surface cracks located near the rail seat. [7][19]
Figure 20. Center Bending Cracks [19]
4.2. Concrete Spalling
Concrete Spalling occurs on the top fiber of the rail seat; also rail
irregularity in the joint area which sometimes reaches 15 mm in length causes
a large wheel impact load of about four to six times of the serviceability
conditions. This magnitude of impact load damages sleepers by appearing as
cracks under the joints of the rail. [6]

22
Figure 21. Concrete Spalling Due to the Impact Event
4.3. Fracture Cracks
Due to infrequent but high magnitude impact force fracture cracks can be
detected under the rail seat on the surface of the sleepers. In addition, tensile
fractures appear in the upper central segment of the sleepers which run
vertically down and spread throughout the central segment. [7] [8]
4.4. Split Concrete Sleeper
Longitudinal splits in concrete sleepers often arise as a result of being
struck by tamping machine tines. They may also be caused by torsional
loading on sleeper owing to non-uniform support over the whole of the width
of the rail seat. It finally decreases flexural stiffness of the concrete sleeper.
Failed sleeper should be replaced before imposing bad effect on other
components. [19]

23
Figure 22. Split Concrete Sleeper [19]
4.5. Damaged Concrete Bearers
A number of concrete bearers damage during the fitting of the chair
screws, either as a result of using chair screws of the wrong diameter, or
because they are over tightened. [18]
Figure 23. Damaged Concrete Bearers [18]

24
4.6. Shear Cracks ( Diagonal Cracks )
After a slightly bending crack stopped, sleepers have sudden brittle failure
due to shear diagonal crush at top fibre. This causes a severe damage like
spalling without any deflection warning. [8] [14]
4.7. Abrasion
Once it exceeds a depth of about 2 mm, Sleeper in the rail seat will not
provide a reasonably smooth surface to accept the rail pad without undue
distortion. Abrasion of the soffit of the sleeper leads to a reduction in cover of
the prestressing wires and tendons or strands. [19
4.8. Wet Spot (Slurry Spot)
Voids under the concrete sleepers, denoted by lighter colored and less
angular ballast on the upper surface, encourage ballast attrition. When mixed
with material abraded from the concrete sleepers, weak-mix concrete results,
thereby failing to keep the sleepers well packed. [19]
Figure 24. Wet Spot (Slurry Spot) [19]

25
5. Failure Mechanism in Ballast
The ballast is the select crushed granular material placed as the top layer of
the substructure in which the sleepers are embedded. The most important
functions of the ballast are to retain track position, reduce the sleeper bearing
pressure for the underlying material, store fouling materials, and provide
drainage for water falling onto the track. [17]
In the past, most attention has been given to the track superstructure
consisting of the rails, the fasteners and the sleepers, and less attention has
been given to the substructure consisting of the ballast, the subballast and the
subgrade. Even though the substructure components have a major influence on
the cost of track maintenance, less attention has been given to the substructure
because the properties of the substructure are more variable and difficult to
define than those of the superstructure (Selig & Waters, 1994).
Figure 25 shows a typical profile of the relative contributions of the
substructure components on track settlement, assuming a good subgrade soil
foundation (Selig & Waters, 1994). This figure shows that ballast contributes
the most to track settlement, compared to subballast and subgrade.
Figure 25. Substructure contributions to settlement (Selig & Waters, 1994).

26
5.1. Crack Failure in Ballast
5.1.1. Micro-Cracks and Particle Breakage
Short wave corrugation on the rail can cause a vibration on the sleeper, and
this can disturb the support under the sleeper. This vibration causes particle
contact force and the ballast stones may lose their sharp ages. Breakage also
occurs from cycles of freezing and thawing and from chemical breakdown due
to environmental factors. White powder builds up and contaminates the
ballast, as shown in the figure below. [21]
Figure 26. Disturb (white) Ballast due to short wave corrugation [21]
5.2. Plastic Deformation in Ballast
5.2.1. Ballast Pockets
Ballast pockets are load-induced depressions in the subgrade surface
directly under the tie. They also can result from a process of ballast
accumulation in the subgrade soil that forms during maintenance and repairs.
The water falling on the track flows down and gets trapped in the depressed
zone. It leads to a weakness in this area and eventually a track settlement. A
common remedy to minimize ballast pocket development is draining the
ballast pocket with a cross-drain excavated perpendicular to the track at the

27
lowest point of the ballast pocket. Figure 27 shows a typical track cross-
section with deforming subgrade. [12]
Figure 27. Ballast Pocket [22]
5.2.2. Erosion Pumping
Where the ballast runs on a clay subgrade condition, under dynamic
loading, water in the subgrade can turn this soil into slurry, which is pumped
upward through the ballast by expansion of the voids. This contamination of
the track ballast (fouling of the ballast) may cause localized undrained track
ballast and reduce its load support properties. It also causes a loss of lateral
track restrain or track alignment and eventually leading to unacceptable
movements of the rails. Placing a layer of blanket material could be a relevant
preventive maintenance. Once the failure occurred replacement the ballast
should be undertaken.[15]

28
Figure 28. Wet-Bed Due to Pumping Near Fishplate Joint [21]
5.2.3. Ballast Settlement
Due to sleeper-ballast interaction, the ballast gradually becomes
contaminated by fines which impair drainage and cause the ballast to perform
less effectively. We have seen that a free ballast movement and also low
bearing capacity of the sub-grade can cause:
Complete shifting of the switch to the sides of original position
Unevenness on one side due to subsiding which cause an unwanted
superelevation
Hence this ballast loosening due to tamping declines its ability to hold the
track geometry and eventually leads to a high settlement in the track. [16]
5.2.4. Ballast Fouling
Over time, the ballast is progressively contaminated by fine-grained
aggregate and metal dust that fills the void space between ballast stones. This
contamination is called fouling. The effect of ballast fouling is that it prevents
the ballast from fulfilling its function, especially when the fouling materials
contain silt and clay sized particles. In most cases to identify ballast fouling
special instruments like Ground Penetration Radar (GPR) involves scanning
the track is needed. Once it discovered replacement the ballast is known as a
treatment before imposing a bad effect in other components. [20]

29
Figure 29. Ballast Cross Section [20]
5.3. Shear Failure
5.3.1. Breakage of the Sharp Edge
Micro-cracks can develop when the ballast rock is stressed and can make
pores in rocks. Numerous micro-cracks can increase a zone of weakness .
This causes breakage of the sharp edge ballast particles during shear
deformation. [9]

30

31
6. Failure Mechanism in Subgrade
The subgrade is the platform upon which the track structure is constructed.
Its main function is to provide a stable foundation for the ballast layer.
Subgrade is a source of rail differential settlement which is considered as
follows:
6.1. Plastic Deformation in Subgrade
6.1.1. Accumulative Plastic Deformation
Progressive soil compaction in soft soils leads to excessive plastic
deformation. In addition, in a saturated silt and fine sand condition, repeated
loading can cause a large displacement called liquefaction. This finally leads
to track settlement. Removal and replacement the subgrade could be as a
rectification. [11]
Figure 30. Accumulative plastic deformation
6.1.2. Consolidation Settlement
Embankment weight in saturated fine-grained soils causes an increased
static soil stress and settlement. Also, changing moisture content in highly
plastic soil by moisture loss (shrinkage) or moisture increase (swelling) causes
subgrade settlement. Excessive subgrade settlement can lead to unacceptable
track geometry changes. [11]

32
6.1.3. Frost Action
The bearing capacity of the frozen soil decreases when its temperature
increases. Periodic freezing in frost-susceptible soils causes heave and
softening, which occurs usually in the winter/spring period. Freezing
temperature in the soil, source of water, and a frost-susceptible soil are the
main factors contributing to this problem. During the period of thaw
softening, severe plastic deformation can result in rapid loss of track geometry
and accelerated damage to track components. [11]
6.1.4. Attrition with Mud Pumping
In a situation of high water content in the subgrade surface, liquefied soil
and water rise to the surface due to high ballast-subgrade contact stress. Such
failure is normally associated with hard, fine-grained materials such as clay
and soft rock. Pumping can lead to a loss of lateral track restraint or track
alignment. Pumping failure can be prevented by placing a layer of blanketing
material between the ballast and the subgrade. [11]
6.2. Shear Failure in Subgrade
6.2.1. Progressive Shear Failure
In fine-grained subgrade soils or soils with high water content associated
with repeated over-stressing of the subgrade. Progressive shear failure can
manifest as squeezing near the subgrade surface, heaves in the shoulder, or
depression under the ties. This process is known in the United Kingdom as
‘Cess Heave.’ This happens because the vertical stress in the layers in the
loaded state is greater than the horizontal stress. Before removing the
subgrade material, using injection system like cement grouting is known as a
treatment. Applying stone column in both sides of the railway is suggested in
high embankment subgrade with more than Five meters thick soft soil. [12]

33
Figure 31. Subgrade Progressive Shear Failure
6.2.2. Massive Shear Failure
Because of inadequate soil strength due to the weight of trains, track, and
the subgrade, we can see slope instability in high embankments, especially
with increased water content. This may occur for example at times of heavy
rainfall and flooding, even without train loading being present. Hence, the
subgrade strength properties are a major factor in terms of safety with regard
to massive shear failure. Replacement the material from the toe of the slip
should be undertaken.[12]
Figure 32. Embankment slip [19]

34

35
7. Failure Analysis
A set of data have been conducted to investigate the Turnout failures. The
actual P-Way failure modes data which were recorded in the UK in 2009 is
our input parameters for analysis. Permanent Way failures are attributed to the
rails, sleepers, ballast and subgrade. To analyze the data correctly, we needed
to split the data into different categorization base on components and modes of
failure. The total number of failure modes was 2458.
7.1. Failed Components Data
To analyze the data recorded, we performed a failure classification based
on components. Table 1 shows a breakdown of all failed components.
Failed Components Total Number Frequency distribution (%)
Switch rail 1113 45.3
Slide chair 747 30.4
Ballast 194 7.9
Schiwag Roller 138 5.6
Stretcher bar 111 4.5
Stock rail 71 2.9
Crossing 33 1.3
Fishplate 24 1.0
Back Drive 18 0.7
Sleeper 5 0.2
Spacer Block 4 0.2
Sum 2458 100
Table 1. Total Number of Failed Components in 2009

36
Figure 33 shows a bar chart of failed Turnout components in the UK in 2009.
Figure 33. Total Number of Failed Components in 2009
The Chart shows that Switch rail and Slide chair were the most common
failed components which made up more than 75% of failed components In the
Uk in 2009. In contrast, Ballast, Schiwag Roller, Stretcher bar, Stock rail
made up about 20.9% of failed components. Finally, some components like
Crossing, Fishplate, Back drive, Sleeper and Spacer Block comprised less than
4% of failed components.
45,3
30,4
7,9 5,6 4,5 2,9 1,3 1,0 0,7 0,2 0,2
0,0 5,0
10,0 15,0 20,0 25,0 30,0 35,0 40,0 45,0 50,0
Fre
qu
en
cy %
Failed Components

37
7.2. Number of Potential Failure Modes
Another condition was considered while analyzing the failure variety in
components. Data demonstrated that Turnout failures can occur in various
modes. An important outcome of assessment of different defects was a
categorization of possible failure modes in turnouts. A classification of
different types of failure modes in Turnouts is shown in Table 2.
Failure Modes Total Number Frequency Distribution %
Obstructed ( Iced,..) 986 40,1
Dry Chairs 441 17,9
Cracked/Broken 233 9,5
Voiding (Ballast) 190 7,7
Out of adjustment 137 5,6
Contaminated (Leaves,..) 136 5,5
Plastic deformation/Lipping 127 5,2
Wear 93 3,8
Loosed/missing(Nuts) 89 3,6
Squat, RCF 8 0,3
Creep (Switch,..) 8 0,3
Track gauge variation 7 0,3
Wet bed 3 0,1
Sum 2458 100
Table 2. Total Number of Failure modes in 2009
The complete series of graphs from the data sets about the failure modes
are presented in Appendix A.

38
The circumstance of failure modes distribution represents in Figure 34.
Figure 34. Failure Modes Distribution in 2009
The chart shows the importance of Obstructed and Dry chairs failures with
58% of occurrence. In contrast, Cracking or Breaking, Ballast Voiding, getting
Out of Adjustment, contaminated and Plastic Deformation made up 40.9 % of
failures whereas Squat, RCF, Creep, Widening Track and Wet Bet failures had
the lowest portion of occurrence with only 1 %.
40,1
17,9
9,5 7,7 5,6 5,5 5,2 3,8 3,6 0,3 0,3 0,3 0,1
0,0 5,0
10,0 15,0 20,0 25,0 30,0 35,0 40,0 45,0
Fre
qu
en
cy %
Failure Modes

39
7.3. Relationship between Weather and Failure Modes
Many factors contribute to the Turnouts failure. Since all information
included the time of year when the failures occurred, In order to find out how
failure frequency varies with climate, an additional attention has been given to
determination of climate effects on failure occurring. The seasonal failures
frequency is shown in Table 3.
Seasons Number of Failure
Modes Frequency Distribution (%)
Spring 421 17,1
Summer 427 17,4
Autumn 830 33,8
Winter 780 31,7
Sum 2458 100
Table 3. Association between Seasons and Number of Failure Modes in
Turnouts in 2009
Probability of Turnouts failure occurrence in different seasons in the UK in
2009 has been shown in Figure 35.

40
Figure 35. Probability of Turnout Failures by Season in 2009
Analysis has revealed a relationship between Seasons and failed
components. It is clear that the weather plays a very significant role in the
probability of failure. In Table 2 Seasonal failures represent a better view of
climate effects on failure, where a large number of failures occurred in the
period of autumn and winter. It means cold weather is a problem of great
significance to the railway system. Indeed, much attention should be given to
the inspection during the cold weather. The small difference between autumn
and winter failures frequency might be as a result of leaves falling in autumn
that train drivers are warn about it in this season. Additional information about
the determination of weather effects on failures frequency is available in
Appendix B.
17,1 17,4
33,8 31,7
0,0
5,0
10,0
15,0
20,0
25,0
30,0
35,0
40,0
Spring Summer Autumn Winter
Fre
qu
ency
%
Seasons
Seasonal Failures

41
7.4. Rectification of Failed Components
After identification of Turnout failure modes, determination of possible
rectification gains a great importance. Actions that are available or can be
taken by an operator to negate or mitigate the effect of a failure on a system
are called Rectification. Rectification concerning turnout failures has been
investigated through the recent data. It has been recognized that the frequency
of some rectification actions allocated to the Turnout is variable for different
components. Table 4 represents different types of Turnout rectification.
Rectification Total
Number Failed Components
De-Iced 559 Switch rail, slide chairs, Schiwag Roller, Back drive, Stretcher bar
Lubricated 445 Slide chairs, Schiwag Roller
Remove Obstacle
427 Switch rail, slide chairs, Stretcher bar, Back drive
Renewed 243 Stretcher bar, Slide chair, Crossing (nose crack), Fishplate, Switch rail, Stock rail, Sleeper, Space block, Ballast
Lift &Pack 190 Ballast
Grind 167 Switch rail, Stock rail, Fish plate
Adjusted 143 Schiwag Roller, Switch rail, Stretcher bar, Back drive, slide chairs, Ballast
Cleaned 136 Slide chairs, Switch rail, Schiwag Roller
Weld repair 71 Switch rail, Crossing, Fishplate
Tightened 70 Slide chairs, Stretcher bar(nuts), Back drive, Fish plate
Gauged 7 Switch rail, Stock rail
Total 2458 -
Table 4. Different Rectification Actions Allocated to Failed components

42
Failed components in the Table 4 has sorted based on the number of
rectification frequency acted on them. It is considerable that the number of
some specific rectifications is noticeable in some components. This
information provides us a better prediction about dominant rectification
mechanism in each component.
Figure 36 shows the rectification Frequency Distribution in Turnouts.
Figure 36. Frequency Distribution of Different Rectification Modes in
Turnouts in 2009
22,7
18,1 17,4
9,9 7,7 6,8 5,8 5,5
2,9 2,8 0,3
0,0
5,0
10,0
15,0
20,0
25,0
Fre
qu
ency
%
Rectification Modes

43
8. Methodology
In order to analyze the potential failure modes within a system for classification by the severity and probability of the failures we used a Failure Modes and Effects Analysis (FMEA) procedure. FMEA consists of breaking a system down into Specific data. A successful FMEA process helps an investigator to identify potential failure modes based on past experience. The analysis begins with identification of the possible failure modes associated with a certain item which results an end effect. . Along with the end effect, the analyst may also determine the probability of occurrence of that effect, the severity of that effect and how the effect could be detected. Once the detection of failure modes is complete, some type of ranking criteria is employed. The ranking is then used to determine how critical failures can be eliminated or the risks mitigated. After determination of different ranking we can approach to a Risk Priority Number (RPN) which reveals the overall risk of a particular failure mode occurring in our system. FMEA cycle is shown in Figure 37. [23][24]
Figure 37. Failure Modes and Effects Analysis Cycle (FMEA)
Risk Priority Number (RPN)=
OCCUR*SEV*DETEC
Detect A failure Mode
Step 1: Probability Number (OCCUR)
Step 2: Sensitivity Number(SEV)
Step 3: Detection Number (DETEC)

44
8.1. FMEA Procedure
Step 1. Occurrence
In the first step we defined a mode failure rate as an occurrence number.
Occurrence is an assigned value that designates how frequently that
particular failure mode occurs over a time period. Table 5 shows a Failure
occurrence ranking.
Rating Meaning Range ( % )
1 No Effect FFD = 0
2 Low ( Few Failure) 0 < FFD < 5
3 Moderate ( occasional Failure) 5 < FFD < 10
4 High ( Repeated Failure) 10 < FFD < 20
5 Very High FFD > 20
Table 5. Failures Occurrence Ranking
In this way a failure mode is given an occurrence ranking (O), Also
Failures Frequency Distribution (FFD) is categorized in different range.
Step 2. Sensitivity
Sensitivity is an assigned value that indicates the severity of the effect of a particular failure mode. A failure mode in one component can lead to a failure mode in another component; therefore each failure mode should be listed in technical terms and for function. Hence, the ultimate effect of each failure mode needs to be considered. Table 6 shows the Failure Sensitivity Ranking.

45
Rating Meaning
1 No Effect
2 Very Minor ( No immediate effect, Affects system in long period )
3 Minor(Affects little of system, Bad effects on other components)
4 Moderate (Causes a less primary function)
5 High (Causes a loss of primary function)
6 Very High ( Results unsafe operation and possible injuries)
Table 6. Failures Sensitivity Ranking
In this step a failure effect is defined as the result of a failure mode on the
function of the system. Each effect is given a sensitivity number (S) from 1 (no danger) to 6 (critical) to prioritize the failure modes and their effects.
Step 3. Detection
Detection is an assigned value that indicates how often that particular failure mode can be detected. In this step each failure receives a detection number (D). The assigned detection number measures the risk that the failure will escape detection. Table 7 represents a Failure Detection Ranking.
Rating Meaning
1 High
2 Moderate
3 Low
Table 6. Failures Detection Ranking
According to Detection Ranking, a high detection number indicates that
the chances are high that the failure will escape detection or the chances of detection are low.

46
Risk Priority Number (RPN)
The RPN reveals the overall risk of a particular failure mode occurring in our system. Actually, RPN is a threshold value in the evaluation of failure. After ranking the occurrence, severity and detectability the RPN is calculated as RPN = S × O × D. The result is a categorized breakdown of failure modes based on risk. Once this is done it is easy to determine the areas of greatest concern. The failure modes that have the highest RPN should be given the highest priority for preventive maintenance. This means it is not always the failure modes with the highest severity numbers that should be treated first. There could be less severe failures, but which occur more often and are less detectable.

47
9. Results
The main objective of this study is to get a better categorization of the most critical failure modes in Turnout in UK railway. This may lead us to know that which components have higher potential to get failed. According to the failure classification in chapter 7, turnout failures have been divided into 13 major parts. Studying the turnout failures behavior and following the FMEA procedure led to the final results in Table 7.
Failure Modes Occurrence
Rate Sensitivity
Rate Detection Rate
RPN
Obstructed (Iced,..) 5 5 3 75
Dry Chairs 4 5 3 60
Crack/Broken 3 5 2 30
Voiding (Ballast) 3 3 3 27
Out of adjustment 3 4 2 24
Contaminated (Leaves,..) 3 3 3 27
Plastic deformation/Lipping 3 4 2 24
Wear 2 4 2 16
Loose/missing(Nuts) 2 2 3 12
Squat, RCF 2 2 2 8
Creep (Switch) 2 3 1 6
Track Gauge variation 2 3 1 6
Wet bed 2 2 1 4
Table 7. Final FMEA Results

48
9.1. Discussion
All assigned values in Occurrence Rate are based on Failure Frequency
Distribution (FFD) ranges defined according to Table 5.
Sensitivity Rate indicates the severity of the effect of failure modes
according to Table 6.
Due to obstructed failure, the Switch Rail loses its primary function to
move, hence the five values assigned to Sensitivity Rate.
Dry Chairs failure usually occurs in the slide chair. The switch rail rests on
the slide chair, so when a slide chair doesn’t work properly it causes the
switch rail to lose its primary function. This means slide chair needs
immediate lubrication. Five values have been assigned under Dry Chair.
About 70% of cracked or broken failures occur in slide chairs and stretcher
bars. These failures cause a loss of primary function. In most cases these
components must be replaced immediately after failure. Five values have been
assigned to Cracked and Broken Failures.
Ballast voiding is the degradation of the ballast because of no tamping in
the turnout area. In most cases it negatively affects other components. In some
conditions the switch blade has become bowed causing tight back drive.
Broken chairs or loose bolts are other consequences. Lifting and packing the
ballast is considered a good rectification in voiding failure. Three values have
been assigned to Ballast Voiding.
When a Schiwag Roller gets out of adjustment, it affects the slide chair's
ability to perform, and needs to be adjusted at immediately. Four values have been assigned to Out of Adjustment Failure.
Leaves, dust and dirt often contaminate components. For example, leaves
can cause problems in the braking system. However, the big concern is in the
slide chair where contamination over time leads to serious problems such as
dry chair. Three values were allocated to Contaminated Failure.
Plastic deformation and wear, particularly in the switch and stock rail, lead
to a failure to provide correct locking or a loss of primary function. Four
values were assigned to them.
Loose or missing nuts, most commonly found in the slide chair and less
often in the stretcher bar, cause a delay for tightening or in some cases

49
renewing. Usually this doesn’t stop a component's function and is less
dangerous. Two values were assigned to this issue.
Squat and Rolling Contact Fatigue (RCF) rectify with weld repair or
grinding. They are generally not dangerous, but if left for a long time with no
repair, rail breakage may occur. They were evaluated with two ratings.
The long term effect of trains moving along a section of track can
cause longitudinal movements of rail, or "creep". An environmental factor
like temperature is known as a motivator item. This occurred in the UK due to
warm weather which led to an out of adjustment switch. Creep may cause a
hazardous situation because it adversely affects welding due to rail movement.
Three values have been assigned to it.
In a wide track, gauge variation usually exceeds standard. It sometimes
leads to track vibration or even wear on the track. It must be adjusted before
negatively affecting other components. Three values have been assigned to
this issue.
Wet bed or erosion pumping in the ballast may reduce its load support
properties. It might affect other components over a long period of time. Two
values were assigned to this.
Assigned values in Detection Rate allocated according to Table 6.
Obstructed Turnout occurs when a switch ices or ballast particles are
thrown out due to high speed train movement. This was assigned three values,
because it is easy to see ballast obstacles in switches or observe an iced
switch.
As with obstructed turnout, dry chair is easily observable by sight.
Therefore the Detection Number has three values assigned to it.
Since some cracks are difficult to see, especially when they have an
internal origin, two values were allocated to it in Detection Rate.
Ballast voiding in most cases is easy to see when viewing from beside the
ballast section. Three values in Detection Rate were assigned to it.
Out of adjustment failure usually shows itself through the slide chair
function, so it is not detectable directly. Accordingly, two values have been
assigned to it.

50
Contamination is observable easily on the track. Contamination by leaves
can be seen by the train driver and they usually report it to monitoring center.
Thus, three values in Detection Rate were attributed to it.
Lipping and wear, Squat, or RCF identification depends on their
regression. In a critical condition these are easy to spot. However, in other
cases, Nondestructive testing (NDT) methods likes Ultrasonic or Eddie
Currents are needed for visual condition monitoring. Two values assigned to
these.
Loose or missing nuts are easy to see. Therefore, three values of detection
number are attributed to them.
Since Creep misalignment is less evident during a walking inspection. It
must be identified by NDT. Thus, only one value was assigned to it.
Track gauge variation is not easy to see. It usually gets measured by a track
geometry recorder trolley. Therefore, only one value was attributed to it.
Wet bed is easy to see in critical conditions when slurry pumps upward
through the ballast. But in most cases, to identify wet bed, special instruments
like Ground Penetration Radar (GPR) are needed to scan the track. For wet
bed, only one value was assigned.
After ranking the Occurrence (O), Severity (S) and Detect ability (D) the
RPN is calculated as RPN = O × S × D. To identify the areas with greatest
concern we categorized the failures based on their RPN in three different
categories.
Group 1. High Risk Priority Number
Group 2. Moderate Risk Priority Number
Group 3. Low Risk Priority Number
Failures with a RPN probability of more than 10 percent belong to Group 1.
Failures with a RPN probability between 5 and 10 percent belong to Group 2.
Failures with a RPN probably of less than 5 percent belong to Group 3.
According to the top categorization all failure modes attributed to three
groups.

51
Group 1. Obstructed, Dry Chair
Group 2. Voiding, Contaminated, Out of Adjustment, Plastic
Deformation/Lipping, Wear
Group 3. Loose/ Missing(NUTS), Squat, RCF, Creep, Track Gauge Variation,
Wet bed.
Figure 38 shows failure zones of different Groups.

52
Figure 38. Failure Zones
Studying the Turnout failure behavior led to the following results. The
failure modes in Group 1 with highest RPN should be given the highest
priority for preventive maintenance. Group 2 is in the second priority for
preventive maintenance. Group 3 needs to get rectified before imposing a
serious effect on the system in long term.
0
5
10
15
20
25
0 5 10 15 20 25
Group 3
Group 2
Group 1
Failure Zones
RPN Distribution %

53
9.2. Conclusion
Turnouts are probably the most important infrastructure elements of the
railway system. They are subjected to high risk owing to many potential
failure modes. The assessment of failure risk in turnouts in order to ensure
high availability and safe operation can be based on historical data and
occurrence of failures. This analysis was conducted by investigation of
different defects appearing in turnouts, which allowed identification of the
most critical failures. FMEA procedure has been introduced to approach the
classification of critical failures in turnouts. Consequently, failure risk
evaluation based on a wider range of data may support a maintenance
development by providing precise criteria for deciding how often routine tasks
should be carried out. This policy might include improved service levels of
inspection and repairment.
.

54

55
References
[1] C. Esveld, Modern railway Track, 2001
[2] U. Zerbst, R. lunden, K. Edel, R. A. Smit, Introduction to the damage
tolerance behavior of railway rails, 2009
[3] H. Desimone, S. Beretta, Mechanisms of mixed mode fatigue crack
propagation at rail butt-welds, 2005
[4] W.J. Zwanengburg, Modeling Degradation Processes of Switches &
Crossings for Maintenance & Renewal Planning on the Swiss Railway
Network, 2009
[5] A.M. Zarembski, P.E, Fasme, ZETA-TECH, Turnout, special track
work grinding, 2010
[ 6] S. Kaewunruen , A. M. Remennikov, Dynamic flexural influence on a
railway concrete sleeper in track system due to a single wheel impact,
2008
[7] S. Kaewunruen, A. M. Remennikov, Probabilistic Impact Fractures of
Railway Prestressed Concrete Sleepers, 2008
[8] G.Nicieza, l. Ferna´ndez, M. Dı´az, l.Vigil, A. Ferna´ndez, Failure analysis
of concrete sleepers in heavy haul railway tracks, 2008
[9] B. Indraratna, W. Salim, Deformation and degradation mechanics of
recycled ballast stabilized with geosynthetics, 2003
[10] M. Clark, D. M. Maccannand ,M. C. Forde, Infrared thermographic
investigation of railway track ballast , 2002
[11] JK. Liu, JH .Xiao, Experimental study on the stability of railroad silt
subgrade with increasing train speed , 2010
[12] M. J. Brough, G. S. Ghataora, A. B. Stirling, K. B. Madelin, C. D. F.
Rogers , D. N. Chapman, Investigation of railway track subgrade ,I:In-
situ assessment, 2003

56
[13] G. N. Haidemenopoulosi, A. d. Zervaki, P. Terezaki, J. Tzani, A. E.
Giannakopoulo, M. K. Kotouzas, Investigation of rolling contact fatigue
cracks in a grade 900A rail steel of a metro track, 2005
[14] S. Kaewunruen, A. M. Remennikov, Impact capacity of railway
prestressed concrete sleepers, 2008
[15] J. Nigel, Geotextiles, 1987
[16] B. M. Krishna, Performability Engineering, 2008
[17] W. L. Lim, Mechanics of railway ballast behavior, 2004
[18] D. L. Cope, J. B. Ellis, British Railway Track, Switch & Crossing
Maintenance, Seventh Edition, 2005
[19] D. L. Cope, J. B. Ellis, British Railway Track, Plain Line Maintenance,
Seventh Edition, 2001
[20] R. Robert, J. Rudy, Rail road ballast fouling detection using ground
penetrating radar, 2006
[21] F. Schmit (Editor), Wheel-Rail best practice handbook, 2010
[22] Rail Defects Handbook, Australian Rail Track Corporation, 2006
[23] J. H. Kim, H. Y. Jeong, J. S. Park, Development of the FMECA process
and analysis methodology for railroad systems, 2009
[24] O. Duque, A. Zorita, L. A. G. Escudero, M. A. Fernandez, Criticality
determination based on failure records for decision-making in the
overhead contact line system, 2009

57

58
Appendix A
The data in this appendix were collected from UK railway in 2009. The
data set consists of 2458 measurements collected over a year period.
A pie chart in Figure A1 represents the distribution of failure modes in
Turnouts components. Figures A.2, 3, 4, 5, 6, 7, 8,9,10, 11, 12, 13 show the
distribution of failure modes in Turnout’s components.
Figure A1. Distribution of Failure Modes in Turnout’s Components
91.7%
Rail
0.2%
Sleeper
7.9%
Ballast

59
Figure A2. Distribution of Obstructed Failure in Turnout’s Components
Figure A3. Distribution of Dry Failure in Turnout’s Components
5,8 0,3
92,3
0,6 1,0 0,0
20,0
40,0
60,0
80,0
100,0
Fre
qu
ency
%
Failed Components
Obstructed
99,8
0,2 0,0
20,0
40,0
60,0
80,0
100,0
120,0
Fre
qu
ency
%
Failed Components
Dry chair

60
Figure A4. Distribution of Out of Adjustment Failure in Turnout’s
Components
Figure A5. Distribution of Plastic Deformation/Wear Failure in Turnout’s
Components
0,7
94,2
2,2 2,2 0,7 0,0
10,0 20,0 30,0 40,0 50,0 60,0 70,0 80,0 90,0
100,0 Fr
eq
uen
cy %
Failed Components
Out of adjustment
72,3
2,3 0,5
25
0,0 10,0 20,0 30,0 40,0 50,0 60,0 70,0 80,0
Fre
qu
ency
%
Failed Components
Plastic deformation/Wear

61
Figure A6. Distribution of Contaminated Failure in Turnout’s Components
Figure A7. Distribution of Track Gauge Variation Failure in Turnout’s
Components
90,4
2,9 6,6
0,0
20,0
40,0
60,0
80,0
100,0 F
req
uen
cy %
Failed Components
Contaminated
100
0
20
40
60
80
100
120
Fre
qu
ency
%
Failed Components
Track gauge variation

62
Figure A8. Distribution of Cracked/Broken Failure in Turnout’s Components
Figure A9. Distribution of Loose (Nuts) Failure in Turnout’s Components
33,5
5,6 5,6
12,9
4,3
34,8
1,7 1,7
0,0 5,0
10,0 15,0 20,0 25,0 30,0 35,0 40,0
Fre
qu
ency
%
Failed Components
Cracked/Broken
53,9
1,1 3,4 6,7 10,1 4,5
19,1
1,1 0,0
10,0
20,0
30,0
40,0
50,0
60,0
Fre
qu
ency
%
Failed Components
Loose(Nuts)

63
Figure A10. Distribution of Voiding Failure in Turnout’s Components
Figure A11. Distribution of Wet Bed Failure in Turnout’s Components
100
0,0
20,0
40,0
60,0
80,0
100,0
120,0
Fre
qu
ency
%
Failed Components
Voiding (Ballast)
100
0
20
40
60
80
100
120
Fre
qu
ency
%
Failed Components
Wet Bed
64
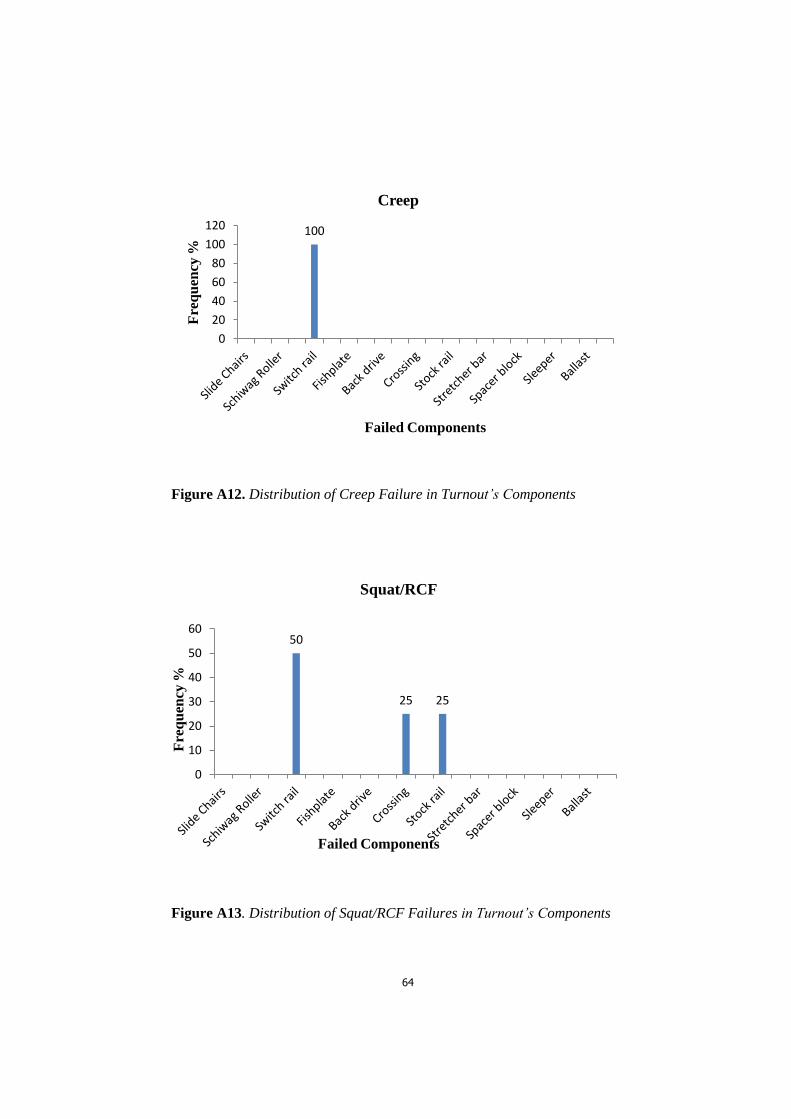
Figure A12. Distribution of Creep Failure in Turnout’s Components
Figure A13. Distribution of Squat/RCF Failures in Turnout’s Components
100
0
20
40
60
80
100
120
Fre
qu
ency
%
Failed Components
Creep
50
25 25
0
10
20
30
40
50
60
Fre
qu
ency
%
Failed Components
Squat/RCF

65

66
Appendix B
The data in this appendix were collected from UK railway in 2009. The
data set consists of 2458 measurements collected over a year period.
Figure B.1 shows Number of Failure Modes in different months.
Figure A13. Relationship Between Number of Failure Modes and Months.
194
410
176
151
142
128
156
139
132 179
182
469
0 50
100 150 200 250 300 350 400 450 500
Dat
a C
ou
nt
Months
Number of Failure Modes

67


![WP2: Enhanced Switches & Crossings · Enhanced Switches & Crossings Task # Description Due Date 2.1 Identifying and Understanding Core S&C Issues [TRL 6] M12 2.2 Enhanced S&C Whole](https://static.fdocuments.us/doc/165x107/5f685daf9c2f603f7b510d0e/wp2-enhanced-switches-crossings-enhanced-switches-crossings-task-.jpg)