Failed States Index IX 2013 - The Fund for...
40
Failed States Index IX2013
Transcript of Failed States Index IX 2013 - The Fund for...

Failed States Index
IX2013

The Fund for Peace is an independent, nonpartisan, 501(c)(3) non-profit research and educational organization that works to prevent violent conflict and
promote sustainable security. We promote sustainable security through research, training and education, engagement of civil society, building bridges
across diverse sectors, and developing innovative technologies and tools for policy makers. A leader in the conflict assessment and early warning field,
The Fund for Peace focuses on the problems of weak and failing states. Our objective is to create practical tools and approaches for conflict mitigation that
are useful to decision-makers.
Copyright © 2013 The Fund for Peace.
All rights reserved.
No part of this publication may be reproduced or transmitted in any form or by any means without prior written consent from The Fund for Peace.
Report Edited by Assessment Directed by
J. J. Messner Nate Haken
Report Written by
Nate Haken, J. J. Messner, Krista Hendry, Patricia Taft, Kendall Lawrence, Felipe Umaña
Assessment Supported by
Filipa Carreira, Elizaveta Egorova, Jack Fritzinger, Lidet Gezahegne, Rachel Hersh, Kimberly Hoffman,
Nora Loncsar, Jessica Mummery, Sebastian Pavlou, Florkime Paye, Felipe Umaña
The Fund for Peace Publication FFP : CFSIR1306 (Version 06L)
Circulation: PUBLIC
The Fund for Peace T: +1 202 223 7940
1720 I Street NW, 7 F: +1 202 223 7947
Washington, D.C. 20006 www.fundforpeace.org
www.failedstatesindex.org
The Fund for Peace is grateful for the support of:
A list of the top 60 countries of the
Failed States Index are published in the
July-August edition of Foreign Policy magazine.
2 The Fund for Peace www.fundforpeace.org

The Failed States Index is an annual ranking
of 178 nations based on their levels of
stability and the pressures they face. The
Index is based on The Fund for Peace’s
proprietary Conflict Assessment Software
Tool (CAST) analytical platform. Based on
comprehensive social science methodology,
data from three primary sources is
triangulated and subjected to critical review
to obtain final scores for the Failed States
Index. Millions of documents are analyzed
every year, and by applying highly
specialized search parameters, scores are
apportioned for every country based on
twelve key political, social and economic
indicators and over 100 sub-indicators that
are the result of years of painstaking expert
social science research.
The 2013 Failed States Index, the ninth
edition of the annual Index, is comprised of
data collected between January 1, 2012 and
December 31, 2012 — thus, certain well-
publicized events that have occurred since
January 1, 2013 are not covered by the 2013
Index.
An Important Note
The Failed States Index scores should be
interpreted with the understanding that the
lower the score, the better. Therefore, a
reduced score indicates an improvement,
just as a higher score indicates greater
instability. For an explanation of the various
indicators and their icons, please refer to
page 10.
Analysis
Introduction to the Failed States Index 9
What Were You Expecting? 11
J. J. Messner
The Troubled Ten in 2013 15
J. J. Messner and Kendall Lawrence
Anatomy of a Storm: 21
Regional Impacts of the Arab Spring
Nate Haken
The Dark Side of State Building: 23
South Sudan
Nate Haken and Patricia Taft
The Recovery of Somalia: 25
Check Back With Us Again Next Year
Felipe Umaña
The Year of Red-Line Diplomacy 27
Patricia Taft
Multidimensional: 29
The Four D’s of Human Security
Krista Hendry
No State is an Island: The Importance 31
of a Multisectoral Approach
Krista Hendry
The Index
Failed States Index 2013 Rankings 4
Failed States Index Heat Map 6
Most Worsened Countries for 2013 13
Most Improved Countries for 2013 14
Top Ten Countries for 2013 16
The Failed States Index 2013
by Country and Indicator 35
Best and Worst by Indicator 33
About
About the Indicators 10
About The Fund for Peace 39
For further analysis on individual countries, read FFP’s Country Profiles online at www.statesindex.org.
Overview
The Failed States Index 2013
3 The Fund for Peace www.fundforpeace.org

Rank Score (out of 120)
29. Bangladesh 92.5
= 59. Mozambique 82.8
30. Nepal 91.8 Philippines 82.8
1. Somalia 113.9 31. Mauritania 91.7 61. Madagascar 82.7
2. Congo (D. R.) 111.9 32. Timor-Leste 91.5 = 62.
Bhutan 81.8
3. Sudan 111.0 33. Sierra Leone 91.2 Gambia 81.8
4. South Sudan 110.6 34. Egypt 90.6 64. Senegal 81.4
35. Burkina Faso 90.2 65. Tanzania 81.1
5. Chad 109.0 66. China 80.9
6. Yemen 107.0
36. Congo, Republic 90.0
=67.
Bolivia 80.8
7. Afghanistan 106.7 37. Iran 89.7 Fiji 80.8
8. Haiti 105.8 = 38.
Mali 89.3 Israel 80.8
9. Central African Republic 105.3 Rwanda 89.3 70. Guatemala 80.7
10. Zimbabwe 105.2 40. Malawi 89.2
11. Iraq 103.9 41. Cambodia 88.0 71. Lesotho 79.4
12. Côte d'Ivoire 103.5 42. Togo 87.8 72. Nicaragua 79.2
13. Pakistan 102.9 43. Angola 87.1 73. Algeria 78.7
14. Guinea 101.3 44. Uzbekistan 86.9 74. Ecuador 78.6
15. Guinea Bissau 101.1 45. Zambia 86.6 75. Honduras 78.3
16. Nigeria 100.7 46. Lebanon 86.3 =76.
Azerbaijan 78.2
47. Equatorial Guinea 86.1 Indonesia 78.2
17. Kenya 99.6 48. Kyrgyz Republic 85.7 78. Benin 77.9
18. Niger 99.0 49. Swaziland 85.6 79. India 77.5
19. Ethiopia 98.9 50. Dijbouti 85.5 80. Russia 77.1
20. Burundi 97.6 = 51.
Solomon Islands 85.2 = 81.
Belarus 76.7
21. Syria 97.4 Tajikistan 85.2 Turkmenistan 76.7
22. Uganda 96.6 53. Papua New Guinea 84.9
= 83.
Bosnia 76.5
=23. Liberia 95.1 54. Libya 84.5 Moldova 76.5
North Korea 95.1 55. Georgia 84.2 Tunisia 76.5
25. Eritrea 95.0 56. Comoros 84.0 86. Turkey 75.9
26. Myanmar 94.6 57. Colombia 83.8 87. Jordan 75.7
27. Cameroon 93.5 58. Laos 83.7 88. Maldives 75.4
28. Sri Lanka 92.9 89. Venezuela 75.3
Very High Alert
1
The Failed States Index Rankings 2013
The Fund for Peace
High Alert
Alert
Very High Warning
High Warning

90. Thailand 75.1
=121. Botswana 64.0
151. Malta 42.4
91. Sao Tome and Principe 74.6 Seychelles 64.0 152. Chile 42.3
92. Serbia 74.4 123. Brunei 63.2 153. Poland 40.9
93. Morocco 74.3 124. Bahrain 62.9
94. Cape Verde 73.7 125. Trinidad & Tobago 62.6
154. Czech Republic 39.9
= 95. Dominican Republic 73.2 126. Brazil 62.1 155. Uruguay 38.4
El Salvador 73.2 156. Japan 36.1
= 97. Mexico 73.1
127. Kuwait 59.6 157. South Korea 35.4
Vietnam 73.1 128. Antigua & Barbuda 58.0 158. Singapore 34.0
= 99. Gabon 72.9 129. Mongolia 57.8 159. United States 33.5
Micronesia 72.9 130. Romania 57.4 160. United Kingdom 33.2
101. Cuba 72.8 131. Panama 55.8 =161.
France 32.6
102. Saudi Arabia 72.7 132. Bulgaria 55.0 Portugal 32.6
103. Peru 72.3 133. Bahamas 54.7 163. Slovenia 32.3
104. Paraguay 71.8 134. Montenegro 54.4 164. Belgium 30.9
105. Armenia 71.3 135. Croatia 54.1
106. Suriname 71.2 136. Oman 52.0
165. Germany 29.7
107. Guyana 70.8 137. Barbados 50.8 =166.
Austria 26.9
108. Namibia 70.4 138. Greece 50.6 Netherlands 26.9
168. Canada 26.0
109. Kazakhstan 69.8
139. Costa Rica 48.7 169. Australia 25.4
110. Ghana 69.1 140. Latvia 47.9 170. Ireland 24.8
111. Samoa 68.7 141. Hungary 47.6 171. Iceland 24.7
112. Macedonia 68.0 142. United Arab Emirates 47.3 172. Luxembourg 23.3
113. South Africa 67.6 143. Qatar 47.1 173. New Zealand 22.7
114. Belize 67.2 144. Argentina 46.1 174. Denmark 21.9
115. Cyprus 67.0 =145.
Estonia 45.3 =175.
Norway 21.5
116. Malaysia 66.1 Slovakia 45.3 Switzerland 21.5
117. Ukraine 65.9 147. Italy 44.6
118. Jamaica 65.6 148. Mauritius 44.5
177. Sweden 19.7
119. Albania 65.2 149. Spain 44.4 178. Finland 18.0
120. Grenada 64.6 150. Lithuania 43.0
Less Stable
Warning Stable
Sustainable
Very Sustainable
Very Stable
www.fundforpeace.org

Country Abbreviations
AE U.A.E. DJ Djibouti LI Lithuania
AL Albania DK Denmark LV Latvia
AM Armenia EE Estonia LX Luxembourg
AT Austria ER Eritrea ME Montenegro
AZ Azerbaijan GE Georgia MK Macedonia
BA Bosnia & Herz. GQ Eq. Guinea MW Malawi
BD Bangladesh GR Greece NL Netherlands
BE Belgium HU Hungary QA Qatar
BF Burkina Faso HV Croatia RS Serbia
BG Bulgaria IL Israel RW Rwanda
BH Bahrain JO Jordan SG Singapore
BI Burundi KG Kyrgyzstan SI Slovenia
BT Bhutan KH Cambodia SK Slovakia
CG Congo (Rep.) KW Kuwait TJ Tajikistan
CY Cyprus LA Laos TN Tunisia
CZ Czech Rep. LB Lebanon UG Uganda
Canada
United States of America
Mexico
Cuba
Jamaica
Haiti
Dominican Republic Honduras
Guatemala El Salvador Nicaragua
Belize
Trinidad & Tobago Costa Rica
Panama Venezuela
Colombia
Brazil
Guyana Suriname
Ecuador
Peru
Bolivia
Bahamas
Chile
Argentina
Paraguay
Uruguay
Iceland
DK United Kingdom
Norway
Sweden
Finland
Portugal Spain
France
NL BE
LX CH
Italy
AT
Germany
CZ
BA SI HV
ME
RS
HU SK
MK
AL
Romania
Poland
South
Africa
Botswana
Namibia
Angola
Democratic
Republic of
the Congo
Libya Algeria
TN
Morocco
Mauritania Mali
ChadNiger
Nigeria
C.A.R.
Cam
eroon
GQ
Gabon CG
Benin Togo
BF
Ghana
Côte
d’Ivoire Liberia
Sierra Leone Guinea
Guinea-Bissau
The Gambia
Senegal Barbados
Antigua
Grenada
Western
Sahara
Greenland
United States
of America
French Guiana
Ireland
The Fund for Peace
The Failed States Index in 2013

www.fundforpeace.org
Alert
Warning
Sustainable
Stable
120
110
100
90
80
70
60
50
40
30
20
10
Finland
RS
MK
GR
BG
Romania
Belarus
LI LV
Malta
South
Africa
Botswana
Zambia
Democratic
Republic of
the Congo
Chad
C.A.R.
MD Ukraine
EE Russia
Turkey
CY LB IL
Syria
JO
Iraq
GE AZ
Iran
AM
Kazakhstan
Uzbekistan Turkmenistan
Afghanistan
Pakistan KW BH QA AE
Saudi
Arabia
Yemen
Oman
KG
TJ
China
North Korea
South Korea
Japan
Vietnam
Thailand
LA
KH
Myanmar
Nepal
BD
BT
India
Sri Lanka
Maldives
SG
Malaysia
Indonesia Timor-Leste
Brunei
Philippines
Papua New Guinea
Solomon Islands
Vanuatu Fiji
Samoa
Australia
New Zealand
Seychelles
Mauritius
Comoros
Madagascar
Swaziland
Lesotho
Zimbabwe Mozambique
MW
Tanzania
BI
RW
UG Kenya
Somalia
Ethiopia
DJ
ER
Egypt
Mongolia
Micronesia
Taiwan
Sudan
South
Sudan
French
Polynesia

BUILDING STRONGER COMMUNITIES IN CONFLICT AND POST-CONFLICT ENVIRONMENTS
CreativeAssociatesInternational.com

eak and failing states pose a
challenge to the international
community. In today’s world,
with its highly globalized
economy, information systems
and interlaced security, pressures on one
fragile state can have serious repercussions
not only for that state and its people, but
also for its neighbors and other states
halfway across the globe.
Since the end of the Cold War, a number of
states have erupted into mass violence
stemming from internal conflict. Some of
these crises are ethnic conflicts. Some are
civil wars. Others take on the form of
revolutions. Many result in complex
humanitarian emergencies. Though the
dynamics may differ in each case, all of
these conflicts stem from social, economic,
and political pressures that have not been
managed by professional, legitimate, and
representative state institutions.
Fault lines emerge between identity groups,
defined by language, religion, race, ethnicity,
nationality, class, caste, clan or area of
origin. Tensions can deteriorate into conflict
through a variety of circumstances, such as
competition over resources, predatory or
fractured leadership, corruption, or
unresolved group grievances. The reasons
for state weakness and failure are complex
but not unpredictable. It is critically
important that the international community
understand and closely monitor the
conditions that create weak and failed
states—and be prepared to take the
necessary actions to deal with the
underlying issues or otherwise mitigate the
negative effects of state failure.
To have meaningful early warning, and
effective policy responses, assessments
must go beyond specialized area
knowledge, narrative case studies and
anecdotal evidence to identify and grasp
broad social trends. An interdisciplinary
combination of qualitative research and
quantitative methodologies is needed to
establish patterns and acquire predictive
value. Without the right data, it is impossible
to identify problems that may be festering
‘below the radar.’ Decision makers need
access to this kind of information to
implement effective policies.
The Failed States Index (FSI), produced by
The Fund for Peace, is a critical tool in
highlighting not only the normal pressures
that all states experience, but also in
identifying when those pressures are
pushing a state towards the brink of failure.
By highlighting pertinent issues in weak and
failing states, the FSI — and the social
science framework and software application
upon which it is built — makes political risk
assessment and early warning of conflict
accessible to policy-makers and the public
at large.
The strength of the FSI is its ability to distill
millions of pieces of information into a form
that is relevant as well as easily digestible
and informative. Daily, The Fund for Peace
collects thousands of reports and
information from around the world,
detailing the existing social, economic and
political pressures faced by each of the 178
countries that we analyze.
The FSI is based on The Fund for Peace’s
proprietary Conflict Assessment Software
Tool (CAST) analytical platform. Based on
comprehensive social science methodology,
data from three primary sources is
triangulated and subjected to critical review
to obtain final scores for the FSI.
Millions of documents are analyzed every
year. By applying highly specialized search
parameters, scores are apportioned for
every country based on twelve key political,
social and economic indicators (which in
turn include over 100 sub-indicators) that
are the result of years of painstaking expert
social science research.
The Fund for Peace’s software performs
content analysis on this collected
information. Through sophisticated search
parameters and algorithms, the CAST
software separates the relevant data from
the irrelevant. Guided by twelve primary
social, economic and political indicators
(each split into an average of 14 sub-
indicators), the CAST software analyzes the
collected information using specialized
search terms that flag relevant items. Using
various algorithms, this analysis is then
converted into a score representing the
significance of each of the various pressures
for a given country.
An Introduction to
the Failed States Index
The Methodology and the Twelve Indicators Explained
Analysis of the Failed States Index
9 The Fund for Peace www.fundforpeace.org

The content analysis is further triangulated
with two other key aspects of the overall
assessment process: quantitative analysis
and qualitative inputs based on major
events in the countries examined. The
scores produced by The Fund for Peace’s
software are then compared with a
comprehensive set of vital statistics—as well
as human analysis—to ensure that the
software has not misinterpreted the raw
data. Though the basic data underpinning
the Failed States Index is already freely and
widely available electronically, the strength
of the analysis is in the methodological rigor
and the systematic integration of a wide
range of data sources.
10 The Fund for Peace www.fundforpeace.org
Introduction to The Failed States Index
Pressures on the population such as disease and
natural disasters make it difficult for the govern-
ment to protect its citizens or demonstrate a lack of
capacity or will.
Includes pressures and measures related to:
Demographic Pressures
• Natural Disasters
• Disease
• Environment
• Pollution
• Food Scarcity
• Malnutrition
• Water Scarcity
• Population Growth
• Youth Bulge
• Mortality
Pressures associated with population displacement.
This strains public services and has the potential to
pose a security threat.
Includes pressures and measures related to:
Refugees and IDPs
• Displacement
• Refugee Camps
• IDP Camps
• Disease related to
Displacement
• Refugees per capita
• IDPs per capita
• Absorption capacity
When tension and violence exists between groups,
the state’s ability to provide security is undermined
and fear and further violence may ensue.
Includes pressures and measures related to:
Group Grievance
• Discrimination
• Powerlessness
• Ethnic Violence
• Communal Violence
• Sectarian Violence
• Religious Violence
When there is little opportunity, people migrate,
leaving a vacuum of human capital. Those with
resources also often leave before, or just as, conflict
erupts.
Includes pressures and measures related to:
• Migration per capita
• Human Capital
• Emigration of
Educated Population
When there are ethnic, religious, or regional
disparities, governments tend to be uneven in their
commitment to the social contract.
Includes pressures and measures related to:
• GINI Coefficient
• Income Share of
Highest 10%
• Income Share of
Lowest 10%
• Urban-Rural Service
Distribution
• Access to Improved
Services
• Slum Population
Poverty and economic decline strain the ability of
the state to provide for its citizens if they cannot
provide for themselves and can create friction
between the “haves” and the “have nots”.
Includes pressures and measures related to:
• Economic Deficit
• Government Debt
• Unemployment
• Youth Employment
• Purchasing Power
• GDP per capita
• GDP Growth
• Inflation
Corruption and lack of representativeness in the
government directly undermine social contract.
Includes pressures and measures related to:
State Legitimacy
• Corruption
• Government
Effectiveness
• Political
Participation
• Electoral Process
• Level of Democracy
• Illicit Economy
• Drug Trade
• Protests and
Demonstrations
• Power Struggles
The provision of health, education, and sanitation
services, among others, are key roles of the state.
Includes pressures and measures related to:
Public Services
• Policing
• Criminality
• Education Provision
• Literacy
• Water & Sanitation
• Infrastructure
• Quality Healthcare
• Telephony
• Internet Access
• Energy Reliability
• Roads
When human rights are violated or unevenly
protected, the state is failing in its ultimate
responsibility.
Includes pressures and measures related to:
• Press Freedom
• Civil Liberties
• Political Freedoms
• Human Trafficking
• Political Prisoners
• Incarceration
• Religious
Persecution
• Torture
• Executions
The security apparatus should have a monopoly on use
of legitimate force. The social contract is weakened
where this is affected by competing groups. Includes
pressures and measures related to:
Security Apparatus
• Internal Conflict
• Small Arms
Proliferation
• Riots and Protests
• Fatalities from
Conflict
• Military Coups
• Rebel Activity
• Militancy
• Bombings
• Political Prisoners
When local and national leaders engage in deadlock
and brinksmanship for political gain, this
undermines the social contract.
Includes pressures and measures related to:
Factionalized Elites
• Power Struggles
• Defectors
• Flawed Elections
• Political
Competition
When the state fails to meet its international or
domestic obligations, external actors may intervene
to provide services or to manipulate internal affairs.
Includes pressures and measures related to:
External Intervention
• Foreign Assistance
• Presence of
Peacekeepers
• Presence of UN
Missions
• Foreign Military
Intervention
• Sanctions
• Credit Rating
Social and Economic Indicators
Political and Military Indicators
Uneven Economic Development
Human Flight and Brain Drain Poverty and Economic Decline
Human Rights and Rule of Law

n compiling the 2013 Failed States
Index (FSI), there was some optimism
at The Fund for Peace that we would
finally see Somalia climb out of first
place on the Index after having been firmly
anchored in top position for five straight
years, especially given the encouraging
signs that have been emanating from the
country in recent times. It was not to be.
Somalia has, for the sixth time in
succession, taken top spot in the FSI.
The case of Somalia demonstrates an
important facet of recovery from conflict
and development. The Fund for Peace’s
Nate Haken has noted the political
metaphor implicit in the nursery rhyme,
Humpty Dumpty, as illustrative of the long-
and short-term performance of countries
on the FSI: Humpty Dumpty – a fragile egg-
based character – had a great fall, leading to
a rapid loss of structural integrity -- or, in
technical parlance, a splattering.
Subsequently, despite the best efforts of all
the King’s horses and all the King’s men,
they were unable to put Humpty back
together again.
The Humpty Dumpty principle thus follows
that when countries fall significantly, they
can do so rapidly and catastrophically and it
takes significant resources to reconstruct
them. Though it is true that countries can
also experience slow declines (as we’ve seen
with multiple European countries), there is
really only one speed of recovery – slow.
Further, such recovery takes significant
effort from all manner of actors. [See our
coverage on interagency and multisectoral
collaboration beginning on page 31.]
There has been, however, some progress in
Somalia – a new government has been
sworn in and the blight of piracy off its coast
has been somewhat subdued. There are
signs that commerce is recovering, albeit
localized mainly in Mogadishu. There are
other hopeful signs as well, reflected in the
fact that Somalia was one of only two
countries in the Top 10 to see their scores
improve this year. As with any country in
Somalia’s position, it will be important for
the international community to be realistic
with its expectations. Yes, Somalia is
number one for the sixth year in a row, but
for a country facing the pressures and
challenges that Somalia has since 1991, the
road to recovery is inevitably a long one.
Similarly, Myanmar has been feted for its
entry into the global community, with the
installation of Aung San Suu-Kyi to
Parliament, some promising democratic
reforms, an opening up to the world
economy, and even a six-hour visit from
President Obama. Certainly, the advances
in Myanmar are encouraging, but no
country is capable of turning its fortunes on
a dime. As Myanmar has opened up, it is at
the same time experiencing massive
internal ethnic turmoil, and it is far from
guaranteed that the political reforms will be
permanent. The FSI demonstrates that
Myanmar is trending in the right direction –
indeed, it has improved nearly six points in
four years – but real, sustained change will
take time.
Another country that will require
international patience by the boat-load is
South Sudan. [See also our coverage on South
Sudan beginning page 23.] There was much
rejoicing at the birth of the world’s newest
country in 2011. As it turns out,
independence was not a panacea. Violence
continues, sometimes perpetrated by those
in state uniforms, sometimes along ethnic
lines. As much as statehood was a
herculean effort, in many ways the real
struggle begins now. South Sudan
provisionally entered the FSI as the 4th
most fragile state in 2012 and has officially
ranked there in 2013 as well, albeit with a
significantly worsened score.
Two countries that illustrate how slow and
steady success in statebuilding really is are
Sierre Leone and Timor-Leste. In the first
Failed States Index, in 2005, Sierra Leone
was ranked 6th. In 2013, Sierra Leone has
climbed down to 33rd, having improved
over ten points in eight years. Similarly,
Timor-Leste, whose UN mission closed in
2012, has also slowly made its way down
the FSI, improving from 20th in 2007 to
32nd this year and having advanced nearly
seven points in only three years. Both have
in common a slow and steady trend of
improvement. During the late 1990s, both
countries experienced at times vicious
conflict. And now, a decade and a half later,
both countries are on the verge of departing
Failed States Index 2013:
What Were You Expecting?
J. J. Messner
Analysis of the Failed States Index 2013
11 The Fund for Peace www.fundforpeace.org

our “Alert” category and entering our less
worrisome “Warning” designation. Neither
has been a smooth trajectory, with bumps
along the way and periodic returns to
violence, especially in Timor-Leste.
On the topic of recovery, the most-improved
nation for the 2013 FSI is Japan. After the
pummeling it received in 2012 from the
effects of the previous year’s earthquake
and nuclear meltdown, Japan has
rebounded significantly in 2013, though it
still has some way to go to return to its pre-
earthquake standing. Though it is true that
recovery is slow, Japan demonstrates that it
is possible for highly resilient countries with
legitimate, representative, and professional
institutions to recover fairly rapidly from
serious shocks. The next most improved
country, Iceland, has similarly demonstrated
a high level of resiliency, recovering from
the economic shocks of previous years.
Similarly, countries with relatively high
capacity can soften shocks that would
otherwise send a state into a tailspin. As the
economic crisis continues in much of
Europe – with Greece, Cyprus, Spain and
Portugal in particular experiencing
continued economic suffering – it is perhaps
interesting that none of these countries’
scores changed significantly in 2013.
Instability courses from country to country
in waves taking on different forms
depending on the sociopolitical context and
the response of leadership. What happened
last year in Tunisia affected Libya and Syria,
which this year affected Mali and
Mauritania. States are not isolated from the
wider international and transnational
context. Mali is by far-and-away the most-
worsened country in the 2013 FSI, having
worsened by 11.4 points and shot up 41
places to 38th on the Index, as a result of
the conflict in the north of the country.
Neighboring Mauritania is 2013’s second-
most worsened country. Syria is again the
third-most worsened country, having
worsened by a cumulative 11.5 points
between 2011 and 2013 as the civil war
continues to rage.
Comparing the FSI from year to year can
provide useful validation of things we
already suspected to be true. Somalia being
the country most at risk of state failure; Mali
and Syria worsening significantly due to
conflict; Japan rebounding from natural
disaster. None of this is news to anyone, nor
does it take the FSI to tell us these things.
What the FSI does do is demonstrate long-
term patterns and trends, allowing us to
possibly formulate new theories (or provide
validation to existing ones) about conflict
risk and lessons for peace building. At a
national level, we are able to chart the
progress of countries recovering from
conflict, like Sierra Leone and Timor-Leste.
We are able to chart the gradual worsening
that led to phenomena such as the Arab
Spring. [See our analysis beginning page 21]
Such observations can help us understand
patterns of political, social and economic
upheaval, hopefully improving our abilities
in early warning and charting successful
development.
Ultimately what the FSI teaches us is to be
realistic and -- to an extent – to be patient.
Certainly, countries can decline both rapidly
and gradually. Without significant capacity
and a high-level of resiliency, however, the
road to recovery will be a long and rocky
one, filled with potholes and setbacks. As
we approach the tenth anniversary of the
Failed States Index, the focus should
increasingly be placed on the overriding
trends of every country. The discourse
should not be about where a country ranks,
but rather, is that country better off than it
was last year? Or ten years ago? Is a country
facing rising pressures or diminishing
capacities? By asking questions such as this,
the international community can best help
alleviate pressures in the short term and
strengthen capacity in the longer term.
Ultimately, that is the purpose of the Failed
States Index.
Year Countries Improved* Unchanged* Worsened*
2013 178 107 15 56
2012 177+1 121 18 39
2011 177 121 13 43
2010 177 92 24 61
2009 177 43 7 127
2008 177 72 22 83
2007 177 66 38 73
2006 147 40 71 36
2005 77 n/a n/a n/a
12 The Fund for Peace www.fundforpeace.org
Failed States Index 2013: What Were You Expecting?
J. J. Messner is Director of Sustainable Development & Security at The Fund for Peace and is also Co-Director of The Failed States Index.
Global Changes from 2012 to 2013
Improved* Unchanged* Worsened*
107
countries 15
countries 56
countries
0
20
40
60
80
100
120
140Improved Unchanged Worsened
How is the World Doing?
The chart below demonstrates the number of countries that either improve or worsen in their total FSI scores
from year to year. Since 2010, more countries have improved their scores than have experienced a worsened
score. This would suggest that, in general, that for the past few years, more countries have been improving
than have been worsening.
* The “margin of error” is considered to be +/- 0.2. Therefore, for us to consider a country to have improved or worsened, its
score must change by +/- 0.3 or more.

2012 saw Mali’s embroilment in a series of compounding political,
security and humanitarian crises.
• An armed conflict has broken out in northern Mali since January
16, 2012 involving several insurgent groups rebelling against the
Malian government for the independence of the northern region
of Azawad.
• Further complications arose when Malian soldiers, dissatisfied
over the handling of the crisis, ousted Mali’s President Touré in a
coup d’état on March 21st. Widely condemned by the interna-
tional community, the coup led to harsh sanctions by Mali's
neighbors and the military chain of command collapsed. This
allowed the National Movement for the Liberation of Azawad
(MNLA) – the rebel group that led the Tuareg rebellion in January –
to swiftly take control of the northern region by April 2012.
• Islamist insurgents, who had initially backed the MNLA, expanded
their presence in the country’s vast, Saharan North imposing strict
Sharia law. Incapable of reconciling conflicting goals, the MNLA
began fighting against Islamist groups, including Ansar Dine and Al
Qaeda in the Islamic Maghreb (AQIM), and ultimately lost control
of most of northern Mali’s cities by July 2012.
• In response to Islamist territorial gains, a second coup d’état in
December, and a request from the Malian government for help in
repelling insurgent advances toward the south, the French
launched military operations on January 11th, 2013.
• Compounding the political and security crises is a humanitarian
crisis with six million people at risk of food insecurity.
Mali Rank Score Overall Trend 2012 Rank 2012 Score
38th 89.3 79th 77.9
Mali: Trend 2006-2013
Mali: Individual Indicator Trends, 2006-2013
Move
2012
Score
2013
Score
+11.4 Mali 77.9 89.3
+4.1 Mauritania 87.6 91.7
+2.9 Syria 94.5 97.4
+2.8 Burkina Faso 87.4 90.2
+2.6 China 78.3 80.9
+2.3 Tunisia 74.2 76.5
South Sudan 108.4 110.6
Senegal 79.3 81.4
Yemen 104.8 107.0
+2.1 Niger 96.9 99.0
Swaziland 83.5 85.6
+2.2
Top 10 Most Worsened 2012-2013 (by Score)
Move
2012
Position
2013
Position
41 Mali 79th 38th
11 Tunisia 94th 83rd
10 China 76th 66th
7 Senegal 71st 64th
Mauritania 38th 31st
Swaziland 55th 49th
6 Sao Tome and Principe 97th 91st
Burkina Faso 41st 35th
5 Angola 48th 43rd
Spain 153rd 149th
Micronesia 103rd 99th
Belarus 85th 81st
Algeria 77th 73rd
4
Top 10 Most Worsened 2012-2013 (by Rank)
Most Worsened for 2013
Failed States Index 2013: What Were You Expecting?
Move
2008
Score
2013
Score
+14.5 Libya 70.0 84.5
+13.7 Mali 75.6 89.3
Yemen 95.4 107.0
Tunisia 65.6 76.5
+10.5 Senegal 70.9 81.4
+9.8 Guinea Bissau 91.3 101.1
+7.6 Eritrea 87.4 95.0
Syria 90.1 97.4
+6.5 Haiti 99.3 105.8
+11.6
+7.3
+10.9
Most Worsened 5-Year Trend 2008-2013 (by Score)
70.0
75.0
80.0
85.0
90.0
2006 2007 2008 2009 2010 2011 2012 2013
0.0
2.0
4.0
6.0
8.0
10.0
DP REF GG HF UED ECO SL PS HR SEC FE EXT
13 The Fund for Peace www.fundforpeace.org

Japan continues to recover with relative speed from the triple crisis
of earthquake, tsunami and nuclear plant meltdown that devastated
the country on March 11, 2011.
• After the 9.0 magnitude earthquake and subsequent tsunami tore
through the country's north-eastern coastal communities of
Miyagi, Iwatu and Fukushima, at least 20,851 people died or
remain missing. This figure includes the confirmed number of
dead, 15,881, those who are missing, 2,668, and 2,303 others who
died from disaster-related issues.
• The crisis caused the displacement of some 400,000 people. It also
destroyed 300,000 buildings and damaged a further one million.
Reasonable estimates for direct economic loss from the earth-
quake and tsunami are around $275 billion with an additional $65
billion in damages as a result of the Fukushima nuclear plant
incident. Indirect losses could be in the order of $185 to 345 billion
across the earthquake, tsunami and nuclear plant.
• After two years and a $260 million long-term budget funds, almost
all of the 27.6 million tons of debris left behind after the crisis has
been transported to areas for waste disposal (approx. 75%) or to
permanent locations (approx. 20%). Various criticisms have been
made concerning how reconstruction funds have been spent as
only 10% of permanent housing for the region has been com-
pleted. Still, as Patrick Fuller of the Red Cross pointed out, Japan's
progress over one year compares to that achieved over three
years in places like Indonesia and Sri Lanka after the 2004
tsunami.
Japan Rank Score Overall Trend 2012 Rank 2012 Score
156th 36.1 151st 43.5
Japan: Trend 2006-2013
Japan: Individual Indicator Trends, 2006-2013
Most Improved for 2013
Move
2012
Score
2013
Score
-7.4 Japan 43.5 36.1
-4.4 Iceland 29.1 24.7
-4.0 Latvia 51.9 47.9
-3.8 Australia 29.2 25.4
-3.3 Poland 44.3 40.9
-2.9 New Zealand 25.6 22.7
-2.6 Belgium 33.5 30.9
-2.5 Botswana 66.5 64.0
Indonesia 80.6 78.2
-2.4 Malaysia 68.5 66.1
Norway 23.9 21.5
Top 10 Most Improved 2012-2013 (by Score)
Move
2012
Position
2013
Position
13 Indonesia 63rd 76th
Laos 48th 58th
Moldova 73rd 83rd
8 Azerbaijan 68th 76th
7
Ecuador 67th 74th
Gabon 92nd 99th
Kyrgyzstan 41st 48th
Venezuela 82nd 89th
6
Israel/West Bank 67th 61st
Malaysia 110th 116th
Morocco 87th 93rd
Thailand 84th 90th
10
Top 10 Most Improved 2012-2013 (by Rank)
Failed States Index 2013: What Were You Expecting?
Most Improved 5-Year Trend 2008-2013 (by Score)
Move
2008
Score
2013
Score
-9.5 Turkmenistan 86.2 76.7
-9.4 Lebanon 95.7 86.3
-9.2 Moldova 85.7 76.5
-7.8 Bosnia & Herzegovina 84.3 76.5
Bangladesh 100.3 92.5
Belarus 84.4 76.7
Barbados 58.5 50.8
-7.6 Germany 37.3 29.7
-7.3 Zimbabwe 112.5 105.2
-7.2 Solomon Islands 92.4 85.2
-7.7
20.0
25.0
30.0
35.0
40.0
45.0
2006 2007 2008 2009 2010 2011 2012 2013
0.0
2.0
4.0
6.0
8.0
10.0
DP REF GG HF UED ECO SL PS HR SEC FE EXT
14 The Fund for Peace www.fundforpeace.org

hough it is called the Failed States
Index, that is not to say that every
country on the FSI is a failed state —
after all, Finland is ranked on the FSI.
That is also not to say that any country on
the FSI is necessarily failed — though
Somalia might be the closest approximation
to what many people may consider to be a
failed state. Rather, the Failed States Index
measures the pressures experienced by
countries and thus adjudges their
susceptibility to state failure. Ranking top on
the FSI does not in and of itself mean that a
country is failed — it simply means that of
all countries, that one country is the most at
risk of failure.
Even when we talk about state failure, the
description itself is in many ways too loose.
A country may, for example, experience
levels of state failure in certain geographical
areas (such as ungoverned or poorly
governed territories). Mexico, for example,
is nationally ranked 97th, yet it could be
argued that the state has failed in some
geographical areas now under the influence
of drug cartels more than the state itself. Or,
a state may experience a level of failure in
certain facets. North Korea, for example, is
quite militarily proficient but its social and
economic indicators are under serious
pressure. So even where it is experienced,
state failure may only be experienced in
part.
Is Somalia a failed state? And if so, is it failed
in whole or in part? We will leave that for
others to decide. What we will do however is
present our assessment of the pressures
experienced by Somalia — and 177 other
countries.
Nevertheless, as with any index, there must
be a top and a bottom. The top ten
countries in the Failed States Index for 2013
are detailed here to provide some basic
context as to their recent performance and
to begin to illustrate why they find
themselves at the wrong end of the FSI.
Overall, there was little movement in the
Top 10 since 2012. The standings in the Top
10 are affected by the official introduction
of South Sudan at 4th, which has effectively
pushed most countries down one rank
simply by muscling them out of the way.
Somalia, D.R. Congo, and Sudan are
unchanged in their rankings. Similarly, were
it not for South Sudan’s introduction, the
rankings of Chad, Afghanistan, and Haiti
would also have been unchanged.
Rankings, of course only tell part of the
story. Of more interest are the scores
themselves. Though the Top 10 is largely
unchanged in terms of ranks, most of them
experienced a worsening in their score in
2013, the exceptions being Somalia and
Zimbabwe.
The Troubled Ten in 2013
J. J. Messner and Kendall Lawrence
Analysis of the Failed States Index
15 The Fund for Peace www.fundforpeace.org
2005 2006 2007 2008 2009 2010 2011 2012
1. Cote d’Ivoire Sudan Sudan Somalia Somalia Somalia Somalia Somalia
2. Congo, D.R. Congo, D.R. Iraq Sudan Zimbabwe Chad Chad Congo, D.R.
3. Sudan Cote d’Ivoire Somalia Zimbabwe Sudan Sudan Sudan Sudan
4. Iraq Iraq Zimbabwe Chad Chad Zimbabwe Congo, D.R. Chad
5. Somalia Zimbabwe Chad Iraq Congo, D.R. Congo, D.R. Haiti Zimbabwe
6. Sierra Leone Chad Cote d’Ivoire Congo, D.R. Iraq Afghanistan Zimbabwe Afghanistan
7. Chad Somalia Congo, D.R. Afghanistan Afghanistan Iraq Afghanistan Haiti
8. Yemen Haiti Afghanistan Cote d’Ivoire C.A.R. C.A.R. C.A.R. Yemen
9. Liberia Pakistan Guinea Pakistan Guinea Guinea Iraq Iraq
10. Haiti Afghanistan C.A.R. C.A.R. Pakistan Pakistan Cote d’Ivoire C.A.R.
2013
Somalia
Congo, D.R.
Sudan
South Sudan
Chad
Yemen
Afghanistan
Haiti
C.A.R.
Zimbabwe
Failed States Index Top 10 Lists, 2005-2013
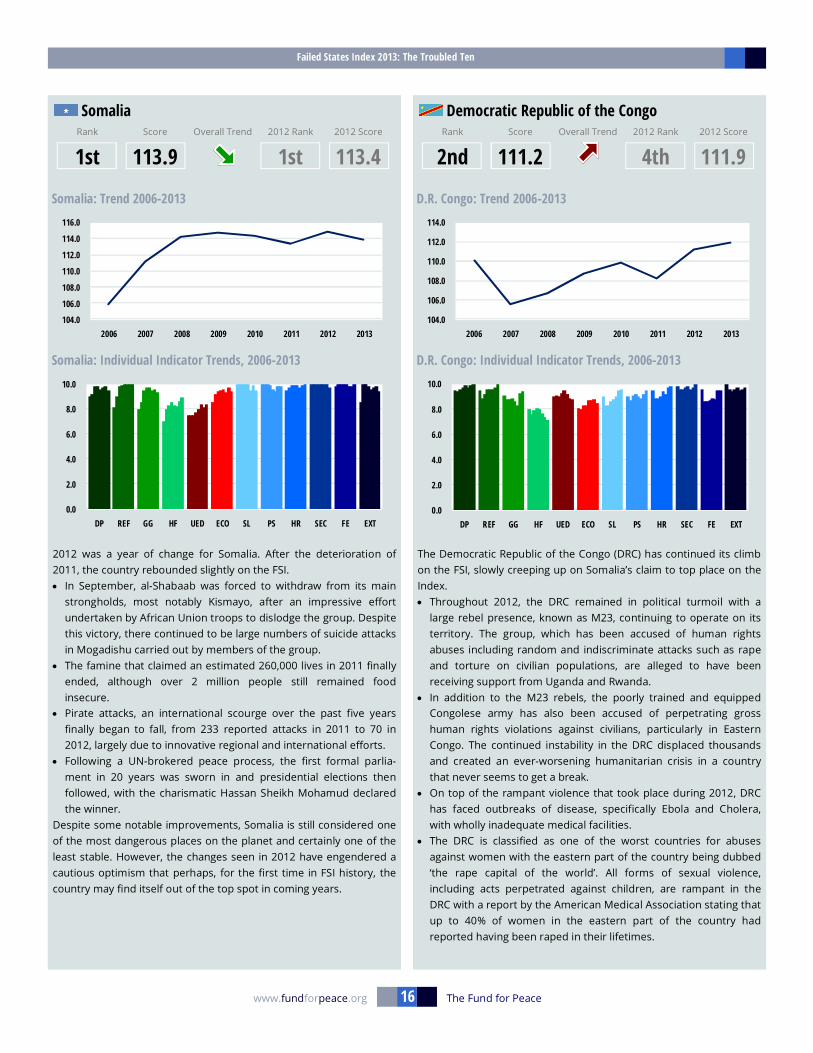
2012 was a year of change for Somalia. After the deterioration of
2011, the country rebounded slightly on the FSI.
• In September, al-Shabaab was forced to withdraw from its main
strongholds, most notably Kismayo, after an impressive effort
undertaken by African Union troops to dislodge the group. Despite
this victory, there continued to be large numbers of suicide attacks
in Mogadishu carried out by members of the group.
• The famine that claimed an estimated 260,000 lives in 2011 finally
ended, although over 2 million people still remained food
insecure.
• Pirate attacks, an international scourge over the past five years
finally began to fall, from 233 reported attacks in 2011 to 70 in
2012, largely due to innovative regional and international efforts.
• Following a UN-brokered peace process, the first formal parlia-
ment in 20 years was sworn in and presidential elections then
followed, with the charismatic Hassan Sheikh Mohamud declared
the winner.
Despite some notable improvements, Somalia is still considered one
of the most dangerous places on the planet and certainly one of the
least stable. However, the changes seen in 2012 have engendered a
cautious optimism that perhaps, for the first time in FSI history, the
country may find itself out of the top spot in coming years.
The Democratic Republic of the Congo (DRC) has continued its climb
on the FSI, slowly creeping up on Somalia’s claim to top place on the
Index.
• Throughout 2012, the DRC remained in political turmoil with a
large rebel presence, known as M23, continuing to operate on its
territory. The group, which has been accused of human rights
abuses including random and indiscriminate attacks such as rape
and torture on civilian populations, are alleged to have been
receiving support from Uganda and Rwanda.
• In addition to the M23 rebels, the poorly trained and equipped
Congolese army has also been accused of perpetrating gross
human rights violations against civilians, particularly in Eastern
Congo. The continued instability in the DRC displaced thousands
and created an ever-worsening humanitarian crisis in a country
that never seems to get a break.
• On top of the rampant violence that took place during 2012, DRC
has faced outbreaks of disease, specifically Ebola and Cholera,
with wholly inadequate medical facilities.
• The DRC is classified as one of the worst countries for abuses
against women with the eastern part of the country being dubbed
‘the rape capital of the world’. All forms of sexual violence,
including acts perpetrated against children, are rampant in the
DRC with a report by the American Medical Association stating that
up to 40% of women in the eastern part of the country had
reported having been raped in their lifetimes.
Somalia Rank Score Overall Trend 2012 Rank 2012 Score
1st 113.9 1st 113.4
Democratic Republic of the Congo Rank Score Overall Trend 2012 Rank 2012 Score
2nd 111.2 4th 111.9
Somalia: Trend 2006-2013
Somalia: Individual Indicator Trends, 2006-2013
D.R. Congo: Trend 2006-2013
D.R. Congo: Individual Indicator Trends, 2006-2013
Failed States Index 2013: The Troubled Ten
16 The Fund for Peace www.fundforpeace.org
104.0
106.0
108.0
110.0
112.0
114.0
116.0
2006 2007 2008 2009 2010 2011 2012 2013
0.0
2.0
4.0
6.0
8.0
10.0
DP REF GG HF UED ECO SL PS HR SEC FE EXT
104.0
106.0
108.0
110.0
112.0
114.0
2006 2007 2008 2009 2010 2011 2012 2013
0.0
2.0
4.0
6.0
8.0
10.0
DP REF GG HF UED ECO SL PS HR SEC FE EXT

South Sudan’s first complete year on the FSI shows it sinking into the
same cycles of instability that many of its neighbors face. Despite the
large volume of aid that has flowed into the country since independ-
ence, it has been unable to effectively utilize those resources towards
actual capacity building.
• Corruption is endemic in South Sudan, with an estimated $4 billion
of public funds having gone stolen or unaccounted for by mid-
2012 alone.
• Migration between South Sudan and Sudan continues to be high;
upward of 170,000 refugees crossed the border from Sudan into
the new state during 2012. This added to South Sudan’s food
shortages following the drought that the country faced during
2012 as well as contributed to overall population pressure in a
place ill-equipped to provide even the most basic services.
• Armed conflict with Sudan over oil rights and disputed pipeline
fees prompted the government in Juba to halt oil production in
January, a risky move as 98% of their income was projected to
come from oil production.
• International aid groups are beginning to accuse the government
and other factions of perpetrating gross human rights violations
including rape, torture, and execution. Media freedom was also
sharply curtailed. A notable journalist was killed after speaking out
against government-sponsored corruption and violence.
Independence has failed to provide the South Sudanese population
with a reprieve from conflict with continued tensions over land and
resources.
Continued strife between Sudan and South Sudan added to the
pressures that both states experienced during 2012.
• Armed conflict took place between South Sudan’s Unity state and
Sudan’s South Kordofan over control of the oil fields and the
pipelines in the highly contested Abyei territory.
• The lack of agreement over the demilitarized zone and Abyei
territory has impeded discussions on South Sudan exporting oil
through Sudan. Sudan’s decrease in oil revenue was due largely to
delays in South Sudan’s production coming online, thus preventing
Khartoum from earning the export fees for its role in bringing
South Sudanese oil to market.
• Fighting between Sudan’s government forces and rebels within
Sudan, largely in Unity and South Kordofan states, displaced an
estimated 655,000 people and created short-term food and
medical crises.
• In June, austerity measures implemented by the government in
the face of reduced oil revenues led to large-scale student
protests in Khartoum, which turned into violent clashes with
police, further underscoring Sudan’s precarious dependence on a
single resource economy.
• The lack of economic diversity has led to Sudan’s continued
decline on the FSI and underlines the need for economic and
political reform with a focus on economic diversification, stronger
public services, and a more professional security sector to deal
with civil unrest.
Failed States Index 2013: The Troubled Ten
Sudan Rank Score Overall Trend 2012 Rank 2012 Score
3rd 111.0 3rd 109.4
South Sudan Rank Score Overall Trend 2012 Rank 2012 Score
4th 110.6 n/r 108.4
Sudan: Trend 2006-2013
Sudan: Individual Indicator Trends, 2006-2013
South Sudan: Trend 2012-2013
South Sudan: Individual Indicator Trends, 2012-2013
17 The Fund for Peace www.fundforpeace.org
106.0
108.0
110.0
112.0
114.0
116.0
2006 2007 2008 2009 2010 2011 2012 2013
0.0
2.0
4.0
6.0
8.0
10.0
DP REF GG HF UED ECO SL PS HR SEC FE EXT
107.0
109.0
111.0
113.0
115.0
2006 2007 2008 2009 2010 2011 2012 2013
Sudan
South Sudan
0.0
2.0
4.0
6.0
8.0
10.0
DP REF GG HF UED ECO SL PS HR SEC FE EXT

Although Chad shifted down one slot on the FSI this year because of
the addition of South Sudan, its actual individual score worsened.
• Throughout 2012, Chad received large numbers of refugees from
both Sudan and the Central African Republic as a result of their
internal conflicts and growing humanitarian crises. Its own number
of IDPs increased by an estimated 90,000 individuals over the year
with the government having little to no capacity to address the
additional needs created by the increase in refugees and IDPs.
• There was continuing concern in Chad throughout 2012 due to
increased desertification and drought, as the semi-arid land is
strained by high demand on scarce resources.
• There was an increase in the number of youth reportedly joining
armed gangs and radical movements due to high rates of
unemployment and few opportunities for alternative livelihoods.
Already experiencing instability along religious and tribal lines that
have been exacerbated in the past by the large influx of refugees
from neighboring conflicts, Chad is confronted by increased
overall volatility and a spike in small arms and trained individuals
proliferating into the country, particularly along the borders.
• Overall, Chad continued to be one of the poorest countries in the
world, with a dire lack of resources and public services. Instability
was exacerbated by increased flows of refugees and arms and an
increasingly radicalized youth population.
Yemen’s FSI score has been steadily getting worse since 2007 with
2012 representing its poorest showing on the Index so far.
• In the shadow of the Arab spring, protests in Yemen over massive
human rights violations including arbitrary detention, attacks on
free speech, and the use of child soldiers, caused President Ali
Abdullah Saleh to step down at the end of 2011. This raised hopes
for stabilization and democratization in the highly factionalized
country. The transitional government that succeeded him faced
many challenges and was confronted by the wide-ranging abuses
Saleh’s regime perpetuated as well as addressing the conflict
between the North and South, neither of which the state was
adequately prepared to address.
• Adding to the challenges facing Yemen, the U.S. continued to
conduct the highly controversial campaign of covert piloted and
drone attacks on alleged al-Qaeda in the Arabian Peninsula
militants in Yemen. U.S.-conducted operations increased during
2012 — hugely unpopular in Yemen. The drone strikes further
underscored the belief on the part of many Yemenis that the
government was complicit in attacking its own citizens.
• As the number of IDPs doubled in 2012 to nearly a half million,
reports indicated that a record 10 million people lacked sufficient
food, half the population did not have access to clean water, and
reductions in access to health care have led to increased out-
breaks of disease.
Failed States Index 2013: The Troubled Ten
Chad Rank Score Overall Trend 2012 Rank 2012 Score
5th 109.0 4th 107.6
Yemen Rank Score Overall Trend 2012 Rank 2012 Score
6th 107.0 8th 104.8
Chad: Trend 2006-2013
Chad: Individual Indicator Trends, 2006-2013
Yemen: Trend 2006-2013
Yemen: Individual Indicator Trends, 2006-2013
18 The Fund for Peace www.fundforpeace.org
104.0
106.0
108.0
110.0
112.0
114.0
2006 2007 2008 2009 2010 2011 2012 2013
0.0
2.0
4.0
6.0
8.0
10.0
DP REF GG HF UED ECO SL PS HR SEC FE EXT
92.0
97.0
102.0
107.0
112.0
2006 2007 2008 2009 2010 2011 2012 2013
0.0
2.0
4.0
6.0
8.0
10.0
DP REF GG HF UED ECO SL PS HR SEC FE EXT

Haiti continues its slow struggle towards recovery following the
devastating earthquake of 2010, improving slightly in its score from
last year’s FSI.
• The country’s capacity to cope with the onslaught of natural
disasters and resulting disease remains low. Despite a large influx
of aid since the 2010 earthquake, Haiti remains extremely fragile,
with widescale corruption and limited government capacity
hindering efforts at recovery and impairing its ability to provide
basic goods and services for most of the population.
• In 2012, there were several large protests over the cost of living
and President Martelly’s proposal to revive Haiti’s Army, leading to
calls for his resignation. With the violent history of the Haitian
army, many believe that any reemergence of the military would
return the island nation to its brutal past.
• The forced eviction of residents from temporary housing that they
had occupied since the 2010 earthquake also created controversy.
Many aid organizations protested this reaction by the government
stating that adequate housing was still not available. Police
brutality and an inappropriate use of force by security services was
also widely reported in the process.
• In addition, the dire state of the public services in Haiti, including
an abysmal medical system and a dearth of trained professionals
from all sectors, continued to hamper the country’s progress.
Afghanistan, 12 years and billions of dollars later, continues to
represent one of the most unstable countries in the world.
• Although the United States and its NATO allies have begun their
drawdown, the process was hampered in 2012 by high rates of
‘green on blue’ violence, with members of the Afghan military and
police attacking their international partners. This led to an initial
halt in joint patrols and then increased vetting for new recruits and
re-vetting of current recruits in an attempt to enhance security.
Overall, these incidents also cast a pall over operations as a
continued lack of trust continued despite years of effort and
resources.
• The drawdown process was also hindered by the large-scale
violent protests that took place across the country following
reports of NATO troops burning copies of the Koran and other
religious items at a base.
• In March of 2012, an American soldier entered a village in
Kandahar province and killed 16 sleeping Afghan civilians,
including women and children, triggering further backlashes
against the occupation.
• Assassinations of local Afghan political figures and religious
leaders by the Taliban and other groups continued to undermine
efforts at an inclusive peace process, most notably with the
assassination of Arsala Rahmani of the High Peace Council, a
former Taliban Minister and key figure in negotiations with rebel
factions.
Afghanistan Rank Score Overall Trend 2012 Rank 2012 Score
7th 106.7 6th 106.0
Haiti Rank Score Overall Trend 2012 Rank 2012 Score
8th 105.8 7th 104.9
98.0
103.0
108.0
113.0
2006 2007 2008 2009 2010 2011 2012 2013
0.0
2.0
4.0
6.0
8.0
10.0
DP REF GG HF UED ECO SL PS HR SEC FE EXT
Afghanistan: Trend 2006-2013
Afghanistan: Individual Indicator Trends, 2006-2013
Failed States Index 2013: The Troubled Ten
Haiti: Trend 2006-2013
Haiti: Individual Indicator Trends, 2006-2013
19 The Fund for Peace www.fundforpeace.org
98.0
100.0
102.0
104.0
106.0
108.0
110.0
2006 2007 2008 2009 2010 2011 2012 2013
0.0
2.0
4.0
6.0
8.0
10.0
DP REF GG HF UED ECO SL PS HR SEC FE EXT

The Central African Republic (CAR) rose from 10th to 9th on this
year’s FSI with an increase in its individual aggregate score of 1.5
points.
• Throughout 2012, natural disasters in the form of flooding
impacted both the food supply and the level of disease in a
country that already struggles with inadequate infrastructure and
public services.
• There was an increase in violence and abductions during the year
due to the presence of the Lord’s Resistance Army (LRA) in
southeastern CAR. With the LRA in the southeast and armed
groups in the north, over 27,000 people were displaced in 2012
from fighting and overall insecurity.
• There were violent protests throughout the year over government
policies as well as riots that culminated in attacks on prisons,
freeing inmates.
• Protests also erupted in December as French troops were
deployed to Bangui to reportedly protect French nationals and
facilitate their safe escort out of the country. Protestors accused
the French of trying to prop up the beleaguered government as
rebel forces closed in on the capital. Both the UN and the US also
issued evacuation orders for their staff and citizens.
• By December of 2012, rebels had overtaken most of the CAR,
including the capital, forcing the government to flee in to exile. The
coup was widely condemned by the international community.
Zimbabwe saw a significant improvement on the 2013 FSI moving
from 5th place in 2012 to 10th this year, the fourth year of consecu-
tive improvement.
• The economic situation in Zimbabwe improved as the European
Union (EU) lifted sanctions on members of government, though
not President Mugabe himself. The biggest improvement came at
the end of the year as the EU lifted further restrictions and began
giving foreign assistance directly to the Zimbabwean government.
Although sanctions against the government were relaxed, there
was not immediate reports of improvement in the economic
situation on the ground for regular Zimbabweans.
• Widespread human rights violations continued throughout the
country. The violations included arresting members of Women of
Zimbabwe Arise during peaceful protests on human rights and
economic conditions. Other groups considered threats to the
government were also harassed.
• Political tensions were high at the beginning of 2012 with reports
of Mugabe’s illness. Rumored to be on his death bed in Singapore,
he returned to Harare in seemingly good health in April.
With elections reported to take place during the second half of 2013,
it remains to be seen if Zimbabwe can hold on to its trend of
improvement or if elections will send it into a political tailspin.
Overall, although its score did improve in 2012, the country remains
extremely fragile and much of its population in dire circumstances.
Failed States Index 2013: The Troubled Ten
Central African Republic Rank Score Overall Trend 2012 Rank 2012 Score
9th 105.3 10th 103.8
Zimbabwe Rank Score Overall Trend 2012 Rank 2012 Score
10th 105.2 5th 106.3
Central African Republic: Trend 2006-2013
Central African Republic: Individual Indicator Trends, 2006-2013
Zimbabwe: Trend 2006-2013
Zimbabwe: Individual Indicator Trends, 2006-2013
J. J. Messner is Director of Sustainable Development & Security at The Fund for Peace and is also Co-Director of The Failed States Index.
Kendall Lawrence is a Research Associate at The Fund for Peace.
20 The Fund for Peace www.fundforpeace.org
96.0
98.0
100.0
102.0
104.0
106.0
108.0
2006 2007 2008 2009 2010 2011 2012 2013
0.0
2.0
4.0
6.0
8.0
10.0
DP REF GG HF UED ECO SL PS HR SEC FE EXT
104.0
106.0
108.0
110.0
112.0
114.0
116.0
2006 2007 2008 2009 2010 2011 2012 2013
0.0
2.0
4.0
6.0
8.0
10.0
DP REF GG HF UED ECO SL PS HR SEC FE EXT

oes state failure matter? Obviously it
matters mostly for the population of
that country, but even for its
neighbors, the answer is a
resounding yes. Chaos in a single country
can often impact an entire region.
In 2011, as measured in the 2012 FSI,
Tunisia and the wider “Arab Spring” were
the case in point. In 2012, Mali — the most
worsened state in the 2013 FSI — dragged
the Western Sahel into a vortex of
instability. Though neither Tunisia nor Mali
were among the countries most at risk as
measured by the FSI, when the social,
economic, political, and security pressures
spiked in those countries and the states
convulsed, it would eventually affect others
in the region. Underscoring the point, what
happened in Mali this year actually started
in Tunisia two years prior.
Since 2011, debates have raged about the
Arab Spring. Observers have sought to
identify root causes, proximate causes, and
triggers, positing various combinations of
factors like corruption, food prices, poverty,
median age, youth unemployment, and
social media. Countless pundits have
opined on the short, medium, and long
term implications: good, bad, or neutral for
democracy, human rights, or national and
regional stability – or more parochially, for
American national interests and security.
Such questions, of course, do not have
simple answers, except perhaps in hyper-
partisan discourse.
Though it is difficult to make definitive
pronouncements about what it all might
mean in the long-term, we can with some
degree of confidence describe what
happened. This is possible using holistic
analytical frameworks like CAST, upon which
the Failed States Index is based. For the FSI,
CAST triangulates data from pre-existing
data sets, qualitative review, and original
data generated through content analysis of
millions of media reports using search
strings and algorithms. Each of the three
methods has its strengths and weaknesses.
Content analysis is particularly strong in its
ability to track trends in dynamic indicators
at varying levels of spatial-temporal
granularity, a helpful feature when
attempting to analyze complex systems,
which underlie the pathology of state failure
in rapidly changing environments.
Drilling into the content analysis data, CAST
tells the story of a storm birthed in North
Africa, which had been brewing for some
time. In 2009, the international community
had not considered the potential impact of
massive protests and popular uprisings
sweeping across borders and governments
in North Africa. But the CAST indicators for
Group Grievance and Human Rights were
gradually and inexorably getting worse. In
November 2010, there was a dramatic
regional increase in the State Legitimacy
score (based on a regional average) that has
yet to come back down. A month later,
thousands took to the streets in Tunisia,
taking the world by surprise. This is not to
say that CAST could have predicted the Arab
Spring — but the trends were there to be
seen.
In 2011 and 2012, the storm twisted east
through the Arabian Peninsula and the
Levant, and south through the Western
Sahel region of Mali, Mauritania, and Niger,
taking on different forms and patterns
along the way. From the Sahel to the
Levant, the storm manifested itself variously
as popular, peaceful protest leading to
political reform (Morocco), peaceful
revolution (Egypt), violent revolution (Libya),
and protracted civil war (Syria).
Governments that tried to cling to the status
quo were fighting a losing battle. This storm
was too big to manage without reforms.
Patterns and Trends
Mapping the storm over time and space,
and the sequence of indicators as they
spiked in successive waves, both the long
term trends and sudden volatility indicated
the scope of the challenge. In Tunisia where
it all started, a group of CAST indicators
spiked in October of 2009, based on content
analysis of media reports at the time, when
then-President Ben Ali won a fifth term in
office in flawed elections. In November
2010, pressures began to spike again
dramatically a month before a man named
Mohamed Bouazizi set himself on fire and
ignited a revolution.
Anatomy of a Storm:
Regional Impacts of the Arab Spring
Nate Haken
Analysis of the Failed States Index 2013
21 The Fund for Peace www.fundforpeace.org

Along with Tunisia, State Legitimacy was
worsening in the fourth quarter of 2010 in
Libya and Egypt as well. Trailing the State
Legitimacy score by three months,
pressures on the Security Apparatus
manifested as security forces responded to
massive protests using varying degrees of
repressive force.
The storm then spun into Syria, which
lagged behind the North African countries
by about three months.
Turning South
Now, waves of instability have moved south
from North Africa to the Western Sahel
region. According to the UN Security
Council’s Group of Experts, weapons from
the 2011 civil war in Libya moved rapidly
throughout the region, particularly Chad,
Niger, and into Mali where January 2012
attacks in the North drove refugees into
Mauritania. In April-May 2012, rebels
declared independence in the northern part
of Mali, and refugees and fighters from Mali
crossed porous borders into neighboring
countries. Forces were drawn in from
abroad to fight on both sides, regionalizing
the impacts of the conflict.
Given this fact, it is perhaps not surprising
that as measured by content analysis, there
was an unmistakable echo of Mali’s
indicator scores in countries throughout the
region, particularly Niger, Mauritania, and
Burkina Faso where there was an increased
number of refugees and border disputes.
Even as far south as Nigeria, militants from
the Jama’atu Ahlus-Sunnah Lidda’Awati Wal
Jihad (known as Boko Haram) have
reportedly fled to Mali for training and safe
haven. As counterinsurgency escalates in
the northeastern part of Nigeria, refugees
are fleeing north into the neighboring
country Niger, where the United States has
begun setting up a base from which
unarmed Predator drones can conduct
surveillance over the Sahel region.
When states fail they don’t fall alone; they
pull neighbors into their wake. This is
nothing new; when the Berlin Wall fell in
1989, it was a “Spring” of sorts for
democracy but it did lead to paroxysms
across former Soviet bloc countries and
Yugoslavia as the balance of power was
suddenly upended, patronage dried up, and
populations were displaced. As the world
becomes increasingly interdependent,
promotion of sustainable human security
requires more collaboration at every level,
including those in the public, private, and
nongovernmental sectors. In a place like the
Sahel, drones and counterinsurgency will
not solve the longer-term challenges. The
long-term problems will not be solved from
the top down, particularly as the
international community wearies of state
building.
North Africa: Group Grievance & Human Rights Indicators North Africa: State Legitimacy Indicator
2.00
3.00
4.00
5.00
6.00
7.00
8.00
9.00
10.00
Group Grievance Human Rights3.00
4.00
5.00
6.00
7.00
8.00
9.00
10.00
State Legitimacy
North Africa vs. The Levant: State Legitimacy Indicator North Africa vs. The Levant: Security Apparatus Indicator
0.00
1.00
2.00
3.00
4.00
5.00
6.00
7.00
8.00
9.00
10.00
North Africa (Tunisa/Egypt/Libya) The Levant (Syria)4.00
5.00
6.00
7.00
8.00
9.00
10.00
N orth Africa (Tunisia/Egypt/Libya) The Levant (Syria)
Continued on page 26
22 The Fund for Peace www.fundforpeace.org
Anatomy of a Storm: Regional Impacts of the Arab Spring

or sustainable human security, state
building is the only endgame. Absent
the state, traditional mechanisms and
authority structures might indeed
manage communal issues, perhaps even
better than would the state. Trans-
communal issues like environmental
degradation, complex humanitarian
emergencies, and large scale conflict,
however, go beyond the jurisdiction and
capacity of such entities. Building a
legitimate, professional, and representative
state, therefore, is the only way to address
the problems of the modern,
interconnected world. This process is
inherent ly messy , however, as
demonstrated in the case of the world’s
newest state, South Sudan, number four on
this year’s Failed States Index.
We must be clear-eyed about what state
building means. New states bring with them
many things, and foremost is often
unrealistic expectations. A state is not an
exogenous entity dropped in from above to
solve the problems down below. A polarized
society gives rise to a polarized state.
Institutions can be co-opted and power
abused, especially in the early years as
militias are subsumed into the public
security forces and warlords are appointed
or elected into positions of national
leadership.
When South Sudan finally gained
independence in July of 2011, it had come at
a huge cost. Between 1983 and 2005, over
two million people died in a war that for
decades seemed to have no end. A popular
narrative of the war spread in capitals
around the world describing the conflict as
one of a Christian South suppressed and
plundered by a Muslim North. This narrative
represents a portion of the truth. A small
group of Northerners did control,
marginalize and wage war against a group
of mainly Southerners. But it did not reflect
the full reality of the conflict and history of
the country.
In addition to the hundreds of thousands of
displaced persons, destroyed property and
infrastructure, and near total economic
devastation in the South, there were deeply
ingrained cleavages throughout society
exacerbated by years of fighting. Along with
the well-defined fault lines between rival
armies and militias and the political
leadership of the “two Sudans,” groups
divided further along tribal and religious
lines as well as over issues such as land,
political control and the economic
opportunities created by the conflict.
Nevertheless the “North bad/South good”
perception helped spur action to end the
conflict and push for implementation of the
Comprehensive Peace Agreement in January
2005 which resulted in the Republic of
South Sudan.
Following the heady days of independence,
ceremonies and gestures of goodwill
buffered the new country for some time.
Development projects and money flooded
into the country to repair the damage of
decades of war. Focus shifted to supporting
the new government, nominally made up of
the “good guys,” to expand their reach and
create a sustainable state, from building
police posts to large scale agricultural
schemes. However, not even six months
after the country was born, violence flared
again internally, most notably in Jonglei
state where ethnic groups pitted against
each other in a conflict that has its roots in
history but was raised to a new level with
the easy availability of small arms and the
heightened stakes of independence. A
disarmament campaign, launched by the
government and logistically supported by
the United Nations Mission in South Sudan
(UNMISS), aimed to curb the violence but
only exacerbated tensions as it initially
targeted a minority group, the Murle, and
reports of abuses by the security forces
during the exercise abounded. Nearly a year
and a half after the campaign was launched,
the conflict and its effects continue. In
November 2012, a Médecins Sans
Frontières (MSF) report accused the
government of hindering relief efforts for
internally displaced people in the state by
refusing to grant permission for their staff
to travel to those areas. Statements and
reports over the disarmament abuses,
continued fighting between the South
Sudanese military (SPLA) and rebel groups,
threats to civilians, and challenges to
providing emergency aid have trickled out
mainly from civil society and NGOs but
there has been a surprising lack of noise
from international governments and the UN
The Dark Side of State Building:
South Sudan
Nate Haken and Patricia Taft
Analysis of the Failed States Index 2013
23 The Fund for Peace www.fundforpeace.org

about the ongoing violence.
At best, the government can do little to stop
the violence and accompanying
humanitarian crises. At worst, whispers
echo that the violence in Jonglei and
elsewhere like Warrap and Upper Nile is
being spurred on by politicians and power
brokers who are interested in land, money,
and revenge. The government most often
points the blame at Khartoum, which was in
fact found complicit in providing assistance
to South Sudanese rebels. There was never
much consideration given, however, to the
idea that there are also legitimate
grievances and deep internal divisions
underlying the conflict that have nothing to
do with Khartoum. The usual answer to
outbreaks of conflict in South Sudan has
been heavy SPLA crackdowns sometimes
accompanied by one-off peace conferences
that leave behind a trail of unfulfilled
recommendations for development,
infrastructure, political representation, and
security.
Compounding the outbreak of fighting and
humanitarian emergencies that gripped the
country throughout 2012, the new
government in Juba struggled to reconcile
its former rebel roots with its newfound
responsibilities to lead a democratic and
developing country. Media freedom was
increasingly curtailed in 2012. The killing of
a well-known commentator and journalist in
December, the arbitrary arrest, beatings,
and detention of members of the press, and
the failure of the government to enact
media laws were all strongly condemned
internationally, leading the country to rank
124 of 180 on the 2013 World Press
Freedom Index by Reporters without
Borders. The South Sudan National Security
Services, a security apparatus whose
functions and mandate have never been
clearly defined by law, was repeatedly cited
as carrying out attacks on journalists,
including harassment and illegal detention.
This fueled speculation that the new
government routinely engages such
praetorian forces to deal with dissent rather
than go through official state-sanctioned
channels, perhaps a hangover from its early
days as a guerrilla movement. In addition,
international organizations have begun to
confront a familiar problem as some
international aid workers are forced, for
seemingly political reasons, to leave the
country with little public resistance or outcry
from their agencies or other international
observers.
South Sudan may have lots of window
dressing but as of yet none of the actual
underpinnings of viable statehood. While
shiny 4x4 vehicles, hotels, new banks and
stores are popping up in the capital of Juba,
outside there is the near complete absence
of development or infrastructure. The new
government, reliant for 90% of its revenue
from oil, was nearly bankrupt by the end of
the year because months of disputes with
Khartoum had led Juba to turn off the pump
in January of 2012. A mid-year attempt by
the government to begin collecting taxes
was also met with widespread reluctance
amid reports that government officials had
“misplaced” and “stolen” nearly US$4 billion.
Officials urged citizens not to worry as
international donors would fill the budget
shortfalls further fueling speculation that
not only did the new government lack the
necessary skills to run a state absent
international assistance, it also had little
incentive to try. The U.S. government
obliged with an international conference in
April 2013 aimed at increasing investment
and development funding for the fledgling
state. Only time will tell if this actually
translates into something meaningful.
Throughout 2012, the “good” guys of South
Sudan were suddenly not looking so great.
This should not be surprising. Experiences
from southeastern Europe in the late
nineties and early 2000s and our
experiments in state building in Afghanistan
and Iraq have repeatedly shown that
imposing a state structure, democratic or
otherwise, on top of a country or territory
that has been in a constant state of warfare
for decades is bound to be chaotic. For
those who cared to look behind the
narrative, the signs that all was not well in
South Sudan were there years before the
referendum on independence. We must
again acknowledge that state building is not
a technical exercise but an inherently
political process that brings inevitable
tensions between the extension and
empowerment of state authority and
accountability and the upholding of human
rights. In the case of South Sudan, the
recognition that this tension exists and
tradeoffs have been made by those in
South Sudan: Political and Military Indicators
4.00
5.00
6.00
7.00
8.00
9.00
10.00
South Sudan: Social Indicators
SEC
FE
SL
HR
6.00
6.50
7.00
7.50
8.00
8.50
9.00
9.50
10.00
REF
GG
DP
24 The Fund for Peace www.fundforpeace.org
The Dark Side of State Building: South Sudan
Continued on page 28
Aggregate
Monthly trends as measured by content analysis only. Monthly trends as measured by content analysis only.

omalia has been what many would
describe as the quintessential “failed
state” since the inception of the
Failed States Index (FSI). Struggling
with an occasionally unforgiving semi-arid
topography in much of the North,
widespread poverty as a result of tight
competition for few resources, and mired by
high levels of insecurity, an inchoate
political system, and a disjointed
sovereignty, Somalia has performed poorly
in virtually every indicator measured on this
and other global indices.
Somalia today represents a hollow shell of
the state it was prior to the collapse of its
government in 1991. Although the
international community still recognizes
Somalia as an integral nation, much of the
North is beyond the governance of
Mogadishu — the de facto independent
Somaliland and neighboring Puntland make
up a substantial chunk of the country’s
territory. Today, an ailing post-transitional
government headed by President Hassan
Sheikh Mohamud continues to make strides
to unite the autonomous northern regions
and return Somalia to the peace and unity it
once enjoyed. Because of these and other
state pressures, it may come as little
surprise that Somalia is once again at the
top of the FSI for the sixth year in a row.
Overall trends seen in the last five years of
the FSI underline many of Somalia’s
destabilizing factors, though small
improvements have been more plentiful
than expected. Despite some gains in the
2011 FSI, last year saw the worsening again
of many indicators as security and
development declined and insurgency,
crime, and lawlessness increased, even as al
-Shabaab’s insurgency was largely quelled
around the capital city. Somalia’s 2012 FSI
score was actually the highest ever seen in
the history of the FSI.
Notwithstanding, the 2013 FSI — which
included the numerous advancements and
improvements in security won in 2012 —
sees Somalia improving in six indicators and
actually earning its lowest score ever. The
Security Apparatus and State Legitimacy
indicators improved due to gains against al-
Shabaab and a marked decrease in
maritime piracy. The near-unanimous
passing of a new Provisional Constitution,
the inauguration of the Federal Parliament
of Somalia, and a peaceful democratic
pres ident ia l e lect ion have a lso
demonstrated that a confident government
could make strides even in uncertain times.
Additionally, the Group Grievance score also
improved, likely due to a decrease in
discrimination and violence against religious
and ethnic groups targeted by al-Shabaab.
Somalia’s informal economic networks have
burgeoned in spite of poor security
conditions and have hardened to these
conditions over the years. Furthermore,
although a worsening in the Human Flight
indicator may mean lower numbers of
skilled or educated individuals choosing to
remain in Somalia, this outflow of talent has
been partially offset by remittances sent
from abroad that have in turn helped to
keep Somalia’s economy afloat.
Somalia’s food security conditions also
improved marginally in 2012, decreasing its
Demographic Pressures score. The
improvement is in part due to the rainy
season in the Fall of 2012, which raised crop
output and helped end Somalia’s 2011
famine; likewise, distribution of emergency
food aid was better facilitated by stronger
security around distribution sites. The
situation in Somalia, however, remains far
from stable. Indeed, though the rains were
welcome to the success of crops, they also
caused substantial damage and displaced
over 20,000 people, thus impacting the
Refugees and IDPs score to the highest it
can possibly get on the FSI.
Somalia’s long-standing lack of any widely
accepted central authority, combined with
the existence of numerous disparate
informal political institutions, particularly
rural clans, lend to Somalia’s abysmally high
Human Rights and Factionalized Elites
scores. All in all, Somalia’s improvements on
the FSI 2013 reflect a rise in government
confidence, a slight movement towards
increased economic activity, and a
somewhat stronger security apparatus,
though still small enough to get lost in
Somalia’s multitude of other stresses.
Yet, what has persisted in making Somalia
The Recovery of Somalia:
Check Back With Us Again Next Year
Felipe Umaña
Analysis of the Failed States Index 2013
25 The Fund for Peace www.fundforpeace.org

the epitome of what some regard as a
“failed state”? For one, the manner in which
the international community and President
Mohamud’s government have window-
dressed the country’s myriad of issues is
problematic. The international community,
for instance, has focused its assistance on
sectors like humanitarian aid, health and
sanitation, meaning aid has been funneled
more towards the symptoms rather than
the existing structures that encapsulate
these very problems. Without the explicit
targeting of Somalia’s existing economic,
political, and social institutions, it is likely
that Somalia will be unable to escape its
ailments. This is critical as international
actors must help Somalia develop and grow
by allowing their existing institutions to bear
the weight of reconstruction.
Moreover, by ignoring the peripheral
informal institutions — rural tribes and
clans, who usually view the central
government with distrust — and focusing
only on top-down forms of assistance,
international donors risk alienating those in
clan-aligned areas. The absence of a strong
central government since 1991 has allowed
for the development of informal, but
stalwart, civil, religious, and customary
structures in rural regions, which have the
necessary authority to organize local
Somalis. If both informal and formal
institutions are not reconciled, in what
President Mohamud called “a very delicate
balance,” the crab-in-the-bucket mentality
could prevail. This could pit clans and the
federal government against each other and
any progress towards greater unity could be
lost.
Lastly, many viewed the London Conference
on Somalia this past May as a diplomatic
event dealing mainly with the symptoms in
Somalia, not the more intractable, sensitive
issues. Critics complained that the
international community has no consensus
on Somaliland vis-à-vis Somalia, for
instance, and have sent mixed messages to
both governments, excluding one from
deliberations with the other. Others see
Somalia’s government as ignoring reality,
and still, many view the international
community as blind to the actual nuts and
bolts on the ground. Though international
forums like these could prove useful in
many ways, they must move away from
obscuring the country’s pressures.
Instead of disguising Somalia’s problems,
the international community should
practice smart development. In by-passing
typically corrupt aid-delivery structures,
governments and private companies can
work together and improve conditions on
the ground. The international community
can also move towards developing regions
outside of Mogadishu, which has been the
focal point for most assistance. Though this
might be limited to areas not under
insurgent control, parts of Puntland and the
central state of Galmudug, as well as others,
could benefit from increased international
attention.
One of Somalia’s greatest problems has
been the absence of a widely accepted
political authority capable of bringing
together Somalis under a common set of
goals. Although President Mohamud’s
administration has made some strides in
the political arena, much more needs to be
done to remove Somalia’s “failed state”
moniker and help the country rebuild. This
is critical not only on a moral ground, but
also for global security. Somalia’s
widespread lawlessness over the last
decade has made the country a hotbed for
jihadists and rampant criminality. Though
efforts to stifle these threats on both land
and sea have improved security conditions,
for the most part, these and other issues
stand to continue to threaten the stability of
the country, Africa, and the international
community as a whole. Tackling these crises
will undoubtedly involve substantial costs
for global actors. If they are not dealt with
promptly and effectively, however, Somalia
and the world will face greater costs in the
future.
26 The Fund for Peace www.fundforpeace.org
The Recovery of Somalia: Check Back With Us Again Next Year
Felipe Umaña is a Research Assistant at The Fund for Peace.
Short term security and humanitarian
emergencies can perhaps be addressed on
an ad hoc basis at mounting cost as the
world pivots from crisis to crisis. But for
better or worse, state building is the only
solution in the end, which is why holistic
frameworks and dynamic data analysis of
risk factors at the regional, national, and
local levels are critical. The process of data
gathering and analysis must be owned, with
the support of the international community,
by local civil society so that they can actively
use the information to promote
reconciliation, improved governance,
increased public services, and infrastructure
development. Effective collaboration
requires shared information on compatible
platforms so that data can be meaningfully
integrated, cross-validated, and analyzed.
More important than good data and
analysis, is the application of that
information by a broad group of
stakeholders, from local to international
and from public to private, to use it in a
collaborative way for building practical and
sustainable conflict mitigation and peace
building strategies.
Continued from page 22
Anatomy of a Storm: Regional Impacts of the Arab Spring
Nate Haken is Director of Conflict Early Warning & Assessment at The Fund for Peace and is also Co-Director of The Failed States Index.

he top several tiers of the annual
Failed States Index (FSI) are often
occupied not only by weak and
fractured states at risk for conflict,
but also states that have, over the years,
been the proverbial thorns in the side of the
international community. Each year these
chart toppers, often impervious by either
choice or circumstance to reform, test the
mettle of world leaders tasked with coming
up with strategies for dealing with their
dangerous behavior. Once we recognize
that states — such as those near the top of
the FSI — are a threat to the international
system, what is the appropriate strategy for
dealing with them? For 2012, that strategy
can be summed up as the year of red line
diplomacy.
The two most notorious recipients of red
line diplomacy in 2012 were Iran and Syria,
both around the development or
deployment of weapons of mass
destruction (WMD). In both cases, the
United States and Israel issued what
appeared to be stark ultimatums to each
country that once certain red lines were
crossed, harsh retaliatory action would be
taken. The problem, in both cases, was that
neither Israel nor the U.S. seemed to be on
the same page as to what constituted a red
line and, if indeed crossed, what specific
actions would be taken.
Other states on the Index have also, at
various times, been subjected to rhetoric
that, if not specifically invoking the term
“red line,” was similarly ominous. North
Korea, Pakistan, and China have been duly
warned for wide-ranging transgressions
from unfair trade practices to harboring
designated terrorist networks. However, as
pointed out by Rosa Brooks in a May 2, 2013
article on Foreign Policy’s online National
Security series, in addition to red line
diplomacy, the usage of such terms as
“intolerable” and “unacceptable” have been
increasingly employed by political leaders to
indicate that if a state does not cease and
desist in specific actions and policies, an
uncertain and potentially hostile fate awaits.
In embracing terminology meant to
intimidate and isolate, the range of options
available in dealing with rogue or fractured
states also becomes increasingly narrow.
As further pointed out by Brooks, when we
treat fractured and fragile states and their
leaders like misbehaving brats, we greatly
limit our range of available diplomatic, non-
lethal options. Red line diplomacy has made
for a confusing and potentially dangerous
game of political brinkmanship when
dealing with rogue, fracturing and fragile
states.
One of the lessons from recent red line
diplomacy in Iran and Syria to our eight-year
involvement in Iraq is to not define the
nature of states solely through the
personalities that represent them. In
dealing with weak and failing states held
together by strong men, we are calling into
question the actions of the individual and
not the state. A leader’s bellicosity or
intransigence, such as in Iran and Syria,
often provoke knee-jerk reactions of the “or
else” variety. When the threat or action we
are trying to prevent or stop is coming from
an individual and not the state, red-line
diplomacy may not only leave us
backtracking, as demonstrated by the
recent kerfuffle over Syria’s possible use of
chemical weapons, but may serve to further
encourage the very behavior we are trying
to prevent.
Whether red line diplomacy works depends
on the context, of course, and also the very
changing nature of fragile states.
Yesterday’s pariah can be today’s
rebounder, such as Myanmar, the state
everyone loved to hate only a couple of
years ago. Many would argue, however, that
the rehabilitation of Myanmar was not the
result of years of isolation and hectoring but
rather of a quiet and gradual effort at
multisectoral statebuilding. Many, including
Israeli Prime Minister Benjamin Netanyahu,
have argued that red lines were successful
during the Cold War nuclear arms race as
the ultimate deterrent, citing the Cuban
missile crisis and Moscow’s ultimate
withdrawal of its missiles. Many others
would be quick to question, however,
whether successful red line diplomacy
should be celebrated at the knife’s edge of a
nuclear Armageddon. States and their
leaders can also be vilified, rehabilitated,
and then vilified again, permanently, as
Colonel Qaddafi would most certainly attest
The Year of Red-Line Diplomacy
Patricia Taft
Analysis of the Failed States Index 2013
27 The Fund for Peace www.fundforpeace.org

— if he could. In Libya’s case, red line
diplomacy might be said to have worked
because the threat was eventually followed
by action. At the same time, however, it did
create unrealistic expectations on how
other international bullies might be dealt
with in the future. And, of course, there is
the perennial favorite, the Hermit Kingdom,
where the opacity of the state and the
dangerous eccentricities of the leadership
combine to create one of the world’s most
vexing foreign policy challenges. Multiple
lines have been drawn in the sand for North
Korea over the years, sometimes leading to
negotiations and other times leading to yet
more saber-rattling and dangerous nuclear
one-upmanship. Overall, however, North
Korea appears impervious to such
ultimatums, and perhaps for good reason.
Red line diplomacy is rife with uncertainties
that are difficult to manage once unleashed.
One man’s red line is another man’s red
cape, particularly when bullying states and
their leadership have few friends but large
arsenals. Plus, as in the case of the
American and Israeli red lines over Tehran’s
nuclear weapons program, red lines can
shift over time and for different purposes,
creating confusion that can possibly lead to
further entrenchment. If a red line is being
used as a deterrent, as one assumes in the
case of Iran, then continuously moving the
red line can make it an ineffective tool.
Similarly, regarding Syria, President
Obama’s threshold of “a whole bunch of
chemical weapons” is extremely difficult to
quantify and qualify, leading to further
confusion and dithering.
Furthermore, as pointed out by Paul Pillar, a
former career CIA analyst and current
Georgetown University professor, red lines
can serve to relieve domestic pressure to
act, such as in the insistence from Congress
that President Obama take a harsher stance
on both Iran and Syria. However, as Pillar
was quoted in a May 2013 National Journal
article, “Now that Syria seems to have
crossed [Obama’s] red line, we’re seeing
that such short-term diplomacy of the
moment carries long-term risks.”
In the case of Iran and North Korea,
multiple and contradictory red lines can
lead to leaders walking up to the threshold,
or even crossing it, purposely or
inadvertently. A red line meant for domestic
consumption can become a taunt on the
international stage, and sometimes it may
be accepted. The risks can include very real
human costs, like the 80,000 and counting
lives lost in Syria as red lines have been set,
reached, and crossed. Moreover, as Syria
continues to fracture, it risks becoming like
the Yugoslavia of the 1990s, where
Slobodan Milosevic called our “boy who
cried wolf” bluff and an entire region was
ultimately sucked into conflict before
decisive action was finally taken years, and
tens of thousands of deaths, later.
It seems that only time will tell in the cases
of Iran, Syria and North Korea how red line
diplomacy will fare. To be certain, while red
line diplomacy became the rage in 2012, it
may ultimately be determined that it carries
far too many risks with too few benefits and
at too high of a cost in dealing with weak
and failing states.
The Year of Red-Line Diplomacy
“At this late hour, there is only one way to peacefully prevent
Iran from getting atomic bombs. That’s by placing a clear red
line on Iran’s nuclear weapons program”
Israeli Prime Minister Benjamin Netanyahu at United Nations General
Assembly (October 2012)
“We have been very clear to the Assad regime, but also to
other players on the ground, that a red line for us is [if] we
start seeing a whole bunch of chemical weapons moving
around or being utilized.”
President Barack Obama, Impromptu Press Conference (August 2012)
28 The Fund for Peace www.fundforpeace.org
power seems to have come belatedly or
simply remains behind closed doors. The
first step is not to ignore or paper over
these problems in the name of “keeping it
together” but to deal with them honestly
and fully in order to avoid compounding
existing grievances and divisions that will
continue the cycle of violence and
marginalization.
South Sudan has a long road ahead of it to
create a democratic and prosperous nation,
and it will undoubtedly take time and the
efforts of many. Nobody understands this
better than the average South Sudanese
who deal everyday with the contradictions
of living in a state born to be free and
peaceful but who are currently insecure and
restricted. Those who have pledged to help
these citizens achieve what South Sudan
was meant to be should confront the
realities they experience and not the
narratives or politics others create.
Continued from page 24
The Dark Side of State Building: South Sudan
Patricia Taft is Director of Transnational Threats at The Fund for Peace.
Nate Haken is Director of Conflict Early Warning & Analysis at The Fund for Peace and is also Co-Director of The Failed States Index.
Patricia Taft is Director of Transnational Threats at The Fund for Peace.
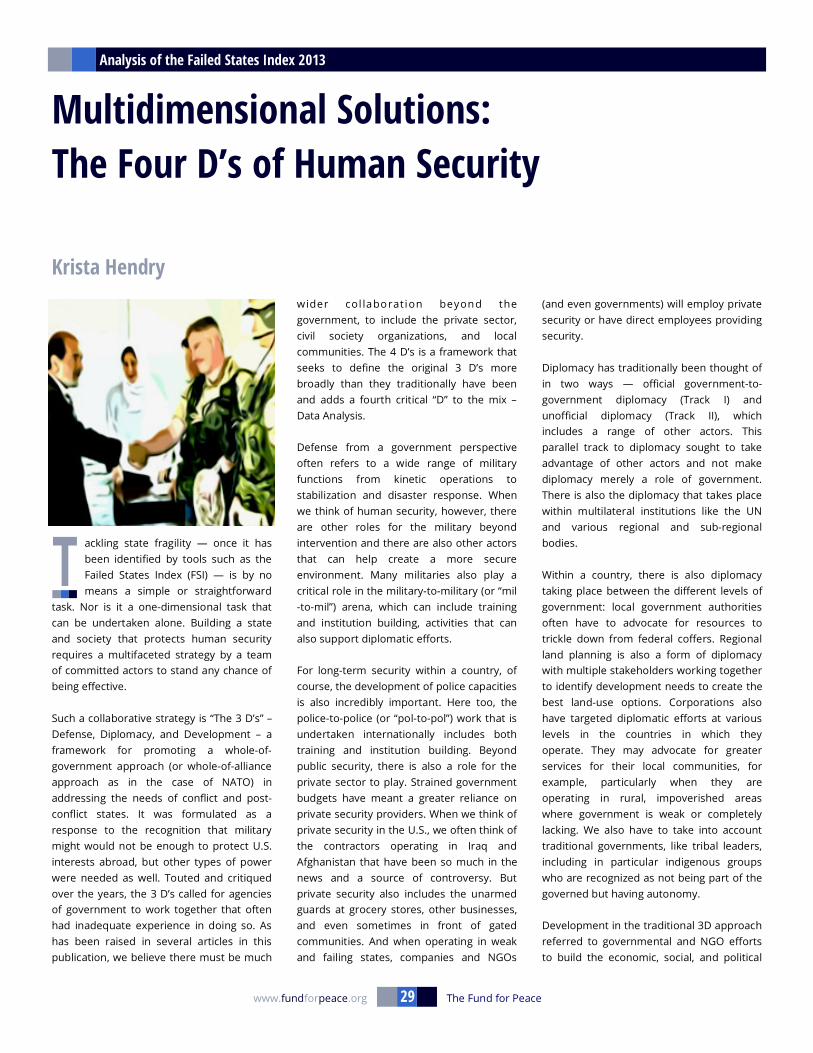
ackling state fragility — once it has
been identified by tools such as the
Failed States Index (FSI) — is by no
means a simple or straightforward
task. Nor is it a one-dimensional task that
can be undertaken alone. Building a state
and society that protects human security
requires a multifaceted strategy by a team
of committed actors to stand any chance of
being effective.
Such a collaborative strategy is “The 3 D’s” –
Defense, Diplomacy, and Development – a
framework for promoting a whole-of-
government approach (or whole-of-alliance
approach as in the case of NATO) in
addressing the needs of conflict and post-
conflict states. It was formulated as a
response to the recognition that military
might would not be enough to protect U.S.
interests abroad, but other types of power
were needed as well. Touted and critiqued
over the years, the 3 D’s called for agencies
of government to work together that often
had inadequate experience in doing so. As
has been raised in several articles in this
publication, we believe there must be much
wider col laboration beyond the
government, to include the private sector,
civil society organizations, and local
communities. The 4 D’s is a framework that
seeks to define the original 3 D’s more
broadly than they traditionally have been
and adds a fourth critical “D” to the mix –
Data Analysis.
Defense from a government perspective
often refers to a wide range of military
functions from kinetic operations to
stabilization and disaster response. When
we think of human security, however, there
are other roles for the military beyond
intervention and there are also other actors
that can help create a more secure
environment. Many militaries also play a
critical role in the military-to-military (or “mil
-to-mil”) arena, which can include training
and institution building, activities that can
also support diplomatic efforts.
For long-term security within a country, of
course, the development of police capacities
is also incredibly important. Here too, the
police-to-police (or “pol-to-pol”) work that is
undertaken internationally includes both
training and institution building. Beyond
public security, there is also a role for the
private sector to play. Strained government
budgets have meant a greater reliance on
private security providers. When we think of
private security in the U.S., we often think of
the contractors operating in Iraq and
Afghanistan that have been so much in the
news and a source of controversy. But
private security also includes the unarmed
guards at grocery stores, other businesses,
and even sometimes in front of gated
communities. And when operating in weak
and failing states, companies and NGOs
(and even governments) will employ private
security or have direct employees providing
security.
Diplomacy has traditionally been thought of
in two ways — official government-to-
government diplomacy (Track I) and
unofficial diplomacy (Track II), which
includes a range of other actors. This
parallel track to diplomacy sought to take
advantage of other actors and not make
diplomacy merely a role of government.
There is also the diplomacy that takes place
within multilateral institutions like the UN
and various regional and sub-regional
bodies.
Within a country, there is also diplomacy
taking place between the different levels of
government: local government authorities
often have to advocate for resources to
trickle down from federal coffers. Regional
land planning is also a form of diplomacy
with multiple stakeholders working together
to identify development needs to create the
best land-use options. Corporations also
have targeted diplomatic efforts at various
levels in the countries in which they
operate. They may advocate for greater
services for their local communities, for
example, particularly when they are
operating in rural, impoverished areas
where government is weak or completely
lacking. We also have to take into account
traditional governments, like tribal leaders,
including in particular indigenous groups
who are recognized as not being part of the
governed but having autonomy.
Development in the traditional 3D approach
referred to governmental and NGO efforts
to build the economic, social, and political
Multidimensional Solutions:
The Four D’s of Human Security
Krista Hendry
Analysis of the Failed States Index 2013
29 The Fund for Peace www.fundforpeace.org

foundations of stable communities and
societies. The expectation was that if there
was basic security and enough
development, the private sector would
make investments in the form of foreign
direct investment. Local markets, supported
also by efforts of governments and NGOs to
build capacity and access to capital to local
entrepreneurs, would then begin to grow.
Here too the private sector is an actor that
should be considered as crucial in the
defining of development. Increasingly, we
are seeing that foreign companies,
desperate to reduce their costs and
increase their positive impact by being able
to source more locally, also develop and
resource projects focused on increasing
entrepreneurship and access to capital.
Development often took a “if we build it,
they will come” approach, sometimes failing
to ask the private sector directly what their
priorities were so they could be calculated
earlier into development plans.
The fourth D – Data Analysis – has always
been there. The analysis of data drives our
decision making in all three categories and
every sector uses it. As with the other D’s,
we need to make investments in data
analysis to improve human security and
assess whether we have all the right tools in
our toolbox and how those tools are
working. For this reason, we believe it
deserves its own category. Before data can
be analyzed, of course, it must be gathered.
In each sector, an amazing amount of time
and resources are spent gathering data
when it exists and generating it when it
does not. And this data comes from a vast
spectrum of sources and levels. The highest
would be satellite imagery and the data that
can be generated from analysis of that
imagery. Coming down a bit one can also
gather aerial imagery. Back on earth, we
have indices, like the FSI and many others
that have taken vast amounts of data and
sought to create new data through the
selection and integration of specific data
sets. Then there is quantitative data – i.e.
statistics. This data, though sometimes old
or unreliable, provides not only an
important snapshot about an environment
but the trends in the statistical data also
become a new set of data. Added to this
myriad of data are surveys, expert opinion
polls, media content, and data gathered
from local community-based organization,
as FFP does with its UNLocK program in
Liberia and Nigeria. This data may be
collected through local workshops or,
following training, via SMS or Internet when
it is available.
Obviously, this fourth D is cross-cutting,
because everyone needs it and everyone
generates it. We would argue, however, that
all of the D’s are crosscutting in a sense.
Just as diplomacy is a set of tools used by
any sector, development is also a tool again
used by all sectors. For example, when a
military helps another country develop its
security-related institutions through training
and other capacity-building exercises, it is
doing both institution building and
diplomacy – clearly a focus of development
and political settlements. This broad view of
the 4D’s, with the recommendation that
they be viewed as toolboxes, not silos of
actors, is being presented so that we can, as
a community, review what tools we have,
how we are using them, and whether they
are working.
Are the right actors using the right tools in
the rights ways to address the wrongs in
this world? We believe there are
opportunities being lost because actors
have a narrow view of where they fit, and
what tools they can utilize, in the
community seeking to address the
challenges. As the FSI demonstrates, we
cannot afford to miss any opportunity to
create greater human security. In adding
another dimension to the traditional 3D’s,
we hope to help broaden and deepen the
ways in which data and cross-cutting
analysis can enhance our abilities to build
stable and secure states that give back to
their citizens.
Multidimensional: The Four D’s of Human Security
DEFENSE DIPLOMACY DEVELOPMENT DATA ANALYSIS
Military Intervention Multilateral Institutions Foreign Aid Satellite Imagery
Mil-to-Mil Training State-to-State Local Capacity Building Aerial Imagery
Military Institution Bldg Federal Capacity Building Entrepreneurship Building Indices
Pol-to-Pol Training Fed-to-Local Access to Capital Expert Opinion
Police Institution Bldg Local Gov’t Capacity Building Access to Market Media
Private Security Companies Corporate Government Affairs Local Supply Chain Development Statistics & Surveys
Security Personnel Community Org. Development Foreign Direct Assistance Local Citizen reports
D a t a i n t e g r a t i o n p l a t f o r m s
The Four D’s of Human Security
30 The Fund for Peace www.fundforpeace.org
Krista Hendry is Executive Director of The Fund for Peace.

n the 2013 Failed States Index (FSI),
we call attention to the linkages
between the underlying causes of
state fragility. Essentially, no state is
an island, and pressures in one state, no
matter how seemingly isolated, often lead
to wider destabilization. The pressures that
can underlay and lead to conflict are
normally a combination of economic, social,
environmental, and political factors that can
reinforce each other, pushing countries or
communities into greater instability if not
addressed. Sometimes addressing or
relieving one pressure, however, can
actually intensify another, necessitating a
much better understanding of how we can
develop programs to support reducing
some pressures while not exacerbating
others. We also must better understand
both the local context in which state fragility
occurs as well as local abilities to manage
potential conflict drivers if we are to work to
increase those capacities rather than relying
on external support indefinitely.
With our increasingly connected world,
issues such as slavery, genocide, child labor,
and poverty spill over borders in the form of
people, weapons, and conflict. Only by
working in collaboration, across sectors and
issues, but also locally and internationally,
do we stand a chance to drive the real
change needed to reduce the major global
challenges highlighted in the FSI. In
particular, the need for multisectoral
collaboration is being increasingly
recognized. For too long, we have worked in
silos – stove piped into various sectors and
areas of expertise. In recognition of the
interrelatedness of the issues that drive
state fragility, we must take a holistic
approach both to understanding the
challenges and in developing programs to
increase human security. Furthermore,
beyond working across sectors at the
international level, if we do not also figure
out how to better collaborate and integrate
local knowledge and ownership, we will
constantly be chasing our tail, and human
beings will suffer for it.
In the last ten years, there has been a
dramatic increase in initiatives known as
‘MSIs’ (multistakeholder initiatives or
multisectoral initiatives). Experience has
repeatedly shown that it takes the
combined efforts of companies,
governments and civil society to actually
implement programs on the ground to
address complex challenges, develop good
practices and programs, and make an
impact where it matters most — with the
people most impacted by the symptoms of
state weakness.
With today’s financial constraints on aid and
development projects, we have to get
increasingly smarter about how we find and
use resources. The private sector is a
powerful actor but was previously an
afterthought in development projects and
rarely included in programs designed to
address what were seen as “social issues.”
They have often been an afterthought in
initial state building. While their money was
welcome, their expertise was underutilized.
If actors in the private sector see a business
case for committing to multistakeholder
initiatives and supporting programs to
address challenges, they can be an
important contributor — not just of financial
resources but of expertise and new
perspectives.
One MSI that has made change at local
levels and improved conditions is the
Voluntary Principles on Security & Human
Rights (VPs). The VPs is an initiative that
began in 2000 by companies, their home
governments, and non-governmental
organizations, including The Fund for Peace.
Initially the group drew up a set of broad
principles for ensuring that companies have
the policies and procedures in place to
prevent human rights-related security
incidences. It then created a forum to meet
annually to discuss how the three pillars, as
they became known, would collaborate to
implement the principles to which they had
agreed.
The first change that the VPs contributed to
was one of mindset. The oil and mining
companies that had come together to
create the VPs had traditionally seen
security as an issue of protecting the
company from potential threats from the
community. With the creation of the VPs,
they were signaling a change to industry,
which has since been adopted much more
widely, that security was for the company
No State is an Island:
The Importance of a Multisectoral Approach
Krista Hendry
Analysis of the Failed States Index 2013
31 The Fund for Peace www.fundforpeace.org

and the community. They also previously
saw a risk as something to prevent by
deterring access. They now were assessing
risks by seeking to understand the stresses
on the communities and encourage
programs that would seek to reduce those
stresses as a means of reducing the security
risk. Today, companies consider the social
and economic situation of the communities
in and around their operations as this may
increase the potential risk of a security
incident. Working more closely with
community relations and others, security
managers are seeking to understand where
the risks lie and what can be done, beyond
protection and prevention of access, to
increase security by reducing tensions that
may exist with or within the local
communities. This mindset change has
created a direct benefit to the communities,
as livelihoods and human rights programs
are developed in collaboration with local
government, companies, NGOs, and the
communities themselves.
The VPs are only one example of an MSI.
MSIs exist to cover a range of issues —
environmental, human rights, human
security, economic development — the list
goes on. They exist across a range of
industries. There are some commonalities
amongst them all but, first and foremost,
they are all about compromise. Of the many
challenges in collaboration, learning how to
compromise while still ensuring the value of
bringing different perspectives and
expertise around the table is not easy. As
the VPs demonstrate, however, that
compromise has real value to our ability to
learn how to make a difference in
communities suffering from the pressures
we highlight on the FSI.
The most basic requirement for
collaboration is mutual respect and trust.
This takes time to develop and often starts
with the individuals and then needs to be
institutionalized. A very basic and major
challenge to building that trust is
communication. The same term can mean
very different things to different people. We
also think in different time periods — some
are focused on short-term symptom
alleviation while others are focused on long-
term solutions. The term “sustainability” is a
great example. For a company, it most likely
means that a challenge has been solved in a
way that can continue without the
additional need for charity. For an NGO, a
program may be sustainable when they
perceive an ongoing revenue stream to
continue delivering services, whether that
revenue stream is philanthropic or not.
Taking the time to understand what we are
saying when we use terms like sustainability
is critical to the success of any collaboration.
Otherwise, we all may think we are on the
same path, but when we get to the
destination, we may find ourselves in either
different places or lost altogether.
For addressing the myriad challenges
highlighted in the FSI that negatively impact
human security, it will take many more
initiatives at various levels — international,
national and local. While most of the work
does need to be done at the local level,
where the people are suffering and the
underlying conditions need to be resolved
with local ownership of the solution,
international MSIs do provide important
platforms for pooling resources and
expertise, creating better understanding of
how different efforts can work together, and
ensuring cross-sectoral learning and
information sharing. Together we are
smarter and can be more efficient, and to
cure some of the suffering, that’s exactly
what we need to be.
No State is an Island: The Importance of a Multisectoral Approach
32 The Fund for Peace www.fundforpeace.org
Krista Hendry is Executive Director of The Fund for Peace.

Best Performers
=177th Iceland 1.0
Sweden 1.0
175th Finland 1.4
174th Ireland 1.6
173rd Portugal 2.3
Worst Performers
=1st
Iraq 10.0
South Sudan 10.0
Sudan 10.0
Nigeria 9.8
Israel 9.8
=4th
When tension and violence exists between groups, the state’s ability to provide
security is undermined and fear and further violence may ensue.
Group Grievance
Best Performers
178th United States 1.0
177th Australia 1.1
=175th Austria 1.6
Norway 1.6
Sweden 1.7
173rd
Worst Performers
1st Haiti 9.1
2nd Somalia 8.9
3rd Samoa 8.8
4th Zimbabwe 8.6
Grenada 8.5
Guyana 8.5 =5th
When there is little opportunity, people migrate, leaving a vacuum of human
capital. Those with resources also often leave before, or just as, conflict erupts.
Brain Drain and Human Flight
Best Performers
178th Finland 1.0
Luxembourg 1.5
Norway 1.5
175th Denmark 1.6
=173rd Iceland 1.7
Sweden 1.7
=176th
Worst Performers
1st Angola 9.4
=2nd C.A.R. 9.2
Nigeria 9.2
=4th
Eq. Guinea 9.1
Haiti 9.1
P.N.G. 9.1
When there are ethnic, religious, or regional disparities, governments tend to
be uneven in their commitment to the social contract.
Uneven Economic Development
Best Performers
178th Luxembourg 1.5
177th Sweden 1.7
176th Canada 1.8
Austria 1.9
Denmark 1.9
Norway 1.9
=173rd
Worst Performers
1st Haiti 9.7
2nd Somalia 9.4
3rd North Korea 9.3
Guinea 9.2
Yemen 9.2
=4th
Poverty and economic decline strain the ability of the state to provide for its
citizens if they cannot provide for themselves and can create class friction.
Poverty and Economic Decline
Best Performers
178th Iceland 1.6
177th Luxembourg 1.7
176th Finland 1.9
175th Norway 2.0
New Zealand 2.1
Switzerland 2.1
=173rd
Worst Performers
1st Congo, D.R. 10.0
2nd Niger 9.8
3rd Ethiopia 9.7
4th Haiti 9.6
Chad 9.5
Somalia 9.5 =5th
Pressures on the population such as disease and natural disasters make it difficult
for the government to protect its citizens or demonstrate a lack of capacity or will.
Demographic Pressures
Best Performers
=177th New Zealand 1.1
Singapore 1.1
Ireland 1.4
Slovenia 1.4
174th Switzerland 2.1
=175th
Worst Performers
Congo, D.R. 10.0
Somalia 10.0
South Sudan 10.0
Sudan 10.0
5th C.A.R. 9.8
=1st
Pressures associated with population displacement. This strains public services,
and has the potential to pose a security threat.
Refugees and IDPs
33 The Fund for Peace www.fundforpeace.org
Failed States Index 2013:
Best and Worst by Indicator
Social and Economic Indicators
Analysis of the Failed States Index 2013

Best Performers
=177th Luxembourg 1.0
Netherlands 1.0
=176th Finland 1.1
=175th New Zealand 1.2
Iceland 1.3
Ireland 1.3
Sweden 1.3
=172nd
Worst Performers
1st Somalia 10.0
Chad 9.8
Congo, D.R. 9.8
4th North Korea 9.7
5th Egypt 9.6
=2nd
When human rights are violated or unevenly protected, the state is failing in its
ultimate responsibility.
Human Rights and Rule of Law
Best Performers
=177th Finland 1.0
Iceland 1.0
=175th Austria 1.1
New Zealand 1.1
174th Switzerland 1.4
Worst Performers
=1st Congo, D.R. 10.0
Iraq 10.0
3rd Afghanistan 9.9
Pakistan 9.8
Sudan 9.8
Syria 9.8
Yemen 9.8
=4th
The security apparatus should have a monopoly on the use of legitimate force.
The social contract is weakened where this is affected by competing groups.
Security Apparatus
Best Performers
=176th
New Zealand 0.5
Norway 0.5
Sweden 0.5
=175th Switzerland 0.8
Australia 1.0
Denmark 1.0
Finland 1.0
Netherlands 1.0
=171st
Corruption and a lack of representativeness in the government directly
undermine the social contract.
State Legitimacy
Worst Performers
1st Chad 9.9
Somalia 9.8
South Sudan 9.8
4th Haiti 9.6
=5th
C.A.R. 9.5
Congo, D.R. 9.5
Niger 9.5
North Korea 9.5
=2nd
Public Services
Best Performers
178th Switzerland 1.0
Finland 1.1
=175th New Zealand 1.1
Norway 1.1
Ireland 1.3
Portugal 1.3
=173rd
Worst Performers
=1st Somalia 10.0
Sudan 10.0
3rd South Sudan 9.8
Guinea Bissau 9.7
Zimbabwe 9.7 =4th
When local and national leaders engage in deadlock and brinksmanship for
political gain, this undermines the social contract.
Factionalized Elites
Best Performers
Australia 1.0
Canada 1.0
Finland 1.0
New Zealand 1.0
Sweden 1.0
United States 1.0
=173rd
Worst Performers
Afghanistan 10.0
South Sudan 10.0
Sudan 10.0
4th Haiti 9.9
5th Liberia 9.8
=1st
When the state cannot meet its international or domestic obligations, external
actors may intervene to provide services or to manipulate internal affairs.
External Intervention
Worst Performers
Chad 9.8
Guinea 9.8
North Korea 9.8
4th Guinea Bissau 9.6
=5th
Congo, D.R. 9.5
Sudan 9.5
Syria 9.5
=1st
Best Performers
178th Luxembourg 1.3
Denmark 1.4
Norway 1.4
Sweden 1.4
=171st
Austria 1.5
Finland 1.5
France 1.5
Netherlands 1.5
=175th
34 The Fund for Peace www.fundforpeace.org
Failed States Index 2013: Best and Worst by Indicator
The provision of health, education, and sanitation services, among others, are
key roles of the state.
Political and Military Indicators

7th Afghanistan 9.3 9.2 9.2 7.2 7.8 8.2 9.4 8.8 8.4 9.9 9.4 10.0 106.7
119th Albania 4.7 3.1 4.8 6.6 4.8 5.3 7.0 4.8 6.0 5.5 6.3 6.3 65.2
73rd Algeria 5.8 7.0 7.8 5.1 6.2 5.8 7.4 5.9 7.7 7.4 7.3 5.2 78.7
43rd Angola 8.9 7.2 6.8 5.9 9.4 5.1 8.6 8.4 7.3 6.1 7.3 6.1 87.1
128th Antigua & Barbuda 4.6 3.0 4.1 7.6 5.6 4.5 5.8 4.0 4.4 4.9 3.7 5.8 58.0
144th Argentina 4.1 2.0 5.0 3.0 6.0 4.0 4.4 3.9 4.1 3.0 2.7 3.8 46.1
105th Armenia 4.9 7.0 5.7 6.0 5.6 5.9 6.6 4.4 6.8 5.3 7.0 6.2 71.3
169th Australia 3.3 2.7 3.6 1.1 3.3 2.1 1.0 1.8 2.2 1.7 1.6 1.0 25.4
= 166th Austria 2.3 2.4 4.3 1.6 4.0 1.9 1.5 1.5 2.0 1.1 2.7 1.6 26.9
= 76th Azerbaijan 5.3 7.9 6.9 4.7 6.1 4.7 8.2 5.1 7.6 6.9 7.8 6.9 78.2
133rd Bahamas 6.6 2.8 4.4 5.6 5.6 4.5 4.9 4.4 2.8 4.3 4.5 4.3 54.7
124th Bahrain 4.6 2.5 7.3 3.3 5.7 3.2 7.6 2.4 7.5 6.1 7.1 5.6 62.9
29th Bangladesh 8.1 7.3 8.6 7.5 7.8 7.3 8.3 8.0 7.3 7.7 8.9 5.8 92.5
137th Barbados 3.8 2.7 4.4 6.2 5.7 5.8 3.6 2.7 2.5 4.2 4.2 5.0 50.8
= 81st Belarus 5.7 3.6 6.8 3.9 5.7 6.2 9.0 5.2 8.3 6.3 8.3 7.6 76.7
164th Belgium 2.5 1.6 4.1 1.8 3.8 3.5 2.1 2.2 1.5 2.0 3.9 2.0 30.9
114th Belize 6.5 4.9 4.4 7.1 6.6 5.5 6.0 6.0 4.1 5.5 4.3 6.3 67.2
78th Benin 8.3 6.5 3.6 6.2 7.2 7.1 6.0 8.6 5.1 5.8 6.1 7.3 77.9
= 62nd Bhutan 6.4 6.9 7.3 6.8 7.5 6.3 6.0 6.9 7.3 5.6 7.5 7.3 81.8
= 67th Bolivia 6.9 4.0 7.1 6.4 8.9 6.2 7.2 6.8 6.3 6.7 8.0 6.3 80.8
= 83rd Bosnia & Herzegovina 4.4 6.8 7.7 5.6 6.2 5.2 6.7 4.4 6.4 6.4 8.7 8.0 76.5
= 121st Botswana 8.3 5.8 4.8 5.0 7.5 6.1 4.4 6.0 4.4 3.5 3.3 4.8 64.0
126th Brazil 7.0 3.6 5.9 3.9 8.3 3.3 5.3 5.4 5.3 5.9 4.9 3.3 62.1
123rd Brunei Darussalam 4.5 3.3 6.2 4.6 7.8 2.8 7.4 2.6 6.9 5.6 7.4 4.1 63.2
132nd Bulgaria 4.4 3.1 4.6 4.9 5.1 5.0 4.8 4.4 3.7 4.7 5.3 5.0 55.0
35th Burkina Faso 9.4 7.4 5.3 6.3 8.4 7.7 7.7 8.7 6.8 7.2 7.3 8.0 90.2
20th Burundi 8.9 8.8 8.1 6.2 7.6 9.1 8.4 8.3 7.9 7.7 7.9 8.7 97.6
41st Cambodia 7.2 6.2 7.0 7.4 7.3 6.4 8.3 8.1 7.8 6.2 8.0 8.0 88.0
27th Cameroon 8.3 7.3 7.8 7.2 7.8 6.1 8.5 8.4 8.1 8.0 9.2 6.8 93.5
168th Canada 2.6 2.1 3.1 2.1 3.5 1.8 1.5 2.0 2.0 1.8 2.5 1.0 26.0
94th Cape Verde 6.7 4.1 4.2 8.3 6.9 6.1 6.3 6.5 5.1 5.7 5.5 8.2 73.7
9th Central African Republic 8.6 9.8 8.5 6.1 9.2 7.7 9.0 9.5 8.6 9.7 9.1 9.4 105.3
5th Chad 9.5 9.7 8.8 8.0 8.9 8.0 9.7 9.9 9.8 9.4 9.5 7.9 109.0
152nd Chile 4.9 2.4 3.5 2.8 5.5 4.1 3.8 4.3 3.5 2.9 1.4 3.2 42.3
66th China 8.1 6.1 8.3 5.0 8.0 3.6 8.1 6.8 9.4 6.5 7.2 3.8 80.9
57th Colombia 6.5 8.3 7.5 7.3 8.1 3.8 7.3 6.1 7.3 6.8 7.7 7.1 83.8
56th Comoros 7.4 4.5 5.3 7.2 6.4 8.2 7.4 7.9 6.6 7.5 7.5 8.1 84.0
2nd Congo (D. R.) 10.0 10.0 9.4 7.1 8.8 8.5 9.6 9.5 9.8 10.0 9.5 9.7 111.9
36th Congo (Republic) 8.2 8.0 6.0 6.2 8.2 7.0 8.7 8.7 7.5 6.7 6.7 8.2 90.0
139th Costa Rica 4.9 4.1 4.1 3.5 6.1 4.3 3.5 4.6 2.4 2.5 3.8 4.9 48.7
12th Côte d'Ivoire 7.8 9.3 9.0 7.3 7.8 7.7 9.3 8.5 8.6 9.1 9.4 9.7 103.5
Total
Failed States Index 2013:
A-Z Country Scores by Indicator
The Failed States Index 2013
35 The Fund for Peace www.fundforpeace.org

135th Croatia 3.7 5.5 5.3 4.4 4.4 5.1 3.9 2.9 4.7 4.8 4.4 5.0 54.1
101st Cuba 6.6 5.3 4.8 6.3 5.9 5.2 6.5 4.7 7.5 6.3 6.9 6.7 72.8
115th Cyprus 4.0 4.4 7.3 4.8 7.0 5.8 5.5 3.0 3.3 5.0 7.9 9.0 67.0
154th Czech Republic 2.5 2.2 3.8 3.4 3.8 4.5 4.1 3.7 2.4 2.1 4.2 3.2 39.9
174th Denmark 2.5 1.6 3.4 1.9 1.6 1.9 1.0 1.4 1.7 1.5 1.4 2.0 21.9
50th Djibouti 8.3 7.2 6.2 5.2 7.3 6.9 7.8 7.4 7.0 6.6 7.5 8.1 85.5
= 95th Dominican Republic 6.4 5.5 6.1 7.9 6.9 5.5 5.4 6.2 5.7 5.2 6.5 5.9 73.2
74th Ecuador 5.8 5.7 7.2 6.8 7.4 5.6 7.2 6.9 4.9 6.7 8.2 6.2 78.6
34th Egypt 7.2 6.5 8.5 5.4 7.1 8.2 8.9 5.6 9.6 7.3 8.7 7.7 90.6
= 95th El Salvador 7.4 5.5 5.7 6.9 7.0 6.5 5.9 6.5 6.1 6.4 4.3 5.1 73.2
47th Equatorial Guinea 8.3 3.3 6.6 6.6 9.1 4.5 9.6 7.6 9.4 7.5 8.2 5.5 86.1
25th Eritrea 8.7 7.4 6.1 7.3 6.9 8.3 8.7 8.4 9.1 7.5 8.1 8.6 95.0
= 145th Estonia 3.5 3.3 5.9 3.9 4.3 3.5 3.8 3.0 2.4 2.9 5.5 3.3 45.3
19th Ethiopia 9.7 8.7 8.6 6.7 7.6 7.7 7.3 8.7 8.7 8.4 8.7 8.1 98.9
= 67th Fiji 5.2 3.8 7.3 7.0 7.4 7.3 8.8 4.9 7.3 7.0 7.9 6.9 80.8
178th Finland 1.9 1.6 1.4 2.3 1.0 3.2 1.0 1.5 1.1 1.0 1.1 1.0 18.0
= 161st France 2.7 2.2 5.9 1.9 4.3 4.0 2.2 1.5 2.4 2.3 1.9 1.4 32.6
= 99th Gabon 6.8 5.6 3.3 5.5 7.3 5.2 7.6 7.0 6.8 5.4 7.1 5.4 72.9
= 62nd Gambia 7.7 6.4 3.7 7.1 6.8 7.8 7.6 7.5 8.0 5.5 6.8 6.9 81.8
55th Georgia 5.2 7.5 8.0 5.2 6.3 6.4 8.6 5.4 6.4 7.9 9.4 7.9 84.2
165th Germany 2.4 3.6 4.3 2.2 3.9 2.6 1.4 1.8 1.9 2.2 2.0 1.4 29.7
110th Ghana 6.7 5.5 4.9 7.3 6.5 6.1 5.1 7.6 4.7 3.8 5.0 6.0 69.1
138th Greece 4.3 2.0 4.8 4.4 4.3 6.4 5.4 3.9 3.0 3.9 3.0 5.1 50.6
120th Grenada 5.2 3.2 3.9 8.5 5.9 5.8 6.2 3.6 3.7 5.3 5.6 7.7 64.6
70th Guatemala 7.3 6.0 7.3 7.1 8.1 6.1 6.9 6.9 6.6 7.0 6.0 5.4 80.7
14th Guinea 8.4 8.2 7.6 7.7 8.2 9.2 9.8 8.9 8.4 9.1 8.9 7.0 101.3
15th Guinea Bissau 8.4 7.8 5.7 8.0 8.1 8.7 9.7 8.8 7.6 9.5 9.7 9.0 101.1
107th Guyana 5.8 3.8 5.9 8.5 6.8 6.6 6.2 6.0 4.4 5.8 5.1 5.9 70.8
8th Haiti 9.6 8.6 7.0 9.1 9.1 9.7 8.8 9.6 7.6 7.9 9.0 9.9 105.8
75th Honduras 7.0 3.9 5.8 6.6 8.1 6.9 6.9 6.8 6.3 6.8 6.3 6.9 78.3
141st Hungary 2.5 2.9 4.1 3.9 4.9 6.0 5.9 3.1 3.4 2.3 4.8 3.8 47.6
171st Iceland 1.6 1.6 1.0 2.8 1.7 3.7 1.4 1.6 1.3 1.0 1.8 5.2 24.7
79th India 7.5 5.2 8.2 5.4 8.1 5.4 5.2 6.7 5.9 7.8 6.8 5.2 77.5
= 76th Indonesia 7.5 6.0 7.3 6.3 6.9 5.5 6.4 6.1 6.5 6.8 7.0 5.9 78.2
37th Iran 5.5 7.3 8.8 6.1 6.7 6.5 8.9 5.0 9.4 8.6 9.4 7.5 89.7
11th Iraq 8.3 8.8 10.0 8.3 8.4 7.3 8.6 7.6 8.6 10.0 9.6 8.5 103.9
170th Ireland 2.2 1.4 1.6 2.8 2.5 3.9 1.9 1.9 1.3 1.8 1.3 2.2 24.8
= 67th Israel (including the West Bank) 6.2 7.4 9.8 3.2 7.5 3.7 6.7 5.9 7.6 7.1 8.1 7.7 80.8
147th Italy 3.8 3.3 4.7 2.6 3.6 4.8 4.7 2.4 2.9 5.0 4.8 2.0 44.6
118th Jamaica 5.6 3.4 4.0 7.2 5.9 6.6 6.1 5.7 5.0 6.3 3.7 6.3 65.6
156th Japan 5.4 3.7 3.8 2.0 1.8 3.7 2.2 2.5 3.0 1.7 2.6 3.7 36.1
87th Jordan 6.7 7.8 7.1 4.2 6.5 6.5 6.5 4.3 7.4 5.8 6.8 6.2 75.7
109th Kazakhstan 5.3 3.8 6.2 3.6 5.3 6.2 7.8 5.1 7.1 6.4 7.7 5.3 69.8
17th Kenya 9.1 8.7 9.0 7.8 8.3 7.6 8.3 8.1 7.1 8.1 9.0 8.5 99.6
127th Kuwait 5.1 3.8 4.6 3.7 5.3 3.4 7.6 2.6 6.8 4.4 7.9 4.4 59.6
48th Kyrgyz Republic 6.2 5.6 8.4 6.4 7.0 7.6 8.4 5.9 7.6 7.4 8.0 7.3 85.7
58th Laos 7.5 5.8 6.1 6.8 6.1 5.7 8.6 7.3 8.3 6.6 8.3 6.6 83.7
140th Latvia 3.6 3.3 5.4 4.2 4.9 4.0 4.5 3.4 3.2 3.3 4.3 3.8 47.9
Total
36 The Fund for Peace www.fundforpeace.org
The Failed States Index 2013: A-Z Country Scores by Indicator

46th Lebanon 6.3 8.5 8.5 6.0 6.2 5.3 7.2 5.6 6.8 8.5 9.2 8.2 86.3
71st Lesotho 8.8 4.9 4.7 6.8 6.7 8.5 6.0 8.2 5.4 5.2 7.0 7.2 79.4
= 23rd Liberia 8.8 9.2 6.5 7.0 8.0 8.3 6.6 9.1 6.4 7.1 8.3 9.8 95.1
54th Libya 5.5 5.4 7.4 4.2 6.7 5.0 8.4 7.3 9.0 8.9 8.0 8.8 84.5
150th Lithuania 3.8 2.9 3.7 4.1 5.2 4.5 3.8 3.4 2.9 2.5 3.0 3.2 43.0
172nd Luxembourg 1.7 1.8 2.8 2.1 1.5 1.5 1.9 1.3 1.0 2.3 3.4 2.0 23.3
112th Macedonia 3.9 5.2 7.8 6.1 6.2 5.9 6.1 3.9 4.3 6.0 7.0 5.6 68.0
61st Madagascar 8.1 4.3 4.9 5.5 7.9 8.2 7.2 8.6 5.9 7.0 7.5 7.7 82.7
40th Malawi 8.9 6.5 5.7 8.1 8.0 8.4 7.5 8.2 6.8 5.0 7.6 8.4 89.2
116th Malaysia 5.6 4.6 6.1 4.8 5.9 4.1 6.2 4.5 7.1 6.0 6.8 4.4 66.1
88th Maldives 5.4 5.3 4.9 6.2 4.4 6.5 8.3 6.7 7.6 5.8 8.0 6.4 75.4
= 38th Mali 9.3 7.6 7.6 7.8 6.8 8.1 6.0 8.5 6.5 8.1 5.0 8.0 89.3
151st Malta 2.8 5.2 4.0 4.1 3.5 3.6 4.1 2.3 3.3 3.7 2.0 3.8 42.4
31st Mauritania 8.5 8.3 7.2 5.7 6.5 8.0 7.7 8.4 7.4 7.8 8.2 7.9 91.7
148th Mauritius 3.8 2.2 3.5 3.6 4.8 4.1 4.1 3.8 3.5 3.3 3.2 4.6 44.5
= 97th Mexico 6.5 4.0 6.1 5.9 7.2 5.2 6.1 6.6 6.3 7.9 5.2 6.1 73.1
= 99th Micronesia 7.1 3.1 4.2 8.4 8.0 7.5 6.3 6.3 3.1 5.4 5.6 7.9 72.9
= 83rd Moldova 5.9 5.0 6.0 6.9 5.9 6.4 6.9 5.7 6.0 7.2 7.7 6.9 76.5
129th Mongolia 5.5 2.2 3.7 2.5 6.3 4.7 5.3 5.7 5.4 4.4 5.5 6.5 57.8
134th Montenegro 3.9 4.5 6.5 3.0 3.5 4.6 4.2 3.6 4.4 4.6 6.2 5.3 54.4
93rd Morocco 5.8 5.9 6.5 7.0 6.9 5.3 6.7 5.9 6.6 6.3 6.6 4.9 74.3
= 59th Mozambique 9.2 4.6 4.9 7.2 8.0 8.0 7.0 8.5 6.4 6.5 5.6 6.8 82.8
26th Myanmar 7.6 8.5 9.0 5.4 8.4 7.3 9.0 8.1 8.3 7.8 8.6 6.6 94.6
108th Namibia 6.9 5.6 5.3 6.5 8.7 6.7 4.1 6.7 4.9 4.9 3.5 6.5 70.4
30th Nepal 7.6 7.7 9.0 5.9 8.1 7.3 8.1 7.3 7.9 7.6 8.2 7.1 91.8
= 166th Netherlands 3.0 2.4 4.1 2.2 2.3 3.5 1.0 1.5 1.0 1.8 2.6 1.5 26.9
173rd New Zealand 2.1 1.1 3.5 2.4 3.4 3.6 0.5 1.8 1.2 1.1 1.1 1.0 22.7
72nd Nicaragua 6.6 4.8 5.9 7.8 7.9 6.8 7.5 6.8 5.4 5.6 6.8 7.3 79.2
18th Niger 9.8 7.9 7.8 6.3 7.9 8.4 8.1 9.5 7.6 8.3 8.9 8.5 99.0
16th Nigeria 8.5 6.6 9.8 7.3 9.2 7.5 8.8 9.3 8.6 9.5 9.4 6.3 100.7
= 23rd North Korea 8.0 5.0 6.6 4.4 8.3 9.3 9.8 9.5 9.7 8.4 7.7 8.4 95.1
= 175th Norway 2.0 1.9 3.6 1.6 1.5 1.9 0.5 1.4 1.9 2.7 1.1 1.3 21.5
136th Oman 5.0 2.0 2.7 1.8 3.6 4.5 6.1 4.4 7.5 5.3 6.6 2.4 52.0
13th Pakistan 8.9 9.1 9.7 6.9 7.9 7.5 8.4 7.3 8.7 9.8 9.2 9.6 102.9
131st Panama 5.9 3.7 5.0 4.5 7.9 3.8 4.7 5.0 4.4 5.1 2.5 3.3 55.8
53rd Papua New Guinea 7.6 5.0 6.6 7.5 9.1 6.9 7.1 8.9 6.2 6.6 7.1 6.3 84.9
104th Paraguay 6.1 2.4 6.5 4.9 8.6 5.1 7.9 6.1 6.1 6.1 7.9 4.2 71.8
103rd Peru 5.9 4.7 7.0 6.1 7.8 4.1 7.1 6.4 5.0 7.0 6.7 4.5 72.3
= 59th Philippines 7.1 6.5 7.9 6.2 6.5 5.6 7.6 6.4 6.7 8.7 8.0 5.5 82.8
153rd Poland 3.5 2.8 3.8 5.0 3.9 3.5 3.4 2.8 2.9 2.5 3.6 3.3 40.9
= 161st Portugal 2.8 1.6 2.3 2.6 3.4 5.4 2.1 3.5 2.7 1.6 1.3 3.3 32.6
143rd Qatar 4.3 2.1 4.9 3.1 4.8 2.9 5.9 2.0 5.6 2.5 5.0 4.0 47.1
130th Romania 4.3 2.7 6.3 4.7 5.3 5.7 6.4 4.3 3.9 4.1 5.2 4.6 57.4
80th Russia 5.7 5.3 8.2 5.1 7.0 3.5 8.1 5.1 8.6 8.5 8.0 4.0 77.1
= 38th Rwanda 8.4 7.9 8.2 6.9 7.7 6.7 6.5 7.6 7.7 5.5 8.2 8.0 89.3
Total
37 The Fund for Peace www.fundforpeace.org
The Failed States Index 2013: A-Z Country Scores by Indicator

111th Samoa 6.8 2.5 4.8 8.8 6.0 5.9 6.0 4.8 4.5 5.5 5.1 8.0 68.7
91st Sao Tome 6.6 4.3 4.8 7.9 6.3 7.9 6.6 6.4 4.3 5.8 6.3 7.3 74.6
102nd Saudi Arabia 5.5 5.2 7.4 3.1 6.4 3.6 7.8 4.0 8.9 7.2 8.0 5.6 72.7
64th Senegal 8.3 7.0 6.3 6.8 6.8 7.2 5.9 7.8 6.2 6.2 6.6 6.3 81.4
92nd Serbia 4.7 6.6 8.0 4.7 5.9 6.5 6.3 4.7 5.5 6.5 8.0 7.0 74.4
= 121st Seychelles 5.2 3.3 4.8 4.9 6.6 5.2 6.3 3.5 5.2 6.4 5.7 6.9 64.0
33rd Sierra Leone 9.0 8.1 5.9 8.0 8.5 8.6 7.3 9.0 6.1 5.4 7.9 7.4 91.2
158th Singapore 2.5 1.1 2.7 3.3 3.7 3.0 3.2 1.9 4.9 1.5 4.0 2.2 34.0
= 145th Slovakia 3.2 2.0 5.0 4.5 4.6 5.2 4.3 3.5 3.0 2.3 3.7 3.9 45.3
163rd Slovenia 2.5 1.4 3.3 3.2 4.5 3.6 2.8 2.1 2.5 2.5 1.6 2.3 32.3
= 51st Solomon Islands 7.7 4.9 6.8 5.7 8.3 7.8 7.3 8.0 5.9 6.7 8.0 8.2 85.2
1st Somalia 9.5 10.0 9.3 8.9 8.4 9.4 9.5 9.8 10.0 9.7 10.0 9.4 113.9
113th South Africa 7.8 6.5 5.7 4.3 8.0 5.9 5.3 6.3 4.2 5.1 5.6 2.9 67.6
157th South Korea 3.0 2.0 3.1 3.9 2.9 2.0 2.9 1.9 2.6 2.1 3.6 5.4 35.4
4th South Sudan 8.9 10.0 10.0 6.5 8.9 8.6 9.1 9.8 9.3 9.6 9.8 10.0 110.6
149th Spain 2.8 2.3 5.8 3.0 4.1 5.5 3.3 3.3 2.2 4.1 6.0 2.0 44.4
28th Sri Lanka 6.8 8.4 9.5 7.3 7.8 5.9 8.2 5.5 9.0 8.5 9.3 6.8 92.9
3rd Sudan 8.8 10.0 10.0 8.4 8.5 7.8 9.6 8.8 9.3 9.8 10.0 10.0 111.0
106th Suriname 5.7 3.0 6.1 7.6 7.0 7.1 6.1 5.3 5.4 5.8 5.8 6.3 71.2
49th Swaziland 9.0 4.9 3.6 6.3 7.5 8.9 8.7 7.8 8.3 6.0 7.0 7.5 85.6
177th Sweden 2.5 2.4 1.0 1.7 1.7 1.7 0.5 1.9 1.3 2.2 1.8 1.0 19.7
= 175th Switzerland 2.1 1.5 3.5 2.1 2.3 2.3 0.8 1.4 1.7 1.4 1.0 1.4 21.5
21st Syria 5.6 9.5 9.3 6.2 7.2 6.4 9.6 7.0 9.5 9.8 9.2 8.1 97.4
= 51st Tajikistan 7.4 5.3 6.7 5.9 6.2 8.0 9.1 6.3 8.2 7.4 8.3 6.4 85.2
65th Tanzania 8.6 6.8 6.0 6.4 6.4 6.8 6.2 8.8 6.2 5.5 5.7 7.7 81.1
90th Thailand 7.9 6.4 8.1 3.5 6.4 3.5 6.2 4.6 7.3 7.8 8.8 4.6 75.1
32nd Timor-Leste 8.7 7.4 6.8 6.4 6.7 7.9 8.0 8.5 6.0 8.3 8.3 8.5 91.5
42nd Togo 8.2 7.1 4.8 6.8 7.6 7.4 8.3 8.3 7.8 7.4 7.5 6.5 87.8
125th Trinidad 5.3 3.0 4.4 7.8 6.1 4.6 5.6 5.2 5.2 5.7 5.6 4.2 62.6
= 83rd Tunisia 4.9 4.2 7.8 5.0 6.0 6.0 7.9 5.0 8.4 7.2 7.8 6.3 76.5
86th Turkey 5.7 7.4 9.0 3.9 6.8 5.3 5.9 5.5 5.5 7.9 7.3 5.6 75.9
= 81st Turkmenistan 5.9 3.9 6.7 4.9 6.5 5.4 9.3 6.1 8.7 7.1 7.7 4.6 76.7
22nd Uganda 9.1 8.4 8.0 6.7 7.8 7.4 8.1 8.3 7.9 8.2 8.6 8.2 96.6
117th Ukraine 4.7 3.2 5.9 5.7 5.3 5.4 7.8 3.6 5.7 4.4 8.0 6.2 65.9
142nd United Arab Emirates 3.9 2.5 4.3 2.4 4.8 3.5 6.5 2.9 6.4 2.9 3.6 3.5 47.3
160th United Kingdom 2.5 2.7 5.0 2.1 3.6 4.1 1.6 2.3 1.8 2.7 3.5 1.3 33.2
159th United States 3.0 2.3 4.2 1.0 4.8 3.2 2.3 2.4 3.2 2.2 3.9 1.0 33.5
155th Uruguay 3.8 1.9 2.8 4.7 4.4 3.6 1.7 3.4 2.3 3.7 2.7 3.5 38.4
44th Uzbekistan 6.7 6.0 7.5 6.3 7.6 7.2 9.0 5.4 9.2 7.9 8.7 5.4 86.9
89th Venezuela 5.4 4.8 6.4 5.8 6.9 5.4 7.6 6.5 7.7 6.5 7.3 4.9 75.3
= 97th Vietnam 5.9 4.7 5.7 5.7 5.8 6.2 7.8 5.8 7.5 5.4 6.9 5.6 73.1
6th Yemen 9.3 9.2 9.0 7.4 8.1 9.2 9.3 8.7 8.7 9.8 9.5 8.7 107.0
45th Zambia 9.3 7.4 6.0 7.4 8.0 8.3 8.0 7.6 6.7 5.0 5.7 7.2 86.6
10th Zimbabwe 9.2 8.7 8.4 8.6 8.6 8.6 9.2 9.1 8.9 8.4 9.7 7.8 105.2
Total
38 The Fund for Peace www.fundforpeace.org
The Failed States Index 2013: A-Z Country Scores by Indicator

The Fund for Peace is an
independent, nonpartisan, 501(c)(3) non-
profit research and educational
organization that works to prevent violent
conflict and promote sustainable security.
We promote sustainable security through
research, training and education,
engagement of civil society, building bridges
across diverse sectors, and developing
innovative technologies and tools for policy
makers.
A leader in the conflict assessment and
early warning field, The Fund for Peace
focuses on the problems of weak and failing
states. Our objective is to create practical
tools and approaches for conflict mitigation
that are useful to decision-makers.
The Fund for Peace adopts a holistic
approach to the issues stemming from
weak and failing states. We work at both the
grassroots level with civil society actors and
at policy levels with key decision makers. We
have worked in over 50 countries with a
wide range of partners in all sectors:
governments, international organizations,
t he m i l i t a ry , non gov e r nment a l
organizations, academics, journalists, civil
society networks, and the private sector.
The Fund for Peace offers a wide range of
initiatives focused on our central objective:
to promote sustainable security and the
ability of a state to solve its own problems
peacefully without an external military or
administrative presence. Our programs fall
into three primary thematic areas:
• Conflict Early Warning & Assessment;
• Transnational Threats; and
• Sustainable Development & Security.
Conflict Early Warning
and Assessment
Transnational
Threats
Sustainable Development
and Security
www.fundforpeace.org Follow us on Facebook
www.fundforpeace.org/facebook
Follow us on Twitter
www.twitter.com/fundforpeace
39 The Fund for Peace www.fundforpeace.org
About The Fund for Peace
The Institution

www.fundforpeace.org