Faculty of Engineering and Science - Aalborg...
97
Faculty of Engineering and Science Aalborg University Department of Communications TITLE: End-2-End QoS Provisioning in UMTS networks TIME PERIOD: 9th and 10th semester Sept 2 nd , 2004 to June 15 th , 2005 GROUP: 1122 GROUP MEMBERS: Haibo Wang Devendra Prasad SUPERVISOR: Hans-Peter Schwefel Oumer Teyeb COPIES: 9 Abstract: A main challenge for UMTS is to convey various types of traffic on the same medium while meeting their different QoS require- ments. QoS is an end-to-end concept that has to be satisfied through the inter-working of all the entities that the data is passing through. Major approaches for QoS provisioning in IP backbone network are DiffServ and InterServ. UMTS standardization as performed in 3GPP focuses on QoS signalling for the UMTS part (UE to GGSN) only, and it does not contain the actual QoS provisioning mechanisms for the data transport. This report proposes de- tailed algorithms and packet treatment strate- gies for the UMTS core network and analyze them in a large set of simulation experiments. The latter focus on revealing the impact of non-real time services on real-time service in different scenarios with and without full QoS provisioning mechanisms. The implemented algorithms include Call Admission Control, policing, scheduling and queuing schemes.
Transcript of Faculty of Engineering and Science - Aalborg...

Faculty of Engineering and ScienceAalborg University
Department of Communications
TITLE:End-2-End QoS Provisioning inUMTS networks
TIME PERIOD:9th and 10th semesterSept 2nd, 2004 to June 15th, 2005
GROUP:1122
GROUP MEMBERS:Haibo WangDevendra Prasad
SUPERVISOR:Hans-Peter SchwefelOumer Teyeb
COPIES: 9
Abstract:
A main challenge for UMTS is to conveyvarious types of traffic on the same mediumwhile meeting their different QoS require-ments. QoS is an end-to-end concept that hasto be satisfied through the inter-working of allthe entities that the data is passing through.Major approaches for QoS provisioning in IPbackbone network are DiffServ and InterServ.UMTS standardization as performed in 3GPPfocuses on QoS signalling for the UMTS part(UE to GGSN) only, and it does not containthe actual QoS provisioning mechanisms forthe data transport. This report proposes de-tailed algorithms and packet treatment strate-gies for the UMTS core network and analyzethem in a large set of simulation experiments.The latter focus on revealing the impact ofnon-real time services on real-time service indifferent scenarios with and without full QoSprovisioning mechanisms. The implementedalgorithms include Call Admission Control,policing, scheduling and queuing schemes.
Preface
This report has been written by group MOB-1122 of the 9th and 10th semester of theInternational Master of Science (M.Sc.E) in Mobile communication. It constitutes thedocumentation of the project work done about End-to-End Quality of service provisioningof UMTS network.The report is primarily intended to students and supervisors of AalborgUniversity.
Reference to literature are in squared brackets with the number that appears in thebibliography, i.e [1].
Figure,Table and Equation Numbering follows the chapter numbering, i.e. Figure 2 ofchapter 2 is called Figure 2.2,Table 3 of chapter 5 is called Table 5.3 and Equation 3 ofchapter 9 is called Equation 9.3.
Group MOB-1122, Aalborg University, June 16, 2005
Haibo Wang Devendra Prasad
2
ACKNOWLEDGEMENTS
We would like to thank our two supervisors, Hans-Peter Schwefel and Oumer Teyeb fortheir patience during all the phases of this project.We would like to express our gratitude toDr.Hans to fulfil our dream of doing Masters in a world-class university. He has providedus guidance,support,motivation to succeed, and countless highlighting discussion.We aregrateful to Oumer for his advice on our simulator.
Finally, we give a very special thanks to all the professors and PhD students who helpedus during the Master’s Program. We would also likes to thanks our family, back home inIndia and China, for their unconditional support in all situations.
3

Contents
1 Introduction 131.1 Motivation . . . . . . . . . . . . . . . . . . . . . . . . . . . . . . . . . . 131.2 QoS Basic Concept . . . . . . . . . . . . . . . . . . . . . . . . . . . . . 141.3 Problem Statement . . . . . . . . . . . . . . . . . . . . . . . . . . . . . 151.4 Chapter Organization . . . . . . . . . . . . . . . . . . . . . . . . . . . . 16
2 Overview of UMTS 172.1 UMTS Services . . . . . . . . . . . . . . . . . . . . . . . . . . . . . . . 172.2 UMTS Architecture . . . . . . . . . . . . . . . . . . . . . . . . . . . . . 18
2.2.1 User Equipment . . . . . . . . . . . . . . . . . . . . . . . . . . 182.2.2 UTRAN . . . . . . . . . . . . . . . . . . . . . . . . . . . . . . . 192.2.3 Core Network (CN) . . . . . . . . . . . . . . . . . . . . . . . . . 192.2.4 Interfaces . . . . . . . . . . . . . . . . . . . . . . . . . . . . . . 20
2.3 UMTS protocol stack . . . . . . . . . . . . . . . . . . . . . . . . . . . . 212.3.1 UMTS user plane . . . . . . . . . . . . . . . . . . . . . . . . . . 212.3.2 UMTS control plane . . . . . . . . . . . . . . . . . . . . . . . . 22
2.4 UMTS Air Interface . . . . . . . . . . . . . . . . . . . . . . . . . . . . . 232.4.1 The Physical layer . . . . . . . . . . . . . . . . . . . . . . . . . 242.4.2 The MAC layer . . . . . . . . . . . . . . . . . . . . . . . . . . . 242.4.3 RLC layer . . . . . . . . . . . . . . . . . . . . . . . . . . . . . . 252.4.4 RRC layer . . . . . . . . . . . . . . . . . . . . . . . . . . . . . 252.4.5 Transport channels . . . . . . . . . . . . . . . . . . . . . . . . . 25
2.5 Packet Data Protocol (PDP) Context . . . . . . . . . . . . . . . . . . . . 262.5.1 PDP context states . . . . . . . . . . . . . . . . . . . . . . . . . 272.5.2 PDP context procedures . . . . . . . . . . . . . . . . . . . . . . 27
3 UMTS QoS 293.1 UMTS QoS architecture . . . . . . . . . . . . . . . . . . . . . . . . . . 293.2 UMTS QoS classes . . . . . . . . . . . . . . . . . . . . . . . . . . . . . 303.3 UMTS QoS mechanisms . . . . . . . . . . . . . . . . . . . . . . . . . . 31
3.3.1 QoS Profile . . . . . . . . . . . . . . . . . . . . . . . . . . . . . 313.3.2 Traffic Flow Template . . . . . . . . . . . . . . . . . . . . . . . 313.3.3 PDP context signalling procedure . . . . . . . . . . . . . . . . . 33
4

CONTENTS
3.4 UMTS QoS management entities and mechanism . . . . . . . . . . . . . 373.4.1 QoS management in the control plane . . . . . . . . . . . . . . . 373.4.2 QoS management in the user plane . . . . . . . . . . . . . . . . . 38
3.5 Conclusion . . . . . . . . . . . . . . . . . . . . . . . . . . . . . . . . . 39
4 IP QoS 404.1 DiffServ approach . . . . . . . . . . . . . . . . . . . . . . . . . . . . . . 40
4.1.1 Per Hop Behaviors(PHB) and Differentiated Services Code Point(DSCP) 404.1.2 Per Hop Behaviors . . . . . . . . . . . . . . . . . . . . . . . . . 424.1.3 Traffic classification and conditioning . . . . . . . . . . . . . . . 444.1.4 Meter and Marker functions - Policy . . . . . . . . . . . . . . . . 45
4.2 IntServ/RSVP Policy . . . . . . . . . . . . . . . . . . . . . . . . . . . . 494.3 Comparison between IntServ and DiffServ . . . . . . . . . . . . . . . . . 504.4 Other IP QoS provisioning mechanisms . . . . . . . . . . . . . . . . . . 52
4.4.1 Scheduling . . . . . . . . . . . . . . . . . . . . . . . . . . . . . 524.4.2 Queuing - RED . . . . . . . . . . . . . . . . . . . . . . . . . . . 53
4.5 Conclusion . . . . . . . . . . . . . . . . . . . . . . . . . . . . . . . . . 54
5 NS-2 simulator 555.1 Overview of NS-2 . . . . . . . . . . . . . . . . . . . . . . . . . . . . . 555.2 DiffServ module . . . . . . . . . . . . . . . . . . . . . . . . . . . . . . 57
5.2.1 AF PHB Implementation with multiple RED queues . . . . . . . 575.2.2 Policer . . . . . . . . . . . . . . . . . . . . . . . . . . . . . . . 585.2.3 Scheduler . . . . . . . . . . . . . . . . . . . . . . . . . . . . . . 58
5.3 UTRAN extension . . . . . . . . . . . . . . . . . . . . . . . . . . . . . 595.3.1 Overview of the UMTS model . . . . . . . . . . . . . . . . . . . 595.3.2 UTRAN nodes and links . . . . . . . . . . . . . . . . . . . . . . 595.3.3 RLC object . . . . . . . . . . . . . . . . . . . . . . . . . . . . . 605.3.4 Error Model for wireless link . . . . . . . . . . . . . . . . . . . . 605.3.5 EURANE limitations . . . . . . . . . . . . . . . . . . . . . . . . 60
6 Delimitation 626.1 State-of-the-Art . . . . . . . . . . . . . . . . . . . . . . . . . . . . . . . 62
6.1.1 E2E framework . . . . . . . . . . . . . . . . . . . . . . . . . . . 636.1.2 QoS mapping: SAMU project . . . . . . . . . . . . . . . . . . . 636.1.3 Call Admission Control (CAC) . . . . . . . . . . . . . . . . . . . 656.1.4 Simulation: SEACORN project . . . . . . . . . . . . . . . . . . 666.1.5 Radio Resource Management . . . . . . . . . . . . . . . . . . . 666.1.6 Conclusion . . . . . . . . . . . . . . . . . . . . . . . . . . . . . 67
6.2 Problem Delimitation . . . . . . . . . . . . . . . . . . . . . . . . . . . . 67
5

CONTENTS
7 Preliminary Simulation 697.1 Simulation including UTRAN . . . . . . . . . . . . . . . . . . . . . . . 69
7.1.1 Simulation settings . . . . . . . . . . . . . . . . . . . . . . . . . 697.1.2 Air interface effects . . . . . . . . . . . . . . . . . . . . . . . . 707.1.3 Simulation result and Conclusion . . . . . . . . . . . . . . . . . 72
7.2 Simulation on DiffServ wired network . . . . . . . . . . . . . . . . . . . 727.2.1 Simulation result and conclusion . . . . . . . . . . . . . . . . . . 73
8 Development of QoS algorithm 748.1 General assumptions and optimization target . . . . . . . . . . . . . . . . 748.2 Mapping from DiffServ PHB to UMTS QoS classes . . . . . . . . . . . . 788.3 Call Admission Control . . . . . . . . . . . . . . . . . . . . . . . . . . . 788.4 Policing, buffering and scheduling . . . . . . . . . . . . . . . . . . . . . 80
8.4.1 Policing and Multiple queuing . . . . . . . . . . . . . . . . . . . 808.4.2 Scheduling . . . . . . . . . . . . . . . . . . . . . . . . . . . . . 81
8.5 conclusion . . . . . . . . . . . . . . . . . . . . . . . . . . . . . . . . . . 82
9 Enhanced simulation and evaluation 849.1 Simulation scenario . . . . . . . . . . . . . . . . . . . . . . . . . . . . . 859.2 Performance evaluation . . . . . . . . . . . . . . . . . . . . . . . . . . . 87
9.2.1 Best Effort . . . . . . . . . . . . . . . . . . . . . . . . . . . . . 879.2.2 CIR-based CAC with QoS schemes . . . . . . . . . . . . . . . . 889.2.3 Mean-based CAC with QoS schemes . . . . . . . . . . . . . . . 899.2.4 EB-based CAC with QoS schemes . . . . . . . . . . . . . . . . 91
9.3 Conclusion . . . . . . . . . . . . . . . . . . . . . . . . . . . . . . . . . 93
10 Conclusion and future work 94
Bibliography 95
6
List of Figures
1.1 Entities involved in E2E UMTS QoS Provision . . . . . . . . . . . . . . 15
2.1 UMTS Network Architecture in Release 99 . . . . . . . . . . . . . . . . 182.2 UMTS Radio Access Network(UTRAN) Architecture [8] . . . . . . . . . 192.3 UMTS Protocol Stack: User Plane . . . . . . . . . . . . . . . . . . . . . 212.4 UMTS Protocol Stack: Control Plane . . . . . . . . . . . . . . . . . . . 222.5 PDP Context State Transition . . . . . . . . . . . . . . . . . . . . . . . . 27
3.1 UMTS End-to-End QoS Architecture . . . . . . . . . . . . . . . . . . . 293.2 PDP Context Activation Procedure for UMTS [11] . . . . . . . . . . . . 343.3 Secondary PDP Context Activation Procedure for UMTS [11] . . . . . . 363.4 GGSN-Initiated PDP Context Modification Procedure for UMTS [11] . . 363.5 UMTS QoS Management functions in the control plane[1] . . . . . . . . 373.6 UMTS QoS Management functions in the user plane[1] . . . . . . . . . . 38
4.1 The DS field structure . . . . . . . . . . . . . . . . . . . . . . . . . . . . 414.2 The architecture a DiffServ Domain . . . . . . . . . . . . . . . . . . . . 424.3 Assured Forwarding PHB Group . . . . . . . . . . . . . . . . . . . . . . 434.4 Possible implementation of Expedited Forwarding PHB . . . . . . . . . . 434.5 Logical structure of a packet classifier and traffic conditioner . . . . . . . 444.6 An example TSW meter algorithm [16] . . . . . . . . . . . . . . . . . . 464.7 TSW3CM Marking Algorithm [16] . . . . . . . . . . . . . . . . . . . . . 464.8 Token Bucket algorithm . . . . . . . . . . . . . . . . . . . . . . . . . . . 484.9 IntServ/RSVP Policy . . . . . . . . . . . . . . . . . . . . . . . . . . . . 494.10 WIRR scheduling . . . . . . . . . . . . . . . . . . . . . . . . . . . . . . 53
5.1 Simplified User View of NS . . . . . . . . . . . . . . . . . . . . . . . . 555.2 UMTS simulation realization in NS2 . . . . . . . . . . . . . . . . . . . . 595.3 UMTS simulation protocol stack . . . . . . . . . . . . . . . . . . . . . . 60
6.1 Layered Service architecture of an E2E QoS chain of UMTS . . . . . . . 63
7.1 E2E Network topology in using Best Effort strategy . . . . . . . . . . . . 697.2 UTRAN delay simulated in NS2-EURANE . . . . . . . . . . . . . . . . 71
7
LIST OF FIGURES
7.3 Traffic throughput in a 10% overload scenario . . . . . . . . . . . . . . . 727.4 Droptail queue size evolution . . . . . . . . . . . . . . . . . . . . . . . . 737.5 RED queue size evolution . . . . . . . . . . . . . . . . . . . . . . . . . . 73
8.1 Simplified End2End QoS investigate scenario . . . . . . . . . . . . . . . 758.2 Packet data flow in AM [13] . . . . . . . . . . . . . . . . . . . . . . . . 778.3 Policing, buffering and scheduling Implementation . . . . . . . . . . . . 808.4 PRI scheduler . . . . . . . . . . . . . . . . . . . . . . . . . . . . . . . . 818.5 WRR scheduler . . . . . . . . . . . . . . . . . . . . . . . . . . . . . . . 828.6 Implemented QoS algorithm . . . . . . . . . . . . . . . . . . . . . . . . 83
9.1 Simplified End2End QoS investigate scenario . . . . . . . . . . . . . . . 849.2 Simulation Parameters . . . . . . . . . . . . . . . . . . . . . . . . . . . 859.3 Traffic Parameters in Simulation . . . . . . . . . . . . . . . . . . . . . . 869.4 Voice Packet Delay Distribution in Best Effort strategy . . . . . . . . . . 879.5 VoIP Packet Delay Distribution in CIR-based QoS algorithm . . . . . . . 889.6 Video Packet Delay Distribution in CIR-based QoS algorithm . . . . . . . 899.7 VoIP Packet Delay Distribution in proposed QoS algorithm . . . . . . . . 909.8 Video Streaming Packet Delay Distribution in proposed QoS algorithm . . 909.9 VoIP Packet Delay Distribution in proposed QoS algorithm . . . . . . . . 929.10 Video Packet Delay Distribution in proposed QoS algorithm . . . . . . . 92
8

List of Tables
2.1 UTRAN Key Parameters . . . . . . . . . . . . . . . . . . . . . . . . . . 23
3.1 UMTS QoS classes . . . . . . . . . . . . . . . . . . . . . . . . . . . . . 313.2 UMTS bearer attributes defined for each traffic class . . . . . . . . . . . 323.3 Valid Packet Filter Attribute Combinations . . . . . . . . . . . . . . . . 33
4.1 A comparison of the IntServ and DiffServ architectures . . . . . . . . . . 51
6.1 Mapping of Differentiated Services Classes to UMTS QoS Classes . . . . 656.2 Mapping of Integrated Services Classes to UMTS QoS Classes . . . . . . 65
7.1 Traffic model . . . . . . . . . . . . . . . . . . . . . . . . . . . . . . . . 707.2 Simulation settings . . . . . . . . . . . . . . . . . . . . . . . . . . . . . 70
8.1 Traffic Model Assumptions . . . . . . . . . . . . . . . . . . . . . . . . . 758.2 UMTS QoS requirements of different service classs . . . . . . . . . . . . 768.3 UMTS Vs DiffServ Mapping . . . . . . . . . . . . . . . . . . . . . . . 78
9.1 UMTS QoS requirements of each service type . . . . . . . . . . . . . . . 849.2 CIR settings for CIR-based Admission Control . . . . . . . . . . . . . . 889.3 Simulation result of CIR-based CAC with QoS algorithm . . . . . . . . . 889.4 Mean sending rate estimation for Mean-based Admission Control . . . . 899.5 Simulation result of Mean-based CAC with algorithm . . . . . . . . . . . 899.6 QoS provisioning settings . . . . . . . . . . . . . . . . . . . . . . . . . . 919.7 Simulation result of proposed EB-CAC with QoS algorithm . . . . . . . . 91
9
Abbreviation List
AF Assured ForwardingAUC Authentication CenterAM Acknowledged ModeARQ Automatic Repeat RequestBA Behavior AggregateBB BAndwidth BrokerBE Best EffortBER Bit Error RateBS Base StationCAC Call Admission ControlCIR Committed Information RateCL Controlled-Load ServiceCN Core NetworkCS circuit switchedCCTrCH Coded Composite Transport ChannelsDCH Dedicated ChannelDiffServ Differentiated ServicesDSCP Differentiated Service Code PointEB Equivalent BandwidthE2E End-to-EndEF Expedited ForwardingETSI European Telecommunications Standards InstituteEIR Equipment Identification RegisterFACH Forward Access ChannelFDD Frequency Division DuplexFEC Forward Error CorrectionFER Frame Error RateQoS Quality of Service3G Third GenerationGMSC Gateway Mobile services Switching CenterGSM Global System for Mobile CommunicationGGSN Gateway GPRS Support Node3GPP Third Generation Partnership Project
10

LIST OF TABLES
3GPP2 Third Generation Partnership ProjectGPRS General packet radio ServiceGTP GPRS Tunneling ProtocolGTP-U GPRS Tunneling Protocol for the user planeGS Guaranteed ServiceHLR Home Location RegisterIntServ Integrated ServicesIETF Internet engineering Task ForceIMT-2000 International Mobile Telecommunications 2000IP Internet ProtocolISP Internet Service ProviderISDN Integrated Services Digital NetworkITU International Telecommunication UnionKbps kilobits per secondKPI Key Performance IndicatorMAC Medium Access ControlMF MultiField AggregateMMS Multimedia Message ServicesMSC Mobile services Switching CenterNS-2 Network Simulator 2NRT NonReal TimeNSAPI Network Service Access Point IdentifierPCM Pulse Code ModulationPDP Packet Data ProtocolPDCP Packet Data Convergence ProtocolPDU Protocol Data UnitPIR Peak Information ratePHB Per Hop BehaviorPPP Point-to-pointPRI PriorityPS Packet SwitchedPHY Physical layerRABs Radio Access BearersRACH Random Access ChannelRANAP: Radio Access Network Application ProtocolRED Random Early DetectionRLC Radio Link ControlRNC Radio Network ControllerRR Round RobinRRC Radio Resource ControlRRM Radio Resource ManagementRSVP Resource Reservation ProtocolRT Real Time
11

LIST OF TABLES
SDU Service Data UnitsSLA Service layer AgreementSMS Short Message ServiceSGSN Serving GPRS Support NodeSPI Security Parameter IndexTCA Traffic Condition AgreementTCP Transmission Control ProtocolTDD Time Division DuplexTFT raffic Flow TemplateTM Transparent ModeTOS Type of ServiceTSW3CM/2CMTime Sliding Window Three/Two Color MarkerUDP User Datagram ProtocolUE User EquipmentUM Unacknowledged ModeUMTS Universal Mobile Telecommunications SystemUTRAN UMTS Terrestrial Radio Access NetworkUSIM UMTS Subscriber Identity ModuleVLR Visitor location registerVoIP Voice over IPWCDMA Wideband Code Division Multiple AccessCDMA Code Division Multipls AccessWIRR Weighted Interleaved Round RobinWRR weighted Round Robin
12

Chapter 1
Introduction
1.1 MotivationThe end-to-end (E2E)Quality of Service (QoS) provision in both the standards for ThirdGeneration(3G) mobile radio systems(in Third Generation Partnership Project,3GPP/3GPP2)and for IP infrastructure(in IETF).The market requires the real-time and quality-assuredservices provision by the mobile communication world which is going to be a convergenceof all-IP backbone[3GPP Release 5] and Universal Mobile Telecommunications System(UMTS) radio access network.
UMTS has been designed to support integrated services such as voice, data, video,etc. The broadband multi-media services is regarded as the key to UMTS success. Someservices require UMTS to provide bandwidth on demand, mixed traffic types, efficientnetwork transport and/or guaranteed QoS features. Those services may be divided intoreal time(RT) and non-real time with quite different demand to the UMTS network.
The QoS provisioning means that the multimedia traffic should get predictable servicefrom the available resources. Typical resources are CPU time (for the communicationsoftware to execute) and network bandwidth. The software must also guarantee an ac-ceptable end-to-end delay and maximum delay jitter i.e., maximum allowed variance inthe arrival of data at the destination. In most case, the 3-tuple specifies QoS requirements:bandwidth, delay and reliability. The QoS provisioning problem for multimedia trafficin wired network has been extensively studied. The ongoing work in this field mainlyconcentrates on the problems of bandwidth management and switch based scheduling toprovide guarantee on end-to-end delay, throughput and packet losses.
There are few major differences between the wire line and wireless networks due tolink characteristics and mobility [1]. The broadband wire-line network transmission linkcharacterized by high transmission rates (in the order of Gbps) and a very low error rates.
13
CHAPTER 1. INTRODUCTION
In contrast, wireless links have a much smaller transmission rate (Kbps-Mbps). In wire-less networks the errors are more likely to come in bursts due to multipath dispersion andRayleigh fading thus requiring a more complex error detection or forward error correc-tion. Another major difference between the two networks is the user mobility. In wire-linenetworks, the User-networks interface (UNI) remains fixed throughout the duration of aconnection whereas the UNI in a wireless networks keeps on changing throughout theconnection. Therefore, it is necessary to redesign or revise the usual provisioning tech-niques for wireless networks.
The focus of the project is on investigating the E2E QoS provisioning for Real timeservices including both external IP network (Internet) and the packet-switched domainof UMTS network. Related concepts are reviewed, well-known approaches in both In-ternet and UMTS system to provide QoS are described, and a new E2E QoS provisionmechanism is proposed.
1.2 QoS Basic ConceptQuality of Service is the collective effectiveness of service performance that determinesthe degree of an end user of a given service.
This concept usually leads to the basic idea of QoS, to distinguish traffic into differenttypes, features,demands to the networks, and to be delivered to the customers on differentcharges.
Consequently, certain QoS mechanisms must be implemented to provide/ensure theE2E QoS features of applications matching their traffic type. We distinguish two maincategories of mechanisms, QoS provision mechanisms and QoS control mechanisms [1],depending on whether it work before a traffic flow start or during the traffic flow passingthrough the communication network:
• QoS provision mechanisms include parameters mapping, admission and resourcereservations schemes.
• QoS control mechanisms consist of traffic shaping, scheduling, policing and con-trol mechanisms.
From application point of view, E2E QoS requirements have to be identified in measur-able QoS metrics, which are delay, jitter, loss rate and throughput.[3GPP 1999a]
Delay It is the elapsed time for a packet to traverse the network from the source to thedestination. At the network layer, the end-to-end packet latency is the sum ofprocessing delay, transmission delay, queuing delay and propagation delay.
14
1.3. PROBLEM STATEMENT
Jitter It is defined as the variation in delay encountered by similar packets followingthe same route through the network. The jitter requirement only affects real-timestreaming applications because QoS requirement arises from the continuous trafficcharacteristics of these class. Jitter is generally included as a performance param-eter. since it is very important at the transport layer in packet data systems, due tothe inherent variability in arrival times of individual packets. Services intolerant ofdelay variation will usually try to reduce the delay variation by means of buffer-ing. However, delayed data arrivals make data useless, resulting in receiver bufferunderflow. Early arrival can lead to receiver buffer overflow.
Loss Rate Loss rate refers to the percentage of data loss among all the delivered datain a given transmission time interval, which can be evaluated in frame level orpacket level. Loss rate requirements apply to all classes of applications. The real-time applications might tolerate a limited amount of data loss, depending on theerror resiliency of the decoder, and the type of application whereas non-realtime(NRT)applications typically have much more strict requirement on dataloss.
Throughput It can be defined as the rate at which packets are transmitted in a network.It can be expressed as a peak rate or an average rate.
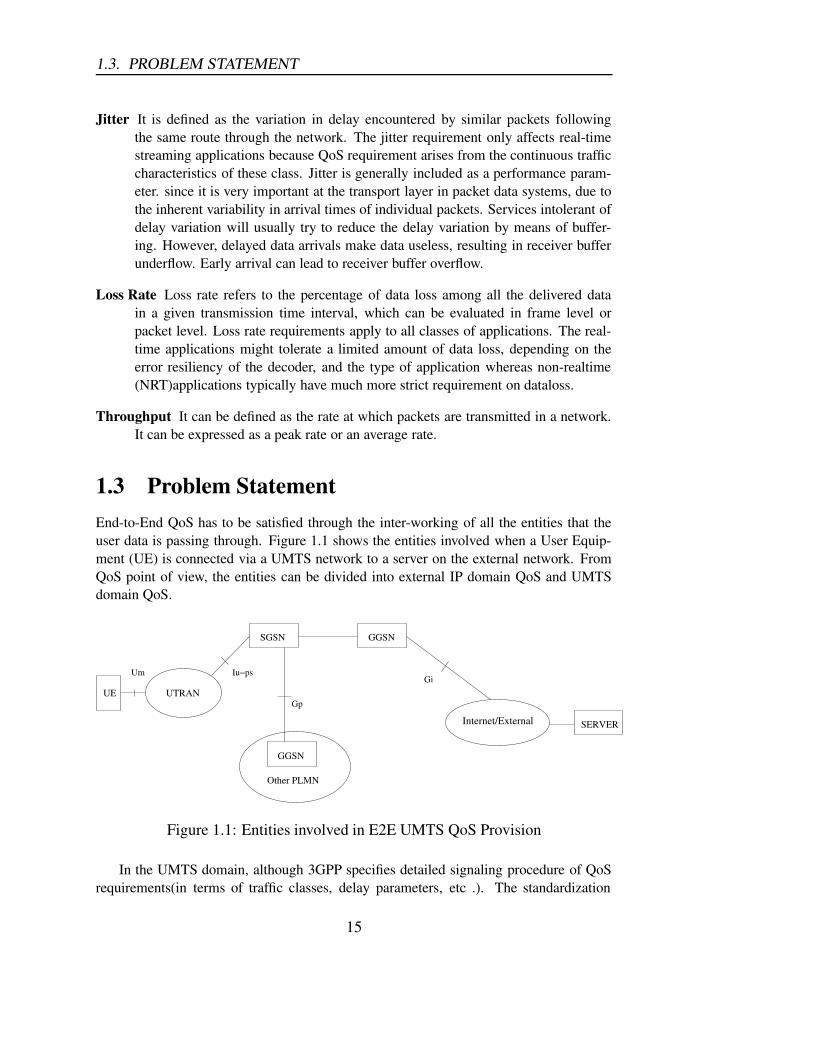
1.3 Problem StatementEnd-to-End QoS has to be satisfied through the inter-working of all the entities that theuser data is passing through. Figure 1.1 shows the entities involved when a User Equip-ment (UE) is connected via a UMTS network to a server on the external network. FromQoS point of view, the entities can be divided into external IP domain QoS and UMTSdomain QoS.
Internet/External
UE UTRAN
GGSN
GGSN
SERVER
SGSN
Um Iu−psGi
Gp
Other PLMN
Figure 1.1: Entities involved in E2E UMTS QoS Provision
In the UMTS domain, although 3GPP specifies detailed signaling procedure of QoSrequirements(in terms of traffic classes, delay parameters, etc .). The standardization
15
CHAPTER 1. INTRODUCTION
does not provide the mechanisms to support QoS during user-data transfer: QoS parame-ters need to be mapped to appropriate Radio Resource Management (RRM) strategies inUMTS Terrestrial Radio Access Network (UTRAN) and IP-layer transport mechanismsin the Core Network (CN).
In the IP domain, there are some well-known mechanisms for QoS provisioning, such asDifferentiated Services(Diffserv)[2] and Integrated Services (InterServ)[3].The utilizationof these mechanisms in the UMTS architecture is still an open issue.
The first goal of the project is to identify the mechanisms relevant for QoS provisioningin the full E2E transmission chain, both in UMTS network side and in external IP networkside. Potential investigation scenarios focuse on one or more of the following aspects:
• QoS provisioning in UTRAN via RRM.
• QoS provisioning in the IP based UMTS Core Network, including Gateway GPRSSupport Node (GGSN) and Serving GPRS Support Node (SGSN) and/or the routersin UMTS IP backbone.
• QoS mapping between UMTS network and external IP network (Internet).
Once specific investigation aspects are identified, new QoS provisioning algorithm willbe proposed and implemented in simulation tool to evaluate its performance.
1.4 Chapter OrganizationThe report is organized as follows. The first chapter explain the motivation and basicconcepts as well as problems in this project. Chapters 2, 3 and 4 review the main char-acteristics of UMTS network, UMTS QoS and IP QoS, as the background to understandthe problem. Chapter 5 analyzes some related projects, their contribution and drawbacks.Chapter 6 delimit the investigation scenarios of this project based on the analysis of Chap-ter 5 and also the features of the simulation tool.furthermore, a new E2E QoS provision-ing algorithm of UMTS is proposed in Chapter 7, and the implementation is described inChapter 8 and the simulation result is analyzed in Chapter 8. Finally, conclusion are givenin Chapter 9.
16

Chapter 2
Overview of UMTS
3G Systems are intended to provide a global mobility with wide range of services includ-ing telephony, paging, messaging, Internet and broadband data. International Telecom-munication Union (ITU) started the process of defining the standard for third generationsystems, referred to as International Mobile Telecommunications 2000 (IMT-2000). InEurope, European Telecommunications Standards Institute (ETSI) and later the ThirdGeneration Partnership Project (3GPP) was responsible for Universal Mobile Telecom-munications System (UMTS) standardization process.
2.1 UMTS ServicesUMTS offers traditional tele-services (such as circuit-switched voice or Short messageservice (SMS)) and bearer services. It is possible to negotiate and renegotiate the charac-teristics of a bearer service at session or connection setup stage as well as during ongoingsession or connection.
Bearer services have different QoS parameters for maximum transfer delay, delay vari-ation and bit error rate. Offered data rate targets are:
• 144 kbits/s satellite and rural outdoor
• 384 kbits/s urban outdoor
• 2048 kbits/s indoor and low range outdoor
UMTS network services with different QoS classes were divided into four types of traffic:
• Conversational class (voice, video telephony, video gaming)
• Streaming class (multimedia, video on demand, webcast)
• Interactive class (web browsing, network gaming, database access)
• Background class (email,Multimedia Message Services (MMS), file downloading)
17

CHAPTER 2. OVERVIEW OF UMTS
2.2 UMTS Architecture
A UMTS network consist of three interacting domains such as Core Network (CN),UMTS Terrestrial Radio Access Network (UTRAN) and User Equipment (UE) [7]. Themain function of core network is to provide switching, routing and transit for user traf-fic. Core network also contains the databases and network management functions. TheUTRAN provides the air interface access method for User Equipment. Figure 2.1 depicts
Figure 2.1: UMTS Network Architecture in Release 99
the overall architecture of UMTS network, which includes both the UMTS and GlobalSystem for Mobile Communication (GSM) network entities. The UTRAN is evolution-ary new for UMTS, while the CN can be seen as a smooth evolution from GSM CN. Thefollowing subsection will describe the UMTS specific parts in this architecture.
2.2.1 User Equipment
User equipment is the equipment used by the user to access UMTS Services. It is madeup of two parts: the UMTS Subscriber Identity Module(USIM) and User Equipment(UE).USIM is a modular IC-card that stores the identity of the subscriber (user), operator andservice provider and user service profile. UE is the radio terminal(the mobile phone) forradio communication via the Uu interface.
18

2.2. UMTS ARCHITECTURE
2.2.2 UTRANIn UTRAN, Wideband Code Division Multiple Access(WCDMA) technology was se-lected for radio access, which supports a transmission rate theoretically up to 2Mbit/s(realistic up to about 300kb/s). UMTS WCDMA is a Direct Sequence CDMA system.WCDMA has two basic modes of operation: Frequency Division Duplex (FDD) and TimeDivision Duplex (TDD). As in Figure 2.2, the UTRAN physical entities are made up of
Figure 2.2: UMTS Radio Access Network(UTRAN) Architecture [8]
two entities: Node-B and Radio Network Controller(RNC).
Node-B
A Node B is a logical node responsible for radio transmission / reception in one or morecells to/from the User Equipment. In UTRAN, it terminates the Iub interface towardsthe Radio Network Controller (RNC)[9].It performs Modulation/Demodulation, CDMAPhysical Channel coding,Forward Error Correction(FEC), Closed loop power control, andRRM etc.
RNC
A RNC controls the usage and the integrity of the radio resources[9]. It controls one ormore Node B and act as a access point between UTRAN and CN. Its functions are RadioResource Control, Admission Control, Channel Allocation, Handover Control, BroadcastSignalling, Open Loop Power Control, etc.
2.2.3 Core Network (CN)The CN architecture is based on GSM network with GPRS. All equipment has to be mod-ified for UMTS operation and services. The CN is divided in circuit switched (CS) and
19

CHAPTER 2. OVERVIEW OF UMTS
packet switched (PS) domains. Some of the circuit switched elements are Mobile servicesSwitching Center (MSC), Visitor location register (VLR) and Gateway MSC(GMSC).Packet switched elements are Serving GPRS Support Node (SGSN) and Gateway GPRSSupport Node (GGSN). Some network elements, like Equipment Identification Register(EIR),Home Location Register (HLR), and Authentication Center (AUC) are shared byboth domains.
MSC and GMSC
The MSC is a switching node that supports circuit-switched connections, user mobilityand handover procedures. GMSC is a special MSC ,which serves as an interface to variousexternal networks, i.e., the Integrated Services Digital Network (ISDN). The MSC is thecentral network entity of the CS domain.[10]
HLR and VLR
The Home Location Register (HLR) is a database in the user’s home system which keepsall the user profile, e.g., roaming areas, allowed services, authentication keys.The VLRis a database similar to HLR which locate the network a user is currently operating.Theinformation in VLR is updated as soon as a user changes location area.
SGSN and GGSN
The SGSN carries out routing function in PS domain and manages the authentication andcurrent user position, like MSC/VLR in CS domain. GGSN offers interfaces to externalPS networks like the Internet.
According to 3GPP R5 specification, IP will be the main protocol for transporting userpackets inside the PS core network. However, user packets are not directly routed via IProuting protocol but based on GPRS Tunneling Protocol(GTP).
2.2.4 InterfacesAn interface refers to the connection between different network entities. In this projectthe most relevant UMTS interfaces are:
• Uu: Termed as Uu reference point (UMTS radio interface).It is used as an interfacebetween the user equipment and the UMTS network.
• IuB: An interface in between Node-B and RNC.
• Iu: This interface connect UTRAN and Core Network. There are two types of Iu,Iu PS for connecting to PS domain and Iu CS connecting to CS domain.
• Gn: This one between SGSN and GGSN.
20
2.3. UMTS PROTOCOL STACK
• Gi: Gi is used to interface GGSN with external packet switched network (Internet).
2.3 UMTS protocol stackThe protocols over Uu and Iu interfaces are divided into two structures [11]:
1. User plane protocols: The user plane consists of a layered protocol structure pro-viding user information transfer, along with associated information transfer controlprocedures (e.g. flow control, error detection, error correction and error recovery).
2. Control plane protocols: The control plane consists of protocols for control andsupport of the user plane functions, including requesting the service, controllingdifferent transmission resources, handover, etc.
In the following, we briefly explain these two protocol structures.
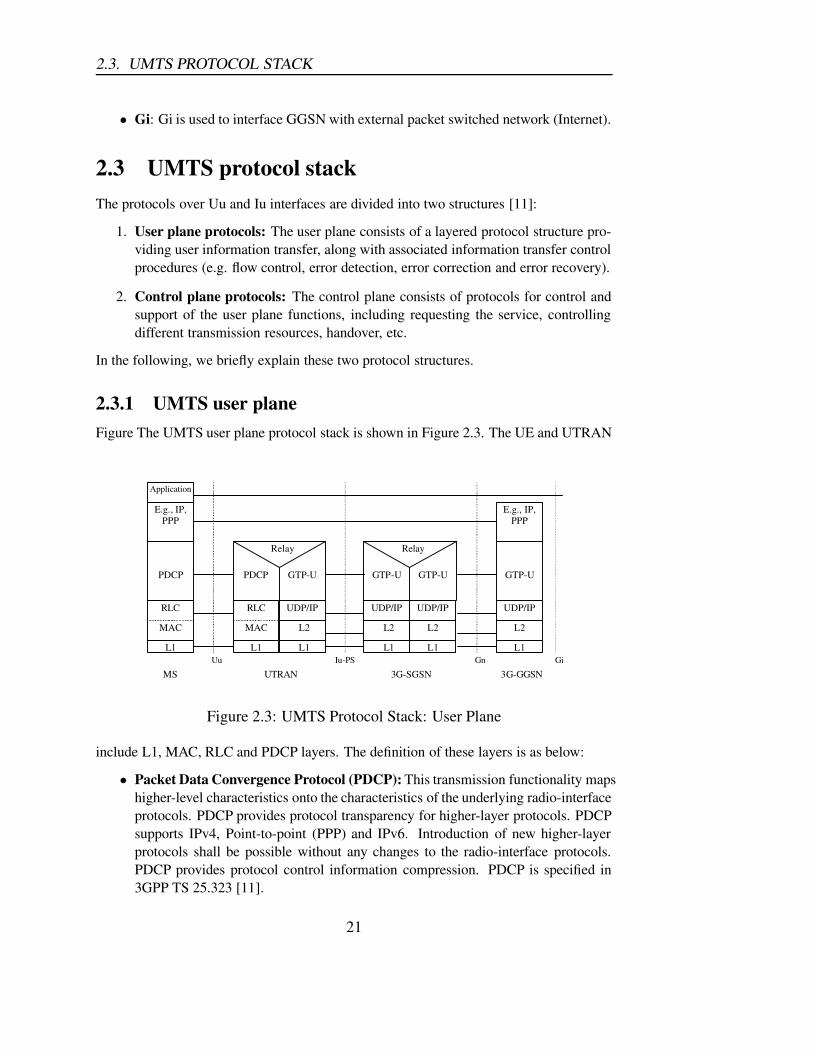
2.3.1 UMTS user planeFigure The UMTS user plane protocol stack is shown in Figure 2.3. The UE and UTRAN
L1
RLC
PDCP
MAC
E.g., IP,PPP
Application
L1
RLC
PDCP
MAC
L1
UDP/IP
GTP-U
L2
Relay
L1
UDP/IP
L2
GTP-U
E.g., IP,PPP
3G-SGSNUTRANMSIu-PSUu Gn Gi
3G-GGSN
L1
UDP/IP
GTP-U
L2
L1
UDP/IP
GTP-U
L2
Relay
Figure 2.3: UMTS Protocol Stack: User Plane
include L1, MAC, RLC and PDCP layers. The definition of these layers is as below:
• Packet Data Convergence Protocol (PDCP): This transmission functionality mapshigher-level characteristics onto the characteristics of the underlying radio-interfaceprotocols. PDCP provides protocol transparency for higher-layer protocols. PDCPsupports IPv4, Point-to-point (PPP) and IPv6. Introduction of new higher-layerprotocols shall be possible without any changes to the radio-interface protocols.PDCP provides protocol control information compression. PDCP is specified in3GPP TS 25.323 [11].
21

CHAPTER 2. OVERVIEW OF UMTS
• Radio Link Control (RLC): The RLC protocol provides logical link control overthe radio interface. There may be several simultaneous RLC links per MS. Eachlink is identified by a Bearer Id. RLC is defined in 3GPP TS 25.322 [11].
• Medium Access Control (MAC): The MAC protocol controls the access sig-nalling (request and grant) procedures for the radio channel. MAC is specifiedin 3GPP TS 25.321.
• Physical layer (PHY or L1): The physical layer offers information transfer ser-vices to MAC and higher layers.
UTRAN, SGSN and GGSN include the following layers:
• GPRS Tunnelling Protocol for the user plane (GTP-U): This protocol tunnelsuser data between UTRAN and the SGSN, and between the SGSN and the GGSNin the core network. GTP encapsulates all PDP Protocol Data Units (PDU). TheGTP is specified in 3GPP TS 29.060
• User Datagram Protocol/Internet Protocol (UDP/IP): These are the backbonenetwork protocols used for routing user data and control signalling.
2.3.2 UMTS control planeThe UMTS control plane is illustrated in Figure 2.4. The control plane consists of the
RLC
RRC
L1
GMM /SM / SMS
RRC
MAC
L1
RANAP
L2
Relay
L1
L2
SGSNRNSMSIu-PsUu
RLC
SCCP
SignallingBearer
MAC
L1
SignallingBearer
RANAP
SCCP
GMM /SM / SMS
Figure 2.4: UMTS Protocol Stack: Control Plane
following layers:
• UMTS Mobility Management and Session Management (GMM/SM): GMM sup-ports mobility management functionality such as attach, detach, security, and rout-ing area update and SM supports PDP context activation and PDP context deacti-vation.
22
2.4. UMTS AIR INTERFACE
• Short Message Service (SMS) supports the mobile-originated and mobile-terminatedshort message service.
• Radio Resource Control (RRC) : This a signalling protocol for the control andconfiguration of the radio interface.
• The RLC protocol offers logical link control over the radio interface for the trans-mission of higher layer-signalling messages and SMS.
• The MAC protocol controls the access signalling (request and grant) proceduresfor the radio channel.
• The physical layer offers information transfer services to MAC and higher layers.
• Radio Access Network Application Protocol (RANAP): This protocol encapsu-lates and carries higher-layer signalling, handles signalling between the SGSN andUTRAN, and manages the GTP connections on the Iu interface.
2.4 UMTS Air InterfaceUMTS air interface issues are described more specifically in this section because they arehighly relevant with most UMTS simulation implementations.The more general elementsin the previous two sections can often been simplified.
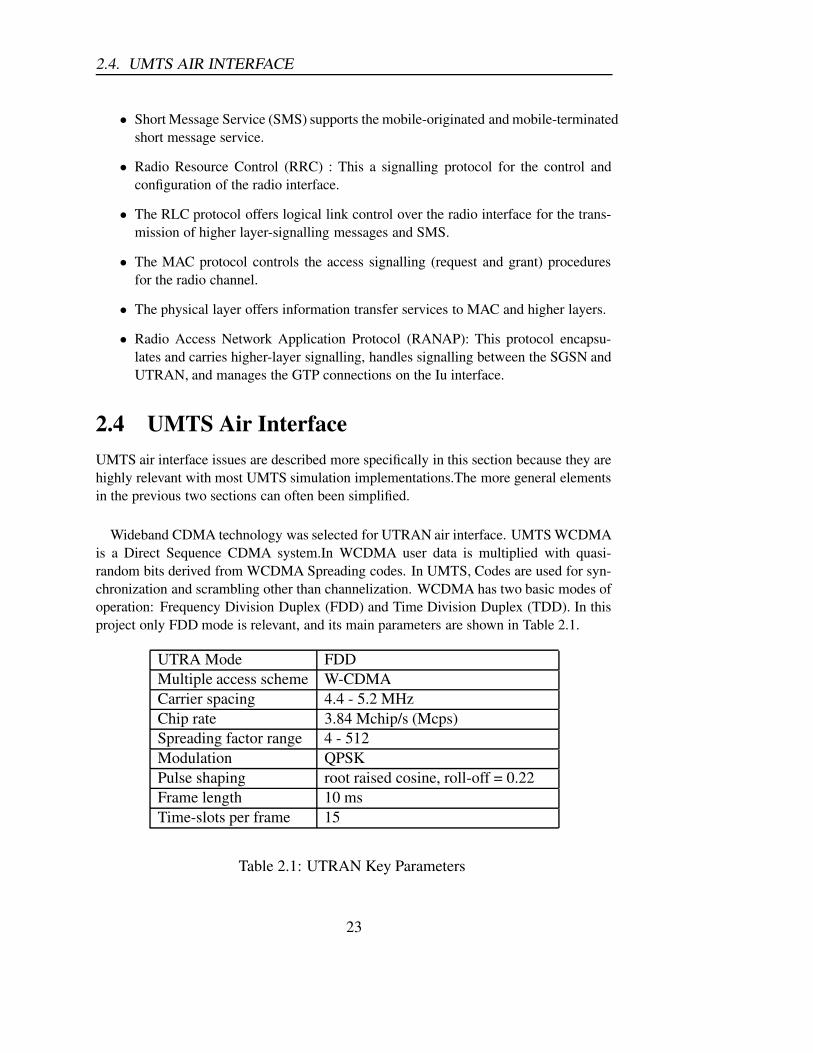
Wideband CDMA technology was selected for UTRAN air interface. UMTS WCDMAis a Direct Sequence CDMA system.In WCDMA user data is multiplied with quasi-random bits derived from WCDMA Spreading codes. In UMTS, Codes are used for syn-chronization and scrambling other than channelization. WCDMA has two basic modes ofoperation: Frequency Division Duplex (FDD) and Time Division Duplex (TDD). In thisproject only FDD mode is relevant, and its main parameters are shown in Table 2.1.
UTRA Mode FDDMultiple access scheme W-CDMACarrier spacing 4.4 - 5.2 MHzChip rate 3.84 Mchip/s (Mcps)Spreading factor range 4 - 512Modulation QPSKPulse shaping root raised cosine, roll-off = 0.22Frame length 10 msTime-slots per frame 15
Table 2.1: UTRAN Key Parameters
23
CHAPTER 2. OVERVIEW OF UMTS
2.4.1 The Physical layerThe physical layer (PHY) is implemented in Node B within the UTRAN. It directly han-dles the transmission of data over radio. Its tasks related to the air interface include:[10]
• Provisioning of transport channels;
• Mapping of transport channels to physical channels;
• Macro diversity, soft handover(RNC);
• Error protection(FEC, interleaving);
• (De-)Multiplexing of Coded Composite Transport Channels (CCTrCH);
• Synchronization (frequency and time) and power control;
• Measurement of FER, SIR, interference power etc.
The physical layer is controlled by RRC sub-layer. For example, the level of error protec-tion via Forward Error Correction (FEC) can be configured by RRC.The physical layerPHY also report the calculated Frame Error Rate (FER), the Signal to Interference Ra-tio (SIR) and the measured interference power. The RRC decide the required parametersaccording to the reported situation.
2.4.2 The MAC layerThe MAC layer coordinates access to the physical medium for data transmission. MAClayer places different data streams to be transmitted in queues, handles priorities/scheduleaccording to the QoS negotiated at connection set-up stage. MAC layer is also associ-ated with RRC sublayer and receive configuration instructions from it. Tasks of MAC isconcluded as follow: [10]
• Provisioning of logical channels
• Mapping of logical channels to transport channels
• Selection of appropriate transport formats
• Priority handling/scheduling
• Monitoring of the traffic volume
• Ciphering (for transparent RLC mode)
• No segmentation of data!
The RLC layer delivers the data to MAC layer over logical channels. A logical channeldescribe which type of data should be transmitted. The MAC layer maps these logicalchannels to transport channels that represent the interface to the physical layer. The MAClayer thus take charge of multiplexing of several parallel data streams from the logicalchannels to the transport channels.
24
2.4. UMTS AIR INTERFACE
2.4.3 RLC layerRLC is a sub layer of data link layer. The purpose is to protect data streams from errorscaused by radio propagation. To achieve data protection, the RLC make segmentationand reassembly of higher-layer Service Data Units (SDU) into/from smaller RLC payloadunits (called Protocol Data Unit, PDU).It manage retransmission for the error PDUs. Thefollowing mode are configured in RLC layer:
Transparent Mode (TM) The RLC doesn’t add a protocol header and erroneous packetsare dropped or marked (no error protection). TM is suitable for error-tolerant butdelay sensitive data, such as video and audio.
Unacknowledged Mode (UM) There are no error correction either, but RLC doesn’t adda sequence number and can ensure the uniqueness of the transmitted data. Segmen-tation and reassembly is done by adding a header to RLC PDUs. The packets areencrypted.
Acknowledged Mode (AM) The Automatic Repeat Request (ARQ) mechanism is usedto protect the RLC PDU. The protection level and the delay performance of theRLC can be configured by the RRC. It can be done by changing the maximumretransmissions number. The packets are encrypted.
2.4.4 RRC layerThe Radio Resource Control (RRC) sublayer is in the control phane in layer 3, its mainfunctions include:
• broadcast of system information
• set-up and management of Radio Bearers
• mobility management: location management and handover
• configuration of lower layers
• collection of measurements from lower layers
2.4.5 Transport channelsIn UTRA FDD mode, there are logical channels, which are mapped to transport channels,and they are again mapped to physical channels. Logical to Transport channel conversionhappens in Medium Access Control (MAC) layer. The transport channels relevant tosimulation are:
• Forward Access Channel (FACH)FACH is used as down-link Common Packet Channel.
25

CHAPTER 2. OVERVIEW OF UMTS
• Random Access Channel (RACH)RACH is used for up-link rapid access and transfer of short and small packets.
• Dedicated Channel (DCH)The normal data and signalling of a user takes place over the DCH.
2.5 Packet Data Protocol (PDP) ContextThe Packet Data Protocol (PDP) context is a data structure present in both the SGSN andthe GGSN which contains the subscriber’s session information during subscriber activesession. A Mobile needs to acquire and configure itself with a PDP address (i.e. an IPAddress when the PDP is IP). Mobile may use single or multiple PDP addresses simul-taneously as per requirement. A PDP context must be established (to get PDP address)and activated in the Packet Switched (PS) Core Network (CN) domain and on the mobile,before any user packets destined to or originated from a PDP address can be transportedover a 3GPP PS core network.[12]
A PDP context is maintained and used by network nodes to determine the path foruser packets destined or originated from a particular PDP address. The PDP contextmaintained by a mobile, an SGSN, and a GGSN link.The Radio Access Bearers (RABs)and a CN Bearer form a 3GPP Bearer for the mobile.
A PDP context maintained on the SGSN and the GGSN carry the following usefulinformation.
• PDP address used by the mobile to and receive PDP Packets.
• Routing Information used by the network node to determine where to forward auser packet such as identifier (established between SGSN and GGSN for this PDPcontext), Access Point Name (APN). APN is a logical name used by SGSN todetermine which GGSN is suitable for a mobile and determination of the servicerequest by user or address of an access point in an external packet network to whichuser packet should be forwarded by GGSN.
• Quality of Service (QoS) Profile:
1. QoS Profile Subscribed: describe QoS characteristic subscribed by mobileuser.
2. QoS profile Requested: Describe QoS characteristic currently requested bymobile user.
3. QoS profile negotiated; QoS actually provided by the network to the mobileat the current time.
26

2.5. PACKET DATA PROTOCOL (PDP) CONTEXT
2.5.1 PDP context states
Figure 2.5: PDP Context State Transition
PDP context can be divided into two different state namely ACTIVE and INACTIVEstates as shown in Figure 2.5. ACTIVE state contains upto date information for forward-ing PDP context between the mobile and the GGSN. Active state doesn’t guarantee theRAB establishment over the RAN to transport user packet. RABs may be established onlywhen mobile has a user packet to send to the network or the network user packet for themobile.
In PDP INACTIVE state may contain a valid PDP address but not valid routing, map-ping information needed to determine how to process packets. If GGSN send a userpackets to a mobile but the PDP context for the destination PDP address is in INACTIVEstate, the GGSN may use network requested PDP context activation procedure to changethe PDP context of the destination mobile to ACTIVE state.
2.5.2 PDP context proceduresPDP context is used for user data session management. These session management pro-cedures include:
• PDP context activation, in which PDP address, QoS profile are set.
• PDP context modification, in which QoS profile is modified.
• PDP context deactivation, in which packet data session is released.
A GPRS-attached (GPRS, this terminology is still used by 3GPP to call the packet domainof UMTS CN) MS can initiate the activation, modification, and deactivation functions atany time for a PDP context in the MS, the SGSN, and the GGSN. A GGSN may requestthe activation of a PDP context to a GPRS-attached subscriber. A GGSN may initiate the
27

CHAPTER 2. OVERVIEW OF UMTS
deactivation of a PDP context. The details of these procedures will be explained in thefollowing chapter concern UMTS QoS management issues.
28
Chapter 3
UMTS QoS
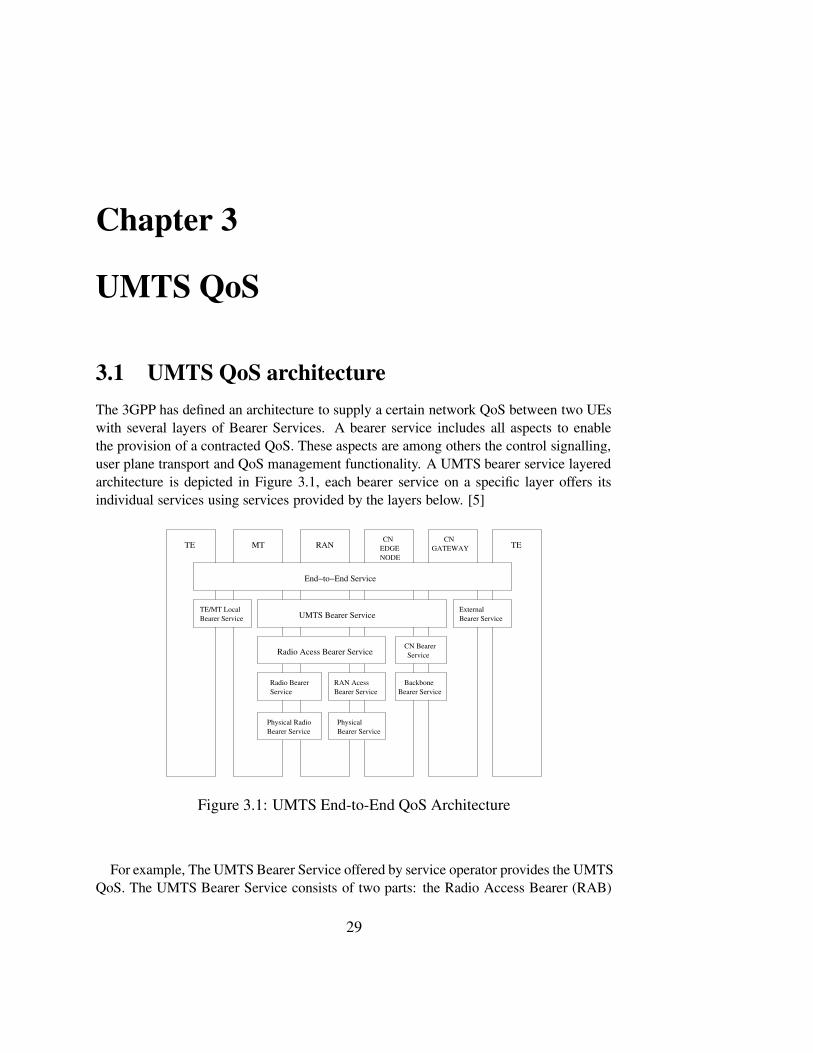
3.1 UMTS QoS architectureThe 3GPP has defined an architecture to supply a certain network QoS between two UEswith several layers of Bearer Services. A bearer service includes all aspects to enablethe provision of a contracted QoS. These aspects are among others the control signalling,user plane transport and QoS management functionality. A UMTS bearer service layeredarchitecture is depicted in Figure 3.1, each bearer service on a specific layer offers itsindividual services using services provided by the layers below. [5]
TE TEMT RAN EDGENODE
GATEWAYCNCN
End−to−End Service
UMTS Bearer Service
Radio Acess Bearer Service ServiceCN Bearer
BackboneBearer Service
Radio BearerService
RAN AcessBearer Service
Physical RadioBearer Service Bearer Service
Physical
TE/MT Local Bearer Service
ExternalBearer Service
Figure 3.1: UMTS End-to-End QoS Architecture
For example, The UMTS Bearer Service offered by service operator provides the UMTSQoS. The UMTS Bearer Service consists of two parts: the Radio Access Bearer (RAB)
29

CHAPTER 3. UMTS QOS
Service for the cellular wireless network, and the Core Network (CN) Bearer Service forthe backbone network.
The RAB service provides confidential transport of signalling and user data betweenUE and its corresponding SGSN with the QoS adequate to the negotiated UMTS bearerservice or with the default QoS for signalling. This service is based on the characteristicsof radio interface and is maintained for a moving UE. The radio access bearer service isrealized by a Radio Bearer Service and an Iu Bearer Service. The role of the radio bearerservice is to cover all the aspects of the radio interface transport. This bearer service usesthe UTRA FDD/TDD mechanism. The Iu bearer service provides the transport betweenUTRAN and CN. The Iu bearer services for packet traffic shall provide different bearerservices for a variety of QoS.
The core network bearer service of the UMTS core network connects the SGSN withthe GGSN. The role of this service is to efficiently control and utilize the core networkin order to provide the contracted UMTS bearer service. The UMTS packet core networkshall support different bearer services for a variety of QoS mechanisms. The CN bearerservice uses a generic Layer1/Layer2 functionality in order to fulfil the QoS requirementsof the core network bearer service. These layers are not specific to UMTS ,may reuse anexisting standard and is selected according to operator’s choice.
The Bearer Service (BS) concept is important for this project,it allows to divide the E2EQoS problem into a set of sub-problems concerning the QoS provision inside a specificBearer Service and the QoS profile mapping among them(between two BSs in the sameplane or between an upper layer and a lower layer).
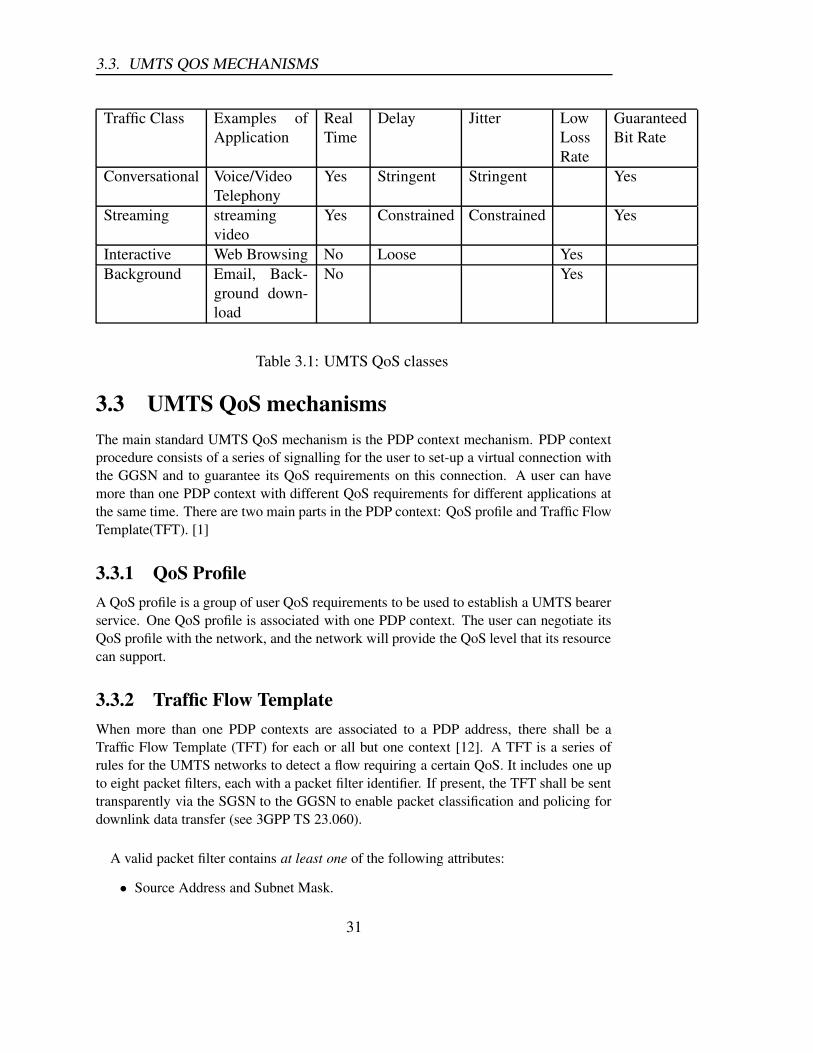
3.2 UMTS QoS classesThe UMTS network classify user data flows according to their QoS requirements. Theflows that have similar QoS requirements are aggregated together by the network. The3GPP defined four classes as shown in Table 3.1 . Each class is characterized by de-lay, delay jitter, loss rate and throughput requirements. The main distinguishing factorsbetween the classes are delay sensitivity and loss rate sensitivity. A QoS class is charac-terized by a set of measurable network parameters values. A specific set of parameters isdefined for each bearer service,i.e., the UMTS bearer service has the following attributes:
30
3.3. UMTS QOS MECHANISMS
Traffic Class Examples ofApplication
RealTime
Delay Jitter LowLossRate
GuaranteedBit Rate
Conversational Voice/VideoTelephony
Yes Stringent Stringent Yes
Streaming streamingvideo
Yes Constrained Constrained Yes
Interactive Web Browsing No Loose YesBackground Email, Back-
ground down-load
No Yes
Table 3.1: UMTS QoS classes
3.3 UMTS QoS mechanismsThe main standard UMTS QoS mechanism is the PDP context mechanism. PDP contextprocedure consists of a series of signalling for the user to set-up a virtual connection withthe GGSN and to guarantee its QoS requirements on this connection. A user can havemore than one PDP context with different QoS requirements for different applications atthe same time. There are two main parts in the PDP context: QoS profile and Traffic FlowTemplate(TFT). [1]
3.3.1 QoS ProfileA QoS profile is a group of user QoS requirements to be used to establish a UMTS bearerservice. One QoS profile is associated with one PDP context. The user can negotiate itsQoS profile with the network, and the network will provide the QoS level that its resourcecan support.
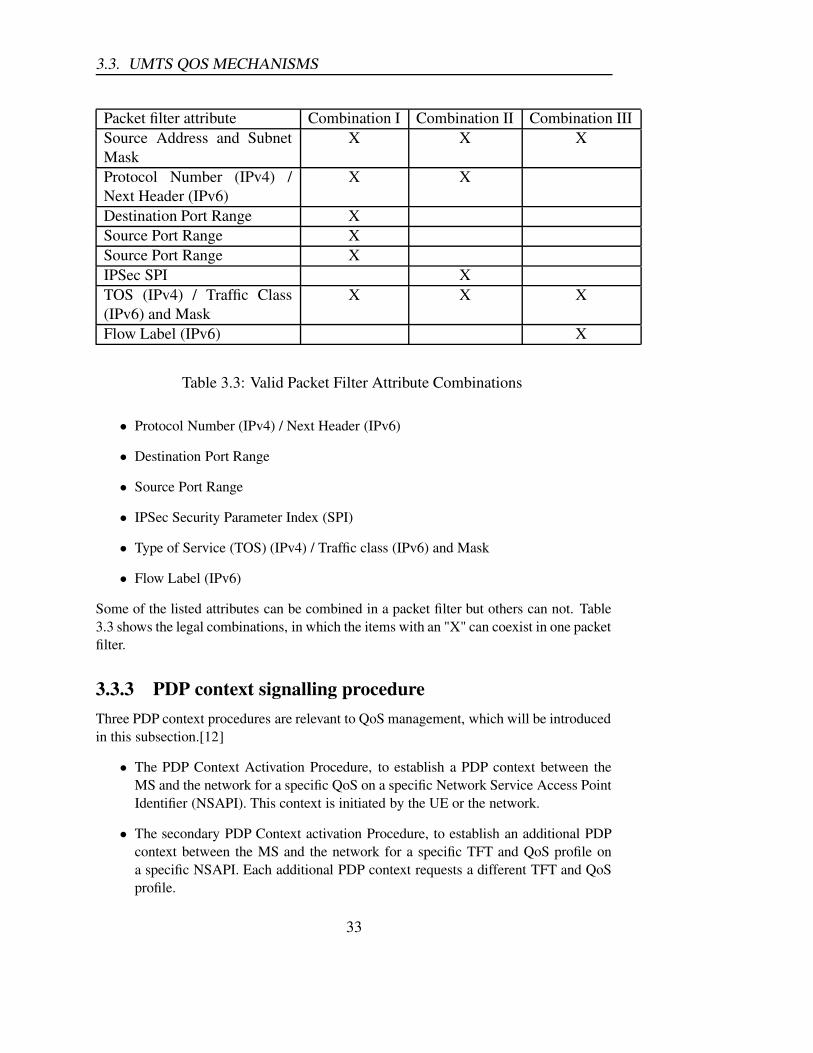
3.3.2 Traffic Flow TemplateWhen more than one PDP contexts are associated to a PDP address, there shall be aTraffic Flow Template (TFT) for each or all but one context [12]. A TFT is a series ofrules for the UMTS networks to detect a flow requiring a certain QoS. It includes one upto eight packet filters, each with a packet filter identifier. If present, the TFT shall be senttransparently via the SGSN to the GGSN to enable packet classification and policing fordownlink data transfer (see 3GPP TS 23.060).
A valid packet filter contains at least one of the following attributes:
• Source Address and Subnet Mask.
31

CHAPTER 3. UMTS QOS
Trafficclass
Conversational Streaming Interactive Background
Maximumbit-rate(kbps)
<2048 <2048 <2048- over-head
<2048-overhead
Deliveryorder
Yes/No Yes/No Yes/No Yes/No
MaximumSDU size(octets)
51500 or1502
51500 or1502
51500 or1502
51500 or1502
SDUformatinformation
X X
Delivery oferroneousSDUs
Yes/No/- Yes/No/- Yes/No/- Yes/No/-
ResidualBER
5 × 10⁻² ∼10−6
5 × 10⁻² ∼10−6
4×10⁻³ ∼ 6×10⁻⁸
4×10⁻³ ∼ 6×10⁻⁸
SDU errorratio
10−2 ∼ 10−5 10−1 ∼ 10−5 10−3 ∼ 10−6 10−3 ∼ 10−6
Transferdelay (ms)
100 (max) 250 (max)
Guaranteedbit rate(kbps)
<2048 <2048
Traffic han-dling prior-ity
1,2,3
Allocation/ Retentionpriority
1,2,3 1,2,3 1,2,3 1,2,3
Sourcestatisticsdescriptor
X X
Table 3.2: UMTS bearer attributes defined for each traffic class
32
3.3. UMTS QOS MECHANISMS
Packet filter attribute Combination I Combination II Combination IIISource Address and SubnetMask
X X X
Protocol Number (IPv4) /Next Header (IPv6)
X X
Destination Port Range XSource Port Range XSource Port Range XIPSec SPI XTOS (IPv4) / Traffic Class(IPv6) and Mask
X X X
Flow Label (IPv6) X
Table 3.3: Valid Packet Filter Attribute Combinations
• Protocol Number (IPv4) / Next Header (IPv6)
• Destination Port Range
• Source Port Range
• IPSec Security Parameter Index (SPI)
• Type of Service (TOS) (IPv4) / Traffic class (IPv6) and Mask
• Flow Label (IPv6)
Some of the listed attributes can be combined in a packet filter but others can not. Table3.3 shows the legal combinations, in which the items with an "X" can coexist in one packetfilter.
3.3.3 PDP context signalling procedureThree PDP context procedures are relevant to QoS management, which will be introducedin this subsection.[12]
• The PDP Context Activation Procedure, to establish a PDP context between theMS and the network for a specific QoS on a specific Network Service Access PointIdentifier (NSAPI). This context is initiated by the UE or the network.
• The secondary PDP Context activation Procedure, to establish an additional PDPcontext between the MS and the network for a specific TFT and QoS profile ona specific NSAPI. Each additional PDP context requests a different TFT and QoSprofile.
33

CHAPTER 3. UMTS QOS
• The PDP Context Modification Procedure, initiated by the network or the MS inorder to change the QoS or TFT for a PDP context.
The PDP Context Activation Procedure
Each PDP address may be described by one or more PDP contexts in the UE or the net-work. The PDP Context Activation procedure as shown in Figure 3.2 is used to activatethe first PDP context for a given PDP address and APN, whereas all additional contexts as-sociated to the same PDP address and APN are activated with the secondary PDP contextactivation procedure.
The PDP Context Activation Procedure will establish the first PDP context for a specificQoS on a specific Network Service Access Point Identifier (NSAPI). It can be initiated bythe UE or the network.
GGSN
9. Activate PDP Context Accept
4. Create PDP Context Response
4. Create PDP Context Request
1. Activate PDP Context Request
SGSNRANMS
5. Radio Access Bearer Setup
C1
C2
6. Invoke Trace
8. Update PDP Context Response
8. Update PDP Context Request
Figure 3.2: PDP Context Activation Procedure for UMTS [11]
1. The UE sends an Activate PDP Context Request message to the SGSN. This mes-sage contains a PDP Type, PDP Address and QoS Requested parameters amongothers. For IP external network, the PDP type and address are IP and IP address. Ifit request a dynamic PDP(IP) address, this field will be left empty.
2. The SGSN validates the Activate PDP Context Request using the information pro-vided by the UE and the PDP context subscription records. The SGSN has theright to rejects the PDP context activation request if it determined the Activate PDPContext Request is invalid. The SGSN may restrict the requested QoS attributesaccording to its capabilities, the current load, and the subscribed QoS profile.
3. The SGSN sends a Create PDP Context Request message to the affected GGSN.The message contains PDP Type, PDP Address, QoS Negotiated and ChargingCharacteristics among other parameters.
34
3.3. UMTS QOS MECHANISMS
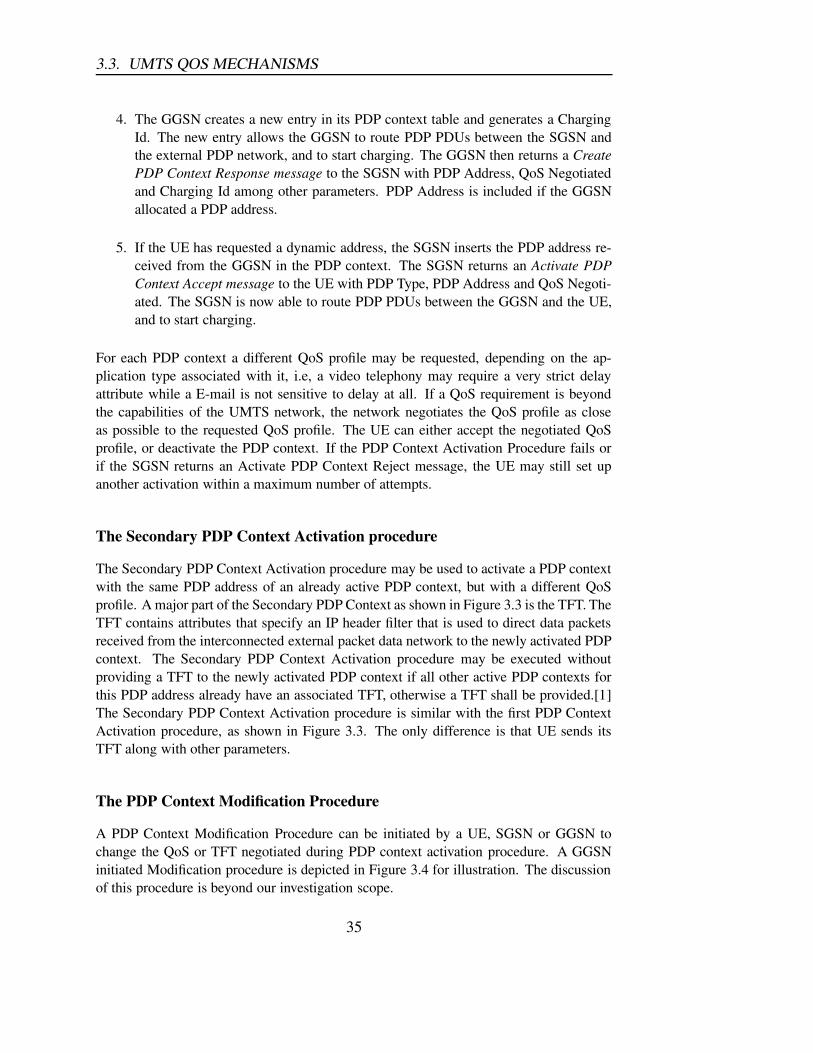
4. The GGSN creates a new entry in its PDP context table and generates a ChargingId. The new entry allows the GGSN to route PDP PDUs between the SGSN andthe external PDP network, and to start charging. The GGSN then returns a CreatePDP Context Response message to the SGSN with PDP Address, QoS Negotiatedand Charging Id among other parameters. PDP Address is included if the GGSNallocated a PDP address.
5. If the UE has requested a dynamic address, the SGSN inserts the PDP address re-ceived from the GGSN in the PDP context. The SGSN returns an Activate PDPContext Accept message to the UE with PDP Type, PDP Address and QoS Negoti-ated. The SGSN is now able to route PDP PDUs between the GGSN and the UE,and to start charging.
For each PDP context a different QoS profile may be requested, depending on the ap-plication type associated with it, i.e, a video telephony may require a very strict delayattribute while a E-mail is not sensitive to delay at all. If a QoS requirement is beyondthe capabilities of the UMTS network, the network negotiates the QoS profile as closeas possible to the requested QoS profile. The UE can either accept the negotiated QoSprofile, or deactivate the PDP context. If the PDP Context Activation Procedure fails orif the SGSN returns an Activate PDP Context Reject message, the UE may still set upanother activation within a maximum number of attempts.
The Secondary PDP Context Activation procedure
The Secondary PDP Context Activation procedure may be used to activate a PDP contextwith the same PDP address of an already active PDP context, but with a different QoSprofile. A major part of the Secondary PDP Context as shown in Figure 3.3 is the TFT. TheTFT contains attributes that specify an IP header filter that is used to direct data packetsreceived from the interconnected external packet data network to the newly activated PDPcontext. The Secondary PDP Context Activation procedure may be executed withoutproviding a TFT to the newly activated PDP context if all other active PDP contexts forthis PDP address already have an associated TFT, otherwise a TFT shall be provided.[1]The Secondary PDP Context Activation procedure is similar with the first PDP ContextActivation procedure, as shown in Figure 3.3. The only difference is that UE sends itsTFT along with other parameters.
The PDP Context Modification Procedure
A PDP Context Modification Procedure can be initiated by a UE, SGSN or GGSN tochange the QoS or TFT negotiated during PDP context activation procedure. A GGSNinitiated Modification procedure is depicted in Figure 3.4 for illustration. The discussionof this procedure is beyond our investigation scope.
35

CHAPTER 3. UMTS QOS
GGSN
7. Activate Secondary PDP Context Accept
3. Create PDP Context Response
3. Create PDP Context Request
1. Activate Secondary PDP Context Request
SGSNRANMS
4. Radio Access Bearer Setup
C1
C2
6. Update PDP Context Response
6. Update PDP Context Request
Figure 3.3: Secondary PDP Context Activation Procedure for UMTS [11]
GGSN
6. Update PDP Context Response
1. Update PDP Context Request
SGSNRANMS
4. Modify PDP Context Request
5. Modify PDP Context Accept
3. Radio Access Bearer Modification
C1
Figure 3.4: GGSN-Initiated PDP Context Modification Procedure for UMTS [11]
36
3.4. UMTS QOS MANAGEMENT ENTITIES AND MECHANISM
3.4 UMTS QoS management entities and mechanismThe UMTS QoS management entities and mechanism can be described in the followingways:
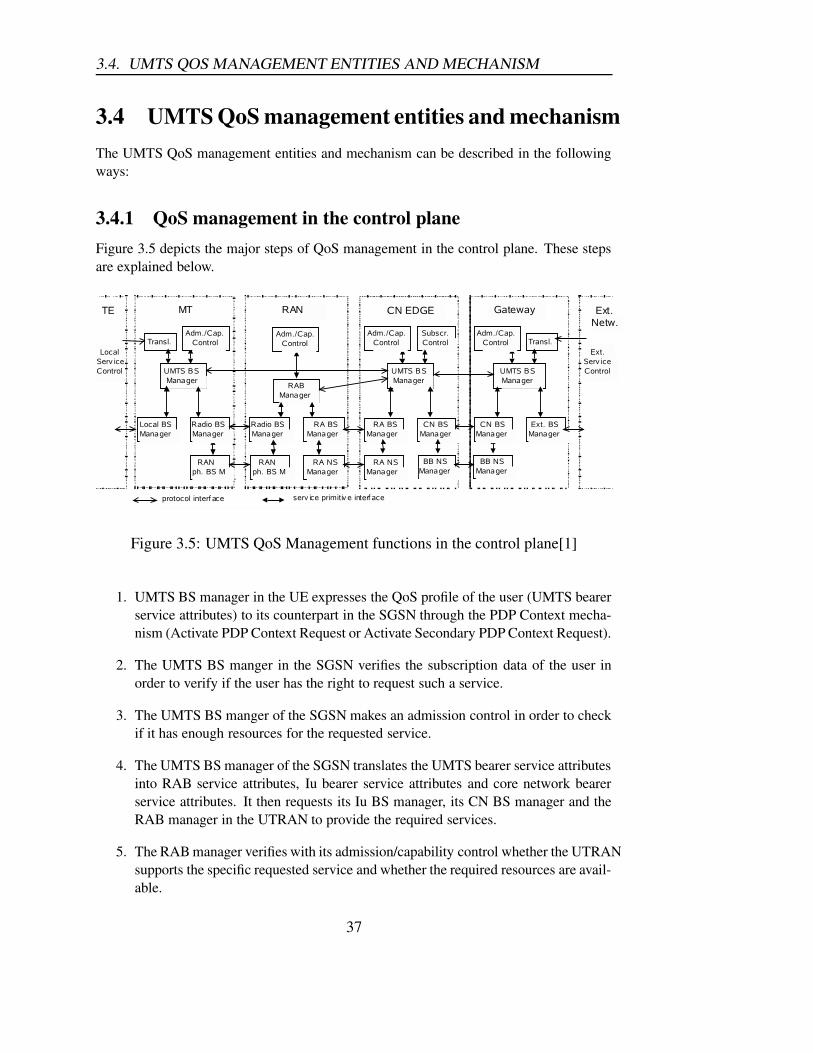
3.4.1 QoS management in the control planeFigure 3.5 depicts the major steps of QoS management in the control plane. These stepsare explained below.
Figure 3.5: UMTS QoS Management functions in the control plane[1]
1. UMTS BS manager in the UE expresses the QoS profile of the user (UMTS bearerservice attributes) to its counterpart in the SGSN through the PDP Context mecha-nism (Activate PDP Context Request or Activate Secondary PDP Context Request).
2. The UMTS BS manger in the SGSN verifies the subscription data of the user inorder to verify if the user has the right to request such a service.
3. The UMTS BS manger of the SGSN makes an admission control in order to checkif it has enough resources for the requested service.
4. The UMTS BS manager of the SGSN translates the UMTS bearer service attributesinto RAB service attributes, Iu bearer service attributes and core network bearerservice attributes. It then requests its Iu BS manager, its CN BS manager and theRAB manager in the UTRAN to provide the required services.
5. The RAB manager verifies with its admission/capability control whether the UTRANsupports the specific requested service and whether the required resources are avail-able.
37
CHAPTER 3. UMTS QOS
6. The RAB manger translates the RAB service attributes into radio bearer serviceand Iu bearer service attributes and requests the radio BS manager and the Iu BSmanager to provide bearer services with the required attributes.
7. Once the radio access bearer is successfully established, the RAB manager informsthe UMTS BS manager in the SGSN.
8. The UMTS BS manager in the SGSN speaks with its counterpart in the GGSN inorder to request the QoS requirements of the user (Create PDP Context Request).
9. The GGSN UMTS BS manager makes an admission control to verify if it hasenough resources to handle the new traffic.
10. The GGSN UMTS BS manager translates the UMTS bearer service attributes intocore network bearer service attributes and requests its core network BS manager toprovide the service.
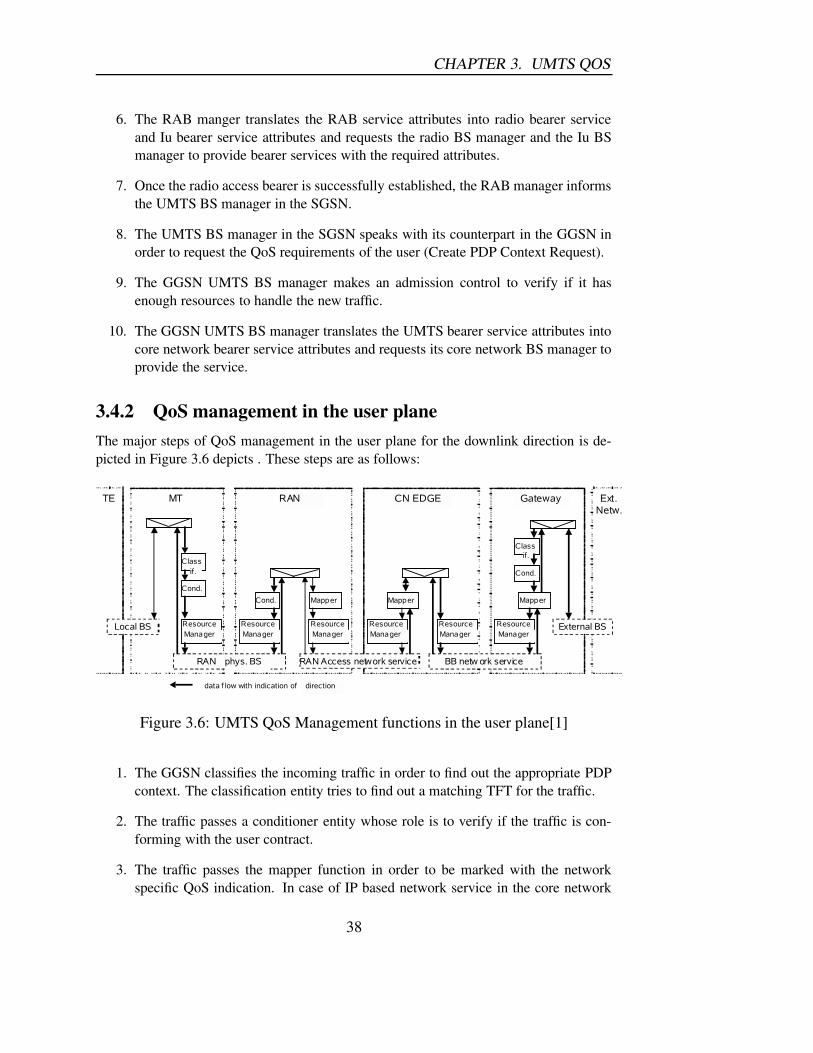
3.4.2 QoS management in the user planeThe major steps of QoS management in the user plane for the downlink direction is de-picted in Figure 3.6 depicts . These steps are as follows:
Figure 3.6: UMTS QoS Management functions in the user plane[1]
1. The GGSN classifies the incoming traffic in order to find out the appropriate PDPcontext. The classification entity tries to find out a matching TFT for the traffic.
2. The traffic passes a conditioner entity whose role is to verify if the traffic is con-forming with the user contract.
3. The traffic passes the mapper function in order to be marked with the networkspecific QoS indication. In case of IP based network service in the core network
38
3.5. CONCLUSION
and the Iu interface, this function simply marks the DS bits of the packet accordingto the local Differentiated Services policy used in these links.
4. The packet passes through the resource manager. This entity decides when thepacket can be transmitted to the next node.
3.5 ConclusionThrough the overview of the UMTS QoS specifications, we can conclude that the 3GPPhas supplied a complete group of standards for the UMTS services and their attributeson different layers of bearer services, as well as the functions/entities and the signallingprocedures to achieve these attributes, but how to achieve them was not specified. This isexactly the problem we called "UMTS QoS provisioning". Till this chapter it can be sumup in two scenarios:
• QoS provisioning on control plane:This function relates to resource reservation protocols at call set-up (Call Admis-sion Control). Call Admission control determines if the call can be accepted by thenetwork while guaranteeing the requested QoS defined by attributes in Table 3.2and for a given duration. UMTS CAC is based on the concept of equivalent band-width. Call Admission Control (CAC) is performed along the path between bothterminals throughout the network.It is also performed at lower layers ; an automaticmapping function translates representations of QoS between different layers. If theresources are available, then are reserved otherwise a lower QoS is proposed.
Key words: CAC, Mapping.
• QoS provisioning on user plane:They act on traffic flow according to requested levels of QoS. As described in theuser plane management for downlink, the mechanisms include
– GGSN specifically: classifier, conditioner, mapper/marker.
– GGSN, SGSN, UTRAN: Traffic differentiation is performed using differentqueues or buffers to maintain QoS, using classical IP Differentiated servicesmechanisms or MPLS/ATM (Multi Protocol Label Switching). This allowsflow scheduling, shaping (regulation), policing (control that the user doesn’texceeds QoS).
39
Chapter 4
IP QoS
4.1 DiffServ approachDiffServ was designed as a simple architecture of QoS which can provide E2E servicesacross different operator’s domain without using signalling process for every connec-tion.DiffServ does not need extra signalling at the IP level. All necessary QoS is alreadycontains in UMTS specific signalling message(Radio access Network Application Part,GPRS tunneling Protocol Control Plane ). The way of DiffServ to achieve this goal is touse Behavior Aggregates (BA) flows and Per-Hop-Behaviors (PHBs) [2].Individual con-nection QoS guarantee in DiffServ is not possible due to its aggregation traffic controlmechanism[4].
4.1.1 Per Hop Behaviors(PHB) and Differentiated Services CodePoint(DSCP)
The DiffServ architecture is used to classify and tag packets into a small number of classesat the edge of the network and to deploy mechanisms inside the network to treat variousclasses of packet differently. The Type Of Service (TOS) field in IPv4 can be used todefine different serving manner for different classes of packet flows, that is, PHB. TheTOS field is called as Differentiated Services field(DS).The information related to PHB iscarried within DS field and called DiffServ Code Point (DSCP), as shown in Figure 4.1.The different PHB classes within DS field and its associated packets can get a preferentialtreatment. There are a lot of mechanisms such as queueing, scheduling, and policing toimplement PHB, which are described in following two subsections. A DiffServ domainhas three main components such as:
• Bandwidth Broker (BB): The resource management, inter-domain negotiation, ad-mission control and dynamic configuration of concerned network elements to sup-port the provisioned QoS services can be controlled in DiffServ using BB withineach DS- domain.The BB in the DiffServ network is responsible for the implemen-tation of admission control and resource allocation.The agreement between the user
40
4.1. DIFFSERV APPROACH
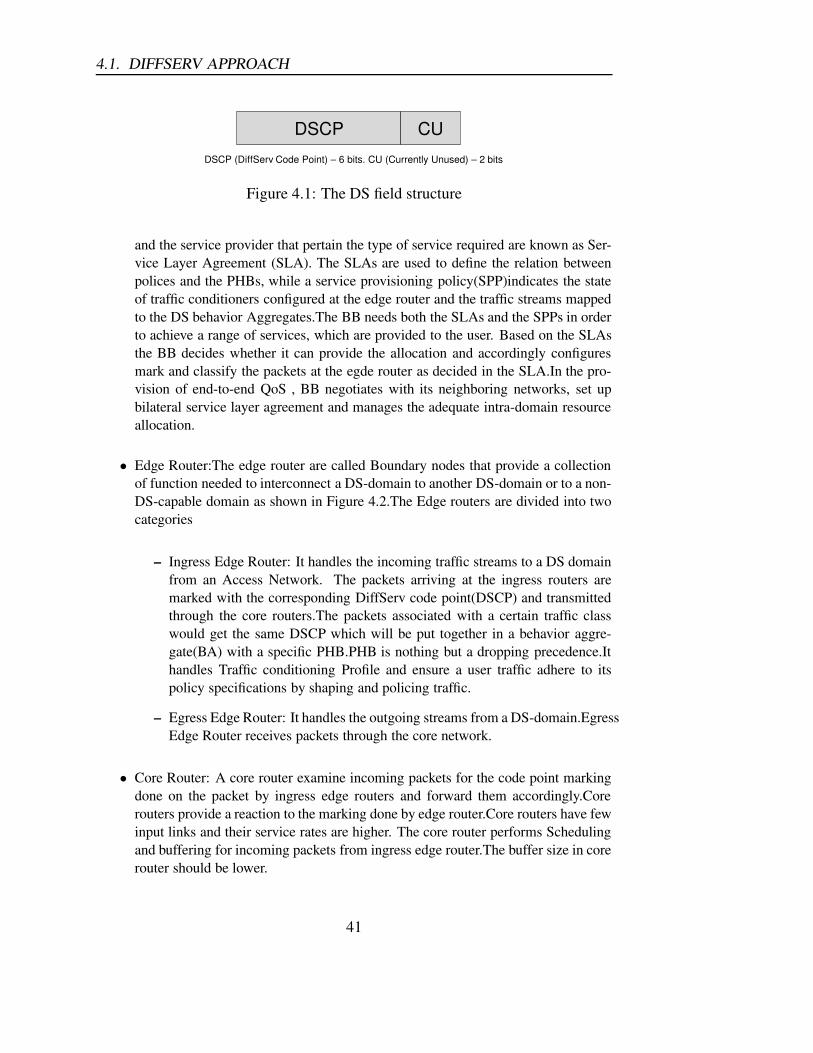
DSCP CU
DSCP (DiffServ Code Point) – 6 bits. CU (Currently Unused) – 2 bits
Figure 4.1: The DS field structure
and the service provider that pertain the type of service required are known as Ser-vice Layer Agreement (SLA). The SLAs are used to define the relation betweenpolices and the PHBs, while a service provisioning policy(SPP)indicates the stateof traffic conditioners configured at the edge router and the traffic streams mappedto the DS behavior Aggregates.The BB needs both the SLAs and the SPPs in orderto achieve a range of services, which are provided to the user. Based on the SLAsthe BB decides whether it can provide the allocation and accordingly configuresmark and classify the packets at the egde router as decided in the SLA.In the pro-vision of end-to-end QoS , BB negotiates with its neighboring networks, set upbilateral service layer agreement and manages the adequate intra-domain resourceallocation.
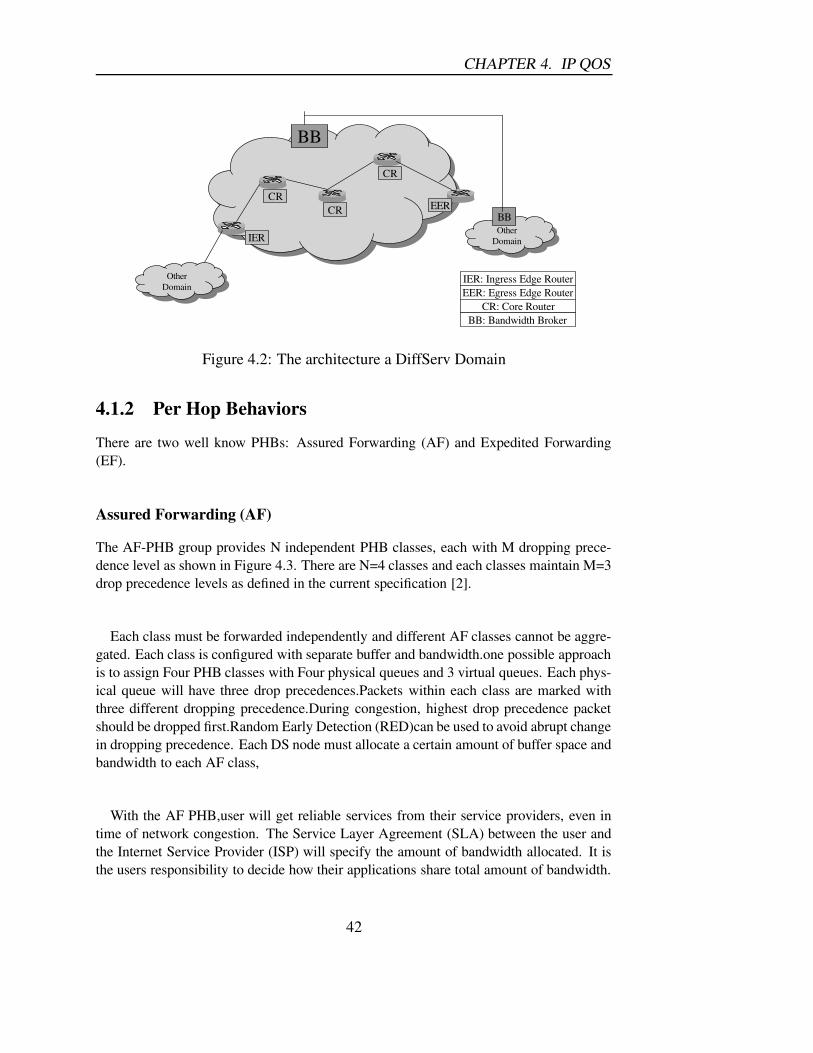
• Edge Router:The edge router are called Boundary nodes that provide a collectionof function needed to interconnect a DS-domain to another DS-domain or to a non-DS-capable domain as shown in Figure 4.2.The Edge routers are divided into twocategories
– Ingress Edge Router: It handles the incoming traffic streams to a DS domainfrom an Access Network. The packets arriving at the ingress routers aremarked with the corresponding DiffServ code point(DSCP) and transmittedthrough the core routers.The packets associated with a certain traffic classwould get the same DSCP which will be put together in a behavior aggre-gate(BA) with a specific PHB.PHB is nothing but a dropping precedence.Ithandles Traffic conditioning Profile and ensure a user traffic adhere to itspolicy specifications by shaping and policing traffic.
– Egress Edge Router: It handles the outgoing streams from a DS-domain.EgressEdge Router receives packets through the core network.
• Core Router: A core router examine incoming packets for the code point markingdone on the packet by ingress edge routers and forward them accordingly.Corerouters provide a reaction to the marking done by edge router.Core routers have fewinput links and their service rates are higher. The core router performs Schedulingand buffering for incoming packets from ingress edge router.The buffer size in corerouter should be lower.
41
CHAPTER 4. IP QOS
OtherDomain
OtherDomain
BB
BBCR
CR
CR
IER
EER
IER: Ingress Edge RouterEER: Egress Edge Router
CR: Core RouterBB: Bandwidth Broker
Figure 4.2: The architecture a DiffServ Domain
4.1.2 Per Hop Behaviors
There are two well know PHBs: Assured Forwarding (AF) and Expedited Forwarding(EF).
Assured Forwarding (AF)
The AF-PHB group provides N independent PHB classes, each with M dropping prece-dence level as shown in Figure 4.3. There are N=4 classes and each classes maintain M=3drop precedence levels as defined in the current specification [2].
Each class must be forwarded independently and different AF classes cannot be aggre-gated. Each class is configured with separate buffer and bandwidth.one possible approachis to assign Four PHB classes with Four physical queues and 3 virtual queues. Each phys-ical queue will have three drop precedences.Packets within each class are marked withthree different dropping precedence.During congestion, highest drop precedence packetshould be dropped first.Random Early Detection (RED)can be used to avoid abrupt changein dropping precedence. Each DS node must allocate a certain amount of buffer space andbandwidth to each AF class,
With the AF PHB,user will get reliable services from their service providers, even intime of network congestion. The Service Layer Agreement (SLA) between the user andthe Internet Service Provider (ISP) will specify the amount of bandwidth allocated. It isthe users responsibility to decide how their applications share total amount of bandwidth.
42

4.1. DIFFSERV APPROACH
AF11
AF11
AF11
AF11
AF12
AF13
AF41
AF42
AF43
AF11
AF11
AF11
AF21
AF22
AF23
AF11
AF11
AF11
AF31
AF32
AF33
Class 1 Class 2 Class 3 Class 4
Low drop
Medium drop
High drop
Drop precedence within a class
Figure 4.3: Assured Forwarding PHB Group
Expedited Forwarding (EF)
The EF-PHB group was designed for users with fixed peak rate traffic to supply low-loss, low-latency and low-jitter end-to-end services as shown in Figure 4.4. Packet loss,latency, and jitter in wired networks are mainly due to that traffics have to wait in queuewhile transmitted through networks. Therefore, providing low loss, latency, and jitter forsome high priority traffics can be achieved by guaranteeing very small queue.
Queues arise when (short-term) traffic arrival rate exceeds departure rate at some node.Thus, for an EF-PHB traffic stream, the departure rate must equal or exceed a configurablerate. EF traffic should average at least the configured rate when measured over any timeinterval equal to or longer than a packet time at the configured rate. The SLA specifies apeak rate for a flow or an aggregation of flows. The user is responsible for not exceedingthe peak rate; otherwise, excess traffic will be dropped.[1]
RED
EF PHB
DefaultPHB
Figure 4.4: Possible implementation of Expedited Forwarding PHB
43
CHAPTER 4. IP QOS
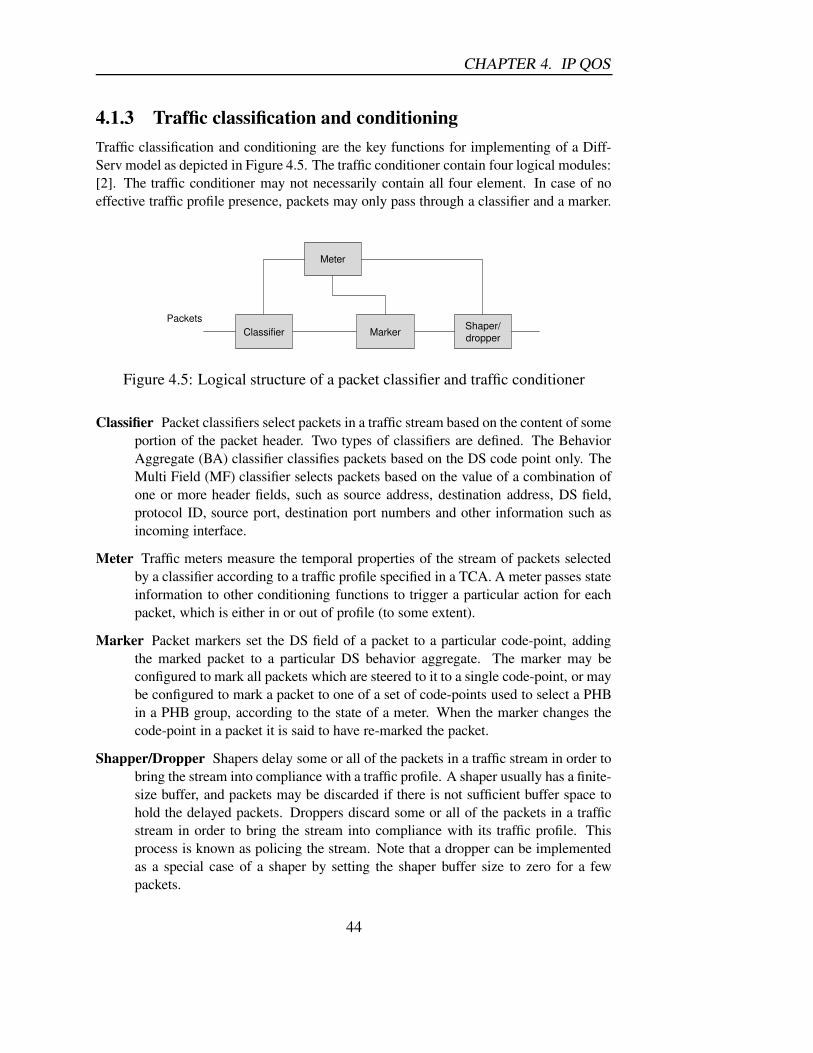
4.1.3 Traffic classification and conditioningTraffic classification and conditioning are the key functions for implementing of a Diff-Serv model as depicted in Figure 4.5. The traffic conditioner contain four logical modules:[2]. The traffic conditioner may not necessarily contain all four element. In case of noeffective traffic profile presence, packets may only pass through a classifier and a marker.
Meter
Classifier MarkerShaper/dropper
Packets
Figure 4.5: Logical structure of a packet classifier and traffic conditioner
Classifier Packet classifiers select packets in a traffic stream based on the content of someportion of the packet header. Two types of classifiers are defined. The BehaviorAggregate (BA) classifier classifies packets based on the DS code point only. TheMulti Field (MF) classifier selects packets based on the value of a combination ofone or more header fields, such as source address, destination address, DS field,protocol ID, source port, destination port numbers and other information such asincoming interface.
Meter Traffic meters measure the temporal properties of the stream of packets selectedby a classifier according to a traffic profile specified in a TCA. A meter passes stateinformation to other conditioning functions to trigger a particular action for eachpacket, which is either in or out of profile (to some extent).
Marker Packet markers set the DS field of a packet to a particular code-point, addingthe marked packet to a particular DS behavior aggregate. The marker may beconfigured to mark all packets which are steered to it to a single code-point, or maybe configured to mark a packet to one of a set of code-points used to select a PHBin a PHB group, according to the state of a meter. When the marker changes thecode-point in a packet it is said to have re-marked the packet.
Shapper/Dropper Shapers delay some or all of the packets in a traffic stream in order tobring the stream into compliance with a traffic profile. A shaper usually has a finite-size buffer, and packets may be discarded if there is not sufficient buffer space tohold the delayed packets. Droppers discard some or all of the packets in a trafficstream in order to bring the stream into compliance with its traffic profile. Thisprocess is known as policing the stream. Note that a dropper can be implementedas a special case of a shaper by setting the shaper buffer size to zero for a fewpackets.
44

4.1. DIFFSERV APPROACH
4.1.4 Meter and Marker functions - PolicyA policy determines the treatment that a traffic aggregate will receive at the edge device.Edge devices use policy information to determine with what code point to mark packets.Each policy defines a policy type, a target rate, and other policy-specific parameters. Asa minimum, each policy defines two code points; and the choice of code point dependson a comparison between the aggregatears target rate and current sending rate [14]. Eachtraffic aggregate has an associated policy type, meter type, and initial code point. Themeter type specifies the method for measuring the state variables needed by the policy.Some well-known meters/markers are explained below.
Time Sliding Window Three/Two Color Marker(TSW3CM/TSM2CM)
The TSW3CM has been primarily designed for traffic streams that will be forwardedbased on the AF PHB in routers[16]. The TSWTCM meters a traffic stream and markspackets to be either green, yellow or red based on the measured throughput relative to twospecified rates: Committed Information Rate (CIR) and Peak Information Rate (PIR).
• The packets contributing to sending rate below or equal to the CIR with be markedwith green color.
• Packets contributing to the portion of the rate between the CIR and PIR are markedyellow
• packets causing the rate to exceed PIR are marked with red.
TSW2CM :The marking takes place in the traffic conditioner of the boundary nodes ofthe DiffServ Domain. A special case of a time sliding window three color marker(TSW3CM) is used, to mark packets with only one of two colors.This is calleda time sliding window two color marker(TSW2CM). Time Sliding Window TwoColor Marker (TSW2CM) only use only CIR to evaluate traffic stream rate andmark them with either green or red. A CIR is defined for each edge router. Aslong as the connections rate is below CIR, all packets are marked as high priority.When the rate exceeds CIR, packets are marked probabilistically such that at theaverage, the rate of packet marked with high priority corresponds to CIR.It servestwo purposes:
• Measuring the data rate of the ingress traffic at the boundary node.
• Marking the packets based on the measurement results.TSW2CM requires aCIR to be specified in units of bits/second.
The TSW3/2CM consists of two independent components: a rate estimator, and amarker to associate a colour (drop precedence) with each packet. If the marker is usedwith the AF PHB, each color would correspond to a level of drop precedence.
Meter A TSW meter working procedure is shown in Figure 4.6:
45

CHAPTER 4. IP QOS
========================================================================|Initially: || || AVG_INTERVAL = a constant; || avg-rate = CTR; || t-front = 0; || ||Upon each packet's arrival, the rate estimator updates its variables: || || Bytes_in_win = avg-rate * AVG_INTERVAL; || New_bytes = Bytes_in_win + pkt_size; || avg-rate = New_bytes/( now - t-front + AVG_INTERVAL); || t-front = now; || ||Where: || now = The time of the current packet arrival || pkt_size = The packet size in bytes of the arriving packet || avg-rate = Measured Arrival Rate of traffic stream || AVG_INTERVAL = Time window over which history is kept || |
Figure 4.6: An example TSW meter algorithm [16]
=================================================================== | avg-rate = Estimated Avg Sending Rate of Traffic Stream | | | | if (avg-rate <= CTR) | | the packet is green; | | else if (avg-rate <= PTR) AND (avg-rate > CTR) | | (avg-rate - CTR) | | calculate P0 = ---------------- | | avg-rate | | with probability P0 the packet is yellow; | | with probability (1-P0) the packet is green; | | else | | (avg-rate - PTR) | | calculate P1 = ---------------- | | avg-rate | | (PTR - CTR) | | calculate P2 = ----------- | | avg-rate | | with probability P1 the packet is red; | | with probability P2 the packet is yellow; | | with probability (1-(P1+P2)) the packet is green; | | |
Figure 4.7: TSW3CM Marking Algorithm [16]
46

4.1. DIFFSERV APPROACH
Marker A TSW3CM marker works as depicted in figure 4.7:
47
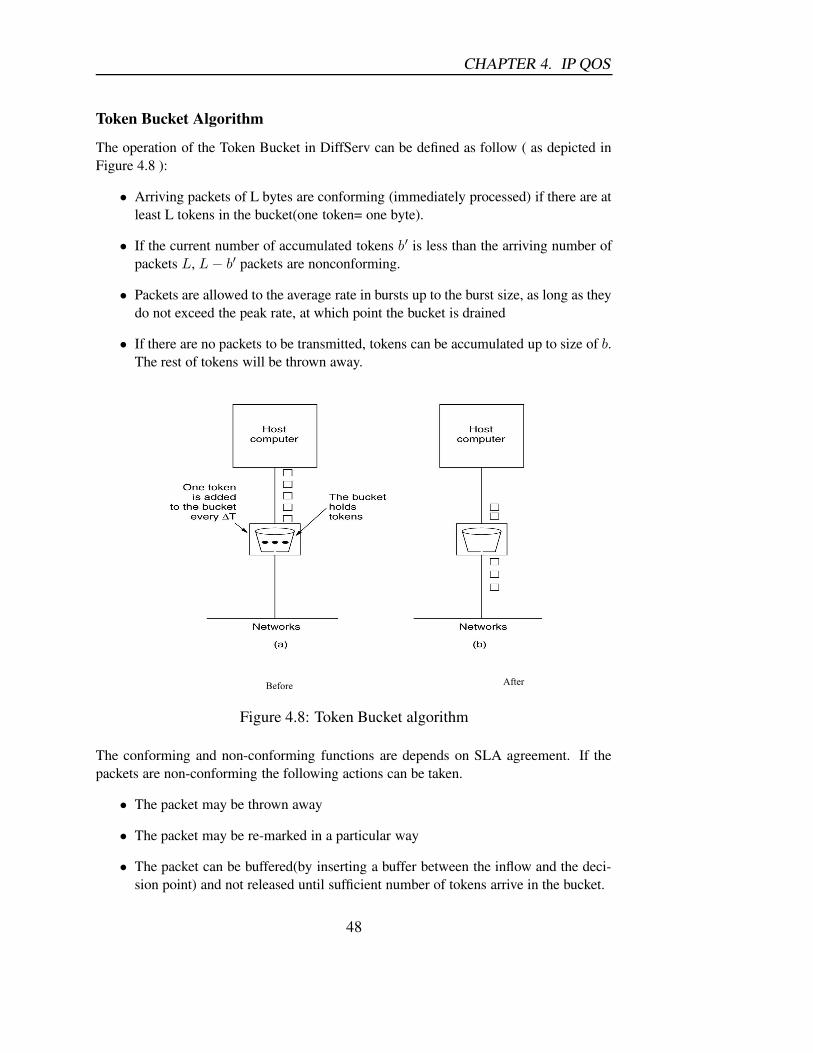
CHAPTER 4. IP QOS
Token Bucket Algorithm
The operation of the Token Bucket in DiffServ can be defined as follow ( as depicted inFigure 4.8 ):
• Arriving packets of L bytes are conforming (immediately processed) if there are atleast L tokens in the bucket(one token= one byte).
• If the current number of accumulated tokens b′ is less than the arriving number ofpackets L, L − b′ packets are nonconforming.
• Packets are allowed to the average rate in bursts up to the burst size, as long as theydo not exceed the peak rate, at which point the bucket is drained
• If there are no packets to be transmitted, tokens can be accumulated up to size of b.The rest of tokens will be thrown away.
BeforeAfter
Figure 4.8: Token Bucket algorithm
The conforming and non-conforming functions are depends on SLA agreement. If thepackets are non-conforming the following actions can be taken.
• The packet may be thrown away
• The packet may be re-marked in a particular way
• The packet can be buffered(by inserting a buffer between the inflow and the deci-sion point) and not released until sufficient number of tokens arrive in the bucket.
48

4.2. INTSERV/RSVP POLICY
4.2 IntServ/RSVP PolicyIntegrated Service/Resourc Reservation Protocol (IntServ/RSVP) is a flow-oriented QoSapproach as depicted in Figure 4.9. This model offers three classes of service:
• Guaranteed service (GS) provides a deterministic upper bound on the delay and lossfor a given flow. We have bandwidth guarantees for the traffic, and the applicationscan improve response time by increasing their demands for bandwidth. It is suitablefor audio and video applications with strict delay requirements.
• Controlled-load service (CL) provides a service equivalent to a best-effort servicein an unloaded or lightly loaded network. Though, this service does not providea deterministic guarantee concerning the end-to-end delay for a given flow. Thisservice class is designed for adaptive real-time applications (e.g. applications thatcan modify their play-out buffer as the end-to-end delay varies).
• Best-effort service (BE) is the fall-back solution providing a level of service similarto the current Internet service, without any bounds on the delay, loss, and jitter.
IntServ/RSVP IntServ/RSVPER1Router
ER1Router
IntServ/RSVPSource destination
RESV RESV RESV RESV
PATH PATH PATH PATH
Figure 4.9: IntServ/RSVP Policy
Within this model, there is an inescapable requirement for routers to be able to reserveresources in order to provide special QoS for specific user packet streams or flows. Thisin turn requires flow-specific state in the routers.
IntServ relies on RSVP to reserve resources for the applications. The resources arereserved for every flow requiring QoS at every router hop in the path between a receiverand a transmitter.
Usually, a flow is characterized by a source and destination IP address, and a sourceand destination port number. The mechanism is the following: the sender emits A PATHmessage. This message specifies the characteristics of the traffic, and routers between
49

CHAPTER 4. IP QOS
the sender and the receiver have to forward the PATH message, according to the routingprotocol currently used within the network. When receiving a PATH message, the receiverhas to send a RESV message to establish resource reservation for this individual flow, soit is a receiver driven mechanism.
When the RESV message flows back to the sender, intermediate routers can accept orreject the reservation. In the case the reservation is rejected by a router, this router hasto send an error message to the receiver. Otherwise, the router allocates resources for theflow, according to the reservation, and forwards the RESV message to the next router. ThePATH and RESV messages are sent periodically to refresh the reservations, so this is asoft state mechanism.
The weaknesses of the IntServ/RSVP model are:
• The amount of state information is proportional to the number of flows. We candeal with hundred thousands of reservations within the core of the IP network, andthis requires processing load and huge resources requirements in the core routers.This approach does not scale well with the number of flows and makes routers verycomplicated.
• This architecture does not fit well with short-lived flows like web traffic, becausethe overhead in term of reservation is greater than the processing of all the packetsin the flow.
• RSVP is a soft-state mechanism that maintains state information for all flows. Thisrequires a large storage capacity.
• Malicious users could set the timer values in PATH messages to a very high valueso that the corresponding state does not time out for a long period and takes upmemory resources in network nodes.
4.3 Comparison between IntServ and DiffServThe IntServ and DiffServ has its own advantages and disadvantages as listed in Table4.1. IntServ supplies a strict E2E QoS guarantee It requires a complex signalling processamong different operators network involved in a connection, like the circuit-switched net-works.DiffServ supply a much more flexible solution to only carry QoS related require-ments within DSCP field of each IP packet.This maybe always not be sufficient to supplyan absolute E2E QoS . Hence, DiffServ approach is used for both external IP network andUMTS IP backbone to investigate End-to-End QoS provisioning.
50

4.3. COMPARISON BETWEEN INTSERV AND DIFFSERV
Integrated services Differentiated servicesGranularity of servicedifferentiation
Individual flow Aggregate of flows
State in routers(e.g.,scheduling buffermanagement)
Per-flow Per-aggregate
Traffic classificationbasis
Several header fields The DS field (6 bits) ofthe IP header
Type of service differ-entiation
Deterministic or statis-tical guarantees
Absolute or relative as-surances
Admission control Required Required for absolutedifferentiation only
Signaling protocol Required (RSVP) Not required for rela-tive schemes;absoluteschemes need semi-static reservations orbroker agents
Coordination for ser-vice differentiation
End-to-end Local (per-hop)
Scope of service differ-entiation
A unicast or multicastpath
Anywhere in a networkor in specific path
Scalability Limited by the numberof flows
Limited by the numberof classes of service
Network accounting Based on flow charac-teristics and QoS re-quirement
Based on class usage
Network management Similar to circuit-switched networks
Similar to existing IPnetworks
Inter-domain deploy-ment
Multilateral agreements Bilateral agreements
Table 4.1: A comparison of the IntServ and DiffServ architectures
51

CHAPTER 4. IP QOS
4.4 Other IP QoS provisioning mechanismsScheduling and buffering are common mechanisms for IP packets handling and inevitableto implement QoS differentiation between User Equipments.
4.4.1 SchedulingWhen multiple queues are sharing the a common transmission media, there must be ascheduler to decide how to pick up packets from each queue to send out. The simplestscheduler is Round Robin (RR), which just select packet from each queue circularly, andall the queues have exactly equal chances to send.
Generally a packet scheduler is expected to have the following properties:
• Has low time complexity to select and forward a packet;
• Treat different flow fairly;
• Provide low worst-case delay and delay variation;
• Is simple enough to implement efficiently
The simplicity and time-complexity properties always collides with fairness and delay-bound properties. Schedulers with short term fairness and strict delay bound generallyhave high time complexity and are hard to implement.
A more useful scheduler for queuing with different classes is Weighted round robin(WRR). It is an extension of RR, which allow the bandwidth between queues to be dis-tributed according to weights. Each time a non-empty queue is examined, it may send asmany packets as its weight indicates. The WRR carry several improvements. The mostcommons are:
• To use bytes, or chunks of bytes, instead of packets. this gives greater granularityon the resource to be distributed.
• Allow queues to be selected several times within short intervals, instead of beingselected many times in series. Since the sum of all weights can be fairly big, theimprovement experienced can be dramatic. this improvement lowers the burntnessof outgoing flows and lowers the average latency, It does however increase theimplementation complexity.In WRR, each queue has bandwidth allocated when allother queues have been visited according to their weight.
In a long term, the percentage of each queue to be served is:
Pi =Wi
Wtotal
52
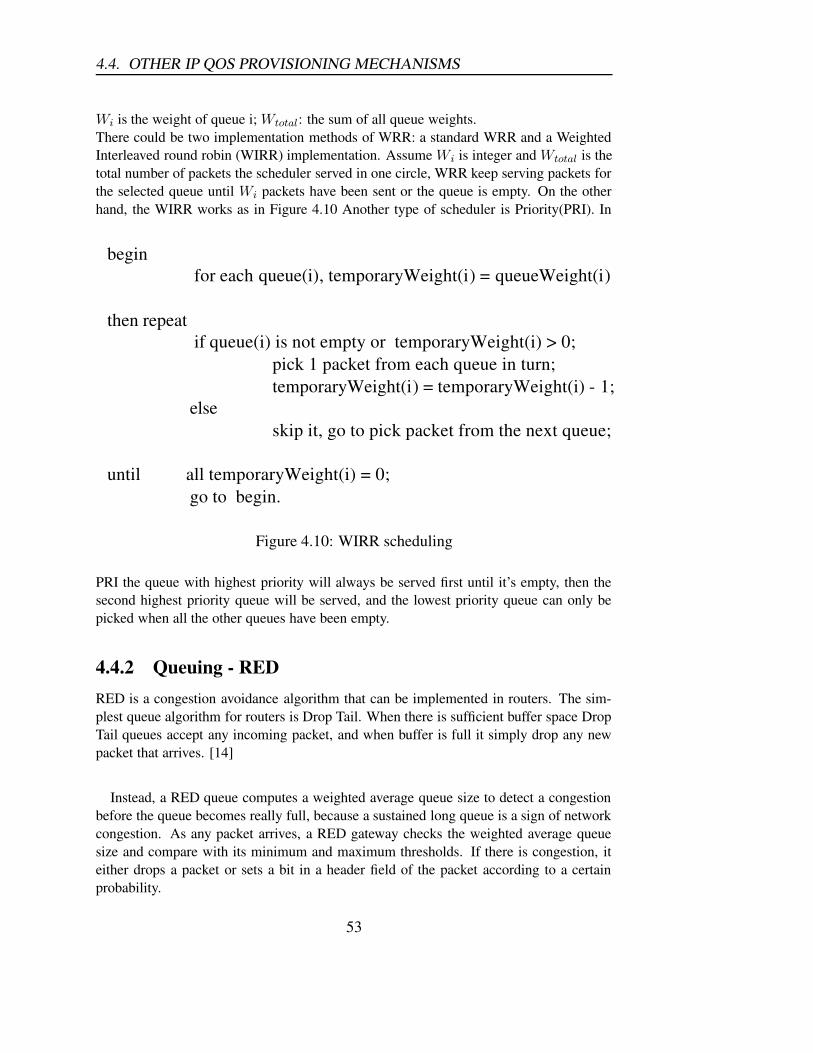
4.4. OTHER IP QOS PROVISIONING MECHANISMS
Wi is the weight of queue i; Wtotal: the sum of all queue weights.There could be two implementation methods of WRR: a standard WRR and a WeightedInterleaved round robin (WIRR) implementation. Assume Wi is integer and Wtotal is thetotal number of packets the scheduler served in one circle, WRR keep serving packets forthe selected queue until Wi packets have been sent or the queue is empty. On the otherhand, the WIRR works as in Figure 4.10 Another type of scheduler is Priority(PRI). In
beginfor each queue(i), temporaryWeight(i) = queueWeight(i)
then repeatif queue(i) is not empty or temporaryWeight(i) > 0;
pick 1 packet from each queue in turn;temporaryWeight(i) = temporaryWeight(i) - 1;
elseskip it, go to pick packet from the next queue;
until all temporaryWeight(i) = 0;go to begin.
Figure 4.10: WIRR scheduling
PRI the queue with highest priority will always be served first until it’s empty, then thesecond highest priority queue will be served, and the lowest priority queue can only bepicked when all the other queues have been empty.
4.4.2 Queuing - REDRED is a congestion avoidance algorithm that can be implemented in routers. The sim-plest queue algorithm for routers is Drop Tail. When there is sufficient buffer space DropTail queues accept any incoming packet, and when buffer is full it simply drop any newpacket that arrives. [14]
Instead, a RED queue computes a weighted average queue size to detect a congestionbefore the queue becomes really full, because a sustained long queue is a sign of networkcongestion. As any packet arrives, a RED gateway checks the weighted average queuesize and compare with its minimum and maximum thresholds. If there is congestion, iteither drops a packet or sets a bit in a header field of the packet according to a certainprobability.
53
CHAPTER 4. IP QOS
There are three phases for a RED gateways which drops packets:
Normal operation: If the average queue size is less than the minimum threshold, nopackets are dropped.
Congestion avoidance: If the average queue size is between the minimum and maxi-mum thresholds, packets are dropped with a certain probability. This probabilityis a function of the average queue size, so that larger queues lead to higher dropprobabilities.
Congestion Control: If the average queue size is greater than the maximum threshold,all incoming packets are dropped.
The effects of RED gateways in a network will be:
• Control the average queue size, and reduce the average queuing delay.
• Act as a low-pass filter, hence the burst traffic get easier to be dropped.
• Avoid synchronization of TCP connections. A TCP based traffic source will re-duce its transmitting rate when some of its burst packets will be dropped whichcause RTT time-out. But the Drop Tail queue will all the packets in congestionwhich cause all the TCP source reduce their transmitting rate at the same timeand the total throughput suddenly becomes very low after the congestion period.RED drops packets randomly before the buffer get overflow, which prevents thissynchronization problem, reduces traffic oscillation effect and hence increase theoverall throughput.
4.5 ConclusionIn this chapter, the two main standard IP QoS provisioning approaches, DiffServ andInterServ, are described and compared, and some other possible mechanisms to implementIP QoS are also introduced.
54

Chapter 5
NS-2 simulator
5.1 Overview of NS-2The Network Simulator version 2 (NS-2) is an event driven network simulator developedat UC Berkeley that simulates variety of IP networks. It implements network protocolssuch as TCP and UDP, traffic source behavior such as FTP, Telnet, Web, CBR and VBR,router queue management mechanism such as Drop Tail, RED and CBQ, routing algo-rithms such as Dijkstra, and more. NS also implements multicasting and some of theMAC layer protocols for LAN simulations. The NS project is now a part of the VINTproject that develops tools for simulation results display, analysis and converters that con-vert network topologies generated by well-known generators to NS formats. Currently,NS (version 2) written in C++ and OTcl (Tcl script language with Object-oriented exten-sions developed at MIT) is available.
Figure 5.1: Simplified User View of NS
As shown in Figure 5.1, in a simplified user’s view, NS is Object-oriented Tcl (OTcl)script interpreter that has a simulation event scheduler and network component object
55
CHAPTER 5. NS-2 SIMULATOR
libraries, and network setup (plumbing) module libraries (actually, plumbing modulesare implemented as member functions of the base simulator object). In other words, NSsimulation program is written in OTcl script language. To setup and run a simulationnetwork, a user should write an OTcl script that initiates an event scheduler, sets up thenetwork topology using the network objects and the plumbing functions in the library,and tells traffic sources when to start and stop transmitting packets through the eventscheduler. The term "plumbing" is used for a network setup, because setting up a networkis plumbing possible data paths among network objects by setting the "neighbor" pointerof an object to the address of an appropriate object. When a user wants to make a newnetwork object, he or she can easily make an object either by writing a new object or bymaking a compound object from the object library, and plumb the data path through theobject. This may sound like complicated job, but the plumbing OTcl modules actuallymake the job very easy. The power of NS comes from this plumbing.
Another major component of NS beside network objects is the event scheduler. Anevent in NS is a packet ID that is unique for a packet with scheduled time and the pointerto an object that handles the event. In NS, an event scheduler keeps track of simulationtime and fires all the events in the event queue scheduled for the current time by invok-ing appropriate network components, which usually are the ones who issued the events,and let them do the appropriate action associated with packet pointed by the event. Net-work components communicate with one another passing packets, however this does notconsume actual simulation time. All the network components that need to spend somesimulation time handling a packet (i.e. need a delay) use the event scheduler by issu-ing an event for the packet and waiting for the event to be fired to itself before doingfurther action handling the packet. For example, a network switch component that sim-ulates a switch with 20 microseconds of switching delay issues an event for a packet tobe switched to the scheduler as an event 20 microsecond later. The scheduler after 20microsecond dequeues the event and fires it to the switch component, which then passesthe packet to an appropriate output link component. Another use of an event scheduler istimer. For example, TCP needs a timer to keep track of a packet transmission time out forretransmission (transmission of a packet with the same TCP packet number but differentNS packet ID). Timers use event schedulers in a similar manner that delay does. Theonly difference is that timer measures a time value associated with a packet and does anappropriate action related to that packet after a certain time goes by, and does not simulatea delay.
NS is written not only in OTcl but in C++ also. For efficiency reason, NS separates thedata path implementation from control path implementations. In order to reduce packetand event processing time (not simulation time), the event scheduler and the basic networkcomponent objects in the data path are written and compiled using C++. These compiledobjects are made available to the OTcl interpreter through an OTcl linkage that creates amatching OTcl object for each of the C++ objects and makes the control functions and theconfigurable variables specified by the C++ object act as member functions and member
56

5.2. DIFFSERV MODULE
variables of the corresponding OTcl object. In this way, the controls of the C++ objectsare given to OTcl. It is also possible to add member functions and variables to a C++linked OTcl object. The objects in C++ that do not need to be controlled in a simulationor internally used by another object do not need to be linked to OTcl. Likewise, an object(not in the data path) can be entirely implemented in OTcl. Figure 2 shows an objecthierarchy example in C++ and OTcl. One thing to note in the figure is that for C++objects that have an OTcl linkage forming a hierarchy, there is a matching OTcl objecthierarchy very similar to that of C++.
5.2 DiffServ moduleThe DiffServ module in NS-2 implemented the AF PHB with a modified Random EarlyDetection (RED) queue mechanism. This module was contribute by Nortel Networks.[14]
5.2.1 AF PHB Implementation with multiple RED queuesIn the Diffserv approach QoS was provided by dividing traffic into different classes andmarking each packet with a code point corresponding to its class, and scheduling packetsaccordingly. The Assured Forwarding mechanism in NS-2 can include at most 4 physicalqueues for 4 PHB classes, and 3 virtual queues in each physical one for the 3 drop prece-dences. Those drop precedences enable differential treatment of traffic within a singleclass.
Different RED parameters are used for the virtual queues, causing packets from onevirtual queue to be dropped more frequently than packets from another. A packet witha lower drop precedence is given better treatment in times of congestion because it isassigned a code point that corresponds to a virtual queue with relatively lenient REDparameters.
For example, one code point might be used for assured traffic and another for besteffort traffic. The assured packet virtual queue will have higher minimum and maximumthresholds than those of best effort queue, meaning that best effort packets will enter thecongestion avoidance and congestion control phase prior to assured packets.
Core Router
Core routers only have the functionality of performing PHB on incoming packets. In NS-2, core routers maintain at most 4 physical queues in its output link, each of them canhave no more than 3 virtual queues or precedences. An incoming packet is placed in avirtual queue within a physical queue based on the DSCP-value in the packet’s IP-header.A physical queue is implemented as a RED-queue and virtual queues within the same
57
CHAPTER 5. NS-2 SIMULATOR
physical queue all use the same buffer to temporarily store packets. However, all vir-tual queues can be configured with their own RED-parameters (minimum and maximumthreshold and dropping probability).
Edge Router
Edge routers include the same PHB functionality as core routers, and in addition performthe following functions:
• Policing
• Metering
• Packet marking
5.2.2 PolicerThe DiffServ module currently supports six policer types.
TSW2CM (TSW2CMPolicer): uses a CIR and two drop precedences. The lower prece-dence is used probabilistically when the CIR is exceeded.
TSW3CM (TSW3CMPolicer): uses a CIR, a PIR, and three drop precedences. Themedium drop precedence is used probabilistically when the CIR is exceeded andthe lowest drop precedence is used probabilistically when the PIR is exceeded, asexplained in [16].
Token Bucket (tokenBucketPolicer): uses a CIR and a CBS and two drop precedences.An arriving packet is marked with the lower precedence if and only if it is largerthan the token bucket.
Single Rate Three Color Marker (srTCMPolicer): uses a CIR, CBS, and an EBS tochoose from three drop precedences, as explained in [17].
Two Rate Three Color Marker (trTCMPolicer): uses a CIR, CBS, PIR, and a PBS tochoose from three drop precdences, as explained in [18].
These policers have been explained in the IP QoS chapter.
5.2.3 SchedulerScheduling modes supported in NS2 are:
• Round Robin (RR)
• Weighted Round Robin (WRR)
• Weighted Interleaved Round Robin (WIRR)
58
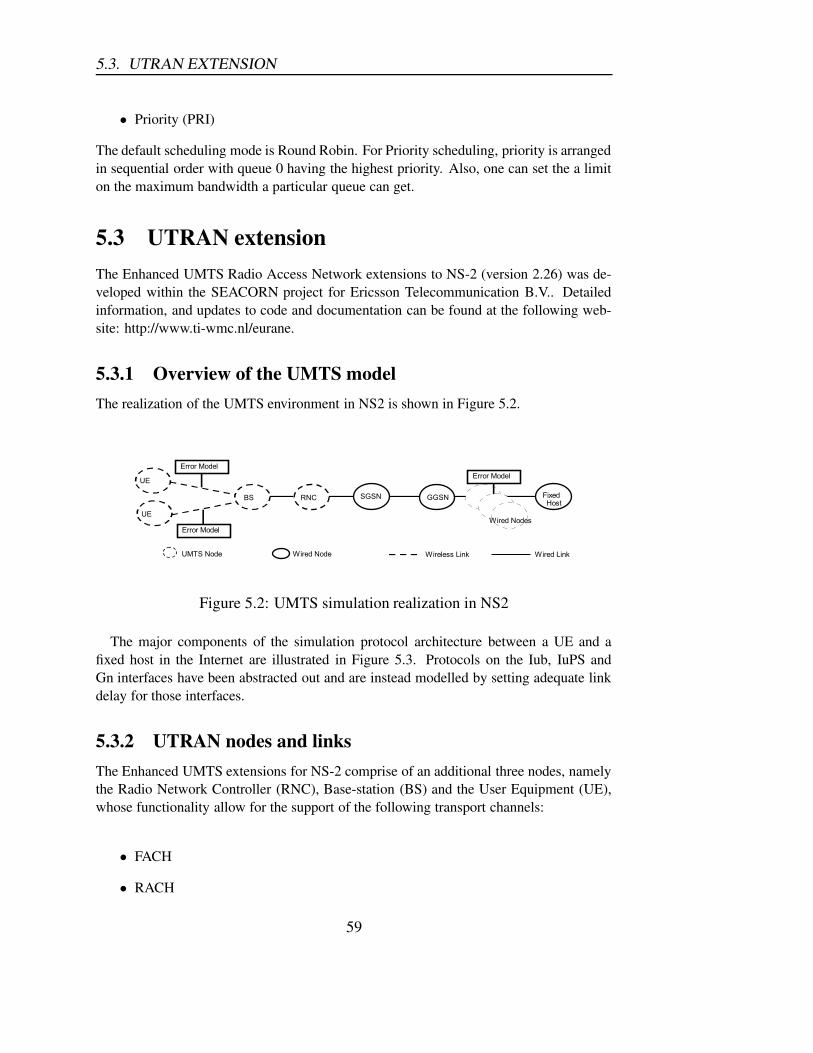
5.3. UTRAN EXTENSION
• Priority (PRI)
The default scheduling mode is Round Robin. For Priority scheduling, priority is arrangedin sequential order with queue 0 having the highest priority. Also, one can set the a limiton the maximum bandwidth a particular queue can get.
5.3 UTRAN extensionThe Enhanced UMTS Radio Access Network extensions to NS-2 (version 2.26) was de-veloped within the SEACORN project for Ericsson Telecommunication B.V.. Detailedinformation, and updates to code and documentation can be found at the following web-site: http://www.ti-wmc.nl/eurane.
5.3.1 Overview of the UMTS modelThe realization of the UMTS environment in NS2 is shown in Figure 5.2.
�
������������������������������������������
".�
/$� ( '� $0$ � ��1���2 ���
.�� ��# ����
"#�$� ��� 4����� ���
00$ �
4����� ����
.�� ��# ����
".�
.�� ��# ����
4��������)���� 4�����)����
Figure 5.2: UMTS simulation realization in NS2
The major components of the simulation protocol architecture between a UE and afixed host in the Internet are illustrated in Figure 5.3. Protocols on the Iub, IuPS andGn interfaces have been abstracted out and are instead modelled by setting adequate linkdelay for those interfaces.
5.3.2 UTRAN nodes and linksThe Enhanced UMTS extensions for NS-2 comprise of an additional three nodes, namelythe Radio Network Controller (RNC), Base-station (BS) and the User Equipment (UE),whose functionality allow for the support of the following transport channels:
• FACH
• RACH
59
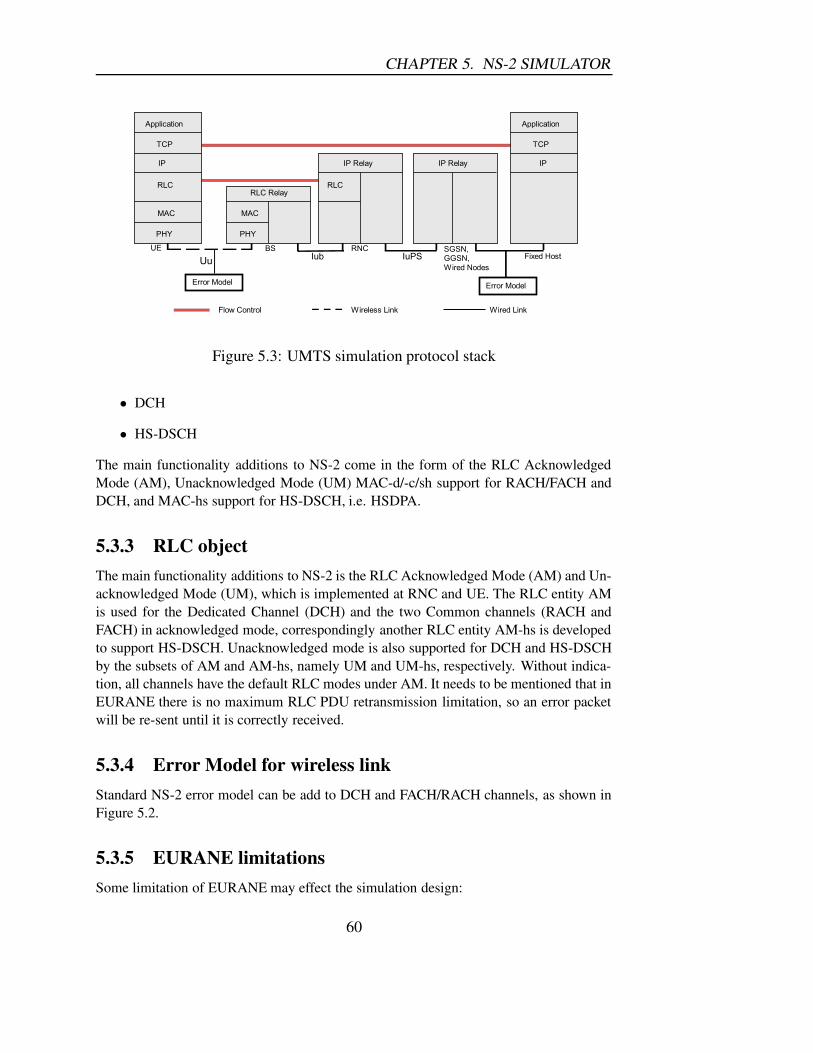
CHAPTER 5. NS-2 SIMULATOR
%&�!��� �
&'(�
����
!"��!��� �
��&�
!"��
����
&'(�
%&�
�)���*���'��
!+��,�� �-�+��--�+��
.�����+����
���������
���
.��������"��/� .�����"��/�
)���������
����������
��&�
%&�
����������
!"��
%&�!��� �
)���������
%��� %�&��
Figure 5.3: UMTS simulation protocol stack
• DCH
• HS-DSCH
The main functionality additions to NS-2 come in the form of the RLC AcknowledgedMode (AM), Unacknowledged Mode (UM) MAC-d/-c/sh support for RACH/FACH andDCH, and MAC-hs support for HS-DSCH, i.e. HSDPA.
5.3.3 RLC objectThe main functionality additions to NS-2 is the RLC Acknowledged Mode (AM) and Un-acknowledged Mode (UM), which is implemented at RNC and UE. The RLC entity AMis used for the Dedicated Channel (DCH) and the two Common channels (RACH andFACH) in acknowledged mode, correspondingly another RLC entity AM-hs is developedto support HS-DSCH. Unacknowledged mode is also supported for DCH and HS-DSCHby the subsets of AM and AM-hs, namely UM and UM-hs, respectively. Without indica-tion, all channels have the default RLC modes under AM. It needs to be mentioned that inEURANE there is no maximum RLC PDU retransmission limitation, so an error packetwill be re-sent until it is correctly received.
5.3.4 Error Model for wireless linkStandard NS-2 error model can be add to DCH and FACH/RACH channels, as shown inFigure 5.2.
5.3.5 EURANE limitationsSome limitation of EURANE may effect the simulation design:
60

5.3. UTRAN EXTENSION
1. Only 1 UMTS cell can be simulated, and there is no cell capacity limitation for thiscell.
2. The wireless link is static, meaning once a DCH has been built, it cannot be releasedduring the simulation.
3. All the DCHs can only be configured with the same parameters, such as down-link/uplink bandwidth, AM/UM mode, etc.
61
Chapter 6
Delimitation
Based on the investigation of the UMTS and the IP QoS concepts and their mechanisms,the E2E QoS provisioning issues mentioned in Section 1.3 can be identified as follows (taking Figure 6.1 as an layered service architecture model):
1. External IP network: to select IETF standard QoS architecture (DiffServ or Inter-Serv) for the UMTS network to interact with.
2. UMTS network domain:
• Control plane:
– QoS attributes mapping between IP QoS classes and UMTS QoS classes.The UMTS Bear Service (BS) attributes mapped to Core Network (CN)BS and Radio Access Bearer (RAB).Furthermore to Radio BS and IuBS.
– Call Admission Control in every multiplexing point (GGSN, SGSN, etc)according to Equivalent Bandwidth(EB).
• User Plane:
– GGSN policing: check downlink flow and filter it according to TFT.– Scheduling and buffering mechanisms in CN transmission– QoS differentiation implementation in RRM
3. Other open issues: Application level End2End QoS provisioning, i.e,session Initi-ation protocol (SIP) signalling
Later in the chapter, several related research projects are reviewed and more specific prob-lems are selected as the focus of our project based on the possibilities supplied by NS-2simulation tool.
6.1 State-of-the-ArtThe following projects or papers are founded relevant to the project.
62

6.1. STATE-OF-THE-ART
Figure 6.1: Layered Service architecture of an E2E QoS chain of UMTS
6.1.1 E2E framework1. "A Framework for Dynamic Service layer Agreement (SLA)-based QOS control
for UMTS", Rajiv Chakravorty, Ian Pratt, and Jon Crowcroft, University of Cam-bridge Computer Laboratory, Maurizio D’Arienzo, University of Naples ("Fed-erico II"). IEEE Wireless Communications, October 2003.In this article, the proposed framework, which is an extension to the IST CADE-NUS project, offers wired-wireless QoS translation, QoS control and management,and dynamic SLA policy-based QoS provisioning. Two new functional compo-nents, the CUE-SM and CUE-RM are added to the UMTS framework to makeup the CADENUS-UMTS Extension (CUE), which enables the dynamic ServiceLayer Agreement(SLA). The QoS translation was done between UMTS and Diff-Serv Per Hop Behavior (PHB). Simulation as well testbed are mentioned but noexperiment result was supplied.
2. "Support of IP QOS over UMTS Networks", M. Ricardo, J. Dias, G. Carneiro,J. Ruela. From ARROW project(2001-2002). A UMTS/InterServ(RSVP) frame-work was presented and the detailed RSVP and PDP Context signalling process aredescribed, no simulation was mentioned.
6.1.2 QoS mapping: SAMU projectAdvanced Services by Mastering UMTS (SAMU)Duration: July 1999 – September 2002SAMU project is a collaborative project approved by the French RNRT (Telecommunica-tion Research National Network) and aims at improving the services offered to the users in
63
CHAPTER 6. DELIMITATION
an UMTS mobile system. For that purpose, the following topics were under investigation:
1. Defining smart resource allocation strategies for a CDMA mobile system.(RRM)
2. Defining an efficient way to map IP over UMTS, to provide the user with an end-to-end QoS.(QoS)
3. Complementary to the two previous ones. It aims at using agent software to makethe system autonomous. (Agent)
4. Demonstrating the feasibility of IP services over UMTS for users in their cars.
http://samu.crm-paris.com/Edocuments.htm
The innovative work in QoS from SAMU includes UMTS/IP QoS mapping architectureand UMTS link layer optimization for TCP. In its report "QoS Architecture, DeliverableSP2-D2", detailed mapping was described in different categories:
• Mapping from IP QoS Attributes to UMTS Bearer Service Attributes:
– Mapping from Differentiated Services to UMTS QoS ClassesBesides QoS classes translation, the parameters in each class are also con-sidered. For example, the guaranteed bit rate and maximum SDU size of theUMTS QoS parameters can be mapped to the arrival rate and the maximumburst size in the traffic profile of the SLA in DiffServ.
64
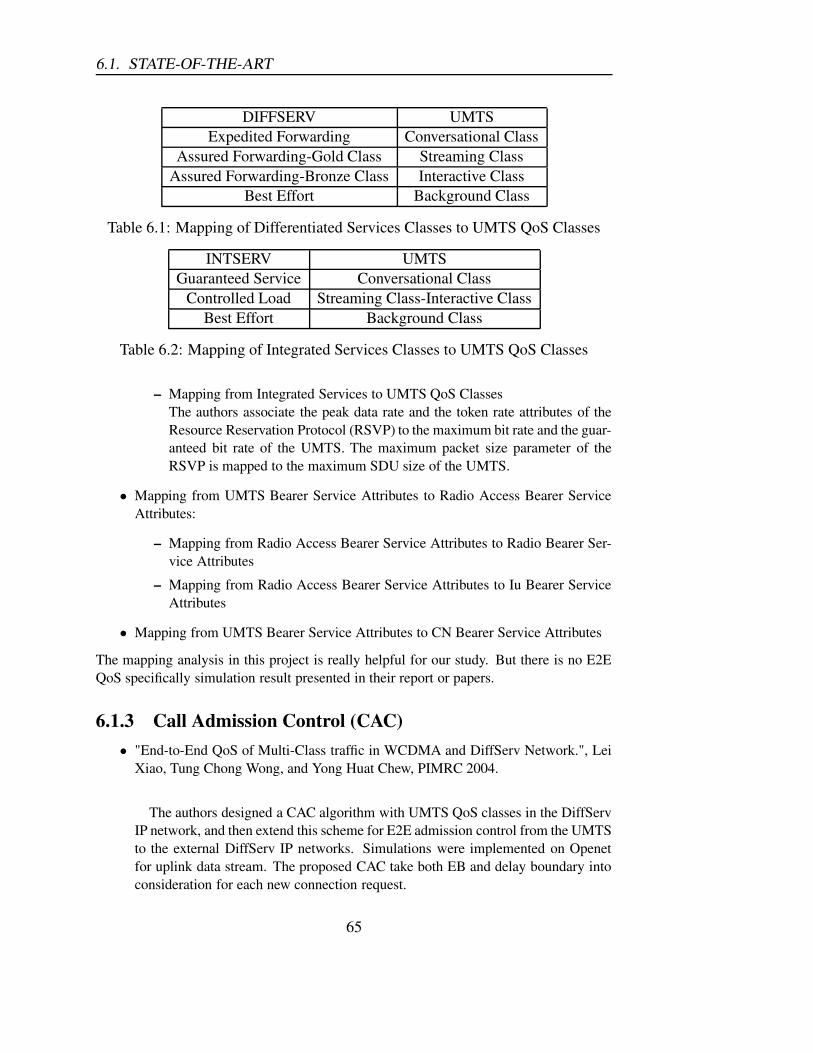
6.1. STATE-OF-THE-ART
DIFFSERV UMTSExpedited Forwarding Conversational Class
Assured Forwarding-Gold Class Streaming ClassAssured Forwarding-Bronze Class Interactive Class
Best Effort Background Class
Table 6.1: Mapping of Differentiated Services Classes to UMTS QoS Classes
INTSERV UMTSGuaranteed Service Conversational Class
Controlled Load Streaming Class-Interactive ClassBest Effort Background Class
Table 6.2: Mapping of Integrated Services Classes to UMTS QoS Classes
– Mapping from Integrated Services to UMTS QoS ClassesThe authors associate the peak data rate and the token rate attributes of theResource Reservation Protocol (RSVP) to the maximum bit rate and the guar-anteed bit rate of the UMTS. The maximum packet size parameter of theRSVP is mapped to the maximum SDU size of the UMTS.
• Mapping from UMTS Bearer Service Attributes to Radio Access Bearer ServiceAttributes:
– Mapping from Radio Access Bearer Service Attributes to Radio Bearer Ser-vice Attributes
– Mapping from Radio Access Bearer Service Attributes to Iu Bearer ServiceAttributes
• Mapping from UMTS Bearer Service Attributes to CN Bearer Service Attributes
The mapping analysis in this project is really helpful for our study. But there is no E2EQoS specifically simulation result presented in their report or papers.
6.1.3 Call Admission Control (CAC)• "End-to-End QoS of Multi-Class traffic in WCDMA and DiffServ Network.", Lei
Xiao, Tung Chong Wong, and Yong Huat Chew, PIMRC 2004.
The authors designed a CAC algorithm with UMTS QoS classes in the DiffServIP network, and then extend this scheme for E2E admission control from the UMTSto the external DiffServ IP networks. Simulations were implemented on Openetfor uplink data stream. The proposed CAC take both EB and delay boundary intoconsideration for each new connection request.
65

CHAPTER 6. DELIMITATION
6.1.4 Simulation: SEACORN projectSimulation of Enhanced UMTS Access and Core Networks (SEACORN)Duration: March, 2002 – March, 2004http://seacorn.ptinovacao.pt/The contribution of SEACORN is
• Development, and implementation of resource management algorithms enablingQoS provisioning and differentiation while optimizing resource efficiency, in amulti-service UMTS dynamic network simulator considering both up- and down-link communications;
• Development and implementation of resource management mechanisms for IP-based core networks in a dynamic network simulator.
And a system level simulator was developed based on Network Simulator 2(NS-2). Re-lated papers from SEACORN project include:
• J. Antoniou, A. Pitsillides, C. Chrysostomou, G. Hadjipollas, N. Jacovides, V. Vas-siliou, "A System Level Simulator for the Performance Evaluation of EnhancedUMTS Networks", ATNAC2003.The paper described the implemented UMTS simulation environment and the pos-sible simulation scenarios.
• Arnaldo Brito, José Lo, Lu¡s Correia and Américo Correia, " Simulation of RadioResource Management Algorithms for Enhanced UMTS".The paper simulate a RRM implementation with CAC in UTRAN part and PowerControl schemes.
We build up our simulation based on the UMTS extension developed in SEACORNproject.
6.1.5 Radio Resource ManagementSome work has been proposed to guarantee QoS for multimedia traffic in wireless cellularnetworks [23, 24, 25, 26, 27, 28, 29, 30, 31]. Rappaport and Purzynski developed an an-alytical models for cellular mobile environment consisting of mixed platform types withdifferent classes of channels and resource requirements. Prioritizing hand-off calls overordinary one and incorporating quotas for each type of resources, various performanceand measure like carried traffic, blocking and forced termination probabilities for eachplatform and call type are numerically computed from analytic model [28].The other min-imum resource requirement criteria provided by the users, Oliveria et al. [26] proposed abandwidth reservation algorithm for guaranteeing QoS to multimedia traffic. For the realtime traffic, the call is admitted only if the requested bandwidth can be reserved in the call
66
6.2. PROBLEM DELIMITATION
originating cell and all its neighbors. For a non-real-time call, the requested bandwidthis reserved only in the originating cell. Although this scheme guarantees QoS, the maindrawbacks are: 1.bandwidth is reserved redundantly since the user moves only to one ofthe six neighboring cells (Assuming hexagonal cell geometry) and 2.the stringent call ad-mission procedure might not admit many real-time requests in a highly overload system.The carried traffic in a wireless network can be increased by the graceful degradation ofsome or all of the existing service in the system [30]. In that, there are two QoS param-eters, namely, graceful degradation of service and guarantee of seamless service. Withthe help of the user-supplied loss profiles, bandwidth usage of the applications that cansustain loss is degraded in situations where user demands exceed the networks capacityto satisfy them. A new transport sub-layer is proposed to implement loss profile by selec-tively discarding data from special applications like a compressed video stream. Anotherproposal is to have a virtual connection tree approach [24] for call routing, call admissionand resource allocation. In [24], a call admission control algorithm is proposed for QoSprovisioning for multimedia traffic, based on an adaptive resource sharing policy amongreal-time and non-real-time traffic, where the former traffic class has preemptive priorityover the latter. A simple analytic model based on Poisson call arrivals and departures andthreshold rules for each class of traffic are proposed to capture various QoS parameterslike call blocking and dropping probabilities and the probability for minimum bandwidthavailability for non-real-time requests which share the available bandwidth equally amongthemselves. Das et al.[32] addressed QoS provisioning techniques in cellular networksfor both real-time and non-real-time data-flows at the link layer and proposed schemesfor issues like bandwidth compaction, channel reservation and degradation to satisfy QoSrequirements for multimedia traffic.
6.1.6 ConclusionContributions and drawbacks of these related works:
1. Many E2E QoS frameworks were proposed but solid implementation and simula-tion output are still missing.
2. QoS attributes mapping are designed but not all implemented.
3. Some work more focused on the RRM implementation, some on CAC control, nocore network QoS user plane mechanisms are investigated in depth.
4. None of the framework gives a clear picture about the impact of mixing real-timeand non-realtime traffics on the QoS aspects.
6.2 Problem DelimitationBased on the above discussion, it is obvious that very few research is taking in CoreNetwork as the bottleneck. However, as the 3G evolution is making the radio link band-width higher and higher (via HSDPA, OFDM, etc) and the traffic between the Internet and
67

CHAPTER 6. DELIMITATION
the wireless network is getting heavier, the GGSN capacity may becomes the bottleneck.Therefor we chose the following scenarios to investigate:
• Assume both external IP network and UMTS IP backbone support DiffServ ap-proach.
• In UMTS network domain, we select to utilize three mechanisms to achieve QoSprovisioning:
– QoS attributes mapping between External IP QoS classes and UMTS QoSclasses at GGSN.
– Call Admission Control in GGSN, according to Equivalent Bandwidth(EB).
– Policing, Scheduling and congestion control mechanisms in Core Networktransmission.
68

Chapter 7
Preliminary Simulation
7.1 Simulation including UTRANThe first preliminary simulation on E2E is based on best effort QoS strategy, meaningdifferent type of traffics (in UMTS traffic classes definition) are treated equally. Thesimulation topology is depicted in Figure 7.1.
UE2
UE3
UE1
Node B SGSNRNC GGSN
ApplicationServer1
ApplicationServer2
ApplicationServer3
Figure 7.1: E2E Network topology in using Best Effort strategy
7.1.1 Simulation settingsTraffic model
The traffic model in this simulation is simple and to show the different behavior of RTand NRT traffics and how they will effect each other when aggregated in a common link.Generally, in an IP based network with various traffic source.The link congestion is dueto the contemporary traffic overload caused by the independent random sending of thesesources. In contemporary congestion period, the total sending rate of all sources willbe greater than the link bandwidth ( This is unlikely to happen in a long term, since the
69
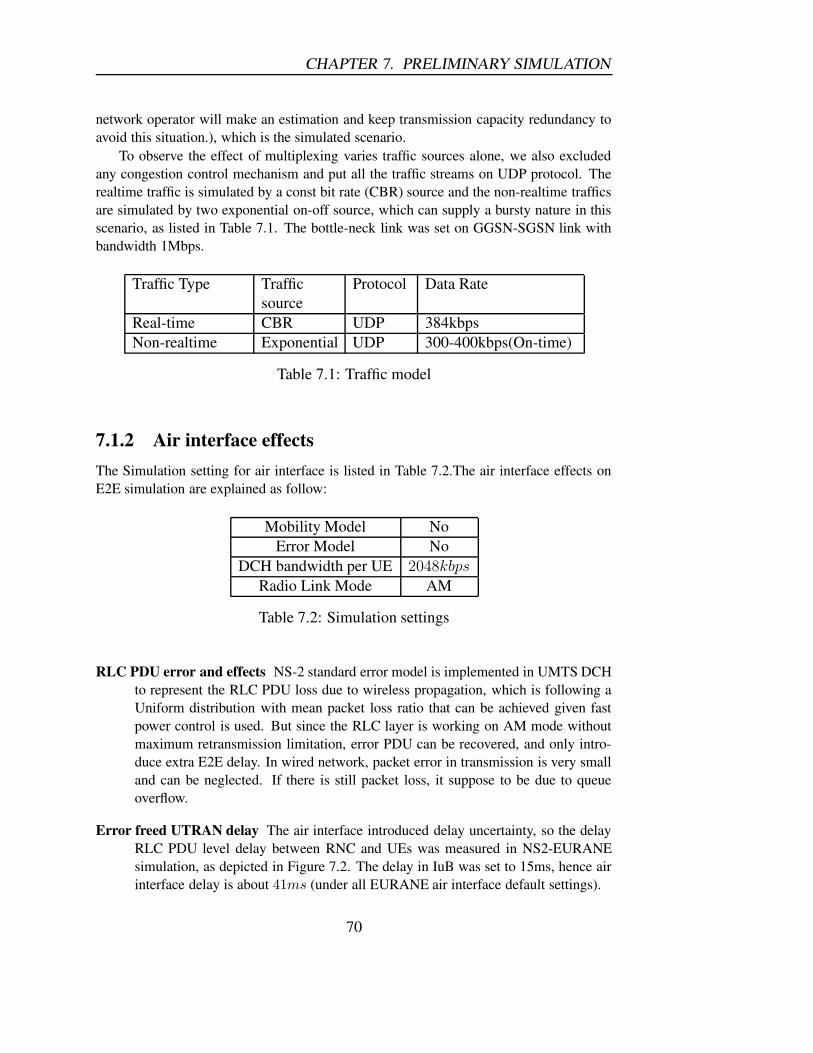
CHAPTER 7. PRELIMINARY SIMULATION
network operator will make an estimation and keep transmission capacity redundancy toavoid this situation.), which is the simulated scenario.
To observe the effect of multiplexing varies traffic sources alone, we also excludedany congestion control mechanism and put all the traffic streams on UDP protocol. Therealtime traffic is simulated by a const bit rate (CBR) source and the non-realtime trafficsare simulated by two exponential on-off source, which can supply a bursty nature in thisscenario, as listed in Table 7.1. The bottle-neck link was set on GGSN-SGSN link withbandwidth 1Mbps.
Traffic Type Trafficsource
Protocol Data Rate
Real-time CBR UDP 384kbpsNon-realtime Exponential UDP 300-400kbps(On-time)
Table 7.1: Traffic model
7.1.2 Air interface effectsThe Simulation setting for air interface is listed in Table 7.2.The air interface effects onE2E simulation are explained as follow:
Mobility Model NoError Model No
DCH bandwidth per UE 2048kbps
Radio Link Mode AM
Table 7.2: Simulation settings
RLC PDU error and effects NS-2 standard error model is implemented in UMTS DCHto represent the RLC PDU loss due to wireless propagation, which is following aUniform distribution with mean packet loss ratio that can be achieved given fastpower control is used. But since the RLC layer is working on AM mode withoutmaximum retransmission limitation, error PDU can be recovered, and only intro-duce extra E2E delay. In wired network, packet error in transmission is very smalland can be neglected. If there is still packet loss, it suppose to be due to queueoverflow.
Error freed UTRAN delay The air interface introduced delay uncertainty, so the delayRLC PDU level delay between RNC and UEs was measured in NS2-EURANEsimulation, as depicted in Figure 7.2. The delay in IuB was set to 15ms, hence airinterface delay is about 41ms (under all EURANE air interface default settings).
70
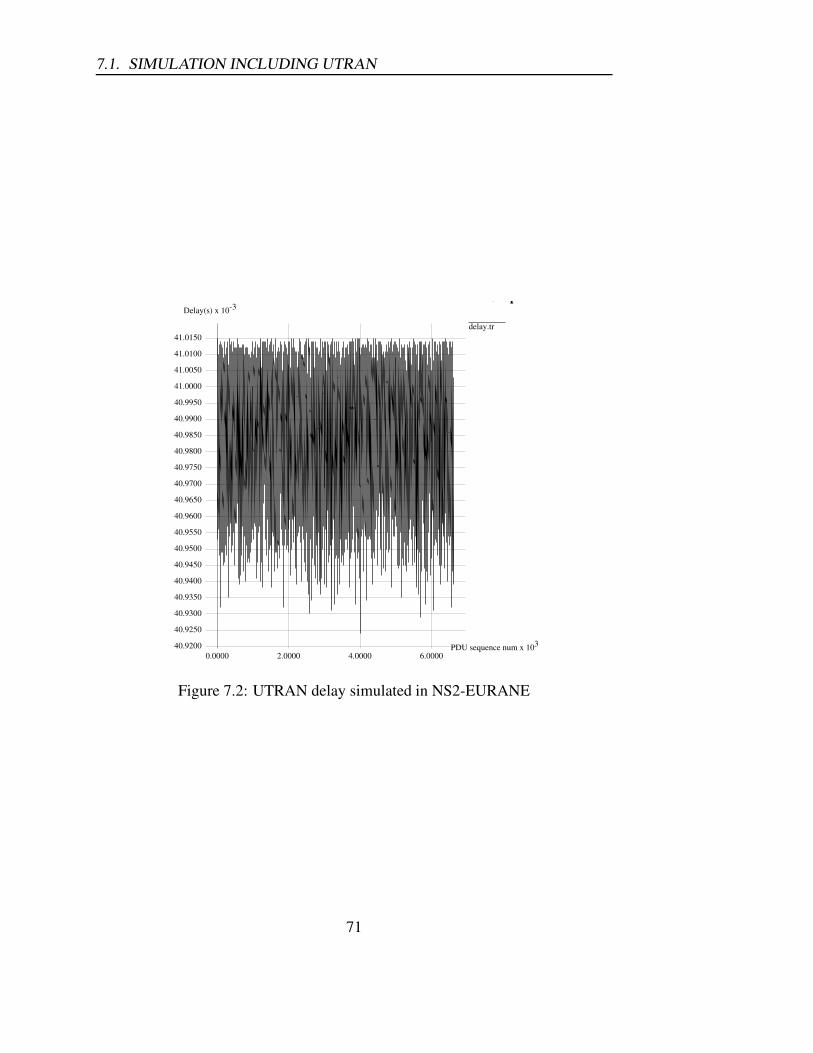
7.1. SIMULATION INCLUDING UTRAN
X Graph
delay.tr
Delay(s) x 10-3
3PDU sequence num x 1040.9200
40.9250
40.9300
40.9350
40.9400
40.9450
40.9500
40.9550
40.9600
40.9650
40.9700
40.9750
40.9800
40.9850
40.9900
40.9950
41.0000
41.0050
41.0100
41.0150
0.0000 2.0000 4.0000 6.0000
Figure 7.2: UTRAN delay simulated in NS2-EURANE
71

CHAPTER 7. PRELIMINARY SIMULATION
7.1.3 Simulation result and ConclusionFigure 7.3 shows user throughput when the total traffic load is higher then the bandwidthin Core network (SGSN-GGSN). It can be observed that in Best Effort transmission, the
Figure 7.3: Traffic throughput in a 10% overload scenario
real-time traffics will suffered from the mixing with non-realtime Traffics in link conges-tion. When the realtime packets meet the "burst" of non-realtime packets, both have towait in queue, which introduces jitter when they are received. Jitter is not a problem forthe non-realtime services but really a trouble for realtime services, especially for conver-sational service. Therefor, real-time and non-realtime should be handled separately toguarantee the QoS requirements of real-time services. This principle can be implementedin differentiated policing,queuing, scheduling technics.
7.2 Simulation on DiffServ wired networkThe purpose of this part is to evaluate the impact of different IP network QoS provisioningmechanisms when they are implemented in UMTS core network, and their performanceunder different higher layer protocols and UMTS traffic classes.
It has been explained in chapter 4 that RED queuing can control the average queuesize for TCP based traffics by random early dropping. And RED is also available in theDiffServ module of NS2 simulator. For UDP based traffics, RED should have no effectson them since UDP sender cannot interactive with packets dropping. But to be careful wedid the following simulation to test.
72
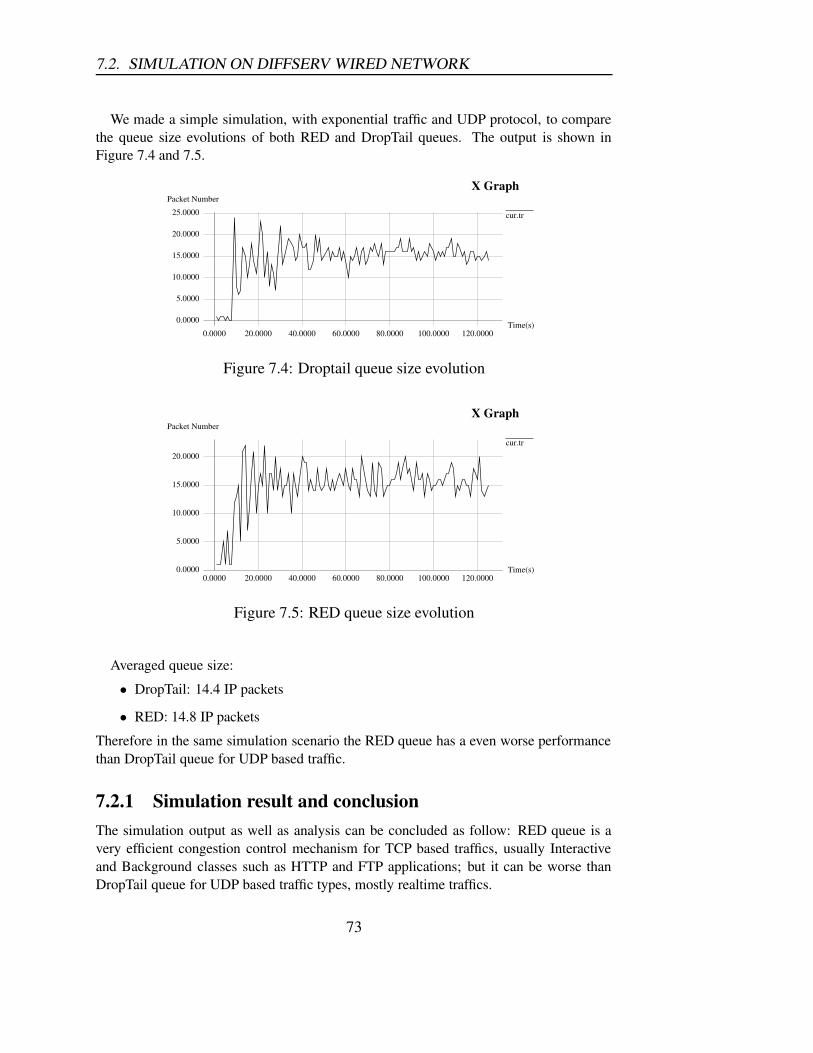
7.2. SIMULATION ON DIFFSERV WIRED NETWORK
We made a simple simulation, with exponential traffic and UDP protocol, to comparethe queue size evolutions of both RED and DropTail queues. The output is shown inFigure 7.4 and 7.5.
X Graph
cur.tr
Packet Number
Time(s)0.0000
5.0000
10.0000
15.0000
20.0000
25.0000
0.0000 20.0000 40.0000 60.0000 80.0000 100.0000 120.0000
Figure 7.4: Droptail queue size evolution
X Graph
cur.tr
Packet Number
Time(s)0.0000
5.0000
10.0000
15.0000
20.0000
0.0000 20.0000 40.0000 60.0000 80.0000 100.0000 120.0000
Figure 7.5: RED queue size evolution
Averaged queue size:
• DropTail: 14.4 IP packets
• RED: 14.8 IP packets
Therefore in the same simulation scenario the RED queue has a even worse performancethan DropTail queue for UDP based traffic.
7.2.1 Simulation result and conclusionThe simulation output as well as analysis can be concluded as follow: RED queue is avery efficient congestion control mechanism for TCP based traffics, usually Interactiveand Background classes such as HTTP and FTP applications; but it can be worse thanDropTail queue for UDP based traffic types, mostly realtime traffics.
73

Chapter 8
Development of QoS algorithm
The development of E2E QoS algorithm is described in terms of following mechanisms:
1. Mapping
2. Admission Control
3. Policing
4. Buffering and scheduling
However, the investigated scenario and assumptions as well as optimization targets willbe described before discussing the algorithm.
8.1 General assumptions and optimization targetThe investigated end-to-end scenario for QoS algorithm development is depicted in Fig-ure 9.1. There application servers on an external network and will send a downlink datastreams to the UEs in one UMTS cell. The sent IP data packets will be handled by Edgerouters, GGSN, SGSN and RNC in turn. Then segmented to RLC PDU in RNC and for-warded to NodeB .In NodeB, PDU will be transmitted via Dedicated Transport Channel(DCH) to UEs. In this scenario application servers and edge routers belong to internetor external IP network domain and GGSN,SGSN,RNC, NodeB belong to UMTS domain.Both external IP network and UMTS IP based core network support DiffServ.
Each server will send only one type of application data corresponding to one UMTSservice class. Each UE can use multiple types of services and set up multiple connectionssimultaneously. The general traffic model are assumed as in Table 8.1, and session of theindividual types of traffic arrive according to Poisson process.
74
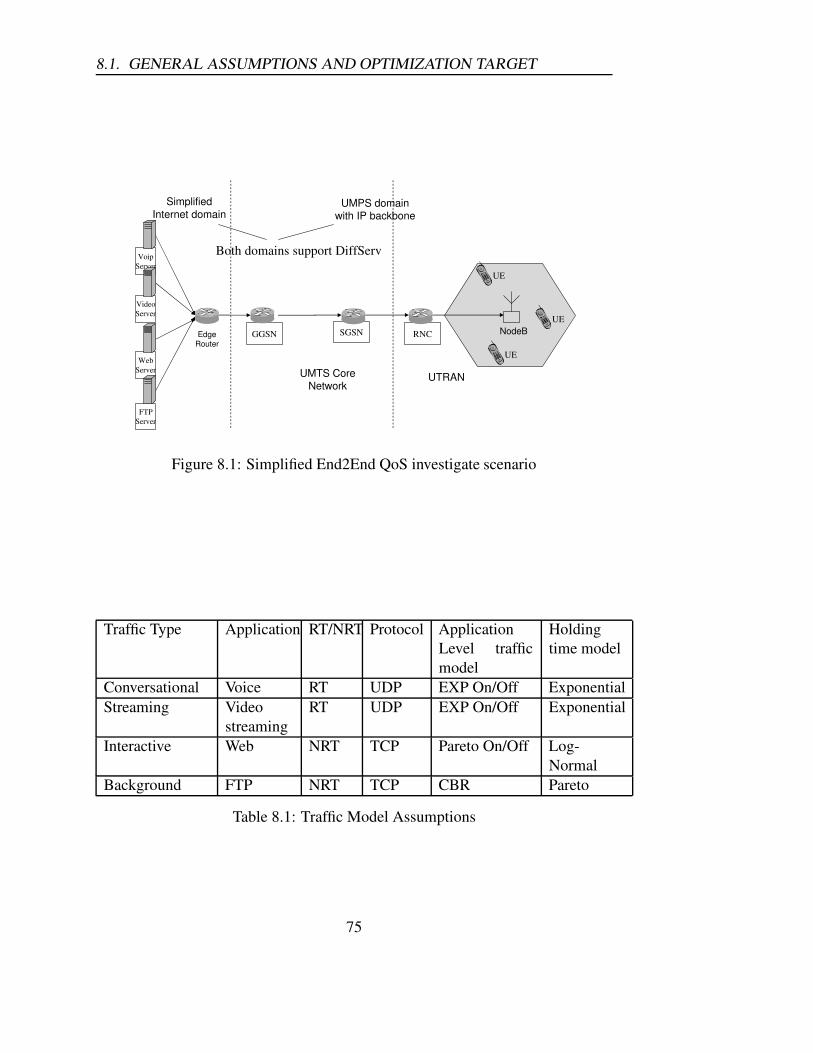
8.1. GENERAL ASSUMPTIONS AND OPTIMIZATION TARGET
RNCGGSN SGSN
VoipServer
VideoServer
WebServer
FTPServer
EdgeRouter
SimplifiedInternet domain
UMPS domain with IP backbone
Both domains support DiffServ
UE
UE
UENodeB
UMTS Core Network
UTRAN
Figure 8.1: Simplified End2End QoS investigate scenario
Traffic Type Application RT/NRT Protocol ApplicationLevel trafficmodel
Holdingtime model
Conversational Voice RT UDP EXP On/Off ExponentialStreaming Video
streamingRT UDP EXP On/Off Exponential
Interactive Web NRT TCP Pareto On/Off Log-Normal
Background FTP NRT TCP CBR Pareto
Table 8.1: Traffic Model Assumptions
75
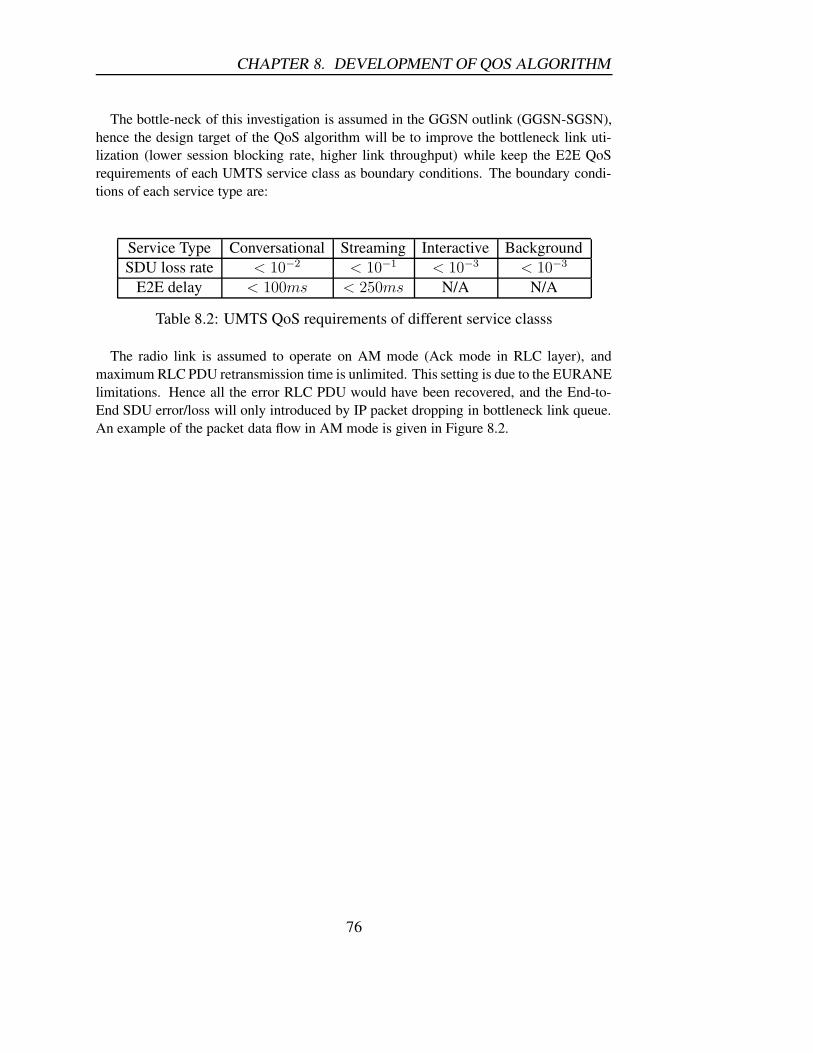
CHAPTER 8. DEVELOPMENT OF QOS ALGORITHM
The bottle-neck of this investigation is assumed in the GGSN outlink (GGSN-SGSN),hence the design target of the QoS algorithm will be to improve the bottleneck link uti-lization (lower session blocking rate, higher link throughput) while keep the E2E QoSrequirements of each UMTS service class as boundary conditions. The boundary condi-tions of each service type are:
Service Type Conversational Streaming Interactive BackgroundSDU loss rate < 10−2 < 10−1 < 10−3 < 10−3
E2E delay < 100ms < 250ms N/A N/A
Table 8.2: UMTS QoS requirements of different service classs
The radio link is assumed to operate on AM mode (Ack mode in RLC layer), andmaximum RLC PDU retransmission time is unlimited. This setting is due to the EURANElimitations. Hence all the error RLC PDU would have been recovered, and the End-to-End SDU error/loss will only introduced by IP packet dropping in bottleneck link queue.An example of the packet data flow in AM mode is given in Figure 8.2.
76
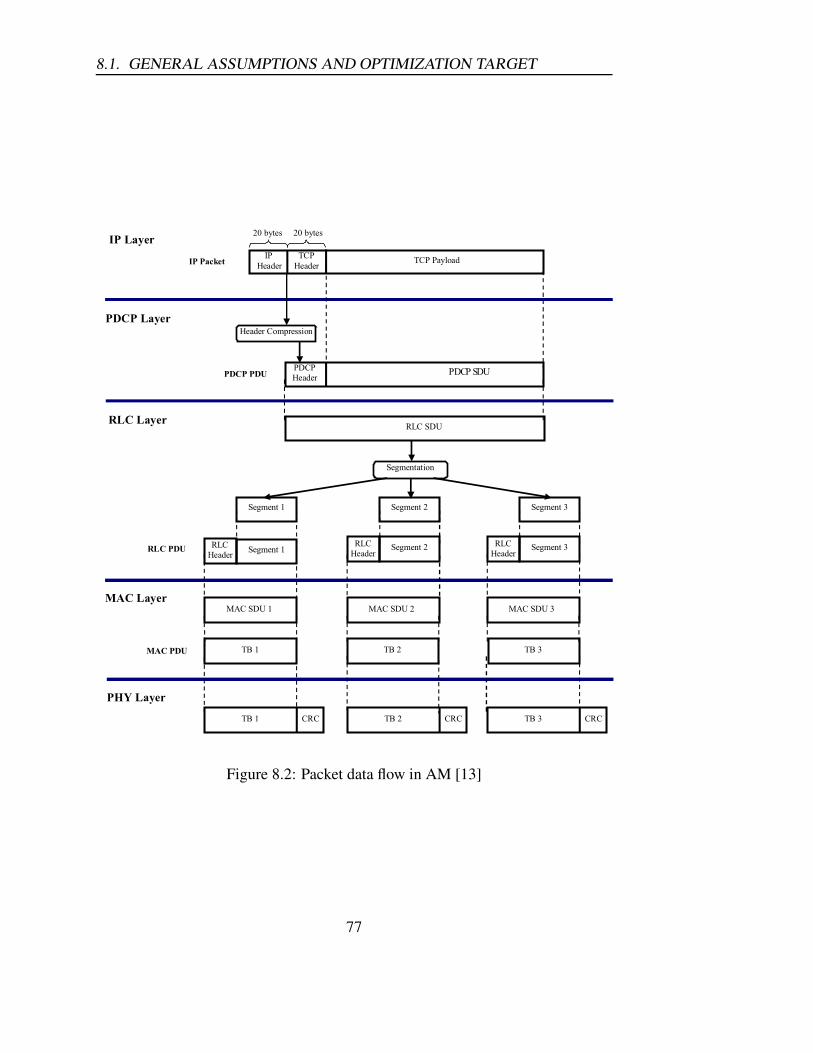
8.1. GENERAL ASSUMPTIONS AND OPTIMIZATION TARGET
�
���������
������� �
�������� �������� ��������
������������
��������������� ������������
�������
����
�������
���������� ���������� ����������
����� ����� �����
��������� ��������� ���������
����������
��������
����������
�����
�������
����
�������
���
���������������� ���
��������
���������������� ������� �
��������
��������
�� ��
���� ��
���� ��
��� ������� ����
Figure 8.2: Packet data flow in AM [13]
77
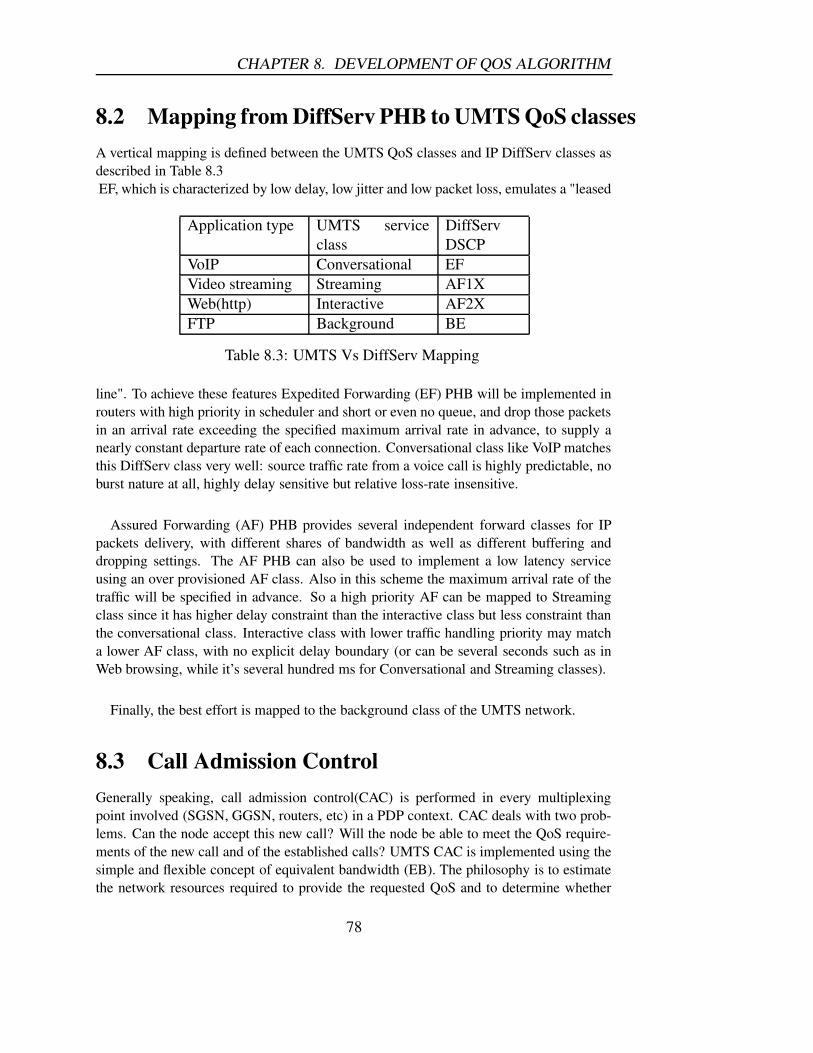
CHAPTER 8. DEVELOPMENT OF QOS ALGORITHM
8.2 Mapping from DiffServ PHB to UMTS QoS classesA vertical mapping is defined between the UMTS QoS classes and IP DiffServ classes asdescribed in Table 8.3EF, which is characterized by low delay, low jitter and low packet loss, emulates a "leased
Application type UMTS serviceclass
DiffServDSCP
VoIP Conversational EFVideo streaming Streaming AF1XWeb(http) Interactive AF2XFTP Background BE
Table 8.3: UMTS Vs DiffServ Mapping
line". To achieve these features Expedited Forwarding (EF) PHB will be implemented inrouters with high priority in scheduler and short or even no queue, and drop those packetsin an arrival rate exceeding the specified maximum arrival rate in advance, to supply anearly constant departure rate of each connection. Conversational class like VoIP matchesthis DiffServ class very well: source traffic rate from a voice call is highly predictable, noburst nature at all, highly delay sensitive but relative loss-rate insensitive.
Assured Forwarding (AF) PHB provides several independent forward classes for IPpackets delivery, with different shares of bandwidth as well as different buffering anddropping settings. The AF PHB can also be used to implement a low latency serviceusing an over provisioned AF class. Also in this scheme the maximum arrival rate of thetraffic will be specified in advance. So a high priority AF can be mapped to Streamingclass since it has higher delay constraint than the interactive class but less constraint thanthe conversational class. Interactive class with lower traffic handling priority may matcha lower AF class, with no explicit delay boundary (or can be several seconds such as inWeb browsing, while it’s several hundred ms for Conversational and Streaming classes).
Finally, the best effort is mapped to the background class of the UMTS network.
8.3 Call Admission ControlGenerally speaking, call admission control(CAC) is performed in every multiplexingpoint involved (SGSN, GGSN, routers, etc) in a PDP context. CAC deals with two prob-lems. Can the node accept this new call? Will the node be able to meet the QoS require-ments of the new call and of the established calls? UMTS CAC is implemented using thesimple and flexible concept of equivalent bandwidth (EB). The philosophy is to estimatethe network resources required to provide the requested QoS and to determine whether
78
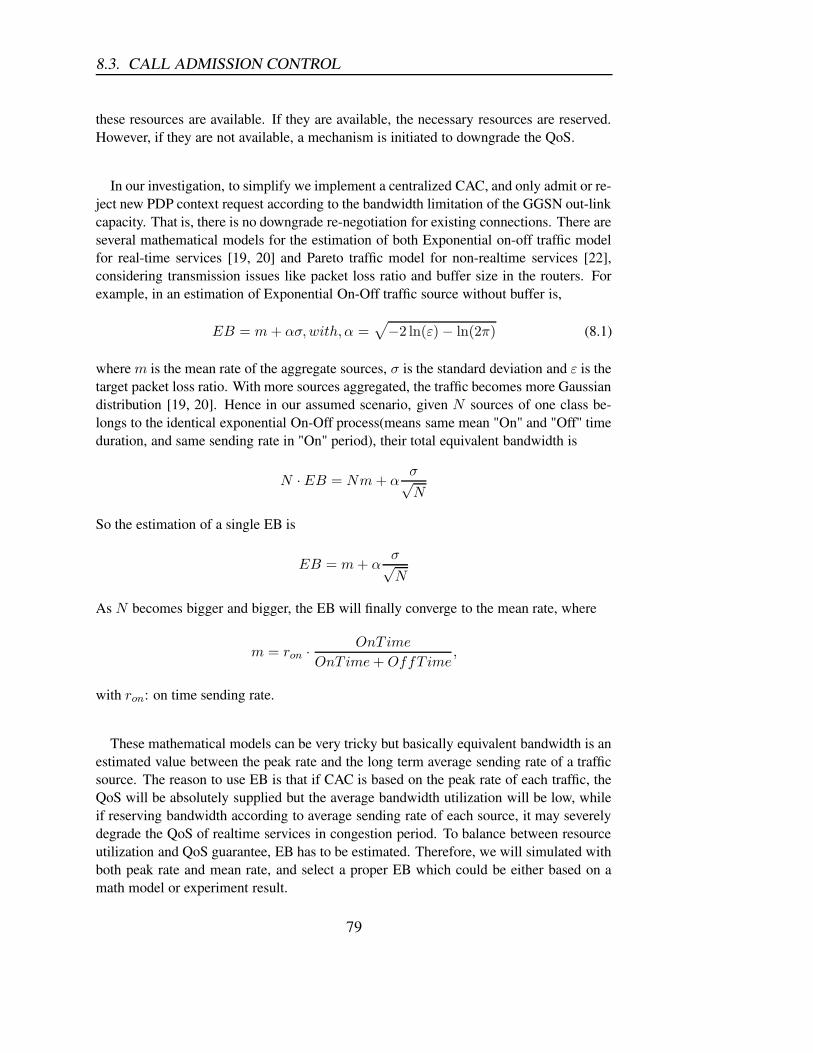
8.3. CALL ADMISSION CONTROL
these resources are available. If they are available, the necessary resources are reserved.However, if they are not available, a mechanism is initiated to downgrade the QoS.
In our investigation, to simplify we implement a centralized CAC, and only admit or re-ject new PDP context request according to the bandwidth limitation of the GGSN out-linkcapacity. That is, there is no downgrade re-negotiation for existing connections. There areseveral mathematical models for the estimation of both Exponential on-off traffic modelfor real-time services [19, 20] and Pareto traffic model for non-realtime services [22],considering transmission issues like packet loss ratio and buffer size in the routers. Forexample, in an estimation of Exponential On-Off traffic source without buffer is,
EB = m + ασ,with, α =√
−2 ln(ε) − ln(2π) (8.1)
where m is the mean rate of the aggregate sources, σ is the standard deviation and ε is thetarget packet loss ratio. With more sources aggregated, the traffic becomes more Gaussiandistribution [19, 20]. Hence in our assumed scenario, given N sources of one class be-longs to the identical exponential On-Off process(means same mean "On" and "Off" timeduration, and same sending rate in "On" period), their total equivalent bandwidth is
N · EB = Nm + ασ
√N
So the estimation of a single EB is
EB = m + ασ
√N
As N becomes bigger and bigger, the EB will finally converge to the mean rate, where
m = ron ·OnTime
OnT ime + OffT ime,
with ron: on time sending rate.
These mathematical models can be very tricky but basically equivalent bandwidth is anestimated value between the peak rate and the long term average sending rate of a trafficsource. The reason to use EB is that if CAC is based on the peak rate of each traffic, theQoS will be absolutely supplied but the average bandwidth utilization will be low, whileif reserving bandwidth according to average sending rate of each source, it may severelydegrade the QoS of realtime services in congestion period. To balance between resourceutilization and QoS guarantee, EB has to be estimated. Therefore, we will simulated withboth peak rate and mean rate, and select a proper EB which could be either based on amath model or experiment result.
79

CHAPTER 8. DEVELOPMENT OF QOS ALGORITHM
8.4 Policing, buffering and scheduling
Policing, buffering and scheduling mechanisms are performed each time a packet is sentand/or received (typically microseconds). Policing and buffer acceptance mechanisms arealgorithms that decide when a packet arrives, whether or not it can be accepted. Schedul-ing algorithms decide when and which packet to send first. The full implementationstructure of these mechanisms is shown in Figure 8.3.
Meter/Marker
IP Packets
GGSN
Edge router(Ingress/Egress router
In external DiffServ domain )Application
server SGSN
EF
AF1x
REDAF2x
REDBE
Scheduler
Figure 8.3: Policing, buffering and scheduling Implementation
8.4.1 Policing and Multiple queuing
A policer at the edge router is the function to implement DSCP marking, usually it in-cludes two code points (CP) ("red" or "green") for each traffic, which means can be IPpackets with different color can be handled later with different physical/virtual queuesand different treatment. Since the implemented traffic source in NS2 will not excess itspeak rate (CIR), the two color marking is not necessary. Hence we decide to only markthe packets of each type of traffic with one color, "green", and handle them with multiplequeues.
Multiple queues have been designed to provide different treatments to different UMTSclasses according to their DSCP field. Since RED queue only effect TCP based traf-fic streams and cannot help in congestion control of UDP based traffic, two drop-tailqueues are designed for UDP based realtime services, Conversational (C) and Streaming(S), while RED queues are for TCP based non-realtime services, Interactive (I) and Back-ground (B). The queue size will be optimized according to their different delay and packetloss requirements simultaneously.
80
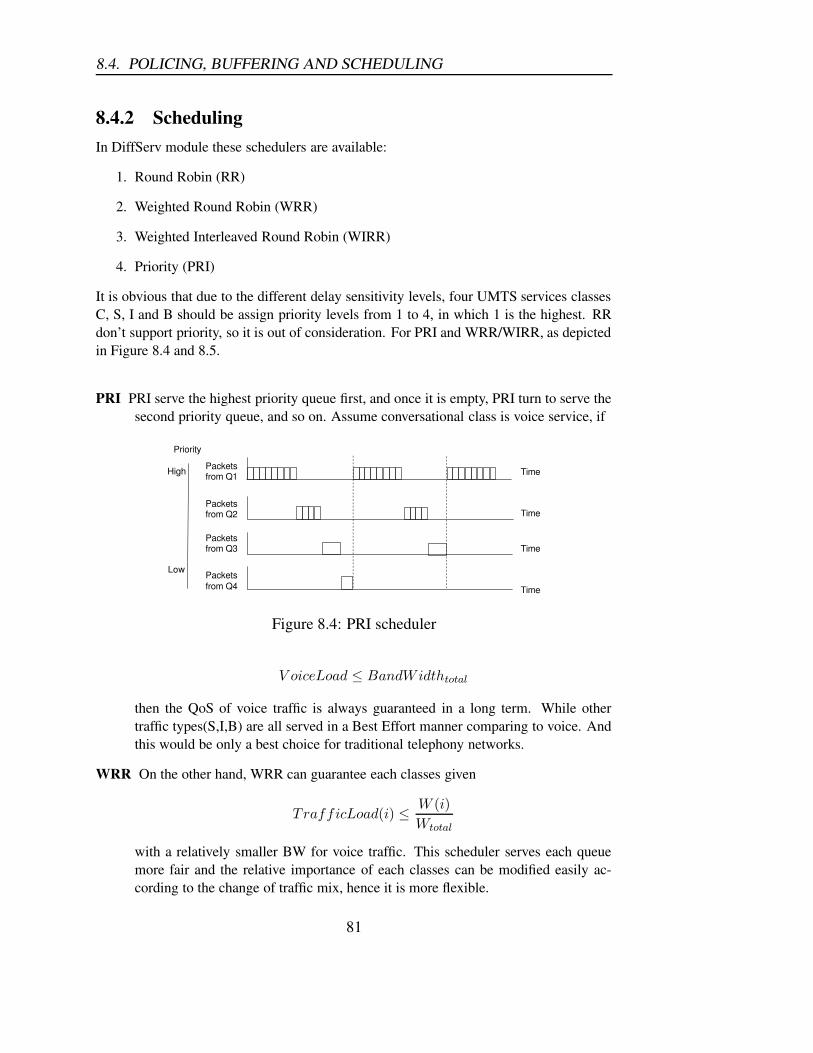
8.4. POLICING, BUFFERING AND SCHEDULING
8.4.2 SchedulingIn DiffServ module these schedulers are available:
1. Round Robin (RR)
2. Weighted Round Robin (WRR)
3. Weighted Interleaved Round Robin (WIRR)
4. Priority (PRI)
It is obvious that due to the different delay sensitivity levels, four UMTS services classesC, S, I and B should be assign priority levels from 1 to 4, in which 1 is the highest. RRdon’t support priority, so it is out of consideration. For PRI and WRR/WIRR, as depictedin Figure 8.4 and 8.5.
PRI PRI serve the highest priority queue first, and once it is empty, PRI turn to serve thesecond priority queue, and so on. Assume conversational class is voice service, if
Priority
High
Low
Packetsfrom Q1
Packetsfrom Q2
Packetsfrom Q3
Packetsfrom Q4
Time
Time
Time
Time
Figure 8.4: PRI scheduler
V oiceLoad ≤ BandWidthtotal
then the QoS of voice traffic is always guaranteed in a long term. While othertraffic types(S,I,B) are all served in a Best Effort manner comparing to voice. Andthis would be only a best choice for traditional telephony networks.
WRR On the other hand, WRR can guarantee each classes given
TrafficLoad(i) ≤W (i)
Wtotal
with a relatively smaller BW for voice traffic. This scheduler serves each queuemore fair and the relative importance of each classes can be modified easily ac-cording to the change of traffic mix, hence it is more flexible.
81

CHAPTER 8. DEVELOPMENT OF QOS ALGORITHM
Priority
High
Low
Packetsfrom Q1
Packetsfrom Q2
Packetsfrom Q3
Packetsfrom Q4
Time
Time
Time
Time
Figure 8.5: WRR scheduler
Technology GSM UMTSSwitching type CS PS
Transport Bandwidth per call 64kb(PCM) 16kb (i.e, via VOIP )Cost Bandwidth ratio 100% 25%
Either PRI or WRR/WIRR can be a good choice. The selection between two sched-ulers depends on the traffic model features. For example, as the mobile operators trans-fer from 2G to 3G technology, the predictable voice traffic will only maintain a slow orflat increase. Assume the transport network keeps the same capacity, only upgrade fromcircuit-switch to packet-switch, and the effect will be (shown in table) So, in UMTS 75%backbone transport bandwidth (BW) can be saved for other services. Considering themultiplexing gain of Packet Switch (PS) comparing to Circuit Switch (CS), the BW sav-ing will be actually more. Since the traditional telephone service can at most occupy 25%backbone bandwidth, and UMTS air interface BW are much bigger than what voice need,while neither radio interface nor backbone can be sufficient for all Internet or multimediaservices, it will be too conservative to keep voice or conversational services always on theabsolute priority, as implemented in [22]. We have to keep in mind that most multime-dia traffics are asymmetrical and in streaming class, they are very bandwidth consumingand to guarantee their QoS profile is also very important. In this sense, we considerWRR/WIRR will be more appropriate than PRI.
8.5 conclusionThe implemented QoS algorithm is depicted in 8.6.
82
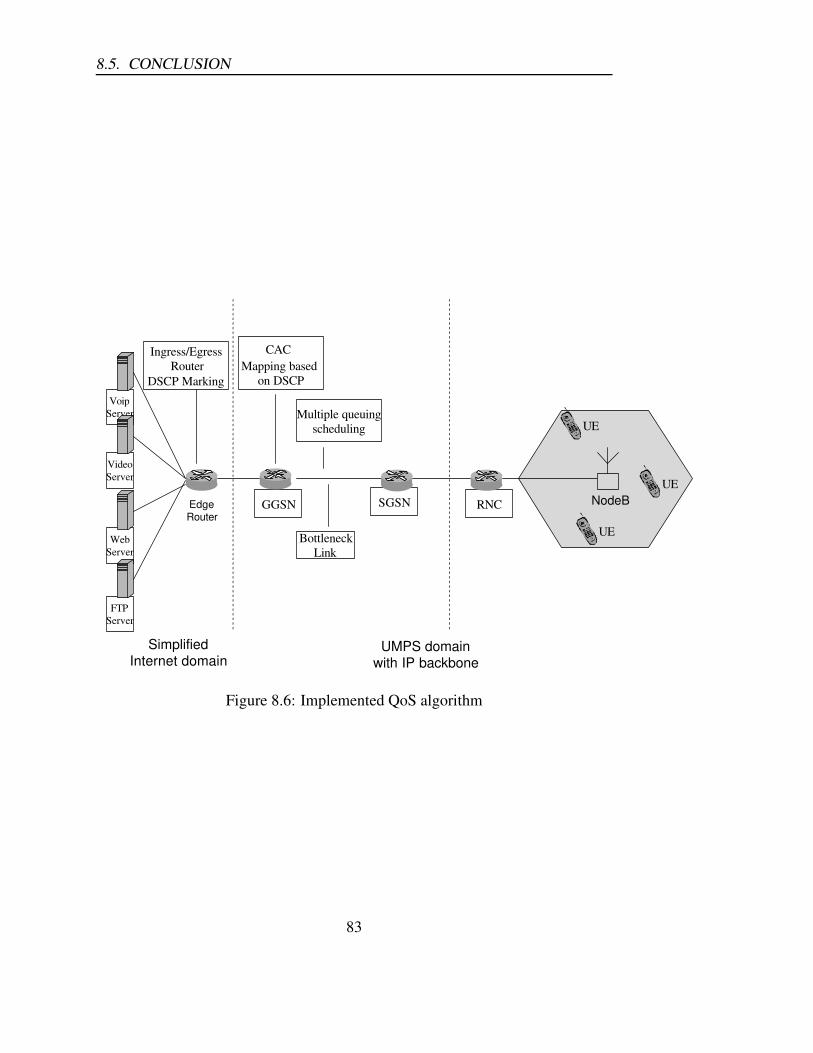
8.5. CONCLUSION
RNCGGSN SGSN
VoipServer
VideoServer
WebServer
FTPServer
EdgeRouter
SimplifiedInternet domain
UMPS domain with IP backbone
UE
UE
UENodeB
BottleneckLink
CACMapping based
on DSCP
Ingress/EgressRouter
DSCP Marking
Multiple queuingscheduling
Figure 8.6: Implemented QoS algorithm
83
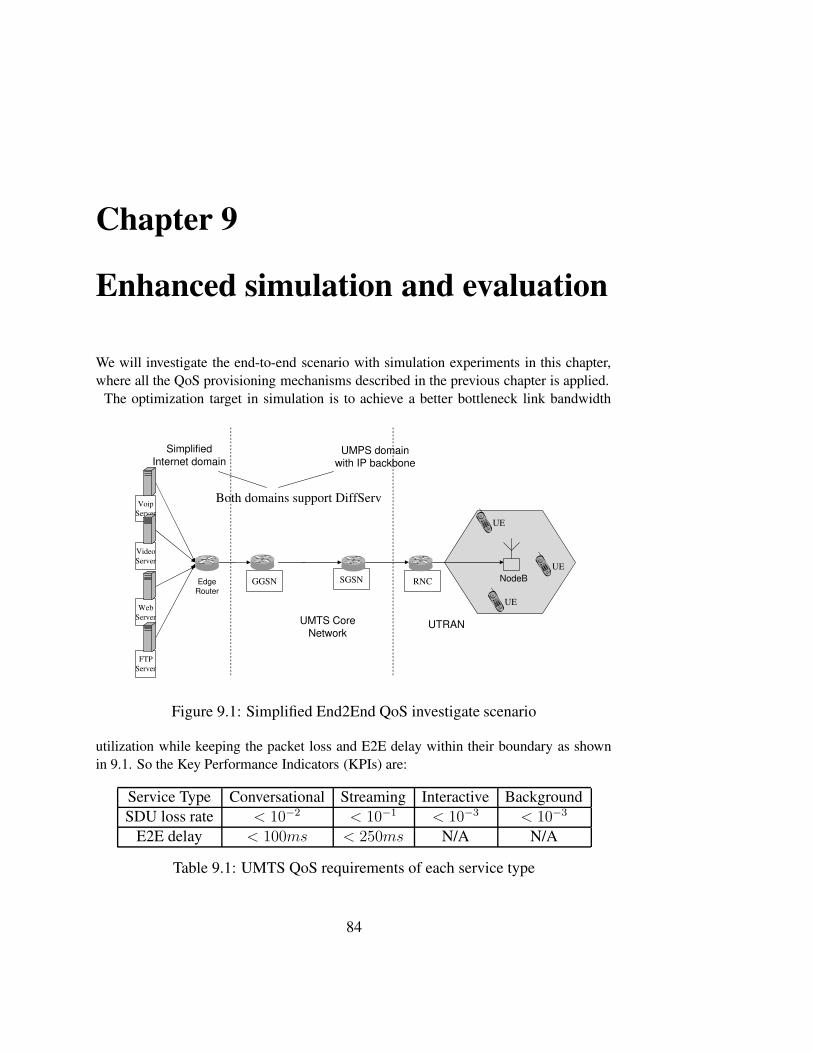
Chapter 9
Enhanced simulation and evaluation
We will investigate the end-to-end scenario with simulation experiments in this chapter,where all the QoS provisioning mechanisms described in the previous chapter is applied.
The optimization target in simulation is to achieve a better bottleneck link bandwidth
RNCGGSN SGSN
VoipServer
VideoServer
WebServer
FTPServer
EdgeRouter
SimplifiedInternet domain
UMPS domain with IP backbone
Both domains support DiffServ
UE
UE
UENodeB
UMTS Core Network
UTRAN
Figure 9.1: Simplified End2End QoS investigate scenario
utilization while keeping the packet loss and E2E delay within their boundary as shownin 9.1. So the Key Performance Indicators (KPIs) are:
Service Type Conversational Streaming Interactive BackgroundSDU loss rate < 10−2 < 10−1 < 10−3 < 10−3
E2E delay < 100ms < 250ms N/A N/A
Table 9.1: UMTS QoS requirements of each service type
84

9.1. SIMULATION SCENARIO
• E2E delay
• IP packet loss (UMTS SDU loss)
• Bottleneck link (GGSN - SGSN) bandwidth utilization
9.1 Simulation scenarioAs shown in Figure 9.1, there are four application servers located in the Internet do-main, and each one of them supplies one type of application: Voice over IP(VoIP), videostreaming, web service via HTTP, or FTP download. The IP data packets are sent to theedge router, which is simplified as both the Ingress and Egress router of external DiffServdomain. The edge router marks IP packets with different DSCP according to their applica-tion type, and send them to GGSN. GGSN then should attach them with GPRS TunnelingProtocol (GTP) and encapsulated into the UMTS IP transport layer, which is simplifiedin the simulator. The GGSN outlink differentiate each IP data flow according there DSCP(GGSN doesn’t change their DSCP assigned from external network) and transmits themwith the queuing and scheduling schemes described in the previous chapter. Then SGSNreceives them and forward to RNC, where the IP header will be compressed into PDCPheader, and a whole IP packet are converted into RLC SDU. Hence the RLC layer in RNCsegments one RLC SDU into several RLC PDU and further mapped into DCH frames andsent on air interface.As shown in Figure 9.2, the radio link settings are relatively simple since it is not consid-
Simulated Duration
Link Bandwidth (Mbps) Link Delay (ms)Server - Edge Router 10 20Edge Router - GGSN 10 2
GGSN - SGSN 1 2SGSN - RNC 10 2
RNC - NodeB (IuB) 10 5
Simulated cell numberCell capacity limitation
Active UE Number
DCH bandwidthFast Power Control
Radio link RLC PDU errorMobility model
Wireline
Wireless
No
384kbps
17.68Mbps
Uniform distributed, mean=0.01Ideal
20 min
20(UE can have multiple sessions simultaneous)
Figure 9.2: Simulation Parameters
ered as the bottleneck of our investigation. The DCH works on AM mode, and maximumRLC layer retransmission time is unlimited. This setting is due to the EURANE limita-tions. Hence all the error RLC PDU would have been recovered, and the End-to-End SDU
85
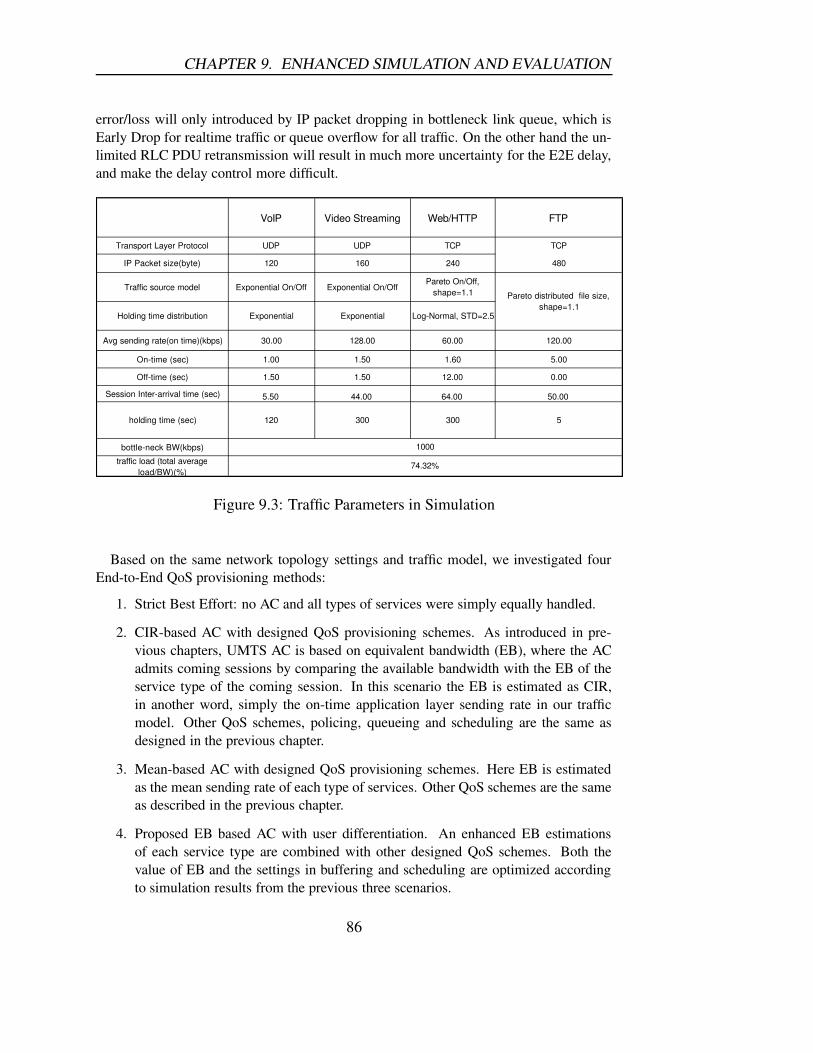
CHAPTER 9. ENHANCED SIMULATION AND EVALUATION
error/loss will only introduced by IP packet dropping in bottleneck link queue, which isEarly Drop for realtime traffic or queue overflow for all traffic. On the other hand the un-limited RLC PDU retransmission will result in much more uncertainty for the E2E delay,and make the delay control more difficult.
VoIP Video Streaming Web/HTTP FTP
Transport Layer Protocol UDP UDP TCP TCP
IP Packet size(byte) 120 160 240 480
Traffic source model Exponential On/Off Exponential On/OffPareto On/Off,
shape=1.1
Holding time distribution Exponential Exponential Log-Normal, STD=2.5
Avg sending rate(on time)(kbps) 30.00 128.00 60.00 120.00
On-time (sec) 1.00 1.50 1.60 5.00
Off-time (sec) 1.50 1.50 12.00 0.00
Session Inter-arrival time (sec) 5.50 44.00 64.00 50.00
holding time (sec) 120 300 300 5
bottle-neck BW(kbps)
traffic load (total averageload/BW)(%)
Pareto distributed file size,shape=1.1
1000
74.32%
Figure 9.3: Traffic Parameters in Simulation
Based on the same network topology settings and traffic model, we investigated fourEnd-to-End QoS provisioning methods:
1. Strict Best Effort: no AC and all types of services were simply equally handled.
2. CIR-based AC with designed QoS provisioning schemes. As introduced in pre-vious chapters, UMTS AC is based on equivalent bandwidth (EB), where the ACadmits coming sessions by comparing the available bandwidth with the EB of theservice type of the coming session. In this scenario the EB is estimated as CIR,in another word, simply the on-time application layer sending rate in our trafficmodel. Other QoS schemes, policing, queueing and scheduling are the same asdesigned in the previous chapter.
3. Mean-based AC with designed QoS provisioning schemes. Here EB is estimatedas the mean sending rate of each type of services. Other QoS schemes are the sameas described in the previous chapter.
4. Proposed EB based AC with user differentiation. An enhanced EB estimationsof each service type are combined with other designed QoS schemes. Both thevalue of EB and the settings in buffering and scheduling are optimized accordingto simulation results from the previous three scenarios.
86

9.2. PERFORMANCE EVALUATION
Notes: In all the simulated scenario, the total buffer sizes on bottleneck link (GGSNoutlink) are approximately the same.
9.2 Performance evaluation
9.2.1 Best Effort
0.00
0.20
0.40
0.60
0.80
1.00
0.0772 0.1772 0.2772 0.3772 0.4772 0.5772 0.6772
Delay(0.2549s,93%Guarantee)
CDF(X)
Figure 9.4: Voice Packet Delay Distribution in Best Effort strategy
As depicted in Figure 9.4, the 93% guaranteed E2E delay of VoIP packets is about250ms, much greater than the 100ms boundary. This result shows that the best effortstrategy caused a unacceptable QoS level for conversational service in a high traffic load.
87

CHAPTER 9. ENHANCED SIMULATION AND EVALUATION
9.2.2 CIR-based CAC with QoS schemesThe CIR(EB) parameters are set as in Table 9.2:
The result shown in Table 9.3 and Figure 9.5 and 9.6 shows that CIR-based AC with de-
Application VoIP Video WEB/HTTP FTPCIR (kbps) 30 128 60 120
Table 9.2: CIR settings for CIR-based Admission Control
UMTS CN(GGSN-SGSN) VoIP Video WEB/HTTP FTPSession Blocking Ratio 31.4% 75.8% 54.1% 76.9%
Packet Loss 0 0 0 0
Bandwidth Utilization 31.0%
Table 9.3: Simulation result of CIR-based CAC with QoS algorithm
0
0.2
0.4
0.6
0.8
1
1.2
0.079 0.084 0.089 0.094 0.099
Delay (0.084249s, 93% Guarantee)
CDF(X)
Figure 9.5: VoIP Packet Delay Distribution in CIR-based QoS algorithm
signed buffering, scheduling and policing schemes easily keep the UMTS QoS boundarybut result in very low bottleneck link bandwidth utilization, only 31%, around half of thetraffic load, and a extremely high blocking rate. Hence it is too conservative a strategy forour optimization target.
88

9.2. PERFORMANCE EVALUATION
0
0.2
0.4
0.6
0.8
1
1.2
0.0828 0.0833 0.0838 0.0843 0.0848 0.0853
Delay (0.0846s, 93% Guarantee)
CDF(X)
Figure 9.6: Video Packet Delay Distribution in CIR-based QoS algorithm
9.2.3 Mean-based CAC with QoS schemesThe mean sending rate of each type of service are used as EB and listed in Table 9.4:
It’s an aggressive CAC that could achieve the bandwidth utilization of 69.8%, which
Application VoIP Video WEB/HTTP FTPMean (kbps) 12 64 7 120
Table 9.4: Mean sending rate estimation for Mean-based Admission Control
UMTS CN(GGSN-SGSN) VoIP Video WEB/HTTP FTPSession Blocking Ratio 0.5% 8.8% 0% 0%
Packet Loss 3.2 × 10⁻² 1.0 × 10⁻² 1.4 × 10⁻² 0
Bandwidth Utilization 69.8%
Table 9.5: Simulation result of Mean-based CAC with algorithm
means it gets a good multiplexing gain. However, to keep staying inside the delay bound-ary, packet loss ratio boundary of conversational class cannot be met, while the packetloss for interactive class is also out of boundary. So the optimization approach shouldbe to reserve more resource for conversational class and interactive class in both AC andother QoS schemes.
89
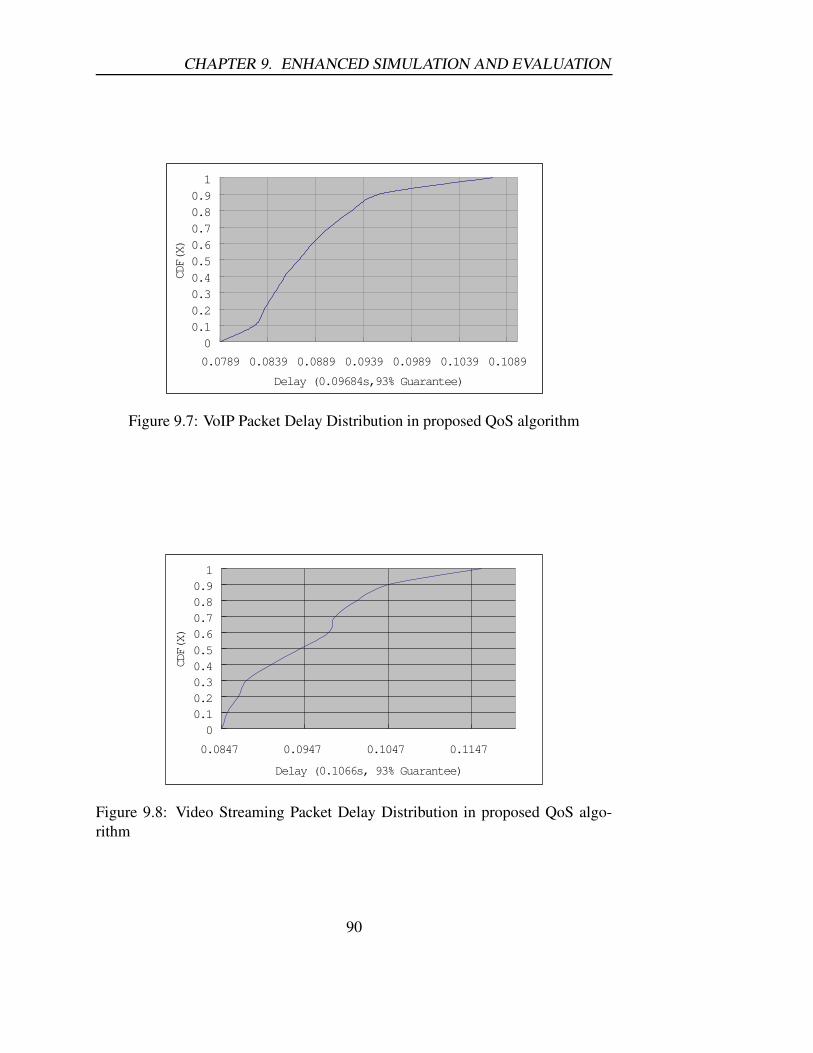
CHAPTER 9. ENHANCED SIMULATION AND EVALUATION
00.10.20.30.40.50.60.70.80.91
0.0789 0.0839 0.0889 0.0939 0.0989 0.1039 0.1089
Delay (0.09684s,93% Guarantee)
CDF(X)
Figure 9.7: VoIP Packet Delay Distribution in proposed QoS algorithm
00.10.20.30.40.5
0.60.70.80.91
0.0847 0.0947 0.1047 0.1147
Delay (0.1066s, 93% Guarantee)
CDF(X)
Figure 9.8: Video Streaming Packet Delay Distribution in proposed QoS algo-rithm
90
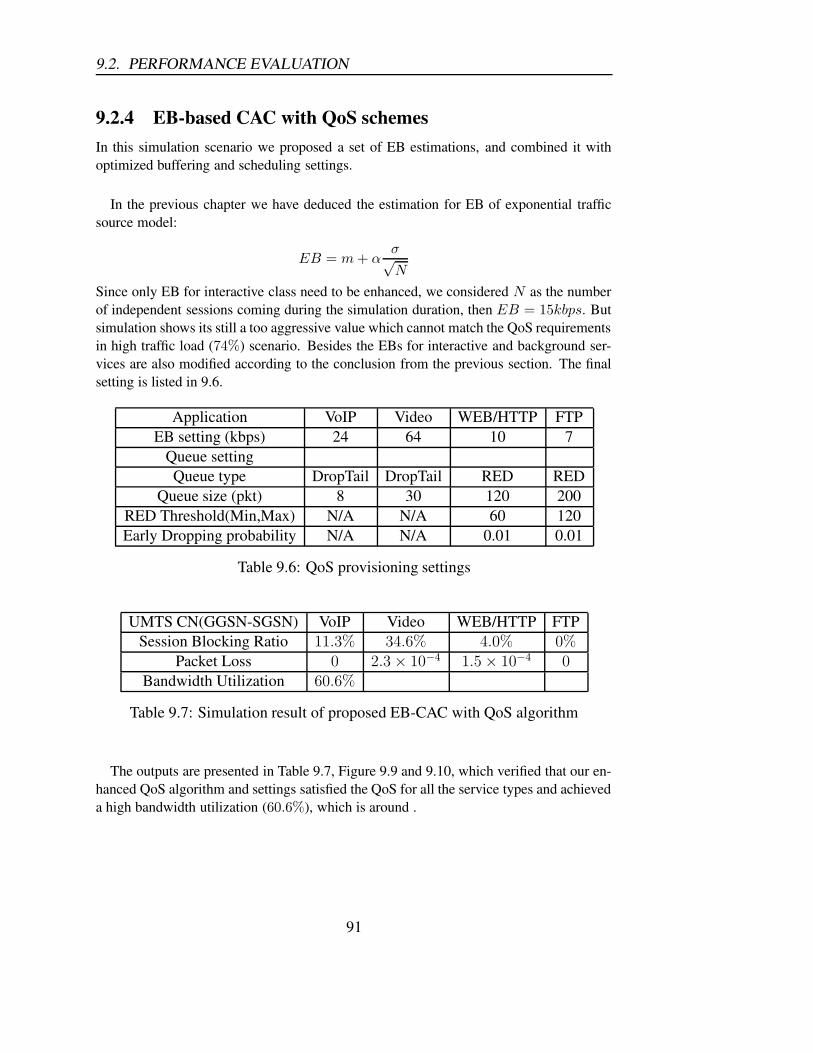
9.2. PERFORMANCE EVALUATION
9.2.4 EB-based CAC with QoS schemesIn this simulation scenario we proposed a set of EB estimations, and combined it withoptimized buffering and scheduling settings.
In the previous chapter we have deduced the estimation for EB of exponential trafficsource model:
EB = m + ασ
√N
Since only EB for interactive class need to be enhanced, we considered N as the numberof independent sessions coming during the simulation duration, then EB = 15kbps. Butsimulation shows its still a too aggressive value which cannot match the QoS requirementsin high traffic load (74%) scenario. Besides the EBs for interactive and background ser-vices are also modified according to the conclusion from the previous section. The finalsetting is listed in 9.6.
Application VoIP Video WEB/HTTP FTPEB setting (kbps) 24 64 10 7
Queue settingQueue type DropTail DropTail RED RED
Queue size (pkt) 8 30 120 200RED Threshold(Min,Max) N/A N/A 60 120Early Dropping probability N/A N/A 0.01 0.01
Table 9.6: QoS provisioning settings
UMTS CN(GGSN-SGSN) VoIP Video WEB/HTTP FTPSession Blocking Ratio 11.3% 34.6% 4.0% 0%
Packet Loss 0 2.3 × 10⁻⁴ 1.5 × 10⁻⁴ 0
Bandwidth Utilization 60.6%
Table 9.7: Simulation result of proposed EB-CAC with QoS algorithm
The outputs are presented in Table 9.7, Figure 9.9 and 9.10, which verified that our en-hanced QoS algorithm and settings satisfied the QoS for all the service types and achieveda high bandwidth utilization (60.6%), which is around .
91
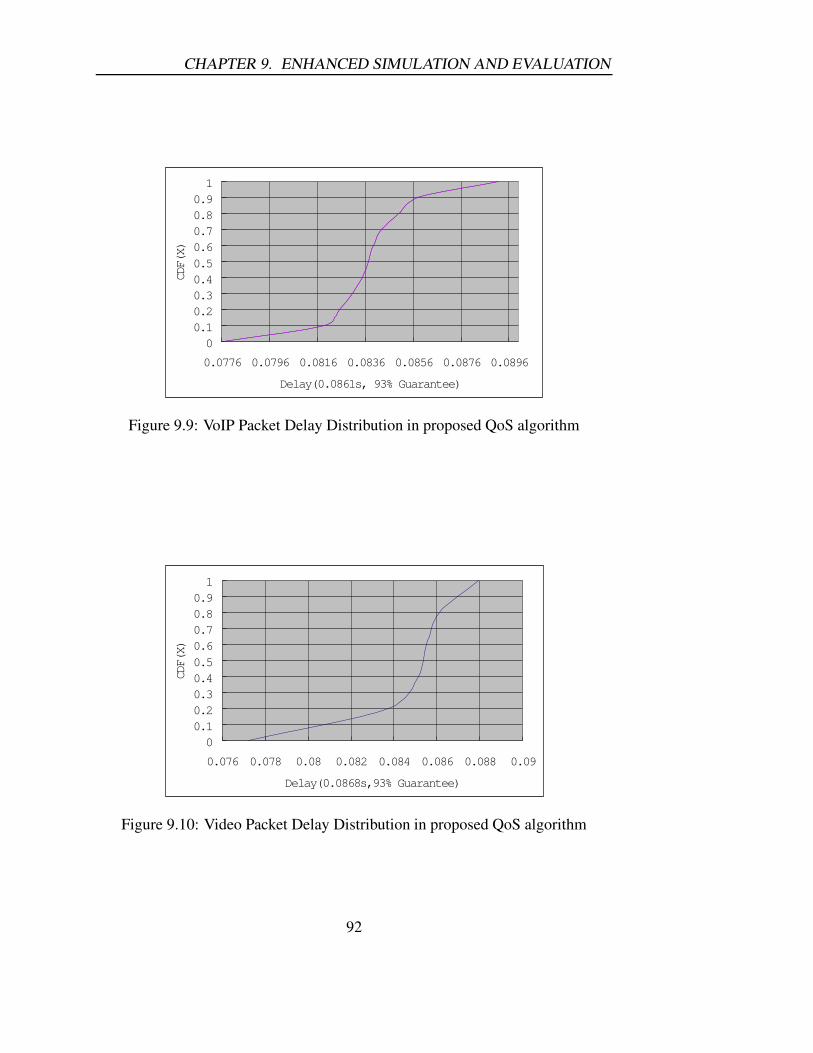
CHAPTER 9. ENHANCED SIMULATION AND EVALUATION
00.10.20.30.40.5
0.60.70.80.91
0.0776 0.0796 0.0816 0.0836 0.0856 0.0876 0.0896
Delay(0.0861s, 93% Guarantee)
CDF(X)
Figure 9.9: VoIP Packet Delay Distribution in proposed QoS algorithm
00.10.20.30.40.5
0.60.70.80.91
0.076 0.078 0.08 0.082 0.084 0.086 0.088 0.09
Delay(0.0868s,93% Guarantee)
CDF(X)
Figure 9.10: Video Packet Delay Distribution in proposed QoS algorithm
92
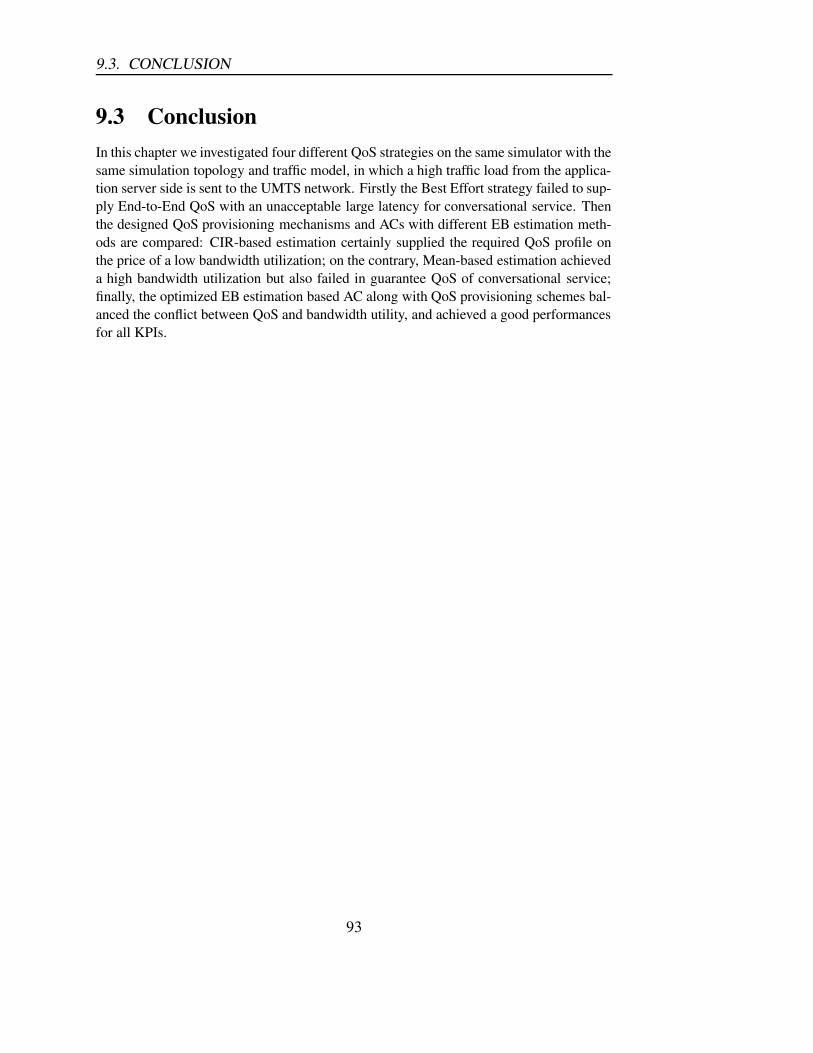
9.3. CONCLUSION
9.3 ConclusionIn this chapter we investigated four different QoS strategies on the same simulator with thesame simulation topology and traffic model, in which a high traffic load from the applica-tion server side is sent to the UMTS network. Firstly the Best Effort strategy failed to sup-ply End-to-End QoS with an unacceptable large latency for conversational service. Thenthe designed QoS provisioning mechanisms and ACs with different EB estimation meth-ods are compared: CIR-based estimation certainly supplied the required QoS profile onthe price of a low bandwidth utilization; on the contrary, Mean-based estimation achieveda high bandwidth utilization but also failed in guarantee QoS of conversational service;finally, the optimized EB estimation based AC along with QoS provisioning schemes bal-anced the conflict between QoS and bandwidth utility, and achieved a good performancesfor all KPIs.
93
Chapter 10
Conclusion and future work
Conclusion This Master mainly focus on investigating an optimized UMTS Quality ofService provisioning strategy in an End-to-End scenario to supply QoS guarantee as wellas to improve system performance. For this purpose, the main features of UMTS networkwas studied first. Then the QoS provisioning approaches in both the UMTS domain andthe Internat domain were investigated and the open issues were identified. A simulationplatform was built up in selected play scenarios and with simplified traffic model andradio link assumptions. An enhanced QoS algorithm was optimized in compare with theBest Effort strategy as well as two other similar QoS schemes with different CAC settings.The simulation results of the proposed strategy was proved to be able to satisfy the UMTSrealtime services QoS requirements and achieve a high system bandwidth utility.
To conclude the study throughout this Master project , user perceived QoS is alwaysdue to many QoS mechanisms involved in the whole End-to-End transmission chain. Thusthe optimization is inevitable a multiple-dimensional process. And the traffic model fromthe users choices is the key issue to judge which types of QoS mechanisms can be the beststrategy.
Future work Our study of the UMTS QoS provisioning could be extended to cooper-ate with RRM schemes to enhance the overall performance, especially in case the HSDPAis implemented. It is also possible to improve it by developing a dynamic AC and schedul-ing, which can adapt to the network traffic load and application mix along with the time.
94

Bibliography
[1] SAMU project, QOS Deliverable SP2-D1,http://samu.crm-paris.com/,2001.
[2] IETF, RFC 2475, "An Architecture for Differentiated services", 1998
[3] IETF, RFC 1633, "Integrated Services in the Internet Architecture: an Overview",1994
[4] IETF, RFC 2998, " A framework for Integrated Services operation over DiffServNetworks ", Nov 2000
[5] 3GPP TS 23.107, "QoS Concept and Architecture (Release 6)", 2002.
[6] 3GPP TS 23.207, "End-to-End QoS Concept and Architecture"
[7] 3G TS 23.101: "General UMTS Architecture".
[8] 3G TS 25.401: "UTRAN Overall Description".
[9] 3GPP, TR 23.905 v6.7.0, "Vocabulary for 3GPP Specifications (Release 6)", 2004.
[10] B.Walke, P.Seidenberg, M.P.Althoff, "UMTS: The Fundamentals", John Wiley andSons Ltd, 2002, ISBN 0-470-8455-7.
[11] 3GPP TS 23.060 v 6.7.0, "General Packet Radio Service (GPRS) Service descrip-tion Stage 2 (Release 6)", 2005
[12] 3GPP TS 24.008 version 6.7.0 (Release 6), "Mobile radio interface Layer 3 speci-fication; Core network protocols; Stage 3", 2005
[13] http://seacorn.ptinovacao.pt/
95
BIBLIOGRAPHY
[14] Peter Pieda,Jeremy Ethridge, Mandeep Baines, Farhan Shallwani, "A NetworkSimulator Differentiated Services Implementation", Open IP, Nortel Networks,July 26, 2000
[15] Clark, D. and W. Fang. "Explicit Allocation of Best Effort Packet DeliveryService."
[16] RFC 2859: "A Time Sliding Window Three Color Marker", June, 2000.
[17] Heinanen, J , T. Finland, and R. Guerin. "A Single Rate Three Color Marker"(Internet draft). May, 1999.
[18] Heinanen, J., T. Finland, and R. Guerin. "A Two Rate Three Color Marker" (Inter-net draft). May, 1999.
[19] P.Joos, W. Verbiest, "A statisticalbandwidth allocation and usage monitoring algo-rithm for ATM networks",in Proc. IEEE ICC1989, Vol.1, pp. 415-422.
[20] F.C. Schoute, "Simple decision rules for acceptance of mixed traffic streams", inProc.12th International Teletraffic Congress, 1988
[21] Pablo José, Ameigeiras Gutiérrez, "Packet scheduling and quality of service inHSDPA", PhD thesis, Aalborg University, October 2003
[22] Lei Xiao, Tung Chong Wong, and Yong Huat Chew, "End -To-End QoS of Multi-Class traffic in WCDMA and DiffServ Network.", PIMRC 2004.
[23] M.Nagshineh, M.Schwartz and A.S. Acampora, Issue in wireless access broadbandnetworks, in : Wireless Information networks,ed. J.M.Holtzman (Kluwar AcadmicPublisher, 1996)
[24] A.S. Acampora and M.Nagshineh, Control and QoS provisioning in high speed mi-crocellular networks, IEEE personal communication Magazine 1(2) (Second quar-ter 1994) 36-43
[25] A.S. Acampora and M.Nagshineh, QoS provisioning in microcellular networkssupporting multimedia traffic, in: Proc. of IEEE INFOCOM (April 1995) pp 1075-1084
[26] C.Oliveira,J.B Kim and T.Suda, QoS guarantee in high-speed multimedia wirelessnetworks in: IEEE InternationalCommunications Conference (Dallas, TX,1996)pp. 728-734.
[27] S.papavassiliou,L.Tassiulas and P.Tondon, Meeting QoS requirenments in a cellu-lar network with resue portioning, in: Proceedings of INFOCOM’94,pp4-12.
96

BIBLIOGRAPHY
[28] S.Rappaport and C.Purzynski,Prioritized resource assignment for mobile cellularcommunication system with mixed services and platform types,IEEE transactionson vehicular technology 45(3) (Augest 1996) 443-457
[29] M.Schwartz,Network Management and control Issues in multimedia wireless net-works, IEEE personal communication Magazine 2(3) (June 1995) 8-16.
[30] K.Seal and S.Singh, Loss profiles: A QoS measure in Mobile computing,Wirelessnetworks 2 (1996) 45-61
[31] S.Sen, J.Jawanda,K.Basu and S.K.Das, Qos degradation strategies for multimediawireless networks, in:Proceedings VTC, Ottawa,Canada(May 1998) pp.1884-1888
[32] S.K.Das, R.Jayaram, N.K.Kakani and S.K.Sen, Call admission and controlfor QoSprovisioning in next generation wireless networks, Wireless Networks 6 (2000)17-30
97