FACULTY OF BUSINESS ADMINISTRATION DEPARTMENT OF BANKING ...€¦ · confidence to the Nigerian...
152
1 IJEOMAH RUTH GINIKACH REG NO: PG/M.Sc/12/63 EFFECT OF MERGERS AND ACQUISITIONS ON THE NIGERIAN BANKING INDUSTRY 1998 – 2 DEPARTMENT OF BANKING AND FACULTY OF BUSINESS ADMINI Fred Attah Digitally signe Name DN : CN = Web O= University OU = Innovati HUKWU 3453 N PERFORMANCE OF 2012 D FINANCE ISTRATION ed by: Content manager’s bmaster’s name of Nigeria, Nsukka on Centre
Transcript of FACULTY OF BUSINESS ADMINISTRATION DEPARTMENT OF BANKING ...€¦ · confidence to the Nigerian...
1
IJEOMAH RUTH GINIKACHUKWU
REG NO: PG/M.Sc/12/63453
EFFECT OF MERGERS AND ACQUISITIONS ON PERFORMANCE OF
THE NIGERIAN BANKING INDUSTRY 1998 – 2012
DEPARTMENT OF BANKING AND FINANCE
FACULTY OF BUSINESS ADMINISTRATION
Fred Attah
Digitally signed by: Content manager’s
Name
DN : CN = Webmaster’s name
O= University of Nigeria, Nsukka
OU = Innovation Centre
IJEOMAH RUTH GINIKACHUKWU
REG NO: PG/M.Sc/12/63453
ON PERFORMANCE OF
2012
DEPARTMENT OF BANKING AND FINANCE
FACULTY OF BUSINESS ADMINISTRATION
Digitally signed by: Content manager’s
DN : CN = Webmaster’s name
O= University of Nigeria, Nsukka
OU = Innovation Centre
2
EFFECT OF MERGERS AND ACQUISITIONS ON PERFORMANCE O F
THE NIGERIAN BANKING INDUSTRY 1998 – 2012
BY
IJEOMAH RUTH GINIKACHUKWU
REG NO: PG/M.Sc/12/63453
DEPARTMENT OF BANKING AND FINANCE
FACULTY OF BUSINESS ADMINISTRATION
UNIVERSITY OF NIGERIA, ENUGU CAMPUS,
DECEMBER, 2015
3
TITLE PAGE
EFFECT OF MERGERS AND ACQUISITIONS ON PERFORMANCE O F THE
NIGERIAN BANKING INDUSTRY 1998 – 2012
BY
IJEOMAH RUTH GINIKACHUKWU
REG NO: PG/M.Sc/12/63453
BEING A DISSERTATION PRESENTED TO THE DEPARTMENT OF
BANKING AND FINANCE, FACULTY OF BUSINESS ADMINISTRA TION,
UNIVERSITY OF NIGERIA, ENUGU CAMPUS,
IN PARTIAL FULFILLMENT OF THE REQUIREMENTS FOR THE AWARD
OF MASTER OF SCIENCE DEGREE (M.Sc) IN BANKING AND F INANCE
SUPERVISOR:
ASSOC. PROF. CHUKE NWUDE
DECEMBER, 2015

4
APPROVAL PAGE
This dissertation by Ijeomah, Ruth Ginikachukwu with Reg. No. PG/M.Sc/12/63453, presented to the Department of Banking and Finance in the Faculty of Business Administration, University of Nigeria, Enugu Campus, for the award of Masters of Science (M.Sc) Degree in Banking and Finance, has been approved by:
____________________ ___________________
Assoc. Prof. ChukeNwude Date
(Supervisor)
____________________ ____________________
Assoc. Prof. ChukeNwude Date
(Head of Department)

5
CERTIFICATION
Ijeomah, Ruth Ginikachukwu , a postgraduate student in the Department of Banking and Finance with Reg No. PG/M.Sc/12/63453 has satisfactorily completed the requirements for research work for the Degree of Masters of Science (M. Sc) in Banking and Finance.
The work embodied in this dissertation is original and has not, to the best of my knowledge, been submitted in part or in full for the award of any other Degree or Diploma of this or any other tertiary institution
_________________ ______________
Ijeomah Ruth Ginikachukwu Date
PG/M.Sc/12/63453

6
DEDICATION
To my parents, Chief and Mrs. Murphy Ijeomah for their love, care, concern, prayers and financial support all through my academic journey.

7
ACKNOWLEDGEMENTS
My unqualified gratitude goes to God Almighty, the merciful and the provider, who lavishly gave me the endurance, resilience, doggedness, insight and foresight to undertake this research work and to successfully complete it to the satisfaction of the Department of Banking and Finance, Faculty of Business Administration, University of Nigeria, Enugu Campus.
My sincere appreciation goes to my highly esteemed and respected supervisor, Assoc. Prof.ChukeNwude for his personal interest, encouragement and meticulous efforts in directing and guiding me through this work. Despite his tight schedule, he still made out time to painstakingly go through my work and made useful suggestion that greatly enhanced the quality of this research work.
I also wish to thank Prof. J.U.J. Onwumere for correcting and supporting me throughout this work.
My appreciation also goes to my friends who supported me all through this programme: OnuChigozie, Chibueze, Charles and my entire course mates. I appreciate my love, Ihem who was by me and to my parent Chief and Mrs. Ijeomah and my siblings; Uche, Uju and Chinonso for their unalloyed and unflinching support. A special thank you goes to my beloved Aunt Lizzy for taking time to read my work and, may God bless you richly.
Once again, I say ‘To God be all the Glory for the strength, sagacity and perspicacity He has put in me.
Thank you all
8
ABSTRACT
This study examined the effect of mergers and acquisitions on the performance of Nigerian banking industry. In order to strengthen the competitive and operational capabilities of banks in Nigeria with a view towards returning global and public confidence to the Nigerian banking sector and the economy in general, the Central Bank of Nigeria instituted a banking reform in 2004, which saw most of the then existing 89 banks merging with each other. The fundamental objectives of this research is to ascertain the impact of mergers and acquisitions on the liquidity profile of commercial banks in Nigeria, examine how mergers and acquisitions adopted by commercial banks impacted on the return on equity of the affected banks, evaluate the impact of mergers and acquisitions on the debt/equity profile of commercial banks in Nigeria and examine the extent to which earning per share of commercial banks improved as a result of mergers and acquisitions. An ex post facto research design was adopted in this study. The population of the study comprises of all 21 commercial banks in Nigeria. The study covered a period of 15years from 1998 to 2012. Secondary sources of data were used in this study. The data were handpicked from the annual reports of the sampled banks and internet. The data obtained were analyzed using panel data analysis. The method of estimation used is the Ordinary Least Square (OLS). The result of the study indicated that overall mergers and acquisitions has a positive effect on the liquidity profile, return on equity, debt/equity profile and earning per share of commercial banks. The study recommends that the monetary authorities should establish an institutional framework to sustain the positive and improved performance of the banking industry in response to mergers and acquisitions.

9
TABLE OF CONTENT
Page
Title Page i
Certification ii
Approval Page iii
Dedication iv
Acknowledgment v
Abstract vi
Table of content vii
List of tables and figures x
CHAPTER ONE INTRODUCTION
1.1 Background of the Study 1
1.2 Statement of the Problem 2
1.3 Objectives of the Study 3
1.4 Research Questions 3
1.5 Research Hypotheses 4
1.6 Scope of the Study 4
1.7 Significance of the Study 4
1.8 Operational definition of terms 5
References 7
CHAPTER TWO REVIEW OF RELATED LITERATURE
2.1 Conceptual framework 9
2.1.1 Merger and Acquisition 9
2.1.2 Reasons for mergers and acquisition 10
2.1.3 Consequences of mergers and acquisition 12
2.1.3.1 Brand implication of M&A on banks 12
2.1.3.2 Structural implications of M&A on banks 15
2.2 Theoretical Review 16
2.2.1 M & A research paradigms 16
2.2.1.1 Economic and finance perspective 17
10
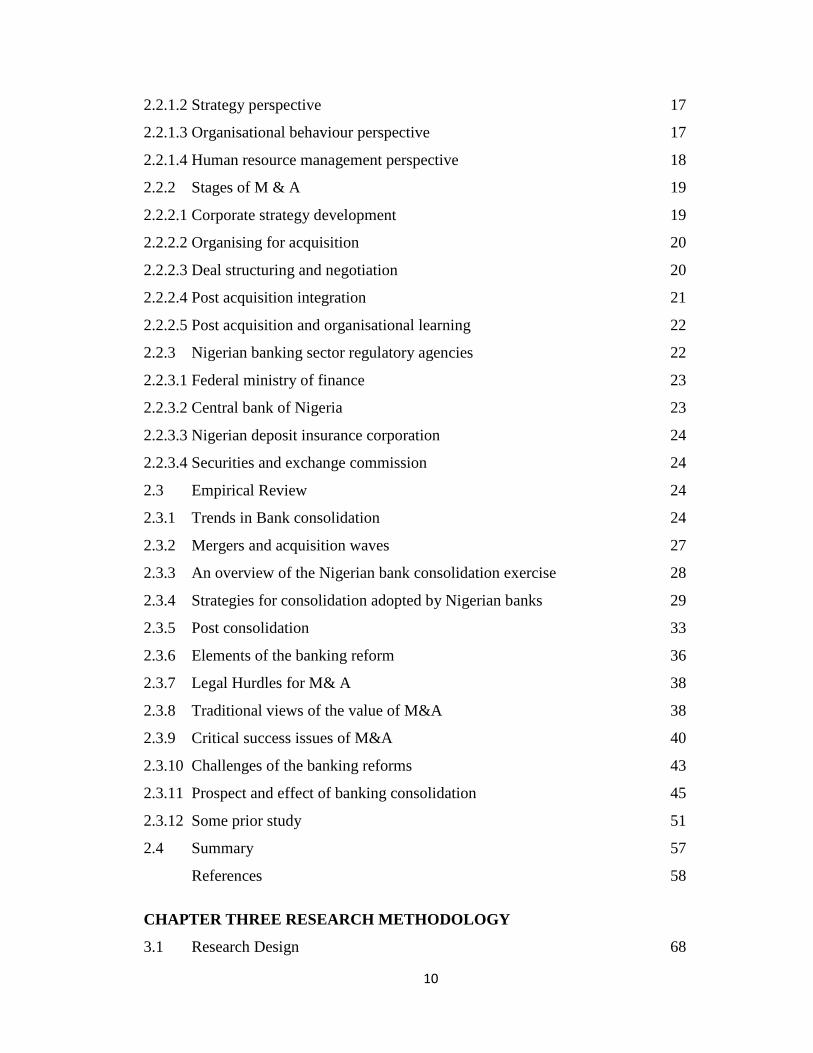
2.2.1.2 Strategy perspective 17
2.2.1.3 Organisational behaviour perspective 17
2.2.1.4 Human resource management perspective 18
2.2.2 Stages of M & A 19
2.2.2.1 Corporate strategy development 19
2.2.2.2 Organising for acquisition 20
2.2.2.3 Deal structuring and negotiation 20
2.2.2.4 Post acquisition integration 21
2.2.2.5 Post acquisition and organisational learning 22
2.2.3 Nigerian banking sector regulatory agencies 22
2.2.3.1 Federal ministry of finance 23
2.2.3.2 Central bank of Nigeria 23
2.2.3.3 Nigerian deposit insurance corporation 24
2.2.3.4 Securities and exchange commission 24
2.3 Empirical Review 24
2.3.1 Trends in Bank consolidation 24
2.3.2 Mergers and acquisition waves 27
2.3.3 An overview of the Nigerian bank consolidation exercise 28
2.3.4 Strategies for consolidation adopted by Nigerian banks 29
2.3.5 Post consolidation 33
2.3.6 Elements of the banking reform 36
2.3.7 Legal Hurdles for M& A 38
2.3.8 Traditional views of the value of M&A 38
2.3.9 Critical success issues of M&A 40
2.3.10 Challenges of the banking reforms 43
2.3.11 Prospect and effect of banking consolidation 45
2.3.12 Some prior study 51
2.4 Summary 57
References 58
CHAPTER THREE RESEARCH METHODOLOGY
3.1 Research Design 68

11
3.2 Nature and Sources of Data 68
3.3 Population and Sample Size 69
3.4 Model Specification 69
3.5 Description of Research Variables 71
3.5.1 Independent Variable 71
3.5.1.1 Shareholders’ Equity 71
3.5.2 Dependent Variable 72
3.5.2.1 Liquidity Ratio 72
3.5.2.2 Return on Equity 72
3.5.2.3 Debt/Equity Ratio 72
3.5.2.3 Earning Per Share 73
3.6 Techniques of Data Analysis 73
References 75
CHAPTER FOUR PRESENTATION AND ANALYSIS OF DATA
4.1 Introduction 76
4.1.1 Presentation of Data 76
4.2 Computation of the Ratio Values 76
4.3 Stationarity Test 76
4.4 Test of Hypothesis 78
4.4.1 Test of Hypothesis One 78
4.4.2 Test of Hypothesis Two 80
4.4.3 Test of Hypothesis Three 81
4.4.4 Test of Hypothesis Four 83
4.5 Granger Causality Test 85
4.6 Implication of the result 86
References 88
CHAPTER FIVE SUMMARY OF FINDINGS, CONCLUSION AND
RECOMMENDATION
5.1 Summary of Findings 95
5.2 Conclusion of the Study 95
5.3 Recommendations of the Study 95
5.4 Recommendation for Further Studies 97
12
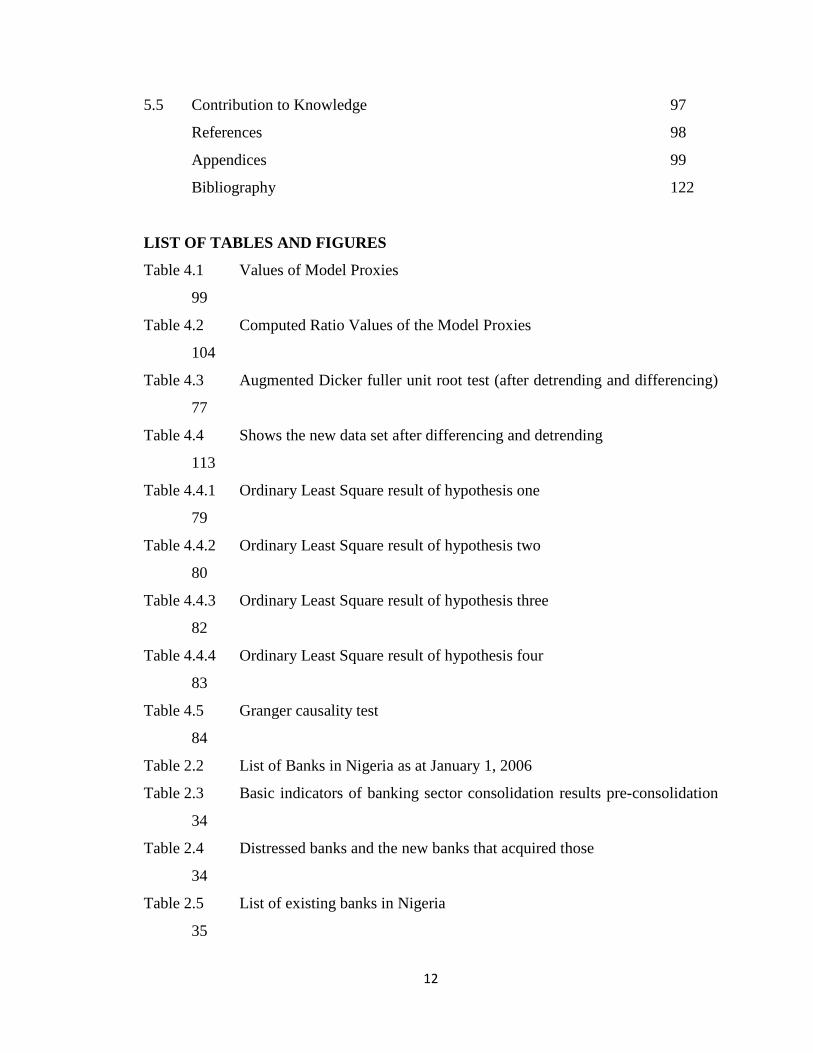
5.5 Contribution to Knowledge 97
References 98
Appendices 99
Bibliography 122
LIST OF TABLES AND FIGURES
Table 4.1 Values of Model Proxies
99
Table 4.2 Computed Ratio Values of the Model Proxies
104
Table 4.3 Augmented Dicker fuller unit root test (after detrending and differencing)
77
Table 4.4 Shows the new data set after differencing and detrending
113
Table 4.4.1 Ordinary Least Square result of hypothesis one
79
Table 4.4.2 Ordinary Least Square result of hypothesis two
80
Table 4.4.3 Ordinary Least Square result of hypothesis three
82
Table 4.4.4 Ordinary Least Square result of hypothesis four
83
Table 4.5 Granger causality test
84
Table 2.2 List of Banks in Nigeria as at January 1, 2006
Table 2.3 Basic indicators of banking sector consolidation results pre-consolidation
34
Table 2.4 Distressed banks and the new banks that acquired those
34
Table 2.5 List of existing banks in Nigeria
35
13
Table 2.1 Summary of major mergers and acquisition waves in the US
28
Figure 1 Line graphs showing the stationarity of panel data series: SHE
108
Figure 2 Line graphs showing the stationarity of panel data series: liquidity ratio
109
Figure 3 Line graphs showing the stationarity of panel data series: return on equity
110
Figure 4 Line graphs showing the stationarity of panel data series: debt/equity ratio
111
Figure 5 Line graphs showing the stationarity of panel data series: earning per share
112

14
CHAPTER ONE
1.0 INTRODUCTION
1.1 Background of the Study
The Nigerian banking sector has undergone remarkable changes over the years, in terms
of the number of institutions, ownership structure, as well as the depth of
operations. These changes have been influenced largely by challenges posed by
deregulation of the financial sector, globalization of operations, technological innovations
and adoption of supervisory and prudential requirements that conform to international
standards.
The Nigerian banking industry witnessed dramatic transformation during the
recapitalization exercise which deadline was December 31st, 2005. Overall, the banking
sector experience steady consolidation through recapitalization and mergers and
acquisitions that have resulted in fewer banks holding a greater value of the total assets in
the sector (Okpanachi, 2011). Spearheaded by the announcement of the Central Bank of
Nigeria on July 6, 2004 about a major reform program that would transform the banking
landscape of the country, an unprecedented process of merger and acquisition took place
in the Nigerian banking sector, shrinking the number of banks.
Immediately after the recapitalization deadline ended on December 31st, 2005, the
number of operating banks in the country reduced from 89 banks to 25banks but later
reduced further to 23 with the merger of some banks like First Atlantic Bank Plc and
Inland Bank to form Fin Bank Plc. Stanbic Bank Plc and IBTC to form Stanbic-IBTC
Bank. The number of operating bank later increased to 24 banks with the entry of
Citibank Nigeria Limited. The merger and acquisition of the nine rescued banks i.e. the
merger of Access Bank Plc with Intercontinental Bank Plc: Merger of Ecobank
Transnational Incorporation with Oceanic Bank Plc: merger of First City Monumental
Bank with Fin Bank Plc further reduced the number of banks operating in Nigeria to 21.
The wave of mergers and acquisitions that had taken place in the Nigerian banking
industry raises an important question of whether bank consolidation enhances the
financial performance of Nigeria banks. Hosono et al (2007) argued that consolidation
may increase or decrease the performance of a bank. Mergers and Acquisitions are
15
common place in developing countries of the world but are just becoming prominent in
Nigeria especially in the banking industry. Umoren (2007) says that merger and
acquisition is simply another way of saying survival of the fittest that is to say a bigger,
more efficient, better-capitalized, more skilled industry.
As the banks are devising ways of improving efficiency and ensuring the optimization of
the available resources, policy makers and regulatory authorities are moving towards
openness, competiveness, and at the same time ensuring market discipline. This is in
tandem with the trend in the banking sector globally. Ahmed (2000:33) described this
development as a magic one which caused quite a substantial number of Nigerian banks
to be sick while some became healthier. In his view, he contended that growth in the
banking sector should be transmitted easily into growth of the real sector. But as banks
continued to record impressive growth in all economics, indices show a declining margin
of economic growth. This makes one wonder where the impacts of the impressive
performance of the banks as reported in the financial reports are being felt. Even the
NDIC (Nigerian Deposit Insurance Corporation) which is established to insure the
deposit liabilities of licensed banks has liquidated some distressed banks. The action,
Ezeikpe (1993: 36-38) commended while arguing that some distressed banks should be
liquidated as a way of survival for the banking system.
This study seeks to evaluate the effect of mergers and acquisitions as strategic growth
option in the Nigerian banking sector, with a view to find out if mergers and acquisitions
result in superior financial performance, efficient, reliable and sound capital base for the
bank that fully embraced it.
1.2 Statement of the Problem
The outbreak of bank mergers in Nigeria is attracting much attention, partly because of
heightened interest in what motivates firms to merger and how mergers affect efficiency.
However, there are often two distinct views to the rationale behind merger and
acquisition. The first held view of mergers, especially those involving mega firms, is that
firms are merging just to get bigger and not to get more efficient. Accompanying that
notion is the fear that as merging firms grab greater market share, individual freedoms,
competition and efficiency are threatened, because bigger is perceived as greater
concentration of power.

16
The second view holds that firm’s merger not just to get bigger but also to be more
efficient. It is claimed that mergers enable the banking industry to take advantage of new
opportunities created by changes in the technological and regulatory environment.
Fallout of this is the reduction in the number of banks nationwide but the concentration of
power in local banking markets has not increased. And the very force of regulatory
change that spurred bank merger is also bringing new sources of competition of local
banking market (especially the management of the country’s external reserves). The
post-consolidation performance of all Nigerian banks was overcast in 2009 by the global
financial and economic crisis, which was precipitated in August 2007 by the collapse of
the sub-prime lending market in the United States. Sanusi (2010) attributed the post
consolidation challenges of Nigerian banking industry to the inability of the industry and the
regulators to sustain and monitor the sector’s explosive growth which as a result led to
risk-build in the system. This study shall investigate the effect of the merger and
acquisition that had taken place in the Nigerian banking sector on the performance of the
selected banks 1998-2012.
1.3 Objectives of the Study
In a broad framework, the general objective of the study is to examine the effect of
mergers and acquisitions on the performance of the Nigerian banking sector
The specific objectives of this study were to:
1. ascertain the impact of mergers and acquisitions on the liquidity profile of
commercial banks in Nigeria.
2. examine how mergers and acquisitions adopted by commercial banks impacted on
the return on equity of the affected banks.
3. evaluate the impact of mergers and acquisitions on the debt/equity profile of
commercial banks in Nigeria.
4. examine the extent to which earning per share of commercial banks improved as a
result of mergers and acquisitions.
1.4 Research Questions
The following research questions are considered relevant for the purpose of this research
work:
17
1. What effect does mergers and acquisitions have on the liquidity profile of
commercial banks in Nigeria?
2. Do mergers and acquisitions have any effect on return on equity of commercial
banks in Nigeria?
3. What effect does mergers and acquisitions have on the debt equity profile of the
commercial banks in Nigeria?
4. To what extent have mergers and acquisitions adopted by banks impacted on the
earning per share of the affected banks?
1.5 Research Hypotheses
For the purpose of this research, the following hypothetical statements stated in their null
forms are considered relevant in order to guide the researcher properly:
H1: Mergers and acquisitions do not have any significant positive effect on the
liquidity profile of the affected banks.
H2: Mergers and acquisitions have no significant positive effect on the return on
equity of commercial banks.
H3: Mergers and acquisitions do not have any significant positive effect on the debt
equity profile of commercial banks in Nigeria
H4: Mergers and acquisitions have no significant positive impact on the earning per
share of the affected banks.
1.6 Scope of the Study
This research focus on the effect of mergers and acquisitions on the performance of the
Nigerian banking industry.The time frame for the analysis is 1998 – 2012, a period of
fifteen (15) years. This is with the understanding that the time frame will only be fair and
balance for analyzing their performance. It is also extended to 2012 to ensure that the
information and data used are timely, up to date and accurate enough to represent the
current position of the banks under study.
1.7 Significance of Study
The major significance of this study relates to the evaluation of mergers and acquisitions
in terms of its impact on the performance in the post-consolidation era in the Nigerian
banking sector, this will serve as a yardstick for the justification of the exercise. This
18
study will also add to the general body of knowledge on the subject matter of mergers
and acquisitions and also compliment the work of other authors.
In furtherance to the above, this research will also be significant to:
The policy makers and regulators of the banking industry, it will present a schema,
through its analysis that could assist them in evolving policies and reforms that will
positively impact on the performance of the banking industry.
To the public, it will enlighten the general public on the effect of bank consolidation on
the performance of banks in Nigeria, and also provide a better understanding of the
dynamics of the Nigerian banking industry and how it has performed within the period
under review.
To investors in general, the study exposes the relationship existing between relevant
variable used in this study. Investors will be in a better position to make rational
investment decisions as the study will make them understand better the nature of
relationship existing between mergers and acquisitions and various performance index of
the Nigerian banking industry.
To students, the research will assist those who wish to take a career in economics,
banking and finance to advance their understanding of the concept and mechanism of
mergers and acquisitions and its effects.
Finally, the research work will serve as a reference material for future researchers on
similar topic.
1.8 Operational Definition of Terms
Merger: In business or economics a merger is a combination of two companies into one
larger company. Such actions are commonly voluntary and involve stock swap or cash
payment to the target. Stock swap is often used as it allows the shareholders of the two
companies to share the risks involved in the deal.
Acquisition: This means the buying of one company (the target) by another. An
acquisition may be friendly or hostile. In the former case, the companies cooperate in
19
negotiations; in the latter case, the takeover target is unwilling to be bought or the targets
board has no prior knowledge of the offer. Acquisition usually refers to a purchase of a
smaller firm by a larger one.
Bank Re-Capitalization: It is the act of supplying long-term funds of the owners of the
bank to meet the requirement of monetary authority. Osiegbu (2005).
Consolidation: It is the reduction in the number of banks and other deposit taking
institution with a simultaneous increase in the size and concentration of the consolidation
entities in the sector (BIS, 2001:2)
Shareholder’s fund: are alternative terms for owners’ or shareholders equity. It
represents the funds invested in the company through stock purchase or other private
investments.
Economy: The relationship between production, trade and the supply of money in a
particular country or region. It is the system of trade and industry by which the wealth of
a country is made and used.
20
References
Ajayi, M. (2005).Banking sector reforms and bank consolidation: conceptual framework. In: Banking sector reforms and bank consolidation in Nigeria.CBN bullion, Vol. 29, No. 3. April/June.
Ahmed, M. (1989).Mergers and Acquisition as Alternative Growth Strategy to Nigerian Firms under SAP.Nigeria Institute of Management Seminar, Lagos.
Anaeto, Emeka. (1998, November 23). Counting the Gains of Corporate Restructuring. Business Times, P. 41.
Ansoff, H. Igor et al (1976).“From Strategic Planning to Strategic Management” Hiley, New York.
Berger,A.N et al (1999). Journal of Banking & Finance, Vol. 23 pp. 135-194. Elsevier, Netherlands
Barney J. (1986). “Strategic Factor Markets; Expectations, Luck and Business Strategy” Management Science, Vol. 42, pp 1231-1241.
Ebeid F. J. (1976). “Tender Offers; Characteristics Affecting their success” Mergers and Acquisitions.
Ezikpe, J. N. (1993). Corporate Responsiveness to Structural Changes: Lectures and Proceedings of Bank Directors Seminar. Lagos: Financial Institution Training Centre, pp. 36 – 58.
Gaughan,P.A(1999). Mergers, Acquisitions and Corporate Restructuring, second edition, John Wiley and Sons,. New York
Gaughan,P.A (1999). Mergers, Acquisitions and Corporate Restructuring, second edition, John Wiley and Sons,. New York
Glueck William (1980). “Business Policy and Strategic Management” Mcgraw Hill
Goorey,G (1999). “Merger disruption”, in Global Finance ,New York.
Hanweck ,G.A and Shull,B (1999). “The bank merger movement: Efficiency, stability and competitive policy concerns”, in Antitrust Bulletin, New York.
Hosono, K; Sakai, K. and Tsuru, K. (2007).‘Consolidation of Banks in Japan; Causes and Consequences’. National Bureau of Economic Research (NBER) Working Paper Series, No. 13399
21
Okpanachi.J. (2011).‘Comparative analysis of the impact of mergers and acquisitions on financial efficiency of banks in Nigeria’.Journal of Accounting and Taxation, Vol. 3, No. 1, pp.1-7
Osiegbu (2005).“The efficiency effects of bank mergers: An overview of case studies of nine mergers”, Journal of Banking and Finance, No. 22 (1998), pp. 273-291 (Amsterdam, Elsevier).
Umoren (2007).“Asset redeployment, acquisition and corporate strategies in declining industries” strategic management journal. Vol., 23 pp. 119-134.
22
CHAPTER TWO
REVIEW OF RELATED LITERATURE
2.1. Conceptual Framework
2.1.1. Mergers and Acquisitions
Merger can be defined as a combination or fusion of two or more formally independent
business units into one organization with a common ownership and management such as
in current usage. A merger is a special ease of combination where both merging
companies wish to pin together on agreed term. Lot (2003) defined merger as a
combination of two companies where only one of them survives and continue its
existence or at least continue to exist but in modified term.Acquisition on the hand is a
corporate action in which a company buys most, if not all, of the target company’s
ownership stakes in order to assume control of the target firm. Acquisitions are often
made as part of a company’s growth strategy whereby it is more beneficial to takeover an
existing firm’s operations and niche compared to expanding on its own. Acquisition can
be either friendly or hostile. Friendly acquisitions occur when the target firm expresses it
agreement to be acquired, whereas hostile acquisitions do not have the same agreement
from the target firm and the acquiring firm needs to actively purchase large stakes of the
target company in order to have a majority stake. In either case, the acquiring company
often offers a premium on the market price of the target company’s shares in order to
entice shareholders to sell.
A consolidation is a type of merger which involves the combination of two or more
companies whereby an entirely new company is formed. All of the old companies cease
to exist and the shares are exchanged for the shares in the new company. Vanhorne
(1998) seems to be in agreement with Hampton that “merger is a combination of two or
more corporations where only one survives. Firms’ assets and liabilities are left to the
new firm.” Ahmed (1989) also viewed merger as a unification of previously separate
companies into a single corporation”. He explains that merger occurs when one or two of
the combining companies survive.
This is illustrated as follows:
23
If company X and company Y merged and a new company Z emerges, it is called a
merger, but where company Y dies and X survives, it is an acquisition. The argument
about identity sprang up in disagreement with Ahmed as Joy (1990) in her write up
argued that in merger, the identity of both merging companies’ ceases to exist and the
surviving company takes any name as maybe wished by the new owner. Acquisition
according to her is a situation where management of independently operating enterprises
is brought under the control of a single management.
According to Umari (1998), in merger, take over, amalgamation or acquisition, two or
more companies come together by the pulling of their undertakings or resources, that is,
material money, goodwill, market, skilled personnel, and technology and so on.
Acquisition can also be by buying a controlling interest on the share capital of one of the
companies.
From the legal point of view, in section 590 of the Companies and Allied Matters Decree
of 1990”, mergers have been described as any amalgamation of the undertakings of any
part or whole of the interest of two or more companies or corporate bodies”. Professor
Cower (2002:51) reviewed that under amalgamation, merger or takeover, two or more
companies are merged either by a consideration of controlling interest in the share capital
of one by the other or in the capital of both by a new company. He also stated that
mergers and acquisitions are not terms of act with clearly defined and distinguishable
legal meaning. They are intervention and can be used interchangeably.
2.1.2 Reasons for Mergers and Acquisitions
Economic literatures provide various reasons why companies engage in M&A, with the
concept of synergy as the underlying factor (Brealey, et al., 2006; Coffee, 1988;
Gaughan, 2007; Hadlock et al, 1999; Bliss and Rosen, 2001; Trautwein, 1990).
Synergy is the interaction or cooperation of two or more organisations to produce a
combined effect greater than the sums of the two organisations operating independently
(Coyle, 2000). Mathematically, this can be stated as:
Value (A + B) >Value (A) + Value (B). The explanation for this occurrence is either the
firms were not performing to optimal level prior to merging or that benefits were

24
achieved by the merger. Following this logic, companies are motivated to involve in
M&A in order to create synergies (Coyle, 2000). Companies derive synergy from M&A’s
activities through, but not limited to: economies of scale; economies of vertical
integration; complementary resources; surplus funds; elimination of inefficiencies
(Brealey, et al., 2006). Coffee (1988) was of the view that managers might also engage in
growth oriented or empire building strategies in order to create a diversified portfolio
within the firm to lower their employment risk but not necessarily due to business
synergy.
Like any business, banks have reasons why they engage in M&As. In this study, we focus
on the business motive while acknowledging that other motives, such as managerial
incentives, can play an important role (Bliss and Rosen, 2001). Berger (1988) identified
the Relative Efficiency and Low Efficiency hypotheses as the drivers of business motives
for M&As by banks. The relative efficiency hypothesis provides that the acquiring bank
seek to bring in the target bank to its own higher level of efficiency by transferring its
superior management capacities or its business procedures.
On the other hand, low efficiency hypothesis is where one or both of the merging banks
are inefficient relative to their peers. M&A may at this instance serve as a corrective tool
to improve the performance of the bank or as a means of implementing radical business
changes. While the low efficiency hypothesis and the relative efficiency hypothesis are
not mutually exclusive, researchers find more evidence for the former. Vennet (1996) in
his research confirms this result for European bank takeovers between 1988 and 1992. In
a related study by Koetter et al. (2007), which focused on the German banking market,
observed that many mergers serve as a pre-emptive distress resolution measure. Studies
by Avkiran (1999) and Worthington (2004) also support the relative efficiency
hypothesis. Support for a ‘reverse’ Relative Efficiency Hypothesis is provided by Resti
(1998), who stated that, merger among Italian bank between 1987 and 1995, showed that
the acquirers appeared even less efficient than their targets. In a study of the US market,
Wheelock and Wilson (2000) find that, contrary to the low efficiency hypothesis,
inefficient banks are less likely to be acquired, this finding contradict an earlier study by
25
Hadlock et al. (1999) who opined that poorly performing banks are more likely to be
acquired.
From the above, one can summarise that the main reasons for M&As is to improve the
financial performance of the firms. This could be achieved through cost reduction,
extending the range of products and services, increase in market share, obtaining tax
advantages, improvement of solvency and knowledge transfer.
2.1.3 Consequences of Mergers and Acquisitions on Banks
No matter which approach is selected by banks within the Nigerian financial sector, the
current consolidation will have a number of effects and implications. These effects and
implications can be broken down into 2 broad categories:
1. Brand implications
2. Structural implications
2.1.3.1 Brand Implications of Mergers and Acquisitions on Banks
Typically, differentiation in the financial sector is determined by financial might and
capital base. However, with the current consolidation, this differentiation factor will
gradually become commoditized. This is because more banks, such as Guaranty TRUST
and Zenith, will possess more financial might bringing them closer to the establishment
banks (e.g. First bank).These series of acquisitions will also ensure that the gap in size
(branch network) is greatly reduced. In view of this, differentiation in the unfolding
financial sector will be greatly impacted upon by the strength of a banks brand within the
market place, and not just the size of its balance sheet.
The current situation in the market attests to this. Consider that banks with strong brands
(i.e. First bank, Guaranty Trust bank and Zenith bank) are attracting a lot of attention and
may most likely serve as lead banks in which ever merger or acquisition scenario they get
involved in .On the other hand, banks with weak brands face an uphill task. They become
devalued and may be forced to merge or be acquired by stronger banks.
Whatever the situation, the new entities that will arise from the dust of consolidation will
need to deal with brand related issues, if they are to survive in the long term. Some of the
most critical issues are as follows:
26
a. Change of name
The Financial sector witnessed a lot of name changes. A number of names that we were
familiar with ceased to exist. The name of an organization in its primary token of
identification in the market place. Thus, organizations resulting from consolidation
process were faced with two options:
• Adoption of the name of the organization with the strongest brand name (this is
often the case if the situation is the acquisition).
• Adoption of a new name (more common with mergers).
Whatever approach is taken, the introduction of the name of the new entity must be done
in such a way that the brand equity resident in the names of the organizations involved is
not lost but leveraged adequately (because each of the names already has certain
associations and implications).careful consideration must be given to what the
associations new name would evoke in the market. Therefore, it is important that a
strategic approach be applied in the development of the name because of its importance
to the brand.
b. Change of logo
In addition to name changes, a number of new logos were unveiled as the merger &
acquisitions spree continues. The word logo is derived from the Greek word ‘Logos’. The
logo of an organization is its graphical mark of identity in the market. It is therefore
important to ensure that like the name, the logo from the entity resulting from a merger or
acquisition scenario takes into consideration the brand equity resident in the constituent
organizations. Such equity may be in the form of colours or symbols. For example, oil
giant, British petroleum (BP Plc) wanted to revamp its brand after its merger with Amoco
in 1998 and the further acquisition with two other companies, Arco and Castrol in 1999
& 2000 respectively. It settled for the strongest name in the group of companies i.e. BP. It
also maintained BP colour palette of green and yellow as the corporate colour because it
was considered a brand asset and unique in the petroleum sector. Another example is the
merger between Citibank and Travelers Group, the merged firm was named Citigroup.
Although Citibank was the smaller of the two, it was the stronger brand. Citi group
incorporated Citibank’s corporate colour-blue and a key element of the Travelers group
logo- the red umbrella- into the Citigroup logo.

27
On the other hand, France telecoms departed from its staid logo and symbols because it
wanted to communicate an entirely new concept as it’s metamorphosed from a state –
owned monopoly into a free market competitor. The new logo, an amperes and,
symbolized the “bringing together of people and the decision by the company to never go
out of style.” In the same vein, some of the consolidated entities in the banking sector
may wish to signify entirely new concepts and strategic direction through their logos.
It is important to note that the design of a logo for an organization is not primarily a
design function but a strategic function. Also, as a result of the new logo, it will be
necessary to redesign the corporate function and visual identity materials (letterheads,
business cards, identity cards, account opening book, websites, etc) for the new entity.
c. Brand culture
Perhaps the most important determinant in the progression of the new banks that will
result from the merger and acquisition process is how well the culture of the various
constituent banks can be melded into one unique cultural system. If this is not properly
done, the resulting banks will experience cultural clashes among employees. Every
organization has its own distinct way of life and its own way of doing things; this is what
culture is all about. It is like an invisible hand that guides the thoughts and actions of
employees. If a unique culture is not developed for the new brand, then the battle is over
before it begins. It is interesting to note that in most of the mergers that have been
witnessed in the Nigerian financial sector thus far, the focus has been on meeting the
required minimum capitalization. But once that is done, the resulting entity will only
progress as far as critical brand issues like culture have been resolved.
d. Brand message
At the end of the merger or acquisition process, a critical brand issue that will arise is
“what message will the new entity put out into the market?” It is a safe assumption that
each of the institutions that make up the new entity touted a particular message. This
message will determine what they will be known for over time.
e. Communication
A major consequence of the consolidation of the banking sector will be an increased
effort by the banks to propagate themselves within the market place. For this to be
28
effective, it must be based on more than just a need to put out information on the entity. It
must be a strategic initiative that communicates the essence of the brand, its strengths and
competencies. Communication issues are critical and must be tackled properly.
2.1.3.2 Structural Implication of Mergers and Acquisitions on Banks
In addition to the aforementioned brand implications, consolidation of the banking sector
leave in its wake a number of structural issues. These are issues that have direct impact
on staff, customers and the structure of the entire banking sector.
Considering the following:
a. Reduced number of banks
One of the major expectations of CBN and a definite outcome of the consolidation within
the financial sector is the reduction in the number of banks within the sector from the
then 89 banks to 21 banks, considering the activity taking place within the sector, a
reduction in the number of banks is inevitable. A similar situation occurred in the
consolidation of the Malaysian banking sector during the early 90s, where the number of
banks then reduced to 10 banking groups from 54 local banks.
b. Increased competition
The entities resulting from the consolidation of the Nigerian financial sector are bigger
(in terms of size, capability and financial might) and thus, are able to compete more
aggressively in the market. Also, because the number of banks that drastically reduced
more opportunities are available for the evolved banking groups.
c. Emergence of New contenders
Taking a lead from the above, in addition to increased competitiveness within the sector,
the rule of the establishment banks may be coming to an end and new contenders may
arise. Front runners for the crown are Guaranty Trust Bank, Zenith Bank, and Standard
Trust Bank (STB) .Each of these banks have being able to acquire billions of Naira
through IPOs and public offers. Consider that Guaranty Trust Bank had a capitalization
of N34b against First Banks N99b, while Zenith had N49b.When the dust from the
current spate of mergers had settled, additional contenders were yet to emerge.

29
d. Acquisition digestion issues
In a merger scenario, a critical issue is how the constituent organizations integrate their
operations and processes. The need to integrate operations effectively will lead to the
following:
• Loss of jobs: This will occur from the middle level to executive level due to overlaps
and duplication of functions within the system.
• Consolidation of branch locations: In a situation where the resulting entity possesses
more than 1 branch in a particular location, these branches may be condensed into a
singular entity. This will help reduce cost overheads and duplication of functions.
• Tackling of inefficiencies and bureaucracies: Size creates a certain level of
inefficiency and bureaucracy within systems. The new banks will be a combination of
three or more banks. Therefore issues of inefficiencies must be tackled.
In addition to the aforementioned, the following will also occur:
i. Customers will have fewer banks to choose from, due to the reduced number of banks
that will exist in the banking sector.
ii. The management and Boards of the banks will be reconstituted.
iii. CEOs will lose their jobs or become Executive Directors.
iv. More IPOs and public offers should be expected.
v. More sophisticated products should be expected from the evolving banking groups as
a differentiation strategy.
vi. True financial supermarkets will emerge as a result of the coming together of banks
with varying competences and strengths.
vii. Technology will become much more important. More capital will be devoted because
of integration issues.
2.2 Theoretical Review
2.2.1 Mergers and Acquisitions Research Paradigms
There are different perspectives to the study of mergers and acquisitions (M&A). Datta,
et al (1992: 68) acknowledged strategic management and financial economics as two
major literature frameworks for identifying sources of shareholders’ wealth in M&A
activities.
30
However, Larsson and Finkelstein (1999) gave a more detailed categorization of M&A
paradigms: economic and finance; strategy; organizational behaviour; and human
resource management perspectives.
2.2.1.1. Economic and Finance Perspective
The economic and finance paradigm is primarily interested in the efficiency impact of
M&A on the economy through economies of scale and market power with emphasis on
‘market for corporate control’. The main argument of this ‘market for corporate control’
paradigm is that M&A are viewed as ‘contests between competing management teams for
the control of corporate entities’ (Dattaet al.1992: 69). One of the key arguments of the
market for the corporate control paradigm is that economic value created through
acquisition activities is decided by market characteristics, including its competitiveness
(Denis and McConnel, 2003: 266). These researchers measure the success of M&A with
accounting numbers by considering their profit margins and return on equity. The finance
scholars typically study M&A performance using stock market based measures. Event
studies are used to examine the performance impact of the acquisitions and changes in
stock prices that occur over a short period of time (Flanagan & O’Shaughnessy, 2003;
Ramawamy&Waegelein, 2003; Rao, Mahajan&Varaiya, 1991).
2.2.1.2Strategy Perspective
Researcher using the strategy paradigm sees M&A as a means of corporate growth and
diversification, primarily emphasizing factors that are management controlled such as
diversification strategies (that is, related vs. unrelated diversification) as a crucial factor
in determining post-acquisition performance. They also consider the identification of
differences between types of acquisition (merger vs. tender offer); and types of payment
(cash vs. stock). The common variables used in this field are size, market share, pre-
acquisition profitability and growth. Problems of measurement and convenience sampling
are given as reasons for inconsistent findings (Marks &Mirvis, 2001; Datta, et al, 1992).
2.2.1.3OrganisationalBehaviour Perspective
Organisational behaviour researchers are interested in post combination integration
process emphasizing both cultural clash and conflict resolution (e.g., Buono, 2003;
Birkinshaw, Bresman & Hakanson, 2000). Constraining time-pressure or too high work
31
pace, deficiencies concerning working conditions, incompatible or ambiguous demands
and expectations around roles, tasks and responsibilities and uncertainty at work are
issues of concern to organizational behaviour researcher of M&A.
2.2.1.4 Human Resource Management Perspective
Primary interest in the Human Resource management perspective is the psychological
effects M&A have on individuals such as feelings of tension, alienation, and uncertainty.
However, the importance of communication, and career planning are the interest of
researchers in this field (Millward &Kyriakidou , 2004; Ford & Harding, 2003; Marks
&Mirvis, 2001).
The organizational behaviour and human resource perspectives indicate that it is basically
the “people problem” that contributes to the success and failure of M&A. As the value
creation of M&A mainly depends on the implementation process where people problem
plays a key role (Jemision & Sitkin, 1986), the financial results of M&A cannot be
explained without considering the human and organizational side of M&A. The people
problem not only prevents the creation of synergistic values, but can also be a direct
cause of M&A failures (Larsson & Finkelstein, 1999).
Basically, mergers and acquisitions are divided in four; horizontal, vertical, conglomerate
mergers and concentric merger. horizontal mergersis a combination of two or more
companies operating in the same field and in the same stages of process of attaining the
same commodity or service (Gaughan, 2007: 13; Brealey, et al., 2006: 871; Okonkwo,
2004:3). In other words, a horizontal merger is the combination of firms that are direct
rivals selling substitutable products within overlapping geographical market. The main
purpose of this merger is to obtain economy of scale in production by eliminating
duplication of facilities, reducing of competition, reducing of cost, and increase in share
price and market segments. A vertical merger is a combination of two or more firms
involved in different stages of production or distribution of the same product. It is a
merger of one company with another having different stages of production/distribution
process of the same product/service. Vertical merger may take the form or forward or
backward merger. When a company combines with the supplier of material, it is called
backward merger and when it combines with the customer, it is known as forward
merger. Congeneric mergeroccur where two merging firms are in the same general
32
industry, but they have no mutual buyer/customer or supplier relationship, such as a
merger between a bank and a leasing company. Example: Prudential’s acquisition of
Bache and Company.Finally, conglomerate mergers takes place when the two firms
operate in different industries. It is an amalgamation of two companies engaged in
different line of business, in other words, the merging companies are engaged in diverse
business activities.
2.2.2 Stages of Mergers and Acquisitions:
Saudarsanam (2003: 3) provide us with a five-stage model that will result in successful
pursuit of synergistic gains from M&A:
• Corporate strategy development;
• Organising for acquisitions;
• Deal structuring and negotiation;
• Post-acquisition integration; and
• Post-acquisition audit and organisational learning.
2.2.2.1 Corporate Strategy Development
Corporate strategic planning has been emphasized by organisations as an essential
ingredient for business success, therefore, the success or failure of M&A to a large extent
depends on the alignment of corporate strategy and M&A strategy (Harding and Rovit,
2004). Corporate strategy development is concerned ‘with ways of optimizing the
portfolios of businesses that a firm currently owns, and how this portfolio can be changed
to serve the interests of the corporation’s stakeholders’ (Saudarsanam, 2003: 4). The
effectiveness of M&A in achieving corporate strategic objectives depends on the
conceptual and empirical validity of the models (industry structure-driven, competition
among strategic groups or resource-based) upon which corporate strategy is based
(Barney, 1991; Lockett, Thompson and Morgenstern, 2008). In agreement with the stance
of Saudarsaram, a study by Harding and Rovit (2004) that reviewed more than 1,700
M&A and interviewed 250 Chief Executives Officers (CEOs) revealed that almost 60%
of the CEOs interviewed do not understand the contribution of M&A to their company’s
long-term financial performance, while those with a clear rationale underpinning their
M&A activity came to realize after the deal that their rationale were altogether wrong.

33
This implies that for a merger to be successful it would require serious planning which
includes screening and identification of clear and realistic goals with proactive strategies
to overcome resistance by the target firm or competitors bidding for the same firm.
2.2.2.2 Organizing for Acquisition
The firm lays down the criteria for potential acquisitions consistent with the strategic
objectives and value creation logic of the firm’s corporate strategy and business model.
Haspeslagh and Jemison (1991, cited in Saudarsaram, 2003) pointed out two contrasting
perspectives of acquisition decision making process: (i) the rationalist; and
(ii) the organizational process.
Success of post-acquisition integration is determined at least partly by the thoroughness,
clarity and forethought with which the value creation logic is blueprinted at the
acquisition decision stage. Therefore, an understanding of the acquisition decision
process is important, since it has a bearing on the quality of acquisition decision and its
value creation logic (Saudarsanam, 2003).
2.2.2.3 Deal Structuring and Negotiation
M&A is tricky business and it can have serious financial implications for both the
acquirer and the acquired that do not possess the necessary experience or professional
guidance due to asymmetric information (Angwin, 2001). According to Saudarsanam
(2003: 6), this stage of M&A involves:
a) valuing target companies, taking into account how the acquirer plans to leverage
its own assets with those of the target; choice of advisers to the deal;
b) obtaining and evaluating as much intelligence as possible about the target from
the target as well as other sources through due diligence;
c) determining the range of negotiation parameters including the walk-away price
negotiating warranties and indemnities; negotiating the positions of senior management
of both firms in the post-merger dispensation; and
d) developing the appropriate bid and defense strategies and tactics within the
parameters set by the relevant regulatory regimes.
The use of third-party in the negotiations stage can be very valuable in giving the client
time to consider options, or keeping the client from giving into emotions and making

34
costly and unnecessary concessions in the heat of matters at the bargaining table
(Angwin, 2001; Murphree& Hollander, 2003; Perry & Herd, 2004; Sinickas, 2004). The
use of wrong valuation methods during the deal structuring stage and over optimism have
resulted in the failure of many M&As in achieving the anticipated results as in the case of
AT&T and NCR; Vodafone, AOL and Vivendi; and Mizuho (Rafferty, 2000;
Saudarsanam, 2003: 7).
2.2.2.4 Post-Acquisition Integration
This stage involves the combination of the distinct organisations into one, resulting in
changes in both the target and the acquirer, to deliver the strategic and value expectations
that informed the merger (Saudarsanam, 2003). Schuler (2003), emphasized the
importance of: an early planning; careful attention to leadership selection; an insider’s
view of knowledge networks and information flow; a clear, coherent and timely
communication strategies; and the dedication of adequate resources to the transition
management team are necessary ingredient that can lead to a successful post-acquisition
integration. The value of most firms depends on its human assets-managers and skilled
workers, therefore, utmost care must be taken to avoid situation whereby the valuable
human assets leave to join a rival firm (Brealey, et al, 2006; Weber &Camerer, 2003).
Lubatkin, Schweiger and Weber (1999) find that cultural differences and the removal of
managerial autonomy were associated with significantly greater management turnover in
the first year after acquisition consistent with Lubatkin et al, (1999),Krug and Hegarty
(2001) also find that most managers who departed within five years of acquisition were
those who felt that the acquirer firm did not understand their firm’s culture.
Another important area to consider in post-acquisition integration is the integration of the
merging firms’ information system. Effective integration of information system in any
organisation is a function of technical and organisational factors (Henderson
&Venkatraman, 1993: 4; Kawalek&Wastell, 2005: 84; Luftman& Brier, 1999:109;
Orlikowski, 1992; Wastell, 1999: 591)
Although post-acquisition integration stage of M&A involves intangible assets which
cannot be easily quantified, synergy may be elusive if not strategically handled. Issues
35
around control and appropriate incentives for the acquired firm’s employees should all be
carefully handled.
2.2.2.5 Post-Acquisition Audit and Organizational Learning.
This stage involves long-term plan evaluation, adjustment and capitalizing on success of
M&A. Specific performance measures, such as financial measures as well as information
system integration may be assessed for further development of capabilities and learning
(Cossey, 1991; Datta, 1991; Healy, et al, 1992; Ghosh, 2001; Robbins &Stylianou, 1999
and Sudarsanam, 2003).Post-acquisition audit and organizational learning enables the
emergent firm to continue developing common tools, practices and processes that will be
of immense relevance for future M&As.
2.2.3 Nigerian Banking Sector Regulatory Agencies
The Nigerian banking sector is highly regulated due to the strict surveillance on banking
activities by regulatory authorities. Banks submits data online through an electronic
Financial Analysis and Surveillance System (e-FASS) to Central Bank of Nigeria and
Nigeria Deposit Insurance Corporation on a regular basis – daily, weekly, mid-month,
monthly, quarterly, semi-annually and annually (CBN circular 2007) to enable the
regulatory agencies carry-out their oversight functions.
According to Llwellyn (1986, as cited by Alashi, 2002), banking regulation is defined as
a body of specific rules or agreed behaviour either imposed by government or other
external agency or self-imposed by explicit or implicit agreement within the industry that
limits the activities and business operations of banks. The set of rules and regulations
guiding the Nigerian banking sector are made by regulatory/supervisory authorities set up
by government. The regulatory/supervisory authorities that are concerned with the
regulation of the Nigerian banking sector include:
(1) The Federal Ministry of Finance;
(2) Central Bank of Nigeria;
(3) Nigeria Deposit Insurance Corporation; and
(4) Securities and Exchange Commission (Onyido, 2004: 13).
Section 43 and 44 of CBN Act 2007 provides for the establishment of a Financial
Services Regulation Co-ordinating Committee, whose responsibilities is to:
36
a) co-ordinate the supervision of financial institutions especially conglomerates;
b) cause reduction of arbitrage opportunities usually created by differing regulation
and supervision standards among supervisory authorities in the economy;
c) deliberate on problems experienced by any member in its relationship with any
financial institution;
d) eliminate any information gap encountered by any regulatory agency in its
relationship with any group of financial institutions;
e) articulate the strategies for the promotion of safe, sound and efficient practices for
financial intermediaries, and
f) deliberate on such other issue as may be specified from time to time.
2.2.3.1 Federal Ministry of Finance
The Federal Ministry of Finance (FMF) advises the Federal Government on its Fiscal
operations and cooperates with CBN on monetary matters. Prior to 1991, the Federal
Ministry of Finance and CBN were jointly responsible for the licensing of banks, but now
the sole responsibility of CBN. Section 43 (2f) of CBN Act 2007 that set up the Financial
Services Regulation Co-ordinating Committee makes the Federal Ministry of Finance
part and parcel of the regulatory committee.
2.2.3.2 Central Bank of Nigeria
The Central Bank of Nigeria is the apex regulatory authority in the financial system.
Among its primary functions, the Bank promotes monetary stability, promotes a sound
financial system, and acts as banker and financial adviser to the Federal Government of
Nigeria, as well as banker of last resort to the banks (Onyido, 2004).
Central Bank of Nigeria Act 2007, gave the CBN more flexibility in regulating and
overseeing the banking sector and licensing finance companies. Section 45(1)(a-b) of the
CBN Act 2007 provides that the apex bank shall from time to time determine and through
circulars cause banks to maintain specified reserve requirements and liquidity ratios. Also
Section 44 (e) and (f) empowers CBN and other members of the Financial Services
Regulation Co-ordinating Committee to articulate strategies for the promotion of safe,
sound and efficient practices for financial intermediaries, and deliberate on such other
issue as may be specified from time to time.
37
Central Bank of Nigeria through its Banking Supervision Department carryout functions
and responsibilities of ensuring the soundness of the banking system, promote monetary
stability and a sound financial system. In discharging this responsibility, the Department
carries out on-site as well as off-site supervision of banks (Onyido, 2004).
2.2.3.3 Nigerian Deposit Insurance Corporation
The Nigerian Deposit Insurance Corporation (NDIC) was set up in 1988 to insure
deposits of all licensed banks in order to promote confidence in the Nigerian banking
industry. It is funded by a tax deductible premium paid on the insured deposits of deposit
taking banks. Although an autonomous entity from the CBN, it complements the
regulatory and supervisory role of the CBN and also acts as the liquidator for banks
which the CBN decides to take over and close down (Umoh, 2004).
2.2.2.4 Securities and Exchange Commission
The Securities and Exchange Commission (SEC) is the apex regulatory organ of the
capital market in Nigeria. Its major objective is to promote an orderly and active capital
market by ensuring adequate protection of securities, registering all securities dealers in
order to maintain proper standards of conduct and professionalism, approving and
regulating mergers and acquisitions and maintaining surveillance over the market to
enhance efficiency. Section 43 (2c) of CBN Act 2007 that set up the Financial Services
Regulation Co-ordinating Committee name the Securities and Exchange Commission as a
member of the committee regulating the activities of financial institutions in Nigeria.
2.3 Empirical Review
2.3.1 Trends in Bank Consolidation
The banking system consolidation is a global phenomenon, which started in the advanced
economies. Two notable examples of countries experiencing a wave of mergers and
consolidation in the banking industry in recent times are the United States of America
(USA) and Japan (Hall, 1999). According to Kwan (2004), since the enactment of the
Riegle-Neal Act, which allows interstate branch banking beginning from 1997, the
number of large bank mergers in the USA has increased significantly. Today, the U.S.

38
banking sector is reported to be in good shape, with record profits and relatively low
volumes of problem loans. Further research on mega mergers in the USA suggests that
merged banks experienced higher profit efficiency from increased revenues than did a
group of individual banks, due to the fact that they provide customers with high value
added products and services (Akhavin, et al, 1997). Furthermore, consolidation may
allow a mega bank to enjoy a hidden subsidy which Kwan (2004) referred to as “too-big-
to-fail” subsidy due to the market’s perception of an illusion of government backing of a
mega bank in times of crisis. The Japanese experience also shows that the consensus has
been that significant economies of scale existed in the banking industry before the onset
of the crisis and subsequent reforms in the ‘90s at all levels of output throughout the
industry (Fukuyama, 1993, McKillop et al, 1996).
Consolidation in financial services in the USA and other industrialized countries has
occurred along three lines, namely: within the banking industry, between banks and other
non-bank financial institutions, and across national borders. In the USA, most of the
consolidation that took place occurred within the banking sector. For instance, in that
country, the number of banking organizations fell from about 12,000 in the early ‘80s to
about 7,000 in 1999, a decrease of over 40 per cent. In the USA and Canada, there has
been a trend towards consolidation of commercial banks and investment or merchant
banks, whereas in Europe, where the universal banking model is more prevalent, the
trend has been to combine banking and insurance business. While most of the bank
consolidations in the developed economies have occurred within the domestic front, there
are signs of increased cross-border activities. Such cross-border activities have been
facilitated in Europe with the launch of the Euro (Adeyemi, 2006).
The work of Linder and Crane (1992) is also noteworthy. They analyze the operating
performance of 47 bank-level intrastate mergers that took place in New England between
1982 and 1987. Of the 47 mergers in the sample, 25 were consolidations of bank
subsidiaries owned by the same holding company. The authors aggregate acquirer and
target data one year before the merger and compare it to performance one and two years
after consolidation. The performance of merged banks is adjusted by the performance of
all non-merging banks in the same state as the merging entities. The results indicate that
mergers did not result in improved operating income, as measured by net interest income
plus net non-interest income to assets.

39
Spindit and Tarhan (1993) find gain in their sample of 192 commercial bank mergers
completed in 1986. Non-parametric tests comparing the performance changes of merged
banks with a group of matched pairs indicate that mergers led to operating improvements.
The results, however, may be due primarily to economies of scale. The existing evidence
in the literature suggests that scale economies do exist for institutions holding less than
$100 million in assets. Spindt and Tarhan’s result are based on a sample that is
dominated by mergers involving banks of this size. Because the results maybe driven by
economies of scale at small institutions, it is unclear whether their findings are relevant to
large mergers-the transactions most severely transforming the banking industry.
Hannan and Wolken (1989) conduct a study of the value-weighted abnormal returns
experienced in 43 deals announced between 1982 and 1987. The authors find that, on
average, total shareholder value was not significantly affected by the announcement of
the deal. The authors do, however, find that one determinant, target capitalization, cross-
sectionally influenced expected synergistic gains Target capital was negatively related to
the change in total value.
Houston and Ryngaert (1994) examine abnormal returns from four days before the target
was initially declared a takeover candidate (by any bank) to the announcement day. In
their sample of 153 mergers announced between 1985 and 1991, acquirers suffered a loss
in value and targets enjoyed a gain. However, there was no significant aggregate effect on
the overall value of the two organizations.
Madura and Wiant (1994) study abnormal returns of acquirers over a lengthy period
following the merger announcement. They find that average cumulative abnormal returns
of acquirers in a sample of 152 deals taking place between 1983 and 1987 were negative
during the 36-month period following the merger announcement, however, are not likely
to be due to the price. They seem more attributable to either the merger achieving fewer
benefits than projected, or the market revising downward its expectations for the merger.
The only serious study of the European market on this issue is the recent work by Cybo
Ottone and Murgia (1996). In it they analyze 26 mergers of European financial services
firms (not just banks) taking place between 1988 and 1995 in 13 European banking
markets. Their results are qualitatively similar to much of the analysis conducted on
American banking organizations. Average abnormal returns of targets were significantly
negative and those of acquirers were essentially zero. This pattern suggests that there was
40
a transfer of wealth from acquirers to targets. Also comparable to mergers of American
banks, the change in overall value of European financial firms at the time of the
announcement was small and not significant. This pattern continued for at least a year. In
the year following the merger, (excluding the first 10 days after the announcement), the
combined value of the acquirer and target did not change significantly. The findings of
Zang (1995) on U.S. data contradict those of most abnormal return studies. Among a
sample of 107 mergers taking place between 1980 and 1990, the author finds that
mergers led to significant increase in over all value. Although both merger partners
experienced an increase in share price around the merger announcement, target
shareholders benefited much more on a percentage basis than the acquiring shareholders.
2.3.2 Mergers and Acquisitions Waves
Mergers and acquisitions have often occurred in waves, with different motives behind
each wave. Five M&A waves in the United States of America between 1897 and 2004
were characterized by cyclic activities, caused by a combination of economic, regulatory,
and technological shocks (Gaughan, 2007; Mitchell &Mulherin, 1996; Sudarsanam,
2003). Some of today’s business giants such as USX Corporation, Du Point Inc, General
Electric, Standard Oil (ExxonMobil, Chevron and Amoco) and Eastman Kodak are result
of merger and acquisition (Gaughan, 2007: 36; Sudarsanam2003: 14). A global view of
competition, in which companies often find that they must be big to compete led to once-
unthinkable combinations, such as the mergers of Pfizer and Pharmacia, Bank of America
and FleetBoston Financial Corporation, Citibank and Travelers, Chrysler and Daimler
Benz, Exxon and Mobil, Sanofi and Aventis, Boeing and McDonnell Douglas, AOL and
Time Warner, and Vodafone and Mannesmann (Brealey, et al., 2006; Gaughan, 1999,
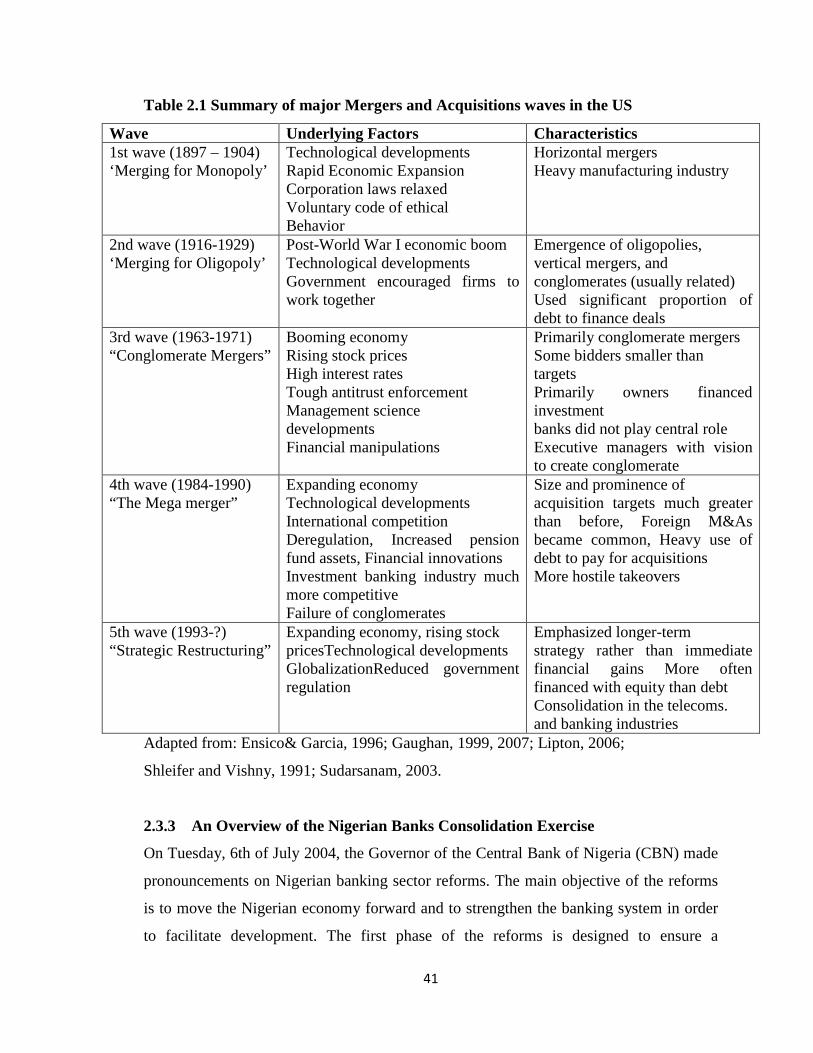
2007; Lipton, 2006; Sidel, 2003). Table 2.1 below summarizes the five major M&A
waves that occurred in the United States of America.
41
Table 2.1 Summary of major Mergers and Acquisitions waves in the US
Adapted from: Ensico& Garcia, 1996; Gaughan, 1999, 2007; Lipton, 2006;
Shleifer and Vishny, 1991; Sudarsanam, 2003.
2.3.3 An Overview of the Nigerian Banks Consolidation Exercise
On Tuesday, 6th of July 2004, the Governor of the Central Bank of Nigeria (CBN) made
pronouncements on Nigerian banking sector reforms. The main objective of the reforms
is to move the Nigerian economy forward and to strengthen the banking system in order
to facilitate development. The first phase of the reforms is designed to ensure a
Wave Underlying Factors Characteristics 1st wave (1897 – 1904) ‘Merging for Monopoly’
Technological developments Rapid Economic Expansion Corporation laws relaxed Voluntary code of ethical Behavior
Horizontal mergers Heavy manufacturing industry
2nd wave (1916-1929) ‘Merging for Oligopoly’
Post-World War I economic boom Technological developments Government encouraged firms to work together
Emergence of oligopolies, vertical mergers, and conglomerates (usually related) Used significant proportion of debt to finance deals
3rd wave (1963-1971) “Conglomerate Mergers”
Booming economy Rising stock prices High interest rates Tough antitrust enforcement Management science developments Financial manipulations
Primarily conglomerate mergers Some bidders smaller than targets Primarily owners financed investment banks did not play central role Executive managers with vision to create conglomerate
4th wave (1984-1990) “The Mega merger”
Expanding economy Technological developments International competition Deregulation, Increased pension fund assets, Financial innovations Investment banking industry much more competitive Failure of conglomerates
Size and prominence of acquisition targets much greater than before, Foreign M&As became common, Heavy use of debt to pay for acquisitions More hostile takeovers
5th wave (1993-?) “Strategic Restructuring”
Expanding economy, rising stock pricesTechnological developments GlobalizationReduced government regulation
Emphasized longer-term strategy rather than immediate financial gains More often financed with equity than debt Consolidation in the telecoms. and banking industries
42
diversified, strong and reliable banking sector, which will ensure the safety of depositors’
money, play active developmental roles in the Nigerian economy and become competent
and competitive players both in the African and global financial systems; while the
second phase will involve encouraging the emergence of regional and specialized banks
(Okagbue and Aliko, 2005: 1).
The Nigerian banks consolidation exercise, mainly through bank mergers and
acquisitions (M & As) in order to attain a minimum capital base of N25 billion (approx
$250 million), is an aspect of the first phase of the reforms. It resulted in the compression
of 89 banks, which accounted for about 93 per cent of the industry’s total deposit
liabilities, into 21 new banks (Komolafe and Ujah, 2006: 1). After the exercise was
concluded, attention has clearly shifted to its term effects on the Nigerian banking system
(Omoh, 2006: 5).
2.3.4 Strategies for Consolidation Adopted by Nigerian Banks
A number of strategies were employed by banks in Nigeria in their bid to comply with
the CBN minimum capital directive. The strategies are:
� Right issues for existing shareholders and capitalization of profits;
� Public offers through the capital market and/or private placement;
� Mergers and acquisitions and
� A combination of the above strategies.
Available statistics show that during the 18-month consolidation period, the capital
market received a boost with a total of N 406 billion raised, out of which the apex bank
has verified and cleared only N306 billion as at 31st December, 2005. The consolidation
drive has also brought in a staggering $3 billion into the sector, $500 million of which
represents Foreign Direct Investment (FDI). This is the highest inflow of FDI into the
non-oil sector within one year (Adeyemi, 2006).
The need for a radical overhaul of Nigeria’s banking system was evident with the
introduction of the Prudential Guidelines in 1990 by the CBN. The sector was highly
fragmented, with just about 10 of the 89 banks controlling more than 70 percent of the
industry’s total assets and savings deposits (CIBN, 2008; Soludo, 2008). The then banks
could not compete with their regional counterparts due to their relatively small size and
thus had little, if any, tangible impact upon the economy. Following the sudden demise of

43
five banks between 1994 and 1995 and the acquisition of 12 banks by the CBN/NDIC, it
was clear that the sector needed urgent reforms to avoid systemic collapse (Augusto and
Co., 1996: 7).
On 6 July 2004, the CBN Governor, Professor Charles Soludo released a revolutionary
consolidation/reform timetable for the banking sector in line with the policy thrust of the
NEEDS document (Ibru, 2006; NPC, 2004; Soludo, 2008), requiring banks to raise their
minimum capital base from N2 billion to N25 billion, with December 31, 2005 as
deadline. This increase representing about 1,150% was to amongst other things
encourage the consolidation of the banking sector to produce mega-banks from the then
existing 89 banks as most of them were just fringe players and financially unsound
(Soludo, 2008).
Why mega-banks?
• Creation of mega banks was aimed at making Nigerian banks compete with
banking institutions from other parts of the world. The creation of mega-banks was to
help Nigeria’s banking sector become Africa’s financial hub, facilitating intra-regional
trade and investments, and join the world-class bank groups (Adesida, 2008; Moin, 2004;
Ogbonna, 2007; Soludo, 2006);
• To act as catalyst to the economic development of Nigeria and the sub-region
through the provision of superior services to the banking public. With a single- obligor-
limit of 35% of equity, the maximum loan amount that can be granted to a single
customer was N700 million (that is, 35% of N2 billion capital base), this was a far cry
from what most customers actually needed. An increase of capital base to N25 billion
meant an increase of single-obligor-limit to N8.75 billion, thus enabling banks to handle
big-ticket transactions (Adesida, 2008; Ogbonna, 2007; Soludo, 2006; Soludo, 2008);
• Building confidence in the Nigerian banking sector so as to interact favourably
with the rest of the world (Soludo, 2008; Steinberg, et al, 2008); and
• Providing good returns to investors through efficiencies and a better range and
quality financial services.
At the end of 31 December 2005, 25 groups emerged from 75 banks out of the 89
licensed banks, these 25 bank groups that were able to meet the N25 billion capital base,

44
either through organic growth by raising funds from the capital market by way of ‘public
offering’ or by mergers and acquisition had their operating licenses renewed, while 14
unsuccessful banks had their operating licenses revoked (CBN, 2005: 45; CIBN, 2008).
Alphabetically itemised in Table 2.2 below are the successful banks that attained the N25
billion capitalisation by December 31, 2005:
Table 2.2 List of Banks in Nigeria as at January 1, 2006.
Bank Constituent member
1 Access Bank Nigeria Plc Access Bank, Marina Int’l Bank & Capital Bank
International
2 Afribank Nigeria Plc AfribankPlc and Afribank Int’l (Merchant Bankers)
3 Bank PHB Plc Platinum Bank Limited and Habib Nigeria Bank
Limited
4 Diamond Bank Plc Diamond Bank , Lion Bank and African
International Bank
5 EcoBank Nigeria Plc EcoBankPlc
6 Equitorial Trust Bank Plc Equitorial Trust Bank Ltd and Devcom Bank Ltd
7 Fidelity Bank Plc Fidelity Bank, FSB International Bank and Manny
Bank
8 First Bank of Nigeria Plc First Bank Plc, MBC International Bank & FBN
(Merchant Bankers)
9 First City Monument Bank
Plc
First City Monument Bank, Coop Development
Bank,
Nigeria-American Bank and Midas Bank
10 First Inland Bank Plc First Atlantic Bank, Inland Bank (Nigeria) Plc, IMB
International Bank
Plc and NUB International Bank Limited
11 GT Bank Plc GT Bank Plc
12 IBTC-Chartered Bank Plc IBTC, Chartered Bank Plc and Regent Bank Plc
13 Intercontinental Bank Plc Intercontinental Bank Plc, Global Bank Plc, Equity
Bank of Nigeria

45
Limited and Gateway Bank of Nigeria Plc
14 **Nigeria International Bank
Limited (Citi Group)
Nigeria International Bank limited
15 Oceanic Bank International
Plc
Oceanic Bank International Plc and International
Trust Bank
16 Skye Bank Plc Prudent Bank Plc, Bond Bank Limited, Reliance
Bank Limited , Cooperative Bank Plc and EIB
International bank Plc
17 Spring Bank Plc Citizens International Bank , ACB International
Bank, Guardian Express Bank, Omega Bank, Trans
International Bank and Fountain Trust Bank
18 **Stanbic Bank of Nigeria
Ltd
Stanbic Bank of Nigeria Limited
19 **Standard Chartered Bank
Ltd
Standard Chartered Bank Limited
20 Sterling Bank Plc Trust Bank of Africa Limited, NBM Bank Limited,
Magnum Trust Bank, NAL Bank Plc and Indo-
Nigeria Bank
21 United Bank for Africa Plc United Bank for Africa Plc, Standard Trust Bank Plc
and Continental Trust Bank
22 Union Bank of Nigeria Plc Union Bank of Nigeria Plc, Union Merchant Bank
Limited, Broad Bank of Nigeria Limited and
Universal Trust Bank Nigeria Plc
23 Unity Bank Plc Intercity Bank Plc, First Interstate Bank Plc, Tropical
Commercial Bank Plc, Centre-point Bank Plc, Bank
of the North, New African Bank, SocieteBancaire,
Pacific Bank and New Nigerian Bank
24 Wema Bank Plc Wema Bank Plc and National Bank of Nigeria
Limited
25 Zenith Bank Plc Zenith Bank Plc
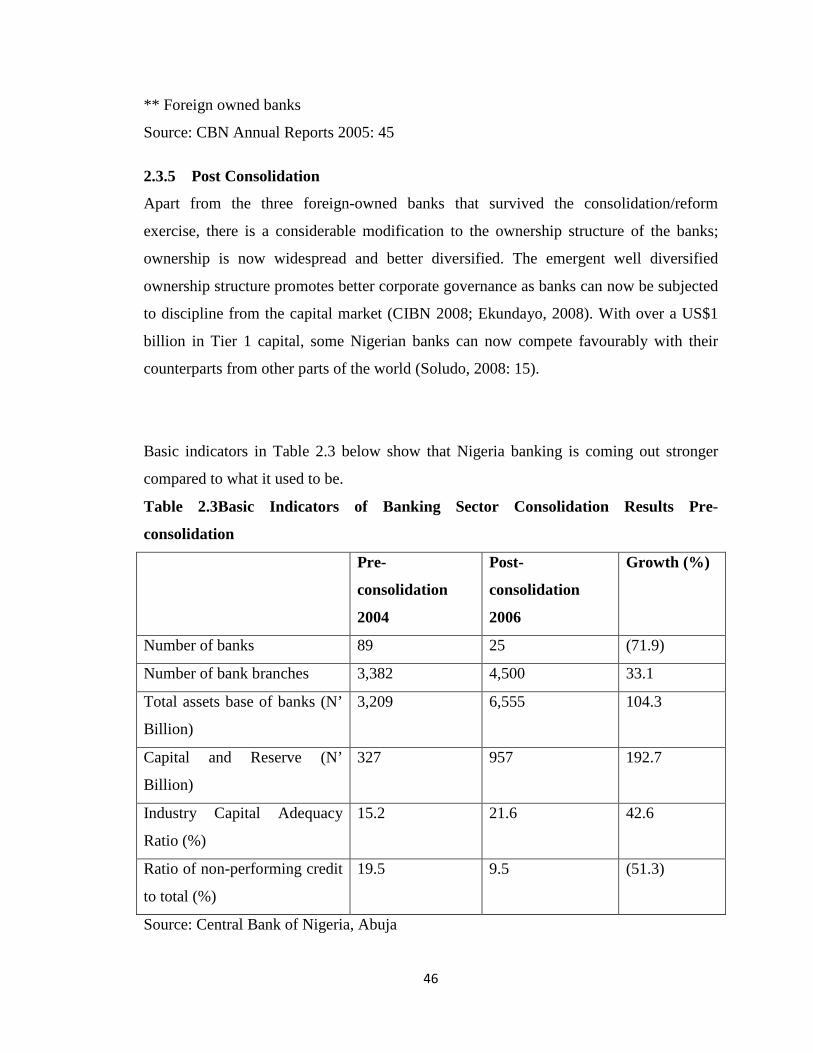
46
** Foreign owned banks
Source: CBN Annual Reports 2005: 45
2.3.5 Post Consolidation
Apart from the three foreign-owned banks that survived the consolidation/reform
exercise, there is a considerable modification to the ownership structure of the banks;
ownership is now widespread and better diversified. The emergent well diversified
ownership structure promotes better corporate governance as banks can now be subjected
to discipline from the capital market (CIBN 2008; Ekundayo, 2008). With over a US$1
billion in Tier 1 capital, some Nigerian banks can now compete favourably with their
counterparts from other parts of the world (Soludo, 2008: 15).
Basic indicators in Table 2.3 below show that Nigeria banking is coming out stronger
compared to what it used to be.
Table 2.3Basic Indicators of Banking Sector Consolidation Results Pre-
consolidation
Pre-
consolidation
2004
Post-
consolidation
2006
Growth (%)
Number of banks 89 25 (71.9)
Number of bank branches 3,382 4,500 33.1
Total assets base of banks (N’
Billion)
3,209 6,555 104.3
Capital and Reserve (N’
Billion)
327 957 192.7
Industry Capital Adequacy
Ratio (%)
15.2 21.6 42.6
Ratio of non-performing credit
to total (%)
19.5 9.5 (51.3)
Source: Central Bank of Nigeria, Abuja
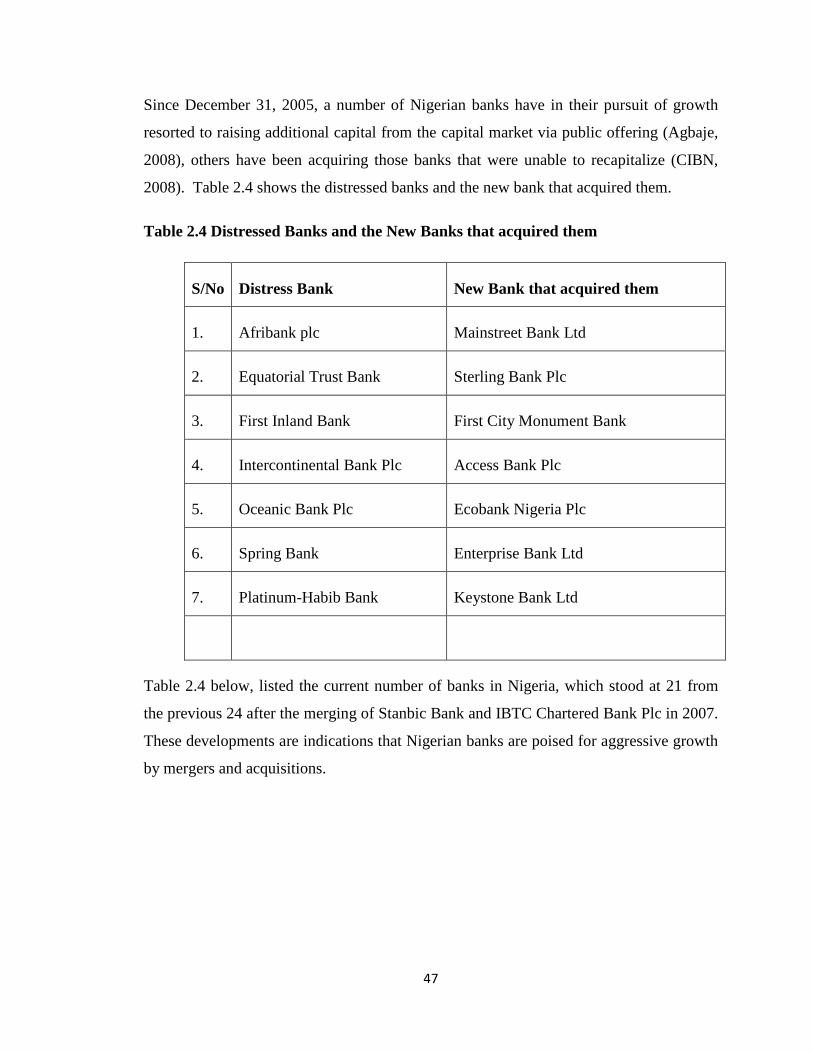
47
Since December 31, 2005, a number of Nigerian banks have in their pursuit of growth
resorted to raising additional capital from the capital market via public offering (Agbaje,
2008), others have been acquiring those banks that were unable to recapitalize (CIBN,
2008). Table 2.4 shows the distressed banks and the new bank that acquired them.
Table 2.4 Distressed Banks and the New Banks that acquired them
S/No Distress Bank New Bank that acquired them
1. Afribank plc Mainstreet Bank Ltd
2. Equatorial Trust Bank Sterling Bank Plc
3. First Inland Bank First City Monument Bank
4. Intercontinental Bank Plc Access Bank Plc
5. Oceanic Bank Plc Ecobank Nigeria Plc
6. Spring Bank Enterprise Bank Ltd
7. Platinum-Habib Bank Keystone Bank Ltd
Table 2.4 below, listed the current number of banks in Nigeria, which stood at 21 from
the previous 24 after the merging of Stanbic Bank and IBTC Chartered Bank Plc in 2007.
These developments are indications that Nigerian banks are poised for aggressive growth
by mergers and acquisitions.

48
Table 2.5 List of exiting banks in Nigeria
S/No Existing Banks in Nigeria
1. Access Bank of Nigeria Plc
2. Diamond Bank of Nigeria Plc
3. Ecobank of Nigeria Plc
4. Enterprise Bank of Nigeria Plc
5. Fidelity Bank Plc
6. First Bank Plc
7. First City Monument Bank Plc
8. Guaranty Trust Bank
9. Keystone Bank Plc
10 Main Street Bank Plc
11. Skye Bank Plc
12. Stanbic IBTC Plc
13. Standard Chartered Bank Plc
14. Sterling Bank Plc
15. United Bank for Africa Plc
16. Union Bank of Nigeria Plc
17. Unity Bank Plc

49
18. Wema Bank Plc
19. Zenith Bank
20. Citi Bank
21. Heritage Banking Company Ltd
2.3.6 Elements of the Banking Reforms
The key elements of the reforms are as follows:
• The requirements of minimum capitalization for banks to N25 billion as at Dec
2005 that is 18 months was given as a notice instead of 12 months normally in many
countries.
• Only the banks that meet up with deposits participated in Duteh Auction System
(DAS) by end of 2005.
• Consolidation of banking institution through mergers and acquisition.
• Adoption of a risk focused and ruled based regulatory framework. The rule of the
game was announced in advanced and these were repeated.
• Arbitrariness was reduced to the barest minimum. More often, operators who run
foul of the rules plead “political” those who petition for ‘political solutions’ to otherwise
strictly economic and financial problems were made to understand the dangers that such
arbitrariness could do to the system, and the wrong signals and morals hazard that it
creates and there may be no end to it. The system will suffer. In the interest of preserving
the integrity of the system, transparency and probity, the rules and regulatory framework
was insisted upon for the interest of Nigeria and Nigerians.
• Adoption of zero tolerance in the regulatory framework, especially in this area of
data/inform motion rendition/reporting. All returns by banks must be signed by the
managing director of the banks the so-called reengineering or manipulation of accounts
especially hiding of information under other assets/liabilities and off – balance sheets
attracted serious sanctions.
• The automation process for rendition of returns through the electronic financial
Analysis and Surveillance system (E-FASS) was completed expeditiously.
50
• Establishment of a hotline confidential internet address ([email protected])
for all Nigerians wishing to share any confidential information with the governor of the
central Bank on the operations of any bank or the financial system. Only the Governor
has access to the address.
• Strict enforcement of the contingency planning framework for systemic banking
distress.
• Promotion of the enforcement of dormant laws, especially those relating to the
issuance of dud cheques, and the law relating to the vicarious liabilities of the Board
members of banks in cases of failings by the bank. A situation where a bank collapses
due to negligence and mismanagement and the bank directors move about in their
limousines while the poor depositors languish in pains is unjust and unfair. There is a
law, which makes the Directors and management liable, and was enforced.
• Revision and updating of relevant laws and drafting of new ones relating to the
effective operations of the banking system.
• Closer collaboration with the economic and financial crimes commission (EFCC)
in the establishment of the financial intelligence unit (FIU) and the enforcement of the
anti-money laundering and other economic crime measures. Greater transparency and
accountability is the hallmark of the system.
• Rehabilitation and effective management of the mint to meet the security printing
needs of the Nigeria, including the banking system which constitutes over 90 percent of
the mint ‘business’. In due course there was no need to print bank cheques abroad.
The central bank in collaboration with other institutions such as the Nigerian Deposit
Insurance Corporation (NDIC) securities and exchange commission (SEC) Nigerian
stock exchange (NSC) the fiscal authorities, National Assembly and the bankers
committee worked out the structure of incentives and legal/regulatory frameworks to
facilitate the rapid consolidation of the system. A technical committee was set up
including international and national consultants who provided free consultancy services
to banks that merged/acquired. The gnat of incentives and guidelines was worked out.
Banks that merged and met the minimum capital base by March 2005 were recorded.
51
2.3.7. Legal Hurdles for M&A in Nigerian Banking Sector
M&A in the Nigerian banking sector is guided by the provisions of:
• Sections 99 - 123 of the Investment and Securities Act (ISA) No. 45 of 1999 and
the Rules and Regulations of the Securities and Exchange Commission pursuant to the
ISA;
• Banks and Other Financial Institutions Act (BOFIA) No. 25 of 1991; and
• Sections 538 and 539 of the Companies and Allied Matters Act (CAMA) 1990.
The objective of M&A regulation by the Investment and Securities Act, Banks and
Other Financial Institutions Act and the Companies and Allied Matters Act is to prevent
restraint of competition and monopolistic tendencies. They provide that a majority
agreement is required at a court-ordered meetings before approval of the Securities and
Exchange Commission is sought for: the transfer to the transferee of property and
liabilities; allotting or appropriation by transferee company shares, debentures, policies or
other like interest; continuation by or against the transferee company of any legal
proceedings pending; and dissolution, without winding-up, of any transferee company.
The Acts also have provision for dissenting shareholders (Okonkwo, 2004; Ogwu, 2004).
Section 7(1) of the Banks and Other Financial Institutions Act (BOFIA) stated
emphatically that banks must obtain the approval of the Governor of CBN before any
merger and/or acquisition is announced and/or consummated.
2.3.8 Traditional Views of the Value of Mergers and Acquisitions
Merger and acquisition activity results in overall benefits to shareholders when the
consolidated post-merger firm is more valuable than the simple sum of the two separate
pre-merger firms. The primary cause of this gain in value is supposed to be the
performance improvement following the merger. The research for post-merger
performance gains has focused on improvements in any one of the following areas,
namely efficiency improvements, increased market power, or heightened diversification.
Several types of efficiency gains may flow from merger and acquisition activity. Of
these, increased cost efficiency is most commonly mentioned. Many mergers have been
motivated by a belief that a significant quantity of redundant operating costs could be
eliminated through the consolidation of activities. For example, Wells Fargo estimated
annual cost savings of $1 billion from its 1996 acquisition of First Interstate.
52
Consolidation enables costs to be lowered if scale or scope economies can be achieved.
Larger institutions may be more efficient if redundant facilities and personnel are
eliminated within the post-merger organization. Moreover, costs may be lowered if one
bank can offer several products at a lower cost than separate banks each providing
individual products. Cost efficiency may also be improved through merger activity if the
management of the acquiring institution is more skilled at holding down expenses for any
level of activity than that of the target.
Bank merger and acquisition activity may also encourage improved revenue efficiency in
a manner analogous to cost efficiency. Some recent deals, such as the proposed
acquisition of Boatmen's Bancshares by NationsBank, have been motivated by potential
gains in this area. According to this view, scale economies may enable larger banks to
offer more products and services, and scope economies may allow providers of multiple
products and services to increase the market share of targeted customer activity.
Additionally, acquiring management may raise revenues by implementing superior
pricing strategies, offering more lucrative product mixes, or incorporating sophisticated
sales and marketing programs. Banks may also generate greater revenue by cross-selling
various products of each merger partner to customers of the other partner. The result is
supposed to be higher revenue without the commensurate costs, i.e., improved profit
efficiency. The latter term in general refers to the ability of profits to improve from any
of the sources noted above, cost economies, scope economies or marketing efficiency. In
a sense, it represents the total efficiency gains from the merger without specific reference
to the separately titled efficiency improvement areas.
Merger-related gains may also stem from increased market power. Deals among banks
with substantial geographic overlap reduce the number of firms in markets in which both
organizations compete. A related effect of in-market mergers is that the market share of
the surviving organization in these markets is raised. These changes in market structure
make the affected markets more vulnerable to reduced competition. The increased market
power of the surviving organization may enable it to earn higher profits by raising loan
rates and lowering deposit rates.
It should be noted that antitrust policies of the Federal Reserve and Department of Justice
are designed to prohibit mergers with substantially anti-competitive effects. However, to
53
the extent that a local market can be exploited by a merger which results in substantial
market power, the potential gain could be substantial.
Finally, mergers may enhance value by raising the level of bank diversification.
Consolidation may increase diversification by either broadening the geographic reach of
an institution or increasing the breadth of the products and services offered. Moreover,
the simple addition of newly acquired assets and deposits facilitates diversification by
increasing the number of bank customers.
Greater diversification provides value by stabilizing returns. Lower volatility may raise
shareholder wealth in several ways. First, the expected value of bankruptcy costs may be
reduced.
Second, if firms face a convex tax schedule, then expected taxes paid may fall, raising
expected net income. Third, earnings from lines of business where customers value bank
stability may b e increased. Finally, levels of certain risky, yet profitable, activities such
as lending may be increased without additional capital being necessary. Any one of these
reasons for gains from mergers is sufficient, and different ones presumably are relevant in
different circumstances. Not all mergers are expected to result in cost efficiencies; no
does each one result in higher revenue and/or diversification gains. However, for any
specific merger to create value, at least one of these gains appears to be necessary to
achieve it. A casual review of the press suggests most mergers assert cost advantages,
while revenue and diversification gains are less often mentioned. When firms of
dissimilar franchise merge, on the other hand, revenue efficiency or diversification are
often the indicated reasons. Participants in in-market mergers trumpet cost efficiencies,
while others allege market power outcomes. In the U.S., the geographic expansion of the
franchise of major super regionals, by contrast, often speaks of the transference of best
practice in production and the stability of a large geographic distribution channel.
Whether any of these gains are obtained is another matter. Bankers, and their investment
bankers can allege all sorts of benefits.
2.3.9 Critical Success Issues of Mergers and Acquisitions in the Nigerian Banking
Industry
54
Consolidation is in some instances driven by regulation, the generic factors influencing a
potential acquirer or buyer en-composes economic of scale, growth in market share, need
to enter a new and more growth oriented market, and desire to invest excess capital.
On the side of the potential sellers, the influencing factors may include lack of
management succession, inability to keep pace with change, particularly, technology,
regulatory pressures and perceived opportunity to cash out at a higher price.
Reforms through consolidation are motivated by four key economic factors, which are:
(i.) Economic of scale
(ii.) Economic of scope
(iii.) Potential for risk diversification
(iv.) Bank management.
i) Economic of Scale:
This is the relationship between the average production cost per unit of output and
production volume. A firm that produces a higher volume of output can see its unit cost
of production declining because the costs of some of the inputs are fixed. While
researchers generally agree that economics of scale do exist in the banking industry at
low levels of output, there is less agreement about whether diseconomies of scale prevails
at high levels of output.
ii) Economics of scope:
This is a situation where the joint costs of producing two complementary outputs are less
than the combined costs of producing the two outputs separately, this may arise when the
production processes of both outputs share some common inputs, including both capital
(such as the actual building the bank occupies) and labour such as bank management.
iii) The Risk Diversification:
Evidence has shown that geographic expansion would provide diversification benefits to
a banking organisation not only by reducing its portfolio risk on the asset side, but also
by lowering its funding risk on the liability side, as it spreads funding activities over a
larger geographic area. (Hughes, Langmester and Moon 1999) further evidence suggests
that product expansion could yield diversification benefits, most notably between
banking and securities activities, while less so between banking and insurance.

55
iv) Bank management, personal incentives:
These may include the desire to run a larger firm and the desire to maximize their own
personal welfare.
In order to achieve a less costly consolidation exercise, due diligence and negotiation are
essential ingredients. Due diligence involves the judgement care and prudence that an
entity should reasonably undertake in order to evaluate any business proposition. In
mergers and acquisitions, due diligence is a critical element. It seeks to confirm the
material facts and figures provided by the seller, the acquirer therefore has the
opportunity to identify subtle but important background details that will impact on the
eventual value placed on the business. Due diligence is therefore intended to provide an
accurate assessment of the target by highlighting key issues, uncover hidden competitive
threats, ensuring disclosure of adequate information to enable the potential acquirer take
informed decisions and determine a fair value that is satisfactory to the parties involved.
Post-merger integration is a tortuous and complex process which involves the integration
of organisations operations, customers and products and service offerings (Deloilte 2005)
this requires an effective post acquisition integration plan that incorporates the processes
involved in the integration. The integration process involves careful staff selection
process that is fair, transparent, efficient and profitable, interfacing information
technology applied by the companies, and synchronization of operational procedures and
service offerings.
The critical success factor therefore, includes the ability to manage risks, ensure control
and exploit growth areas in the blended organisation. Mr. M. Ajayi (2004) identifies
some points for successful merger integration as follows:
a) Proper programme management: defining an integration roadmap and process to
manage issues that may arise.
b) The ability to realize value: - being able to capture synergies, and meet strategy
targets and establish the appropriate culture.
c) Integrating infrastructures establishing common bank office operations,
procedures and processes, and rationalizing and migrating information systems to
common platform.

56
d) Organisational preparedness: such as leadership and staffing, execution plans
change management support.
2.3.10 Challenges of the Banking Reforms
The challenges can be viewed from 2 sides
1. Pre-consolidation
2. Post-consolidation
Pre – Consolidation Challenges
The challenges before the CBN in ensuring the realization of the objectives of the
banking system reforms were enormous, especially as it was a pioneering effort with no
previous internal experience in consolidation to draw from. Experiences of other
countries could not represent and absolute fit to our peculiar problems, with our
economic environment.
Some of the challenges are as follows: -
a. Lack of country experience and technical knowledge on large-scale consolidation
manifesting partly in lack of experienced staffs on the subject of mergers and acquisitions
on both the regulations and operators side.
b. Dominant government ownership in some banks and its implication for good
corporate governance in emergent banks.
c. The possibility of inflow of laundered funds into the system and the stretched
supervisory capacity as a result of the plethora of capital verification exercises arising
from mass re-capitalization by banks.
d. The problem posed by delinquent assets and non-performing loans of banks
which might distort the balance sheet of emergent banks if not well handled. The
situation was worsened by the prevalence of falsified records/accounts that were kept by
the banks.
e. Operational challenge arising from ICT systems and cultural integrations as a
result of mergers and acquisition.
f. Supervision and regulation of mega banks.
g. Possible litigations on mergers and acquisitions.
57
h. It was inevitable that some of the mergers and acquisitions will result in
redundancies of human resources especially where skills and competencies are
duplicated.
Post-Consolidation Challenges
The post-consolidation mega institutions, would perhaps pose the greatest challenges in
the areas of corporate governance, supervision, ICT integration etc.It is an established
fact that the fastest route to improving efficiency in any industry is to foster competition
among the operators.
A major challenge of bank consolidation is how to foster competition with fewer mega
banks fewer cannot be more competitive. There is however, the other side of the
argument, which considers the number and spread of bank branches. The fewer banks are
likely to be pressured to expand further, seeking business opportunities through
aggressive branching to hitherto unexplored territories.
The large capital requirement that comes with the on-going bank consolidation in
Nigeria poses a challenge of generating commensurate return. If Nigerian banks want to
maintain any semblance of their five-year average return on equity (about 43.92% during
1998 to 2002) a figure averaging between N11billion and N19.8billion would become the
new profit targets. This might not be a big deal for the big banks that have being in
operation within this threshold. But for the new big banks, it could signpost the race of
death, which the Central Bank must gear up to monitor and find strategies to check.
Another major challengeis capacity building for risk management, for both the regulators
and operators. It is not unlikely that contain key individual would in the consolidation
process take some strategic positions that might not be acceptable to other stakeholders
after the process is completed.
One other important challenge is in the gaps that exist in the legal frame work for
banking in Nigeria, including the Central Bank of Nigeria Act and the banks and other
financial institutions Act in the main provisions that enhance the autonomy of the apex
bank and minimize restrictions on the emerging mega banks are most desirable in the
post consolidation era.
There has been the argument that Small and Medium Scale Enterprises (SMES) will
suffer neglect in lending by the emerging mega banks. Available evidence in the work of
Jayaratne and Wolkan (1998) suggest that banks consolidation will have little effect on
58
credit availability to small firms. Other findings by Cole and Walraven (1998) suggest
that consolidation in the banking industry may have enhanced rather than restricting the
availability of credit to small business.
Another challenge the bank regulatory authorities and indeed all the stakeholders of
Nigerian banking is the fresh wave of fierce competition that accompanies bank
consolidation and its capacity to trigger another around of unethical practices and poor
corporate governance. Most big organizations, whether banks or non-banks have one
time or the other violated the basic tenets of good corporate governance.
Berenson (2003) highlighted this in two ways;
1. Employ unethical strategies to beat competition, in the bid to meet profit targets.
This entails strategies for getting and keeping business, as well as negative application of
deep smarts in public sector dealings.
2. With all the mega banks listed on the stock exchange, performance pressures
might result in income inflation.
An important challenge of bank consolidation comes under the nomenclature of financial
infrastructure, dealing with the capital market, insurance sub-sector and new financial
instruments. Only very few analysts would have given the Nigerian capital market any
thought of the volume of fresh capital raised from it in the last one year, June 2004 to
June 2005.
2.3.11 Prospect and Effect of Banking Consolidation
The consolidation of the Nigerian Banking system started after the announcement of July
6 2004 by the Governor of the Central Bank of Nigeria to the bankers committee on
banking sector reforms. In order to encourage and assist banks to meet the requirements.
Some incentives were promised by the Central Bank of Nigeria.
As at July 8, 2005 twenty-one (21) group involving sixty-four (64) banks had signed
memoranda of understanding (MOU) while others were still holding discussions towards
consolidations.
The prospect of the consolidated banks are as follows: -
a) Banks that consolidated were allowed to participate in foreign exchange market.
b) Permission to collect public sector deposits and government revenue.
59
c) Prospect to manage part of Nigeria foreign reverse holdings.
d) Reduction in transaction cost.
e) Provision of technical assistance by the Central Bank.
f) The initial public offerings by banks through the capital market when completed was
expectedly increased to the level of financial deepening as evidenced in the upsurge in
the volume and value of trading in the stock market.
g) The reforms in the banking industry has been able to attract more foreign investment
inflow especially in the area of portfolio investment, this development if sustained will
boost the level of economic activity especially towards non-oil sector.
h) The consolidation of banks is likely to attract a significant level of foreign banks
entrance into Nigeria, which will become a feature in the industry overtime. This will
bring about more confidence by the international community of the banking sector in
Nigeria thereby attracting more foreign investment into the country.
i) As the level of financial intermediation increase, interest rate is likely to fall and
increase lending to the real sector will generate growth.
Other Implications
The broad implication of the policy shift is to create a fundamentally strong banking
sector for the benefit of Nigeria and all stake holders. The emerging big banks will be
expected to have a stronger capital structure and expectedly a reduced risk profile, by
eliminating duplicate costs, the new banking system would be more efficient.
Also, consolidation is expected to create regional banking with corresponding degree of
efficiency to compete with international banks. This would enhance trade across West-
Africa sub-region, whilst also contributing to the enhancement of Africa banking
structure that should be able to contribute to economic growth and development in the
continent.
However, the policy shift is likely to have some united adverse implications. In what
follows, an attempt will be made to highlight some of the specific implications (both
positive and otherwise).
a) Consolidation and payment system efficiency
Consolidation reduces inter-bank transactions and/or increases intra-bank transactions
and hence efficiency payments system. In addition, many of the remaining bank payment

60
may be cleared more quickly and efficient because there are fewer end points to which to
send payment information or payment instruments. Thus every individual institution are
not more proficient in handling cheques, credit card, debit cards, automated clearing
system, wire payments etc, the payments system efficiency increases with consolidation
as the number of institutions declines.
It also positively affects the payments system by improving scale efficiencies in bank
office payments operations as larger processing sites may yield scale efficiencies in
processing payments information/instruments.
b) Distress Resolution
Consolidation may be an efficient way of resolving problems of financial distress.
Institutions that are troubled because of their own inefficiency or underperforming
investments are often taken over as an efficient alternative to bankruptcy or other means
of exit. In that type of situation, the ideal merger would be for the ailing financial
institution to be merged with a conservatively/leveraged one that has a complementary
mix of financial products, services, and target markets. In the United States, the Federal
Home Loan Bank System had arranged the mergers of a number of large “problem”
savings and loan associations into sound institutions, and the Federal Reserve System had
done the same thing for banks.
c) Capital Market
Consolidation may encourage the development of capital markets, with potential benefits
for financial stability. This is because consolidation through mergers and acquisitions
may force the parties involved to raise funds from the capital market to consummate the
transactions. Thus there would be increased activities in the capital market. By extension,
there may be dilution in the ownership of banks. A widespread ownership of banks has
the potential benefit of reducing the possibility of abuse by owners of banks, for instance,
the owners using banks to form other activities.
61
d) Confidence in the banking system
Banks, although stringently regulated, are prone to runs. This is because they are known
to be highly geared; confidence is therefore crucial for banks to attract and retain
deposits, big banks have been observed to be less vulnerable to external shocks. It could
therefore, be said that big banks enhance the confidence of the public. Since
consolidation is expected to lead to the creation of large and strong banks, confidence in
the nation’s banking system is likely to be enhanced and this in turn may lead to
improvement in banking habits of the populace thereby enhancing the efficacy of
monetary policy.
e) Effectiveness of IT Architecture
The effectiveness of IT system might be impaired, at least in the short-run. IT systems
should be able to provide management information that is accurate timely and relevant to
managing a bank’s risks. IT is most probably the biggest risk if not properly, planned and
managed. In the long-run however, consolidation is expected to lead to the deployment
of highly sophisticated IT systems that would be of immense advantage to the industry in
particular and the economy in general.
f) Financial Safety Net
Given the importance of banks to the economy their inherent fragility and the devastating
and painful consequences of banks failure, most governments put in place safety nets.
Financial safety nets are made up of effective supervision, lender-of-last-resort role and
deposit insurance.
g) Regulation and Supervision
Consolidation will not only lead to large banks but it may also lead to the merger of
banks involved in both securities and money market activities.
The development will necessarily entail reviewing the prevailing regulatory/supervisory
approaches/processes in particular, strong prudential regulation, risk-based and
consolidated supervisory approaches, strong accounting and disclosure regimes and
effective self-regulation may be unavoidable.
62
h) Strong Prudential Regulation
In order to ensure safe and sound banking practices in a consolidated banking
environment, there is the need for effective frameworks for strong prudential regulation,
supervision and laws covering the establishment of new banks, the implementation of
minimum capital requirements, the qualifications of directors and managers, sound
business activities, fit and proper test for controlling shareholders, standards for risk
management, strong internal control and external audits. Supervisory discipline can be
exercised by ensuring that banks are monitored for safety and soundness as well as
compliance issues and that corrective actions are taken promptly when problems surface
including the closure of banks when necessary.
i) Risk-Based Supervision
With consolidation, there is the need to adopt a robust, proactive and sophisticated
supervisory process, which should essentially be based on risk profiling of emerging big
banks. In other words, the adoption of an appropriate risk-based supervisory approach is
imperative with consolidation. The approach entails the design of a customized
supervisory programme for each bank and it should focus more attention on banks that
are considered to have potentially high systemic impact.
j) Consolidation Supervision
Consolidation has no doubt made it imperative for consolidated supervision that requires
consultation and corporation amongst the various regulatory/supervisory institutions in
the system. It is equally imperative that the present reporting format of banks be reviewed
so as to incorporate all possible activities that banks undertake under the present
dispensation. This will make it possible for supervisors to obtain a global view of the
banks operations. The current efforts of the CBN/NDIC in the development of an
electronic financial analysis surveillance system (e-FASS) and the activities of the
Financial Services Regulation Coordinating Committee (FSRCC) would go a long way to
assist in this regard.
k) Responsive Corporate Governance
Responsive corporate governance is always an aspect that is closely monitored by the
regulatory authority in order to ensure the transparency and accountability of

63
management of banking institutions and the curtailment of the then risk appetite.
Consideration should always be given to the possibility that corporate governance, in
particular internal control systems, will be less effective during a merger, since the
persons responsible for governance and control will be focusing on strategic issues
relating to the merger. Regulatory/supervisory authorities must therefore continue to
encourage the enthronement of responsive corporate governance structure for effective
risk management both during and after consolidation by banks.
l) Range of Product Lines Available to Consumers
Banking consolidation should potentially be in the public interest, particularly in the area
of service delivery as consolidation is expected to add some depth to the local banking
sector and make a worthwhile contribution to banking services and the banking industry
in a particular country. A frequent factor motivating mergers According to Mr. Afolabi
of CBN research dept. is the possibility of scope efficiencies, the pursuit of these
efficiencies often results in the product lines of two entities being rationalized, with
consequent cost benefits, since a single delivery system is used to sell a “better” (bigger)
range of products. They often increase the options that consumers have and enhances the
utility of these options.
He further says that it will improve economics of scale fairly likely after consolidation.
Larger transaction volume and larger asset positions through a rationalized delivery
system, means that unit costs can be reduced, when such cost reductions are passed on to
the consumers, this may be regarded as a public interest benefit.
m) Staff Rationalization
In a service industry such as banking, motivation of staff is a key factor in ensuring that
efficiency is maintained when banks consolidate, there is the tendency that jobs might be
lost as part of the repositioning strategies the new management may want to undertake.
Apart from the adverse impact on employment level, the development could also impact
negatively on the morale of the remaining workforce.
The adverse effects on employment is, however, expected to wane with time as a stronger
banking sector would inevitably recruit more staff when the respective banks grow and
open new branches. In addition, the induced employment generation from the real sector

64
of the economy might more than compensate for job loss, net of attrition, during
consolidation.
2.3.12 Some Prior Study
Some of the studies that were carried out in the past that are in relation to the concept
under study will be reviewed in this section.
Berger and Humphrey (1992), for example, examine mergers occurring in the 1980s that
involved banking organizations with at least $1 billion in assets.The results of their paper
are based on data aggregated to the holding company level, using frontiermethodology
and the relative industry rankings of banks participating in mergers. Frontiermethodology
involves econometrically estimating an efficient cost frontier for a cross-section ofbanks.
For a given institution, the deviation between its actual costs and the minimum cost point
onthe frontier corresponding to an institution similar to the bank in question measures X-
efficiency. Theauthors find that, on average, mergers led to no significant gains in X-
efficiency.
Berger andHumphrey also conclude that the amount of market overlap and the difference
between acquirer andtarget X-efficiency did not affect post-merger efficiency gains. In
addition to testing X-efficiency,they also analyze return on assets and total costs to assets
and reach a similar conclusion: no averagegains and no relation between gains and the
relative performance of acquirers and targets.Non-interest costs yield significant results,
but the findings are opposite of expectations that theoperations of an inefficient target
purchased by an efficient acquirer should be improved.
Akhavein, Berger, and Humphrey (1997) analyze changes in profitability experienced in
the same setof large mergers as examined by Berger and Humphrey. They find that
banking organization significantly improved their profit efficiency ranking after mergers.
However, rankings based on moretraditional ROA and ROE measure s that exclude loan
loss provisions and taxes from net income didnot change significantly following
consolidation.
DeYoung (1993) also utilizes frontier methodology to examine cost efficiency and
reachessimilar conclusions as Berger and Humphrey. Cost benefits from mergers did not
exist for 34 8bank-level mergers taking place in 1986 and 1987. In addition t o the lack of
65
average efficiency gains,improvements were unrelated to the difference between acquirer
and target efficiency. However,DeYoung does find that when both the acquirer and target
were poor performers, mergers resultedin improved cost efficiency.
In addition to frontier methodology, the literature contains several papers that
solelyemploy standard corporate finance measures to analyze the effect of mergers on
performance. Forexample, Srinivasan and Wall (1992) examine all commercial bank and
bank holding companymergers occurring between 1982 and 1986. They find that mergers
did not reduce non-interestexpenses. Srinivasan (1992) reaches a similar conclusion.
Both of these studies focus solely on non-interest expenses resulting in an incomplete
picture ofthe cost savings associated with mergers. In order to gain a complete view of
bank costs, the totalof interest and non-interest expenses must be examined. Various
funding and investment strategieshave different impacts on the two cost components. For
example, an increase in purchased fundsraises interest costs, but lowers non-interest
costs.
Toward this end, Rhoades (1993) conducts a thorough examination of in-market mergers
taking place between 1981 and 1986. Here gresses the change in several performance
measures on controlvariables and a dummy variable differentiating bank that engaged in
an in-market merger from thosethat did not. Rhoades also conducts several login analyses
where the dependent variables measurewhether the efficiency quartile of a bank
increased, decreased, or remained unchanged. In both setsof tests, cost reductions and
efficiency gains were not significantly related to horizontal mergers.
The 1993 study is the most recent of a number of studies on the subject by this author. In
anearlier study, Rhoades (1987) examines the impact of mergers on the ratios of net
income beforeextraordinary items to assets and non-interest expenses to assets. He runs
probit analyses in whicha dummy variable distinguishing non-acquired banks from banks
acquired by multibank holdingcompanies is the dependent variable. Performance
measures and several control variables serve asthe independent variables. Rhoades finds
that neither income nor non-interest expenses were affectedby merger activity. In
Rhoades (1990), a similar study to Rhoades (1993) is conducted with acquisitions
involving billion dollar banks. Consistent with his other work, Rhoades finds
noperformance effect due to mergers.
66
The work of Linder and Crane (1992) is also noteworthy. They analyze the
operatingperformance of 47 bank-level intrastate mergers that took place in New England
between 1982 and1987. Of the 47 mergers in the sample, 25 were consolidations of bank
subsidiaries owned by thesame holding company. The authors aggregate acquirer and
target data one year before the mergerand compare it to performance one and two years
after consolidation. The performance of mergedbanks is adjusted by the performance of
all non-merging banks in the same state as the merging entities. The results indicate that
mergers did not result in improved operating income, as measuredby net interest income
plus net non-interest income to assets.
Several studies find evidence of merger gains, but the results of these studies must be
scrutinizedcarefully. Spindt and Tarhan (1993) find gains in their sample of 192
commercial bank merger scompleted in 1986. Non-parametric tests comparing the
performance changes of merged banks witha group of matched pairs indicate that
mergers led to operating improvements. The results, however,may be due primarily to
economies of scale. The existing evidence in the literature suggests that scaleeconomies
do exist for institutions holding less than $100 million in assets.Spindt and
Tarhan'sresults are based on a sample that is dominated by mergers involving banks of
this size. Because theresults may be driven by economies of scale at small institutions, it
is unclear whether their findingsare relevant to large mergers--the transactions most
severely transforming the banking industry.
Chamberlain (1992) demonstrates the importance that sample selection can have in
influencingthe results of a merger study. Her sample consists of 180 bank subsidiaries
that were acquired bybank holding companies between 1981 and 1987. The unit of
analysis is the individual target bankthat experienced a change in ownership, but was not
consolidated into another bank. For eachmerger, matched pair analysis is conducted. Pre-
merger and post-merger performance of the acquiredbank are compared to those of a
non-acquired bank from the same area and of similar size andleverage. While
Chamberlain finds evidence of overall gains when Texas mergers are omitted fromthe
sample, the full sample yields no evidence of gains.
Turning to studies of stock market reactions to merger announcements, researchers also
generallyfail to find total gains from consolidation. Most abnormal return studies
typically analyze target andacquirer returns separately. However, in order to measure the
67
overall anticipated gains resulting froma merger, the value-weighted average of bidder
and target abnormal returns must be analyzed. Mostresearch on abnormal returns does
not do this.
Hannan and Wolken (1989) conduct a study of the value-weighted abnormal returns
experiencedin 43 deals announced between 1982 and 1987. The authors find that, on
average, total shareholdervalue was not significantly affected by the announcement of the
deal. The authors do, however, findthat one determinant, target capitalization, cross-
sectionally influenced expected synergistic gains.Target capital was negatively related to
the change in total value.
Houston and Ryngaert (1994) examine abnormal returns from four days before the target
wasinitially declared a takeover candidate (by any bank) to the announcement day. In
their sample of 153mergers announced between 1985 and 1991, acquirers suffered a loss
in value and targets enjoyeda gain. However, there was no significant aggregate effect on
the overall value of the twoorganizations. The amount of value that was created was
highest when acquirers were strongpre-merger performers and when substantial overlap
existed. This relationship of value creation withthe degree of overlap is consistent with
the market expecting mergers best suited for improvedefficiency and/or increased market
power to experience the greatest level of post-merger benefits.
Madura and Wiant (1994) study abnormal returns of acquirers over a lengthy period
followingthe merger announcement. They find that average cumulative abnormal returns
of acquirers in asample of 152 deals taking place between 1983 and 1987 were negative
during the 36-month periodfollowing the merger announcement. Moreover, abnormal
returns were negative in nearly everymonth. Acquirer losses around the time of the
announcement may reflect a loss of wealth from anoverly generous acquisition price.
Negative abnormal returns in months after the announcement,however, are not likely to
be due to the price. They seem more attributable to either the mergerachieving fewer
benefits than projected, or the market revising downward its expectations for themerger.
The only serious study of the European market on this issue is the recent work by Cybo-
Ottoneand Murgia (1996). In it they analyze 26 mergers of European financial services
firms (not justbanks) taking place between 1988 and 1995 in 13 European banking
markets. Their results arequalitatively similar to much of the analysis conducted on
American banking organizations. Averageabnormal returns of targets were significantly
68
negative and those of acquirers were essentially zero.This pattern suggests that there was
a transfer of wealth from acquirers to targets. Also comparableto mergers of American
banks, the change in overall value of European financial firms at the time ofthe
announcement was small and not significant. This pattern continued for at least a year. In
the year following the merger, (excluding the first 10 days after the announcement), the
combined valueof the acquirer and target did not change significantly.
The findings of Zhang (1995) on U.S. data contradict those of most abnormal return
studies.Among a sample of 107 mergers taking place between 1980 and 1990, the author
finds that mergersled to a significant increase in overall value. Although both merger
partners experienced an increasein share price around the merger announcement, target
shareholders benefitted much more on apercentage basis than the acquiring shareholders.
Cross-sectional results suggest that increases invalue were smallest when improved
efficiency and increased market power were expected to havetheir greatest potential
impact. Changes in value decreased as targets got larger relative to acquirersand as the
amount of geographic overlap between acquirers and targets increased. The latter
findingis consistent with diversification creating value.
Recently, several papers incorporate both approaches in the literature. The first of these
studiesis conducted by Cornett and Tehranian (1992) and examines 30 large holding
company merger soccurring between 1982 and 1987. The authors find that profitability,
as measured by cash flowreturns on the market value of assets, improved significantly
after the merger. This finding, however,must be viewed closely for several reasons. First,
the market value of assets may be an inappropriatemeasure for standardizing income. It is
defined primarily from the liability side of the balance sheetas the market value of
common stock pl us the book value of long-term debt and preferred stock lesscash. Given
the nature of banks as financial intermediaries, it is unclear why deposits are not
includedin this liability-based definition. The appropriateness of subtracting cash
holdings is also debatable.
Cornett and Tehranian find that net income to assets, a more traditional measure of bank
profitability,does not change by a significant amount.
In addition, the findings of Cornett and Tehranian may also be partially driven by
adjustingperformance by an improper benchmark. The authors use, as their peer group, a
sample of bank slocated throughout the country that were traded on either the NYSE or
69
AMEX and that did no tmerge during the sample period. This comparison set of banking
organizations may not be relevantto the sample institutions which had significantly
different regional characteristics. This problem isaccentuated by a set of sample
observations which has a number of questionable deals. As a result,Cornett and
Tehranian's findings of post-merger improvements relative to a benchmark may be dueto
the unique data used for the study.
Cornett and Tehranian also examine value-weighted abnormal returns around the time of
themerger announcement. They find that the market responded to announced deals by
raising thecombined value of the merger partners. The authors also find that changes in
several performancemeasures, including cash flow returns on the market value of assets,
were positively correlatedwith value-weighted abnormal returns. These relationships
suggest that the market may have beenable to accurately forecast the eventual benefits of
individual mergers. Net income to total assets isnot one of the variables that was
correlated to value-weighted abnormal returns, however.Pilloff (1996), like Cornett and
Tehranian, combines both approaches found in the literature toanalyze a sample of 48
mergers of publicly traded banking organizations that merged between 1982and 1991.
His study improves upon Cornett and Tehranian by addressing many of the problems
inthat paper. First, results are based on traditional measures of performance that are
appropriate fora study of banking organizations. Second, the performance of merging
banks is compared to a moreaccurate benchmark that controls for geographic location.
Third, and perhaps most importantly, themerger sample is larger with substantially fewer
observations that are poorly suited for analysis.Pilloff obtains results that are consistent
with the bulk of the merger literature. In general,mergers were not associated with any
significant change in performance, suggesting that managerswere unable to generate
benefits from deals on average. Moreover, the mean overall change inshareholder value
was also quite small.
Although there was no average change in either operating performance or shareholder
value, therewas a great deal of variation among banks. Some mergers proceeded
successfully and others resultedin failure. Likewise, the dispersion of changes in market
values indicates that investors expectedsome mergers to increase and others to decrease
firm value. A particularly important result of thispaper is that merger-related changes in
performance were found to be unrelated to changes in marketvalue at the time of merger

70
announcement. Investors recognized that although the mergers wouldnot create benefits
on average, some would result in better performance and some would lead toworse
performance. However, the market was unable to distinguish between the two types of
dealsat the time the mergers were initially announced.
In summary, most studies fail to find a positive relationship between merger activity and
gains ineither performance or stockholder wealth. This conclusion of no economic
benefits holds across awide variety of methodologies, samples, and levels of analysis,
(individual bank or bank holdingcompany). Moreover, there appears to be no relationship
between changes in value at announcementand subsequent outcomes. Although Cornett
and Tehranian find the existence a relationship, Pilloffprovides stronger evidence for
nonexistence.
2.4. Summary
From the preceding discourse on M&A, the simple major reason why firms opt for
growth and the expansion of their operations is because growth affects business and the
general public opinion as it stands for stability, safety and profitability.
Strategy is the engine that drives the expansion and consolidation of business. Businesses
can grow organically by internal investments or externally by acquiring other businesses.
The choice of merger and acquisition may raise the question of whether it results in
superior financial performance in the Nigerian banking sector. This depends on the
planned growth rate and on available internal and external resources to achieve that goal.
71
References
Adesida, S., (2008).‘Stanbic, IBTC Chartered set to unveil new logo’. Daily Sun Online, [internet]. 31 March. Available at: http://www.sunnewsonline.com/webpages/features/moneymarket/2008/mar/3/ monymarket-31-03-2008-003.htm [accessed 2 June 2013].
Adesida, S., (2008b).‘UBA has acquired 5 failed banks, 38,500 accounts and N7.9b private deposits ––NDIC MD’. Daily Sun Online, [internet]. 29 March. Available at: http://www.sunnewsonline.com/webpages/features/enterprise/2008/mar/29/ent erprise-29-03-2008-002.htm [accessed: 17 June 2013].
Agbaje, O., (2008). ‘The Banking industry in 2008’.Business Day Online. [internet]. 19 February. Availableat: http://www. Business day online. com/analysis/back page/4569.html[accessed 2 June 2013].
Agusto & Co., 1996. ‘Exchange Rate’. Banking Industry Survey .
Akhavein, J.D., Berger, A.N., and Humphrey, D.B., (1997). ‘The effects of mega- mergers on efficiency and prices: Evidence from a bank profit function’, Review of Industrial Organization, 12, pp. 95-139.
Alashi, S.O., (2002). ‘Banking supervision under West African Monetary Zone’.Central Bank of Nigeria.[Online]. Available at: http://www.cenbank.org/OUT/PUBLICATIONS/EFR/RD/2002/EFRVOL40-4-5.PDF [accessed 12 June 2013].
Amihud Y., & Baruch L., (1981).‘Risk reduction as a managerial motive for conglomerate mergers’, Bell Journal of Economics, 12, 605–617.
Angwin, D., (2001). ‘Mergers and acquisitions across European borders: National perspectives on pre-acquisition due diligence and use of professional advisers’, Journal of World Business, 36(1), pp. 32-57.
Atkearney., (2005). ‘Rising to the growth challenge’.A.T. Kearney Inc. [Online]. Available at: http://www.atkearney.com/shared_res/pdf/OGI_2005_S.pdf [accessed 18 June 2013]
Avkiran, N., (1999). ‘The evidence on efficiency gains: the role of mergers and the benefits to the public’, Journal of Banking and Finance, 23, pp. 991–1013.
Barney, J., (1998). ‘Returns to bidding firms in mergers and acquisitions: Reconsidering the relatedness hypothesis’, Strategic Management Journal, 9 (Special Issue), pp. 71-78.
Barney, J., (1991). ‘Firm resources and sustained competitive advantage’ , Journal of Management, 17(1), pp. 99-120.
Berger, A. N., (1998). ‘The efficiency effects of bank mergers and acquisitions: A preliminary look at the 1990s data’, in Y. Amihud, and G. miller (ed.), Bank Mergers and Acquisitions, Boston, Kluwer Academic Publishers, pp. 79-111.
72
Berger, A.N., and Humphrey, D.B., (1992). ‘Megamergers in banking and the use of cost efficiency as an antitrust defense’, The Antitrust Bulletin, 33, pp. 541-600
Bichi, K., (1996). ‘The genesis of banks distress’, Credit News Magazine, 7(1&2), February March, pp. 28 – 29.
Birkinshaw, J., Bresman, H., and Hakanson, L., (2000). ‘Managing the post-acquisitionintegration process: How the human integration and task integration process interact to foster value creation’, Journal of Management Studies , 37(3), pp. 395-425.
Bliss, R.T., and Rosen, R.J., (2001). ‘CEO compensation and bank mergers’, Journal of Financial Economics, 61, pp. 107-138.
Buono, A. F., (2003). ‘SEAM-less post-merger integration strategies: A cause for Concern’, Journal of Organizational Change Management , 16(1), pp. 90-98.
Business Wire, (2008).Organic Growth in Domestic Markets Key to Bank Profitability . [Online]. Availableat: http://findarticles.com/p/articles/mi_m0EIN/is_2008_March_12/ai_n24387311 [accessed: 18 June, 2013].
Cartwright, S., and Cooper, C., (1992).Managing Mergers and Strategic Alliances: Integrating People and Cultures ., Oxford, Elsevier.
Cashcraft, (2008).‘Security Analysis – Historical’.Cashcraft Asset Management Limited [Online]. Available at: http://www.cashcraft.com/Secanalysis.asp [accessed 18 July 2013].
Casu, B., Girardone, C., and Molyneux, P., (2006). Introduction to Banking, Essex:Pearson Education Limited.
CBN, (2008). ‘Indigenous Banking in Nigeria’, Central Bank of Nigeria. [Online] . Available at: http://www.cenbank.org/documents/gpagedocs.asp [accessed 22 May 2013].
CIBN, (2008).‘Bank Consolidation – History Summary’.The Chartered Institute of Bankers of Nigeria.[Online]. Available at: http://www.cibng.org/News/New%20Folder/Bank%20Consolidation.htm [accessed 25 May 2008].
Coffee, J.C., (1988).‘Shareholders versus Managers: The strain in the corporate web’, in J.C. Coffe, L. Lowestein & S. Rose-Ackerman (ed.), Knights, Raiders and Targets: The Impact of the Hostile takeover , Oxford, Oxford University Press, 1988, pp. 77-134.
Cossey, B., (1991). ‘Systems assessment in acquired subsidiaries’, Accountancy, 107(1169), pp. 98-99.
Coyle, B., (2000). Mergers &Acquisitions , UK, CIB Publishing.
73
Cuesta, R.A. & Orea, L., (2002).‘Mergers and technical efficiency in Spanish savings banks: A stochastic distance function approach’, Journal of Banking and Finance, 26, pp. 2231 2247.
Danjuma, N., (1993). The Bankers’ Liability , Ibadan, African University Press.
Datta, D.K., (1991). ‘Organisational fit and acquisition performance: Effects of post-acquisition integration’, Strategic Management Journal, 12, pp. 281-297.
Datta, D.K., Pinches, G.E., and Narayanan, V.K., (1992). ‘Factors influencing wealth creation from Mergers and Acquisitions: A meta-analysis’, Strategic Management Journal, 13, pp. 67-84.
Daruvala, T., and Yulinsky, C., (2001).‘The journey to organic retail banking growth’. McKinsey & Company. [Online] . Available at: http://fs.mckinsey.com/Display.aspx?id=91e2c951-a9fb-a348-f785e6f7314c [accessed 18 June 2013].
Denis, D.K., and McConnell, J.J., (2003). ‘International Corporate Governance’, in K. Keasey, S. Thompson, & M. Wright (ed.), Corporate Governance: Accountability, Enterprise and International comparisons , Chichester-West Sussex, John Wiley & Sons Ltd, 2005, pp. 251-283.
Denrell, J., Fang, C., and Winter, S.G. (2003). ‘The economics of strategic opportunity, Strategic Management Journal , 24(10), pp. 977-990.
Dierickx, I., and Cool, K., (1989). ‘Asset stock accumulation and sustainability of competitive advantage’, Management Science , 35(12), pp. 1504 – 1511.
Ebhodaghe, J., (1995). ‘Causes and environment effects of bank failure in Nigeria’, NDIC Quarterly , Vol. 6, September.
Emefiele, G.I., (2008). Why Zenith Bank opted for organic growth instead of merger and acquisition.[Personal conversation]. (27 March 2013).
Emmanuel, U.G., (2008). Why Zenith Bank opted for organic growth instead of merger and acquisition. [Personal conversation]. (27 March 2013).
Ensico, I. M. T., and Garcia J. B., (1996).‘Mergers and acquisitions trends in Europe’, International Advances in Economic Research, 2(3), pp. 279-286.
Euromoney, (2006). ‘Nigeria benefits from banking mergers and recapitalizations’. Euro money , 37 (444), pp. 1-9.
Fitzroy, F.R., Zoltan, J.A., and Gerlowski, D.A., (1998). Management and Economics of Organisation, Essex, Pearson Education Limited.
Fisher, J.K., (200?). ‘Mergers and Acquisitions: Strategic perspectives’. Dartmouth Research and Consulting. [online]. Available at: http://www.dartmouth research.com/merg_acq_PR.html[accessed 11 June 2013].
74
Flanagan, D. J., & O’Shaughnessy, K. C., (2003). ‘Core-related acquisitions, multiple bidders and tender offer premiums’, Journal of Business Research , 56, pp. 573-585.
Flyvbjerg, B., (2004). ‘Five misunderstandings about case-study research’, in C. Seale,
Focarelli, D., Panetta, F., and Salleo, C., (2002).‘Why do banks merge?’ Journal of Money, Credit and Banking, 34, pp. 1047-1066.
Ford, J., & Harding, N., (2003). ‘Invoking Satan or the Ethics of the employment contract’, Journal of Management Studies , 40(5), pp. 1131-1149.
Gadiesh, O., Ormiston, C., and Rovit, S., (2003). ‘Achieving an M&AS’s strategic goals at maximum speed for maximum value’, Strategy and Leadership , 31 (3), pp. 35-41.
Gaughan, P.A., (2007). Mergers, Acquisitions, and Corporate Restructurings . 4th ed. New Jersey: John Wiley & Sons, Inc.
Gaughan, P., (1999). Mergers, Acquisitions, and Corporate Restructurings, 2nd ed. New Jersey, John Wiley & Sons Inc.
Ghosh, A., (2001). ‘Does operating performance really improve following corporate acquisitions?’ Journal of Corporate Finance, 7, pp. 151-178.
Goold, M., and Luchs K., (1993).‘Why diversify? Four decades of management thinking’ , Academy of Management Executive , 7(3), pp. 7 - 25
G. Gobo, J.F. Gubrium, and D. Silverman (ed.), Qualitative Research Practice, London, Sage, pp. 390 – 404.
Hadlock, C., Houston, J.F., and Ryngaert, M., (1999).‘The role of managerial incentives in bank acquisitions’, Journal of Banking and Finance, 23, pp. 221-249.
Harding, D., and Rovit, S., (2004).‘Building deals on bedrock’, Harvard Business Review,82(9), pp. 121-128.
Healy, P.M., Palepu, K.G., and Ruback, R.S., (1992).‘Does corporate performance improveafter mergers?’ Journal of Financial Economics, 31, pp. 135-175.
Henderson, J.C. and Venkatraman, N., (1993). ‘Strategic alignment: Leveraging information technology for transforming organisations’, IBM Systems Journal, 32(1), pp. 4 – 16.
HighBeam, (2008). ‘Banks more likely to achieve organic growth with a formal plan, study says’. HighBeam Research. [Online]. Available at: http://www.highbeam.com/doc/1G1 178187798.html [accessed 18 June 2013].
Hirtle, B., (1991). ‘Factors affecting the competitiveness of internationally active financial institutions’, Federal Reserve Bank of New York Quarterly Review, Spring, pp. 38-51.
75
Houston, J.F., James, C.M., & Ryngaert, M., (2001).‘Where do merger gains come from? Bank mergers from the perspective of insiders and outsiders’, Journal of Financial Economics, 60, pp. 285-331.
Ibru, C., (2006) ‘Overview of Financial environment in Nigeria’.Working paper, Lagos, Nigerian Army College of Logistics.
IBTC, (2007). Corporate Finance’. IBTC [Online]. Available at: http://www.ibtc.com/corporate%20finance.asp [accessed 4 July 2013]. Imala, O.I., (2004). ‘The experience of banking supervision in financial sector Surveillance’, Central Bank of Nigeria Bullion, January – March, 28(1), pp.49-53. Lagos: Central Bank of Nigeria.
Jemision, D., & Sitkin, S., (1986). ‘Corporate acquisitions: A process perspective’, Academy of Management Review , 11(1), pp. 145-163.
Jensen M. C., (1986).‘Agency costs of free cash flow, coporate finance, and takeovers’, American Economic Review , 76(2), May: 323-329.
Kaplan, N., (2002). ‘Assimilate, Integrate, or Leave Alone (after acquisition of a company)’, Journal of Business Strategy , 22(1), pp. 23-25.
Kawalek, P. and Wastell, D., (2005). ‘Pursuing Radical transformation in Information Age Government: Case Studies Using the SPRINT Methodology’, Journal of Global Information Management, 13(1), pp. 79 – 101.
Keasey, S. Thompson, and M. Wright (ed.), Corporate Governance Accountability,
Enterprise and International comparisons, Chichester-West Sussex, John
Wiley & Sons Ltd, 2005, pp. 251-283.
Kilner, R., (2008).‘UBA acquires Liberty Bank’. Banking Times Online [internet] 9 June. Available at: http://www.bankingtimes.co.uk/09062008-uba-acquires-liberty-bank/ [accessed 17 June, 2013].
Koetter, M., Bos, J.W.B., Heid, F., Kool, C.J., Kolari, J.W., and Porath, D., (2007).‘Accounting for distress in bank mergers’, Journal of Banking and Finance, 10, pp. 3200– 3217.
Krug, J.A., and Hegarty, W.H., (2001). ‘Predicting who stays and leaves after an acquisition: A study of top managers in multinational firms’, Strategic Management Journal, 22, pp. 185-196.
Lang, G., and Welzel, P., (1999). ‘Mergers among German cooperative banks: A panel-based stochastic frontier analysis’, Small Business Economics, 13(4), pp. 273-286.
Larsson, R., & Finkelstein, S., (1999). ‘Integrating strategic, organisational, and human resource perspectives: A case survey of synergy realization’, Organisation Science , 10(1), pp. 1-27.
76
Lipton, M., 2006.Merger waves in the 19th , 20th and 21st centuries. [online]. Available at: http://osgoode.yorku.ca/media2.nsf/58912001c091cdc8852569300055bbf9/1e 37719232517fd0852571ef00701385/$FILE/Merger%20Waves_Toronto_Lipton.pdf [accessed 13 June 2013].
Lubatkin, M.H., Schweiger, D.M., and Weber, Y., (1999). ‘Top management turnover in related M&A’s: An additional test of the theory of relative standing’, Journal of Management, 25(1), pp. 55-73.
Luftman, J., and Brier, T., (1999).‘Achieving and sustaining business-IT alignment’,California Management Review, 42(1), pp. 109 – 122.
Mantravadi, P. and Reddy, A.V. 2008, “Post mergers performance of acquiring firms
from different industries in India”, International Research Journal of Finance
and Economics, Vol. 22, pp. 192-201.
Marks, L. M., and Mirvis, P. H., (2001).‘Making mergers and acquisitions work: Strategic and psychological preparation’, Academy of Management Executive , 15(2), pp. 80-93.
Milligan, J., (2006). ‘Growing the bank’, Bank Director Magazine Archives Online [internet]. Available at: tp://www.bankdirector.com/issues/articles.pl?article_id=11782 [accessed 18 June 2013].
Millward, L., and Kyriakidou, O., (2004). ‘Linking pre and post merger identities through the concept of career’, Career Development International , 9(1), pp. 12-27.
Mishkin, F.S., (2006). The Economics of money, banking, and financial markets.8th ed., London, Addison-Wesley.
Mitchell, M., and Mulherin, J.H., (1996).‘The impact of industry shocks on takeovers and restructuring activity’, Journal of Financial Economics , 41, pp. 193-229.
Mordi, C.N.O., (2004). ‘Institutional framework for the regulation and supervision of the financial sector’, Central Bank of Nigeria Bullion, 28(1), pp. 25 – 30.
Murphree, D., and Hollander, A., (2003). ‘How to avoid a flawed mergers and acquisitions process’.[Online].The Journal of New England Technology, 21(35). Available at: http://www.equationpartners.com/News/MHT01Sep03.pdf [accessed 16 June 2013].
NPC, (2004).‘Meeting everyone’s Needs: National Economic Empowerment and Development Strategy’, Nigerian National Planning Commission .[Online]. Available at: http://siteresources.worldbank.org/INTPRS1/Resources/Nigeria_PRSP(Dec2005).pdf [accessed May 24 2013].
Nwankwo, G., (1980) The Nigerian Financial System, London, Macmillan Publishing. O’Regan, P., (2001). Financial Information Analysis , Indianapolis, John Wiley & Sons.

77
Ogbonna, A., (2007) ‘Can the real sector count on Nigerian banks?’The Sun News Online. [internet]. 18October. Availableat:http: //www. sunnewsonline. com/webpages/features/money/2007/oct/18/Money-18-10-07 002.htm [accessed May 27 2013].
Ogwu, D., (2004). ‘Legal framework for mergers and acquisitions’.Securities and Exchange Commission. [Online]. Available at: http://www.cenbank.org/OUT/PUBLICATIONS/BSD/2005/LEGAL%20FRAME%20 ORK%20FOR%20MERGERS%20AND%20ACQUISITIONS.PDF [accessed 17 June 2013].
Okoduwa, A., (1995) ‘Fighting distress in the banking sector’, Business Times (Nigeria), December 18, pp. 5.
Okonkwo, C.O., (2004). ‘Legal framework for mergers and acquisitions’.Central Bank of Nigeria. [Online]. Available at: http://www.cenbank.org/OUT/PUBLICATIONS/BSD/2005/LEGAL%20FRAMEWO %20FOR%20MERGERS%20%20ACQUISITIONS.PDF [accessed 3 June 2013].
Okwe, M.,( 2006). ‘Ecobank takes over All States Trust liabilities’. The Guardian Online. [internet] 5 May. Available at: http://www.guardiannewsngr.com/news/article15/050506 [accessed 17 June 2013].
Olajide, B., (2008). ‘Banks consolidation on the last lap, acquisition continue’, The Guardian Online [internet]. 28 January. Available at:http://www.guardiannewsngr.com/market_report/article02//indexn3_html?pdate=28010 &ptitle=Union%20Registrars%20opens%2011%20new%20branches&cpdate=280108 [accessed 17 June 2013].
Onyido, B.C., (2004). ‘The role of the Central Bank of Nigeria in the Nigerian Financial System’, Central Bank of Nigeria Bullion, 28(1), pp. 13-19.
Orlikowski, W., (1992).‘The Duality of Technology: Rethinking the concept of Technology in Organisations’, Organisation Science, 3, pp. 398 – 427.
Perry, J.S., and Herd, T.J., (2004). ‘Mergers and acquisitions: Reducing M&A risk through due diligence’, Strategy and Leadership, 32(2), pp. 12-19.
Ramawamy, K. P., and Waegelein, J. F., (2003).‘Firm financial performance following the merger’, Review of Quantitative Finance and Accounting , 20, pp. 115-126.
Rao, V. R., Mahajan, V., and Varaiya, N. P., (1991).‘A balance models for evaluating firms for acquisition’, Management Science , 37(3), pp. 330-349.
Rees, B., (1995). Financial Analysis.2nd ed., London, Prentice Hall.
Resti, A., (1998). ‘Regulation can foster mergers, can mergers foster efficiency? The Italian case’, Journal of Economics and Business 50 , pp. 157–169.
Robbins, S.S., and Stylianou, A.C., (1999). ‘Post-merger systems integration: The impact on IS capabilities’, Information & Management, 36, pp. 205-212.
78
Saboo, S. and Gopi, S. 2009.“Comparison of post-merger performance of acquiring
firms (India) involved in domestic and cross-border acquisitions”, MPRA Paper
No. 19274.
Samaras, V., (2007), ‘Internal versus external growth: impact on operational and market Performance’. [Online]. Available at: http://www.dauphine.fr/cereg/Userfiles/File/Paper_Samaras.pdf [accessed 19 June 2013]
Schneider, W., (2003).‘Trouble at the Top: A Sign of Deal Disorder, Mergers and Acquisitions: The Dealmaker’s Journal , 38 (4), pp. 30-33.
Schuler, A.J., (2003). ‘Post acquisition integration’. [Online]. Available at: http://www.schulersolutions.com/html/post_acquisition_integration.html [accessed 16 June, 2013].
Sharma, G., 200?.‘Mergers and Acquisitions’.Rediff homepages [Online]. Available at: http://members.rediff.com/future/m&a.htm [accessed 11 June 2013].
Shleifer, A., and Vishny, R.W., (1991). ‘Takeovers in the ‘60s and the ‘80s: Evidence and implications’, Strategic Management Journal, 12, pp. 51-59.
Shleifer A., and Vishny R.W., (1989). ‘Management Entrenchment: The case of Manager Specific Investments’, Journal of Financial Economics , 25: 123-139.
Sidel, R., (2003). ‘After a dry spell, a merger flood’, The Wall Street Journal , 28 Oct. p. C1, C3.
Sinickas, A., 2004). ‘How to do due diligence research’, Strategic ommunication Management, 8(4), p. 12.
Soludo, C., (2008). ‘The unfinished revolution in the banking system’.[Online].Presentation at the University of Agriculture, Abeokuta on March 18, 2008 by the CBN Governor. Available at: http://www.cenbank.org/OUT/SPEECHES/2008/Govadd26-3-08.pdf [Accessed 2 June 2013].
Soludo, C., (2006). ‘Financial Sector reforms and the real economy’.Speech to the Council of Fellows of the Pharmaceutical Society of Nigeria. Soludo, C., (2006b). ‘Beyond banking sector consolidation in Nigeria.’[Online]. Presentation at the Global Banking Conference on Nigerian Banking Reform . Available at: http://www.cenbank.org/out/Speeches/2006/Govadd29-3-06.pdf [accessed 17 June 2013].

79
Steinberg, C., Swaray, S., and Moyo, J., (2008), ‘Nigeria: Selected issues’, IMF Country Report No. 09/65 , Washington, D.C., International Monetary Fund.
Stewart, D., (2006). ‘MKS shows virtues of organic growth’. Financial Post Online. [Internet] 23 June. Available at: http://www.financialpost.com/scripts/story.html?id=41f27462-6fea-467b-9f1a b35031a33515&k=40744 [accessed 4 August 2013].
Sudarsanam, S., (2003).Creating value from Mergers and acquisitions: The challenges , Harlow, Pearson Education Limited.
Tetenbaum, T., (1999).‘Beating the odds of mergers and acquisition failure: Seven key practices that improve the chance for expected integration and synergies’, Organisational Dynamics, 28(2), pp. 22-36.
Thompson, S., and Wright, M., (2005).‘Edith Penrose’s contribution to Economics and Strategy: An overview’. Managerial and Decision Economics, 26, 57-66.
Trautwein, F., (1990).Merger Motives and Merger Prescriptions’, Strategic Management Journal, 11(4), 283 – 295.
Umaru, A., (1993). ‘New banks are boutique banks’, The Nigerian Economist, May 17, p. 5. Lagos, Sahel Publishing and Printing Co.
Umoh, P.N., (2004). ‘The role of deposit insurance in financial sector stability’, Central Bank of Nigeria Bullion, 28(1), pp 60-63.
Vennet, R.V., (1996). ‘The effect of mergers and acquisitions on the efficiency and profitability of EC credit institutions’, Journal of Banking and Finance, 20 (9), pp. 1531–1558.
Weber, R.A., and Camerer, C.F., (2003). ‘Cultural conflict and merger failure: An experimental approach’, Management Science, 49(4), pp. 400-415.
Weber, Y., Shenkar, O., and Raveh, A., (1996). ‘National and Corporate Fit inMergers/Acquisitions: An Exploratory Study’, Management Science , 42(8), pp.1215 1227.
Wastell, D., (1999). ‘Learning dysfunctions and information systems development: Overcoming the social defenses with transitional objects’, MIS Quarterly, 23, pp. 581 – 600.
Wheelock, D. C., and Wilson, P.W., (2000). ‘Why do banks disappear? The determinants of U.S. bank failures and acquisitions’, The Review of Economics and Statistics, 82, pp. 127–38.
Worthington, A.C., (2004). ‘Determinants of merger and acquisition activity in Australian cooperative deposit-taking institutions’, Journal of Business Research, 57, pp. 47–57.

80
Zikmund, W.G., (2003). Business Research Methods.7th ed., South-Western Australia, Thomson.

81
CHAPTER THREE
RESEARCH METHODOLOGY
3.1. Research Design
Research Design is a kind of blue print that guides the researcher in his or her
investigation and analysis (Onwumere 2005). The research design adopted for this
research is the ex post facto since it relies on historical data. Ex post facto design is a non
experimental research technique in which pre-existing groups are compared on some
dependent variables; it is a type of study that can masquerade as a genuine experiment.
This study is designed to use econometrics models in the analysis and is also designed to
be both a time serial and cross-sectional study. In view of this and in line with previous
studies, this study adopts panel data analysis. Panel data analysis is the most efficient tool
to use when the sample is a mixture of time series and cross-sectional data and the
structure takes into account the unobservable and constant heterogeneity (Andres and
Vallelado, 2008). Hsiao (2003), Klevmarken (1989) and Moulton (1986 and 1987)
highlight some merits in the use of panel data as follows: The use of panel data controls
for individual heterogeneity. The underlying principle of panel data is the assumption that
firms, states or countries are heterogeneous. In time series and cross section analysis, this
heterogeneity is not taken care of and this poses a threat because of the risk of obtaining
biased results; unlike time series studies which is plagued with multi-collinearity issues,
panel data gives more informative data, more variability, less collinearity among the
variables, more degrees of freedom and more efficiency; Panel data has the ability to
study the dynamics of adjustment because cross-sectional distribution that looks
relatively stable conceals a lot of changes. It is again able to measure effects that are
difficult to detect in pure cross-sectional or time-series data.
3.2. Nature and Sources of Data
The data for this research is from secondary sources, in line with the works of Andres and
Vallelado, (2008).The data were handpicked from the annual reports and statements of
accounts of banks quoted on the Nigerian Stock Exchange and Fact books of the Nigerian
Stock Exchange since they are believed to constitute the most authoritative and accessible
documents for our research.These sources are ideal in answering our research questions

82
and to empirically test our research hypothesis. Such annual reports and financial
statement of accounts of the various banks are sourced from the banks’ corporate
headquarters, the Central Bank of Nigeria (CBN), the Nigerian Stock Exchange (NSE),
the Securities and Exchange Commission (SEC) and other relevant bodies.The data
needed based on the nature of this research is from 1998 to 2012.
Relevant data for this study is extracted from the annual reports and statements of
accounts of banks quoted on the Nigerian Stock Exchange and Fact books of the Nigerian
Stock Exchange since they are believed to constitute the most authoritative and accessible
documents for our research. Companies in Nigeria are required by law to keep proper
books of account and the production of an account that gives a true and fair view of the
affairs of the company. The Companies and Allied Matters Act of 1990 requires
companies to make provisions, in forms, contents and with regards to keeping accounting
records which includes: the balance sheet; the profit and loss account; and also the
documents to be attached, e.g. the name of the directors, Directors’ Report and the
Auditors’ Report, and the publication of accounts (Ujunwa, 2010). This provision is
aimed at improving the reliability of the accounting records.
3.3 Population and Sample Size
A population comprises of all elements, subjects and perhaps observations in relation to a
particular phenomenon, while a sample is a group of variables or items derived from a
relevant population for the purpose of examination or analysis (Onwumere, 2005). In
consonance with the above definition, the population for this study comprise of all the 21
commercial banks in Nigeria, while the sample for this study consist of 10 commercial
banks in Nigeria that are quoted on the Nigerian stock exchange covering a 15-year
period, 1998 – 2012. The choice for the sample size is influenced by data availability.
3.4 Model Specification
Analytically, the generalized regression model is adopted from the works ofEfe Jimmy
(2008) and Yener Altunbas & David Marques (2004). The model for this study is as
follows;
Hypothesis One;

83
Hypothesis one states that mergers and acquisitions does not have any significant positive
effect on the liquidity profile of the affected banks, the relevant model is represented as:
LR = f (she) …………………………………………………….(i)
Model (i) can be further specified as;
LRjt= β0 + β1SHEjt + �jt ……………………………………..(ii)
Where;
LRjt= Liquidity ratio for firm j at time t
SHE = Shareholders equity for firm j at time t
�jt =error component that varies over both individual firms and time.
β0, β1=parameters to be estimated,
j = 1,2,…..10 and t =1998-2012.
Hypothesis Two;
Hypothesis two states that mergers and acquisitions does not have any significant positive
effect on the return on equity of the effected banks, the relevant model is represented as:
ROE = f (she)………………………………………………… (iii)
Model (iii) can be further specified as;
ROEjt= β0 + β1SHEjt + �jt ……………………………………(iv)
Where;
ROEjt= Return on Equity for firm j at time t
SHE = Shareholders equity for firm j at time t
�jt =error component that varies over both individual firmsand time.
β0, β1 = parameters to be estimated,
j = 1,2,…..10 and t =1998-2012.
Hypothesis Three;
Hypothesis three states that mergers and acquisitionsdoes not have any significant
positive effect on the debt-equity ratio of the affected banks, the relevant model is
represented as:
DER = f (she) ……………………………………………………(v)
Model (v) can be further specified as;
DERjt= β0 + β1SHEjt + �jt ………………………………………(vi)
84
Where ;
DERjt=Debt/Equity Ratiofor firm j at time t
SHE = Shareholders equity for firm j at time t
�jt =error component that varies over both individual firmsand time.
β0, β1 = parameters to be estimated,
j = 1,2,…..10 and t =1998-2012.
Hypothesis Four;
Hypothesis four states that mergers and acquisition does not have any significant positive
effect on the earning per share of the affected banks, the relevant model is represented as:
EPS = f (she) ……………………………………………………… (vii)
Model (vii) can be further specified as;
EPSjt= β0 + β1SHEjt + �jt ……………………………………….(viii)
Where;
EPSjt= Earnings per share for firm j at time t
SHE = Shareholders equity for firm j at time t
�jt =error component that varies over both individual firms and time.
β0, β1 = parameters to be estimated,
j = 1,2,…..10 and t =1998-2012.
3.5 Description of Research Variables
This research involves an empirical analysis of the dependent and independent variables.
Further insight on the relevance of each of the variables is presented in the following sub-
sessions.
3.5.1 Independent Variables
The independent variable in this study is mergers and acquisitions which are represented
by shareholders equity.
3.5.1.1 Shareholders Equity
Shareholders’ equity represents the amount by which a company is financed through
common and preferred shares. Shareholders’ equity is often referred to as the book value
of the company, and it comes from two main sources. The first and original source is the
85
money that was originally invested in the company. Along with any additional
investments made thereafter. The second comes from retained earnings which the
company is able to accumulate over time through its operations.
The shareholders’ equity is chosen as the appropriate representation for mergers and
acquisitions because it gives an estimate of the accumulation of investment returns in the
bank.
Shareholders’ Equity = Total Assets – Total Liabilities
3.5.2 Dependent variables
Liquidity ratio, return on equity, debt/equity ratio and earnings per share has been chosen
as the appropriate measure of the performance of Nigerian banks because it gives an
estimate of the movements of finance in the bank.
3.5.2.1 Liquidity Ratio
The Liquidity Ratios has been chosen as the appropriate measure of mergers and
acquisitions because it attempts to measure a company’s capability to meet its short-term
debt obligations. This is done by comparing most liquid assets to short-term liabilities.
This study used current ratio with the formula:
Current ratio = Current Assets/Current liabilities
3.5.2.2 Return on Equity
Return on equity (ROE) ratio indicates how profitable a company is by comparing its net
income to its average shareholders' equity (Mishkin, 2006: 232). The ratio measures how
much the shareholders earned for their investment in the company. The higher the ratio
percentage, the more efficient management is in utilizing its equity base and the better
return is to shareholders.
ROE = Net profit after taxes/Average shareholders’ equity
3.5.2.3 Debt/Equity Ratio
This is a financial ratio indicting the relative proportion of shareholders equity
and debt used to finance a company’s assets.
DER = Total Debt/ Shareholders funds (equity)

86
3.5.2.4 Earning Per Share
This is part of a company's profit apportioned to each outstanding ordinary share. EPS is
used by investors as a profitability variable in determining share price.
EPS = (Net Income – Dividends on preferred stocks)/Average outstanding ordinary
shares
3.6 Techniques of Data Analysis
The estimation technique of panel data for this study is as follows;
Stationarity Test
Stationary is defined as a quality of a process in which the statistical parameters (mean and standard deviation) of the process do not change with time. The most important property of a stationary process is that the auto-correlation function (acf) depends on lag alone and does not change with the time at which the function was calculated. Stationary is used as a tool in time series analysis, where the raw data is often transformed to become stationary. The stationarity or otherwise of a series can strongly influence its behavior and properties, it can lead to spurious regressions. if the variables in the regression model are not stationary, then it can be proved that the standard assumption for asymptotic analysis will not be valid. In other words, the usual‘t-ratio’ will not follow a t-distribution, so we cannot validly undertake hypothesis tests about the regression parameters.
Unit Root Test
In statistic, a unit root test tests whether a time series variable is non stationary using
autoregressive model. A well known test that is valid in large samples is the Augmented
Dickey-Fuller test. The importance of testing for the existence of unit roots is now
generally accepted following the study of Granger and Newbold (1974) that regression
analysis between two non stationary series could lead to a spurious result. This means
that one could observe a good fit from regression results whereas the series are almost
independent. Therefore it is necessary to test for the stationarity or the presence of a unit
root before any regression analysis is conducted. It has been observed that many time
series variables are stationary after first or second differencing. The idea of differencing
may sometime imply eliminating seasonal influences on the variable but it eliminates
very valuable information in the long-run which may be peculiar to the characteristics of
the variable. Therefore the need to integrate short-run dynamics with long-run
87
equilibrium gave rise to the Co-integration technique by Granger (1981), Engle and
Granger (1987) and Mills (1990).
Granger Causality Test
Granger causality test is a statistical hypothesis test for determining whether one time
series is useful in forecasting another. Granger causality is a statistical concept of
causality that is based on prediction. According to granger causality, if a signal x1
‘granger-causes’ a signal x2, then past values of x1 should contain information that helps
predict x2 above and beyond the information contained in past values of x2 alone. Its
mathematical formulation is based on linear regression modeling of stochastic processes
(Granger 1969). Before conducting this granger causality test we have to first make sure
that our variables are stationary.
88
References
Beatty, R., A. Santomero, and M. Smirlock, Bank Merger Premiums: Analysis and Evidence, Monographs in Finance and Economics , Salomon Brothers Center, New York University, 1988.
Chuke Nwude (2004). ‘Basic Principles of Financial Management’ A First Course, Second Edition .University of Nigeria, Enugu. pp 269-343
Flanagan, D. J., and O’Shaughnessy, K. C., (2003).‘Core-related acquisitions, multiple bidders and tender offer premiums’, Journal of Business Research, 56, pp. 573-585.
Gujarati D.N. and Porter D.C. (2009).Basic Econometrics, 5thed: McGraw-Hill companies inc.New York.
Gill James O, (1992), ‘How to understand financial statement’ London Kogan
Mishkin, F.S., (2006). The Economics of money, banking, and financial markets.8th ed., London, Addison-Wesley.
Rao, V. R., Mahajan, V., and Varaiya, N. P., (1991).‘A balance models for evaluating firms for acquisition’, Management Science, 37(3), pp. 330-349.
Rees, B., (1995). Financial Analysis.2nd ed., London, Prentice Hall.
89
CHAPTER FOUR
PRESENTATION AND ANALYSIS OF DATA
4.1 Introduction
This chapter presents and tests the hypotheses stated in chapter one, using the techniques
of analysis describe in chapter three, which is ordinary least square regression analysis.
4.1. Presentation of Data
Table 4.1 shows the value of the model proxies which will be used to calculate the ratios that we shall use in our analysis. From the table, we can see the values of current asset, total debt, net profit after tax, earning per share and shareholders’ equity which is used as the proxy for mergers and acquisitions in this work. These values are handpicked from the annual report of the sampled bank year by year for the period of 15years from 1998 to 2012.
4.2 Computation of the Ratio Values
Table 4.2 shows the values of the model proxies calculated using the formula; Liquidity
Ratio = Current Asset/Current Liability
Return on Equity = Net Profit after Tax/Average Shareholders’ Equity
Debt Equity Ratio = Total Debt/Shareholders Equity
Earnings Per Share = (Net Income – Dividends on preferred stocks)/Average outstanding
ordinary shares
These values are obtained using the formula stated above on the values of model proxies
shown on table 4.1.
The values in table 4.2 are to be used in conducting our stationarity test ratio.
(see appendix for all tables and figures)
4.3 Stationarity Test
For any econometric analysis the most important aspect we need to check is whether the
data is stationary or not. If the data is not stationary then the results we will get will be
absurd. We do this stationarity test by importing our data into e-views and check for unit
root test using the Augmented Dickey-Fuller test level. The result of the stationarity test
are presented in figures 1-5.

90
In figures 1 - 5, the graphical test of stationarity for panel data series (shareholders
equity, liquidity ratio, return on investment, debt equity ratio and earnings per share)
shows that the series is non-stationary since it is increased upward or decreased
downward as time changes. The time series data is characterized by seasonality and trend
as well as exhibits a type of non-stationarity called random walk with drift. The
stationarity or otherwise of a series can strongly influence its behavior and properties,
hence yielding Spurious regressions. Since these variables are trending over time, a
regression of one on the other could have a high R2 even if the two are totally unrelated.
To avoid this, the series must be transformed into a stationary data so we can validly
undertake hypothesis tests about the regression parameters.
Table 4.3: Augmented Dickey-Fuller Unit Root Test (after detrending and
differencing)
Share holders
equity
ADF Test Statistic -13.35905 1% Critical Value* -4.0288
5% Critical Value -3.4437
10% Critical Value -3.1464
Durbin Watson 1.701308
Liquidity ratio
ADF Test Statistic -13.09176 1% Critical Value* -5.1288
5% Critical Value -4.2437
10% Critical Value -3.1444
Durbin Watson 1.983132
Return on equity
ADF Test Statistic -10.03807 1% Critical Value* -3.0118
5% Critical Value -3.4674
10% Critical Value -3.3164
Durbin Watson 1.633950
Debt-equity ratio

91
ADF Test Statistic -5.167382 1% Critical Value* -4.4415
5% Critical Value -3.6330
10% Critical Value -3.2535
Durbin Watson 1.826268
Earnings per share
ADF Test Statistic -31.28125 1% Critical Value* -4.0320
5% Critical Value -3.4452
10% Critical Value -3.1473
Durbin Watson 1.956941
Table 4.3 shows results of tests for stationarity and autocorrelation after transformation of
the panel time series data. After 1st differencing and detrendingof the time series data, the
series became stationary. The results in table 1 shows that the computed ADF test-
statistics for all the variables are smaller than the critical values at 1%, 5% and 10%
significant levels and the Durbin-Watson statistics are very close to 2 which means no
autocorrelation problems in the time series data; thus we can now reject the Ho that the
time series data is non stationary.
Table 4.4 Shows new data set after Differencing and Detrending, which we shall use for testing of our hypothesis.
4.4 Test of Hypothesis
4.4.1 Test of Hypothesis One
We re-state hypothesis one as follows:
Ho: Mergers and acquisitions does not have any significant positive effect on the
liquidity profile of the affected banks.
Ha: Mergers and acquisitions have significant positive effect on the liquidity profile of
the affected banks
Decision rules
Decision Rule 1: Accept null hypothesis if P-value is greater than 0.05 and reject
null hypothesis is P-value is less than 0.05
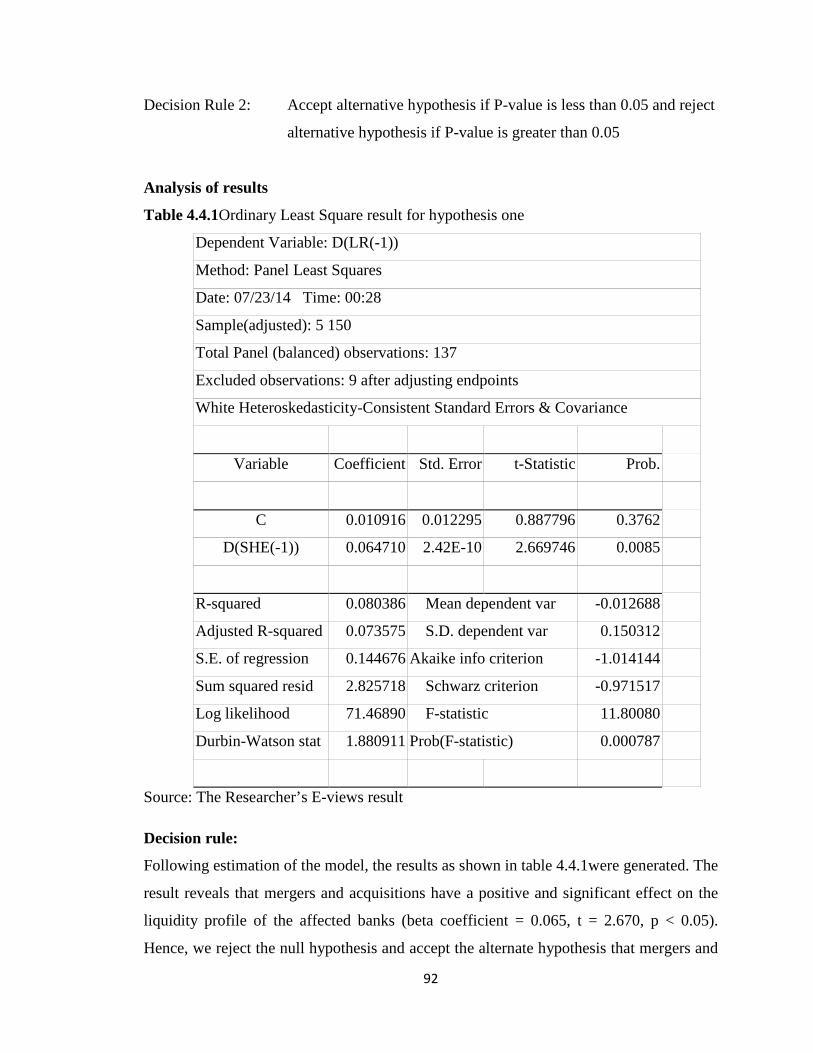
92
Decision Rule 2: Accept alternative hypothesis if P-value is less than 0.05 and reject
alternative hypothesis if P-value is greater than 0.05
Analysis of results
Table 4.4.1Ordinary Least Square result for hypothesis one
Dependent Variable: D(LR(-1))
Method: Panel Least Squares
Date: 07/23/14 Time: 00:28
Sample(adjusted): 5 150
Total Panel (balanced) observations: 137
Excluded observations: 9 after adjusting endpoints
White Heteroskedasticity-Consistent Standard Errors & Covariance
Variable Coefficient Std. Error t-Statistic Prob.
C 0.010916 0.012295 0.887796 0.3762
D(SHE(-1)) 0.064710 2.42E-10 2.669746 0.0085
R-squared 0.080386 Mean dependent var -0.012688
Adjusted R-squared 0.073575 S.D. dependent var 0.150312
S.E. of regression 0.144676 Akaike info criterion -1.014144
Sum squared resid 2.825718 Schwarz criterion -0.971517
Log likelihood 71.46890 F-statistic 11.80080
Durbin-Watson stat 1.880911 Prob(F-statistic) 0.000787
Source: The Researcher’s E-views result
Decision rule:
Following estimation of the model, the results as shown in table 4.4.1were generated. The
result reveals that mergers and acquisitions have a positive and significant effect on the
liquidity profile of the affected banks (beta coefficient = 0.065, t = 2.670, p < 0.05).
Hence, we reject the null hypothesis and accept the alternate hypothesis that mergers and

93
acquisition have a positive and significant effect on the liquidity profile of the affected
banks. The Coefficient of Determination (R2 =0.080) indicates that little variation in
liquidity ratio is explained by the model. The Durbin-Watson statistic is very close to 2
which mean no autocorrelation problems. Hence the model:
Liquidity Ratio = 0.0109 + 0.0647SHE
4.4.2 Test of Hypothesis Two
We re-state of hypothesis one as follows:
Ho: Mergers and acquisitions does not have any significant positive effect on the
return on equity of the affected banks.
Ha: Mergers and acquisitions have significant positive effect on the return on equity
of the affected banks
Decision rules
Decision Rule 1: Accept null hypothesis if P-value is greater than 0.05 and reject
null hypothesis is P-value is less than 0.05
Decision Rule 2: Accept alternative hypothesis if P-value is less than 0.05 and reject
alternative hypothesis if P-value is greater than 0.05
Analysis of results
Table 4.4.2 Ordinary Least Square result for hypothesis two
Dependent Variable: D(ROE(-1))
Method: Panel Least Squares
Date: 07/23/14 Time: 00:32
Sample(adjusted): 5 150
Total Panel (balanced) observations: 137
Excluded observations: 9 after adjusting endpoints
White Heteroskedasticity-Consistent Standard Errors & Covariance
Variable Coefficient Std. Error t-Statistic Prob.
C -0.033603 0.039708 -0.846250 0.3989
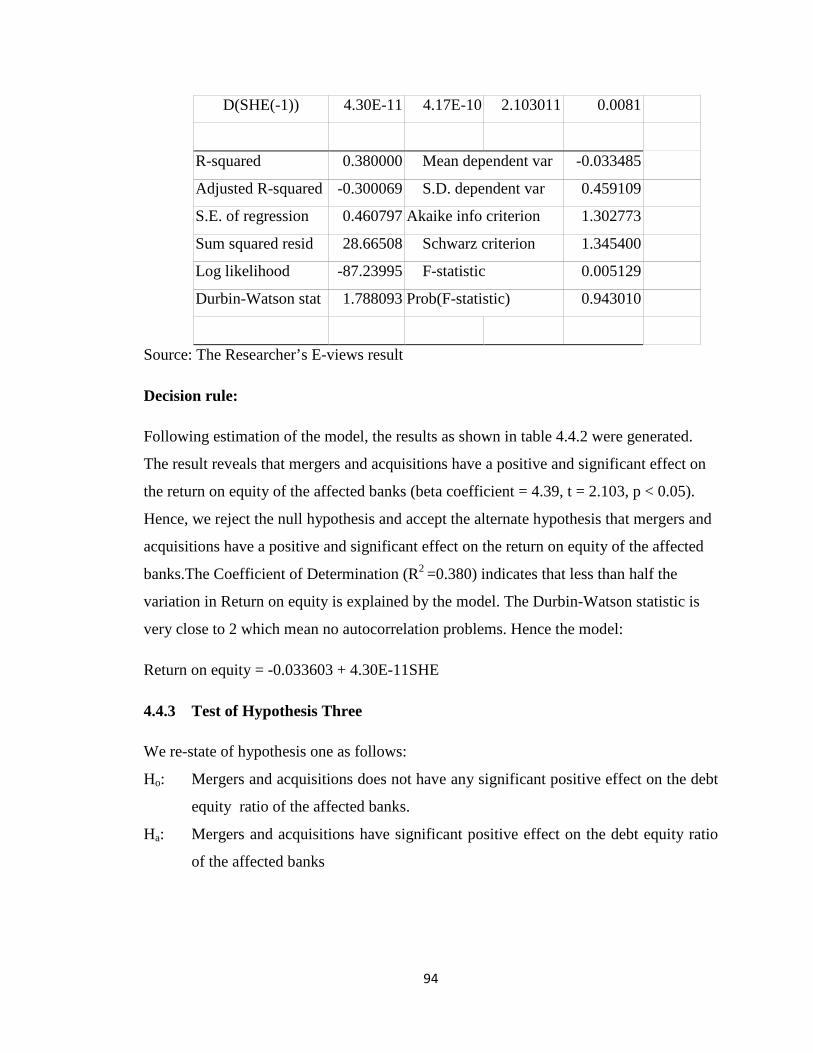
94
D(SHE(-1)) 4.30E-11 4.17E-10 2.103011 0.0081
R-squared 0.380000 Mean dependent var -0.033485
Adjusted R-squared -0.300069 S.D. dependent var 0.459109
S.E. of regression 0.460797 Akaike info criterion 1.302773
Sum squared resid 28.66508 Schwarz criterion 1.345400
Log likelihood -87.23995 F-statistic 0.005129
Durbin-Watson stat 1.788093 Prob(F-statistic) 0.943010
Source: The Researcher’s E-views result
Decision rule:
Following estimation of the model, the results as shown in table 4.4.2 were generated.
The result reveals that mergers and acquisitions have a positive and significant effect on
the return on equity of the affected banks (beta coefficient = 4.39, t = 2.103, p < 0.05).
Hence, we reject the null hypothesis and accept the alternate hypothesis that mergers and
acquisitions have a positive and significant effect on the return on equity of the affected
banks.The Coefficient of Determination (R2 =0.380) indicates that less than half the
variation in Return on equity is explained by the model. The Durbin-Watson statistic is
very close to 2 which mean no autocorrelation problems. Hence the model:
Return on equity = -0.033603 + 4.30E-11SHE
4.4.3 Test of Hypothesis Three
We re-state of hypothesis one as follows:
Ho: Mergers and acquisitions does not have any significant positive effect on the debt
equity ratio of the affected banks.
Ha: Mergers and acquisitions have significant positive effect on the debt equity ratio
of the affected banks
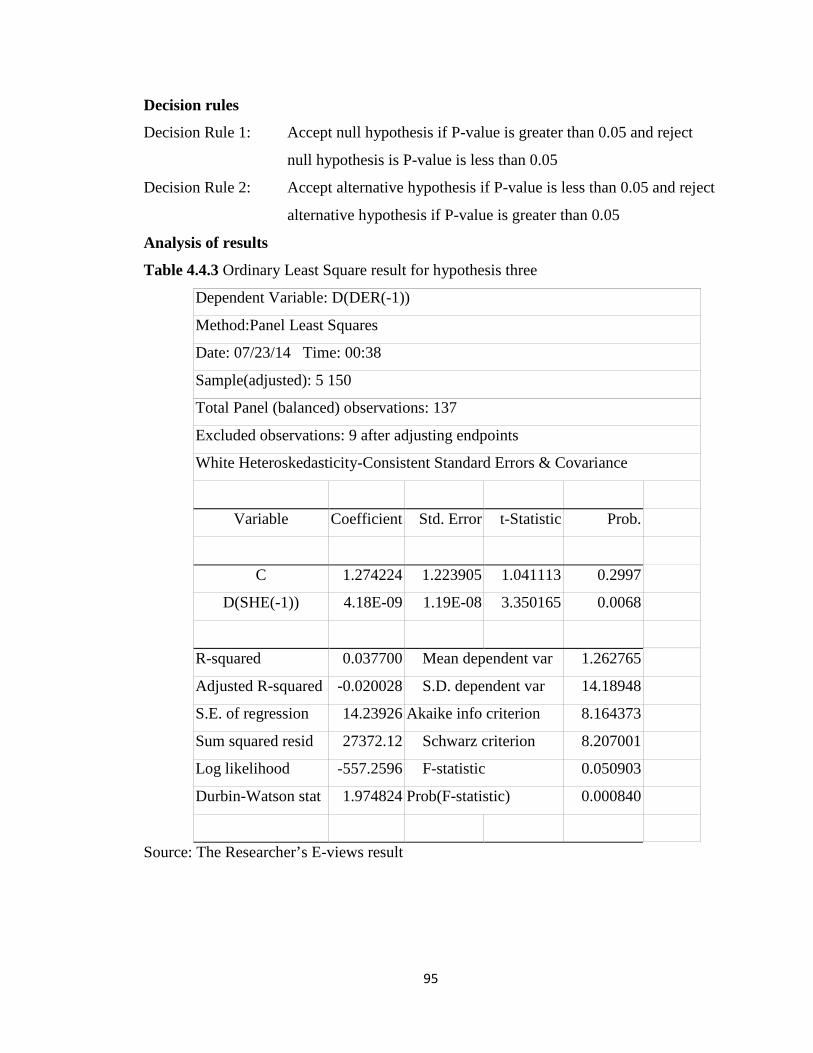
95
Decision rules
Decision Rule 1: Accept null hypothesis if P-value is greater than 0.05 and reject
null hypothesis is P-value is less than 0.05
Decision Rule 2: Accept alternative hypothesis if P-value is less than 0.05 and reject
alternative hypothesis if P-value is greater than 0.05
Analysis of results
Table 4.4.3 Ordinary Least Square result for hypothesis three
Dependent Variable: D(DER(-1))
Method:Panel Least Squares
Date: 07/23/14 Time: 00:38
Sample(adjusted): 5 150
Total Panel (balanced) observations: 137
Excluded observations: 9 after adjusting endpoints
White Heteroskedasticity-Consistent Standard Errors & Covariance
Variable Coefficient Std. Error t-Statistic Prob.
C 1.274224 1.223905 1.041113 0.2997
D(SHE(-1)) 4.18E-09 1.19E-08 3.350165 0.0068
R-squared 0.037700 Mean dependent var 1.262765
Adjusted R-squared -0.020028 S.D. dependent var 14.18948
S.E. of regression 14.23926 Akaike info criterion 8.164373
Sum squared resid 27372.12 Schwarz criterion 8.207001
Log likelihood -557.2596 F-statistic 0.050903
Durbin-Watson stat 1.974824 Prob(F-statistic) 0.000840
Source: The Researcher’s E-views result
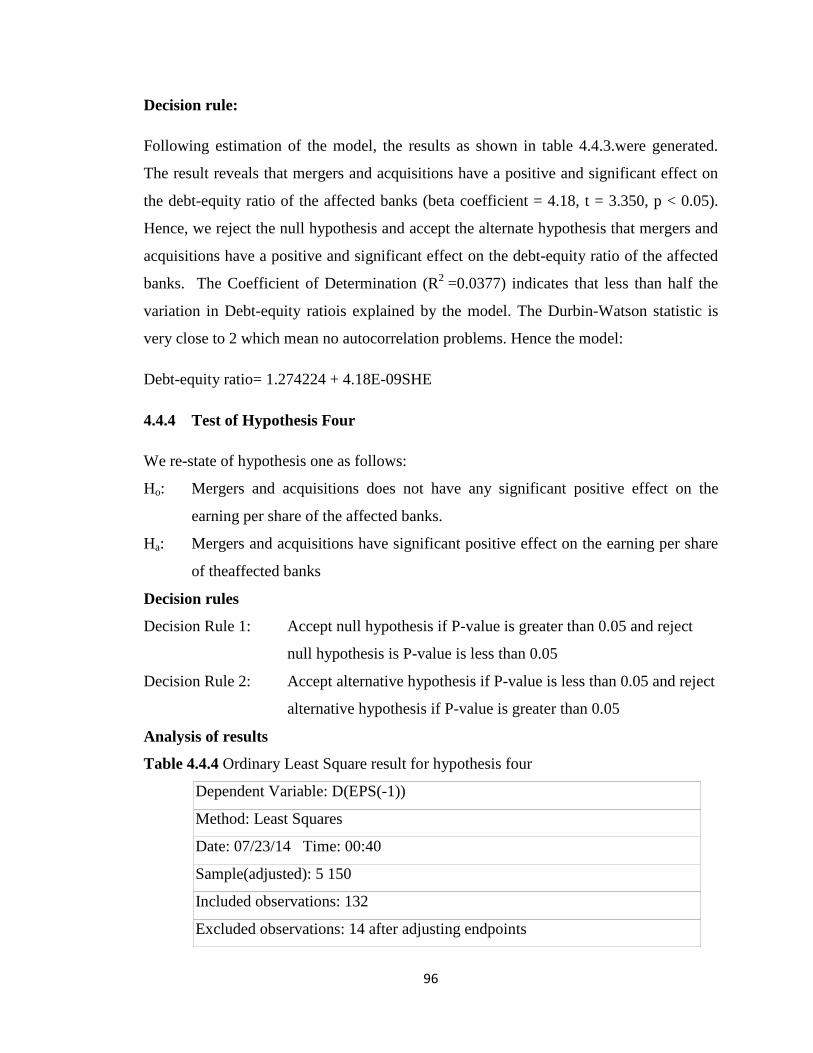
96
Decision rule:
Following estimation of the model, the results as shown in table 4.4.3.were generated.
The result reveals that mergers and acquisitions have a positive and significant effect on
the debt-equity ratio of the affected banks (beta coefficient = 4.18, t = 3.350, p < 0.05).
Hence, we reject the null hypothesis and accept the alternate hypothesis that mergers and
acquisitions have a positive and significant effect on the debt-equity ratio of the affected
banks. The Coefficient of Determination (R2 =0.0377) indicates that less than half the
variation in Debt-equity ratiois explained by the model. The Durbin-Watson statistic is
very close to 2 which mean no autocorrelation problems. Hence the model:
Debt-equity ratio= 1.274224 + 4.18E-09SHE
4.4.4 Test of Hypothesis Four
We re-state of hypothesis one as follows:
Ho: Mergers and acquisitions does not have any significant positive effect on the
earning per share of the affected banks.
Ha: Mergers and acquisitions have significant positive effect on the earning per share
of theaffected banks
Decision rules
Decision Rule 1: Accept null hypothesis if P-value is greater than 0.05 and reject
null hypothesis is P-value is less than 0.05
Decision Rule 2: Accept alternative hypothesis if P-value is less than 0.05 and reject
alternative hypothesis if P-value is greater than 0.05
Analysis of results
Table 4.4.4 Ordinary Least Square result for hypothesis four
Dependent Variable: D(EPS(-1))
Method: Least Squares
Date: 07/23/14 Time: 00:40
Sample(adjusted): 5 150
Included observations: 132
Excluded observations: 14 after adjusting endpoints
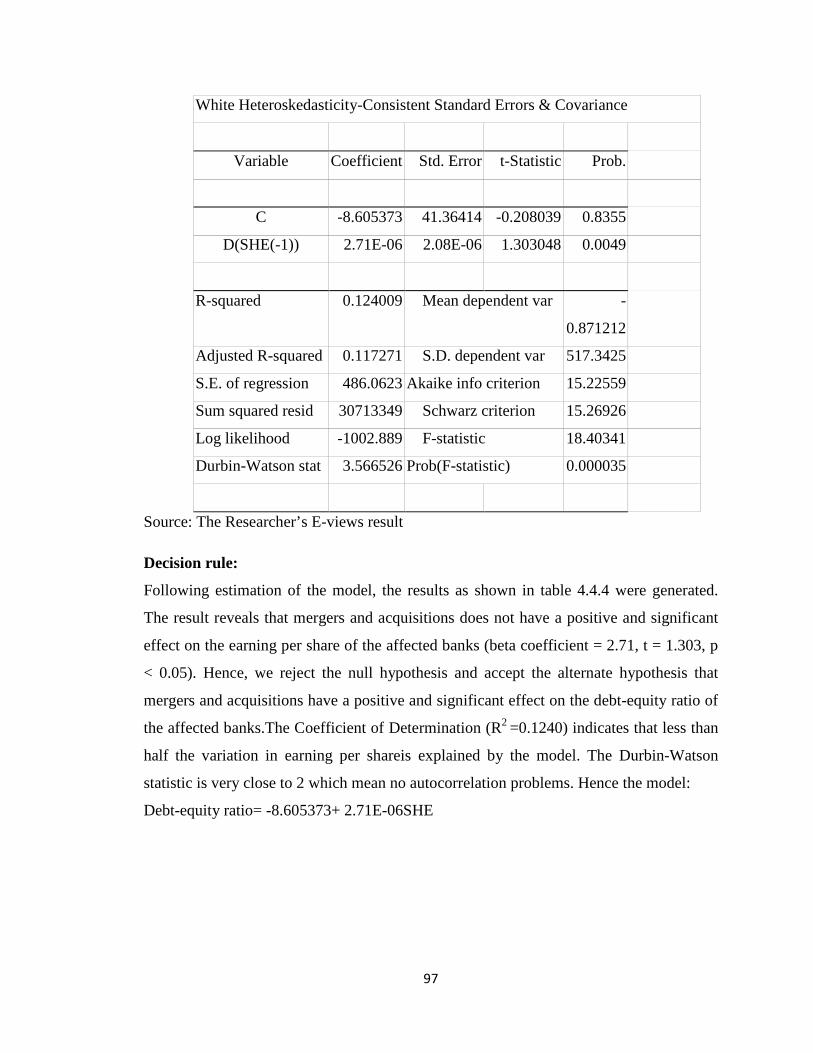
97
White Heteroskedasticity-Consistent Standard Errors & Covariance
Variable Coefficient Std. Error t-Statistic Prob.
C -8.605373 41.36414 -0.208039 0.8355
D(SHE(-1)) 2.71E-06 2.08E-06 1.303048 0.0049
R-squared 0.124009 Mean dependent var -
0.871212
Adjusted R-squared 0.117271 S.D. dependent var 517.3425
S.E. of regression 486.0623 Akaike info criterion 15.22559
Sum squared resid 30713349 Schwarz criterion 15.26926
Log likelihood -1002.889 F-statistic 18.40341
Durbin-Watson stat 3.566526 Prob(F-statistic) 0.000035
Source: The Researcher’s E-views result
Decision rule:
Following estimation of the model, the results as shown in table 4.4.4 were generated.
The result reveals that mergers and acquisitions does not have a positive and significant
effect on the earning per share of the affected banks (beta coefficient = 2.71, t = 1.303, p
< 0.05). Hence, we reject the null hypothesis and accept the alternate hypothesis that
mergers and acquisitions have a positive and significant effect on the debt-equity ratio of
the affected banks.The Coefficient of Determination (R2 =0.1240) indicates that less than
half the variation in earning per shareis explained by the model. The Durbin-Watson
statistic is very close to 2 which mean no autocorrelation problems. Hence the model:
Debt-equity ratio= -8.605373+ 2.71E-06SHE

98
4.5 Granger Causality test
Table 4.5: Granger Causality test
Pairwise Granger Causality Tests
Date: 07/22/14 Time: 22:51
Sample: 1 150
Lags: 2
Null Hypothesis: Obs F-Statistic Probability
LR does not Granger Cause SHE 134 1.99163 0.14065
SHE does not Granger Cause LR 1.17200 0.31302
ROE does not Granger Cause SHE 134 1.26146 0.28671
SHE does not Granger Cause ROE 0.17476 0.83985
DER does not Granger Cause SHE 134 3.01148 0.05269
SHE does not Granger Cause DER 0.12083 0.88629
EPS does not Granger Cause SHE 128 4.91978 0.00880
SHE does not Granger Cause EPS 0.84948 0.43013
Based on the Probability value reported in table 4.5, the hypothesis that shareholder’s
equitydoes not Granger cause liquidity ratiocannot be rejected, and also the hypothesis
that liquidity ratiodoes not Granger cause share holder’s equity cannot be rejected too (P
> 0.05). The hypothesis that return on equitydoes not Granger Cause shareholder’s
equitycannot be rejected, and the hypothesis that shareholder’s equitydoes not Granger
cause return on equity cannot be rejected too (P> 0.05). Similarly, the hypothesis that
debt-equity ratio and earnings per share does not Granger Cause shareholder’s
equitycannot be rejected, and the hypothesis that shareholder’s equitydoes not Granger
99
causedebt-equity ratio cannot be rejected either (P> 0.05). However, the hypothesis that
earnings per share does not Granger cause share holder’s equity can be rejected (P <0.05)
but not the other way round.
4.6 Implication of the results
4.6.0 Comparison of the findings with the objectives of the study
This section shows how the results of this study compares with the objectives of the
study. There is strong support from the results which demonstrate the achievement of the
key goals originally set out for this study. This is demonstrated more as follows:
4.6.1 Research objective one
To ascertain the impact of mergers and acquisitions on the liquidity profile of commercial
banks in Nigeria.
The results from the regression model show that mergers and acquisitionshas positive and
significant effect on the liquidity profile of commercial banks. This support our a priori
expectation and also the objective of the study achieved. With the positive relationship
between the shareholders equity and liquidity ratio, it follows that the banking industry
has experienced growth. Our findings are consistent with the work of Capasso (2008).
4.6.2 Research Objective Two
To examine how mergers and acquisitions adopted by commercial banks impacted on the
return on equity of the affected banks.
The results of the regression model indicate that mergers and acquisitions has a positive
and significant impact on the return on equity of the affected bank. This is consistent with
Ujunwa and Salami (2010), and support the a priori expectation, therefore, the objective
of the study achieved.
4.6.3 Research Objective Three
To evaluate the impact of mergers and acquisitions on the debt/equity profile of
commercial banks in Nigeria.
The results of the study indicate that mergers and acquisitions have a positive and
significant impact on the debt equity ratio of commercial banks in Nigeria. When the

100
economy grows through increase in output, this will lead to higher demand for
more financial services which could exert pressure for the expansion of financial
institutions to satisfy the new demand.
4.6.4 Research Objective Four
To examine the extent to which earning per share of commercial banks improved as a
result mergers and acquisitions.
The regression result shows that mergers and acquisitions have a negative and non-
significant impact on domestic credit to private sector. From the findings, economic
growth only affects a marginal increase in domestic credit to private sector. This is an
indication that economic growth have not really impacted on the lending activities of
banks in the country. Adenuga (2010), examined the private credit on economic growth
in Nigeria, found, on the basis of supply-led hypothesis, that private credit had in-
significant impact on economic growth. However, as revealed from the demand-
following hypothesis adopted in this study, economic has a positive though insignificant
impact on private credit this follows our a priori expectation

101
References
Access Bank, (2012). Annual Report for the year ended 30 June, 2012
Access Bank, (2011). Annual Report for the year ended 30 June, 2011
Access Bank, (2010). Annual Report for the year ended 30 June, 2010
Access Bank, (2009). Annual Report for the year ended 30 June, 2009
Access Bank, (2008). Annual Report for the year ended 30 June, 2008
Access Bank, (2007). Annual Report for the year ended 30 June, 2007
Access Bank, (2006). Annual Report for the year ended 30 June, 2006
Access Bank, (2005). Annual Report for the year ended 30 June, 2005
Access Bank, (2004). Annual Report for the year ended 30 June, 2004
Access Bank, (2003). Annual Report for the year ended 30 June, 2003
Access Bank, (2002). Annual Report for the year ended 30 June, 2002
Access Bank, (2001). Annual Report for the year ended 30 June, 2001
Access Bank, (2000). Annual Report for the year ended 30 June, 2000
Berndt, Ernst R. (1991). Practice of Econometrics: Classic and Contemporary. Boston, Mass.: Addison-Wesley.Econometric Software, Inc. 2001. “LIMDEP, Version 8.0.” Plainview. From New York.
Christopher Dougherty (2010). “Introduction to Econometrics” 3rd Edition
Diamond Bank, (2012). Annual Report for the year ended 30 June, 2012
Diamond Bank, (2011). Annual Report for the year ended 30 June, 2011
Diamond Bank, (2010). Annual Report for the year ended 30 June, 2010
Diamond Bank, (2009). Annual Report for the year ended 30 June, 2009
Diamond Bank, (2008). Annual Report for the year ended 30 June, 2008
Diamond Bank, (2007). Annual Report for the year ended 30 June, 2007
Diamond Bank, (2006). Annual Report for the year ended 30 June, 2006
Diamond Bank, (2005). Annual Report for the year ended 30 June, 2005
102
Diamond Bank, (2004). Annual Report for the year ended 30 June, 2004
Diamond Bank, (2003). Annual Report for the year ended 30 June, 2003
Diamond Bank, (2002). Annual Report for the year ended 30 June, 2002
Diamond Bank, (2001). Annual Report for the year ended 30 June, 2001
Diamond Bank, (2000). Annual Report for the year ended 30 June, 2000
Diamond Bank, (1999). Annual Report for the year ended 30 June, 1999
Diamond Bank, (1998). Annual Report for the year ended 30 June, 1998
Eco Bank, (2012). Annual Report for the year ended 30 June, 2012
Eco Bank, (2011). Annual Report for the year ended 30 June, 2011
Eco Bank, (2010). Annual Report for the year ended 30 June, 2010
Eco Bank, (2009). Annual Report for the year ended 30 June, 2009
Eco Bank, (2008). Annual Report for the year ended 30 June, 2008
Eco Bank, (2007). Annual Report for the year ended 30 June, 2007
Eco Bank, (2006). Annual Report for the year ended 30 June, 2006
Eco Bank, (2005). Annual Report for the year ended 30 June, 2005
Eco Bank, (2004). Annual Report for the year ended 30 June, 2004
Eco Bank, (2003). Annual Report for the year ended 30 June, 2003
Eco Bank, (2002). Annual Report for the year ended 30 June, 2002
Eco Bank, (2001). Annual Report for the year ended 30 June, 2001
Eco Bank, (2000). Annual Report for the year ended 30 June, 2000
Eco Bank, (1999). Annual Report for the year ended 30 June, 1999
Eco Bank, (1998). Annual Report for the year ended 30 June, 1998
Emily Blumenthal (2010). “Introduction to SPSS 16.0.”University of Washington, Seattle, WA 98195.From USA
FCMB, (2012).Annual Report for the year ended 30 June, 2012
FCMB, (2011).Annual Report for the year ended 30 June, 2011
103
FCMB, (2010).Annual Report for the year ended 30 June, 2010
FCMB, (2009).Annual Report for the year ended 30 June, 2009
FCMB, (2008).Annual Report for the year ended 30 June, 2008
FCMB, (2007).Annual Report for the year ended 30 June, 2007
FCMB, (2006).Annual Report for the year ended 30 June, 2006
FCMB, (2005).Annual Report for the year ended 30 June, 2005
FCMB, (2004).Annual Report for the year ended 30 June, 2004
FCMB, (2003).Annual Report for the year ended 30 June, 2003
FCMB, (2002).Annual Report for the year ended 30 June, 2002
FCMB, (2000).Annual Report for the year ended 30 June, 2000
Fidelity Bank, (2012). Annual Report for the year ended 30 June, 2012
Fidelity Bank, (2011). Annual Report for the year ended 30 June, 2011
Fidelity Bank, (2010). Annual Report for the year ended 30 June, 2010
Fidelity Bank, (2009). Annual Report for the year ended 30 June, 2009
Fidelity Bank, (2008). Annual Report for the year ended 30 June, 2008
Fidelity Bank, (2007). Annual Report for the year ended 30 June, 2007
Fidelity Bank, (2006). Annual Report for the year ended 30 June, 2006
Fidelity Bank, (2005). Annual Report for the year ended 30 June, 2005
Fidelity Bank, (2004). Annual Report for the year ended 30 June, 2004
Fidelity Bank, (2003). Annual Report for the year ended 30 June, 2003
Fidelity Bank, (2002). Annual Report for the year ended 30 June, 2002
Fidelity Bank, (2001). Annual Report for the year ended 30 June, 2001
Fidelity Bank, (2000). Annual Report for the year ended 30 June, 2000
Fidelity Bank, (1999). Annual Report for the year ended 30 June, 1999
Fidelity Bank, (1998). Annual Report for the year ended 30 June, 1998
104
First Bank, (2012).Annual Report for the year ended 30 June, 2012
First Bank, (2011).Annual Report for the year ended 30 June, 2011
First Bank, (2010).Annual Report for the year ended 30 June, 2010
First Bank, (2009).Annual Report for the year ended 30 June, 2009
First Bank, (2008).Annual Report for the year ended 30 June, 2008
First Bank, (2007).Annual Report for the year ended 30 June, 2007
First Bank, (2006).Annual Report for the year ended 30 June, 2006
First Bank, (2005).Annual Report for the year ended 30 June, 2005
First Bank, (2004).Annual Report for the year ended 30 June, 2004
First Bank, (2003).Annual Report for the year ended 30 June, 2003
First Bank, (2002).Annual Report for the year ended 30 June, 2002
First Bank, (2001).Annual Report for the year ended 30 June, 2001
First Bank, (2000).Annual Report for the year ended 30 June, 2000
First Bank, (1999).Annual Report for the year ended 30 June, 1999
Gujarati, D.N. (1995), Basic Econometrics, New York: McGraw-Hill Inc.
Gujarati, D.N (2004), Basic Econometrics, New Delhi: Tata McGraw-Hill
Lawler, Kevin et al. (2000). Econometrics: A Practical Approach. London: Rutledge Press.
McCloskey, Deirdre and Stephen Ziliak.1996.“The Standard Error of Regression.”Journal ofEconomic Literature. March, 34, 97–114.
R.R Johnson. (2010) “A Guide to Using Eviews with Using Econometrics: A Practical Guide”. University of San Diego
Ramanathan, Ramu. (1998). Introductory Econometrics with Applications. Fort Worth, Tex.: HarcourtCollege Publishers.Secrist, Horace. 1933. The Triumph of Mediocrity in Business. Evanston, Ill.: Bureau of Business Research. Northwestern University.
Spector, Lee C. & Michael Mazzeo.(1980). “Profit Analysis and Economic Education.” Journal of Economic Education.Spring.Vol. 11. Pp. 37–44.
Stanbic IBTC Bank (2012). Annual Report for the year ended 30 June, 2012
105
Stanbic IBTC Bank, (2011). Annual Report for the year ended 30 June, 2011
Stanbic IBTC Bank (2010). Annual Report for the year ended 30 June, 2010
Stanbic IBTC Bank (2009). Annual Report for the year ended 30 June, 2009
Stanbic IBTC Bank, (2008). Annual Report for the year ended 30 June, 2008
Stanbic IBTC Bank (2007). Annual Report for the year ended 30 June, 2007
Stanbic IBTC Bank, (2006). Annual Report for the year ended 30 June, 2006
Stanbic IBTC Bank (2005). Annual Report for the year ended 30 June, 2005
Stanbic IBTC Bank (2004). Annual Report for the year ended 30 June, 2004
Stanbic IBTC Bank, (2003). Annual Report for the year ended 30 June, 2003
Stanbic IBTC Bank (2002). Annual Report for the year ended 30 June, 2002
Stanbic IBTC Bank (2001). Annual Report for the year ended 30 June, 2001
Stanbic IBTC Bank (2000). Annual Report for the year ended 30 June, 2000
Stanbic IBTC Bank (1999). Annual Report for the year ended 30 June, 1999
Studenmund, A. H. (2001). Using Econometrics: A Practical Guide. Boston, Mass.: Addison Wesley.
UBA, (2012).Annual Report for the year ended 30 June, 2012
UBA, (2011).Annual Report for the year ended 30 June, 2011
UBA, (2010).Annual Report for the year ended 30 June, 2010
UBA, (2009).Annual Report for the year ended 30 June, 2009
UBA, (2008).Annual Report for the year ended 30 June, 2008
UBA, (2007).Annual Report for the year ended 30 June, 2007
UBA, (2006).Annual Report for the year ended 30 June, 2006
UBA, (2005).Annual Report for the year ended 30 June, 2005
UBA, (2004).Annual Report for the year ended 30 June, 2004
UBA, (2003).Annual Report for the year ended 30 June, 2003
UBA, (2002).Annual Report for the year ended 30 June, 2002

106
UBA, (2001).Annual Report for the year ended 30 June, 2001
UBA, (2000).Annual Report for the year ended 30 June, 2000
UBA, (1999).Annual Report for the year ended 30 June, 1999
UBA, (1998).Annual Report for the year ended 30 June, 1998
Union Bank (2012). Annual Report for the year ended 30 June, 2012
Union Bank, (2011). Annual Report for the year ended 30 June, 2011
Union Bank (2010). Annual Report for the year ended 30 June, 2010
Union Bank (2009). Annual Report for the year ended 30 June, 2009
Union Bank, (2008). Annual Report for the year ended 30 June, 2008
Union Bank (2007). Annual Report for the year ended 30 June, 2007
Union Bank, (2006). Annual Report for the year ended 30 June, 2006
Union Bank (2005). Annual Report for the year ended 30 June, 2005
Union Bank (2004). Annual Report for the year ended 30 June, 2004
Union Bank, (2003). Annual Report for the year ended 30 June, 2003
Union Bank (2002). Annual Report for the year ended 30 June, 2002
Union Bank (2001). Annual Report for the year ended 30 June, 2001
Union Bank (2000). Annual Report for the year ended 30 June, 2000
Union Bank (1999). Annual Report for the year ended 30 June, 1999
Union Bank (1998). Annual Report for the year ended 30 June, 1998
Wema Bank (2012). Annual Report for the year ended 30 June, 2012
Wema Bank, (2011). Annual Report for the year ended 30 June, 2011
Wema Bank (2010). Annual Report for the year ended 30 June, 2010
Wema Bank (2009). Annual Report for the year ended 30 June, 2009
Wema Bank, (2008). Annual Report for the year ended 30 June, 2008
Wema Bank (2007). Annual Report for the year ended 30 June, 2007
107
Wema Bank, (2006). Annual Report for the year ended 30 June, 2006
Wema Bank (2005). Annual Report for the year ended 30 June, 2005
Wema Bank (2004). Annual Report for the year ended 30 June, 2004
Wema Bank, (2003). Annual Report for the year ended 30 June, 2003
Wema Bank (2002). Annual Report for the year ended 30 June, 2002
Wema Bank (2001). Annual Report for the year ended 30 June, 2001
Wema Bank (2000). Annual Report for the year ended 30 June, 2000
Wema Bank (1999). Annual Report for the year ended 30 June, 1999
Wema Bank (1998). Annual Report for the year ended 30 June, 1998
Wonnacott, Ronald J. and Thomas H. Wonnacott.(1980). Econometrics. New York,N.Y.: Wiley.
Wooldridge, Jeffrey. (2000) Introductory Econometrics: A Modern Approach. Cincinnati, Ohio: Southwestern College Publishing.182 Journal of Economic Perspectives
Yi-Chi Chen (1999).“Introduction to Eviews”.University of Washington, Seattle WA 98195 USA.

108
CHAPTER FIVE
SUMMARY OF FINDINGS, CONCLUSION AND RECOMMENDATIONS
5.1 Summary of Findings
The findings emanating from the study are as follows:
1. Mergers and acquisition haspositive and significant effect on the liquidity profile
of the affected banks.
2. Mergers and acquisition has positive and significant effect on return on equity of
the affected banks.
3. Mergers and acquisition has positive and insignificant effect on debt/equity ratio
of the affected banks.
4. Mergers and acquisition has positive and significant effect on earnings per share
of the affected banks.
5.2 Conclusion of the Study
This research has been able to estimate the effect of mergers and acquisitions on the
performance of Nigerian banking industry from 1998-2012. The conclusions based on
the findings are as follows;
1. The finding of the research is of the conclusion that mergers and acquisitions has
positive and significant effect on the liquidity profile of the affected banks.
2. The effect of return on equity on mergers and acquisition are positive and
significant.
3. It was concluded that the debt/equity ratio of the effected banks are positive and
significant
4. Finally, the finding on earning per share of the affected banks are also positive but
not significant
5.3 Recommendations of the Study
The following specific recommendations based on the objectives of this study are as
follows;
109
1. Government should ensure the stability of operating environment for banks. The
liberalization policy should be vigorously pursued to enable banks and business
decision makers to work freely within a wider horizon with reasonable degree of
certainty about the environment for speedy and more effective decision making.
2. In order to discourage unethical practices on the part of the banks and their
managements, the Central Bank of Nigeria (CBN) and other regulatory bodies should
turn their searchlights on the Nigerian banking industry, so that the megabanks would
not begin to perpetuate financial crimes to generate jumbo returns from the enormous
funds available to them. And also in order to build and retain public confidence and
avoid a run on Nigerian banks, greater transparency and accountability should be
firmly embedded as the hallmark of the Nigerian banking system.
3. Consolidation of any industry is likely to pose additional challenges arising from
integration of processes, IT and culture. In addition, research has shown that two-
thirds of mergers, world-wide, fail due to inability to integrate personnel and systems
as well as due to irreconcilable differences in corporate culture and management,
resulting in Board and Management squabbles (CBN, 2006). In view of this, the
emergence of mega banks in the post consolidation era is bound to task the skills and
competencies of Boards and Managements in improving shareholder values and
balance same against other stakeholder interests in a competitive environment.
Therefore, in order to ensure that the synergy that the bank consolidation promises,
and to mitigate post-consolidation conflicts, adequate steps should be taken to train
and retrain the staff and management of all the banks that have scaled the
consolidation huddles while the regulatory environment has to be tightened to close

110
all the loopholes that could come up as a result of the increased size of the firms in
the industry.
4. In the bid to ensure the practice of good corporate governance, which is a system by
which corporations are governed and controlled with a view to increasing shareholder
value and meeting the expectations of the other stakeholders, the CBN and other
regulatory bodies like Security and Exchange Commission, Nigeria Stock Exchange,
Nigeria Deposit Insurance Corporation, among others, should not allow any of the
banks to have weak corporate governance.
5.4 Recommendation for Further Studies
Firstly, Nigerian banks are increasing their presence in overseas countries, mainly in Asia
Pacific region by acquiring majority or strategic stakes in foreign target banks. It would
be interesting to study the effectiveness of these cross-border acquisitions which we
opined, is still at infancy stage and have not been analyzed by any researchers yet.
Further research could be undertaken to compare both the assets size of acquiring banks
and target banks on the effectiveness of post merger efficiency.
Secondly, the interest in this study was to examine the effect of mergers and acquisitions
on the Nigerian banking industry. However, there are other survival strategies that can be
adopted by banks like organic growths. This study recommends an up to date study on
the effectiveness of this approach of survival other than mergers and acquisitions.
5.5 Contribution to Knowledge
This study investigates the effect of mergers and acquisitions on the performance of the
Nigerian banking industry for the period 1998 to 2012. This study contributes to
literature geographically. Most literature reviewed for this study is between 2004-2006.
This study gives a more elaborate analysis of the mergers and acquisitions period so that
we are able ascertain that mergers and acquisitions has improved the performance of
banks in Nigeria.

111
References
Anard J. & singh. H. (1997).“Asset redeployment, acquisition and corporate strategies in declining industries”Strategic Management Journal.Vol. 23. pp. 119-134.
Burt, S& limmack R. (2001).“Takeovers and Shareholders Return in the Retail Industry.”
Gaughan,P.A (1999).Mergers, Acquisitions and Corporate Restructuring, second edition, John Wiley and Sons. New York
Glueck William (1980). “Business Policy and Strategic Management”Mcgraw Hill
Goorey,G(1999).“Merger disruption”, in Global Finance.New York.
Hanweck ,G.& Shull,B(1999).“The bank merger movement: Efficiency,stability and competitive policy concerns”, in Antitrust Bulletin. New York.
Hearly P M et al (1992).“Does corporate Performance Improve after Mergers” Journal of Financial Economics. Vol. 31.pp.135-175
Ifezue, A.N. (1979).“Essential of Strategic Management and Marketing” ABIC Books and Equip Ltd.Enugu.
Rhoades.S.A (1998).“The efficiency effects of bank mergers: An overview of case studies of nine mergers”, Journal of Banking and Finance, Vol. 22. pp.273-291. Retrieved 1998. Amsterdam, Elsevier.
www.cenbank.org/FAQ/faqconsolidation.htm
www.acenture.com/evolutionbanking
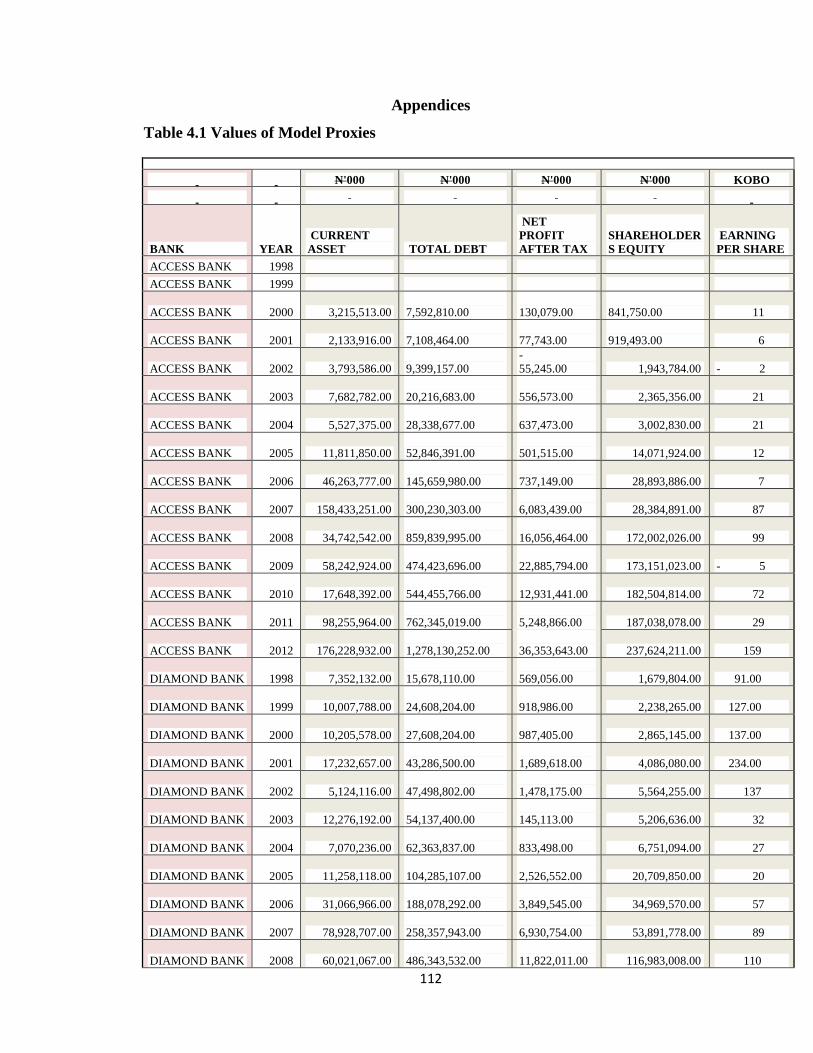
112
Appendices
Table 4.1 Values of Model Proxies
N'000 N'000 N'000 N'000 KOBO
BANK YEAR CURRENT ASSET TOTAL DEBT
NET PROFIT AFTER TAX
SHAREHOLDERS EQUITY
EARNING PER SHARE
ACCESS BANK 1998
ACCESS BANK 1999
ACCESS BANK 2000 3,215,513.00 7,592,810.00
130,079.00
841,750.00 11
ACCESS BANK 2001 2,133,916.00 7,108,464.00
77,743.00
919,493.00 6
ACCESS BANK 2002 3,793,586.00 9,399,157.00
- 55,245.00 1,943,784.00 - 2
ACCESS BANK 2003 7,682,782.00 20,216,683.00
556,573.00 2,365,356.00 21
ACCESS BANK 2004 5,527,375.00 28,338,677.00
637,473.00 3,002,830.00 21
ACCESS BANK 2005 11,811,850.00 52,846,391.00
501,515.00 14,071,924.00 12
ACCESS BANK 2006 46,263,777.00 145,659,980.00
737,149.00 28,893,886.00 7
ACCESS BANK 2007 158,433,251.00 300,230,303.00
6,083,439.00 28,384,891.00 87
ACCESS BANK 2008 34,742,542.00 859,839,995.00
16,056,464.00 172,002,026.00 99
ACCESS BANK 2009 58,242,924.00 474,423,696.00
22,885,794.00 173,151,023.00 - 5
ACCESS BANK 2010 17,648,392.00 544,455,766.00
12,931,441.00 182,504,814.00 72
ACCESS BANK 2011 98,255,964.00 762,345,019.00
5,248,866.00 187,038,078.00 29
ACCESS BANK 2012 176,228,932.00 1,278,130,252.00
36,353,643.00 237,624,211.00 159
DIAMOND BANK 1998 7,352,132.00 15,678,110.00
569,056.00 1,679,804.00 91.00
DIAMOND BANK 1999 10,007,788.00 24,608,204.00
918,986.00 2,238,265.00 127.00
DIAMOND BANK 2000 10,205,578.00 27,608,204.00
987,405.00 2,865,145.00 137.00
DIAMOND BANK 2001 17,232,657.00 43,286,500.00
1,689,618.00 4,086,080.00 234.00
DIAMOND BANK 2002 5,124,116.00 47,498,802.00
1,478,175.00 5,564,255.00 137
DIAMOND BANK 2003 12,276,192.00 54,137,400.00
145,113.00 5,206,636.00 32
DIAMOND BANK 2004 7,070,236.00 62,363,837.00
833,498.00 6,751,094.00 27
DIAMOND BANK 2005 11,258,118.00 104,285,107.00
2,526,552.00 20,709,850.00 20
DIAMOND BANK 2006 31,066,966.00 188,078,292.00
3,849,545.00 34,969,570.00 57
DIAMOND BANK 2007 78,928,707.00 258,357,943.00
6,930,754.00 53,891,778.00 89
DIAMOND BANK 2008 60,021,067.00 486,343,532.00
11,822,011.00 116,983,008.00 110
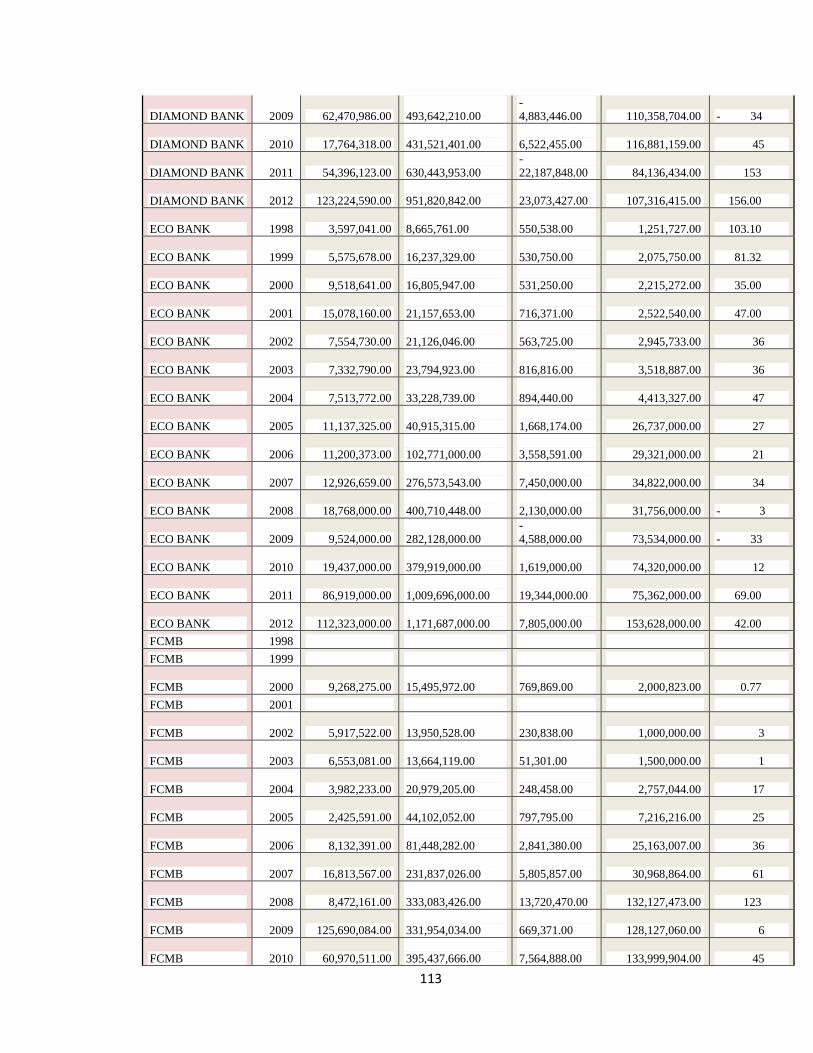
113
DIAMOND BANK 2009 62,470,986.00 493,642,210.00
- 4,883,446.00 110,358,704.00 - 34
DIAMOND BANK 2010 17,764,318.00 431,521,401.00
6,522,455.00 116,881,159.00 45
DIAMOND BANK 2011 54,396,123.00 630,443,953.00
- 22,187,848.00 84,136,434.00 153
DIAMOND BANK 2012 123,224,590.00 951,820,842.00
23,073,427.00 107,316,415.00 156.00
ECO BANK 1998 3,597,041.00 8,665,761.00
550,538.00 1,251,727.00 103.10
ECO BANK 1999 5,575,678.00 16,237,329.00
530,750.00 2,075,750.00 81.32
ECO BANK 2000 9,518,641.00 16,805,947.00
531,250.00 2,215,272.00 35.00
ECO BANK 2001 15,078,160.00 21,157,653.00
716,371.00 2,522,540.00 47.00
ECO BANK 2002 7,554,730.00 21,126,046.00
563,725.00 2,945,733.00 36
ECO BANK 2003 7,332,790.00 23,794,923.00
816,816.00 3,518,887.00 36
ECO BANK 2004 7,513,772.00 33,228,739.00
894,440.00 4,413,327.00 47
ECO BANK 2005 11,137,325.00 40,915,315.00
1,668,174.00 26,737,000.00 27
ECO BANK 2006 11,200,373.00 102,771,000.00
3,558,591.00 29,321,000.00 21
ECO BANK 2007 12,926,659.00 276,573,543.00
7,450,000.00 34,822,000.00 34
ECO BANK 2008 18,768,000.00 400,710,448.00
2,130,000.00 31,756,000.00 - 3
ECO BANK 2009 9,524,000.00 282,128,000.00
- 4,588,000.00 73,534,000.00 - 33
ECO BANK 2010 19,437,000.00 379,919,000.00
1,619,000.00 74,320,000.00 12
ECO BANK 2011 86,919,000.00 1,009,696,000.00
19,344,000.00 75,362,000.00 69.00
ECO BANK 2012 112,323,000.00 1,171,687,000.00
7,805,000.00 153,628,000.00 42.00
FCMB 1998
FCMB 1999
FCMB 2000 9,268,275.00 15,495,972.00
769,869.00 2,000,823.00 0.77
FCMB 2001
FCMB 2002 5,917,522.00 13,950,528.00
230,838.00 1,000,000.00 3
FCMB 2003 6,553,081.00 13,664,119.00
51,301.00 1,500,000.00 1
FCMB 2004 3,982,233.00 20,979,205.00
248,458.00 2,757,044.00 17
FCMB 2005 2,425,591.00 44,102,052.00
797,795.00 7,216,216.00 25
FCMB 2006 8,132,391.00 81,448,282.00
2,841,380.00 25,163,007.00 36
FCMB 2007 16,813,567.00 231,837,026.00
5,805,857.00 30,968,864.00 61
FCMB 2008 8,472,161.00 333,083,426.00
13,720,470.00 132,127,473.00 123
FCMB 2009 125,690,084.00 331,954,034.00
669,371.00 128,127,060.00 6
FCMB 2010 60,970,511.00 395,437,666.00
7,564,888.00 133,999,904.00 45

114
FCMB 2011 41,642,744.00 476,095,598.00
- 11,004,393.00 117,018,764.00 - 68
FCMB 2012 120,210,262.00 759,422,893.00
12,559,592.00 130,890,713.00 66.00
FIDELITY BANK 1998 1,893,304.00 3,959,018.00
174,918.00
779,385.00 7
FIDELITY BANK 1999 2,670,677.00 5,381,179.00
173,241.00
831,668.00 9
FIDELITY BANK 2000 3,443,937.00 9,090,196.00
207,627.00
922,122.00 23
FIDELITY BANK 2001 5,917,983.00 11,415,433.00
400,661.00 1,300,533.00 23
FIDELITY BANK 2002 5,171,463.00 13,721,769.00
539,242.00 1,915,211.00 36
FIDELITY BANK 2003 6,023,194.00 20,001,640.00
856,885.00 2,515,423.00 36
FIDELITY BANK 2004 5,321,948.00 24,032,455.00
913,604.00 3,519,624.00 30
FIDELITY BANK 2005 5,219,332.00 25,229,803.00
1,236,790.00 9,723,548.00 14
FIDELITY BANK 2006 12,174,535.00 94,388,808.00
3,162,347.00 25,596,993.00 19
FIDELITY BANK 2007 19,733,974.00 187,387,465.00
4,160,007.00 29,757,000.00 25
FIDELITY BANK 2008 30,901,857.00 397,258,245.00
12,986,570.00 135,863,988.00 45
FIDELITY BANK 2009 24,894,093.00 374,789,896.00
2,296,799.00 129,340,000.00 8
FIDELITY BANK 2010 25,505,000.00 343,574,000.00
5,827,000.00 134,446,000.00 20
FIDELITY BANK 2011 82,271,000.00 603,158,000.00
3,911,000.00 136,350,000.00 55
FIDELITY BANK 2012 117,291,000.00 752,905,000.00
17,924,000.00 161,455,000.00 68
FIRST BANK 1998
FIRST BANK 1999 71,420,000.00 118,196,000.00
2,943,000.00 11,307,000.00 283.00
FIRST BANK 2000 126,457,000.00 166,034,000.00
4,221,000.00 14,519,000.00 324.00
FIRST BANK 2001 145,924,000.00 195,808,000.00
4,676,000.00 17,093,000.00 288.00
FIRST BANK 2002 186,978,000.00 248,609,000.00
3,979,000.00 17,747,000.00 196.00
FIRST BANK 2003 230,497,000.00 295,538,000.00
10,323,000.00 25,050,000.00 406.00
FIRST BANK 2004 24,098,000.00 341,900,000.00
11,483,000.00 41,605,000.00 110.00
FIRST BANK 2005 32,881,000.00 421,034,000.00
13,234,000.00 48,726,000.00 126.00
FIRST BANK 2006 50,992,000.00 552,547,000.00
17,383,000.00 64,277,000.00 147.00
FIRST BANK 2007 61,822,000.00 801,221,000.00
20,367,000.00 83,383,000.00 175.00
FIRST BANK 2008 89,076,000.00 825,614,000.00
30,473,000.00 339,847,000.00 95.00
FIRST BANK 2009 67,576,000.00 1,454,968,000.00
1,275,000.00 317,488,000.00 141.00
FIRST BANK 2010 74,894,000.00 1,616,523,000.00
32,123,000.00 340,735,000.00 4.00
FIRST BANK 2011 199,091,000.00 2,491,589,000.00
18,636,000.00 368,580,000.00 98.00

115
FIRST BANK 2012 300,531,000.00 2,747,282,000.00
75,670,000.00 438,847,000.00 145.00
UBA 1998 32,681.00
68,715.00
134.00
5,036.00 13.00
UBA 1999 47,221.00
94,967.00
1,109.00
5,011.00 111.00
UBA 2000 53,920.00
113,205.00
3,013.00
6,782.00 301.00
UBA 2001 87,712.00
178,821.00
1,183.00
8,427.00 46.00
UBA 2002 103,314.00
188,898.00
1,361.00
9,782.00 53.00
UBA 2003 92,615.00
187,228.00
2,989.00
13,767.00 117.00
UBA 2004 40,913.00
187,362.00
4,185.00
18,059.00 137.00
UBA 2005 36,461.00
229,550.00
4,653.00
17,702.00 152.00
UBA 2006 57,866.00
803,620.00
11,468.00
47,621.00 186.00
UBA 2007 63,902.00
937,527.00
19,831.00
164,590.00 241.00
UBA 2008 95,733.00
1,331,936.00
40,002.00
176,924.00 305.00
UBA 2009 38,972.00
1,213,160.00
12,889.00
187,719.00 60.00
UBA 2010 330,701.00
1,253,368.00
- 6,295.00
187,356.00 8.00
UBA 2011 352,500.00
1,483,738.00
- 7,966.00
182,315.00
UBA 2012 629,481.00
1,712,748.00
47,375.00
220,317.00
UNION BANK 1998 5,660,000.00 93,679,000.00
1,733,000.00 8,752,000.00 68.00
UNION BANK 1999 8,354,000.00 115,602,000.00
3,127,000.00 10,632,000.00 124.00
UNION BANK 2000 5,624,946.00 16,196,976.00
418,962.00 1,727,827.00 40.00
UNION BANK 2001 15,291,000.00 201,099,000.00
5,035,000.00 13,786,000.00 200.00
UNION BANK 2002 20,814,000.00 244,892,000.00
4,726,000.00 30,302,000.00 188.00
UNION BANK 2003 29,090,000.00 296,853,000.00
6,600,000.00 32,730,000.00 262.00
UNION BANK 2004 22,872,000.00 331,813,000.00
7,750,000.00 35,985,000.00 231.00
UNION BANK 2005 27,476,000.00 359,142,000.00
9,375,000.00 39,129,000.00 97.00
UNION BANK 2006 56,995,000.00 421,879,000.00
10,036,000.00 95,685,000.00 104.00
UNION BANK 2007 29,419,000.00 523,170,000.00
12,126,000.00 96,630,000.00 126.00
UNION BANK 2008 42,868,000.00 795,803,000.00
24,737,000.00 111,271,000.00 41.00
UNION BANK 2009 70,185,000.00 868,085,000.00
- 71,052,000.00 53,145,000.00 43.00
UNION BANK 2010 22,578,000.00 981,125,000.00
118,016,000.00 - 135,894,000.00 ########
UNION BANK 2011 51,134,000.00 664,203,000.00
- 86,667,000.00 179,560,000.00 ########
UNION BANK 2012 142,938,000.00 714,800,000.00 3,914,000.00 171,700,000.00 ########
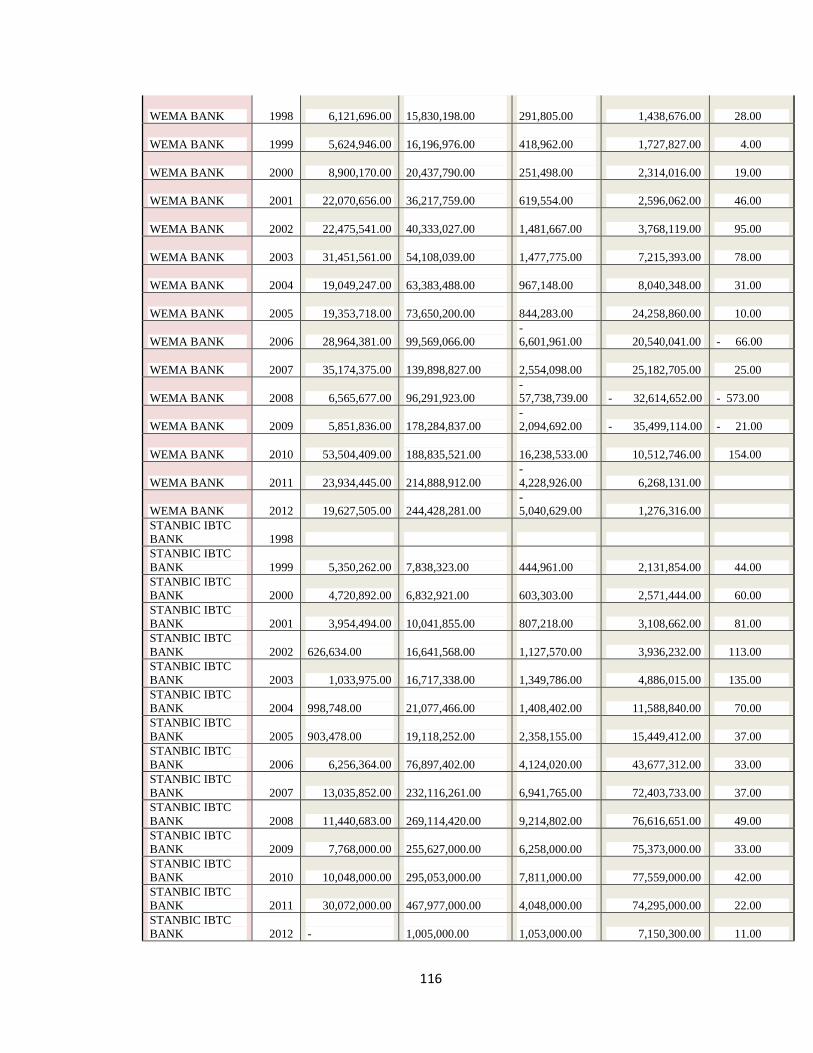
116
WEMA BANK 1998 6,121,696.00 15,830,198.00
291,805.00 1,438,676.00 28.00
WEMA BANK 1999 5,624,946.00 16,196,976.00
418,962.00 1,727,827.00 4.00
WEMA BANK 2000 8,900,170.00 20,437,790.00
251,498.00 2,314,016.00 19.00
WEMA BANK 2001 22,070,656.00 36,217,759.00
619,554.00 2,596,062.00 46.00
WEMA BANK 2002 22,475,541.00 40,333,027.00
1,481,667.00 3,768,119.00 95.00
WEMA BANK 2003 31,451,561.00 54,108,039.00
1,477,775.00 7,215,393.00 78.00
WEMA BANK 2004 19,049,247.00 63,383,488.00
967,148.00 8,040,348.00 31.00
WEMA BANK 2005 19,353,718.00 73,650,200.00
844,283.00 24,258,860.00 10.00
WEMA BANK 2006 28,964,381.00 99,569,066.00
- 6,601,961.00 20,540,041.00 - 66.00
WEMA BANK 2007 35,174,375.00 139,898,827.00
2,554,098.00 25,182,705.00 25.00
WEMA BANK 2008 6,565,677.00 96,291,923.00
- 57,738,739.00 - 32,614,652.00 - 573.00
WEMA BANK 2009 5,851,836.00 178,284,837.00
- 2,094,692.00 - 35,499,114.00 - 21.00
WEMA BANK 2010 53,504,409.00 188,835,521.00
16,238,533.00 10,512,746.00 154.00
WEMA BANK 2011 23,934,445.00 214,888,912.00
- 4,228,926.00 6,268,131.00
WEMA BANK 2012 19,627,505.00 244,428,281.00
- 5,040,629.00 1,276,316.00
STANBIC IBTC BANK 1998 STANBIC IBTC BANK 1999 5,350,262.00
7,838,323.00
444,961.00 2,131,854.00 44.00
STANBIC IBTC BANK 2000 4,720,892.00
6,832,921.00
603,303.00 2,571,444.00 60.00
STANBIC IBTC BANK 2001 3,954,494.00
10,041,855.00
807,218.00 3,108,662.00 81.00
STANBIC IBTC BANK 2002
626,634.00
16,641,568.00
1,127,570.00 3,936,232.00 113.00
STANBIC IBTC BANK 2003 1,033,975.00
16,717,338.00
1,349,786.00 4,886,015.00 135.00
STANBIC IBTC BANK 2004
998,748.00
21,077,466.00
1,408,402.00 11,588,840.00 70.00
STANBIC IBTC BANK 2005
903,478.00
19,118,252.00
2,358,155.00 15,449,412.00 37.00
STANBIC IBTC BANK 2006 6,256,364.00
76,897,402.00
4,124,020.00 43,677,312.00 33.00
STANBIC IBTC BANK 2007 13,035,852.00
232,116,261.00
6,941,765.00 72,403,733.00 37.00
STANBIC IBTC BANK 2008 11,440,683.00
269,114,420.00
9,214,802.00 76,616,651.00 49.00
STANBIC IBTC BANK 2009 7,768,000.00
255,627,000.00
6,258,000.00 75,373,000.00 33.00
STANBIC IBTC BANK 2010 10,048,000.00
295,053,000.00
7,811,000.00 77,559,000.00 42.00
STANBIC IBTC BANK 2011 30,072,000.00
467,977,000.00
4,048,000.00 74,295,000.00 22.00
STANBIC IBTC BANK 2012
-
1,005,000.00
1,053,000.00 7,150,300.00 11.00
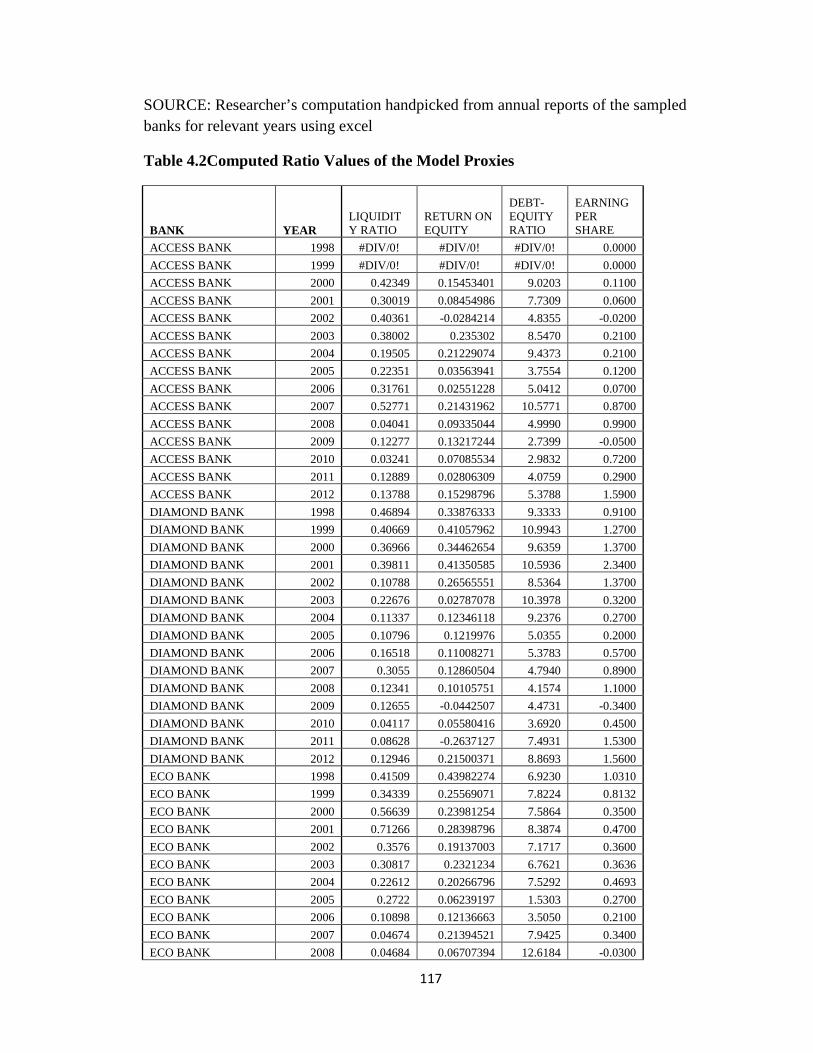
117
SOURCE: Researcher’s computation handpicked from annual reports of the sampled banks for relevant years using excel
Table 4.2Computed Ratio Values of the Model Proxies
BANK YEAR LIQUIDITY RATIO
RETURN ON EQUITY
DEBT-EQUITY RATIO
EARNING PER SHARE
ACCESS BANK 1998 #DIV/0! #DIV/0! #DIV/0! 0.0000
ACCESS BANK 1999 #DIV/0! #DIV/0! #DIV/0! 0.0000
ACCESS BANK 2000 0.42349 0.15453401 9.0203 0.1100
ACCESS BANK 2001 0.30019 0.08454986 7.7309 0.0600
ACCESS BANK 2002 0.40361 -0.0284214 4.8355 -0.0200
ACCESS BANK 2003 0.38002 0.235302 8.5470 0.2100
ACCESS BANK 2004 0.19505 0.21229074 9.4373 0.2100
ACCESS BANK 2005 0.22351 0.03563941 3.7554 0.1200
ACCESS BANK 2006 0.31761 0.02551228 5.0412 0.0700
ACCESS BANK 2007 0.52771 0.21431962 10.5771 0.8700
ACCESS BANK 2008 0.04041 0.09335044 4.9990 0.9900
ACCESS BANK 2009 0.12277 0.13217244 2.7399 -0.0500
ACCESS BANK 2010 0.03241 0.07085534 2.9832 0.7200
ACCESS BANK 2011 0.12889 0.02806309 4.0759 0.2900
ACCESS BANK 2012 0.13788 0.15298796 5.3788 1.5900
DIAMOND BANK 1998 0.46894 0.33876333 9.3333 0.9100
DIAMOND BANK 1999 0.40669 0.41057962 10.9943 1.2700
DIAMOND BANK 2000 0.36966 0.34462654 9.6359 1.3700
DIAMOND BANK 2001 0.39811 0.41350585 10.5936 2.3400
DIAMOND BANK 2002 0.10788 0.26565551 8.5364 1.3700
DIAMOND BANK 2003 0.22676 0.02787078 10.3978 0.3200
DIAMOND BANK 2004 0.11337 0.12346118 9.2376 0.2700
DIAMOND BANK 2005 0.10796 0.1219976 5.0355 0.2000
DIAMOND BANK 2006 0.16518 0.11008271 5.3783 0.5700
DIAMOND BANK 2007 0.3055 0.12860504 4.7940 0.8900
DIAMOND BANK 2008 0.12341 0.10105751 4.1574 1.1000
DIAMOND BANK 2009 0.12655 -0.0442507 4.4731 -0.3400
DIAMOND BANK 2010 0.04117 0.05580416 3.6920 0.4500
DIAMOND BANK 2011 0.08628 -0.2637127 7.4931 1.5300
DIAMOND BANK 2012 0.12946 0.21500371 8.8693 1.5600
ECO BANK 1998 0.41509 0.43982274 6.9230 1.0310
ECO BANK 1999 0.34339 0.25569071 7.8224 0.8132
ECO BANK 2000 0.56639 0.23981254 7.5864 0.3500
ECO BANK 2001 0.71266 0.28398796 8.3874 0.4700
ECO BANK 2002 0.3576 0.19137003 7.1717 0.3600
ECO BANK 2003 0.30817 0.2321234 6.7621 0.3636
ECO BANK 2004 0.22612 0.20266796 7.5292 0.4693
ECO BANK 2005 0.2722 0.06239197 1.5303 0.2700
ECO BANK 2006 0.10898 0.12136663 3.5050 0.2100
ECO BANK 2007 0.04674 0.21394521 7.9425 0.3400
ECO BANK 2008 0.04684 0.06707394 12.6184 -0.0300

118
ECO BANK 2009 0.03376 -0.0623929 3.8367 -0.3300
ECO BANK 2010 0.05116 0.02178418 5.1119 0.1200
ECO BANK 2011 0.08608 0.25668109 13.3979 0.6900
ECO BANK 2012 0.09586 0.05080454 7.6268 0.4200
FCMB 1998 #DIV/0! #DIV/0! #DIV/0! 0.0000
FCMB 1999 #DIV/0! #DIV/0! #DIV/0! 0.0000
FCMB 2000 0.59811 0.38477616 7.7448 0.0077
FCMB 2001 #DIV/0! #DIV/0! #DIV/0! 0.0000
FCMB 2002 0.42418 0.230838 13.9505 0.0300
FCMB 2003 0.47958 0.03420067 9.1094 0.0100
FCMB 2004 0.18982 0.09011753 7.6093 0.1700
FCMB 2005 0.055 0.11055586 6.1115 0.2500
FCMB 2006 0.09985 0.11291894 3.2368 0.3600
FCMB 2007 0.07252 0.18747401 7.4861 0.6100
FCMB 2008 0.02544 0.10384267 2.5209 1.2300
FCMB 2009 0.37864 0.00522428 2.5908 0.0600
FCMB 2010 0.15418 0.05645443 2.9510 0.4500
FCMB 2011 0.08747 -0.0940396 4.0685 -0.6800
FCMB 2012 0.15829 0.0959548 5.8020 0.6600
FIDELITY BANK 1998 0.47823 0.2244308 5.0797 0.0700
FIDELITY BANK 1999 0.4963 0.20830548 6.4703 0.0900
FIDELITY BANK 2000 0.37886 0.22516218 9.8579 0.2300
FIDELITY BANK 2001 0.51842 0.30807446 8.7775 0.2300
FIDELITY BANK 2002 0.37688 0.28155749 7.1646 0.3600
FIDELITY BANK 2003 0.30114 0.34065245 7.9516 0.3600
FIDELITY BANK 2004 0.22145 0.25957432 6.8281 0.3000
FIDELITY BANK 2005 0.20687 0.12719534 2.5947 0.1400
FIDELITY BANK 2006 0.12898 0.12354369 3.6875 0.1900
FIDELITY BANK 2007 0.10531 0.13979927 6.2973 0.2500
FIDELITY BANK 2008 0.07779 0.09558508 2.9239 0.4500
FIDELITY BANK 2009 0.06642 0.01775784 2.8977 0.0800
FIDELITY BANK 2010 0.07423 0.04334082 2.5555 0.2000
FIDELITY BANK 2011 0.1364 0.02868354 4.4236 0.5500
FIDELITY BANK 2012 0.15578 0.11101545 4.6632 0.6800
FIRST BANK 1998 #DIV/0! #DIV/0! #DIV/0! 0.0000
FIRST BANK 1999 0.60425 0.26028124 10.4533 2.8300
FIRST BANK 2000 0.76163 0.2907225 11.4356 3.2400
FIRST BANK 2001 0.74524 0.27356228 11.4554 2.8800
FIRST BANK 2002 0.7521 0.22420691 14.0085 1.9600
FIRST BANK 2003 0.77992 0.41209581 11.7979 4.0600
FIRST BANK 2004 0.07048 0.27600048 8.2178 1.1000
FIRST BANK 2005 0.0781 0.27160038 8.6408 1.2600
FIRST BANK 2006 0.09229 0.27043888 8.5963 1.4700
FIRST BANK 2007 0.07716 0.24425842 9.6089 1.7500
FIRST BANK 2008 0.10789 0.08966682 2.4294 0.9500
FIRST BANK 2009 0.04645 0.0040159 4.5827 1.4100
FIRST BANK 2010 0.04633 0.09427561 4.7442 0.0400
FIRST BANK 2011 0.07991 0.05056161 6.7600 0.9800
FIRST BANK 2012 0.10939 0.17242912 6.2602 1.4500
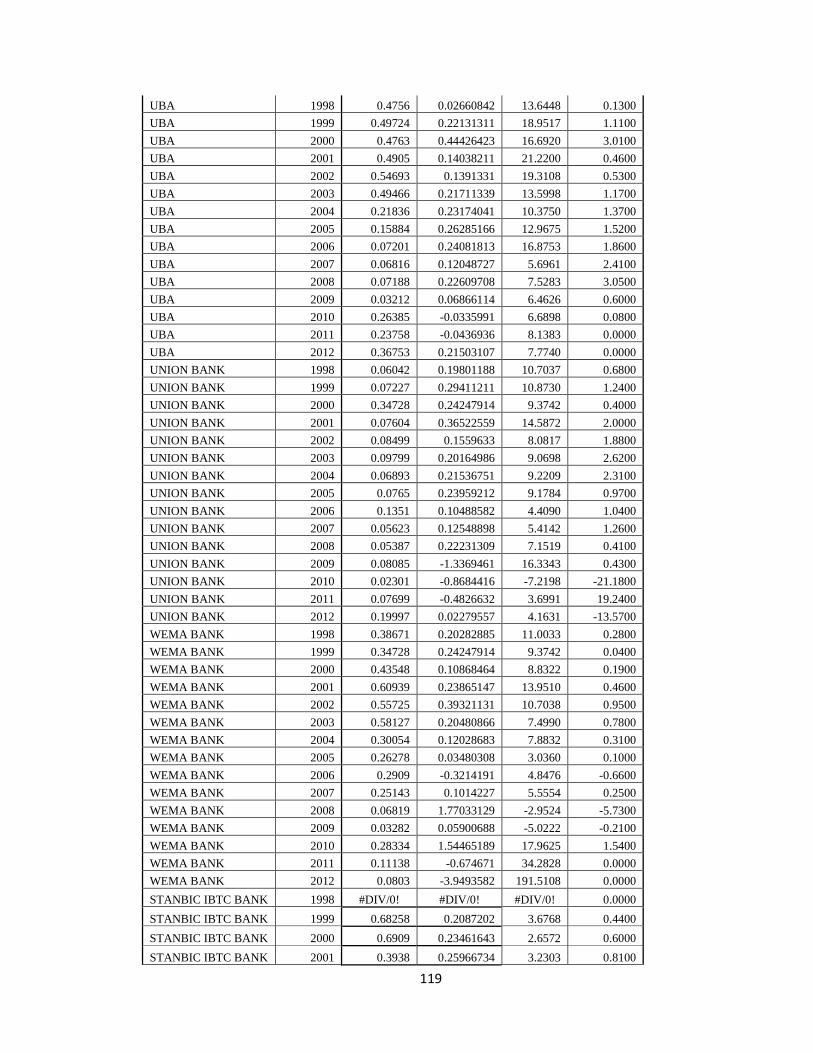
119
UBA 1998 0.4756 0.02660842 13.6448 0.1300
UBA 1999 0.49724 0.22131311 18.9517 1.1100
UBA 2000 0.4763 0.44426423 16.6920 3.0100
UBA 2001 0.4905 0.14038211 21.2200 0.4600
UBA 2002 0.54693 0.1391331 19.3108 0.5300
UBA 2003 0.49466 0.21711339 13.5998 1.1700
UBA 2004 0.21836 0.23174041 10.3750 1.3700
UBA 2005 0.15884 0.26285166 12.9675 1.5200
UBA 2006 0.07201 0.24081813 16.8753 1.8600
UBA 2007 0.06816 0.12048727 5.6961 2.4100
UBA 2008 0.07188 0.22609708 7.5283 3.0500
UBA 2009 0.03212 0.06866114 6.4626 0.6000
UBA 2010 0.26385 -0.0335991 6.6898 0.0800
UBA 2011 0.23758 -0.0436936 8.1383 0.0000
UBA 2012 0.36753 0.21503107 7.7740 0.0000
UNION BANK 1998 0.06042 0.19801188 10.7037 0.6800
UNION BANK 1999 0.07227 0.29411211 10.8730 1.2400
UNION BANK 2000 0.34728 0.24247914 9.3742 0.4000
UNION BANK 2001 0.07604 0.36522559 14.5872 2.0000
UNION BANK 2002 0.08499 0.1559633 8.0817 1.8800
UNION BANK 2003 0.09799 0.20164986 9.0698 2.6200
UNION BANK 2004 0.06893 0.21536751 9.2209 2.3100
UNION BANK 2005 0.0765 0.23959212 9.1784 0.9700
UNION BANK 2006 0.1351 0.10488582 4.4090 1.0400
UNION BANK 2007 0.05623 0.12548898 5.4142 1.2600
UNION BANK 2008 0.05387 0.22231309 7.1519 0.4100
UNION BANK 2009 0.08085 -1.3369461 16.3343 0.4300
UNION BANK 2010 0.02301 -0.8684416 -7.2198 -21.1800
UNION BANK 2011 0.07699 -0.4826632 3.6991 19.2400
UNION BANK 2012 0.19997 0.02279557 4.1631 -13.5700
WEMA BANK 1998 0.38671 0.20282885 11.0033 0.2800
WEMA BANK 1999 0.34728 0.24247914 9.3742 0.0400
WEMA BANK 2000 0.43548 0.10868464 8.8322 0.1900
WEMA BANK 2001 0.60939 0.23865147 13.9510 0.4600
WEMA BANK 2002 0.55725 0.39321131 10.7038 0.9500
WEMA BANK 2003 0.58127 0.20480866 7.4990 0.7800
WEMA BANK 2004 0.30054 0.12028683 7.8832 0.3100
WEMA BANK 2005 0.26278 0.03480308 3.0360 0.1000
WEMA BANK 2006 0.2909 -0.3214191 4.8476 -0.6600
WEMA BANK 2007 0.25143 0.1014227 5.5554 0.2500
WEMA BANK 2008 0.06819 1.77033129 -2.9524 -5.7300
WEMA BANK 2009 0.03282 0.05900688 -5.0222 -0.2100
WEMA BANK 2010 0.28334 1.54465189 17.9625 1.5400
WEMA BANK 2011 0.11138 -0.674671 34.2828 0.0000
WEMA BANK 2012 0.0803 -3.9493582 191.5108 0.0000
STANBIC IBTC BANK 1998 #DIV/0! #DIV/0! #DIV/0! 0.0000
STANBIC IBTC BANK 1999 0.68258 0.2087202 3.6768 0.4400
STANBIC IBTC BANK 2000 0.6909 0.23461643 2.6572 0.6000
STANBIC IBTC BANK 2001 0.3938 0.25966734 3.2303 0.8100
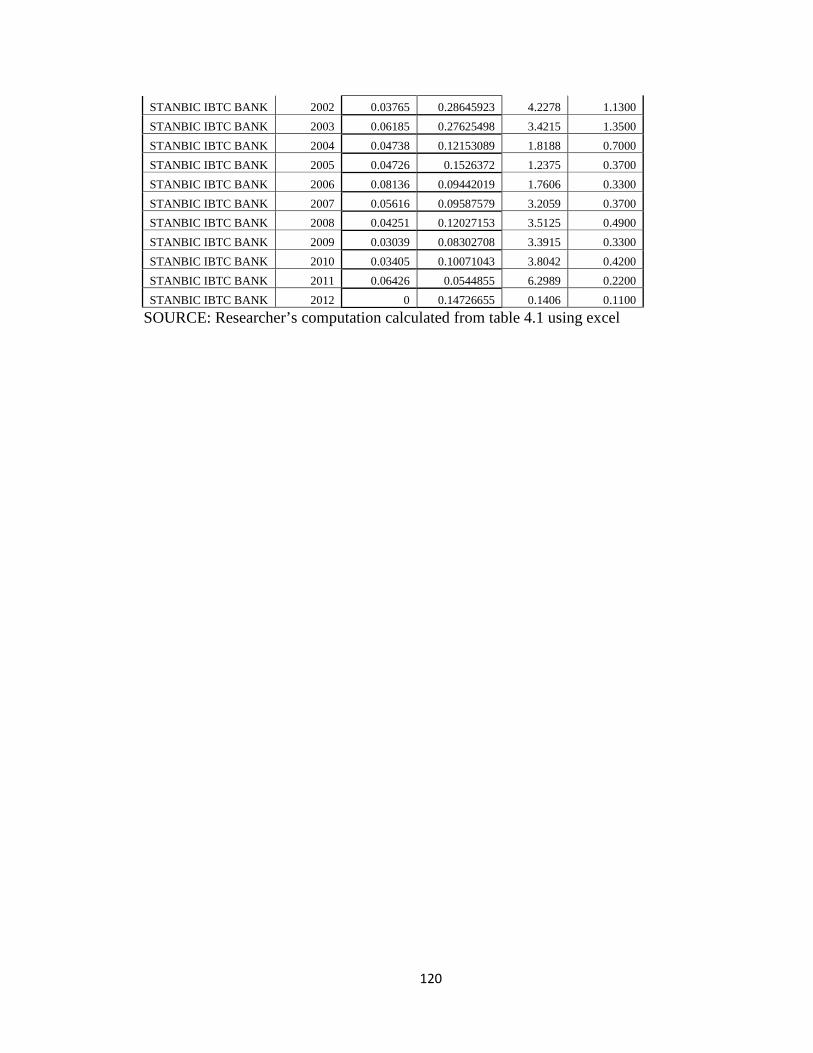
120
STANBIC IBTC BANK 2002 0.03765 0.28645923 4.2278 1.1300
STANBIC IBTC BANK 2003 0.06185 0.27625498 3.4215 1.3500
STANBIC IBTC BANK 2004 0.04738 0.12153089 1.8188 0.7000
STANBIC IBTC BANK 2005 0.04726 0.1526372 1.2375 0.3700
STANBIC IBTC BANK 2006 0.08136 0.09442019 1.7606 0.3300
STANBIC IBTC BANK 2007 0.05616 0.09587579 3.2059 0.3700
STANBIC IBTC BANK 2008 0.04251 0.12027153 3.5125 0.4900
STANBIC IBTC BANK 2009 0.03039 0.08302708 3.3915 0.3300
STANBIC IBTC BANK 2010 0.03405 0.10071043 3.8042 0.4200
STANBIC IBTC BANK 2011 0.06426 0.0544855 6.2989 0.2200
STANBIC IBTC BANK 2012 0 0.14726655 0.1406 0.1100
SOURCE: Researcher’s computation calculated from table 4.1 using excel
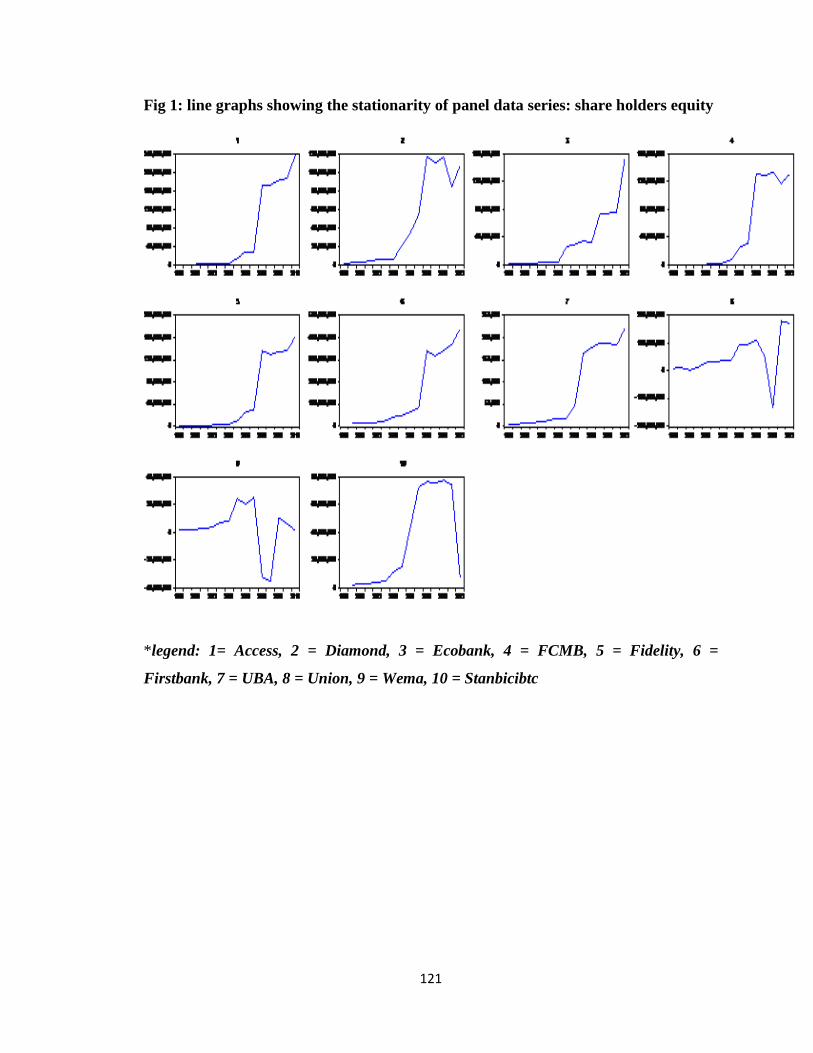
121
Fig 1: line graphs showing the stationarity of panel data series: share holders equity
* legend: 1= Access, 2 = Diamond, 3 = Ecobank, 4 = FCMB, 5 = Fidelity, 6 =
Firstbank, 7 = UBA, 8 = Union, 9 = Wema, 10 = Stanbicibtc
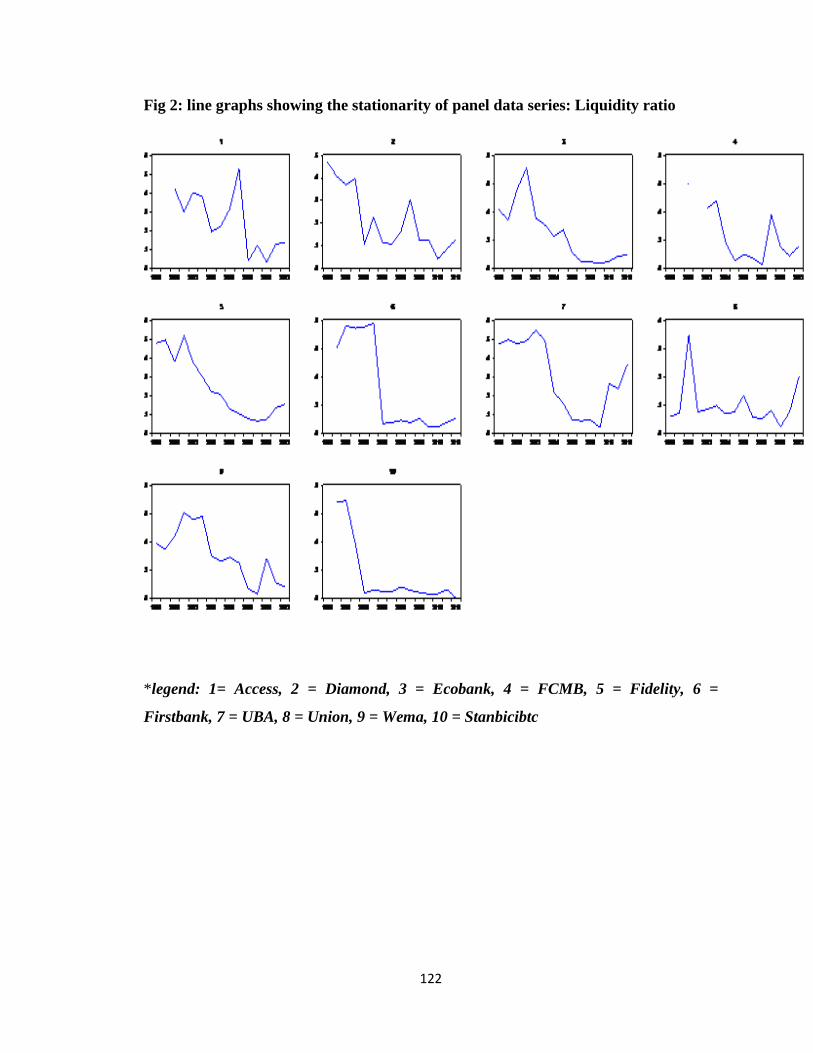
122
Fig 2: line graphs showing the stationarity of panel data series: Liquidity ratio
* legend: 1= Access, 2 = Diamond, 3 = Ecobank, 4 = FCMB, 5 = Fidelity, 6 =
Firstbank, 7 = UBA, 8 = Union, 9 = Wema, 10 = Stanbicibtc
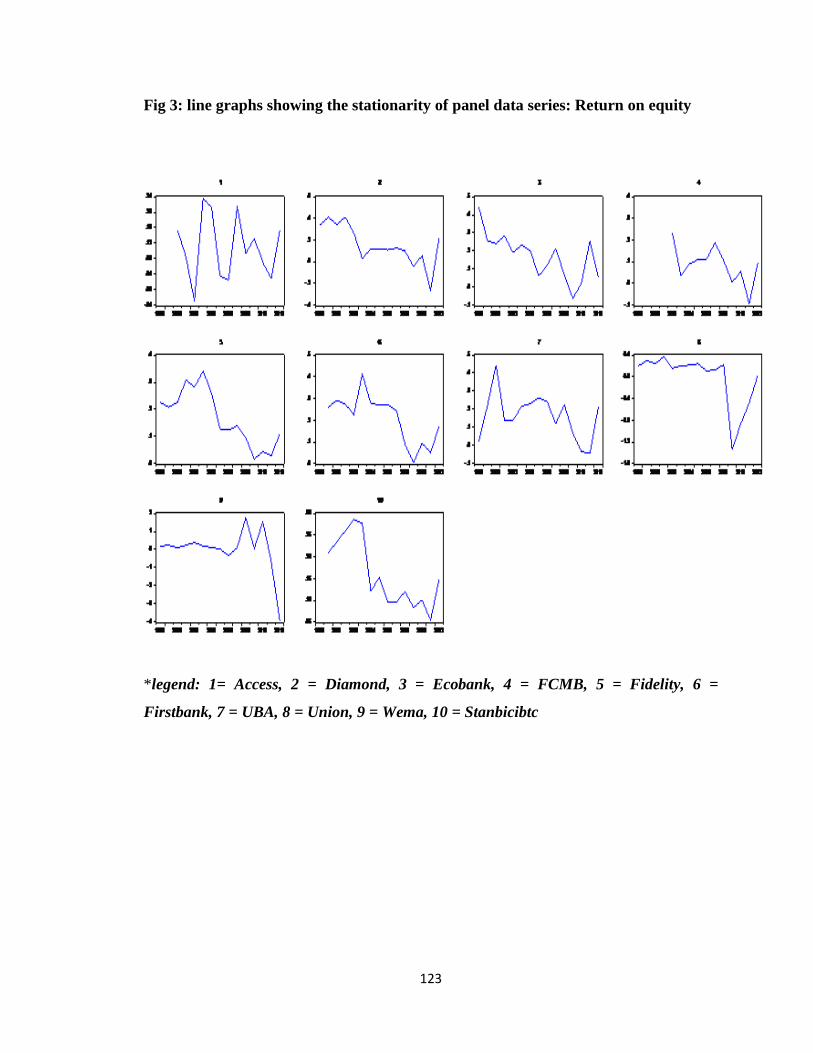
123
Fig 3: line graphs showing the stationarity of panel data series: Return on equity
* legend: 1= Access, 2 = Diamond, 3 = Ecobank, 4 = FCMB, 5 = Fidelity, 6 =
Firstbank, 7 = UBA, 8 = Union, 9 = Wema, 10 = Stanbicibtc

124
Fig 4: line graphs showing the stationarity of panel data series: Debt-equity ratio
* legend: 1= Access, 2 = Diamond, 3 = Ecobank, 4 = FCMB, 5 = Fidelity, 6 =
Firstbank, 7 = UBA, 8 = Union, 9 = Wema, 10 = Stanbicibtc
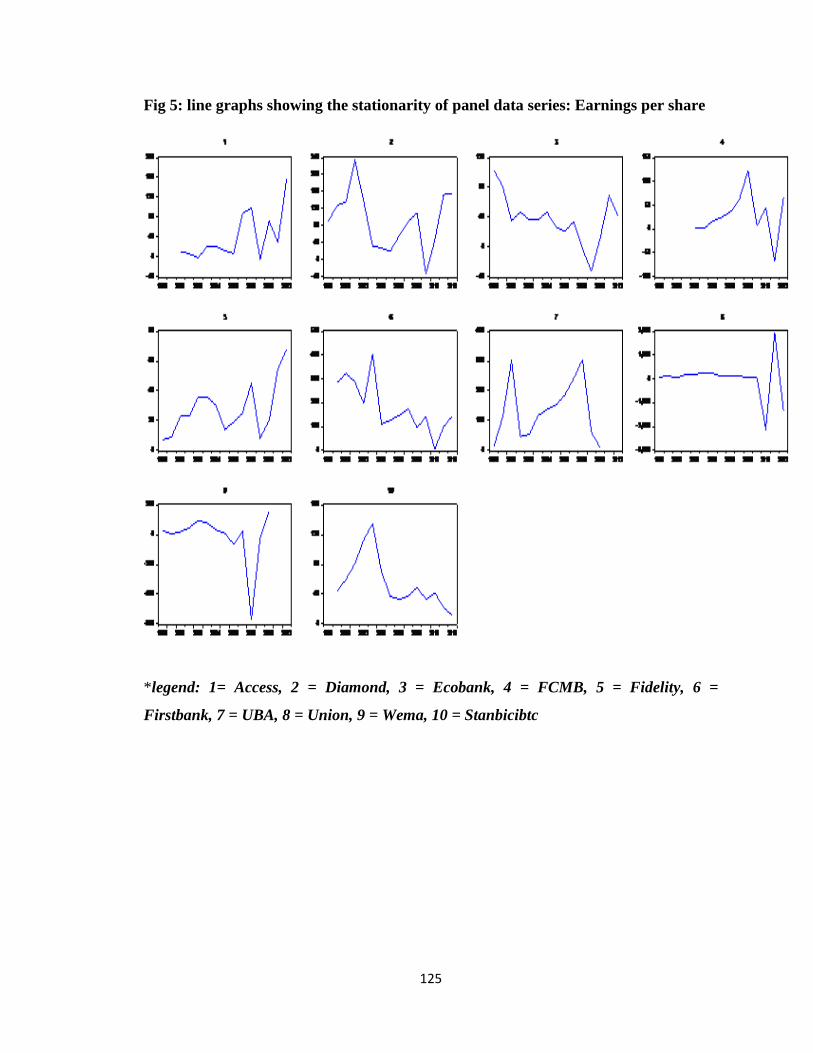
125
Fig 5: line graphs showing the stationarity of panel data series: Earnings per share
* legend: 1= Access, 2 = Diamond, 3 = Ecobank, 4 = FCMB, 5 = Fidelity, 6 =
Firstbank, 7 = UBA, 8 = Union, 9 = Wema, 10 = Stanbicibtc
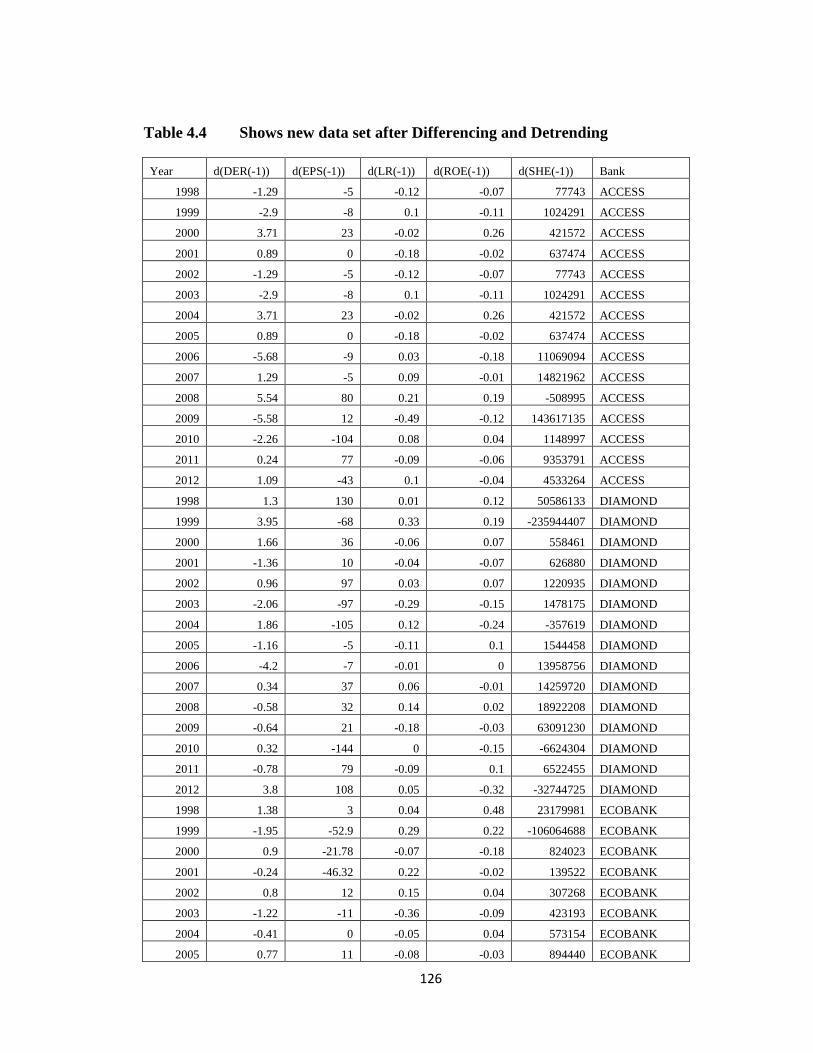
126
Table 4.4 Shows new data set after Differencing and Detrending
Year d(DER(-1)) d(EPS(-1)) d(LR(-1)) d(ROE(-1)) d(SHE(-1)) Bank
1998 -1.29 -5 -0.12 -0.07 77743 ACCESS
1999 -2.9 -8 0.1 -0.11 1024291 ACCESS
2000 3.71 23 -0.02 0.26 421572 ACCESS
2001 0.89 0 -0.18 -0.02 637474 ACCESS
2002 -1.29 -5 -0.12 -0.07 77743 ACCESS
2003 -2.9 -8 0.1 -0.11 1024291 ACCESS
2004 3.71 23 -0.02 0.26 421572 ACCESS
2005 0.89 0 -0.18 -0.02 637474 ACCESS
2006 -5.68 -9 0.03 -0.18 11069094 ACCESS
2007 1.29 -5 0.09 -0.01 14821962 ACCESS
2008 5.54 80 0.21 0.19 -508995 ACCESS
2009 -5.58 12 -0.49 -0.12 143617135 ACCESS
2010 -2.26 -104 0.08 0.04 1148997 ACCESS
2011 0.24 77 -0.09 -0.06 9353791 ACCESS
2012 1.09 -43 0.1 -0.04 4533264 ACCESS
1998 1.3 130 0.01 0.12 50586133 DIAMOND
1999 3.95 -68 0.33 0.19 -235944407 DIAMOND
2000 1.66 36 -0.06 0.07 558461 DIAMOND
2001 -1.36 10 -0.04 -0.07 626880 DIAMOND
2002 0.96 97 0.03 0.07 1220935 DIAMOND
2003 -2.06 -97 -0.29 -0.15 1478175 DIAMOND
2004 1.86 -105 0.12 -0.24 -357619 DIAMOND
2005 -1.16 -5 -0.11 0.1 1544458 DIAMOND
2006 -4.2 -7 -0.01 0 13958756 DIAMOND
2007 0.34 37 0.06 -0.01 14259720 DIAMOND
2008 -0.58 32 0.14 0.02 18922208 DIAMOND
2009 -0.64 21 -0.18 -0.03 63091230 DIAMOND
2010 0.32 -144 0 -0.15 -6624304 DIAMOND
2011 -0.78 79 -0.09 0.1 6522455 DIAMOND
2012 3.8 108 0.05 -0.32 -32744725 DIAMOND
1998 1.38 3 0.04 0.48 23179981 ECOBANK
1999 -1.95 -52.9 0.29 0.22 -106064688 ECOBANK
2000 0.9 -21.78 -0.07 -0.18 824023 ECOBANK
2001 -0.24 -46.32 0.22 -0.02 139522 ECOBANK
2002 0.8 12 0.15 0.04 307268 ECOBANK
2003 -1.22 -11 -0.36 -0.09 423193 ECOBANK
2004 -0.41 0 -0.05 0.04 573154 ECOBANK
2005 0.77 11 -0.08 -0.03 894440 ECOBANK

127
2006 -6 -20 0.05 -0.14 22323673 ECOBANK
2007 1.97 -6 -0.16 0.06 2584000 ECOBANK
2008 4.44 13 -0.06 0.09 5501000 ECOBANK
2009 4.68 -37 -0.06 -0.15 -3066000 ECOBANK
2010 -8.78 -30 -0.01 -0.13 41778000 ECOBANK
2011 1.28 45 0.02 0.08 786000 ECOBANK
2012 8.29 57 0.03 0.23 1042000 ECOBANK
1998 -5.77 -27 0.01 -0.21 78266000 FCMB
1999 -1.29 -5 -0.12 -0.07 77743 FCMB
2000 -2.9 -8 0.1 -0.11 1024291 FCMB
2001 3.71 23 -0.02 0.26 421572 FCMB
2002 0.89 0 -0.18 -0.02 637474 FCMB
2003 3.71 23 -0.02 0.26 421572 FCMB
2004 -4.84 -2 0.06 -0.2 500000 FCMB
2005 -1.5 16 -0.29 0.06 1257044 FCMB
2006 -1.5 8 -0.13 0.02 4459172 FCMB
2007 -2.87 11 0.04 0 17946791 FCMB
2008 4.25 25 -0.03 0.07 5805857 FCMB
2009 -4.97 62 -0.05 -0.08 101158609 FCMB
2010 0.07 -117 0.35 -0.1 -4000413 FCMB
2011 0.36 39 -0.22 0.05 5872844 FCMB
2012 1.12 -113 -0.07 -0.15 -16981140 FCMB
1998 1.73 134 0.07 0.19 13871949 FIDELITY
1999 -0.72 -59 0.32 0.13 -130111328 FIDELITY
2000 1.39 2 0.02 -0.02 52283 FIDELITY
2001 3.39 14 -0.12 0.02 90454 FIDELITY
2002 -1.08 0 0.14 0.08 378411 FIDELITY
2003 -1.61 13 -0.14 -0.03 614678 FIDELITY
2004 0.79 0 -0.08 0.06 600212 FIDELITY
2005 -1.12 -6 -0.08 -0.08 1004201 FIDELITY
2006 -4.23 -16 -0.01 -0.13 6203924 FIDELITY
2007 1.09 5 -0.08 0 15873445 FIDELITY
2008 2.61 6 -0.02 0.02 4160007 FIDELITY
2009 -3.37 20 -0.03 -0.04 106106988 FIDELITY
2010 -0.03 -37 -0.01 -0.08 -6523988 FIDELITY
2011 -0.34 12 0.01 0.03 5106000 FIDELITY
2012 1.87 35 0.06 -0.01 1904000 FIDELITY
1998 0.24 13 0.02 0.08 25105000 FIRSTBANK
1999 -1.29 -5 -0.12 -0.07 77743 FIRSTBANK
2000 -2.9 -8 0.1 -0.11 1024291 FIRSTBANK
2001 3.71 23 -0.02 0.26 421572 FIRSTBANK
2002 0.89 0 -0.18 -0.02 637474 FIRSTBANK
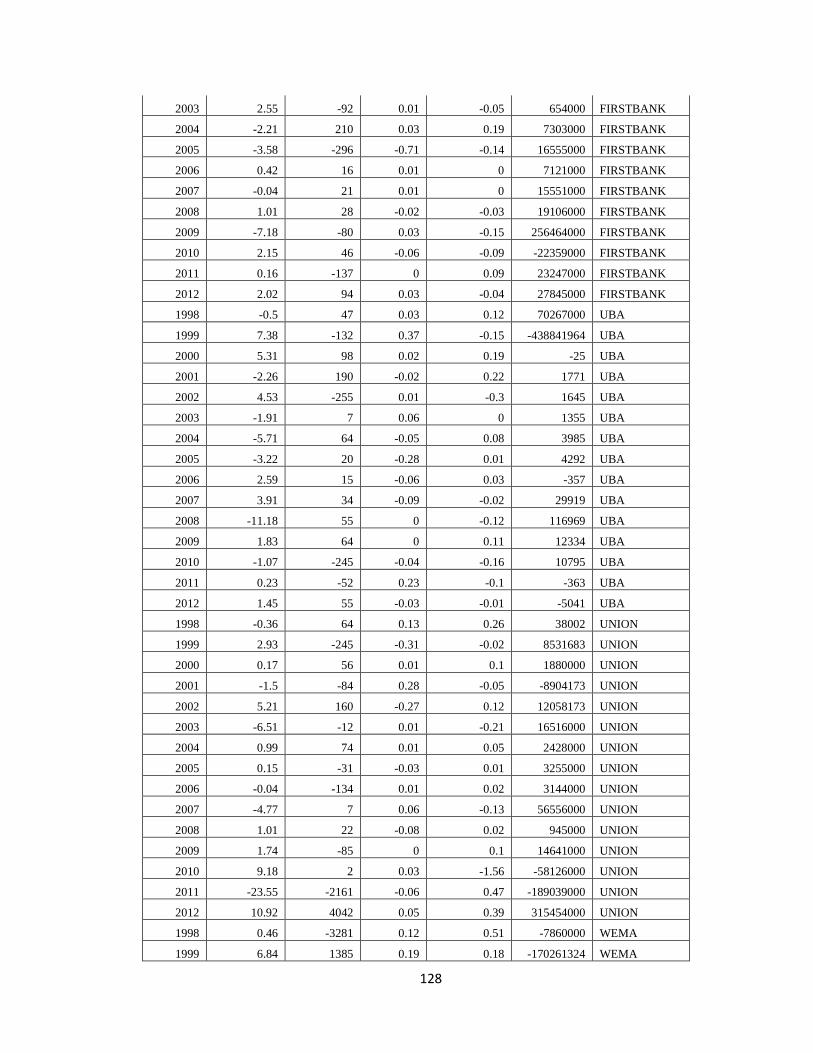
128
2003 2.55 -92 0.01 -0.05 654000 FIRSTBANK
2004 -2.21 210 0.03 0.19 7303000 FIRSTBANK
2005 -3.58 -296 -0.71 -0.14 16555000 FIRSTBANK
2006 0.42 16 0.01 0 7121000 FIRSTBANK
2007 -0.04 21 0.01 0 15551000 FIRSTBANK
2008 1.01 28 -0.02 -0.03 19106000 FIRSTBANK
2009 -7.18 -80 0.03 -0.15 256464000 FIRSTBANK
2010 2.15 46 -0.06 -0.09 -22359000 FIRSTBANK
2011 0.16 -137 0 0.09 23247000 FIRSTBANK
2012 2.02 94 0.03 -0.04 27845000 FIRSTBANK
1998 -0.5 47 0.03 0.12 70267000 UBA
1999 7.38 -132 0.37 -0.15 -438841964 UBA
2000 5.31 98 0.02 0.19 -25 UBA
2001 -2.26 190 -0.02 0.22 1771 UBA
2002 4.53 -255 0.01 -0.3 1645 UBA
2003 -1.91 7 0.06 0 1355 UBA
2004 -5.71 64 -0.05 0.08 3985 UBA
2005 -3.22 20 -0.28 0.01 4292 UBA
2006 2.59 15 -0.06 0.03 -357 UBA
2007 3.91 34 -0.09 -0.02 29919 UBA
2008 -11.18 55 0 -0.12 116969 UBA
2009 1.83 64 0 0.11 12334 UBA
2010 -1.07 -245 -0.04 -0.16 10795 UBA
2011 0.23 -52 0.23 -0.1 -363 UBA
2012 1.45 55 -0.03 -0.01 -5041 UBA
1998 -0.36 64 0.13 0.26 38002 UNION
1999 2.93 -245 -0.31 -0.02 8531683 UNION
2000 0.17 56 0.01 0.1 1880000 UNION
2001 -1.5 -84 0.28 -0.05 -8904173 UNION
2002 5.21 160 -0.27 0.12 12058173 UNION
2003 -6.51 -12 0.01 -0.21 16516000 UNION
2004 0.99 74 0.01 0.05 2428000 UNION
2005 0.15 -31 -0.03 0.01 3255000 UNION
2006 -0.04 -134 0.01 0.02 3144000 UNION
2007 -4.77 7 0.06 -0.13 56556000 UNION
2008 1.01 22 -0.08 0.02 945000 UNION
2009 1.74 -85 0 0.1 14641000 UNION
2010 9.18 2 0.03 -1.56 -58126000 UNION
2011 -23.55 -2161 -0.06 0.47 -189039000 UNION
2012 10.92 4042 0.05 0.39 315454000 UNION
1998 0.46 -3281 0.12 0.51 -7860000 WEMA
1999 6.84 1385 0.19 0.18 -170261324 WEMA

129
2000 -1.63 -24 -0.04 0.04 289151 WEMA
2001 -0.54 15 0.09 -0.13 586189 WEMA
2002 5.12 27 0.17 0.13 282046 WEMA
2003 -3.25 49 -0.05 0.15 1172057 WEMA
2004 -3.2 -17 0.02 -0.19 3447274 WEMA
2005 0.38 -47 -0.28 -0.08 824955 WEMA
2006 -4.85 -21 -0.04 -0.09 16218512 WEMA
2007 1.81 -76 0.03 -0.36 -3718819 WEMA
2008 0.71 91 -0.04 0.42 4642664 WEMA
2009 -8.51 -598 -0.18 1.67 -57797357 WEMA
2010 -2.07 552 -0.04 -1.71 -2884462 WEMA
2011 22.98 175 0.25 1.49 46011860 WEMA
2012 -1.29 -5 -0.12 -0.07 77743 WEMA
1998 -2.9 -8 0.1 -0.11 1024291 STANBIC IBTC
1999 3.71 23 -0.02 0.26 421572 STANBIC IBTC
2000 0.89 0 -0.18 -0.02 637474 STANBIC IBTC
2001 -1.02 16 0.01 0.03 439590 STANBIC IBTC
2002 0.57 21 -0.3 0.03 537218 STANBIC IBTC
2003 1 32 -0.36 0.03 827570 STANBIC IBTC
2004 -0.81 22 0.02 -0.01 949783 STANBIC IBTC
2005 -1.6 -65 -0.01 -0.15 6702825 STANBIC IBTC
2006 -0.58 -33 0 0.03 3860572 STANBIC IBTC
2007 0.52 -4 0.03 -0.06 28227900 STANBIC IBTC
2008 1.45 4 -0.03 0 28726421 STANBIC IBTC
2009 0.31 12 -0.01 0.02 4212918 STANBIC IBTC
2010 -0.12 -16 -0.01 -0.04 -1243651 STANBIC IBTC
2011 0.41 9 0 0.02 2186000 STANBIC IBTC
2012 2.49 -20 0.03 -0.05 -3264000 STANBIC IBTC
Augmented Dickey-Fuller Unit Root Test (after detrending and differencing)
ADF Test Statistic -13.35905 1% Critical Value* -4.0288
5% Critical Value -3.4437
10% Critical Value -3.1464
*MacKinnon critical values for rejection of hypothesis of a unit root.
Augmented Dickey-Fuller Test Equation
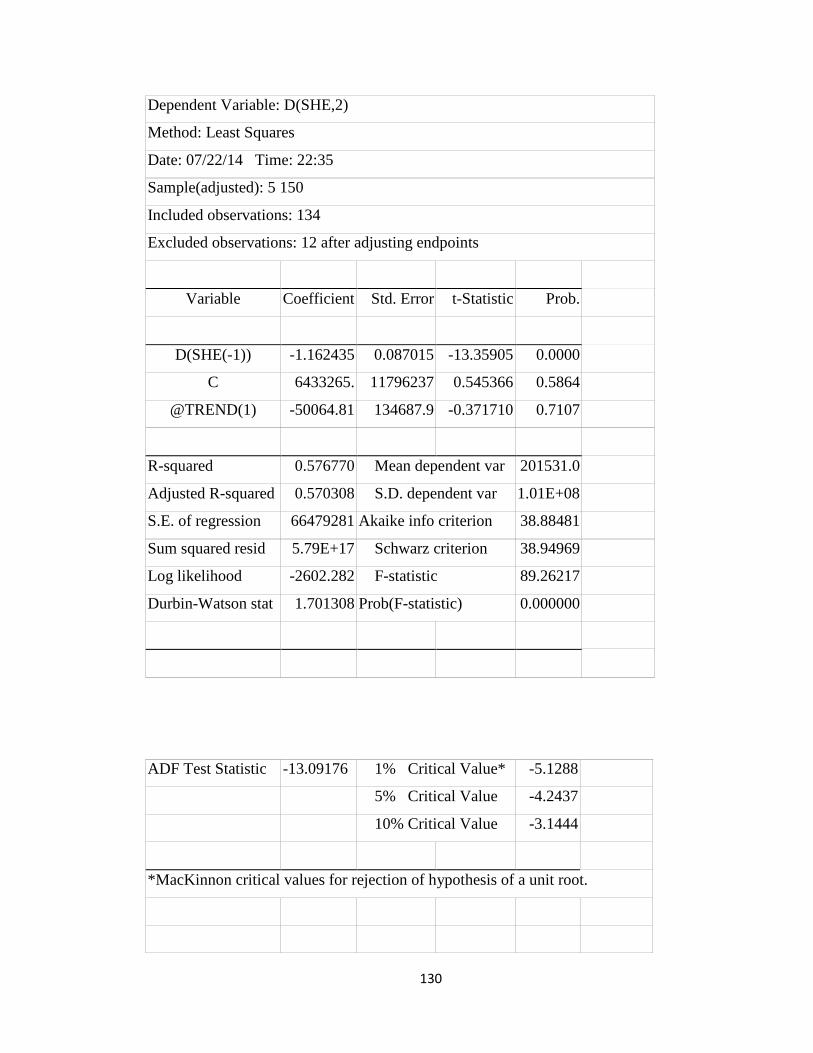
130
Dependent Variable: D(SHE,2)
Method: Least Squares
Date: 07/22/14 Time: 22:35
Sample(adjusted): 5 150
Included observations: 134
Excluded observations: 12 after adjusting endpoints
Variable Coefficient Std. Error t-Statistic Prob.
D(SHE(-1)) -1.162435 0.087015 -13.35905 0.0000
C 6433265. 11796237 0.545366 0.5864
@TREND(1) -50064.81 134687.9 -0.371710 0.7107
R-squared 0.576770 Mean dependent var 201531.0
Adjusted R-squared 0.570308 S.D. dependent var 1.01E+08
S.E. of regression 66479281 Akaike info criterion 38.88481
Sum squared resid 5.79E+17 Schwarz criterion 38.94969
Log likelihood -2602.282 F-statistic 89.26217
Durbin-Watson stat 1.701308 Prob(F-statistic) 0.000000
ADF Test Statistic -13.09176 1% Critical Value* -5.1288
5% Critical Value -4.2437
10% Critical Value -3.1444
*MacKinnon critical values for rejection of hypothesis of a unit root.

131
Augmented Dickey-Fuller Test Equation
Dependent Variable: D(LR,2)
Method: Least Squares
Date: 07/22/14 Time: 22:39
Sample(adjusted): 5 150
Included observations: 134
Excluded observations: 12 after adjusting endpoints
Variable Coefficient Std. Error t-Statistic Prob.
D(LR(-1)) -1.126151 0.086020 -13.09176 0.0000
C -0.003261 0.026734 -0.121986 0.9031
@TREND(1) -0.000164 0.000305 -0.537579 0.5918
R-squared 0.566836 Mean dependent var -
0.001224
Adjusted R-squared 0.560223 S.D. dependent var 0.227220
S.E. of regression 0.150683 Akaike info criterion -
0.925146
Sum squared resid 2.974394 Schwarz criterion -
0.860269
Log likelihood 64.98481 F-statistic 85.71292
Durbin-Watson stat 1.983132 Prob(F-statistic) 0.000000
ADF Test Statistic -10.03807 1% Critical Value* -3.0118
5% Critical Value -3.4674
10% Critical Value -3.3164
*MacKinnon critical values for rejection of hypothesis of a unit root.

132
Augmented Dickey-Fuller Test Equation
Dependent Variable: D(ROE,2)
Method: Least Squares
Date: 07/22/14 Time: 22:43
Sample(adjusted): 5 150
Included observations: 134
Excluded observations: 12 after adjusting endpoints
Variable Coefficient Std. Error t-Statistic Prob.
D(ROE(-1)) -1.097605 0.109344 -10.03807 0.0000
C 0.046106 0.082351 0.559865 0.5765
@TREND(1) -0.001032 0.000941 -1.097219 0.2746
R-squared 0.436368 Mean dependent var -
0.023098
Adjusted R-squared 0.427763 S.D. dependent var 0.613631
S.E. of regression 0.464190 Akaike info criterion 1.325087
Sum squared resid 28.22685 Schwarz criterion 1.389964
Log likelihood -85.78082 F-statistic 50.71052
Durbin-Watson stat 1.633950 Prob(F-statistic) 0.000000

133
ADF Test Statistic -5.167382 1% Critical Value* -4.4415
5% Critical Value -3.6330
10% Critical Value -3.2535
*MacKinnon critical values for rejection of hypothesis of a unit root.
Augmented Dickey-Fuller Test Equation
Dependent Variable: D(DER,2)
Method: Least Squares
Date: 07/22/14 Time: 22:44
Sample(adjusted): 5 150
Included observations: 134
Excluded observations: 12 after adjusting endpoints
Variable Coefficient Std. Error t-Statistic Prob.
D(DER(-1)) -0.266362 0.261856 -1.017207 0.3109
C -1.677685 2.473425 -0.678284 0.4988
@TREND(1) 0.037294 0.028289 1.318343 0.1897
R-squared 0.019458 Mean dependent var 1.132134
Adjusted R-squared 0.004488 S.D. dependent var 13.96122
S.E. of regression 13.92986 Akaike info criterion 8.128080
Sum squared resid 25419.36 Schwarz criterion 8.192957
Log likelihood -541.5813 F-statistic 1.299798
Durbin-Watson stat 1.826268 Prob(F-statistic) 0.000000
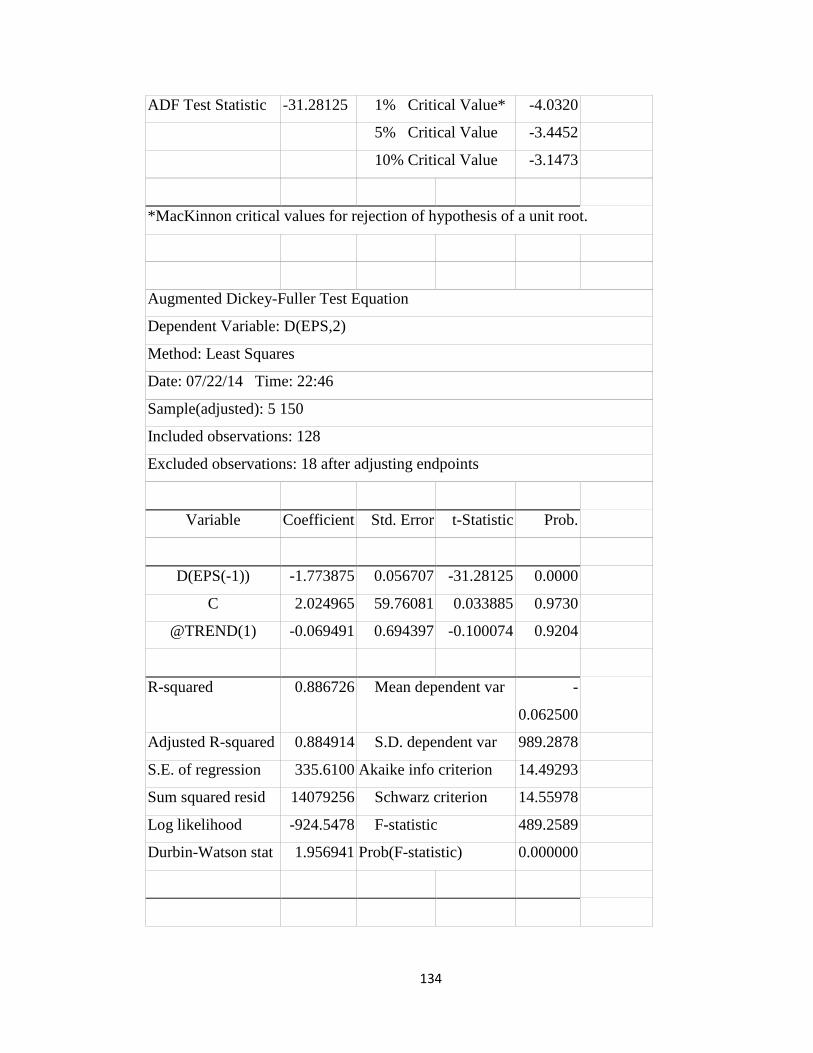
134
ADF Test Statistic -31.28125 1% Critical Value* -4.0320
5% Critical Value -3.4452
10% Critical Value -3.1473
*MacKinnon critical values for rejection of hypothesis of a unit root.
Augmented Dickey-Fuller Test Equation
Dependent Variable: D(EPS,2)
Method: Least Squares
Date: 07/22/14 Time: 22:46
Sample(adjusted): 5 150
Included observations: 128
Excluded observations: 18 after adjusting endpoints
Variable Coefficient Std. Error t-Statistic Prob.
D(EPS(-1)) -1.773875 0.056707 -31.28125 0.0000
C 2.024965 59.76081 0.033885 0.9730
@TREND(1) -0.069491 0.694397 -0.100074 0.9204
R-squared 0.886726 Mean dependent var -
0.062500
Adjusted R-squared 0.884914 S.D. dependent var 989.2878
S.E. of regression 335.6100 Akaike info criterion 14.49293
Sum squared resid 14079256 Schwarz criterion 14.55978
Log likelihood -924.5478 F-statistic 489.2589
Durbin-Watson stat 1.956941 Prob(F-statistic) 0.000000
135
Bibliography
Access Bank, (2012). Annual Report for the year ended 30 June, 2012
Access Bank, (2011). Annual Report for the year ended 30 June, 2011
Access Bank, (2010). Annual Report for the year ended 30 June, 2010
Access Bank, (2009). Annual Report for the year ended 30 June, 2009
Access Bank, (2008). Annual Report for the year ended 30 June, 2008
Access Bank, (2007). Annual Report for the year ended 30 June, 2007
Access Bank, (2006). Annual Report for the year ended 30 June, 2006
Access Bank, (2005). Annual Report for the year ended 30 June, 2005
Access Bank, (2004). Annual Report for the year ended 30 June, 2004
Access Bank, (2003). Annual Report for the year ended 30 June, 2003
Access Bank, (2002). Annual Report for the year ended 30 June, 2002
Access Bank, (2001). Annual Report for the year ended 30 June, 2001
Access Bank, (2000). Annual Report for the year ended 30 June, 2000
Ajayi, M. (2005).Banking sector reforms and bank consolidation: conceptual framework. In: Banking sector reforms and bank consolidation in Nigeria.CBN bullion, Vol. 29, No. 3.April/June.
Ahmed, M. (1989).Mergers and Acquisition as Alternative Growth Strategy to Nigerian Firms under SAP.Nigeria Institute of Management Seminar, Lagos.
Anaeto, Emeka. (1998, November 23). Counting the Gains of Corporate Restructuring. Business Times, P. 41.
Anard J. &singh. H. (1997).“Asset redeployment, acquisition and corporate strategies in declining industries” Strategic Management Journal.Vol. 23. pp. 119-134.
Ansoff, H. Igor et al (1976).“From Strategic Planning to Strategic Management” Hiley, New York.
Adesida, S., (2008).‘Stanbic, IBTC Chartered set to unveil new logo’. Daily Sun Online, [internet]. 31 March. Available at: http://www.sunnewsonline.com/webpages/features/moneymarket/2008/mar/3/ monymarket-31-03-2008-003.htm [accessed 2 June 2013].

136
Adesida, S., (2008b).‘UBA has acquired 5 failed banks, 38,500 accounts and N7.9b private deposits ––NDIC MD’. Daily Sun Online, [internet]. 29 March. Available at: http://www.sunnewsonline.com/webpages/features/enterprise/2008/mar/29/enterprise-29-03-2008-002.htm [accessed: 17 June 2013].
Agbaje, O., (2008). ‘The Banking industry in 2008’.Business Day Online. [internet]. 19 February. Available at: http://www.businessdayonline.com/analysis/backpage/4569.html [accessed 2 June 2013].
Agusto & Co., 1996. ‘Exchange Rate’. Banking Industry Survey .
Akhavein, J.D., Berger, A.N., and Humphrey, D.B., (1997). ‘The effects of mega- mergers on efficiency and prices: Evidence from a bank profit function’, Review of Industrial Organization, 12, pp. 95-139.
Alashi, S.O., (2002). ‘Banking supervision under West African Monetary Zone’.CentralBank of Nigeria.[Online]. Available at: http://www.cenbank.org/OUT/PUBLICATIONS/EFR/RD/2002/EFRVOL40-4-5.PDF [accessed 12 June 2013].
Amihud Y., & Baruch L., (1981).‘Risk reduction as a managerial motive for conglomerate mergers’, Bell Journal of Economics, 12, 605–617.
Angwin, D., (2001). ‘Mergers and acquisitions across European borders: National perspectives on pre-acquisition due diligence and use of professional advisers’, Journal of World Business, 36(1), pp. 32-57.
Atkearney., (2005). ‘Rising to the growth challenge’.A.T. Kearney Inc. [Online]. Available at: http://www.atkearney.com/shared_res/pdf/OGI_2005_S.pdf [accessed 18 June 2013]
Avkiran, N., (1999). ‘The evidence on efficiency gains: the role of mergers and the benefits to the public’, Journal of Banking and Finance, 23, pp. 991–1013.
Barney, J., (1998). ‘Returns to bidding firms in mergers and acquisitions: Reconsidering the relatedness hypothesis’, Strategic Management Journal, 9 (Special Issue), pp. 71-78.
Barney, J., (1991). ‘Firm resources and sustained competitive advantage’ , Journal of Management, 17(1), pp. 99-120.
Beatty, R., A. Santomero, and M. Smirlock, Bank Merger Premiums: Analysis and Evidence, Monographs in Finance and Economics , Salomon Brothers Center, New York University, 1988.
Berndt, Ernst R. (1991). Practice of Econometrics: Classic and Contemporary. Boston, Mass.: Addison-Wesley.Econometric Software, Inc. 2001. “LIMDEP, Version 8.0.” Plainview. From New York.

137
Berger, A. N., (1998). ‘The efficiency effects of bank mergers and acquisitions: A preliminary look at the 1990s data’, in Y. Amihud, and G. miller (ed.), Bank Mergers and Acquisitions, Boston, Kluwer Academic Publishers, pp. 79-111.
Berger, A.N., and Humphrey, D.B., (1992). ‘Megamergers in banking and the use of cost efficiency as an antitrust defense’, The Antitrust Bulletin, 33, pp. 541-600
Bichi, K., (1996). ‘The genesis of banks distress’, Credit News Magazine, 7(1&2), February March, pp. 28 – 29.
Birkinshaw, J., Bresman, H., and Hakanson, L., (2000). ‘Managing the post-acquisition integration process: How the human integration and task integration process interact to foster value creation’, Journal of Management Studies , 37(3), pp. 395-425.
Bliss, R.T., & Rosen, R.J., (2001). ‘CEO compensation and bank mergers’, Journal of Financial Economics, 61, pp. 107-138.
Buono, A. F., (2003). ‘SEAM-less post-merger integration strategies: A cause for Concern’, Journal of Organizational Change Management , 16(1), pp. 90-98.
Business Wire, (2008).Organic Growth in Domestic Markets Key to Bank Profitability .[Online]. Availableat: http://findarticles.com/p/articles/mi_m0EIN/is_2008_March_12/ai_n24387311 [accessed: 18 June, 2013].
Berger,A.N et al (1999). Journal of Banking & Finance, Vol. 23 pp. 135-194. Elsevier, Netherlands
Barney J. (1986). Strategic Factor Markets; Expectations, Luck and Business Strategy” Management Science, Vol. 42, pp 1231-1241.
Cartwright, S., & Cooper, C., (1992).Managing Mergers and Strategic Alliances: Integrating People and Cultures ., Oxford, Elsevier.
Cashcraft, (2008).‘Security Analysis – Historical’.Cashcraft Asset Management Limited [Online]. Available at: http://www.cashcraft.com/Secanalysis.asp [accessed 18 July 2013].
Casu, B., Girardone, C., and Molyneux, P., (2006). Introduction to Banking, Essex:Pearson Education Limited.
CBN, (2008). ‘Indigenous Banking in Nigeria’, Central Bank of Nigeria. [Online] . Available at: http://www.cenbank.org/documents/gpagedocs.asp [accessed 22 May 2013].
CIBN, (2008).‘Bank Consolidation – History Summary’.The Chartered Institute of Bankers of Nigeria. [Online]. Available at: http://www.cibng.org/News/New%20Folder/Bank%20Consolidation.htm [accessed 25 May 2008].
138
Christopher Dougherty (2010). “Introduction to Econometrics” 3rd Edition
Chuke Nwude (2004). ‘Basic Principles of Financial Management’ A First Course, Second Edition .University of Nigeria, Enugu. pp 269-343
Coffee, J.C., (1988).‘Shareholders versus Managers: The strain in the corporate web’, in J.C. Coffe, L. Lowestein & S. Rose-Ackerman (ed.), Knights, Raiders and Targets: he Impact of the Hostile takeover , Oxford, Oxford University Press, 1988, pp. 77-134.
Cossey, B., (1991). ‘Systems assessment in acquired subsidiaries’, Accountancy, 107(1169), pp.98-99.
Coyle, B., (2000). Mergers &Acquisitions , UK, CIB Publishing.
Cuesta, R.A. & Orea, L., (2002).‘Mergers and technical efficiency in Spanish savings banks: A stochastic distance function approach’, Journal of Banking and Finance, 26, pp. 2231-2247.
Danjuma, N., (1993). The Bankers’ Liability , Ibadan, African University Press.
Datta, D.K., (1991). ‘Organisational fit and acquisition performance: Effects of post acquisition integration’, Strategic Management Journal, 12, pp. 281-297.
Datta, D.K., Pinches, G.E., and Narayanan, V.K., (1992). ‘Factors influencing wealth creation from Mergers and Acquisitions: A meta-analysis’, Strategic Management Journal, 13, pp.67-84.
Daruvala, T., &Yulinsky, C., (2001).‘The journey to organic retail banking growth’. McKinsey & Company. [Online] . Available at: http://fs.mckinsey.com/Display.aspx?id=91e2c951-a9fb-a348-f785e6f7314c [accessed 18 June 2013].
Denis, D.K., & McConnell, J.J., (2003). ‘International Corporate Governance’, in K. Keasey, S. Thompson, & M. Wright (ed.), Corporate Governance: Accountability, Enterprise and International comparisons , Chichester-West Sussex, John Wiley & Sons Ltd, 2005, pp. 251-283.
Denrell, J., Fang, C., &Winter, S.G. (2003). ‘The economics of strategic opportunity, Strategic Management Journal , 24(10), pp. 977-990.
Diamond Bank, (2012). Annual Report for the year ended 30 June, 2012
Diamond Bank, (2011). Annual Report for the year ended 30 June, 2011
Diamond Bank, (2010). Annual Report for the year ended 30 June, 2010
Diamond Bank, (2009). Annual Report for the year ended 30 June, 2009

139
Diamond Bank, (2008). Annual Report for the year ended 30 June, 2008
Diamond Bank, (2007). Annual Report for the year ended 30 June, 2007
Diamond Bank, (2006). Annual Report for the year ended 30 June, 2006
Diamond Bank, (2005). Annual Report for the year ended 30 June, 2005
Diamond Bank, (2004). Annual Report for the year ended 30 June, 2004
Diamond Bank, (2003). Annual Report for the year ended 30 June, 2003
Diamond Bank, (2002). Annual Report for the year ended 30 June, 2002
Diamond Bank, (2001). Annual Report for the year ended 30 June, 2001
Diamond Bank, (2000). Annual Report for the year ended 30 June, 2000
Diamond Bank, (1999). Annual Report for the year ended 30 June, 1999
Diamond Bank, (1998). Annual Report for the year ended 30 June, 1998
Dierickx, I., &Cool, K., (1989). ‘Asset stock accumulation and sustainability of competitive advantage’, Management Science , 35(12), pp. 1504 – 1511.
Ebeid F. J. (1976).“Tender Offers; Characteristics Affecting their success” Mergers andAcquisitions.
Eco Bank, (2012). Annual Report for the year ended 30 June, 2012
Eco Bank, (2011). Annual Report for the year ended 30 June, 2011
Eco Bank, (2010). Annual Report for the year ended 30 June, 2010
Eco Bank, (2009). Annual Report for the year ended 30 June, 2009
Eco Bank, (2008). Annual Report for the year ended 30 June, 2008
Eco Bank, (2007). Annual Report for the year ended 30 June, 2007
Eco Bank, (2006). Annual Report for the year ended 30 June, 2006
Eco Bank, (2005). Annual Report for the year ended 30 June, 2005
Eco Bank, (2004). Annual Report for the year ended 30 June, 2004
Eco Bank, (2003). Annual Report for the year ended 30 June, 2003
Eco Bank, (2002). Annual Report for the year ended 30 June, 2002
140
Eco Bank, (2001). Annual Report for the year ended 30 June, 2001
Eco Bank, (2000). Annual Report for the year ended 30 June, 2000
Eco Bank, (1999). Annual Report for the year ended 30 June, 1999
Eco Bank, (1998). Annual Report for the year ended 30 June, 1998
Emily Blumenthal (2010). “Introduction to SPSS 16.0.”University of Washington, Seattle, WA 98195.From USA
Ezikpe, J. N. (1993). Corporate Responsiveness to Structural Changes: Lectures and Proceedings of Bank Directors Seminar. Lagos: Financial Institution Training Centre, pp. 36 – 58.
Ebhodaghe, J., (1995). ‘Causes and environment effects of bank failure in Nigeria’, NDIC Quarterly , Vol. 6, September.
Emefiele, G.I., (2008). Why Zenith Bank opted for organic growth instead of merger and acquisition.[Personal conversation]. (27 March 2013).
Emmanuel, U.G., (2008). Why Zenith Bank opted for organic growth instead of merger and acquisition. [Personal conversation]. (27 March 2013).
Ensico, I. M. T., &Garcia J. B., (1996).‘Mergers and acquisitions trends in Europe’, International Advances in Economic Research, Vol. 2(3), pp. 279-286.
Euromoney, (2006). ‘Nigeria benefits from banking mergers and recapitalizations’. Euro money Vol. 37 (444), pp. 1-9.
FCMB, (2012).Annual Report for the year ended 30 June, 2012
FCMB, (2011).Annual Report for the year ended 30 June, 2011
FCMB, (2010).Annual Report for the year ended 30 June, 2010
FCMB, (2009).Annual Report for the year ended 30 June, 2009
FCMB, (2008).Annual Report for the year ended 30 June, 2008
FCMB, (2007).Annual Report for the year ended 30 June, 2007
FCMB, (2006).Annual Report for the year ended 30 June, 2006
FCMB, (2005).Annual Report for the year ended 30 June, 2005
FCMB, (2004).Annual Report for the year ended 30 June, 2004
FCMB, (2003).Annual Report for the year ended 30 June, 2003

141
FCMB, (2002).Annual Report for the year ended 30 June, 2002
FCMB, (2000).Annual Report for the year ended 30 June, 2000
Fidelity Bank, (2012). Annual Report for the year ended 30 June, 2012
Fidelity Bank, (2011). Annual Report for the year ended 30 June, 2011
Fidelity Bank, (2010). Annual Report for the year ended 30 June, 2010
Fidelity Bank, (2009). Annual Report for the year ended 30 June, 2009
Fidelity Bank, (2008). Annual Report for the year ended 30 June, 2008
Fidelity Bank, (2007). Annual Report for the year ended 30 June, 2007
Fidelity Bank, (2006). Annual Report for the year ended 30 June, 2006
Fidelity Bank, (2005). Annual Report for the year ended 30 June, 2005
Fidelity Bank, (2004). Annual Report for the year ended 30 June, 2004
Fidelity Bank, (2003). Annual Report for the year ended 30 June, 2003
Fidelity Bank, (2002). Annual Report for the year ended 30 June, 2002
Fidelity Bank, (2001). Annual Report for the year ended 30 June, 2001
Fidelity Bank, (2000). Annual Report for the year ended 30 June, 2000
Fidelity Bank, (1999). Annual Report for the year ended 30 June, 1999
Fidelity Bank, (1998). Annual Report for the year ended 30 June, 1998
First Bank, (2012).Annual Report for the year ended 30 June, 2012
First Bank, (2011).Annual Report for the year ended 30 June, 2011
First Bank, (2010).Annual Report for the year ended 30 June, 2010
First Bank, (2009).Annual Report for the year ended 30 June, 2009
First Bank, (2008).Annual Report for the year ended 30 June, 2008
First Bank, (2007).Annual Report for the year ended 30 June, 2007
First Bank, (2006).Annual Report for the year ended 30 June, 2006
First Bank, (2005).Annual Report for the year ended 30 June, 2005
142
First Bank, (2004).Annual Report for the year ended 30 June, 2004
First Bank, (2003).Annual Report for the year ended 30 June, 2003
First Bank, (2002).Annual Report for the year ended 30 June, 2002
First Bank, (2001).Annual Report for the year ended 30 June, 2001
First Bank, (2000).Annual Report for the year ended 30 June, 2000
First Bank, (1999).Annual Report for the year ended 30 June, 1999
Fitzroy, F.R., Zoltan, J.A., & Gerlowski, D.A., (1998). Management and Economics of Organisation, Essex, Pearson Education Limited.
Fisher, J.K., (200?). ‘Mergers and Acquisitions: Strategic perspectives’. Dartmouth Research and Consulting. [online]. Available at: http://www.dartmouth research.com/merg_acq_PR.html[accessed 11 June 2013].
Flanagan, D. J., & O’Shaughnessy, K. C., (2003). ‘Core-related acquisitions, multiple bidders and tender offer premiums’, Journal of Business Research , 56, pp. 573-585.
Flyvbjerg, B., (2004). ‘Five misunderstandings about case-study research’, in C. Seale,
Focarelli, D., Panetta, F., and Salleo, C., (2002).‘Why do banks merge?’ Journal of Money,Credit and Banking, 34, pp. 1047-1066.
Ford, J., & Harding, N., (2003). ‘Invoking Satan or the Ethics of the employment contract’, Journal of Management Studies , 40(5), pp. 1131-1149.
Gujarati D.N. and Porter D.C. (2009).Basic Econometrics, 5thed: McGraw-Hill companies inc.New York.
Gujarati, D.N. (1995), Basic Econometrics, New York: McGraw-Hill Inc.
Gujarati, D.N (2004), Basic Econometrics, New Delhi: Tata McGraw-Hill
Gill James O, (1992), ‘How to understand financial statement’ London Kogan
Gaughan,P.A(1999). Mergers, Acquisitions and Corporate Restructuring, second edition, John Wiley and Sons,. New York
Gaughan,P.A (1999). Mergers, Acquisitions and Corporate Restructuring, second edition, John Wiley and Sons,. New York
Glueck William (1980). “Business Policy and Strategic Management” Mcgraw Hill
Goorey,G (1999). “Merger disruption”, in Global Finance ,New York.
143
Gadiesh, O., Ormiston, C., and Rovit, S., (2003). ‘Achieving an M&AS’s strategic goals at maximum speed for maximum value’, Strategy and Leadership , 31 (3), pp. 35-41.
Gaughan, P.A., (2007). Mergers, Acquisitions, and Corporate Restructurings . 4th ed. NewJersey: John Wiley & Sons, Inc.
Gaughan,P.A (1999). Mergers, Acquisitions and Corporate Restructuring, second edition, John Wiley and Sons. New York
Glueck William (1980). “Business Policy and Strategic Management”Mcgraw Hill
Goorey,G(1999).“Merger disruption”, in Global Finance. New York.
Gaughan, P., (1999). Mergers, Acquisitions, and Corporate Restructurings, 2nd ed. New Jersey, John Wiley & Sons Inc.
Ghosh, A., (2001). ‘Does operating performance really improve following corporate acquisitions?’ Journal of Corporate Finance, 7, pp. 151-178.
Goold, M., & Luchs K., (1993).‘Why diversify? Four decades of management thinking’ , Academy of Management Executive , 7(3), pp. 7 - 25
G. Gobo, J.F. Gubrium, & D. Silverman (ed.), Qualitative Research Practice, London, Sage, pp. 390 – 404.
Hadlock, C., Houston, J.F., &Ryngaert, M., (1999).‘The role of managerial incentives in bank acquisitions’, Journal of Banking and Finance, 23, pp. 221-249.
Harding, D., & Rovit, S., (2004).‘Building deals on bedrock’, Harvard Business Review, 82(9), pp. 121-128.
Healy, P.M., Palepu, K.G., & Ruback, R.S., (1992).‘Does corporate performance improve after mergers?’ Journal of Financial Economics, 31, pp. 135-175.
Henderson, J.C. & Venkatraman, N., (1993).‘Strategic alignment: Leveraging information technology for transforming organisations’, IBM Systems Journal, 32(1), pp. 4 – 16.
HighBeam, (2008). ‘Banks more likely to achieve organic growth with a formal plan, study says’. HighBeam Research. [Online]. Available at: http://www.highbeam.com/doc/1G1 178187798.html [accessed 18 June 2013].
Hirtle, B., (1991). ‘Factors affecting the competitiveness of internationally active financial institutions’, Federal Reserve Bank of New York Quarterly Review, Spring, pp. 38 51.
144
Houston, J.F., James, C.M., & Ryngaert, M., (2001).‘Where do merger gains come from? Bank mergers from the perspective of insiders and outsiders’, Journal of Financial Economics, 60, pp. 285-331.
Hanweck ,G.A& Shull,B (1999). “The bank merger movement: Efficiency, stability and competitive policy concerns”, in Antitrust Bulletin, New York.
Hosono, K; Sakai, K. & Tsuru, K. (2007).‘Consolidation of Banks in Japan; Causes and Consequences’. National Bureau of Economic Research (NBER) Working Paper Series, No. 13399
Hearly P M et al (1992). “Does corporate Performance Improve after Mergers” Journal of Financial Economics. Vol. 31.pp.135-175
Ifezue, A.N. (1979). “Essential of Strategic Management and Marketing” ABIC Books and Equip Ltd. Enugu.
Ibru, C., (2006) ‘Overview of Financial environment in Nigeria’.Working paper, Lagos, Nigerian Army College of Logistics.
IBTC, (2007).‘Corporate Finance’.IBTC [Online]. Available at: http://www.ibtc.com/corporate%20finance.asp [accessed 4 July 2013].
Imala, O.I., (2004). ‘The experience of banking supervision in financial sector Surveillance’, Central Bank of Nigeria Bullion, January – March, 28(1), pp.49-53. Lagos: Central Bank of Nigeria.
Jemision, D., & Sitkin, S., (1986). ‘Corporate acquisitions: A process perspective’, Academy of Management Review , 11(1), pp. 145-163.
Jensen M. C., (1986).‘Agency costs of free cash flow, coporate finance, and takeovers’, American Economic Review , 76(2), May: 323-329.
Kaplan, N., (2002). ‘Assimilate, Integrate, or Leave Alone (after acquisition of a company)’, Journal of Business Strategy , 22(1), pp. 23-25.
Kawalek, P. & Wastell, D., (2005).‘Pursuing Radical transformation in Information Age Government: Case Studies Using the SPRINT Methodology’, Journal of Global Information Management, 13(1), pp. 79 – 101.
Keasey, S. Thompson, &M. Wright (ed.), Corporate Governance Accountability, Enterprise and International comparisons, Chichester-West Sussex, John Wiley & Sons Ltd, 2005, pp. 251-283.
Kilner, R., (2008).‘UBA acquires Liberty Bank’. Banking Times Online [internet] 9 June. Available at: http://www.bankingtimes.co.uk/09062008-uba-acquires-liberty-bank/ [accessed 17 June, 2013].

145
Koetter, M., Bos, J.W.B., Heid, F., Kool, C.J., Kolari, J.W., & Porath, D., (2007). ‘Accounting for distress in bank mergers’, Journal of Banking and Finance, 10, pp. 3200– 3217.
Krug, J.A., & Hegarty, W.H., (2001). ‘Predicting who stays and leaves after an acquisition: A study of top managers in multinational firms’, Strategic Management Journal, 22, pp. 185-196.
Lang, G., & Welzel, P., (1999). ‘Mergers among German cooperative banks: A panel based stochastic frontier analysis’, Small Business Economics, 13(4), pp. 273-286.
Lawler, Kevin et al. (2000). Econometrics: A Practical Approach. London: Rutledge Press
Larsson, R., & Finkelstein, S., (1999). ‘Integrating strategic, organisational, and hum resource perspectives: A case survey of synergy realization’, Organisation Science , 10(1), pp. 1-27.
Lipton, M., 2006.Merger waves in the 19th , 20th and 21st centuries. [online]. Available at: http://osgoode.yorku.ca/media2.nsf/58912001c091cdc8852569300055bbf9/1e 37719232517fd0852571ef00701385/$FILE/Merger%20Waves_Toronto_Lipton.pdf [accessed 13 June 2013].
Lubatkin, M.H., Schweiger, D.M., & Weber, Y., (1999). ‘Top management turnover in related M&A’s: An additional test of the theory of relative standing’, Journal of Management, 25(1), pp. 55-73.
Luftman, J., &Brier, T., (1999).‘Achieving and sustaining business-IT alignment’, California Management Review, 42(1), pp. 109 – 122.
McCloskey, Deirdre &Stephen Ziliak.1996.“The Standard Error of Regression.”Journal ofEconomic Literature. March, 34, 97–114.
Mantravadi, P. & Reddy, A.V. 2008, “Post mergers performance of acquiring firms from different industries in India”, International Research Journal of Finance and Economics, Vol. 22, pp. 192-201.
Marks, L. M., & Mirvis, P. H., (2001).‘Making mergers and acquisitions work: Strategic and psychological preparation’, Academy of Management Executive , 15(2), pp. 80 93.
Milligan, J., (2006). ‘Growing the bank’, Bank Director Magazine Archives Online [internet]. Available at:http://www.bankdirector.com/issues/articles.pl?article_id=11782 [accessed 18 June 2013].
Mishkin, F.S., (2006). The Economics of money, banking, and financial markets.8th ed., London, Addison-Wesley.

146
Millward, L., & Kyriakidou, O., (2004). ‘Linking pre and post merger identities through the concept of career’, Career Development International , 9(1), pp. 12-27.
Mishkin, F.S., (2006). The Economics of money, banking, and financial markets.8th ed., London, Addison-Wesley.
Mitchell, M., & Mulherin, J.H., (1996).‘The impact of industry shocks on takeovers and restructuring activity’, Journal of Financial Economics , 41, pp. 193-229.
Mordi, C.N.O., (2004). ‘Institutional framework for the regulation and supervision of the financial sector’, Central Bank of Nigeria Bullion, 28(1), pp. 25 – 30.
Murphree, D., & Hollander, A., (2003). ‘How to avoid a flawed mergers and acquisitions process’.[Online].The Journal of New England Technology, 21(35). Available at: http://www.equationpartners.com/News/MHT01Sep03.pdf [accessed 16 June 2013].
NPC, (2004).‘Meeting everyone’s Needs: National Economic Empowerment and Development Strategy’, Nigerian National Planning Commission .[Online]. Available at: http://siteresources.worldbank.org/INTPRS1/Resources/Nigeria_PRSP(Dec2005). pdf [accessed May 24 2013].
Nwankwo, G., (1980) The Nigerian Financial System, London, Macmillan Publishing. O’Regan, P., (2001). Financial Information Analysis , Indianapolis, John Wiley & Sons.
Ogbonna, A., (2007) ‘Can the real sector count on Nigerian banks?’The Sun News Online. [internet]. 18 October. Available at: http://www.sunnewsonline.com/webpages/features/money/2007/oct/18/Money-18-10 07 002.htm [accessed May 27 2013].
Okpanachi.J. (2011).‘Comparative analysis of the impact of mergers and acquisitions on financial efficiency of banks in Nigeria’.Journal of Accounting and Taxation, Vol. 3, No. 1, pp.1-7
Osiegbu (2005).“The efficiency effects of bank mergers: An overview of case studies of nine mergers”, Journal of Banking and Finance, No. 22 (1998), pp. 273-291 (Amsterdam, Elsevier).
Ogwu, D., (2004). ‘Legal framework for mergers and acquisitions’.Securities and Exchange Commission Online]. Available at: http://www.cenbank.org/OUT/PUBLICATIONS/BSD/2005/LEGAL%20FRAME% 0 ORK%20FOR%20MERGERS%20AND%20ACQUISITIONS.PDF [accessed 17 June 2013].
Okoduwa, A., (1995) ‘Fighting distress in the banking sector’, Business Times (Nigeria), December 18, pp. 5.
147
Okonkwo, C.O., (2004). ‘Legal framework for mergers and acquisitions’.Central Bank of Nigeria [Online]. Available at: http://www.cenbank.org/OUT/PUBLICATIONS/BSD/2005/LEGAL%20FRAMEWO %20FOR%20MERGERS%20%20ACQUISITIONS.PDF [accessed 3 June 2013].
Okwe, M.,( 2006). ‘Ecobank takes over All States Trust liabilities’. The Guardian Online. [internet] 5 May. Available at: http://www.guardiannewsngr.com/news/article15/050506 [accessed 17 June 2013].
Olajide, B., (2008). ‘Banks consolidation on the last lap, acquisition continue’, The Guardian Online. [internet]. 28 January. Available at: http://www.guardiannewsngr.com/market_report/article02//indexn3_html?pdate=28 10&ptitle=Union%20Registrars%20opens%2011%20new%20branches&cpdate=28 8[accessed 17 June 2013].
Onyido, B.C., (2004). ‘The role of the Central Bank of Nigeria in the Nigerian Financial System’, Central Bank of Nigeria Bullion, 28(1), pp. 13-19.
Orlikowski, W., (1992).‘The Duality of Technology: Rethinking the concept of Techttnology in Organisations’, Organisation Science, 3, pp. 398 – 427.
Perry, J.S., & Herd, T.J., (2004). ‘Mergers and acquisitions: Reducing M&A risk through due diligence’, Strategy and Leadership, 32(2), pp. 12-19.
R.R Johnson. (2010) “A Guide to Using Eviews with Using Econometrics: A Practical Guide”. University of San Diego
Rhoades.S.A (1998).“The efficiency effects of bank mergers: An overview of case studies of nine mergers”, Journal of Banking and Finance, Vol. 22. pp.273-291. Retrieved 1998. Amsterdam, Elsevier.
Ramanathan, Ramu. (1998). Introductory Econometrics with Applications. Fort Worth, Tex.: HarcourtCollege Publishers.Secrist, Horace. 1933. The Triumph of Mediocrity in Business. Evanston, Ill.: Bureau of Business Research. Northwestern University
Ramawamy, K. P., & Waegelein, J. F., (2003).‘Firm financial performance following the merger’, Review of Quantitative Finance and Accounting , 20, pp. 115-126.
Rao, V. R., Mahajan, V., and Varaiya, N. P., (1991).‘A balance models for evaluating firms for acquisition’, Management Science, 37(3), pp. 330-349.
Rees, B., (1995). Financial Analysis.2nd ed., London, Prentice Hall.
Resti, A., (1998). ‘Regulation can foster mergers, can mergers foster efficiency? The Italian case’, Journal of Economics and Business 50 , pp. 157–169.
Robbins, S.S., & Stylianou, A.C., (1999). ‘Post-merger systems integration: The impact on IS capabilities’, Information & Management, 36, pp. 205-212.

148
Saboo, S. & Gopi, S. 2009.“Comparison of post-merger performance of acquiring firms (India) involved in domestic and cross-border acquisitions”, MPRA Paper No. 19274.
Samaras, V., (2007), ‘Internal versus external growth: impact on operational and market Performance’. [Online]. Available at: http://www.dauphine.fr/cereg/Userfiles/File/Paper_Samaras.pdf [accessed 19 June 2013]
Schneider, W., (2003).‘Trouble at the Top: A Sign of Deal Disorder, Mergers and Acquisitions: The Dealmaker’s Journal , 38 (4), pp. 30-33.
Schuler, A.J., (2003). ‘Post acquisition integration’. [Online]. Available at: http://www.schulersolutions.com/html/post_acquisition_integration.html [accessed 16 June, 2013].
Sharma, G., 200?.‘Mergers and Acquisitions’.Rediff homepages [Online]. Available at: http://members.rediff.com/future/m&a.htm [accessed 11 June 2013].
Shleifer, A., &Vishny, R.W., (1991). ‘Takeovers in the ‘60s and the ‘80s: Evidence and implications’, Strategic Management Journal, 12, pp. 51-59.
Shleifer A.,& Vishny R.W., (1989). ‘Management Entrenchment: The case of Manager Specific Investments’, Journal of Financial Economics , 25: 123-139.
Sidel, R., (2003). ‘After a dry spell, a merger flood’, The Wall Street Journal , 28 Oct. pp. C1, C3.
Sinickas, A., (2004). ‘How to do due diligence research’, Strategic Communication Management, 8(4), p. 12.
Soludo, C., (2008). ‘The unfinished revolution in the banking system’.[Online].Presentation at the University of Agriculture, Abeokuta on March 18, 2008 by the CBN Governor. Available at: http://www.cenbank.org/OUT/SPEECHES/2008/Govadd26-3-08.pdf [Accessed 2 June 2013].
Soludo, C., (2006). ‘Financial Sector reforms and the real economy’.Speech to the Council of Fellows of the Pharmaceutical Society of Nigeria.
Soludo, C., (2006b). ‘Beyond banking sector consolidation in Nigeria.’[Online]. Presentation at the Global Banking Conference on Nigerian Banking Reform . Available at: http://www.cenbank.org/out/Speeches/2006/Govadd29-3-06.pdf [accessed 17 June 2013].
Stanbic IBTC Bank (2012). Annual Report for the year ended 30 June, 2012
Stanbic IBTC Bank, (2011). Annual Report for the year ended 30 June, 2011
149
Stanbic IBTC Bank (2010). Annual Report for the year ended 30 June, 2010
Stanbic IBTC Bank (2009). Annual Report for the year ended 30 June, 2009
Stanbic IBTC Bank, (2008). Annual Report for the year ended 30 June, 2008
Stanbic IBTC Bank (2007). Annual Report for the year ended 30 June, 2007
Stanbic IBTC Bank, (2006). Annual Report for the year ended 30 June, 2006
Stanbic IBTC Bank (2005). Annual Report for the year ended 30 June, 2005
Stanbic IBTC Bank (2004). Annual Report for the year ended 30 June, 2004
Stanbic IBTC Bank, (2003). Annual Report for the year ended 30 June, 2003
Stanbic IBTC Bank (2002). Annual Report for the year ended 30 June, 2002
Stanbic IBTC Bank (2001). Annual Report for the year ended 30 June, 2001
Stanbic IBTC Bank (2000). Annual Report for the year ended 30 June, 2000
Stanbic IBTC Bank (1999). Annual Report for the year ended 30 June, 1999
Studenmund, A. H. (2001). Using Econometrics: A Practical Guide. Boston, Mass.: Addison Wesley.
Steinberg, C., Swaray, S., & Moyo, J., (2008), ‘Nigeria: Selected issues’, IMF Country Report No. 09/65 , Washington, D.C., International Monetary Fund.
Stewart, D., (2006). ‘MKS shows virtues of organic growth’. Financial Post Online. [Internet] 23 June. Available at: http://www.financialpost.com/scripts/story.html?id=41f27462-6fea-467b-9f1a b35031a33515&k=40744 [accessed 4 August 2013].
Sudarsanam, S., (2003).Creating value from Mergers and acquisitions: The challenges , Harlow, Pearson Education Limited.
Tetenbaum, T., (1999).‘Beating the odds of mergers and acquisition failure: Seven key practices that improve the chance for expected integration and synergies’, Organisational Dynamics, 28(2), pp. 22-36.
Thompson, S., & Wright, M., (2005).‘Edith Penrose’s contribution to Economics and Strategy: An overview’. Managerial and Decision Economics, 26, 57-66.
Trautwein, F., (1990).Merger Motives and Merger Prescriptions’, Strategic Management Journal, 11(4), 283 – 295.
UBA, (2012).Annual Report for the year ended 30 June, 2012
150
UBA, (2011).Annual Report for the year ended 30 June, 2011
UBA, (2010).Annual Report for the year ended 30 June, 2010
UBA, (2009).Annual Report for the year ended 30 June, 2009
UBA, (2008).Annual Report for the year ended 30 June, 2008
UBA, (2007).Annual Report for the year ended 30 June, 2007
UBA, (2006).Annual Report for the year ended 30 June, 2006
UBA, (2005).Annual Report for the year ended 30 June, 2005
UBA, (2004).Annual Report for the year ended 30 June, 2004
UBA, (2003).Annual Report for the year ended 30 June, 2003
UBA, (2002).Annual Report for the year ended 30 June, 2002
UBA, (2001).Annual Report for the year ended 30 June, 2001
UBA, (2000).Annual Report for the year ended 30 June, 2000
UBA, (1999).Annual Report for the year ended 30 June, 1999
UBA, (1998).Annual Report for the year ended 30 June, 1998
Union Bank (2012). Annual Report for the year ended 30 June, 2012
Union Bank, (2011). Annual Report for the year ended 30 June, 2011
Union Bank (2010). Annual Report for the year ended 30 June, 2010
Union Bank (2009). Annual Report for the year ended 30 June, 2009
Union Bank, (2008). Annual Report for the year ended 30 June, 2008
Union Bank (2007). Annual Report for the year ended 30 June, 2007
Union Bank, (2006). Annual Report for the year ended 30 June, 2006
Union Bank (2005). Annual Report for the year ended 30 June, 2005
Union Bank (2004). Annual Report for the year ended 30 June, 2004
Union Bank, (2003). Annual Report for the year ended 30 June, 2003
Union Bank (2002). Annual Report for the year ended 30 June, 2002

151
Union Bank (2001). Annual Report for the year ended 30 June, 2001
Union Bank (2000). Annual Report for the year ended 30 June, 2000
Union Bank (1999). Annual Report for the year ended 30 June, 1999
Union Bank (1998). Annual Report for the year ended 30 June, 1998
Umaru, A., (1993). ‘New banks are boutique banks’, The Nigerian Economist, May 17, pp. 5.Lagos, Sahel Publishing and Printing Co.
Umoren (2007).“Asset redeployment, acquisition and corporate strategies in declining industries” strategic management journal. Vol., 23 pp. 119-134.
Umoh, P.N., (2004). ‘The role of deposit insurance in financial sector stability’, Central Bank of Nigeria Bullion, 28(1), pp 60-63.
Vennet, R.V., (1996). ‘The effect of mergers and acquisitions on the efficiency andprofitability of EC credit institutions’, Journal of Banking and Finance, 20 (9), pp. 1531–1558.
Weber, R.A., & Camerer, C.F., (2003). ‘Cultural conflict and merger failure: An experimental approach’, Management Science, 49(4), pp. 400-415.
Weber, Y., Shenkar, O., & Raveh, A., (1996). ‘National and Corporate Fit in Mergers/Acquisitions: An Exploratory Study’, Management Science , 42(8), pp.1215 1227.
Wema Bank (2012). Annual Report for the year ended 30 June, 2012
Wema Bank, (2011). Annual Report for the year ended 30 June, 2011
Wema Bank (2010). Annual Report for the year ended 30 June, 2010
Wema Bank (2009). Annual Report for the year ended 30 June, 2009
Wema Bank, (2008). Annual Report for the year ended 30 June, 2008
Wema Bank (2007). Annual Report for the year ended 30 June, 2007
Wema Bank, (2006). Annual Report for the year ended 30 June, 2006
Wema Bank (2005). Annual Report for the year ended 30 June, 2005
Wema Bank (2004). Annual Report for the year ended 30 June, 2004
Wema Bank, (2003). Annual Report for the year ended 30 June, 2003
Wema Bank (2002). Annual Report for the year ended 30 June, 2002

152
Wema Bank (2001). Annual Report for the year ended 30 June, 2001
Wema Bank (2000). Annual Report for the year ended 30 June, 2000
Wema Bank (1999). Annual Report for the year ended 30 June, 1999
Wema Bank (1998). Annual Report for the year ended 30 June, 1998
Wonnacott, Ronald J. &Thomas H. Wonnacott.(1980). Econometrics. New York,N.Y.: Wiley.
Wooldridge, Jeffrey. (2000) Introductory Econometrics: A Modern Approach. Cincinnati, Ohio: Southwestern College Publishing.182 Journal of Economic Perspectives
Wastell, D., (1999). ‘Learning dysfunctions and information systems development: Overcoming the social defenses with transitional objects’, MIS Quarterly, 23, pp. 581 – 600.
Wheelock, D. C., &Wilson, P.W., (2000). ‘Why do banks disappear? The determinants of U.S. bank failures and acquisitions’, The Review of Economics and Statistics, 82, pp. 127–38.
Worthington, A.C., (2004). ‘Determinants of merger and acquisition activity in Australian cooperative deposit-taking institutions’, Journal of Business Research, 57, pp. 47-7. www.cenbank.org/FAQ/faqconsolidation.htm www.acenture.com/evolutionbanking
Yi-Chi Chen (1999).“Introduction to Eviews”.University of Washington, Seattle WA 98195 USA.
Zikmund, W.G., (2003). Business Research Methods.7th ed., South-Western Australia, Thomson.