FACULDADE DE ECONOMIA - core.ac.uk · ANA RITA SALVÉ-RAINHA GASPAR Dissertação para obtenção...
49
UNIVERSIDADE DO ALGARVE FACULDADE DE ECONOMIA EFFECTIVENESS IN THE PREVENTION AND CONTROL OF TUBERCULOSIS – A COMPARATIVE ANALYSIS OF COUNTRIES USING DATA ENVELOPMENT ANALYSIS ANA RITA SALVÉ-RAINHA GASPAR Dissertação para obtenção do grau de Mestre em Gestão de Unidades de Saúde Mestrado em Gestão de Unidades de Saúde Trabalho efetuado sob orientação de: Professora Doutora Carla Alexandra E. Filipe Amado Professor Doutor Sérgio Pereira dos Santos Faro 2016
Transcript of FACULDADE DE ECONOMIA - core.ac.uk · ANA RITA SALVÉ-RAINHA GASPAR Dissertação para obtenção...

UNIVERSIDADE DO ALGARVE
FACULDADE DE ECONOMIA
EFFECTIVENESS IN THE PREVENTION AND CONTROL OF
TUBERCULOSIS – A COMPARATIVE ANALYSIS OF
COUNTRIES USING DATA ENVELOPMENT ANALYSIS
ANA RITA SALVÉ-RAINHA GASPAR
Dissertação para obtenção do grau de Mestre em Gestão de Unidades de Saúde
Mestrado em Gestão de Unidades de Saúde
Trabalho efetuado sob orientação de:
Professora Doutora Carla Alexandra E. Filipe Amado
Professor Doutor Sérgio Pereira dos Santos
Faro
2016

ii
UNIVERSIDADE DO ALGARVE
FACULDADE DE ECONOMIA
EFFECTIVENESS IN THE PREVENTION AND CONTROL OF
TUBERCULOSIS – A COMPARATIVE ANALYSIS OF
COUNTRIES USING DATA ENVELOPMENT ANALYSIS
ANA RITA SALVÉ-RAINHA GASPAR
Dissertação para obtenção do grau de Mestre em Gestão de Unidades de Saúde
Mestrado em Gestão de Unidades de Saúde
Trabalho efetuado sob orientação de:
Professora Doutora Carla Alexandra E. Filipe Amado
Professor Doutor Sérgio Pereira dos Santos
Faro
2016

iii
DECLARAÇÃO DE AUTORIA E COPYRIGHT
EFFECTIVENESS IN THE PREVENTION AND CONTROL OF TUBERCULOSIS –
A COMPARATIVE ANALYSIS OF COUNTRIES USING DATA ENVELOPMENT
ANALYSIS
Declaro ser a autora deste trabalho, que é original e inédito. Autores e trabalhos
estão devidamente citados no texto e constam da listagem de referências incluída.
__________________________________________
Ana Rita Salvé-Rainha Gaspar
Ana Rita Salvé-Rainha Gaspar Copyright ©
A Universidade do Algarve tem o direito, perpétuo e sem limites geográficos, de
arquivar e publicitar este trabalho através de exemplares impressos reproduzidos em
papel ou de forma digital, ou por qualquer outro meio conhecido ou que venha a ser
inventado, de o divulgar através de repositórios científicos e de admitir a sua cópia e
distribuição com objetivos educacionais ou de investigação, não comerciais, desde que
seja dado crédito ao autor e editor.

iv
TABLE OF CONTENTS
ACKNOWLEDGEMENTS vii
RESUMO viii
ABSTRACT ix
1. INTRODUCTION 1
2. EFFECTIVENESS IN THE PREVENTION AND CONTROL OF
TUBERCULOSIS 2
2.1 PREVENTION AND CONTROL OF TUBERCULOSIS 2
2.2 THE USE OF DATA ENVELOPMENT ANALYSIS TO ASSESS
EFFECTIVENESESS 6
3. DATA ANALYSIS 12
3.1 DEA MODEL 12
3.2 DATA AND EFFECTIVENESS RESULTS 17
4. CONCLUSION 33
5. REFERENCES 35

v
LIST OF TABLES
Table 1: Summary of the input and outputs included in the DEA model 15
Table 2: Summary of the ratios between the TB cases included in each category 16
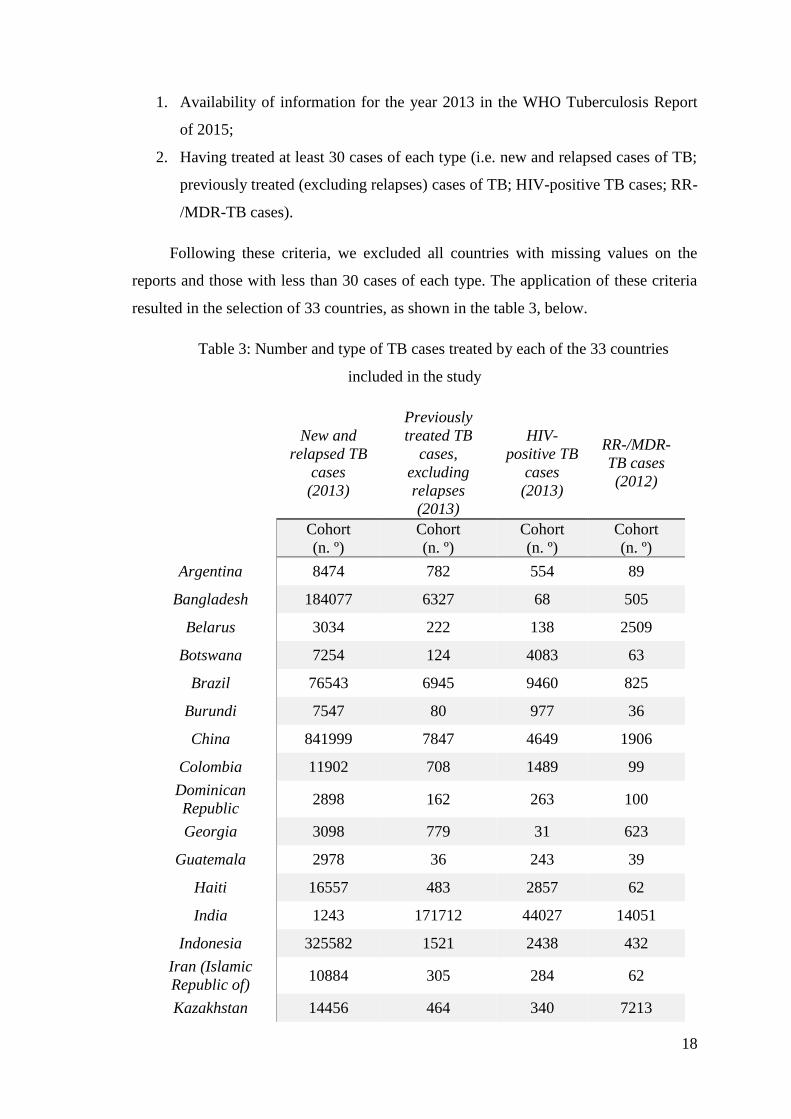
Table 3: Number and type of TB cases treated by each of the 33 countries included in the study
18
Table 4: Data used in the DEA model regarding treatment success rates 20
Table 5: DEA effectiveness scores and % contribution of each output to the score 23
Table 6: Descriptive statistics of the scores and % contribution of each output to the score 24
Table 7: Summary of Benchmarks (peers and lambdas) 26
Table 8: Targets for non-effective countries 31

vi
LIST OF ABBREVIATIONS
AIDS – Acquired Immunodeficiency Syndrome
CI – Composite Indicator
CRS – Constant Return to Scale
DEA – Data Envelopment Analysis
DMU – Decision Making Unit
DOTS – Directly Observed Treatment Short-coursed
EMS – Efficiency Measurement System
HBC – High Burden Country
HIV – Human Immunodeficiency Virus
MDR – Multi-drug resistance
MDR-TB – Multi-drug resistant tuberculosis
NTP – National Tuberculosis Control Program
RR – Rifampicin Resistance
RR-/MDR- - Rifampicin Resistant-/Multi-drug Resistant
RR-/MDR-TB - Rifampicin Resistant-/Multi-drug Resistant Tuberculosis
TB - Tuberculosis
WHO – World Health Organization

vii
ACKNOWLEDGEMENTS
To my advisors, Professor Sérgio Santos and Professor Carla Amado, for all the
availability, guidance and professionalism.
To all those who, during this journey, were somehow harmed by my absence. The
choices were not always easy and only your strength and your smile gave me the
courage to continue. My success is due to you.

viii
RESUMO
A Tuberculose é a primeira causa de morte por doenças infeciosas em todo o
mundo. O atual panorama de restrições que a maioria dos países atravessa, reforça a
avaliação da eficiência e efetividade, como a única forma de orientação para que os
investimentos feitos assentem sobre uma base sólida de boas práticas e melhoria
contínua.
O presente estudo tem como objetivo explorar o uso da técnica Data Envelopment
Analysis (DEA) por forma a analisar o desempenho dos países no que se refere ao
controlo da Tuberculose e identificar boas práticas como uma plataforma de melhoria.
Para esse efeito, utilizamos dados de 33 países de baixo e médio rendimento referentes
ao sucesso de tratamento. Os resultados mostram que o Bangladesh, Burundi, China e
Paquistão são os únicos países efetivos na nossa amostra. Apesar da variação da
efetividade entre países não ser substancial, os resultados mostram margem para
melhorias e sugerem que uma melhor utilização dos recursos e práticas mais efetivas de
prevenção e controlo podem ser estabelecidas. Além disso, os nossos resultados também
apoiam o DEA como uma ferramenta versátil para o planeamento estratégico e tomada
de decisões efetivas.
Palavras-chave: Tuberculose, Prevenção e Controlo, Data Envelopment Analysis,
Efetividade;

ix
ABSTRACT
Tuberculosis (TB) is the first cause of death from infectious diseases worldwide.
The current panorama of restrictions that most of the countries are experiencing, makes
it necessary to assess efficiency and effectiveness as the only way to provide guidance
so that the investments made can have a sound basis of good practice and continuous
improvement.
The present study proposes to explore Data Envelopment Analysis (DEA) to
assess countries performance in TB prevention and control, and in doing so establish
comparisons between countries and identify good practices as a platform for
improvement. To achieve these objectives, we used data regarding TB treatment success
from 33 low and middle income countries. Our results show Bangladesh, Burundi,
China and Pakistan as the only effective countries in our sample. Despite the variation
of effectiveness not being substantial, our results show margin for great improvement
and suggest that a better use of resources and more effective practices regarding TB
prevention and control can be established for the non-effective countries. Moreover, our
results also support DEA as a versatile tool for effective strategic planning and decision
making.
Keywords: Tuberculosis, Prevention and Control, Data Envelopment Analysis,
Effectiveness.

1
1. INTRODUCTION
Tuberculosis (TB) is today, according to the World Health Organization (WHO),
the number one cause of death from infectious diseases worldwide, along with the
Human Immunodeficiency Virus (HIV). Despite all the efforts made, and knowing that
TB is preventable and curable, numbers show that this disease has a global massive
representation and creates an urgent need for effective strategies to control it and
prevent the appearance of new cases. The WHO (2016) points to an estimated 10,4
million new TB cases worldwide in 2015. This represents 800.000 more cases than
those estimated in the report published in 2015. The high number of TB cases
worldwide has major repercussions in countries’ budgets and creates financial gaps that
can make treatment inaccessible for those who need.
Treatment success (including completed treatment or cured patients) is
remarkably important for TB control programs, as non-adherence can contribute to the
ongoing spread of this disease and the emergence of multi-drug resistant TB (MDR-TB)
in the community (Okanurak, Kitayaporn & Akarasewi, 2008). In this scenario, an early
diagnosis of infected people and an adequate monitorization during the course of
treatment are both milestones in stopping TB and the most effective strategy in
preventing this disease from spreading.
TB control programs face several difficulties and challenges throughout their
implementation. The lack of a structured and solid funding, a poor government
commitment and deep difficulties in implementation and surveillance require simple but
effective measures, as we need to have in mind that the most affected TB countries are
greatly affected by poverty. In these countries, wasting money with ideal but not real
policies is not an option. Indeed, it is imperative to assess if strategies and countries’
policies are truly effective and efficient. We need to be conscious that health systems
everywhere could make better use of their resources, whether through better practices,
more widespread use of generic products, better incentives to providers, or more fluid
financial and administrative mechanisms (Chan in World Health Report, 2010). The
current panorama of restrictions that most of the countries are experiencing, makes it
necessary to take a more critical and reflexive look at the health policies and programs
of the various countries. The assessment of efficiency and effectiveness plays an
increasingly significant role, as the only way to provide guidance so that the
investments made can have a sound basis of good practice and continuous improvement.

2
Data Envelopment Analysis (DEA), developed by Charnes, Cooper and Rhodes
(1978), is a non-parametric linear programming technique intended to measure the
relative efficiency of Decision Making Units (DMU). More than that, it allows the
identification of best performers and the establishment of comparisons among countries
through a benchmark group. The information obtained by the identification of best
practices can guide decision makers in the definition of better policies to improve the
performance of countries (Zanella, Camanho & Dias, 2013).
Therefore, the aim of this study is to assess countries effectiveness in the
prevention and control of TB by using the DEA technique. In doing so, we can establish
comparisons between countries and identify the most effective practices so that others
can learn through them. As far as we know, there are no published papers crossing DEA
and countries performance regarding TB prevention and control. As a consequence, we
believe that the present study will add valuable knowledge to this area. Furthermore, it
is also our aim that managers, policy makers and decision takers use this knowledge as
a platform for improvement.
2. EFFECTIVENESS IN THE PREVENTION AND CONTROL OF
TUBERCULOSIS
2.1 PREVENTION AND CONTROL OF TUBERCULOSIS
TB was declared a global public health problem in 1993 by the WHO and with
this declaration, several strategies were developed to fight this disease. According to the
WHO, TB was the 2nd cause of death from infectious disease worldwide in the year of
2014. More recent data from the same organization, shows that the numbers have grown.
In fact, TB became the 1st cause of death from infectious diseases worldwide in 2015,
alongside HIV (WHO, 2015; WHO, 2016).
Despite what seems to be a negative scenario with growing numbers playing a
major role, it is important to notice that this increase can be due to increased reporting.
Several countries, such as China, India, Egypt and Peru made substantial progress in
their public health communicable diseases reporting systems. Particularly in China,
public hospitals are responsible for 55% of all reported cases and a web-based system
for the reporting of communicable diseases has been implemented.

3
Globally speaking, it is estimated that in 2015 alone, 10,4 million new cases of
TB have emerged (WHO, 2016). This represents 6 million more new cases than in 2013
and 800.000 more cases than first estimated by the WHO’s report from 2015. In
financial terms, the expression of these numbers assumes enormous proportions in all
countries budget. Indeed, the average cost per person in 2015, oscillated between 100-
1000 US dollars for drug-sensitive TB and 2000-20000 US dollars for MDR-TB (WHO,
2016). The overall value of prevention, diagnosis and treatment in 2014 and 2015 was
estimated to be over 6.6 billion US dollars (WHO, 2014; WHO, 2015).
Since 1990 until 2015, TB mortality has fallen 47%. In all, effective diagnosis and
treatment saved an estimated 43 million lives between 2000 and 2014 (WHO, 2015).
The advances were indeed major, but effective management strategies are still needed.
Despite all the efforts made, TB still holds an extremely significant role in the world of
diseases, as it is estimated that 1.4 million persons died from TB in 2015 and for each
three persons who develop TB, one is still either not diagnosed or not reported. In fact,
TB remains a major public health problem. The lack of timely access to quality
diagnostic and treatment services for vulnerable populations contributed to the spread of
TB and drug resistance (Khan, Fletcher & Coker, 2016).
In what refers to success rates, globally, the treatment success rate for people
newly diagnosed with TB was 86% in 2013 (WHO, 2015; WHO, 2016). A level that
has been maintained since 2005. Although the target of 85% treatment success imposed
by the WHO was achieved, the numbers show discrepant scenarios among the six WHO
regions. The highest treatment success rates in 2013, were observed in the Western
Pacific Region, the South-East Asia Region and the Eastern Mediterranean Region with,
92%, 88% and 91%, respectively. Whilst in the African Region the treatment success
rate was 79%, the lowest numbers were observed in the Region of the Americas and the
European Region, with 75% and 76%, respectively. This shows a severe increase in
treatment success since 1995, however, the differences between regions provides
evidence that best practices need to be identified. A learning process based on the
experiences of the best practices regarding TB prevention and control is fundamental to
improve the performance of the different regions and to achieve the WHO’s targets.
Among all the countries that report information about TB to the WHO, there are
22 that hold the highest incidence rate of TB. The WHO considers Angola, Bangladesh,
Brazil, China, Democratic People’s Republic of Korea, Democratic Republic of Congo,
Ethiopia, India, Indonesia, Kenya, Mozambique, Myanmar, Nigeria, Pakistan,

4
Philippines, Russian Federation, South Africa, Thailand, Tanzania, United Republic of
Viet Nam, Cambodia, Central African Republic, Congo, Lesotho, Liberia, Namibia,
Papua New Guinea, Sierra Leone, Zambia and Zimbabwe, to be the 22 high burden
countries (HBC), as, together, they are responsible for 83% of all cases reported.
According to data published in the Global Tuberculosis Report of 2015 (WHO, 2015),
most of these countries have rates of new cases around 150 to 300 per 100.000
inhabitants. Moreover, the mortality rate in these countries oscillated between 790.000
and 1.100.000 deaths excluding deaths among HIV-positive patients. Between HIV-
positive patients the mortality rate fell between 280.000 and 360.000 deaths. The high
numbers of cases, as well as the high mortality rates, which represent between 81% to
85% of the global mortality rate, make clear the concrete and fundamental need for
effective actions to fight this disease, not only for the obvious expenses associated with
it but, and above all, to avoid the loss of health and quality of life that it causes.
The prevention, diagnosis and treatment of TB is a challenge for all those who
care about health and well-being and brings out the need for an efficient intervention
guided by scientific knowledge and good management practices. It is remarkably
important to understand if concerted efforts are truly effective and efficient. Indeed,
when we talk about effectiveness (the extent to which the system achieves the
objectives set) and efficiency (the extent to which the system uses the resources to
maximize the delivery of services) we need to realize that there is potential to improve.
For example, it has been argued that health systems could make better use of their
resources, by implementing best practices, making a more widespread use of generic
products, providing better incentives or applying more fluid financial and administrative
mechanisms (Chan in the World Health Report, 2010). Effective action involves a
systemic and agile look and requires proper management of resources.
Due to this fact, the achievement of efficiency and effectiveness became a major
priority for managers, directors and other stakeholders. There must be a clear
understanding of the difficulty, but also the fundamental need, to systematically
conjugate these two concepts. The search for efficiency and effectiveness should aim to
guarantee not only the aspects of the best use of resources and the best possible results,
but should also be seen as the only way to provide the best possible care to TB patients.
TB control programs face several difficulties and challenges throughout their
implementation. The lack of a structured and solid funding, a poor government
commitment and deep difficulties in implementation and surveillance are examples of

5
these challenges (Jassal & Bishai, 2010). To address them, simple but effective actions
are required. We need to have in mind that the most affected TB countries are greatly
affected by poverty and therefore cannot waste money with ineffective and inefficient
actions.
Choosing the appropriate indicators is pointed out as a critical issue in monitoring
and evaluating TB control programs (Cherchye, Moesen, Rogge & Van Puyenbroeck,
2007; Cherchye, Moesen, Rogge, Van Puyenbroeck, Saisana, Saltelli, Liska and
Tarantola, 2008). Indeed, some of the most important organizations in shaping
healthcare policy have worked on this issue and developed methods to monitor and
evaluate National TB Programs. In spite of this, to the best of our knowledge, there is
no method available to compare, in aggregated terms, the performance of countries with
respect to TB programs. However, as discussed by Cherchye et al. (2008), the WHO,
the United Nations and other international organizations have developed composite
indicators (CIs) to compare countries in other complex policy issues. These CIs
aggregate the performance of several indicators into a single number.
Indicators like coverage, case detection, and treatment success embody the three
key global indicators recommended by the World Health Assembly for measuring
national TB control program. The Compendium of Indicators for Monitoring and
Evaluating National Tuberculosis Programs (WHO, 2004), clarifies, among concepts
and other indicators, the use of these three indicators and explains how they should be
interpreted. Due to the importance of treatment success in preventing TB from
spreading and drug resistance from developing, we felt the need to specifically refer to
this concept. Indeed, the treatment success rate is defined as
“the percentage of a cohort of TB cases registered in a specified period
that successfully completed treatment, whether with bacteriologic evidence
of success (“cured”) or without (“treatment completed”)”
(WHO, 2004: 37)
Treatment success represents a clear benefit for the person itself, but more than
that, it is an enormous step to stop TB from spreading. Therefore, treatment success is
directly related to reduced TB mortality. As an indicator, TB treatment success
measures the capability of a program to hold the patients through the, sometimes very
long, course of treatment.

6
When, in 1991, the WHO set a target of 85% for this indicator, only those cases
which had bacteriologic evidence of success after treatment (cure) were considered.
Later, the WHO started including also the persons who have completed treatment even
without evidence of being cured. This target has been accomplished in the case of drug-
susceptible TB since 2007. However, when we refer to drug-resistant TB, the treatment
success was only 48% in the year of 2012. This is a number far from the established
targets and that shows the substantial improvements that need to be done.
Assessing and monitoring TB in terms of treatment success, the objective of this
dissertation, allows us to understand if countries strategies are producing effects and
making progress is the fight against TB. In doing so, we can realize what countries are
effective, identify their practices and learn from them, so that progress can be a constant
process in countries’ agenda. Only an effective performance assessment can guarantee
an adequate use of funds, improvements in quality of life and a safer world to live in.
2.2 THE USE OF DATA ENVELOPMENT ANALYSIS TO ASSESS
EFFECTIVENESESS
To assess effectiveness there are many techniques that can be used. The most
frequently used approaches for performance assessment are: ratio analysis, the
parametric approach, and the non-parametric approach, known as Data Envelopment
Analysis (DEA). Whilst the ratio analysis involves the comparison of several
performance indicators in the form of ratios, the parametric approach involves the
assessment of performance based on a comparison with a best practice frontier with a
shape as hypothesized by the analyst. Concerning DEA, it involves the assessment of
performance regarding a non-parametric performance frontier. As opposed to the
parametric approach, DEA identifies the best practice frontier based on the observed
data, without the need for assumptions about its shape. For this reason, as discussed by
Hollingsworth (2003), DEA has become the dominant approach for performance
assessment in healthcare as well as other sectors.
Although initially intended to assess productive efficiency of “not-for-profit
entities” (Charnes, Cooper & Rhodes, 1978: 1) participating in public programs,
nowadays its use seem to have expanded to other realities. Cherchye et al. (2007) note
that the scope of DEA has broadened substantially over the last two decades, including

7
macro-assessments of countries, productivity and performance assessments and several
applications to composite indicators construction.
Going back to the foundations of DEA, in what refers to productive efficiency,
Farrell (1957) by continuing Koopmans (1951) and Debreu (1951) work, defined this
concept as the product of technical and allocative efficiency. Being more specific, Kopp
(1981) defines productive efficiency as the ability of production organizations to
produce a well-specified output at minimum cost, where the output and factor inputs
must be clearly specified by vectors of measurable features.
Giving attention to Farrell’s definition, it becomes easy to understand that the
concept of technical and allocative efficiency are indeed easily distinguished but at the
same time connected to each other. The first one is associated with the production
frontier, which considers that an organization is efficient when produces the maximum
output from a specified set of inputs, while the second one measures an organization’s
success in selecting an ideal set of inputs with a certain set of input prices (Cooper,
Seiford & Zhu, 2011). Regarding allocative efficiency, Kopp (1981) clarifies that it
involves the selection of the most adequate input mix that allocates factors to their
highest valued uses and thus introduces the opportunity cost of factor inputs in the
measurement of productive efficiency.
Even though DEA has been mostly used to measure the relative efficiency of units,
there are also a few authors using DEA to measure effectiveness. Golany (1988),
Schinnar, Kamis-Gould, Delucia & Rothbard (1990), Asmild, Paradi, Reese & Tam
(2007) and Amado & Dyson (2008) are examples of some authors that have used DEA
with the aim of evaluating effectiveness. According to Asmild et al. (2007), in the
absence of precise prices or other value measures, models incorporating weight
constraints such as DEA models can be used to determine effectiveness. Indeed, when
Golany (1988), affirms that effectiveness measures how close an entity performs
relative to some given goals and argues that inefficiency is associated with waste, and,
therefore, cannot be associated with effective operations, we can see the proximity
between these two concepts.
Generally speaking, effectiveness assesses the beneficial impact of strategies in
real healthcare outcomes (the impact on the relevant stakeholders). It evaluates the
extent to which the aims of a particular organization are achieved. When healthcare and

8
economics study fields cross over, effectiveness is in fact what makes more sense to
measure and to have in consideration when strategies are planned. To talk about
effective strategies is to talk about positive impact and about real changes in people’s
quality of life.
DEA was initially proposed by Charnes, Cooper & Rhodes (1978), and consists in
a non-parametric linear programming model that allows to evaluate the performance of
a set of DMUs and that considers that each DMU integrates a process of transforming a
set of inputs (resources) into outputs (goods/ services) (Cooper, Seiford & Zhu, 2011).
Overall, DEA measures efficiency by estimating an empirical production function
which embodies the optimal amount of outputs that could be generated by the inputs
(Golany, 1988; Lovell, Pastor & Turner, 1995). This said, a DMU’s
efficiency/inefficiency is measured by the distance from the point which represents its
input and output values to the production frontier. Furthermore, DEA gives the
possibility of benchmarking in operations management and just requires general
information of production and distribution (Cooper, Seiford & Zhu, 2011).
More than simply compiling results of efficiency for each DMU, DEA also allows
each unit to identify a benchmarking group. These groups are made by units that,
despite sharing goals and priorities with other units, appear to have a better performance
and so are considered to be more efficient (Santos, Amado & Santos, 2012; Dear &
Dyson, 2008). In this respect, by comparing the inefficient units with the efficient ones,
it is possible to find ways to reduce inefficiencies.
In this regard, Cherchye et al. (2007) developed their work around CIs and weight
restrictions. In what refers to CIs, they represent indices that compile several individual
performance indicators. This aggregation is undertaken by applying a specific weight to
each performance indicator and measures multi-dimensional concepts that cannot be
captured by a single indicator. These authors explain the “benefit-of-the-doubt”
approach to construct CIs, in which “the weighting problem is handled for each country
separately, and the country-specific weights accorded to each sub-indicator are
endogenously determined” (Cherchye et al., 2007: 119). In this perspective, the main
idea is that a country’s good relative performance in one specific sub-indicator points to
a higher policy significance. Since one does not have information about the true weight
policy of a country, one can collect that information by identifying the country’s
relative weaknesses and strengths (Cherchye et al., 2007; Cherchye et al., 2008).
9
Therefore, these authors named above, affirm that such a data-oriented weighting model
is justified by the typical CI-context of uncertainty, and lack of consensus on an
appropriate weighting scheme.
The use of DEA to develop CIs has been very popular and numerous papers can
be found illustrating its use. Cherchye, Moesen & Puyenbroeck (2004), Zanella et al.
(2013) are just a few examples of studies that have used DEA with the “benefit-of-the-
doubt approach” to compare the performance of countries in several different contexts.
In the case of Zanella et al. (2013), these authors used a CI based in 25 single indicators
that underlie the estimation of the Environmental Performance Index, to assess
countries’ environmental performance. To ensure that all countries were being
evaluated homogeneously they imposed weight restrictions and identified which
countries are examples of best practices and which need to improve their results. By
comparing the obtained ranking of countries with the ranking of the Environmental
Performance Index, they tested the robustness of the results and verified that a positive
relation exists between the approaches.
In the healthcare field, Santos et al. (2012), conducted a study to assess the
efficiency in preventing mother-to-child HIV transmission. With a sample of 52 low
and middle income countries, these authors also chose to impose weight restrictions and
by that, to prevent the countries from attributing a null weight to the variables. Through
their DEA model, they concluded that there are significant variations between countries
in matter of services provided. Some of the countries could make a more efficient use of
the resources and, in doing so, could increase their performance around 70%. Moreover,
they identified the non-efficient countries, the countries with best practices and set
targets for improvement. In fact, they showed the potential of the DEA features and
their importance for strategic planning in healthcare.
In any of the studies reported above, one of the main challenges faced by the
authors was to identify the appropriate performance indicators to include in the analysis.
By indicator we mean a section of information that provides evidence about a specific
phenomenon. However, a single indicator is not enough to make assessments and take
conclusions given that it is just a small piece of a multi-dimensional phenomenon. Thus,
the composite indicators, as a combination of a set of sub-indicators, were developed to
give a broader idea regarding the performance of an entity. They summarize complex
and multi-dimensional issues in a mathematical combination of individual indicators

10
that represent different dimensions of a concept, which cannot be captured by a single
indicator (Saisana & Tarantola, 2002; Zanella et al., 2013).
The CI’s construction formula adapted from Cherchye et al. (2007) is as follows:
𝐶𝐼𝑗 = ∑ 𝑤𝑖𝑗
𝑚
𝑖=1
⋅ 𝑦𝑖𝑗
In this, CIj (j=1,…, n) is the composite index for country j, n represents the
number of DMU’s, m is the number of performance indicators, 𝑦𝑖𝑗 is the value of
indicator i generated by country j (i = 1,... m) and wi the weight assigned to indicator i.
The resulting composite index can vary between zero, that represents the worst possible
performance, and 1 (the benchmark).
The fact that DEA does not impose a rigid structure of input and output weights
for each unit is also pointed as an advantage of this technique. Thus, the weights are
identified by the optimization problem and assume values that allows each DMU to
achieve the best possible efficiency result. This flexibility assumes important
proportions when we intend to identify the inefficient DMU’s, as it validates that they
are not capable of accomplishing efficient results even when we use a weight
distribution that favors them. Therefore, because of this absolute freedom, in a
conventional DEA model, there are some inputs and/or outputs that can assume a
weight close to zero and, as a consequence, be almost ignored in the efficiency analysis,
despite any previous information about the DMU’s purpose and alleged importance of
that input/output. Lins, Silva & Lovell (2007), point this situation as one of the most
severe limitations of the conventional DEA models.
From this fact, rises the need to restrain the excess of freedom and impose limits
to reach a balance between flexibility and data information. Indeed, several researchers,
such as Wong & Beasley (1990), Roll, Cook & Golany (1991) and Dimitrov & Sutton
(2010) tried to find this balance and created models with weight restrictions. Pedraja-
Chaparro, Salinas-Jimenez & Smith (1997) and Chercye et al. (2007), have also
recognized the usefulness of these models and explained them in their work.
However, imposing weight restrictions is not an easy task. Restricting weights can
be a difficult task due to possible conflicting expert opinions on the proper restrictions
and due to problems with infeasibility (Dimitrov & Sutton, 2010).

11
In terms of the formulation of weight restrictions, there are a number of
approaches suggested in the literature, most of which operate on the basis of judgements
of importance about the inputs and outputs, based on monetary values, or based on
production trade-offs. In this paper, we are just going to explain weight restrictions
based on the “trade-off approach”, proposed by Podinovski (2004), since this is the
method we use in this dissertation. We have chosen to use this approach since, as
discussed by Podinovski (2004), it has several advantages: it avoids infeasibility and it
ensures that the performance targets are realistic. According to the same author, this
method guarantees that the radial target of inefficient units is always producible, since
the restrictions are formulated based on realistic technological trade-offs. This situation
cannot be guaranteed when we define weight restrictions based on the other two
approaches mentioned above (judgements of importance and monetary values). In these
cases, the resulting efficiency assessment can no longer be interpreted as a realistic
improvement factor (Podinovski, 2004; Podinovski, 2016).
As the “trade-off approach” gives us the possibility of imposing restrictions and at
the same time ensures that realistic targets are estimated, it seems the best choice for our
model.
In some contexts, we are interested in comparing countries with respect to their
achievements, without being concerned about the level of resources that was used to
produce the results. That means that we are interested in evaluating the relative
effectiveness of the countries without a concern for the level of relative efficiency. In
these cases, the DEA model needs to be modified to include a single unitary input and
several outputs. According to Lovell et al., (1995: 509), “this assumption implies that
one input, the helmsman, provides varying amounts of several services, and that every
country-year observation has exactly one helmsman”. This single input is also called
“dummy input” (Cherchye et al., 2007: 121). In this perspective, the results we obtain
are focused only on the achievements without evaluating the inputs required to achieve
them.
Indeed, Amado, José & Santos (2016) developed their study around a benefit-of-
the-doubt DEA model related to the measurement of active ageing in the European
Union, with output orientation and using a single unitary input. These authors present
the mathematical formulation for the benefit-of-the-doubt model as follows:

12
hL= Min v
Subject to:
∑ 𝑢𝑟𝑦𝑟𝐿
𝑠
𝑟=1
= 1
∑ 𝑢𝑟𝑦𝑟𝑗
𝑠
𝑟=1
− 𝑣 ≤ 0
𝑣 ≥ 𝜀 > 0
𝑢𝑟 ≥ 𝜀 > 0
In this sense, s represents the number of outputs, ur is the output weight or the
multiplier associated with output r, yr represent the outputs (r=1, …, r), hL is the
relative score of the country, j represents each of the n countries (j, …, n) and v is the
weight of the single input. For the present study, we add to this formulation 12 weight
restrictions in the form of trade-offs, which will be presented in the next chapter.
Based on this model, countries can take conclusions regarding their own results,
compare their performances with the benchmarks and adjust their policies according to
the best practices. Due to its characteristics, the model can be used to assess the
effectiveness of countries. We would like to recall that assessing effectiveness assumes
extreme importance in healthcare, not only for managers, directors and administrators,
but also, and above all, for patients, as the only way to pursue excellence.
Despite the extensive use of DEA in the healthcare context, to the best of our
knowledge, there are no published papers that compare countries in terms of the
effectiveness of TB prevention and control. Due to this fact, the present paper
undertakes the important task of exploring this issue with the aim to identify the most
effective countries in this context, as well as understand the structures and processes
that support their best practices.
3. DATA ANALYSIS
3.1 DEA MODEL

13
In order to choose the appropriate set of inputs and outputs for our DEA model,
several documents were consulted. Unfortunately, as far as we are aware, there are no
published studies we can refer to in what regards the use of DEA to assess countries
effectiveness in TB prevention and control. Consequently, we constructed our model
with the information provided by WHO’s annual reports, which include data about
several indicators and allow us to choose the variables that are most suitable for the
purpose of our study.
Since the present dissertation focuses on an evaluation of effectiveness, in which
the fundamental purpose is to maximize results/outcomes, the choice of inputs turned
out to be very clear. Following the approach suggested by other authors (such as, for
example, Cherchye et al., 2007), we used a single input equal to one, or in other words a
“dummy” input. Its use only makes sense when we want a model that is only concerned
with achievements.
Based on our review of the WHO reports, we have selected the following four
outputs to include in the DEA model:
1. Treatment success rate for new and relapsed TB cases;
2. Treatment success rate for previously treated TB cases, excluding relapses;
3. Treatment success rate for HIV-positive TB cases;
4. Treatment success rate for Rifampicin Resistant-/Multi-drug resistant- (RR-
/MDR-) TB cases.
Treatment success, alongside with directly observed treatment, short-coursed
(DOTS) coverage and case detection rate, is a key global indicator recommended by the
World Health Assembly for measuring national TB program’s success.
Adherence to TB treatment is especially important for TB control. Non-adherence
can contribute to the ongoing spread of the disease and the emergence of drug-resistant
TB in the community (Okanurak et al., 2008). Considering that TB treatment requires
taking several drugs for at least 6–8 months and that numerous adverse effects can
happen, patients do not always finish it. It should also be mentioned that, because after a
few weeks of taking the drugs the patients start feeling better, the need for continuing
treatment is sometimes not perceived by them and so they tend to abandon it. Therefore,
treatment success rates are dependent on this adherence and evaluate the capability of

14
countries TB programs to retain the patients until the course of treatment is finished. Its
importance is major in stopping TB globally.
The calculation of this indicator is made by the following formula:
𝑁𝑢𝑚𝑏𝑒𝑟 𝑜𝑓 𝑛𝑒𝑤 𝑠𝑚𝑒𝑎𝑟 𝑝𝑜𝑠𝑖𝑡𝑖𝑣𝑒 𝑝𝑢𝑙𝑚𝑜𝑛𝑎𝑟𝑦 𝑇𝐵 𝑐𝑎𝑠𝑒𝑠 𝑟𝑒𝑔𝑖𝑠𝑡𝑒𝑟𝑒𝑑 𝑖𝑛 𝑎𝑠𝑝𝑒𝑐𝑖𝑓𝑖𝑒𝑑 𝑝𝑒𝑟𝑖𝑜𝑑 𝑡ℎ𝑎𝑡 𝑤𝑒𝑟𝑒 𝑐𝑢𝑟𝑒𝑑 + 𝑡ℎ𝑒 𝑛𝑢𝑚𝑏𝑒𝑟 𝑡ℎ𝑎𝑡 𝑐𝑜𝑚𝑝𝑙𝑒𝑡𝑒𝑑 𝑡𝑟𝑒𝑎𝑡𝑚𝑒𝑛𝑡
𝑇𝑜𝑡𝑎𝑙 𝑛𝑢𝑚𝑒𝑟 𝑜𝑓 𝑠𝑚𝑒𝑎𝑟 𝑝𝑜𝑠𝑖𝑡𝑖𝑣𝑒 𝑝𝑢𝑙𝑚𝑜𝑛𝑎𝑟𝑦 𝑇𝐵 𝑐𝑎𝑠𝑒𝑠 𝑟𝑒𝑔𝑖𝑠𝑡𝑒𝑟𝑒𝑑𝑡ℎ𝑒 𝑠𝑎𝑚𝑒 𝑝𝑒𝑟𝑖𝑜𝑑
𝑋 100
Treatment success rate is an outcome indicator, so it reflects the changes, or in
other words the broader results, that are expected to occur with the use of the inputs.
The numbers needed to calculate this indicator are reported quarterly to the WHO at a
facility, district, regional and national level. For this study, we consider only the
national level data as, according to the WHO (2004), it allows comparisons between
countries.
Specifically referring to our first output, it is important to clarify the term
“relapsed cases” and to make a distinction between this and “previously treated cases”
of TB. Some confusion may occur when we look at these two concepts. The WHO
(2011) defines that the relapses occur in patients that had TB and after treatment stayed
without it for a period. They consider these patients as having a new TB episode and not
the same one. In contrast, previously treated cases (after failure or after default) are
cases in which the prolongation of a TB episode requires a change in the treatment.
Indeed, the new and relapsed cases are treated as one category of patients in what refers
to reporting information to the WHO (our first output), and previously treated patients
are handled in separate (our second output).
About this second output, it is also important to emphasize that the cases that have
been previously treated, have a higher probability of having a RR-/MDR-TB, and
therefore should be tested for drug resistance. These patients require a treatment
regimen that differs from patients that were not previously treated.
In addition to classifying cases by their treatment history, the numbers published
by the WHO are also differenced by HIV status and multi-drug resistance (MDR) status.
Since the risk of having TB is estimated to be 26 to 31 times higher in people living
with HIV than among those without HIV infection, this category of patients demands
special attention and requires specific collaboration strategies between WHO’s HIV and

15
TB departments. Consequently, our third output refers to “treatment success rate for
HIV-positive TB cases”.
Lastly, referring to the fourth output, it is important to clarify the RR-/MDR-TB
definition. The WHO (2011) defines it as the infection caused by Mycobacterium
tuberculosis resistant in vitro to the effects of rifampicin (RR) or isoniazid and
rifampicin (MDR), with or without resistance to any other drugs. Therefore, this
diagnosis is made based on drug sensibility tests, which may be crucial in defining the
course of treatment for these patients. It is estimated that in 2015 there were 480.000
cases of MDR-TB and 110.000 of RR-TB (WHO, 2016). Although the number of
patients with this type of TB are significantly lower than the number of patients with
drug-sensitive TB, treatment success is more difficult to achieve because treatment
courses require adjustments to the drug resistances and last for at least 2 years. In
WHO’s reports, the information about these patients are reported in separate and,
because of that, this category is also handled in separate in our DEA model.
It is important to emphasize that the right selection of outputs for the DEA model
is fundamental for the robustness of the results we present below. These four outputs
were selected because of their importance, recognized by the WHO, and having in
attention the availability of the information. In fact, the choice of these outputs is
justified by the need to treat the different categories of patients separately, but also by
the fact that the reporting systems do not capture information regarding other TB high
risk groups. The only at-risk groups for which information is available are HIV patients
and RR-/MDR-TB patients, and so these were the separate groups that could be
included.
In summary, table 1 presents the input and outputs considered in our DEA model:
Table 1: Summary of the input and outputs included in the DEA model
Inputs Outputs
Dummy input Treatment success rate for new and relapsed TB cases;
Treatment success rate for previously treated TB cases,
excluding relapses;
Treatment success rate for HIV-positive TB cases;
Treatment success rate for RR-/MDR- TB cases.

16
In terms of describing our DEA model, it is also relevant to clarify the restrictions
imposed and why we choose to impose them. Considering that the countries under
analysis (i.e. high burden TB countries) have the same generic goals regarding TB
prevention and control, it was considered unacceptable and unrealistic to allow the DEA
model to assign to their outputs very discrepant weights. Thus, we felt the need to limit
the level of flexibility in the choice of weights, in order to avoid the possibility of some
countries assigning a weight close to zero to some of the outputs.
We consider that the analysis of the proportion of patients accounted by each
output in the total of TB patients for a particular country, is a realistic piece of
information that can be taken into account in the definition of the weight restrictions. To
formulate these restrictions, we gave special attention to the maximum and minimum
values of this ratio. Considering that they can translate the trade-offs expected to occur
between outputs, based on this information, we can establish restrictions that reflect
realistic information about the countries. Consider the following codification of
variables:
“v1”: number of new and relapsed cases;
“v2”: number of previously treated cases, excluding relapses;
“v3”: number of HIV-positive TB cases;
“v4”: number of RR-/MDR-TB cases.
Table 2 below shows the results we obtain when we divide the number of cases
included in each of the 4 categories of outputs by the cases included in the others.
Table 2: Summary of the ratios between the TB cases included in each category
v1/v2 v1/v3 v1/v4 v2/v3 v2/v4 v3/v4
Maximum 294,33 8979,64 1774,38 192,65 73,06 445,37
Minimum 4,19 1,26 1,95 0,03 0,06 0,04
With these ratios, one can tell, for example, that in a given country for each
successfully treated case of TB in previously treated patients, we have approximately
294 new or relapsed cases also treated with success. This is the maximum ratio

17
observed. The minimum ratio observed is of 4,19. We have defined weight restrictions
that limit the ratio of weights between variables to be consistent with the maximum and
minimum ratios observed between the respective variables.
If we consider u1, u2, u3 and u4 as the weights assigned to outputs 1, 2, 3 and 4,
respectively, the mathematical expressions stated above, reflect the weight restrictions
we developed for our DEA model:
(1) 4,19 ≤ 𝑢1/𝑢2 ≤ 294,33
(2) 1,26 ≤ 𝑢1/𝑢3 ≤ 8979,64
(3) 1,95 ≤ 𝑢1/𝑢4 ≤ 1774,38
(4) 0,03 ≤ 𝑢2/𝑢3 ≤ 192,65
(5) 0,06 ≤ 𝑢2/𝑢4 ≤ 73,06
(6) 0,04 ≤ 𝑢3/𝑢4 ≤ 445,37
In this respect, we have used a benefit-of-the-doubt DEA model with restrictions
in the form of trade-offs, as proposed by Podinovski (2004) and explained above.
With the objective of assessing each countries’ effectiveness, we used the
Efficiency Measurement System (EMS) software, version 1.3.0, with a Constant
Returns to Scale (CRS) assumption and an output orientation. This is not very common
to find in literature, since most of the published papers that use the benefit-of-the-doubt
approach, follow an input orientation. However, and having in mind that our study is in
the healthcare context where the ultimate goal is to improve the outcomes, this choice
seems to be more adequate for our DEA model. Zanella et al. (2013) is a clear example
of a paper with this same perspective.
3.2 DATA AND EFFECTIVENESS RESULTS
The data used in this study relates to the performance of countries in what refers
to Tuberculosis prevention and control. All the data is from the year of 2013, except for
RR-/MDR-TB data. In this case, the values used are from the year of 2012 as data from
2013 were not available. Among the 194 countries and territories that report information
to the WHO, the selection of countries to integrate in this study sample, followed two
inclusion criteria:
18
1. Availability of information for the year 2013 in the WHO Tuberculosis Report
of 2015;
2. Having treated at least 30 cases of each type (i.e. new and relapsed cases of TB;
previously treated (excluding relapses) cases of TB; HIV-positive TB cases; RR-
/MDR-TB cases).
Following these criteria, we excluded all countries with missing values on the
reports and those with less than 30 cases of each type. The application of these criteria
resulted in the selection of 33 countries, as shown in the table 3, below.
Table 3: Number and type of TB cases treated by each of the 33 countries
included in the study
New and
relapsed TB
cases
(2013)
Previously
treated TB
cases,
excluding
relapses
(2013)
HIV-
positive TB
cases
(2013)
RR-/MDR-
TB cases
(2012)
Cohort
(n. º)
Cohort
(n. º)
Cohort
(n. º)
Cohort
(n. º)
Argentina 8474 782 554 89
Bangladesh 184077 6327 68 505
Belarus 3034 222 138 2509
Botswana 7254 124 4083 63
Brazil 76543 6945 9460 825
Burundi 7547 80 977 36
China 841999 7847 4649 1906
Colombia 11902 708 1489 99
Dominican
Republic 2898 162 263 100
Georgia 3098 779 31 623
Guatemala 2978 36 243 39
Haiti 16557 483 2857 62
India 1243 171712 44027 14051
Indonesia 325582 1521 2438 432
Iran (Islamic
Republic of) 10884 305 284 62
Kazakhstan 14456 464 340 7213

19
Kenya 81255 8445 31755 197
Lesotho 9119 1619 7683 146
Malaysia 23346 654 1510 74
Mexico 20708 638 1230 133
Namibia 8418 2192 4343 208
Nigeria 91997 8404 7481 154
Pakistan 289376 7217 37 858
Peru 17265 2802 1016 1122
Republic of
Moldova 3889 357 247 856
Romania 15188 925 250 638
Rwanda 5701 278 1448 58
South Africa 321087 18292 191189 8084
Tajikistan 5263 812 122 535
Turkey 13170 239 32 291
Uganda 44605 2572 16762 41
Ukraine 29726 9149 7553 5556
United Republic
of Tanzania 64053 1679 20320 45
Mean 77657 8023 11057 1443
Standard
Deviation 164644 29662 33775 3021
Minimum 1243 36 31 36
Maximum 841999 171712 191189 14051
All the presented countries are low and middle income countries, among which,
10 (Bangladesh, Brazil, China, India, Indonesia, Kenya, Lesotho, Namibia, Nigeria and
Pakistan) are HBC. In terms of the six WHO regions, our sample has the following
distribution:
Africa Region: Botswana, Burundi, Kenya, Lesotho, Namibia, Nigeria,
Rwanda, South Africa, Uganda and Tanzania;
Americas Region: Argentina, Brazil, Colombia, Dominican Republic,
Guatemala, Haiti, Mexico and Peru;
Eastern Mediterranean Region: Iran (Islamic Republic of) and Pakistan;

20
Europe Region: Belarus, Georgia, Kazakhstan, Republic of Moldova,
Romania, Tajikistan, Turkey and Ukraine;
South-East Asia Region: Bangladesh, India and Indonesia;
Western Pacific Region: China and Malaysia.
In our opinion, having this diversified distribution in our sample assumes
substantial importance, as it allows us to analyze the relative performance of some of
the countries that most contribute to the high number of TB cases reported, and at the
same time compare them with others that are not so affected by this disease in order to
identify the best practices. The imposition of these criteria to select the countries,
provides assurance regarding the robustness of the data and consequently of the results
we obtain.
Considering all the information provided above, we are now going to present table
4 with the data regarding treatment success rates (%) for some of the countries studied:
Table 4: Data used in the DEA model regarding treatment success rates
Countries
New and
relapses,
2013
Previously treated,
excluding relapses,
2013
HIV-
positive TB,
2013
RR-/MDR-
TB, 2012
Output 1 Output 2 Output 3 Output 4
Argentina 51 40 32 34
Bangladesh 93 86 75 72
Belarus 87 71 65 54
Botswana 73 60 71 70
Brazil 72 38 46 51
Burundi 91 84 87 92
China 95 90 82 42
Colombia 71 42 45 48
Dominican
Republic 83 51 65 72
Georgia 80 69 68 48
Guatemala* 84 67 62 69
Haiti* 81 75 71 76

21
India 88 66 76 46
Indonesia 88 64 49 54
Iran (Islamic
Republic of) 87 82 66 48
Kazakhstan 89 63 59 73
Kenya* 86 78 79 83
Lesotho* 70 62 66 64
Malaysia 76 46 51 30
Mexico 80 55 48 74
Namibia* 86 71 81 68
Nigeria* 86 83 80 62
Pakistan 93 80 81 71
Peru* 79 59 57 60
Republic of
Moldova 80 39 52 59
Romania 85 45 58 34
Rwanda 85 75 76 98
South Africa 78 69 76 49
Tajikistan 88 82 66 66
Turkey 86 38 53 66
Uganda 75 67 73 80
Ukraine 71 55 44 34
United Republic of
Tanzania 91 79 72 73
Mean 82,06% 64,58% 64,61% 61,21%
Standard deviation 8,87% 15,56% 13,54% 16,81%
Maximum 95% 90% 87% 98%
Minimum 51% 38% 32% 30%
By analyzing this table, it is possible to realize the great discrepancies existent
between the countries. The fact that Argentina has a treatment success rate for new and
relapsed cases of just 51% when China has 95% and the mean is 82,06%, indicates that
several gaps still need to be filled and more effective strategies need to be established.

22
With regards to treatment success among previously treated patients, excluding relapses,
the differences are accentuated and the scenario is even less positive. Here, the mean is
just 64,58%. A number far from WHO’s target of 85%. Moreover, although the
maximum value for this rate is very similar to the maximum value observed for the first
output (90% for China), when we refer to the minimum value the number is quite
discrepant. In fact, Turkey has just 38% of treatment success among these patients.
Specifically speaking about China, as one can tell by analyzing table 4, this
country consistently shows high rates of treatment success, and leads the group in what
refers to new and relapsed TB cases and previously treated TB cases. According to Lin,
Wang, Zhang, Ruan, Chinc & Dyed (2015) several improvements in the Chinese
healthcare system were made, as they recognized the impact of TB and the State
Council of China implemented a 10-year program in 2001 that expanded services’
coverage. This can in fact justify these high success rates. Further information about
China’s strategies will be provided bellow.
When we turn our attention to the third output, having in mind that Argentina was
the country with the lowest treatment success rate in output 1, it is not shocking to
verify that the minimum value observed in this output also belongs to this country.
Argentina has just 32% of success rate regarding HIV-positive patients with TB,
followed by Ukraine with 44%. An interesting fact is that the country with the highest
rate of success in the third output is Burundi (82%). However, this high success rate in
terms of HIV positive TB cases turns to be not so surprising when we realize that
Burundi also shows relatively high success rates in terms of outputs 1 and 2.
In the fourth output is where we can notice a greater difference between countries,
with a standard deviation of 16,81%. When focusing on the extreme values, we can
compare, for example, Malaysia with a 30% treatment success rate, and Rwanda, which
has the highest rate of all countries (98%). There is, therefore, a difference of 68%
between these two countries. In general, analyzing the rate’s standard deviation for all
outputs, the numbers are quite significant, especially when we report to previously
treated patients, excluding relapses, and to RR-/MDR-TB patients. This high variation
between countries suggests that there is potential for improvement in some countries
and that high treatment success rates are achievable. Low rates in treatment success

23
suggest that the patients may not be receiving an adequate treatment and may receive a
poor monitorization and control.
Even though this analysis of the summary statistics allows us to have a first idea
regarding the countries performance, and considering that trade-offs may occur between
the treatment of the four types of patients, we need to undertake an analysis with DEA
in order to identify the best practices. Table 5 shows the scores to all 33 countries from
the DEA model presented above:
Table 5: DEA effectiveness scores and % contribution of each output to the score
DMU Score Output 1 Output 2 Output 3 Output 4
1 Argentina 54,41% 95% 0% 0% 5%
2 Bangladesh 100,00% 90% 4% 0% 6%
3 Belarus 92,58% 96% 0% 0% 4%
4 Botswana 80,71% 56% 1% 43% 0%
5 Brazil 76,95% 95% 0% 0% 5%
6 Burundi 100,00% 40% 9% 31% 20%
7 China 100,00% 72% 16% 12% 0%
8 Colombia 75,74% 95% 0% 0% 5%
9 Dominican Republic 89,85% 92% 0% 0% 8%
10 Georgia 85,07% 95% 0% 1% 4%
11 Guatemala* 90,63% 92% 0% 0% 8%
12 Haiti* 88,45% 75% 17% 0% 8%
13 India 93,07% 95% 0% 1% 4%
14 Indonesia 93,53% 96% 0% 0% 4%
15
Iran (Islamic
Republic of) 92,25% 78% 18% 0% 4%
16 Kazakhstan 95,95% 92% 0% 0% 8%
17 Kenya* 94,10% 91% 0% 0% 9%
18 Lesotho* 76,42% 57% 1% 42% 0%
19 Malaysia 79,90% 100% 0% 0% 0%
20 Mexico 87,03% 91% 0% 0% 9%
21 Namibia* 93,77% 57% 1% 42% 0%
22 Nigeria* 93,61% 50% 12% 37% 1%

24
23 Pakistan 100,00% 91% 0% 3% 9%
24 Peru* 84,79% 95% 0% 0% 5%
25 Republic of Moldova 85,65% 95% 0% 0% 5%
26 Romania 89,34% 100% 0% 0% 0%
27 Rwanda 97,61% 61% 2% 1% 36%
28 South Africa 86,32% 56% 1% 43% 0%
29 Tajikistan 94,56% 77% 17% 0% 6%
30 Turkey 92,23% 95% 0% 0% 5%
31 Uganda 83,90% 43% 1% 33% 23%
32 Ukraine 74,82% 97% 0% 0% 3%
33
United Republic of
Tanzania 98,06% 92% 0% 0% 7%
For a better understanding of these results, we now present the descriptive
statistics:
Table 6: Descriptive statistics of the scores and % contribution of each output to the
score
Score Output 1 Output 2 Output 3 Output 4
Mean 88,52% 82,00% 3,00% 9,00% 6,00%
Maximum 100,00% 100,00% 18,00% 43,00% 36,00%
Minimum 54,41% 40,00% 0,00% 0,00% 0,00%
Standard deviation 9,62% 18,43% 5,88% 16,08% 7,37%
Regarding table 5, we can observe that only 4 countries (Bangladesh, Burundi,
China and Pakistan) are effective, 20 countries have scores higher than 85% and just 1
has a score lower than 70%. The average of the effectiveness score is 88,52%, which
demonstrates margin for improvement but at the same time validates the efforts that
have been undertaken in some countries to pursue effectiveness in TB prevention and
control. The standard deviation is 9,62%, which indicates that there are some
differences between the performance of the countries. However, this value does not
translate the gap that exists between some of the countries, which is larger and demands
effective changes in countries programs. That difference is more perceivable when one

25
focuses the attention on the minimum and maximum value of the score. For example,
Argentina has a score of 54,41%, which is 34,11% lower than the average score of all
countries. This difference makes clear that great changes need to be implemented, the
reasons behind the gap need to be identified and Argentina must learn from effective
countries.
In order to fully understand countries performance, we need to analyze the
contribution of each output to the overall effectiveness score. The last four columns of
Table 6 present the optimal share of contribution of each output to the score. It is
important to emphasize one aspect. The shares of contribution presented in table 5 are
rounded values. Whilst in some cases, we can observe a null share of weight attributed
to some outputs, this does not correspond to zero weight. In fact, this corresponds to a
weight which is very close to zero. Similarly, when a 100% contribution is attributed to
some outputs, this corresponds to a contribution that is close to 100%.
Therefore, in terms of optimal weight distribution, we can see different scenarios
among the 33 countries and by analyzing them we can extract valuable information
about the strategies implemented by countries. The first output, which has a mean of
contribution of 82%, is, clearly, the one with more representation in the effectiveness
score. We can observe that all countries benefited from the attribution of the largest
share of weight to the first output, which is not surprising, given that, except for
Burundi, Uganda and Rwanda, the best treatment success rate for all countries is for
new and relapsed cases. At the extreme, we can observe two countries (Malaysia and
Romania) that have actually benefited from the attribution of almost the totality of the
weight to the first output. Generally, while Malaysia and Romania benefited from this
weight distribution, others benefited from the distribution of the weight into two or
three outputs, and only 4 countries benefited from the distribution through all four.
Concerning the second output, this is the one with the lowest mean of contribution
of all 4 outputs, with just 3%. In addition, 20 countries assigned it a close to zero weight
and the remaining countries have put between 1% and 18% of the weight on this output.
With this, output 2 appears to be one of the less contributive to the effectiveness score
alongside with output 4. In the case of the fourth output, 8 countries put a weight close
to zero on it and the other countries benefited from the attribution of a weight between

26
1% and 36%. Among this last group, 23 countries chose to put less than 10% of their
weight into RR-/MDR-TB cases.
With regards to the third output, 21 countries assigned a close to zero weight to it
and 4 countries assigned less than 10% of the weight to this output. This situation is
expected since we know that the choice of the weights follows the scheme that most
benefits the countries, and, in the case of HIV-positive TB cases, the treatment success
rates are lower than in other cases. However, 7 countries have assigned more than 30%
of their weight to this output, which are the countries with highest treatment success
rates for this category of patients (see for example Burundi) and countries that have
divided the weight more equally through the four outputs in our DEA model (see for
example Uganda).
When we analyse the optimal share of contribution of the outputs chosen for each
country, it is more prudent to take conclusions about the non-effective countries rather
than the effective ones. This occurs because this weight distribution is the one that
maximizes their effectiveness score and if they are not effective in this scenario, they
will not be in any different one. However, one cannot have this certainty about effective
countries. For the effective countries, there is a possibility of existing a different weight
distribution that produces the same effectiveness results and, if this is the case, the
interpretation of the relative importance of each output can assume completely
difference values. Cooper, Ruiz & Sirvent (2007) corroborate this by affirming that, for
the units that score 100%, we may have different optimal weights associated with the
performance score of a given unit and this may provide very different insights into the
role played by the variables used in the performance assessment.
In what refers to the effective countries, table 8 allows us to see that China and
Bangladesh assume the strongest positions as benchmarks, since they serve as an
example for 20 different non-effective countries. After them, Burundi is a reference for
14 countries and Pakistan for only 2. The reason for this situation relates to the weight
scheme that these countries have used. Countries with unusual weight distribution tend
to be the reference for a low number of non-effective countries. The following table
presents the peers (effective countries that act like benchmarks) and the lambdas
(weight of each peer) for every country:
Table 7: Summary of Benchmarks (peers and lambdas)

27
DMU Benchmarks
Argentina Bangladesh (0,63) China (0,37)
Bangladesh 20
Belarus Bangladesh (0,51) China (0,49)
Botswana Burundi (0,89) China (0,11)
Brazil Bangladesh (0,72) China (0,28)
Burundi 14
China 20
Colombia Bangladesh (0,63) China (0,37)
Dominican Republic Bangladesh (0,69) Burundi (0,31)
Georgia Bangladesh (0,26) China (0,52) Pakistan (0,21)
Guatemala* Bangladesh (0,84) Burundi (0,16)
Haiti* Bangladesh (0,31) Burundi (0,69)
India Bangladesh (0,02) China (0,78) Pakistan (0,20)
Indonesia Bangladesh (0,45) China (0,55)
Iran (Islamic Republic of) Bangladesh (0,32) China (0,68)
Kazakhstan Bangladesh (0,88) Burundi (0,12)
Kenya* Bangladesh (0,20) Burundi (0,80)
Lesotho* Burundi (0,83) China (0,17)
Malaysia China (1,00)
Mexico Bangladesh (0,46) Burundi (0,54)
Namibia* Burundi (0,61) China (0,39)
Nigeria* Burundi (0,48) China (0,52)
Pakistan 2
Peru* Bangladesh (0,92) China (0,08)
Republic of Moldova Bangladesh (0,80) China (0,20)
Romania China (1,00)
Rwanda Burundi (1,00)
South Africa Burundi (0,30) China (0,70)
Tajikistan Bangladesh (0,92) China (0,08)
Turkey Bangladesh (0,88) China (0,12)
Uganda Burundi (1,00)
Ukraine Bangladesh (0,06) China (0,94)

28
United Republic of
Tanzania
Bangladesh (0,90) Burundi (0,10)
As we mentioned before, China and Bangladesh are the strongest benchmarks
(these countries work as benchmark to a large number of non-effective countries) and
for that reason it is important to identify and understand their strategies, practices and
how they overcome their problems, so that other countries can learn from them. In the
case of China, there were several improvements and new strategies implemented that
can justify this performance. Primarily, these results can be attributed to the expansion
to the entire country of the DOTS program, implemented in 2001 by the Chinese Center
for Disease Control and Prevention (Lin et al., 2015). By implementing this program,
they were able to increase coverage and treatment success, since during the entire
course of treatment, the medication is provided and directly observed by a healthcare
worker. With this, patients’ adherence to the treatment was significantly improved.
Moreover, according to WHO (2013), in China, the cost of TB treatment, provided as a
public service, is covered by domestic healthcare budgets, often supplemented by
international grants or loans. Olson, English & Claiborne (2014) refer that MDR-TB is
covered by medical insurance for all patients and close to 70% of the entire cost is
returned to the patient. This helps to reduce the financial barriers and financial burden
of the disease which could lead to giving up treatment.
In addition to all this, several other improvements in the Chinese programs are
worth to be pointed out. Indeed, the Chinese government has been investing in
diagnostic technologies and scientific research to contribute to the development of new
drugs and drug regimens. Cell phones have been used in a pilot study to alert or remind
patients to take medicine and to convey information about the side effects of treatment
to physicians (Olson et al., 2014).
In the case of Bangladesh there are also numerous policies and events that may
justify the good performance of this country. This country is, like China, under the
DOTS strategy, which started covering 99% of all population in 2003. In 2010, a five-
year cooperative agreement led by the United States Agency for International
Development, supported a project called TB CARE II Bangladesh financed by the
Global Fund and the Government of Bangladesh. With this project, Bangladesh could
fill its gaps with major emphasis on universal and early access to TB services,

29
Programmatic Management of Drug Resistant TB and health systems (Government of
the People’s Republic of Bangladesh, 2013). Moreover, laboratories quality assurance
and support systems at all levels, were also a concern. In fact, the National Tuberculosis
Control Program (NTP) has been improving since it was first implemented and
preserves high treatment success rates, having achieved WHO’s target of 85% treatment
success from 2003 until now.
Since Bangladesh is a low-income country, an important problem to address is the
financial burden of TB. Intending to overcome this issue, according to the Annual
Report of Tuberculosis Control in Bangladesh from 2013, the NTP guaranteed free
diagnostic and treatment services in all Upazila Health Complex, 44 Centers for Disease
Control, 12 Chest Disease Hospitals, workplaces, prisons, etc. All these strategies made
a significant difference on Bangladesh’s approach to TB patients, and that difference is
shown by its performance results presented above.
In the case of Burundi, the success achieved in the treatment of HIV-TB cases
(where the country achieves the highest treatment success rate) can also be explained by
some important policies and strategies that were implemented. Even though Burundi
has reduced financing capacity, the money donated by the Global Fund to Fight
Acquired Immunodeficiency Syndrome (AIDS), Tuberculosis and Malaria and other
partners, gave them the opportunity to fill the gaps in the existing programs and
improve results. Indeed, the United States Department of State (2015), emphasizes that
the following strategies have contributed for the improvement of TB results in Burundi:
systematic HIV testing among TB patients through the integration of HIV testing in all
centers of TB care: surveillance of HIV sero-prevalence among TB patients; systematic
integration of HIV prevention messages in structures for management of tuberculosis;
early initiation of antiretroviral therapy for patients on TB treatment; and capacity
building in centers for diagnosis and treatment so that they are able to provide quality
services with a regular supply of drugs, equipment and consumables necessary for the
diagnosis and treatment of co-infected patients.
The last of the effective countries, is Pakistan. Despite this country being a
reference (benchmark) for only 2 other countries, its performance score requires
attention. In fact, the effectiveness of this country has its foundations in some strategies
that were implemented. According to the Global Tuberculosis Report (WHO, 2016),
Pakistan has established partnerships between the public and private sectors, which led

30
to the implementation of an active screening for TB in private clinics, private hospitals
and laboratories, and guaranteed access to new faster diagnostic tests in private clinics
at a low or zero cost. The implementation of this partnerships translated in the increase
of the numbers of case notifications and improved patient’s monitorization. More
specifically, the number of case notifications in the city of Karachi doubled in one year
(WHO, 2016).
The treatment success rates for Pakistan are quite balanced. It’s highest treatment
success rate, like most countries, regards to new and relapsed cases of TB. The HIV-
positive TB cases has 81% treatment success and previously treated TB cases,
excluding relapses has 80%. The lowest treatment success rate refers to RR-/MDR-TB
cases. This is due to a severe problem with resistant TB, as high levels of ofloxacin
resistance were found in this country (WHO, 2016). According to Metzger, Baloch,
Kazi1 & Bile (2010), additional strategies funded by global and national sources, have
contributed to the significant improvement in case detection and to the treatment
success rates outlined above. These authors identify improvements in surveillance and
laboratory network and improvements in patients’ follow-up and treatment modalities
as the most significant changes in Pakistan’s TB control program. They explain that
“a 5-year plan was devised leading to universal DOTS coverage in the
public sector towards the end of 2005. The funding was lined up efficiently
by the federal Ministry of Health and provincial Departments of Health,
with responsibilities delineated and TB control activities integrated into
the primary health care system.”
(Metzger et al., 2010: 49)
Despite Rwanda not being considered one of the effective countries, the treatment
success rate of this country regarding RR-/MDR-TB deserves some attention. The
treatment of this category of patients suffered several alterations and because of that
Rwanda shows the highest treatment success. Rwanda recognized that there were in the
country high numbers of cases of MDR-TB and implemented several improvements to
address this problem, which translated in better results. Specifically speaking, Rwanda
went from a “twice a week” treatment in 1990, to a daily treatment in 2006. The
previous intermittent intake of medicines resulted in the appearance of MDR-TB cases
and created the need of effective strategies. In 2000, the Rwandan government created a

31
plan with the primary objective of rapidly transforming Rwanda into a middle-income
country, in which health was identified as a key pillar in the government’s vision for
economic development and poverty reduction (United Nations Office for Project
Services, 2014). With this program, it was possible to start undertaking home visits for
patients lost to follow-up and to improve treatment surveillance and monitorization.
Regarding the information provided by table 8, it is important to clarify how one
should interpret the values presented for each of the non-effective countries. Indeed, the
name of the country that is presented before the parenthesis is the peer, or in other
words, the effective country that the non-effective country should have as an example to
improve its own results. The number between parenthesis is the lambda (λ), or the
coefficients that should be applied to the output values of each peer in order to estimate
the target value for the non-effective country. In fact, with this information, DEA allows
us to analyze which countries serve as benchmark for the non-effective ones, the weight
of that influence and which effective countries are the strongest and serve as
benchmarks for a larger group. Moreover, one can easily calculate the targets for each
non-effective country.
The calculation of targets for non-effective countries is an interesting tool.
Argentina has an improvement score of 183,79%, obtained by calculating the
mathematical inverse of its effectiveness score presented in table 6. This score means
that Argentina should be able to improve its performance by 83,79%. However, one
does not know which values should the treatment success rates for each type of TB
assume. This is only possible by calculating the targets for each non-effective country,
as shown by the following formula. Consider that: “Tx1” is the target for the treatment
success rate for new and relapsed cases (output1) for country x; “B1” is the treatment
success rate of peer 1; “B2” is the treatment success rate of peer 2; λ1 is the weight of
peer 1; λ2 is the weight of peer 2.
𝑇𝑥1 = (𝐵1 λ1) + (𝐵2λ2)
Following this method, table 8 shows the targets for each non-effective country:
Table 8: Targets for non-effective countries

32
DMU Output 1 Output 2 Output 3 Output 4
Argentina 94% 87% 78% 61%
Belarus 94% 88% 78% 57%
Botswana 91% 85% 86% 87%
Brazil 94% 87% 77% 64%
Colombia 94% 87% 78% 61%
Dominican Republic 92% 85% 79% 78%
Georgia 93% 86% 79% 55%
Guatemala 93% 86% 77% 75%
Haiti 92% 85% 83% 86%
India 95% 88% 82% 48%
Indonesia 94% 88% 79% 56%
Iran (Islamic
Republic of) 94% 89% 80% 52%
Kazakhstan 93% 86% 76% 74%
Kenya 91% 84% 85% 88%
Lesotho 92% 85% 88% 84%
Malaysia 95% 90% 82% 42%
Mexico 92% 85% 81% 83%
Namibia 93% 86% 85% 73%
Nigeria 93% 87% 84% 66%
Peru 93% 86% 76% 70%
Republic of Moldova 93% 87% 76% 66%
Romania 95% 90% 82% 42%
Rwanda 91% 84% 87% 92%
South Africa 94% 88% 84% 57%
Tajikistan 93% 86% 76% 70%
Turkey 93% 86% 76% 68%
Uganda 91% 84% 87% 92%
Ukraine 95% 90% 82% 44%
United Republic of
Tanzania
93% 86% 76% 74%

33
With this information, and the information regarding their specific peers, each
country can plan strategies in order to achieve the specific values proposed as target for
each of the outputs. The success rates observed for some countries are already close to
the proposed targets, and therefore only small improvements are necessary. Others, like
Argentina or Brazil, are far from their targets and because of that, deeper changes are
needed to fill the gaps. Having effective countries as reference for reconsidering their
own practices is a useful strategy that can lead them to effective results. For example,
Argentina and Brazil can develop strategies based on the best practices observed in
Bangladesh and China, which we discussed previously.
4. CONCLUSION
Regarding the seriousness of the world situation and the worrying spread of TB,
public policies that can effectively improve the quality of life of the population
represent an urgent need. For the structures responsible for national TB programs, it is
necessary that effective actions are implemented to ensure detection, treatment and
prevention of TB. Despite all the efforts made and the several strategies undertaken in
TB prevention and control, this disease stills poses a massive health problem with huge
social and economic impacts. The WHO (2016) points to 6.1 million new TB cases in
2015 and makes clear that gaps in financing, prevention, treatment monitorization and
control must be filled.
To the best of our knowledge, there are no contributions exploring countries
effectiveness in TB prevention and control through DEA analysis. Consequently, it is
our aim that the present study makes a significant contribution to the knowledge in this
area. With this intention, we have proposed a DEA model to analyze the performance of
33 low and middle income countries regarding the treatment success rates in TB
prevention and control. In this model, we have included one single unitary input and 4
outputs.
Despite the practical and relatively simple use of DEA, this study faced several
obstacles and challenges through its development. Data unavailability for more recent
years and the existence of missing values for a high number of countries in WHO’s
reports, represents, probably, the most relevant challenge. In fact, information about

34
treatment success rates is missing for numerous countries for the year of 2013 and those
who have information, sometimes it does not comprehend all types of TB or patients’
categories. Moreover, information available for most of the countries, covers just a
single year or, when it covers more than one year, it is not for consecutive years.
Because of this, we were unable to perform a dynamic analysis of the performance of
countries but we believe that the present DEA model allowed some relevant findings.
We also advise some caution in the interpretation of the results for Guatemala, Haiti,
Kenya, Lesotho, Namibia, Nigeria and Peru (countries marked with the sign * in Tables
6 and 8) as for these countries output 1 does not include the relapsed cases. These cases
are accounted in output 2. Considering that none of these countries was considered
effective, that means that their TB treatment success rates did not impact the
effectiveness scores of the other countries. However, considering that the prognosis of
treatment for new and relapsed cases is better that for previously treated TB cases,
excluding relapses, it is likely that the effectiveness scores for these countries are
overestimated.
Other important challenge we faced relates to the selection of the weight
restrictions imposed in the DEA model. In fact, one needs to consider the possibility
that the selected weight restrictions may benefit the effective countries and, by imposing
a weight scheme far from the real priorities of the countries, we might make them look
effective when in reality they are not. Although we have pointed above several studies
that have used weight restrictions, further investigation about this issue needs to be done
in order to guarantee meaningful conclusions.
Despite the exploratory nature of this study, there are some important conclusions
that need to be highlighted. Among the 33 countries, China, Bangladesh, Burundi and
Pakistan were considered effective in TB prevention and control. Although the standard
deviation of the performance scores does not constitute a very surprising number, the
analysis case by case showed significant variation in some countries. This indicates that
countries could make better use of their resources and consequently achieve better
results. Furthermore, our study allowed the identification of the benchmarks and some
of their best practices, and helped establish specific targets so that the non-effective
countries can plan strategies in order to achieve those targets. Regarding the
identification of the specific causes behind poor performance and the reasons why

35
specific strategies are not being effective in TB prevention and control, deeper
investigation deserves to be done.
5. REFERENCES
Amado, C. A. F., & Dyson, R. G. (2008). On comparing the performance of primary
care providers. European Journal of Operational Research, 185, 915–932.
Amado, C. A. F., José, M. S., & Santos, S. P. (2016). Measuring active ageing : A Data
Envelopment Analysis approach. European Journal of Operational Research, 255,
207–223. https://doi.org/10.1016/j.ejor.2016.04.048
Asmild, M., Paradi, J. C., Reese, D. N., & Tam, F. (2007). Measuring overall efficiency
and effectiveness using DEA. European Journal of Operational Research, 178,
305–321.
Charnes, A., Cooper, W. W., Rhodes, E. (1978). Measuring the efficiency of decision
making units. European Journal of Operational Research, 2, 429–444.
Cherchye, L., Moesen, W., & Van Puyenbroeck, T. (2004). Legitimately Diverse , yet
Comparable : On Synthesizing Social Inclusion Performance in the EU *. Journal
of Commom Market Studies, 42(5), 919–955.
Cherchye, L., Moesen, W., Rogge, N. & Van Puyenbroeck, T. (2007). An introduction
to “benefit of the doubt” composite indicators. Social Indicators Research, 82,
111–145.
Cherchye, L., Moesen, W., Rogge, N., & Van Puyenbroeck, T. (2008). Knowledge
Economy Indicators: “Benefit of the doubt” composite indicators. Retrieved from
https://www.uni-trier.de/fileadmin/fb4/projekte/SurveyStatisticsNet/KEI-WP5-
D5.3.pdf (accessed on 18th of August of 2016)
Cherchye, L., Moesen, W., Rogge, N., Van Puyenbroeck, T., Saisana, M., Saltelli, A.,
Liska, R. & Tarantola, S. (2008). Creating composite indicators with DEA and
robustness analysis : the case of the Technology Achievement Index. Journal, 59,
239–251.

36
Cooper, W. W., Ruiz, J. L., & Sirvent, I. (2007). Choosing weights from alternative
optimal solutions of dual multiplier models in DEA. European Journal of
Operational Research, 180, 443–458. https://doi.org/10.1016/j.ejor.2006.02.037
Cooper, W. W., Seiford, L. M., & Zhu, J. (2011). Data Envelopment Analysis : History,
Models, and Interpretations, in W. W. Cooper, L. M. Seiford and J. Zhu (2nded.)
Handbook on Data Envelopment Analysis. International Series in Operations
Research & Management Science, Berlim: Springer
Debreu, G. (1951). The Coefficient of Resource Utilization. Econometrica, 19(3), 273–
292.
Dimitrov, S., & Sutton, W. (2010). Promoting symmetric weight selection in data
envelopment analysis : A penalty function approach. European Journal of
Operational Research, 200(1), 281–288. https://doi.org/10.1016/j.ejor.2008.11.043
Farrel, M. J. (1957). The Measurement of Productive Efficiency. Journal of the Royal
Statistical Society, 120(3), 253–290.
Golany, B. (1988). An Interactive MOLP Procedure for the Extension of DEA to
Effectiveness Analysis. Journal of the Operational Research Society, 39(8), 725–
734.
Government of the People’s Republic of Bangladesh. (2013). Tuberculosis Control in
Bangladesh: Annual Report 2013. Retrieved from
http://www.dghs.gov.bd/images/docs/NTP/Tuberculosis Control in Bangladesh
Annual Report 2013.pdf (accessed on 24th of October of 2016)
Hollingsworth, B. (2003). Non-Parametric and Parametric Applications Measuring
Efficiency in Health Care. Health Care Management Science, 6, 203–218.
Jassal, M. S. & Bishai, W. R. (2010). The Epidemiology and Challenges to the
Elimination of Global Tuberculosis. Clinical Infectious Diseases, 50(3), 1–19.
Retrieved from https://www.ncbi.nlm.nih.gov/pmc/articles/PMC4575217/
(accessed on 5th of November of 2016)

37
Khan, M. S., Fletcher, H., & Coker, R. (2016). Investments in tuberculosis research –
what are the gaps ? BMC Medicine, 14(123), 1–5. https://doi.org/10.1186/s12916-
016-0644-0
Koopmans, T. (1951). ‘An Analysis of Production as an Efficient Combination of
Activities’, in T. Koopmans (Ed.), ‘Activity Analysis of Production and
Allocation’. Cowles Commission for Research in Economics, Monograph 13, New
York: Wiley.
Kopp, J. R. (1981). The Measurement of Productive Efficiency: A Reconsideration. The
Quarterly Journal of Economics, 96(3), 477–503.
Lin, H., Wang, L., Zhang, H., Ruan, Y., Chin, D. P., & Dye, C. (2015). Tuberculosis
control in China : use of modelling to develop targets and policies. Bulletin of the
World Health Organization, 93, 790–798.
Lins, M. P. E., Silva, A. C. M., & Lovell, C. A. K. (2007). Avoiding infeasibility in
DEA models with weight restrictions. European Journal of Operational Research,
181, 956–966. https://doi.org/10.1016/j.ejor.2006.05.041
Lovell, C. A. K., Pastor, J. T., & Turner, J. A. (1995). Measuring macroeconomic
performance in the OECD : A comparison of European and non-European
countries. European Journal of Operational Research, 87, 507–518.
Metzger, P., Baloch, N. A., Kazi, G. N., & Bile, K. M. (2010). Tuberculosis control in
Pakistan : reviewing a decade of success and challenges. Eastern Mediterranean
Health Journal, 16, 47–53.
Okanurak, K., Kitayaporn D., Akarasewi, P. (2008). Factors contributing to treatment
success among tuberculosis patients : a prospective cohort study in Bangkok.
International Journal of Tuberculosis and Lung Diseases, 12(10), 1160–1165.
Olson, S., English, R. A., & Claiborne, A. B. (2014). The Global Crisis of Drug-
Resistant Tuberculosis and Leadership of China and the BRICS : Challenges and
Opportunities : Summary of a Joint Workshop by the Institute of Medicine and the
Institute of Microbiology , Chinese Academy of Sciences. Washington, DC: The
National Academies Press.

38
Pedraja-chaparro, F., Salinas-Jimenez, J., & Smith, P. (1997). On the Role of Weight
Restrictions in Data Envelopment Analysis. Journal of Produtivity Analysis, 8(2),
215–230.
Podinovski, V. V. (2004). Production trade-offs and weight restrictions in data
envelopment analysis. Journal of Produtivity Analysis, 55, 1311–1322.
Podinovski, V. V. (2016). Optimal weights in DEA models with weight restrictions.
European Journal of Operational Research, 000, 1–9.
Roll, Y., Cook, W. D., & Golany, B. (n.d.). Controlling Factor Weights in Data
Envelopment Analysis. IIE Transactions, 23(1), 2–9.
Saisana, M., & Tarantola, S. (2002). State-of-the-Art Report on Current Methodologies
and Practices for Composite Indicator Development. European Commission, Joint
Research Centre, Ispra, Italy.
Santos, S. P., Amado, C. A. E., & Santos, M. F. (2012). Assessing the Efficiency of
Mother-to-Child HIV Prevention in Low- and Middle-Income Countries using
Data Envelopment Analysis. Centro de Estudos e Formação Avançada Em Gestão
E Economia - Universidade de Évora, 2.
Schinnar, A. P., Kamis-Gould, E., Delucia, N., & Rothbard, A. B. (1990).
Organizational Determinants of Efficiency and Effectiveness in Mental Health
Partial Care Programs. Health Services Research, 25(2), 387–420.
State, U. S. D. of. (2015). Burundi Operational Plan (COP/ROP) 2015: Strategic
Direction Summary. Retrieved from
https://www.pepfar.gov/documents/organization/250387.pdf (accessed on 14th of
November of 2016)
United Nations Office for Project Services (2014). Rwanda, 20 years on: an inspiration
for health systems strengthening. Retrieved from
http://www.stoptb.org/news/stories/2014/ns14_021.asp (accessed on 4th of
December of 2016)

39
Wong, H. B., & Beasley, J. E. (1990). Restricting Weight Flexibility in Data
Envelopment Analysis. Journal of the Operational Research Society, 41(9), 829–
835.
World Health Organization (2004). Compendium of Indicators for Monitoring and
Evaluating National Tuberculosis Programs. Retrieved from
http://apps.who.int/iris/bitstream/10665/68768/1/WHO_HTM_TB_2004.344.pdf
(accessed on 3rd of March of 2016)
World Health Organization (2010). The world health report: health systems financing -
the path to universal coverage. World Health Organization Library Cataloguing-in-
Publication Data. Retrieved from
http://apps.who.int/iris/bitstream/10665/44371/1/9789241564021_eng.pdf
(accessed on 1st of November of 2015)
World Health Organization (2011). Global Tuberculosis Control: WHO report 2011.
World Health Organization Library Cataloguing-in-Publication Data. Retrieved
from http://apps.who.int/iris/bitstream/10665/44728/1/9789241564380_eng.pdf
(accessed on 3rd of March of 2016)
World Health Organization (2013). The world health report 2013: research for universal
health coverage. World Health Organization Library Cataloguing-in-Publication
Data. Retrieved from
http://apps.who.int/iris/bitstream/10665/85761/2/9789240690837_eng.pdf?ua=1
(accessed on 25th of April of 2016)
World Health Organization (2014). Global Tuberculosis Report. World Health
Organization Library Cataloguing-in-Publication Data. Retrieved from
http://apps.who.int/iris/bitstream/10665/137094/1/9789241564809_eng.pdf
(accessed on 1th of November of 2015)
World Health Organization (2015). Global Tuberculosis Report. World Health
Organization Library Cataloguing-in-Publication Data. Retrieved from
http://apps.who.int/iris/bitstream/10665/191102/1/9789241565059_eng.pdf
(accessed on 15th of November of 2015)

40
World Health Organization (2016). Global Tuberculosis Report. World Health
Organization Library Cataloguing-in-Publication Data. Retrieved from
http://apps.who.int/iris/bitstream/10665/250441/1/9789241565394-eng.pdf?ua=1
(accessed on 1st of December of 2016)
Zanella, A., Camanho, A. S., & Dias, T. G. (2013). Benchmarking countries’
environmental performance. Journal of the Operational Research Society, 64,
426–438.