Factsheet - December 2015 - principalindia.com · the methodology for determining the base rate...
40
Transcript of Factsheet - December 2015 - principalindia.com · the methodology for determining the base rate...


PRODUCT SUITABILITYScheme Names This product is suitable for investors who are seeking~ RISKOMETER Pg.
No.
Principal Large Cap Fund • Long term Capital Growth. • Investment in equity & equity related securities 8(An Open-ended Equity Scheme) including equity derivatives of large capitalization Companies
Principal Emerging Bluechip Fund • Long term Capital Growth. • Investment in equity & equity related securities 9(An Open-ended Equity Scheme) including equity derivatives of mid & small capitalization Companies.
Principal Growth Fund • Long term Capital Growth. • Investment in equity & equity related securities 10(An Open-ended Equity Scheme) including equity derivatives of companies across market capitalization.
Principal Dividend Yield Fund • Long term Capital Growth. • Investment in equity & equity related securities 11(An Open-ended Equity Scheme) including equity derivatives of high dividend yield Companies.
Principal Index Fund - Nifty • Long term Capital Growth. • Investment in equity securities including 12(An Open-ended Index Scheme) equity derivatives of Nifty 50 Companies.
Principal Index Fund - Midcap • Long term Capital Growth. • Investment in equity securities including 13(An Open-ended Index Scheme) equity derivatives of Nifty Midcap 100 Index.
Principal SMART Equity Fund • Long term Capital Growth. • Investment in equity & equity related securities 14(An Open-ended Equity Scheme) including equity derivatives of large capitalization Companies as well as Debt/
Money Market securities through a systematic allocation of Funds betweenEquity & Debt on the basis of the Price Earnings Ratio of Nifty 50.
Principal Personal Tax Saver Fund • Long term Capital Growth with a three year lock-in. 15(An Open-ended Equity Linked Savings Scheme) • Investment in equity & equity related securities including equity
derivatives of large capitalization Companies.
Principal Tax Savings Fund • Long term Capital Growth with a three year lock-in. 16(An Open-ended Equity Linked Savings Scheme) • Investment in equity & equity related securities including equity
derivatives of companies across market capitalization.
Principal Balanced Fund • Income and Long term Capital Growth. • Investment in equity & equity 17(An Open-ended Balanced Scheme) related securities, debt/money market securities as well as derivatives.
Principal Debt Savings Fund - MIP • Income and Capital Growth over a medium term investment horizon. 18An Open-ended Income Fund • Investment primarily in debt/money market securities with exposure in(Monthly Income is not assured and is subject equity & equity related instruments including equity derivatives.to the availability of distributable surplus)
Principal Debt Savings Fund - Retail Plan • Income over a long term investment horizon. 19(An Open-ended Income Scheme) • Investment in Debt & Money Market Instruments.
Principal Government Securities Fund • Income over a long term investment horizon. 20(An Open-ended dedicated Gilt Scheme • Investment in Government Securities.investing in Government Securities)
Principal Dynamic Bond Fund • Income over a long term investment horizon. 21(An Open-ended Income Scheme) • Investment in Debt & Money Market Instruments.
Principal Debt Opportunities Fund - • Income over a long term investment horizon. 22Corporate Bond Plan • Investment in Debt & Money Market Instruments of(An Open-ended Debt Scheme) Private & Public Sector Companies.
Principal Income Fund - Short Term Plan • Income over a medium term investment horizon. 23(An Open-ended Income Scheme) • Investment in Debt & Money Market Instruments.
Principal Bank CD Fund • Income over a medium term investment horizon. 24(An Open-ended Debt Scheme) • Investment in Bank CDs, Debt & Money Market Instruments.
Principal Debt Opportunities Fund - • Income over a short term investment horizon. 25Conservative Plan • Investment in Debt & Money Market Instruments.(An Open-ended Debt Scheme)
Principal Retail Money Manager Fund • Income over a short term investment horizon. 26(An Open-ended Debt Scheme) • Investment in Debt & Money Market Instruments.
Principal Global Opportunities Fund • Long term Capital Growth. 26(An Open-ended Fund of Funds Scheme) • Investment in overseas mutual fund schemes.
Principal Cash Management Fund • Income over a short term investment horizon. 27(An Open-ended Liquid Scheme) • Investment in Debt & Money Market Instruments,
with maturity not exceeding 91 days.
Principal Asset Allocation Fund-of-Funds - • Income and Capital growth over a long term investment horizon. 28Conservative Plan • Investment primarily in debt/money market mutual funds with some(An open-ended Fund-of-Funds Scheme) exposure to equity mutual funds.
Principal Asset Allocation Fund-of-Funds - • Capital growth and Income over a long term investment horizon. 28Moderate Plan • Investment in a basket of equity mutual funds, debt/money market(An open-ended Fund-of-Funds Scheme) mutual funds and Gold ETFs.
Principal Asset Allocation Fund-of-Funds - • Capital growth over a long term investment horizon. 28Aggressive Plan • Investment primarily in equity mutual funds with some allocation to(An open-ended Fund-of-Funds Scheme) debt/money market mutual funds and Gold ETFs.
~ Investors should consult their financial advisers if in doubt about whether the product is suitable for them.

INVEST KNOWHOW December 20153
Debt Markets
Fund Manager Commentary
December 2015
Fixed Income Update for December 2015
Key Market Highlights:
• Long end gilt yields rose during the month as heavy positioning, fading investor
appetite, FII sales and rising global bond yields weighed on sentiment. Corporate
bond yields rose as spreads widened, tax free bonds supply came in the market and
FIIs sold on year end considerations. Money market yields at the short end were
largely flattish, however one year rates rose as liquidity conditions tightened.
• RBI kept key rates unchanged as widely expected at its Monetary Policy Review
held on December 1st. RBI also continued to reiterate the accommodative stance
maintained as inflation forecasts for January 2016 are broadly expected to be met
and growth continues to remain a concern. Later in the month, RBI also released
the methodology for determining the base rate based on the marginal cost of funds,
which all banks will move to. This is to ensure RBI rate actions are suitably transmitted
by the banking system to the end consumers.
• The ten year AAA PSU Corporate bond benchmark closed at 8.41%, 13 bps higher
than previous month. The five year PSU AAA corporate bond benchmark closed
at 8.39%, 16 bps higher as compared to previous month.
• 1 year CD rates rose by 5 bps to close at 7.70%. 1 year T-bill yield also rose by 5 bps
to close at 7.22%.
• Brent Crude oil prices ended lower at USD 35 per barrel during the month as
compared to USD 43 in previous month.
• INR appreciated during the month and closed at 66.15 as against 66.75 in previous
month. For the month of December, FIIs were net sellers in the debt market to the
tune of ` 4,100 crore. Risk aversion and year end profit booking could probably
be the main reasons.
• The ten year benchmark US treasury yield ended 4 bps higher at 2.26%.
• November WPI data release came at -1.99% as compared to -3.81% in previous
month. CPI for November came at 5.41% compared to 5.0% in previous month.
• October Industrial production (IIP) growth rose to 9.8% yoy reflecting festive demand
and positive base effects.
• Banking system liquidity deficit averaged ` 96,000 crore approx. combined for
daily LAF, term and variable LAF and MSF. Overnight rates remained stable around
6.7% -7.10% during the month. RBI announced an OMO (purchase) worth
` 10,000 crore which was fully subscribed and accepted on 7th Dec, 2015. RBI has
also been conducting OMO purchases vis the NDS system as shown by data.
• RBI released calendar of market borrowings by State Government for Jan-March
2016 quarter. This is expected to be in range of ̀ 95,000 crore to ` 1,05,000 crore
RBI also released the T bill borrowing calendar for same period. Market borrowings
through 91 day, 182 day and 364 day t bill are expected to be in the range of
` 1,89,000 crore.
• India's fiscal deficit reached ̀ 4.84 lakh crore ($73.2 billion) during April-November
2015, or 87 per cent of the full-year target, as shown by government data.
Government officials have repeatedly reiterated that fiscal deficit targets for
FY 2016 (at 3.9% to GDP) would be met.
Outlook:
• As base effects wear off, we expect CPI to rise towards 6% in January 2016.
WPI may also rise and come into positive territory in the range of -0.5% to 0.5%.
• Fresh limits will be available to FPIs (Foreign portfolio investors) for dated gilts and
SDLs. This may lead to demand for short to medium end tenors.
• Banking system liquidity deficit is expected to increase further in January due to
lower maturities and higher auction outflows. It’s expected to be in the range of
` 1,25,000 crore to 1,65,000 crore for the month on an average. RBI may announce
OMO purchases to inject liquidity on a permanent basis into the banking system.
• Short term money market yields upto 3 month maturity are expected to remain
range bound. We expect the March maturity CD rate to trade in range of
7.05-7.25%.
• The ten year benchmark g sec yield is expected to trade in a range of 7.70-7.80%
during the month. The five year AAA PSU corporate bond benchmark is expected to
trade in a range of 8.10%-8.50%.

INVEST KNOWHOW December 20154
Fund Manager Commentary
Equity Markets
Review of Equity Market for the Month of December 2015
The Indian equity markets closed in negative for the calendar year, with the Nifty down
about 4% as given below. The Mid-Caps and Small-Caps however did better, up about
6-7% during the year. As a category, the Emerging markets underperformed the
Developed Markets during the year. The MSCI EM Index (USD) was down 17% during
the year, while the MSCI World index, dominated by the developed markets, was down
2.7%. A major portion of the fall was on account of weak performance of the
EM currencies. India was among the better performing Emerging Markets, with
MSCI EM down 3% during the year. During the month, MSCI India (USD) was up 1.7%,
while MSCI EM was down 2.5%.
The year was marked by weakness in commodity prices, with prices of Crude Oil, Iron
Ore, Thermal Coal, Copper, Zinc, Aluminum, Steel, Natural Gas etc. down sharply
during the year. The Thomson Reuters Commodity Index was down 23% during the
year. Specifically, Crude Oil (Brent) was down more than 30% during the year, with
16% of the fall happening in the month of December itself. The sharp fall in crude has
been positive for corporates helping bring down their energy costs and for the government
budget. The government has raised excise duties on petrol and diesel thrice in the
current fiscal, including twice in the last two weeks, which is expected to raise about
` 10,000 crores of revenue.
In terms of flows, net FII flows into India were sharply lower at USD 3.3 Billion in 2015
(CY 2014: USD 16 Bio). However, EM equity funds as a category had redemptions of
USD 63 Billion during the year. In contrast, domestic investors were net buyers for the
year, buying about USD 10.3bn. Among DIIs, Mutual funds led the buying with an
impressive year end tally of USD 10.8bn. Domestic Insurance companies had net outflows
of USD 510mn during the year. However, FDI flows have been strong this year, likely
driven by interest from PE investors, who have invested USD 21 Billion in 2015 in Indian
companies, according to published reports.
In macroeconomic data, the November CPI rose to a 14-month high, at 5.4% vs 5% in
October, led by food items (esp. pulses, sugar and edible oils). India’s merchandise
exports fell for the 12th consecutive month in November (down 24% to $ 20 Billion).
Imports declined 30% to $ 30 Bio in November. Cumulatively, in April-November, India's
imports were USD 261 Bio (-17%). However, non-oil, non-gold imports have not declined
much and are virtually flat. The October IIP surged sharply to a 5 year high at 9.8% vs
3.6% in Sep due to one-off from shift in festival season this year. However, this is a
lumpy number and is quite volatile, especially as a result of a base effect.
On the policy front, the GST bill remains stalled in parliament. However, there is more
positive news in other areas. As an example, 12 states have now joined the UDAY
scheme for resolution of power sector problems, with UP also coming on board. 90% of
the LPG consumers now receive the LPG subsidy in their bank accounts now, which is a
meaningful achievement to plug leakages. Roads and railways continue to see capex.
However, revival in private sector capex is some time away. However, according to CMIE
data, projects that were abandoned / shelved / stalled declined in value terms in the
last quarter. This is the fifth consecutive quarter of decline i.e. there has been continued
improvement in stalled projects. (Morgan Stanley report). Another area of stress is
agriculture, where poor rains, lower increase in MSPs and weak soft commodity prices
have caused severe rural stress. According to data, rabi sowing has been lower this year,
compared to the previous year.
The corporate earnings are likely to witness downgrades in the short term but FY17
growth likely to be better. FY16 earnings growth is likely to be barely around 5%-6%.
FY17 earnings expectations still remain at 18%-20% but more likely these could grow
around 13%-15%.
December 2015
PERFORMANCE AS ON DECEMBER 31, 2015*
Index 1 Month 3 Months 6 Months 1 Year(%) (%) (%) (%)
Broad Markets
Nifty 50 7946 0.14 -0.03 -5.04 -4.06
S&P BSE Sensex 26118 -0.11 -0.14 -5.99 -5.03
S&P BSE 100 8098 0.19 0.25 -4.33 -3.25
S&P BSE 200 3378 0.36 0.76 -3.49 -1.48
S&P BSE 500 10634 0.50 1.29 -2.47 -0.82
S&P BSE MID CAP 11143 1.40 3.18 4.34 7.43
S&P BSE SMALL CAP 11837 1.72 7.40 6.87 6.76
Sectoral Performance
S&P BSE AUTO 18519 -2.35 6.49 -1.03 -0.60
S&P BSE Bankex 19329 -2.95 -1.79 -7.88 -9.92
S&P BSE CG 14128 -3.15 -6.51 -19.35 -8.51
S&P BSE CD 11998 -3.76 10.99 11.65 24.02
S&P BSE FMCG 7872 -0.51 1.55 1.06 1.36
S&P BSE METAL 7398 3.93 8.26 -20.75 -31.20
S&P BSE Oil & Gas 9556 2.44 9.90 -3.08 -3.43
S&P BSE PSU 6814 -0.99 1.78 -10.79 -17.18
S&P BSE Teck 6053 1.85 -3.24 2.16 3.61
S&P BSE HC 16905 3.72 -4.92 2.06 15.06
*Performance for less than one year period are absolute returns.
Source - MFI Explorer

INVEST KNOWHOW December 20155
Funds at a Glance
EQUITY SCHEMES
Particulars Principal Principal Personal Principal Principal Principal Debt Savings Fund -SMART Equity Fund Tax Saver Fund Tax Savings Fund Balanced Fund Monthly Income Plan
Nature of the An Open-ended An Open-ended Equity An Open-ended Equity An Open-ended An Open-ended Income FundScheme Equity Scheme Linked Savings Scheme Linked Savings Scheme Balanced Scheme (Monthly Income is not assured
and is subject to the availabilityof distributable surplus)
Allotment Date- Regular Plan December 16, 2010 March 31, 1996 March 31, 1996 January 14, 2000 May 23, 2002
- Direct Plan January 2, 2013 January 2, 2013 January 2, 2013 January 2, 2013 January 2, 2013
Investment Plans / Regular Plan & Direct Plan. Regular Plan & Direct Plan. Regular Plan & Direct Plan. Regular Plan and Direct Plan. Regular Plan & Direct Plan.Options Both the Plans offer Growth & Both the Plan do not have Both the Plan do not have Both the Plans offer Growth & Both the Plans offer
Half Yearly Dividend Option. any options at present. any options at present. Half Yearly Dividend Option. Dividend & Growth Option.Half Yearly Dividend Option Half Yearly Dividend Option Dividend Frequencies -under both the Plans offers under both the Plan offers Monthly / Quarterlyfacility of Payout, Reinvestment facility of Payout,Reinvestmentand Sweep. and Sweep.
Fund Manager & Anupam Tiwari Anupam Tiwari P.V.K. Mohan P.V.K. Mohan Pankaj JainManaging the July 2011 July 2011 September 2010 May 2010 January 2012Current Fund from
Total Investment 10 years 10 years 22 years 22 years 13 yearsExperience
Benchmark Crisil Balanced Fund Index S&P BSE 100 Index S&P BSE 200 Index Crisil Balanced Fund Index Crisil MIP Blended Index
Minimum New Investor: ` 5,000 New Investor: ` 500 New Investor: ` 500 New Investor: ` 5,000 New Investor: ` 5,000Application Amount Existing Investor: ` 1,000 Existing Investor: ` 500 Existing Investor: ` 500 Existing Investor: ` 1,000 Existing Investor: ` 1,000
Cut Off Time# 3.00 pm 3.00 pm 3.00 pm 3.00 pm 3.00 pm
Exit Load 1% if redeemed Nil Nil If redeemed on or before 1 Year from the(including SIP /STP / within 1 year from the date of allotment - 1%.SWP, if available) date of allotment.
SIP Available
SWP / STP Available Available after lock-in period Available Available
Minimum No. & 6 installment of 6 installments of ` 500/- each. 6 installment of SIP - ` 2,000/- each, STP - ` 1,000/- eachAmt. of SIP/SWP/STP SIP - ` 2,000/- each, & SWP - ` 500/- each.(if available) STP - ` 1,000/- each &
SWP - ` 500/- each.
EQUITY SCHEME EQUITY LINKED SAVINGS SCHEME (ELSS)^ TARGET RISK FUNDS
Particulars Principal Principal Emerging Principal Principal Principal PrincipalLarge Cap Fund Bluechip Fund Growth Fund Dividend Yield Fund Index Fund - Nifty Index Fund - Midcap
Nature of the An Open-ended An Open-ended An Open-ended An Open-ended An Open-ended An Open-endedScheme Equity Scheme Equity Scheme Equity Scheme Equity Scheme Index Scheme Index Scheme
Allotment Date- Regular Plan November 11, 2005 November 12, 2008 October 25, 2000 October 15, 2004 July 27, 1999 May 12, 2014
- Direct Plan January 2, 2013 January 2, 2013 January 2, 2013 January 2, 2013 January 2, 2013 May 12, 2014
Investment Plans / Regular Plan & Direct Plan. Both the Plans offer Growth & Half Yearly Dividend Option. Regular Plan & Direct Plan. Both the Plans offerOptions Half Yearly Dividend Option under both the Plans offers facility of Payout, Reinvestment and Sweep. Growth & Dividend Option. Dividend Option under
both the Plans offers facility of Payout,Reinvestment and Sweep.
Fund Manager & Anupam Tiwari Dhimant Shah P.V.K. Mohan Dhimant Shah Rajat Jain Rajat JainManaging the July 2011 June 2011 September 2010 December 2011 August 2015 August 2015Current Fund from
Total Investment 10 years 24 years 22 years 24 years 26 years 26 yearsExperience
Benchmark S&P BSE 100 Index Nifty Midcap 100 Index S&P BSE 200 Index Nifty Dividend Nifty 50 Index Nifty Midcap 100 IndexOpportunities 50 Index
Minimum New Investor: ` 5,000 New Investor: ` 5,000 New Investor: ` 5,000 New Investor: ` 5,000 New Investor: ` 5,000 New Investor: ` 5,000Application Amount Existing Investor: ` 1,000 Existing Investor: ` 1,000 Existing Investor: ` 1,000 Existing Investor: ` 1,000 Existing Investor: ` 1,000 Existing Investor: ` 1,000
Cut Off Time# 3.00 pm 3.00 pm 3.00 pm 3.00 pm 3.00 pm 3.00 pm
Exit Load If redeemed on or before 1 Year from the 1% - If redeemed within If redeemed on or before 1% - if redeemed on or before 90 days(including SIP /STP / date of allotment - 1% 365 days from the 1 Year from the from the date of allotment;SWP, if available) date of allotment. date of allotment - 1% Nil - if redeemed after 90 days from the
Nil - If redeemed after date of allotment.365 days from thedate of allotment.
SIP / SWP / STP Available
Minimum No. & 6 installments of SIP - ` 2,000/- each, STP - ` 1,000/- each & SWP - ` 500/- each.Amt. of SIP/SWP/STP(if available)
# In respect of purchase/switch-in of units in any of the Schemes (other than Liquid Schemes) for an amount equal to or more than ` 2 Lakhs, the closing NAV (Net Asset Value) of the day shall be applicable subject to realisationof the funds upto 3.00 p.m. and receipt of application (duly time stamped). ^ Lock-in of 3 years.
INVEST KNOWHOW December 20156
Funds at a Glance (Contd.)
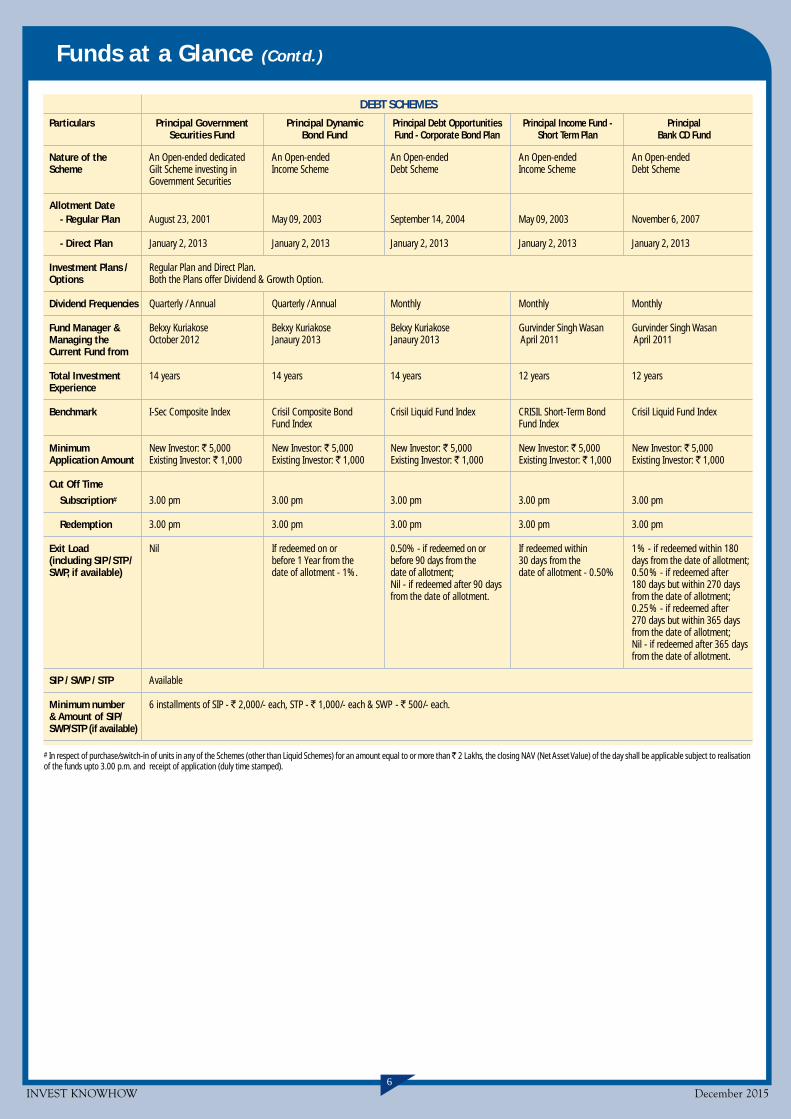
Particulars Principal Government Principal Dynamic Principal Debt Opportunities Principal Income Fund - PrincipalSecurities Fund Bond Fund Fund - Corporate Bond Plan Short Term Plan Bank CD Fund
Nature of the An Open-ended dedicated An Open-ended An Open-ended An Open-ended An Open-endedScheme Gilt Scheme investing in Income Scheme Debt Scheme Income Scheme Debt Scheme
Government Securities
Allotment Date- Regular Plan August 23, 2001 May 09, 2003 September 14, 2004 May 09, 2003 November 6, 2007
- Direct Plan January 2, 2013 January 2, 2013 January 2, 2013 January 2, 2013 January 2, 2013
Investment Plans / Regular Plan and Direct Plan.Options Both the Plans offer Dividend & Growth Option.
Dividend Frequencies Quarterly / Annual Quarterly / Annual Monthly Monthly Monthly
Fund Manager & Bekxy Kuriakose Bekxy Kuriakose Bekxy Kuriakose Gurvinder Singh Wasan Gurvinder Singh WasanManaging the October 2012 Janaury 2013 Janaury 2013 April 2011 April 2011Current Fund from
Total Investment 14 years 14 years 14 years 12 years 12 yearsExperience
Benchmark I-Sec Composite Index Crisil Composite Bond Crisil Liquid Fund Index CRISIL Short-Term Bond Crisil Liquid Fund IndexFund Index Fund Index
Minimum New Investor: ` 5,000 New Investor: ` 5,000 New Investor: ` 5,000 New Investor: ` 5,000 New Investor: ` 5,000Application Amount Existing Investor: ` 1,000 Existing Investor: ` 1,000 Existing Investor: ` 1,000 Existing Investor: ` 1,000 Existing Investor: ` 1,000
Cut Off Time
Subscription# 3.00 pm 3.00 pm 3.00 pm 3.00 pm 3.00 pm
Redemption 3.00 pm 3.00 pm 3.00 pm 3.00 pm 3.00 pm
Exit Load Nil If redeemed on or 0.50% - if redeemed on or If redeemed within 1% - if redeemed within 180(including SIP /STP / before 1 Year from the before 90 days from the 30 days from the days from the date of allotment;SWP, if available) date of allotment - 1%. date of allotment; date of allotment - 0.50% 0.50% - if redeemed after
Nil - if redeemed after 90 days 180 days but within 270 daysfrom the date of allotment. from the date of allotment;
0.25% - if redeemed after270 days but within 365 daysfrom the date of allotment;Nil - if redeemed after 365 daysfrom the date of allotment.
SIP / SWP / STP Available
Minimum number 6 installments of SIP - ` 2,000/- each, STP - ` 1,000/- each & SWP - ` 500/- each.& Amount of SIP/SWP/STP (if available)
DEBT SCHEMES
# In respect of purchase/switch-in of units in any of the Schemes (other than Liquid Schemes) for an amount equal to or more than ̀ 2 Lakhs, the closing NAV (Net Asset Value) of the day shall be applicable subject to realisationof the funds upto 3.00 p.m. and receipt of application (duly time stamped).

INVEST KNOWHOW December 20157
Funds at a Glance (Contd.)
Particulars Principal Debt Opportunities Principal Principal Retail Principal Debt Savings Principal GlobalFund - Conservative Plan Cash Management Fund Money Manager Fund~ Fund - Retail Plan~ Opportunities Fund
Nature of the An Open-ended Debt Scheme An Open-ended Liquid Scheme An Open-ended Debt Scheme An Open-ended Income Fund An Open-endedScheme Fund of Funds Scheme
Allotment Date- Regular Plan September 14, 2004 August 30, 2004 December 28, 2007 December 30, 2003 March 29, 2004
- Direct Plan January 2, 2013 January 1, 2013 January 1, 2013 January 2, 2013 January 2, 2013
Investment Plans/ Regular Plan and Direct Plan. Regular Plan and Direct Plan. Growth & Dividend Regular Plan and Direct Plan. Regular Plan & Direct Plan.Options/ Both the Plans offer Both the Plans offer Both the Plans offer Both the Plans offer Both the Plans offer
Dividend & Growth Option. Dividend & Growth Option. Dividend & Growth Option. Dividend~ and Growth Option. Growth & Dividend Option.Dividend Frequencies Dividend Frequency - Dividend Frequency - Dividend Frequency - Dividend Frequency - Dividend Option under both
Daily / Weekly / Monthly Daily / Weekly / Monthly Regular Plan~: Monthly / Quarterly the Plan offers facility ofDaily / Weekly / Monthly. Payout, Reinvestment andDirect Plan: Monthly Sweep.(Reinvestment)
Fund Manager & Pankaj Jain Pankaj Jain Pankaj Jain Pankaj Jain Rajat JainManaging the January 2012 January 2012 January 2012 January 2012 March 2004Current Fund from
Total Investment 13 years 13 years 13 years 13 years 26 yearsExperience
Benchmark Crisil Liquid Fund Index Crisil Liquid Fund Index Crisil Liquid Fund Index Crisil Short Term MSCI World IndexBond Fund Index
Minimum New Investor: ` 5,000 New Investor: ` 5,000 New Investor: ` 5,000 New Investor: ` 5,000 New Investor: ` 10,000Application Amount Existing Investor: ` 1,000 Existing Investor: ` 1,000 Existing Investor: ` 1,000 Existing Investor: ` 1,000 Existing Investor: ` 1,000
Cut Off TimeSubscription# 3.00 pm 2.00 pm 3.00 pm 3.00 pm 12.30 pm
Redemption 3.00 pm 3.00 pm 3.00 pm 3.00 pm 12.30 pm
Exit Load Nil Nil Nil If redeemed on or before If redeemed on or before(including SIP /STP / 30 days from the 1 Year from theSWP, if available) date of allotment - 1%. date of allotment - 1%.
SIP / SWP / STP Available
Minimum number 6 installments of SIP - ` 2,000/- each, STP - ` 1,000/- each & SWP - ` 500/- each.& Amount of SIP/SWP/STP (if available)
DEBT SCHEMES RETAIL SCHEMESLIQUID SCHEME* FUND OF FUNDS SCHEME
* In respect of Liquid Scheme(s) NAV applicable shall be subject to receipt of valid application/switch-in request at the OPT and credit of entire subscription/switch-in amounts into the Bank Account of the concerning Scheme(s)/Plan(s) and funds are available for utilization by the Scheme(s)/Plan(s), within relevant cut-off time as applicable to the relevant Scheme(s)/Plan(s).# In respect of purchase/switch-in of units in any of the Schemes (other than Liquid Schemes) for an amount equal to or more than ̀ 2 Lakhs, the closing NAV (Net Asset Value) of the day shall be applicable subject to realisationof the funds upto 3.00 p.m. and receipt of application (duly time stamped).~ Subscriptions (by way of purchase / switch in or in any mode) is restricted only for individual investors (including HUFs, Association of Persons & where an individual is an ultimate beneficiary). Further, (a) Daily & Weekly DividendOption and the Payout & Sweep facility to Monthly Dividend Option under Regular Plan of Principal Retail Money Manager Fund and (b) Dividend Option under Regular Plan of Principal Debt Savings Fund - Retail Plan. Direct Planunder the Scheme do not offer this Options.
Particulars Principal Asset Allocation Fund-of-Funds Principal Asset Allocation Fund-of-Funds Principal Asset Allocation Fund-of-FundsConservative Plan Moderate Plan Aggressive Plan
Nature of the Scheme An Open-ended Fund-of-Funds Scheme An Open-ended Fund-of-Funds Scheme An Open-ended Fund-of-Funds Scheme
Allotment DateRegular Sub-Plan & December 14, 2015 December 14, 2015 December 14, 2015Direct Sub-Plan
Investment Plans/Option Regular Sub-Plan & Direct sub-Plan. Both the Plans offer Growth Option.
Fund Manager & Rajat Jain - December 2015 Rajat Jain - December 2015 Rajat Jain - December 2015Managing theCurrent Fund from
Total Investment 26 years 26 years 26 yearsExperience
Composite Benchmark 85% CRISIL Short Term Bond Fund Index and 60% CRISIL Short Term Bond Fund Index and 20% CRISIL Short Term Bond Fund Index andConsisting of 15% Nifty 50 40% Nifty 50 80% Nifty 50
Min. Application Amt. New Investor: ` 5,000 • Existing Investor: ` 1,000 New Investor: ` 5,000 • Existing Investor: ` 1,000 New Investor: ` 5,000 • Existing Investor: ` 1,000
Cut Off Time# 3.00 pm 3.00 pm 3.00 pm
Exit Load NIL(including SIP /STP / No exit load will be applicable for switches between the 3 plans i.e. Conservative Plan, Moderate Plan and Aggressive Plan of the Scheme.SWP, if available)
SIP / SWP / STP Available
Min. number & Amount 6 installments of SIP - ` 2,000/- each, STP - ` 1,000/- each & SWP - ` 500/- each.of SIP/SWP/STP
FUND OF FUNDS SCHEME

INVEST KNOWHOW December 20158
Principal Large Cap Fund (An open-ended equity scheme)
FUND FEATURES (As on December 31, 2015)
MAAUM: ` 297.27 crore • AUM: ` 307.64 crore
NAV Per Unit (As on December 31, 2015):Direct Plan Regular Plan
Growth Option : ` 46.50 ` 45.64Dividend Option (Half yearly) : ` 27.75 ` 27.65
INVESTMENT OBJECTIVETo provide capital appreciation and /or dividend distribution by predominantly investingin companies having a large market capitalization.
DIVIDEND UPDATE
Date Regular Plan Direct Plan
Dividend Cum Dividend Cum(`̀̀̀̀/Unit)* Dividend (`̀̀̀̀/Unit)* Dividend
NAV NAV
December 24, 2015 – – 0.3300 27.81
December 29, 2014 3.5700 30.79 3.6900 31.15
June 24, 2010 1.5000 20.2200 N.A. N.A.
July 28, 2009 2.0000 17.6700 N.A. N.A.
February 5, 2008 2.0000 23.5600 N.A. N.A.
May 15, 2007 1.5000 17.7600 N.A. N.A.
Past performance may or may not be sustained in the future.* On face value of ` 10.Note: All Dividend (`/Unit) figures are Gross Dividend.
RATIOS & OTHER DETAILS (As on December 31, 2015)
Standard Deviation^ (Annualised) 15.52%
Beta^ 0.96
Sharpe Ratio^ (Annualised) 0.45
Portfolio Turnover Ratio** 0.75
Expense Ratio# Direct Plan - 2.12%Regular Plan - 2.81%
Note: ^ The above measures have been calculated by taking rolling returns for a 3 yearperiod with 7.03% risk free rate of return (1 days - MIBOR Rate as on Dec. 31, 2015).** The Portfolio Turnover Rate (PTR) means the lower of aggregate sales or purchases madeduring the 12 month rolling year/period divided by the 12 month rolling year/period Averageasset under Management for the relevant year/period.# MTD ratio to Average AUM including Service Tax on Management Fees which is over andabove to TER & proportionate charge in respect of sales beyond T-15 cities subject to maximumof 30 bps on daily net assets.
MARKET CAP ALLOCATION (As on December 31, 2015)
% of NAV
Equity & Equity Related Instruments of Large Cap Companies 94.63
Equity & Equity Related Instruments of Mid Cap & Other Companies –
Cash and Other Assets 5.37
PORTFOLIO (As on December 31, 2015)
Instrument Industry % of NAV
Equity 94.63
Tata Motors Auto 5.13
Maruti Suzuki India Auto 3.47
Bajaj Auto Auto 1.58
Tata Motors - A Class Auto 0.88
Motherson Sumi Systems Auto Ancillaries 1.01
HDFC Bank Banks 6.98
ICICI Bank Banks 4.23
State Bank of India Banks 3.38
22.35%
13.32%
13.30%
11.06%
7.43%
6.13%
5.88%
3.75%
2.12%
1.71%
0.00% 5.00% 10.00% 15.00% 20.00% 25.00%
Banks
Software
Pharmaceuticals
Auto
Consumer Non Durables
Cement
Petroleum Products
Finance
Construction Project
Services
IndusInd Bank Banks 2.45
Bank of Baroda Banks 1.83
Kotak Mahindra Bank Banks 1.78
Axis Bank Banks 1.70
Shree Cements Cement 2.97
UltraTech Cement Cement 1.93
Century Textiles & Industries Cement 0.81
The Ramco Cements Cement 0.42
Larsen & Toubro Construction Project 2.12
Britannia Industries Consumer Non Durables 2.68
Hindustan Unilever Consumer Non Durables 1.95
ITC Consumer Non Durables 1.43
Colgate Palmolive (India) Consumer Non Durables 1.37
Housing Development Finance Corporation Finance 3.75
The Indian Hotels Company Hotels, Resorts & 0.93Other Recreational Activities
Mahindra Holidays & Resorts India Hotels, Resorts & 0.54Other Recreational Activities
Alstom T&D India Industrial Capital Goods 0.72
Bharat Electronics Industrial Capital Goods 0.16
Dish TV India Media & Entertainment 0.86
D.B.Corp Media & Entertainment 0.10
Coal India Minerals/Mining 1.00
National Aluminium Company Non - Ferrous Metals 0.87
Reliance Industries Petroleum Products 2.98
Hindustan Petroleum Corporation Petroleum Products 1.65
Bharat Petroleum Corporation Petroleum Products 1.25
Divi's Laboratories Pharmaceuticals 3.70
Abbott India Pharmaceuticals 3.30
Natco Pharma Pharmaceuticals 2.62
Sun Pharmaceuticals Industries Pharmaceuticals 1.98
Aurobindo Pharma Pharmaceuticals 1.28
Glenmark Pharmaceuticals Pharmaceuticals 0.42
Aditya Birla Nuvo Services 1.71
Infosys Software 6.37
Tata Consultancy Services Software 3.81
HCL Technologies Software 2.15
Hexaware Technologies Software 0.99
Adani Ports and Special Economic Zone Transportation 1.39
Cash and Other Assets 5.37
Net Assets 100.00
SECTOR ALLOCATION (TOP 10) (As on December 31, 2015)
(% of NAV)

INVEST KNOWHOW December 20159
Principal Emerging Bluechip Fund (An open-ended equity scheme)
11.49%
10.67%
10.12%
8.27%
5.51%
5.49%
4.63%
4.40%
4.37%
3.75%
0.00% 2.00% 4.00% 6.00% 8.00% 10.00% 12.00% 14.00%
Banks
Pharmaceuticals
Auto Ancillaries
Industrial Products
Construction Project
Cement
Chemicals
Consumer Non Durables
Auto
Transportation
FUND FEATURES (As on December 31, 2015)
MAAUM: ` 509.61 crore • AUM: ` 523.14 crore
NAV Per Unit (As on December 31, 2015):Direct Plan Regular Plan
Growth Option : ` 70.07 ` 68.51Dividend Option (Half yearly) : ` 53.35 ` 44.39
INVESTMENT OBJECTIVE: To achieve long-term capital appreciation by investingin equity & equity related instruments of Mid Cap & Small Cap companies.
DIVIDEND UPDATE
Date Regular Plan Direct PlanDividend Cum Dividend Cum(`̀̀̀̀/Unit)* Dividend (`̀̀̀̀/Unit)* Dividend
NAV NAVJune 24, 2015 1.9200 46.04 – –
December 29, 2014 5.5000 48.48 – –October 15, 2010 1.0000 27.4300 N.A. N.A.
June 19, 2009 4.0000 19.3500 N.A. N.A.
Past performance may or may not be sustained in the future. * On face value of ` 10.Note: All Dividend (`/Unit) figures are Gross Dividend.
RATIOS & OTHER DETAILS (As on December 31, 2015)
Standard Deviation^ (Annualised) 18.56%
Beta^ 0.92
Sharpe Ratio^ (Annualised) 0.97
Portfolio Turnover Ratio** 0.66
Expense Ratio# Direct Plan - 1.78%Regular Plan - 2.71%
Note: ^ The above measures have been calculated by taking rolling returns for a 3 yearperiod with 7.03% risk free rate of return (1 days - MIBOR Rate as on Dec. 31, 2015).** The Portfolio Turnover Rate (PTR) means the lower of aggregate sales or purchases madeduring the 12 month rolling year/period divided by the 12 month rolling year/period Averageasset under Management for the relevant year/period.# MTD ratio to Average AUM including Service Tax on Management Fees which is over andabove to TER & proportionate charge in respect of sales beyond T-15 cities subject to maximumof 30 bps on daily net assets.
MARKET CAP ALLOCATION (As on December 31, 2015)
% of NAVEquity and equity related instruments of Mid Cap Companies 73.69
Equity and equity related instruments of Small Cap Companies 14.17Equity and equity related instruments of Companies other thanMid & Small Cap 9.48
Cash and Money Market / Fixed Income Securities(including MIBOR Linked Short Term Papers & Securitised Debt) 1.77Mutual Funds 0.15
Derivatives 0.74
Market Cap Range for Nifty Midcap 100 StocksAs on September 30, 2015 ` ` ` ` ` 97,482.29 Cr – `̀̀̀̀ 3,330.69 Crs
PORTFOLIO (As on December 31, 2015)
Instrument Industry % of NAVEquity 97.34Eicher Motors Auto 3.48Escorts Auto 0.89Amara Raja Batteries Auto Ancillaries 3.50Motherson Sumi Systems Auto Ancillaries 2.58MRF Auto Ancillaries 1.81Gabriel India Auto Ancillaries 1.23Dynamatic Technologies Auto Ancillaries 1.00IndusInd Bank Banks 3.10ICICI Bank Banks 2.39Kotak Mahindra Bank Banks 1.89HDFC Bank Banks 1.68The Federal Bank Banks 1.42State Bank of India Banks 1.01Shree Cements Cement 2.61
(% of NAV)
Orient Cement Cement 1.55The Ramco Cements Cement 1.33Navin Fluorine International Chemicals 1.45Tata Chemicals Chemicals 1.18Atul Chemicals 1.11Pidilite Industries Chemicals 0.89National Buildings Construction Corporation Construction 1.29Kajaria Ceramics Construction 1.19PNC Infratech Construction 1.04Sadbhav Engineering Construction Project 2.67Voltas Construction Project 1.47KEC International Construction Project 1.37Symphony Consumer Durables 1.98Bata India Consumer Durables 1.19Britannia Industries Consumer Non Durables 2.89Triveni Engineering & Industries Consumer Non Durables 1.51Bajaj Finance Finance 1.55SKS Microfinance Finance 1.12Power Finance Corporation Finance 1.03Gujarat State Petronet Gas 1.30Texmaco Rail & Engineering Industrial Capital Goods 0.98Inox Wind Industrial Capital Goods 0.96Mold-Tek Packaging Industrial Products 1.60Cummins India Industrial Products 1.53Ramkrishna Forgings Industrial Products 1.49Bharat Forge Industrial Products 1.28Finolex Cables Industrial Products 1.26AIA Engineering Industrial Products 1.11Dish TV India Media & Entertainment 0.97Hindustan Zinc Non - Ferrous Metals 0.77UPL Pesticides 1.03Hindustan Petroleum Corporation Petroleum Products 2.94Indian Oil Corporation Petroleum Products 0.39Aurobindo Pharma Pharmaceuticals 2.97Divi’s Laboratories Pharmaceuticals 2.64Torrent Pharmaceuticals Pharmaceuticals 1.85Glenmark Pharmaceuticals Pharmaceuticals 1.72Natco Pharma Pharmaceuticals 1.49Aditya Birla Nuvo Services 1.77HCL Technologies Software 2.12Cyient Software 0.61Persistent Systems Software 0.44Tata Communications Telecom - Services 1.00SRF Textile Products 1.83Vardhman Textiles Textiles - Cotton 1.14Gateway Distriparks Transportation 2.01Transport Corporation of India Transportation 0.95Navkar Corporation Transportation 0.48Spicejet Ltd Transportation 0.31Derivatives 0.74Indian Oil Corporation Jan 2016 Stock Futures 0.49Hindalco Industries Jan 2016 Stock Futures 0.20State Bank of India Jan 2016 Stock Futures 0.05Investment Funds/Mutual Funds 0.15Principal Index Fund - Midcap - Mutual Funds 0.15Direct Plan - GrowthCash and Other Assets 1.77Net Assets 100.00
SECTOR ALLOCATION (TOP 10) (As on December 31, 2015)

INVEST KNOWHOW December 201510
Principal Growth Fund (An open-ended equity scheme)
FUND FEATURES (As on December 31, 2015)
MAAUM: ` 362.01 crore • AUM: ` 367.75 crore
NAV Per Unit (As on December 31, 2015):Direct Plan Regular Plan
Growth Option : ` 97.58 ` 95.80Dividend Option (Half yearly) : ` 40.31 ` 37.50
INVESTMENT OBJECTIVE: To achieve long-term capital appreciation.
DIVIDEND UPDATE
Date Regular Plan Direct PlanDividend Cum Dividend Cum(`̀̀̀̀/Unit)* Dividend (`̀̀̀̀/Unit)* Dividend
NAV NAV
December 24, 2015 0.8500 38.04 1.1800 41.16
December 29, 2014 4.8800 41.86 2.6200 42.36
December 31, 2007 2.5000 37.1400 N.A. N.A.
March 20, 2006 2.5000 24.6400 N.A. N.A.
Past performance may or may not be sustained in the future.* On face value of ` 10.Note: All Dividend (`/Unit) figures are Gross Dividend.
RATIOS & OTHER DETAILS (As on December 31, 2015)
Standard Deviation^ (Annualised) 17.75%
Beta^ 1.10
Sharpe Ratio^ (Annualised) 0.62
Portfolio Turnover Ratio** 0.62
Expense Ratio# Direct Plan - 2.09%Regular Plan - 2.89%
Note: ^ The above measures have been calculated by taking rolling returns for a 3 yearperiod with 7.03% risk free rate of return (1 days - MIBOR Rate as on Dec. 31, 2015).** The Portfolio Turnover Rate (PTR) means the lower of aggregate sales or purchases madeduring the 12 month rolling year/period divided by the 12 month rolling year/period Averageasset under Management for the relevant year/period.# MTD ratio to Average AUM including Service Tax on Management Fees which is over andabove to TER & proportionate charge in respect of sales beyond T-15 cities subject to maximumof 30 bps on daily net assets.
PORTFOLIO (As on December 31, 2015)
Instrument Industry % of NAV
Equity 95.57Tata Motors Auto 3.00
Bajaj Auto Auto 2.11Escorts Auto 1.99
Maruti Suzuki India Auto 1.53
Asahi India Glass Auto Ancillaries 1.00Motherson Sumi Systems Auto Ancillaries 0.91
HDFC Bank Banks 4.85
ICICI Bank Banks 3.15State Bank of India Banks 2.42
Bank of Baroda Banks 1.75
The Federal Bank Banks 1.07Axis Bank Banks 1.06
The Ramco Cements Cement 2.17
Century Textiles & Industries Cement 2.03JK Cement Cement 1.62
UltraTech Cement Cement 1.46
The India Cements Cement 1.09Ambuja Cements Cement 0.99
DLF Construction 1.01
IRB Infrastructure Developers Construction 0.95Prestige Estates Projects Construction 0.83
Mile Stone Global Construction 0.02
14.30%
12.19%
9.36%
8.63%
7.95%
6.18%
5.62%
4.43%
3.30%
3.05%
0.00% 4.00% 8.00% 12.00% 16.00%
Banks
Software
Cement
Auto
Pharmaceuticals
Finance
Consumer Non Durables
Construction ProjectHotels, Resorts &
Other Recreational ActivitiesPetroleum Products
(% of NAV)
Ashoka Buildcon Construction Project 1.31KEC International Construction Project 1.22Larsen & Toubro Construction Project 0.97Hindustan Construction Company Construction Project 0.93Britannia Industries Consumer Non Durables 1.75ITC Consumer Non Durables 1.66Bombay Burmah Trading Corporation Consumer Non Durables 1.40United Spirits Consumer Non Durables 0.81Housing Development Finance Corporation Finance 2.14Dewan Housing Finance Corporation Finance 2.04Rural Electrification Corporation Finance 1.01L&T Finance Holdings Finance 0.99Indraprastha Gas Gas 1.38Mahindra Holidays & Resorts India Hotels, Resorts & 2.09
Other Recreational ActivitiesThe Indian Hotels Company Hotels, Resorts 1.21
Other Recreational ActivitiesJain Irrigation Systems Industrial Products 1.52Coal India Minerals/Mining 0.82Hindalco Industries Non - Ferrous Metals 1.04National Aluminium Company Non - Ferrous Metals 0.75Hindustan Zinc Non - Ferrous Metals 0.62Reliance Industries Petroleum Products 2.32Hindustan Petroleum Corporation Petroleum Products 0.73Abbott India Pharmaceuticals 1.72Natco Pharma Pharmaceuticals 1.49Aurobindo Pharma Pharmaceuticals 1.46Sun Pharmaceuticals Industries Pharmaceuticals 1.33Cipla Pharmaceuticals 1.19Glenmark Pharmaceuticals Pharmaceuticals 0.76Kalpataru Power Transmission Power 1.18RattanIndia Power Power 0.91Aditya Birla Nuvo Services 1.22Infosys Software 3.88Tata Consultancy Services Software 3.39HCL Technologies Software 2.46Firstsource Solutions Software 2.03Cyient Software 0.43Bharti Airtel Telecom - Services 1.30Tata Communications Telecom - Services 1.10SRF Textile Products 1.40Navkar Corporation Transportation 1.08Gateway Distriparks Transportation 1.00Spicejet Ltd Transportation 0.52Investment Funds/Mutual Funds 0.99Principal Index Fund - Midcap -Direct Plan - Growth Mutual Funds 0.99Cash and Other Assets 3.44Net Assets 100.00
SECTOR ALLOCATION (TOP 10) (As on December 31, 2015)

INVEST KNOWHOW December 201511
17.73%
17.38%
13.96%
10.88%
5.23%
4.19%
4.06%
3.83%
3.74%
2.05%
0.00% 4.00% 8.00% 12.00% 16.00% 20.00%
Banks
Auto
Consumer Non Durables
Petroleum Products
Software
Textile Products
Finance
Cement
Oil
Industrial Products
(% of NAV)
Principal Dividend Yield Fund (An open-ended equity scheme)
Kotak Mahindra Bank Banks 1.03
Dalmia Bharat Cement 2.38
UltraTech Cement Cement 1.45
Tata Chemicals Chemicals 1.09
National Buildings Construction Corporation Construction 1.75
KEC International Construction Project 1.85
Hindustan Unilever Consumer Non Durables 5.31
Colgate Palmolive (India) Consumer Non Durables 4.70
VST Industries Consumer Non Durables 2.04
ITC Consumer Non Durables 1.91
EID Parry India Fertilisers 0.98
Bajaj Holdings & Investment Finance 2.88
Power Finance Corporation Finance 1.18
Gujarat State Petronet Gas 1.36
Cummins India Industrial Products 2.05
Hindustan Zinc Non - Ferrous Metals 0.98
Oil & Natural Gas Corporation Oil 3.74
PI Industries Pesticides 1.72
Hindustan Petroleum Corporation Petroleum Products 3.69
Bharat Petroleum Corporation Petroleum Products 2.61
Castrol India Petroleum Products 2.40
Reliance Industries Petroleum Products 2.18
Aurobindo Pharma Pharmaceuticals 1.28
HCL Technologies Software 2.37
Infosys Software 1.87
Tata Consultancy Services Software 0.99
Welspun India Textile Products 2.59
SRF Textile Products 1.60
Gateway Distriparks Transportation 1.81
Derivatives 0.70
Hindalco Industries Jan 2016 Stock Futures 0.70
Cash and Other Assets 1.38
Net Assets 100.00
SECTOR ALLOCATION (TOP 10) (As on December 31, 2015)
FUND FEATURES (As on December 31, 2015)
MAAUM: ` 107.74 crore • AUM: ` 108.82 crore
NAV Per Unit (As on December 31, 2015):Direct Plan Regular Plan
Growth Option : ` 35.38 ` 34.78Dividend Option (Half yearly) : ` 23.44 ` 22.57
INVESTMENT OBJECTIVETo provide capital appreciation and / or dividend distribution by investing predominantlyin a well-diversified portfolio of companies that have a relatively high dividend yield.
DIVIDEND UPDATE
Date Regular Plan Direct PlanDividend Cum Dividend Cum(`̀̀̀̀/Unit)* Dividend (`̀̀̀̀/Unit)* Dividend
NAV NAV
December 29, 2014 3.2000 26.47 2.7400 26.76
October 12, 2007 1.5000 15.4400 N.A. N.A.
April 24, 2006 1.5000 15.7200 N.A. N.A.
October 3, 2005 0.7500 13.5100 N.A. N.A.
April 20, 2005 0.5000 11.0900 N.A. N.A.
* On face value of ` 10.Past performance may or may not be sustained in the future.Note: All Dividend (`/Unit) figures are Gross Dividend.
RATIOS & OTHER DETAILS (As on December 31, 2015)
Standard Deviation^ (Annualised) 16.84%
Beta^ 0.85
Sharpe Ratio^ (Annualised) 0.22
Portfolio Turnover Ratio** 0.45
Expense Ratio# Direct Plan - 2.54%Regular Plan - 2.99%
Note: ^ The above measures have been calculated by taking rolling returns for a 3 yearperiod with 7.03% risk free rate of return (1 days - MIBOR Rate as on Dec. 31, 2015).** The Portfolio Turnover Rate (PTR) means the lower of aggregate sales or purchases madeduring the 12 month rolling year/period divided by the 12 month rolling year/period Averageasset under Management for the relevant year/period.# MTD ratio to Average AUM including Service Tax on Management Fees which is over andabove to TER & proportionate charge in respect of sales beyond T-15 cities subject to maximumof 30 bps on daily net assets.
PORTFOLIO (As on December 31, 2015)
Instrument Industry % of NAV
Equity 97.92
Bajaj Auto Auto 4.82
Hero MotoCorp Auto 4.23
Maruti Suzuki India Auto 3.30
SML Isuzu Auto 2.67
Tata Motors - A Class Auto 2.36
Shivam Autotech Auto Ancillaries 2.05
State Bank of India Banks 4.68
ICICI Bank Banks 3.82
HDFC Bank Banks 3.57
Bank of Baroda Banks 1.84
IndusInd Bank Banks 1.44
The Federal Bank Banks 1.35

INVEST KNOWHOW December 201512
Principal Index Fund - Nifty (An open-ended index scheme)
FUND FEATURES (As on December 31, 2015)
MAAUM: ` 24.68 crore • AUM: ` 25.12 crore
NAV Per Unit (As on December 31, 2015):Direct Plan Regular Plan
Growth Option : ` 55.4818 ` 54.7167Dividend Option : ` 32.6061 ` 32.1582
INVESTMENT OBJECTIVETo invest principally in securities that comprise Nifty 50 and subject to tracking errorsendeavour to attain results commensurate with the Nifty 50.
DIVIDEND UPDATE (REGULAR PLAN)
Date Dividend (`̀̀̀̀/Unit)* Cum Dividend NAVDecember 24, 2008 3.7500 15.7934
* On face value of ` 10.Past performance may or may not be sustained in the future.Note: All Dividend (`/Unit) figures are Gross Dividend.
RATIOS & OTHER DETAILS (As on December 31, 2015)
Standard Deviation^ (Annualised) 15.09%
Beta^ 0.99
Sharpe Ratio^ (Annualised) 0.23
Portfolio Turnover Ratio** 0.27
Expense Ratio Direct Plan - 0.50%Regular Plan - 1.00%
Note: ^ The above measures have been calculated by taking rolling returns for a 3 yearperiod with 7.03% risk free rate of return (1 days - MIBOR Rate as on Dec. 31, 2015).** The Portfolio Turnover Rate (PTR) means the lower of aggregate sales or purchases madeduring the 12 month rolling year/period divided by the 12 month rolling year/period Averageasset under Management for the relevant year/period.
TRACKING DEVIATION
0.12%*
* Trailing 12 months ended Dec. 31 2015 (Annualized).
PORTFOLIO (As on December 31, 2015)
Instrument Industry % of NAV
Equity 99.69
Tata Motors Auto 2.66
Maruti Suzuki India Auto 2.15
Mahindra & Mahindra Auto 2.07
Bajaj Auto Auto 1.21
Hero MotoCorp Auto 1.16
Bosch Auto Ancillaries 0.59
HDFC Bank Banks 7.52
ICICI Bank Banks 5.34
Axis Bank Banks 2.65
Kotak Mahindra Bank Banks 2.61
State Bank of India Banks 2.44
IndusInd Bank Banks 1.66
Yes Bank Banks 0.83
Bank of Baroda Banks 0.52
Punjab National Bank Banks 0.30
UltraTech Cement Cement 1.00
Grasim Industries Cement 0.84
Ambuja Cements Cement 0.55
(% of NAV)
23.87%
16.23%
10.03%
9.25%
7.24%
7.01%
6.70%
3.67%
2.84%
2.58%
0.00% 5.00% 10.00% 15.00% 20.00% 25.00%
Banks
Software
Consumer Non Durables
Auto
Pharmaceuticals
Finance
Petroleum Products
Construction Project
Cement
Power
ACC Cement 0.45
Larsen & Toubro Construction Project 3.67
ITC Consumer Non Durables 6.47
Hindustan Unilever Consumer Non Durables 2.15
Asian Paints Consumer Non Durables 1.41
Tata Steel Ferrous Metals 0.61
Housing Development Finance Corporation Finance 7.01
GAIL (India) Gas 0.61
Bharat Heavy Electricals Industrial Capital Goods 0.54
Zee Entertainment Enterprises Media & Entertainment 0.84
Coal India Minerals/Mining 1.49
Hindalco Industries Non - Ferrous Metals 0.38
Vedanta Non - Ferrous Metals 0.35
Oil & Natural Gas Corporation Oil 1.53
Cairn India Oil 0.28
Reliance Industries Petroleum Products 5.89
Bharat Petroleum Corporation Petroleum Products 0.81
Sun Pharmaceuticals Industries Pharmaceuticals 3.14
Lupin Pharmaceuticals 1.55
Dr. Reddy's Laboratories Pharmaceuticals 1.39
Cipla Pharmaceuticals 1.16
Power Grid Corporation of India Power 1.09
NTPC Power 1.06
Tata Power Company Power 0.43
Infosys Software 7.76
Tata Consultancy Services Software 4.41
HCL Technologies Software 1.67
Wipro Software 1.27
Tech Mahindra Software 1.12
Bharti Airtel Telecom - Services 1.65
Idea Cellular Telecom - Services 0.57
Adani Ports and Special Economic Zone Transportation 0.83
Cash and Other Assets 0.31
Net Assets 100.00
SECTOR ALLOCATION (TOP 10) (As on December 31, 2015)

INVEST KNOWHOW December 201513
Principal Index Fund - Midcap (An open-ended index scheme)
FUND FEATURES (As on December 31, 2015)
MAAUM: ` 10.77 crore • AUM: ` 10.96 crore
NAV Per Unit (As on December 31, 2015):Direct Plan Regular Plan
Growth Option : ` 14.8817 ` 14.7570Dividend Option : ` 14.8817 ` 14.7570
INVESTMENT OBJECTIVETo invest principally in securities that comprise Nifty Midcap 100 and subject to trackingerrors endevour to attain results commensurate with the Nifty Midcap 100.
RATIOS & OTHER DETAILS (As on December 31, 2015)
Portfolio Turnover Ratio** 0.67
Expense Ratio Direct Plan - 0.50%Regular Plan - 1.00%
** The Portfolio Turnover Rate (PTR) means the lower of aggregate sales or purchases madeduring the 12 month rolling year/period divided by the 12 month rolling year/period Averageasset under Management for the relevant year/period.
PORTFOLIO (As on December 31, 2015)
Instrument Industry % of NAV
Equity 99.55Ashok Leyland Auto 2.02TVS Motor Company Auto 0.95MRF Auto Ancillaries 1.60Amara Raja Batteries Auto Ancillaries 1.15Exide Industries Auto Ancillaries 1.10Apollo Tyres Auto Ancillaries 0.72Karur Vysya Bank Banks 0.94Union Bank of India Banks 0.61IDBI Bank Banks 0.55Canara Bank Banks 0.54The South Indian Bank Banks 0.42Bank of India Banks 0.40DCB Bank Banks 0.32Shree Cements Cement 1.63The Ramco Cements Cement 0.87Century Textiles & Industries Cement 0.51Jaiprakash Associates Cement 0.29Pidilite Industries Chemicals 1.40Tata Chemicals Chemicals 1.15DLF Construction 0.85IRB Infrastructure Developers Construction 0.59Housing Development and Infrastructure Construction 0.34Voltas Construction Project 1.22NCC Construction Project 0.40Rajesh Exports Consumer Durables 1.51Havells India Consumer Durables 1.19Bata India Consumer Durables 0.51Britannia Industries Consumer Non Durables 2.86Marico Consumer Non Durables 1.92GlaxoSmithKline Consumer Healthcare Consumer Non Durables 1.21United Breweries Consumer Non Durables 1.03Emami Consumer Non Durables 1.01Tata Global Beverages Consumer Non Durables 0.99Procter & Gamble Hygiene and Health Care Consumer Non Durables 0.87Kansai Nerolac Paints Consumer Non Durables 0.73Jubilant Foodworks Consumer Non Durables 0.65Godrej Industries Consumer Non Durables 0.52JSW Steel Ferrous Metals 1.77Steel Authority of India Ferrous Metals 0.81Jindal Steel & Power Ferrous Metals 0.55Bajaj Finance Finance 2.04Bajaj Finserv Finance 1.96Power Finance Corporation Finance 1.39Mahindra & Mahindra Financial Services Finance 1.08SKS Microfinance Finance 0.88Reliance Capital Finance 0.80CRISIL Finance 0.75
(% of NAV)
14.41%
11.79%
10.07%
5.69%
5.62%
5.08%
4.57%
4.37%
3.78%
3.30%
0.00% 4.00% 8.00% 12.00% 16.00%
Pharmaceuticals
Consumer Non Durables
Finance
Petroleum Products
Industrial Capital Goods
Software
Auto Ancillaries
Power
Banks
Cement
Dewan Housing Finance Corporation Finance 0.61L&T Finance Holdings Finance 0.56Petronet LNG Gas 1.25Gujarat State Petronet Gas 0.64Indraprastha Gas Gas 0.60Apollo Hospitals Enterprise Healthcare Services 1.82The Indian Hotels Company Hotels, Resorts & 0.96
Other Recreational ActivitiesSiemens Industrial Capital Goods 1.74Bharat Electronics Industrial Capital Goods 1.34ABB India Industrial Capital Goods 0.96Suzlon Energy Industrial Capital Goods 0.96Thermax Industrial Capital Goods 0.62Sintex Industries Industrial Products 0.50Sun TV Network Media & Entertainment 0.68NMDC Minerals/Mining 1.16Hindustan Zinc Non - Ferrous Metals 0.56Oil India Oil 0.88Indian Oil Corporation Petroleum Products 3.43Hindustan Petroleum Corporation Petroleum Products 2.26Divi's Laboratories Pharmaceuticals 2.39Glenmark Pharmaceuticals Pharmaceuticals 2.10Cadila Healthcare Pharmaceuticals 1.38Piramal Enterprises Pharmaceuticals 1.34Torrent Pharmaceuticals Pharmaceuticals 1.15Strides Arcolab Pharmaceuticals 1.12IPCA Laboratories Pharmaceuticals 0.82Natco Pharma Pharmaceuticals 0.73Wockhardt Pharmaceuticals 0.71Sanofi India Pharmaceuticals 0.65Biocon Pharmaceuticals 0.59Alembic Pharmaceuticals Pharmaceuticals 0.55Ajanta Pharma Pharmaceuticals 0.50Sun Pharma Advanced Research Company Pharmaceuticals 0.38Reliance Infrastructure Power 1.20Reliance Power Power 0.65CESC Power 0.56NHPC Power 0.53JSW Energy Power 0.49Torrent Power Power 0.47Adani Power Power 0.47Oracle Financial Services Software Software 1.32MindTree Software 1.30Vakrangee Software 0.88MphasiS Software 0.67Persistent Systems Software 0.47Just Dial Software 0.44Reliance Communications Telecom - Services 1.44Tata Communications Telecom - Services 0.51Page Industries Textile Products 1.20SRF Textile Products 0.56Container Corporation of India Transportation 1.59Gujarat Pipavav Port Transportation 0.63The Great Eastern Shipping Company Transportation 0.63Cash and Other Assets 0.45Net Assets 100.00
SECTOR ALLOCATION (TOP 10) (As on December 31, 2015)

INVEST KNOWHOW December 201514
Principal SMART Equity Fund (An open-ended equity scheme)
The Indian Hotels Company Hotels, Resorts & 0.45Other Recreational Activities
Mahindra Holidays & Resorts India Hotels, Resorts & 0.26Other Recreational Activities
Alstom T&D India Industrial Capital Goods 0.35
Bharat Electronics Industrial Capital Goods 0.08
Dish TV India Media & Entertainment 0.42
D.B.Corp Media & Entertainment 0.05
Coal India Minerals/Mining 0.49
National Aluminium Company Non - Ferrous Metals 0.42
Reliance Industries Petroleum Products 1.45
Hindustan Petroleum Corporation Petroleum Products 0.80
Bharat Petroleum Corporation Petroleum Products 0.61
Divi's Laboratories Pharmaceuticals 1.80
Abbott India Pharmaceuticals 1.60
Natco Pharma Pharmaceuticals 1.27
Sun Pharmaceuticals Industries Pharmaceuticals 0.94
Aurobindo Pharma Pharmaceuticals 0.62
Glenmark Pharmaceuticals Pharmaceuticals 0.20
Aditya Birla Nuvo Services 0.83
Infosys Software 3.09
Tata Consultancy Services Software 1.85
HCL Technologies Software 1.04
Hexaware Technologies Software 0.48
Adani Ports and Special Economic Zone Transportation 0.68
Cash Future Arbitrage 21.11 -21.19Axis Bank Banks 0.08
Axis Bank Jan 2016 Stock Futures -0.08
Cipla Pharmaceuticals 0.09
Cipla Jan 2016 Stock Futures -0.10
Tata Global Beverages Consumer Non Durables 0.27
Tata Global Beverages Jan 2016 Stock Futures -0.27
Bharti Airtel Telecom - Services 0.67
Bharti Airtel Jan 2016 Stock Futures -0.67
Yes Bank Banks 1.44
Yes Bank Jan 2016 Stock Futures -1.45
Tata Motors - A Class Auto 1.50
Tata Motors - A Class Jan 2016 Stock Futures -1.51
Housing Development Finance Corpn. Finance 2.17
Housing Development Finance Corpn. Jan 2016 Stock Futures -2.17
Hindustan Petroleum Corporation Petroleum Products 2.52
Hindustan Petroleum Corporation Jan 2016 Stock Futures -2.53
HDFC Bank Banks 5.88
HDFC Bank Jan 2016 Stock Futures -5.91
Reliance Industries Petroleum Products 6.49
Reliance Industries Jan 2016 Stock Futures -6.51
Commercial Paper 16.42Housing Development Finance Corpn. A1+ 11.87
KEC International A1 4.55
Central Government Securities 9.4408.83% GOI -M- 25-NOV-2023 Sovereign 4.80
8.12% GOI -M- 10-DEC-2020 Sovereign 4.64
Cash and Other Assets 7.07Net Assets 100.00
SECTOR ALLOCATION OF EQUITY INSTRUMENTS (TOP 10) (As on December 31, 2015)
FUND FEATURES (As on December 31, 2015)
MAAUM: ` 106.75 crore • AUM: ` 109.58 crore
NAV Per Unit (As on December 31, 2015):Direct Plan Regular Plan
Growth Option : ` 17.16 ` 16.75Dividend Option (Half yearly) : ` 16.38 ` 15.16
INVESTMENT OBJECTIVE: The primary objective of the scheme is to seek to generatelong term capital appreciation with relatively lower volatility through systematic allocationof funds into equity; and in debt /money market instruments for defensive purposes.The Scheme will decide on allocation of funds into equity assets based on equity marketPrice Earning Ratio (PE Ratio) levels. When the markets become expensive in terms of'Price to Earnings' Ratio'; the Scheme will reduce its allocation to equities and moveassets into debt and/or money market instruments and vice versa.
DIVIDEND UPDATE
Date Regular Plan Direct PlanDividend Cum Dividend Cum(`̀̀̀̀/Unit)* Dividend (`̀̀̀̀/Unit)* Dividend
NAV NAVJune 24, 2015 0.2500 15.25 0.3200 16.37
December 29, 2014 1.2900 16.13 0.5100 16.38
Past performance may or may not be sustained in the future. * On face value of ` 10.Note: All Dividend (`/Unit) figures are Gross Dividend.
RATIOS & OTHER DETAILS (As on December 31, 2015)
Standard Deviation^ (Annualised) 11.68%
Beta^ 0.98
Sharpe Ratio^ (Annualised) 0.54
Portfolio Turnover Ratio** 0.83
Expense Ratio# Direct Plan - 1.98%Regular Plan - 3.19%
Note: ^ The above measures have been calculated by taking rolling returns for a 3 yearperiod with 7.03% risk free rate of return (1 days - MIBOR Rate as on Dec. 31, 2015).** The Portfolio Turnover Rate (PTR) means the lower of aggregate sales or purchases madeduring the 12 month rolling year/period divided by the 12 month rolling year/period Averageasset under Management for the relevant year/period.# MTD ratio to Average AUM including Service Tax on Management Fees which is over andabove to TER & proportionate charge in respect of sales beyond T-15 cities subject to maximumof 30 bps on daily net assets.
PORTFOLIO (As on December 31, 2015)
Instrument Industry/ % of % ofRating NAV NAV
Deriv-atives
Equity 45.96
Tata Motors Auto 2.49
Maruti Suzuki India Auto 1.69
Bajaj Auto Auto 0.77
Tata Motors - A Class Auto 0.43
Motherson Sumi Systems Auto Ancillaries 0.49
HDFC Bank Banks 3.39
ICICI Bank Banks 2.05
State Bank of India Banks 1.65
IndusInd Bank Banks 1.19
Bank of Baroda Banks 0.89
Kotak Mahindra Bank Banks 0.87
Axis Bank Banks 0.82
Shree Cements Cement 1.44
UltraTech Cement Cement 0.94
Century Textiles & Industries Cement 0.39
The Ramco Cements Cement 0.20
Larsen & Toubro Construction Project 1.03
Britannia Industries Consumer Non Durables 1.30
Hindustan Unilever Consumer Non Durables 0.95
ITC Consumer Non Durables 0.70
Colgate Palmolive (India) Consumer Non Durables 0.67
Housing Development Finance Corpn. Finance 1.82
10.86%
6.46%
6.43%
5.38%
3.62%
2.97%
2.86%
1.82%
1.03%
0.83%
0.00% 2.00% 4.00% 6.00% 8.00% 10.00% 12.00%
Banks
Software
Pharmaceuticals
Auto
Consumer Non Durables
Cement
Petroleum Products
Finance
Construction Project
Services
(% of NAV)
The chart represents the unhedged equitys positions only.

INVEST KNOWHOW December 201515
Principal Personal Tax Saver Fund (An open-ended equity linked savings scheme)
FUND FEATURES (As on December 31, 2015)
MAAUM: ` 318.83 crore • AUM: ` 322.01 crore
NAV Per Unit (As on December 31, 2015):Direct Plan : ` 153.34Regular Plan : ` 150.68
INVESTMENT OBJECTIVETo provide long term growth of capital. The Investment Manager will aim to achieve areturn on assets in excess of the performance of S&P BSE 100 Index.
DIVIDEND UPDATE (REGULAR PLAN)
Date Dividend (`̀̀̀̀/Unit)* Cum Dividend NAVMarch 25, 2008 40.0000 124.66
February 26, 2008 20.0000 172.57
December 31, 2007 11.0000 221.26
October 30, 2007 11.0000 190.53
March 13, 2006 10.0000 118.96
November 2, 2005 40.0000 124.43
* On face value of ` 10.Past performance may or may not be sustained in the future.Note: All Dividend (`/Unit) figures are Gross Dividend.
RATIOS & OTHER DETAILS (As on December 31, 2015)
Standard Deviation^ (Annualised) 15.56%
Beta^ 0.96
Sharpe Ratio^ (Annualised) 0.46
Portfolio Turnover Ratio** 0.69
Expense Ratio# Direct Plan - 2.11%Regular Plan - 2.76%
Note: ^ The above measures have been calculated by taking rolling returns for a 3 yearperiod with 7.03% risk free rate of return (1 days - MIBOR Rate as on Dec. 31, 2015).** The Portfolio Turnover Rate (PTR) means the lower of aggregate sales or purchases madeduring the 12 month rolling year/period divided by the 12 month rolling year/period Averageasset under Management for the relevant year/period.# MTD ratio to Average AUM including Service Tax on Management Fees which is over andabove to TER & proportionate charge in respect of sales beyond T-15 cities subject to maximumof 30 bps on daily net assets.
PORTFOLIO (As on December 31, 2015)
Instrument Industry % of NAV
Equity 96.24
Tata Motors Auto 5.24
Maruti Suzuki India Auto 3.50
Bajaj Auto Auto 1.59
Tata Motors - A Class Auto 0.90
Motherson Sumi Systems Auto Ancillaries 1.03
HDFC Bank Banks 7.11
ICICI Bank Banks 4.23
State Bank of India Banks 3.40
IndusInd Bank Banks 2.50
Bank of Baroda Banks 1.83
Kotak Mahindra Bank Banks 1.82
Axis Bank Banks 1.70
Shree Cements Cement 3.00
UltraTech Cement Cement 1.95
Century Textiles & Industries Cement 0.84
The Ramco Cements Cement 0.42
22.59%
13.57%
13.55%
11.23%
7.55%
6.21%
6.01%
3.83%
2.13%
1.79%
0.00% 4.00% 8.00% 12.00% 16.00% 20.00% 24.00%
Banks
Software
Pharmaceuticals
Auto
Consumer Non Durables
Cement
Petroleum Products
Finance
Construction Project
Services
(% of NAV)
Larsen & Toubro Construction Project 2.13
Britannia Industries Consumer Non Durables 2.69
Hindustan Unilever Consumer Non Durables 1.95
ITC Consumer Non Durables 1.48
Colgate Palmolive (India) Consumer Non Durables 1.43
Housing Development Finance Corporation Finance 3.83
The Indian Hotels Company Hotels, Resorts & 0.97Other Recreational Activities
Mahindra Holidays & Resorts India Hotels, Resorts & 0.54Other Recreational Activities
Alstom T&D India Industrial Capital Goods 0.74
Bharat Electronics Industrial Capital Goods 0.16
Dish TV India Media & Entertainment 0.86
D.B.Corp Media & Entertainment 0.10
Coal India Minerals/Mining 1.03
National Aluminium Company Non - Ferrous Metals 0.89
Reliance Industries Petroleum Products 3.04
Hindustan Petroleum Corporation Petroleum Products 1.70
Bharat Petroleum Corporation Petroleum Products 1.27
Divi's Laboratories Pharmaceuticals 3.82
Abbott India Pharmaceuticals 3.31
Natco Pharma Pharmaceuticals 2.63
Sun Pharmaceuticals Industries Pharmaceuticals 2.09
Aurobindo Pharma Pharmaceuticals 1.28
Glenmark Pharmaceuticals Pharmaceuticals 0.42
Aditya Birla Nuvo Services 1.79
Infosys Software 6.49
Tata Consultancy Services Software 3.90
HCL Technologies Software 2.15
Hexaware Technologies Software 1.03
Adani Ports and Special Economic Zone Transportation 1.46
Cash and Other Assets 3.76
Net Assets 100.00
SECTOR ALLOCATION (TOP 10) (As on December 31, 2015)

INVEST KNOWHOW December 201516
Principal Tax Savings Fund (An open-ended equity linked savings scheme)
FUND FEATURES (As on December 31, 2015)
MAAUM: ` 256.38 crore • AUM: ` 260.51 crore
NAV Per Unit (As on December 31, 2015):Direct Plan : ` 143.49Regular Plan : ` 141.32
INVESTMENT OBJECTIVETo build a high quality growth-oriented portfolio to provide long-term capital gains tothe investors. The scheme aims at providing returns through capital appreciation.
DIVIDEND UPDATE (REGULAR PLAN)
Date Dividend (`̀̀̀̀/Unit)* Cum Dividend NAV
March 31, 2008 8.0000 90.1200
January 15, 2007 5.0000 83.6600
* On face value of ` 10.Past performance may or may not be sustained in the future.Note: All Dividend (`/Unit) figures are Gross Dividend.
RATIOS & OTHER DETAILS (As on December 31, 2015)
Standard Deviation^ (Annualised) 17.79%
Beta^ 1.09
Sharpe Ratio^ (Annualised) 0.62
Portfolio Turnover Ratio** 0.62
Expense Ratio# Direct Plan - 2.27%Regular Plan - 2.83%
Note: ^ The above measures have been calculated by taking rolling returns for a 3 yearperiod with 7.03% risk free rate of return (1 days - MIBOR Rate as on Dec. 31, 2015).** The Portfolio Turnover Rate (PTR) means the lower of aggregate sales or purchases madeduring the 12 month rolling year/period divided by the 12 month rolling year/period Averageasset under Management for the relevant year/period.# MTD ratio to Average AUM including Service Tax on Management Fees which is over andabove to TER & proportionate charge in respect of sales beyond T-15 cities subject to maximumof 30 bps on daily net assets.
PORTFOLIO (As on December 31, 2015)
Instrument Industry % of NAV
Equity 95.98
Tata Motors Auto 2.99
Bajaj Auto Auto 2.12
Escorts Auto 1.99
Maruti Suzuki India Auto 1.53
Asahi India Glass Auto Ancillaries 1.00
Motherson Sumi Systems Auto Ancillaries 0.91
HDFC Bank Banks 4.84
ICICI Bank Banks 3.13
State Bank of India Banks 2.41
Bank of Baroda Banks 1.75
The Federal Bank Banks 1.07
Axis Bank Banks 1.06
The Ramco Cements Cement 2.21
Century Textiles & Industries Cement 2.02
JK Cement Cement 1.64
UltraTech Cement Cement 1.46
The India Cements Cement 1.09
Ambuja Cements Cement 0.98
DLF Construction 1.01
IRB Infrastructure Developers Construction 0.98
Prestige Estates Projects Construction 0.86
Ashoka Buildcon Construction Project 1.31
KEC International Construction Project 1.22
Larsen & Toubro Construction Project 1.00
Hindustan Construction Company Construction Project 0.96
Britannia Industries Consumer Non Durables 1.75
ITC Consumer Non Durables 1.68
Bombay Burmah Trading Corporation Consumer Non Durables 1.41
United Spirits Consumer Non Durables 0.84
Housing Development Finance Corporation Finance 2.14
Dewan Housing Finance Corporation Finance 2.06
Rural Electrification Corporation Finance 1.02
L&T Finance Holdings Finance 0.98
Indraprastha Gas Gas 1.42
Mahindra Holidays & Resorts India Hotels, Resorts & 2.09Other Recreational Activities
The Indian Hotels Company Hotels, Resorts & 1.22Other Recreational Activities
Jain Irrigation Systems Industrial Products 1.57
Coal India Minerals/Mining 0.81
Hindalco Industries Non - Ferrous Metals 1.04
National Aluminium Company Non - Ferrous Metals 0.75
Hindustan Zinc Non - Ferrous Metals 0.65
Reliance Industries Petroleum Products 2.31
Hindustan Petroleum Corporation Petroleum Products 0.73
Abbott India Pharmaceuticals 1.72
Natco Pharma Pharmaceuticals 1.49
Aurobindo Pharma Pharmaceuticals 1.46
Sun Pharmaceuticals Industries Pharmaceuticals 1.33
Cipla Pharmaceuticals 1.21
Glenmark Pharmaceuticals Pharmaceuticals 0.77
Kalpataru Power Transmission Power 1.21
RattanIndia Power Power 0.94
Aditya Birla Nuvo Services 1.27
Infosys Software 3.87
Tata Consultancy Services Software 3.38
HCL Technologies Software 2.45
Firstsource Solutions Software 2.03
Cyient Software 0.43
Bharti Airtel Telecom - Services 1.30
Tata Communications Telecom - Services 1.10
SRF Textile Products 1.40
Navkar Corporation Transportation 1.08
Gateway Distriparks Transportation 1.01
Spicejet Ltd Transportation 0.52
Cash and Other Assets 4.02
Net Assets 100.00
SECTOR ALLOCATION (TOP 10) (As on December 31, 2015)
(% of NAV)
14.26%
12.16%
9.40%
8.63%
7.98%
6.20%
5.68%
4.49%
3.31%
3.04%
0.00% 4.00% 8.00% 12.00% 16.00%
Banks
Software
Cement
Auto
Pharmaceuticals
Finance
Consumer Non Durables
Construction Project
Hotels, Resorts &Other Recreational Activities
Petroleum Products

INVEST KNOWHOW December 201517
Principal Balanced Fund (An open-ended balanced scheme)
10.06%
8.50%
6.53%
6.01%
5.43%
4.86%
4.29%
2.99%
2.32%
2.09%
0.00% 2.00% 4.00% 6.00% 8.00% 10.00% 12.00%
Banks
Software
Cement
Auto
Pharmaceuticals
Consumer Non Durables
Finance
Construction ProjectHotels, Resorts &
Other Recreational ActivitiessPetroleum Products
(% of NAV)
Ambuja Cements Cement 0.70DLF Construction 0.69IRB Infrastructure Developers Construction 0.63Prestige Estates Projects Construction 0.55Ashoka Buildcon Construction Project 0.91KEC International Construction Project 0.83Larsen & Toubro Construction Project 0.64Hindustan Construction Company Construction Project 0.61Britannia Industries Consumer Non Durables 1.21ITC Consumer Non Durables 1.17Bombay Burmah Trading Corporation Consumer Non Durables 0.98Balrampur Chini Mills Consumer Non Durables 0.96United Spirits Consumer Non Durables 0.54Housing Development Finance Corporation Finance 1.51Dewan Housing Finance Corporation Finance 1.42Rural Electrification Corporation Finance 0.71L&T Finance Holdings Finance 0.65Indraprastha Gas Gas 0.97Mahindra Holidays & Resorts India Hotels, Resorts & 1.48
Other Recreational ActivitiesThe Indian Hotels Company Hotels, Resorts & 0.84
Other Recreational ActivitiesJain Irrigation Systems Industrial Products 1.07Coal India Minerals/Mining 0.55Hindalco Industries Non - Ferrous Metals 0.74National Aluminium Company Non - Ferrous Metals 0.49Hindustan Zinc Non - Ferrous Metals 0.41Reliance Industries Petroleum Products 1.61Hindustan Petroleum Corporation Petroleum Products 0.48Abbott India Pharmaceuticals 1.22Natco Pharma Pharmaceuticals 1.05Aurobindo Pharma Pharmaceuticals 1.00Sun Pharmaceuticals Industries Pharmaceuticals 0.88Cipla Pharmaceuticals 0.78Glenmark Pharmaceuticals Pharmaceuticals 0.50Kalpataru Power Transmission Power 0.78RattanIndia Power Power 0.60Aditya Birla Nuvo Services 0.81Infosys Software 2.74Tata Consultancy Services Software 2.34HCL Technologies Software 1.70Firstsource Solutions Software 1.42Cyient Software 0.30Bharti Airtel Telecom - Services 0.90Tata Communications Telecom - Services 0.77SRF Textile Products 0.97Navkar Corporation Transportation 0.75Gateway Distriparks Transportation 0.66Spicejet Ltd Transportation 0.37Treasury Bill 0.71T-Bill 91 Day 2016 Sovereign 0.71Sovereign 15.0708.13% GOI -M- 22-JUN-2045 Sovereign 15.07Bonds & NCDs 14.43Housing Development Finance Corporation AAA 9.02Rural Electrification Corporation AAA 3.90National Bank for Agriculture &Rural Development AAA 1.51Cash and Other Assets 2.70Net Assets 100.00
SECTOR ALLOCATION OF EQUITY INSTRUMENTS (TOP 10) (As on December 31, 2015)
FUND FEATURES (As on December 31, 2015)
MAAUM: ` 33.18 crore • AUM: ` 33.40 crore
NAV Per Unit (As on December 31, 2015):Direct Plan Regular Plan
Growth Option : ` 52.23 ` 50.98Dividend Option (Half yearly) : ` 25.12 ` 22.71
INVESTMENT OBJECTIVE: To provide long term appreciation and current income byinvesting in a portfolio of equity, equity related securities and fixed income securities.
DIVIDEND UPDATE
Date Regular Plan Direct PlanDividend Cum Dividend Cum(`̀̀̀̀/Unit)* Dividend (`̀̀̀̀/Unit)* Dividend
NAV NAVDecember 24, 2015 0.6500 23.24 0.8900 25.87
December 29, 2014 2.3200 24.83 0.3900 25.28
March 24, 2008 2.5000 14.9200 N.A. N.A.
November 5, 2007 6.0000 23.9000 N.A. N.A.
November 9, 2005 3.2000 16.4100 N.A. N.A.
Past performance may or may not be sustained in the future. * On face value of ` 10.Note: All Dividend (`/Unit) figures are Gross Dividend.
RATIOS & OTHER DETAILS (As on December 31, 2015)
Standard Deviation^@ (Annualised) 12.55%
Beta^@ 1.09
Sharpe Ratio^@ (Annualised) 0.54
Portfolio Turnover Ratio**@ 0.48
Expense Ratio# Direct Plan - 2.21%Regular Plan - 2.98%
Note: ^ The above measures have been calculated by taking rolling returns for a 3 yearperiod with 7.03% risk free rate of return (1 days - MIBOR Rate as on Dec. 31, 2015).** The Portfolio Turnover Rate (PTR) means the lower of aggregate sales or purchases madeduring the 12 month rolling year/period divided by the 12 month rolling year/period Averageasset under Management for the relevant year/period.# MTD ratio to Average AUM including Service Tax on Management Fees which is over andabove to TER & proportionate charge in respect of sales beyond T-15 cities subject to maximumof 30 bps on daily net assets.@ For equity portion only.
AVERAGE MATURITY OF THE DEBT PORTFOLIO (As on December 31, 2015)
15.58 years
MODIFIED DURATION OF THE DEBT PORTFOLIO (As on December 31, 2015)
6.73 years
YIELD TO MATURITY OF THE DEBT PORTFOLIO (As on December 31, 2015)
8.11%
PORTFOLIO (As on December 31, 2015)
Instrument Industry / Rating % of NAVEquity 67.09Tata Motors Auto 2.11Bajaj Auto Auto 1.46Escorts Auto 1.38Maruti Suzuki India Auto 1.06Asahi India Glass Auto Ancillaries 0.70Motherson Sumi Systems Auto Ancillaries 0.60HDFC Bank Banks 3.43ICICI Bank Banks 2.22State Bank of India Banks 1.70Bank of Baroda Banks 1.23Axis Bank Banks 0.75The Federal Bank Banks 0.73The Ramco Cements Cement 1.50Century Textiles & Industries Cement 1.44JK Cement Cement 1.12UltraTech Cement Cement 1.00The India Cements Cement 0.77

INVEST KNOWHOW December 201518
Principal Debt Savings Fund (An open-ended income fund)
- Monthly Income Plan (Monthly Income is not assured and is subject to the availability of distributable surplus.)
PORTFOLIO (As on December 31, 2015)
Instrument Industry/Rating % of NAV
Derivatives 2.25
NIFTY Index Future Jan 2016 Index Futures 2.25
Certificate of Deposit 1.40
DCB Bank A1+ 1.40
Treasury Bill 1.08
T-Bill 91 Day 2016 Sovereign 1.08
Sovereign 70.93
8.17% GOI -M- 01-DEC-2044 Sovereign 23.79
08.13% GOI -M- 22-JUN-2045 Sovereign 23.72
7.88% GOI -M- 19-Mar-2030 Sovereign 23.42
Bonds & NCDs 14.20
Housing Development Finance Corporation AAA 14.20
Investment Funds/Mutual Funds 11.41
Principal Index Fund - Nifty -Direct Plan - Growth Option Mutual Funds 11.41
Cash and Other Assets -1.27
Net Assets 100.00
COMPOSITION BY ASSETS (As on December 31, 2015)
Industry / Ratings % of NAV
Sovereign 70.93
Bonds & NCDs 14.20
Investment Funds/Mutual Funds 11.41
Derivatives 2.25
Certificate of Deposit 1.40
Treasury Bill 1.08
Cash and Other Assets -1.27
RATING PROFILE (As on December 31, 2015)
FUND FEATURES (As on December 31, 2015)
MAAUM: ` 21.34 crore • AUM: ` 21.20 crore
NAV Per Unit (As on December 31, 2015):Direct Plan Regular Plan
Growth Option : ` 29.1998 ` 28.5481Dividend Option (Monthly) : ` 10.9463 ` 10.7762Dividend Option (Quarterly) : ` 12.4960 ` 12.2299
INVESTMENT OBJECTIVETo generate regular income through investments in fixed income securities so as tomake periodical income distribution to the Unitholders and also to generate long-termcapital appreciation by investing a portion of the Scheme’s assets in equity and equityrelated instruments.
DIVIDEND UPDATE
Date Regular Plan Direct Plan
Dividend Cum Dividend Cum(`̀̀̀̀/Unit)* Dividend (`̀̀̀̀/Unit)* Dividend
NAV NAV
Monthly Dividend (Last 3 Months)
October 23, 2015 0.1481 11.1056 0.2453 11.3633
September 24, 2015 0.0509 10.9226 0.0767 11.1947
July 27, 2015 – – 0.0230 11.1410
Quarterly Dividend (Last 3 Quarters)
December 23, 2015 0.0747 12.3027 0.0945 12.5868
September 24, 2015 0.0294 12.2772 0.0752 12.5865
March 24, 2015 0.3907 12.6051 0.4210 12.8959
* On face value of ` 10.Past performance may or may not be sustained in the future.Note: All Dividend (`/Unit) figures are Gross Dividend.
RATIO (As on December 31, 2015)
Portfolio Turnover Ratio** –
Expense Ratio Direct Plan - 1.65%Regular Plan - 2.24%
** The Portfolio Turnover Rate (PTR) means the lower of aggregate sales or purchases madeduring the 12 month rolling year/period divided by the 12 month rolling year/period Averageasset under Management for the relevant year/period.
AVERAGE MATURITY OF THE DEBT PORTFOLIO (As on December 31, 2015)
20.19 years
MODIFIED DURATION OF THE DEBT PORTFOLIO (As on December 31, 2015)
8.73 years
YIELD TO MATURITY OF THE DEBT PORTFOLIO (As on December 31, 2015)
8.07%(% of NAV)
72.01%
14.20%
1.40%
12.39%
0.00% 20.00% 40.00% 60.00% 80.00%
Sovereign
AAA
A1+
Cash and Other Assets(incl. MF Units & Index Futures)

INVEST KNOWHOW December 201519
Principal Debt Savings Fund (An open-ended income fund)
- Retail Plan
FUND FEATURES (As on December 31, 2015)
MAAUM: ` 22.26 crore • AUM: ` 22.15 crore
NAV Per Unit (As on December 31, 2015):Direct Plan Regular Plan
Growth Plan : ` 26.3279 ` 25.7061Dividend Plan (Monthly) : N.A. ` 10.2598Dividend Plan (Quarterly) : ` 12.0669 ` 11.9877
INVESTMENT OBJECTIVETo seek to generate stable returns and capital appreciation through investment in Debtinstruments and related securities over medium to long term investment horizon.
DIVIDEND UPDATE
Date Regular Plan Direct Plan
Dividend Cum Dividend Cum(`̀̀̀̀/Unit)* Dividend (`̀̀̀̀/Unit)* Dividend
NAV NAV
Monthly Dividend (Last 3 Months)
December 23, 2015 0.0352 10.2822 – –
November 24, 2015 0.0183 10.2653 – –
October 23, 2015 0.1395 10.3865 – –
Quarterly Dividend (Last 3 Quarters)
December 23, 2015 0.2232 12.1958 0.2456 12.2952
September 24, 2015 0.2070 12.1764 0.2294 12.2743
June 24, 2015 0.1070 12.0409 0.1285 12.1356
* On face value of ` 10.Past performance may or may not be sustained in the future.Note: All Dividend (`/Unit) figures are Gross Dividend.
TOTAL EXPENSE RATIO (As on December 31, 2015)
Direct Plan- 0.50% • Regular Plan - 1.25%
AVERAGE MATURITY (As on December 31, 2015)
5.35 years
MODIFIED DURATION (As on December 31, 2015)
3.87 years
YIELD TO MATURITY (As on December 31, 2015)
8.20%
PORTFOLIO (As on December 31, 2015)
Instrument Rating % of NAV
Treasury Bill 1.34
T-Bill 91 Day 2016 Sovereign 1.34
Sovereign 40.21
7.72% GOI -M- 25-May-2025 Sovereign 22.51
8.40% GOI -M- 28-JUL-2024 Sovereign 17.70
Bonds & NCDs 43.95
Rural Electrification Corporation AAA 16.74
Housing Development Finance Corporation AAA 13.60
Aspire Home Finance Corporation A+ 9.04
Bajaj Finance AA+ 4.57
Cash and Other Assets 14.50
Net Assets 100.00
COMPOSITION BY ASSETS (As on December 31, 2015)
Industry / Ratings % of NAV
Bonds & NCDs 43.95
Sovereign 40.21
Treasury Bill 1.34
Cash and Other Assets 14.50
RATING PROFILE (As on December 31, 2015)
(% of NAV)
41.55%
30.34%
9.04%
14.50%
4.57%
0.00% 10.00% 20.00% 30.00% 40.00% 50.00%
Sovereign
AAA
A+
AA+
Cash and Other Assets

INVEST KNOWHOW December 201520
Principal Government Securities Fund(An open-ended dedicated gilt scheme investing in government securities)
PORTFOLIO (As on December 31, 2015)
Instrument Rating % of NAV
Sovereign 83.51
08.30% GOI -M- 31-DEC-2042 Sovereign 23.20
8.24% GOI -M- 10-NOV-2033 Sovereign 13.81
7.73% GOI -M- 19-DEC-2034 Sovereign 13.30
8.60% GOI -M- 02-JUN-2028 Sovereign 9.50
7.88% GOI -M- 19-Mar-2030 Sovereign 9.04
9.20% GOI -M- 30-SEP-2030 Sovereign 8.28
08.83% GOI -M- 25-NOV-2023 Sovereign 6.38
Cash and Other Assets 16.49
Net Assets 100.00
COMPOSITION BY ASSETS (As on December 31, 2015)
Ratings % of NAV
Sovereign 83.51
Cash and Other Assets 16.49
RATING PROFILE (As on December 31, 2015)
FUND FEATURES (As on December 31, 2015)
MAAUM: ` 40.34 crore • AUM: ` 32.97 crore
NAV Per Unit (As on December 31, 2015):Direct Plan Regular Plan
Growth Option : ` 29.3602 ` 28.9282Dividend Option (Quarterly) : ` 11.9502 ` 11.9145Dividend Option (Annual) : ` 13.6783 ` 13.2610
INVESTMENT OBJECTIVETo generate return through investment in sovereign securities and thus provide capitalgains and income distribution to its Unitholders.
DIVIDEND UPDATE
Date Regular Plan Direct Plan
Dividend Cum Dividend Cum(`̀̀̀̀/Unit)* Dividend (`̀̀̀̀/Unit)* Dividend
NAV NAV
Quarterly Dividend Option (Last 3 Quarters)
December 23, 2015 0.1339 12.0501 0.1496 12.101
September 24, 2015 0.2814 12.2067 0.3123 12.2718
March 24, 2015 0.3658 12.2325 0.3800 12.2792
Annual Dividend Option (Last 3 Years)
September 24, 2015 1.6751 14.8009 1.7979 15.3183
September 24, 2014 1.1532 14.2079 1.2578 14.7028
September 24, 2013 0.7559 13.7794 0.4192 13.8300
* On face value of ` 10.Past performance may or may not be sustained in the future.Note: All Dividend (`/Unit) figures are Gross Dividend.
TOTAL EXPENSE RATIO (As on December 31, 2015)
Direct Plan- 1.00% • Regular Plan - 1.50%
AVERAGE MATURITY (As on December 31, 2015)
15.45 years
MODIFIED DURATION (As on December 31, 2015)
7.59 years
YIELD TO MATURITY (As on December 31, 2015)
7.90%
MATURITY PROFILE
Period Portfolio (%)
5 - 10 years 6.38
10 - 15 years 26.82
Above 15 years 50.31
Cash and Other Assets 16.49
83.51%
16.49%
0.00% 20.00% 40.00% 60.00% 80.00% 100.00%
Sovereign
Cash and Other Assets
(% of NAV)

INVEST KNOWHOW December 201521
Principal Dynamic Bond Fund* (An open-ended income scheme)
PORTFOLIO (As on December 31, 2015)
Instrument Rating % of NAV
Certificate of Deposit 5.80
Allahabad Bank A1+ 5.80
Commercial Paper 5.76
JM Financial Products A1+ 5.76
Sovereign 63.25
08.83% GOI -M- 25-NOV-2023 Sovereign 15.86
8.24% GOI -M- 10-NOV-2033 Sovereign 12.33
08.30% GOI -M- 31-DEC-2042 Sovereign 8.88
8.60% GOI -M- 02-JUN-2028 Sovereign 8.49
7.73% GOI -M- 19-DEC-2034 Sovereign 6.22
8.40% GOI -M- 28-JUL-2024 Sovereign 5.99
9.20% GOI -M- 30-SEP-2030 Sovereign 3.17
7.88% GOI -M- 19-Mar-2030 Sovereign 2.31
Bonds & NCDs 2.32
Aspire Home Finance Corporation A+ 2.32
Cash and Other Assets 22.87
Net Assets 100.00
COMPOSITION BY ASSETS (As on December 31, 2015)
Ratings % of NAV
Sovereign 63.25
Certificate of Deposit 5.80
Commercial Paper 5.76
Bonds & NCDs 2.32
Cash and Other Assets 22.87
RATING PROFILE (As on December 31, 2015)
FUND FEATURES (As on December 31, 2015)
MAAUM: ` 86.16 crore • AUM: ` 86.13 crore
NAV Per Unit (As on December 31, 2015):Direct Plan Regular Plan
Growth Option : ` 25.4782 ` 24.9133Dividend Option (Quarterly) : ` 13.1309 ` 13.0701Dividend Option (Annual) : ` 11.7038 ` 11.3614
INVESTMENT OBJECTIVETo generate regular income and capital appreciation/accretion through investment indebt instruments and related securities besides preservation of capital.
DIVIDEND UPDATE
Date Regular Plan Direct Plan
Dividend Cum Dividend Cum(`̀̀̀̀/Unit)* Dividend (`̀̀̀̀/Unit)* Dividend
NAV NAV
Quarterly Dividend Option (Last 3 Quarters)
December 23, 2015 0.1651 13.2338 0.0448 13.1723
September 24, 2015 0.3349 13.4186 0.3836 13.5245
March 24, 2015 0.3764 13.4051 0.3976 13.4809
Annual Dividend Option (Last 3 Years)
September 24, 2015 1.3206 12.552 1.4457 12.9921
September 24, 2014 0.9630 12.1429 1.0896 12.5807
September 24, 2013 0.7029 11.8468 0.4597 11.9117
* On face value of ` 10.Past performance may or may not be sustained in the future.Note: All Dividend (`/Unit) figures are Gross Dividend.
TOTAL EXPENSE RATIO (As on December 31, 2015)
Direct Plan- 0.92% • Regular Plan - 1.65%
AVERAGE MATURITY (As on December 31, 2015)
9.47 years
MODIFIED DURATION (As on December 31, 2015)
5.1 years
YIELD TO MATURITY (As on December 31, 2015)
7.88%
MATURITY PROFILE
Period Portfolio (%)
Less than 1 year 11.56
1 - 3 years 2.32
5 - 10 years 21.85
10 - 15 years 13.97
Above 15 years 27.43
Cash and Others Assets 22.87
63.25%
11.56%
2.32%
22.87%
0.00% 10.00% 20.00% 30.00% 40.00% 50.00% 60.00% 70.00%
Sovereign
A1+
A+
Cash and Other Assets
(% of NAV)
*Name change w.e.f January 01, 2016, the scheme was earlier known as Principal Income Fund - Long Term Plan.

INVEST KNOWHOW December 201522
Principal Debt Opportunities Fund - Corporate Bond Plan(An open-ended debt scheme)
PORTFOLIO (As on December 31, 2015)
Instrument Rating % of NAV
Commercial Paper 90.60
Godrej Industries A1+ 25.59
HCL Infosystems A1+ 17.81
JK Lakshmi Cement A1+ 14.11
KEC International A1 11.86
Aadhar Housing Finance A1+ 7.09
Housing Development Finance Corporation A1+ 5.95
Cox & Kings A1+ 5.84
Magma ITL Finance A1+ 2.35
Treasury Bill 0.12
T-Bill 91 Day 2016 Sovereign 0.12
Bonds & NCDs 0.60
Rural Electrification Corporation AAA 0.60
Cash and Other Assets 8.68
Net Assets 100.00
COMPOSITION BY ASSETS (As on December 31, 2015)
Industry / Ratings % of NAV
Commercial Paper 90.60
Bonds & NCDs 0.60
Treasury Bill 0.12
Cash and Other Assets 8.68
RATING PROFILE (As on December 31, 2015)
FUND FEATURES (As on December 31, 2015)
MAAUM: ` 83.64 crore • AUM: ` 83.97 crore
NAV Per Unit (As on December 31, 2015):Direct Plan Regular Plan
Growth Option : ` 2321.4868 ` 2293.9994Dividend Option (Monthly) : ` 1240.8865 ` 1237.8939
INVESTMENT OBJECTIVEThe primary objective is to generate income and capital gains through investments in aportfolio of securities issued by Private and Public Sector Companies.
DIVIDEND UPDATE
Date Regular Plan Direct Plan
Dividend Cum Dividend Cum(`̀̀̀̀/Unit)* Dividend (`̀̀̀̀/Unit)* Dividend
NAV NAV
Monthly Dividend (Last 3 Months)
December 23, 2015 8.5518 1244.0703 8.7202 1247.1841
November 24, 2015 8.8184 1244.3369 9.0036 1247.4675
October 23, 2015 8.5580 1244.0765 8.7276 1247.1915
* On face value of ` 1,000/-.Past performance may or may not be sustained in the future.All Dividend (`/Unit) figures are Gross Dividend.
TOTAL EXPENSE RATIO (As on December 31, 2015)
Direct Plan- 0.15% • Regular Plan - 0.30%
AVERAGE MATURITY (As on December 31, 2015)
23 days
MODIFIED DURATION (As on December 31, 2015)
21 days
YIELD TO MATURITY (As on December 31, 2015)
8.36%
(% of NAV)
78.74%
11.86%
0.60%
8.68%
0.12%
0.00% 20.00% 40.00% 60.00% 80.00% 100.00%
A1+
A1
AAA
Sovereign
Cash and Other Assets
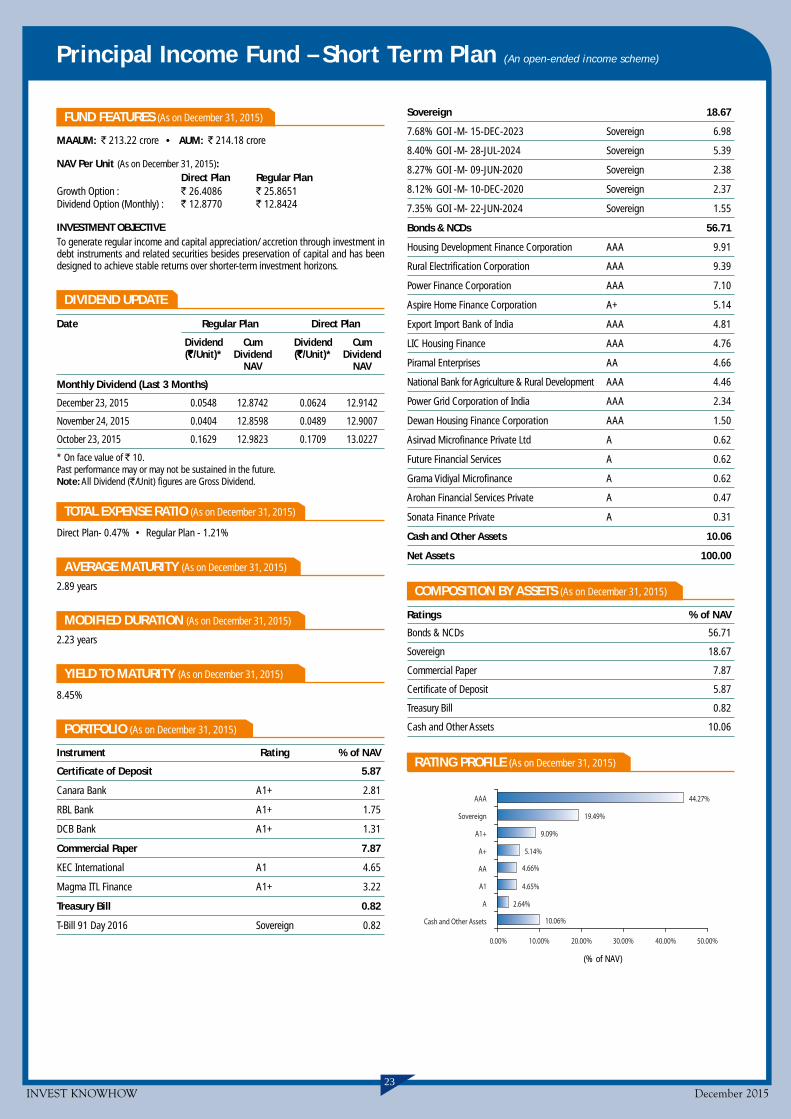
INVEST KNOWHOW December 201523
Principal Income Fund – Short Term Plan (An open-ended income scheme)
FUND FEATURES (As on December 31, 2015)
MAAUM: ` 213.22 crore • AUM: ` 214.18 crore
NAV Per Unit (As on December 31, 2015):Direct Plan Regular Plan
Growth Option : ` 26.4086 ` 25.8651Dividend Option (Monthly) : ` 12.8770 ` 12.8424
INVESTMENT OBJECTIVETo generate regular income and capital appreciation/ accretion through investment indebt instruments and related securities besides preservation of capital and has beendesigned to achieve stable returns over shorter-term investment horizons.
DIVIDEND UPDATE
Date Regular Plan Direct Plan
Dividend Cum Dividend Cum(`̀̀̀̀/Unit)* Dividend (`̀̀̀̀/Unit)* Dividend
NAV NAV
Monthly Dividend (Last 3 Months)
December 23, 2015 0.0548 12.8742 0.0624 12.9142
November 24, 2015 0.0404 12.8598 0.0489 12.9007
October 23, 2015 0.1629 12.9823 0.1709 13.0227
* On face value of ` 10.Past performance may or may not be sustained in the future.Note: All Dividend (`/Unit) figures are Gross Dividend.
TOTAL EXPENSE RATIO (As on December 31, 2015)
Direct Plan- 0.47% • Regular Plan - 1.21%
AVERAGE MATURITY (As on December 31, 2015)
2.89 years
MODIFIED DURATION (As on December 31, 2015)
2.23 years
YIELD TO MATURITY (As on December 31, 2015)
8.45%
PORTFOLIO (As on December 31, 2015)
Instrument Rating % of NAV
Certificate of Deposit 5.87
Canara Bank A1+ 2.81
RBL Bank A1+ 1.75
DCB Bank A1+ 1.31
Commercial Paper 7.87
KEC International A1 4.65
Magma ITL Finance A1+ 3.22
Treasury Bill 0.82
T-Bill 91 Day 2016 Sovereign 0.82
44.27%
19.49%
9.09%
4.66%
10.06%
5.14%
4.65%
2.64%
0.00% 10.00% 20.00% 30.00% 40.00% 50.00%
AAA
Sovereign
A1+
A+
AA
A1
A
Cash and Other Assets
(% of NAV)
Sovereign 18.67
7.68% GOI -M- 15-DEC-2023 Sovereign 6.98
8.40% GOI -M- 28-JUL-2024 Sovereign 5.39
8.27% GOI -M- 09-JUN-2020 Sovereign 2.38
8.12% GOI -M- 10-DEC-2020 Sovereign 2.37
7.35% GOI -M- 22-JUN-2024 Sovereign 1.55
Bonds & NCDs 56.71
Housing Development Finance Corporation AAA 9.91
Rural Electrification Corporation AAA 9.39
Power Finance Corporation AAA 7.10
Aspire Home Finance Corporation A+ 5.14
Export Import Bank of India AAA 4.81
LIC Housing Finance AAA 4.76
Piramal Enterprises AA 4.66
National Bank for Agriculture & Rural Development AAA 4.46
Power Grid Corporation of India AAA 2.34
Dewan Housing Finance Corporation AAA 1.50
Asirvad Microfinance Private Ltd A 0.62
Future Financial Services A 0.62
Grama Vidiyal Microfinance A 0.62
Arohan Financial Services Private A 0.47
Sonata Finance Private A 0.31
Cash and Other Assets 10.06
Net Assets 100.00
COMPOSITION BY ASSETS (As on December 31, 2015)
Ratings % of NAV
Bonds & NCDs 56.71
Sovereign 18.67
Commercial Paper 7.87
Certificate of Deposit 5.87
Treasury Bill 0.82
Cash and Other Assets 10.06
RATING PROFILE (As on December 31, 2015)

INVEST KNOWHOW December 201524
Principal Bank CD Fund (An open-ended debt scheme)
PORTFOLIO (As on December 31, 2015)
Instrument Rating % of NAV
Certificate of Deposit 82.05
DCB Bank A1+ 29.18
RBL Bank A1+ 28.30
Canara Bank A1+ 17.90
Oriental Bank of Commerce A1+ 6.67
Treasury Bill 0.13
T-Bill 91 DAY 2016 Sovereign 0.13
Bonds & NCDs 17.43
Dewan Housing Finance Corporation AAA 17.43
Cash and Other Assets 0.39
Net Assets 100.00
COMPOSITION BY ASSETS (As on December 31, 2015)
Ratings % of NAV
Certificate of Deposit 82.05
Bonds & NCDs 17.43
Treasury Bill 0.13
Cash and Other Assets 0.39
RATING PROFILE (As on December 31, 2015)
FUND FEATURES (As on December 31, 2015)
MAAUM: ` 73.52 crore • AUM: ` 73.98 crore
NAV Per Unit (As on December 31, 2015):Direct Plan Regular Plan
Growth Option : ` 1922.0831 ` 1899.2497
Dividend Option (Monthly) : ` 1128.0043 ` 1126.7816
INVESTMENT OBJECTIVEThe objective is to generate returns by primarily investing in Bank CDs. Bank CDs provideliquidity and a relatively lower credit risk.
DIVIDEND UPDATE
Date Regular Plan Direct Plan
Dividend Cum Dividend Cum(`̀̀̀̀/Unit)* Dividend (`̀̀̀̀/Unit)* Dividend
NAV NAV
Monthly Dividend (Last 3 Months)
December 23, 2015 5.9535 1130.5796 6.4079 1132.1306
November 24, 2015 6.7725 1131.3986 7.2751 1132.9978
October 23, 2015 7.9314 1132.5575 8.3889 1134.1116
* On face value of ` 1,000/-Past performance may or may not be sustained in the future.All Dividend (`/Unit) figures are Gross Dividend.
TOTAL EXPENSE RATIO (As on December 31, 2015)
Direct Plan- 0.25% • Regular Plan - 0.75%
AVERAGE MATURITY (As on December 31, 2015)
65 days
MODIFIED DURATION (As on December 31, 2015)
60 days
YIELD TO MATURITY (As on December 31, 2015)
7.44%
82.05%
17.43%
0.13%
0.39%
0.00% 20.00% 40.00% 60.00% 80.00% 100.00%
A1+
AAA
Sovereign
Cash and Other Assets
A1+
AAA
Sovereign
Cash and Other Assets
(% of NAV)

INVEST KNOWHOW December 201525
52.60%
20.05%
16.96%
3.69%
3.75%
1.54%
1.41%
0.00% 10.00% 20.00% 30.00% 40.00% 50.00% 60.00%
A1+
AA
AAA
Sovereign
A
AA-
Cash and Other Assets
Principal Debt Opportunities Fund - Conservative Plan(An open-ended debt scheme)
FUND FEATURES (As on December 31, 2015)
MAAUM: ` 419.27 crore • AUM: ` 399.97 crore
NAV Per Unit (As on December 31, 2015):Direct Plan Regular Plan
Growth Option : ` 2383.7467 ` 2330.2518Dividend Option (Daily) : ` 1003.3517 ` 1003.4214Dividend Option (Weekly) : ` 1004.1621 ` 1002.2227Dividend Option (Monthly) : ` 1143.4935 ` 1141.3202
INVESTMENT OBJECTIVETo generate regular income and capital appreciation through investments in debtsecurities and money market instruments.
DIVIDEND UPDATE
Date Regular Plan Direct Plan
Dividend Cum Dividend Cum(`̀̀̀̀/Unit)* Dividend (`̀̀̀̀/Unit)* Dividend
NAV NAV
Monthly Dividend (Last 3 Months)
December 23, 2015 5.4756 1144.5949 6.2591 1147.3330
November 24, 2015 6.7284 1145.8477 7.5946 1148.6685
October 23, 2015 8.9287 1148.0480 9.7860 1150.8599
* On face value of ` 1,000/-.Past performance may or may not be sustained in the future.All Dividend (`/Unit) figures are Gross Dividend.
TOTAL EXPENSE RATIO (As on December 31, 2015)
Direct Plan- 0.25% • Regular Plan - 1.10%
AVERAGE MATURITY (As on December 31, 2015)
275 days
MODIFIED DURATION (As on December 31, 2015)
237 days
YIELD TO MATURITY (As on December 31, 2015)
8.64%
PORTFOLIO (As on December 31, 2015)
Instrument Rating % of NAV
Certificate of Deposit 7.25
Axis Bank A1+ 5.88
Canara Bank A1+ 1.37
Commercial Paper 45.35
Housing Development Finance Corporation A1+ 12.19
Cox & Kings A1+ 11.17
JK Lakshmi Cement A1+ 9.49
Magma ITL Finance A1+ 5.23
HCL Infosystems A1+ 3.78
KEC International A1+ 3.49
Treasury Bill 3.75
T-Bill 91 DAY 2016 Sovereign 2.50
T-Bill 91 DAY 2016 Sovereign 1.25
BONDS & NCDs 42.24
Tata Motors AA 12.94
Power Finance Corporation AAA 6.41
Housing Development Finance Corporation AAA 6.34
Music Broadcast Private AA 5.06
LIC Housing Finance AAA 4.05
Cholamandalam Investment andFinance Company AA 2.05
Muthoot Finance AA- 1.54
Asirvad Microfinance Private Ltd A 0.87
Future Financial Services A 0.87
Grama Vidiyal Microfinance A 0.87
Arohan Financial Services Private A 0.65
Sonata Finance Private A 0.43
Rural Electrification Corporation AAA 0.10
Power Grid Corporation of India AAA 0.06
Cash and Other Assets 1.41
Net Assets 100.00
COMPOSITION BY ASSETS (As on December 31, 2015)
Ratings % of NAV
Commercial Paper 45.35
Bonds & NCDs 42.24
Certificate of Deposit 7.25
Treasury Bill 3.75
Cash and Other Assets 1.41
RATING PROFILE (As on December 31, 2015)
(% of NAV)
Past performance is no guarantee of future result. (++ for rating methodology please refer page 39.)
CreditRisk Rating[ICRA] A1+mfs ++

Principal Global Opportunities Fund (An open-ended Fund of Funds scheme)
PORTFOLIO (As on December 31, 2015)
Instrument % of NAV
Foreign Securities
I. Units of Mutual Fund / Unit Trust 96.00Principal Global Investors Funds -Emerging Markets Equity Fund
II. Cash and Other Current Assets 4.00
Net Assets 100.00
Principal Retail Money Manager Fund (An open-ended debt scheme)
86.36%
0.12%
13.52%
0.00% 20.00% 40.00% 60.00% 80.00% 100.00%
A1+
Sovereign
Cash and Other Assets
(% of NAV)
PORTFOLIO (As on December 31, 2015)
Instrument Rating % of NAV
Certificate of Deposit 29.14
Corporation Bank A1+ 19.40
Dena Bank A1+ 9.74
Commercial Paper 57.22
Cox & Kings A1+ 19.37
Housing Development Finance Corporation A1+ 17.16
Dewan Housing Finance Corporation A1+ 12.11
Godrej Industries A1+ 8.58
Treasury Bill 0.12
T-Bill 91 Day 2016 Sovereign 0.12
Cash and Other Assets 13.52
Net Assets 100.00
COMPOSITION BY ASSETS (As on December 31, 2015)
Ratings % of NAV
Commercial Paper 57.22
Certificate of Deposit 29.14
Treasury Bill 0.12
Cash and Other Assets 13.52
RATING PROFILE (As on December 31, 2015)
INVEST KNOWHOW December 201526
FUND FEATURES (As on December 31, 2015)
MAAUM: ` 15.78 crore • AUM: ` 15.54 crore
NAV Per Unit (As on December 31, 2015):Direct Plan Regular Plan
Growth Option: ` 20.2927 ` 20.0541Dividend Option: ` 20.2927 ` 20.0541
INVESTMENT OBJECTIVETo provide long term capital appreciation by predominantly investing in overseas mutualfund schemes, and a certain portion of its corpus in Money Market Securities and/orunits of Money Market / Liquid Schemes of Principal Mutual Fund.
TOTAL EXPENSE RATIO# (As on December 31, 2015)
Direct Plan- 0.34% • Regular Plan - 0.79%# MTD ratio to Average AUM including Service Tax on Management Fees which is over and aboveto TER & after deducting rebate. Expenses charged by the underlying funds are not included inthe Expense Ratios given above.
FUND FEATURES (As on December 31, 2015)
MAAUM: ` 39.75 crore • AUM: ` 40.81 crore
NAV Per Unit (As on December 31, 2015):Direct Plan Regular Plan
Growth Option : ` 1685.6125 ` 1681.1012Dividend Option (Daily) : N.A. ` 1005.4300Dividend Option (Weekly) : N.A. ` 1012.9738Dividend Option (Monthly) : ` 1060.7460 ` 1060.6899
INVESTMENT OBJECTIVETo generate regular income & capital appreciation through investments in debt securitiesand money market instruments.
DIVIDEND UPDATE
Date Regular Plan Direct Plan
Dividend Cum Dividend Cum(`̀̀̀̀/Unit)* Dividend (`̀̀̀̀/Unit)* Dividend
NAV NAV
Monthly Dividend (Last 3 Months)
December 23, 2015 6.6797 1065.5089 6.7386 1065.6072
November 24, 2015 7.3472 1066.1764 7.4131 1066.2817
October 23, 2015 6.8563 1065.6855 6.9160 1065.7846
* On face value of ` 1,000/-.Past performance may or may not be sustained in the future.Note: All Dividend (`/Unit) figures are Gross Dividend.
TOTAL EXPENSE RATIO (As on December 31, 2015)
Direct Plan- 0.19% • Regular Plan - 0.12%
AVERAGE MATURITY (As on December 31, 2015)
36 days
MODIFIED DURATION (As on December 31, 2015)
34 days
YIELD TO MATURITY (As on December 31, 2015)
7.61%

INVEST KNOWHOW December 201527
Principal Cash Management Fund (An open-ended liquid scheme)
86.57%
5.99%
2.44%
5.00%
0.00% 20.00% 40.00% 60.00% 80.00% 100.00%
A1+
Sovereign
A1
Cash and Other Assets
(% of NAV)
CreditRisk Rating[ICRA] A1+mfs ++
Past performance is no guarantee of future result. (++ for rating methodology please refer page 39.)
Commercial Paper 44.91
Dewan Housing Finance Corporation A1+ 8.23
Cox & Kings A1+ 6.87
Steel Authority of India A1+ 4.85
Edelweiss Financial Services A1+ 4.84
Manappuram Finance A1+ 4.84
KEC International A1 2.44
Magma Fincorp A1+ 2.43
Motilal Oswal Securities A1+ 2.42
Magma ITL Finance A1+ 2.17
Export Import Bank of India A1+ 1.21
Piramal Enterprises A1+ 1.21
HCL Infosystems A1+ 0.98
Kotak Commodity Services A1+ 0.97
Aadhar Housing Finance A1+ 0.92
KEC International A1+ 0.53
Treasury Bill 5.99
T-Bill 91 DAY 2016 Sovereign 3.87
T-Bill 91 DAY 2016 Sovereign 1.77
T-Bill 91 DAY 2016 Sovereign 0.23
T-Bill 91 DAY 2016 Sovereign 0.12
Cash and Other Assets 5.00
Net Assets 100.00
COMPOSITION BY ASSETS (As on December 31, 2015)
Ratings % of NAV
Commercial Paper 44.91
Certificate of Deposit 44.10
Treasury Bill 5.99
Cash and Other Assets 5.00
RATING PROFILE (As on December 31, 2015)
FUND FEATURES (As on December 31, 2015)
MAAUM: ` 2,319.69 crore • AUM: ` 1,637.91 crore
NAV Per Unit (As on December 31, 2015):Direct Plan Regular Plan
Growth Option : ` 1445.4877 ` 1441.7985Dividend Option (Daily) : ` 1000.3870 ` 1000.4682Dividend Option (Weekly) : ` 1006.9739 ` 1006.4402Dividend Option (Monthly) : ` 1024.5055 ` 1024.4731
INVESTMENT OBJECTIVETo provide investors with as high a level of income available from short-term investmentsas is considered consistent with preservation of capital and maintenance of liquidity, byinvesting in a portfolio of money market and investment grade debt instruments.
DIVIDEND UPDATE
Date Regular Plan Direct Plan
Dividend Cum Dividend Cum(`̀̀̀̀/Unit)* Dividend (`̀̀̀̀/Unit)* Dividend
NAV NAV
Monthly Dividend (Last 3 Months)
December 23, 2015 6.0053 1028.7297 6.0621 1028.8033
November 24, 2015 6.7491 1029.4735 6.8122 1029.5534
October 23, 2015 6.3386 1029.0630 6.3960 1029.1372
* On face value of ` 1,000/-.Past performance may or may not be sustained in the future.All Dividend (`/Unit) figures are Gross Dividend.
TOTAL EXPENSE RATIO (As on December 31, 2015)
Direct Plan- 0.07% • Regular Plan - 0.14%
AVERAGE MATURITY (As on December 31, 2015)
48 days
MODIFIED DURATION (As on December 31, 2015)
45 days
YIELD TO MATURITY (As on December 31, 2015)
7.69%
PORTFOLIO (As on December 31, 2015)
Instrument Rating % of NAV
Certificate of Deposit 44.10
Vijaya Bank A1+ 9.69
IDBI Bank A1+ 7.26
Allahabad Bank A1+ 7.11
The South Indian Bank A1+ 4.86
Bank of Maharashtra A1+ 3.63
IndusInd Bank A1+ 2.43
Punjab & Sind Bank A1+ 2.43
Corporation Bank A1+ 2.42
Dena Bank A1+ 2.24
Corporation Bank A1+ 2.03

INVEST KNOWHOW December 201528
Principal Asset Allocation Fund (An open-ended Fund-of-Funds Scheme)
PORTFOLIO (As on December 31, 2015)
Instrument % of NAV
Investment Funds/Mutual Funds 112.66
Principal Income Fund Short Term Plan -Direct Plan- Growth Option Mutual Funds 67.37
Principal Debt Opportunities Fund -Conservative Plan - Direct Plan - Growth Option Mutual Funds 28.10
Principal Large Cap Fund -Direct Plan - Growth Option Mutual Funds 17.19
Cash and Other Assets -12.66
Net Assets 100.00
FUND FEATURES (As on December 31, 2015)
MAAUM: ` 38.53 crore • AUM: ` 37.84 crore
NAV Per Unit (As on December 31, 2015):Direct Sub-Plan Regular Sub-Plan
Growth Option: ` 10.0795 ` 10.0757
INVESTMENT OBJECTIVEThe objective of the Plan is to provide long term total return primarily by seeking incomethrough investments made in debt/money market mutual funds with some exposure toequity mutual funds.
TOTAL EXPENSE RATIO# (As on December 31, 2015)
Direct Sub-Plan- 0.10% • Regular Sub-Plan - 0.90%# MTD ratio to Average AUM including Service Tax on Management Fees which is over and aboveto TER & after deducting rebate. Expenses charged by the underlying funds are not included inthe Expense Ratios given above.
CONSERVATIVE PLAN
PORTFOLIO (As on December 31, 2015)
Instrument % of NAV
Investment Funds/Mutual Funds 99.46
Principal Income Fund - Short Term Plan -Direct Plan - Growth Option Mutual Funds 41.41
Principal Large Cap Fund - Direct Plan -Growth Option Mutual Funds 30.14
Principal Debt Opportunities Fund -Conservative Plan - Direct Plan - Growth Option Mutual Funds 17.74
Principal Emerging Bluechip Fund -Direct Plan - Growth Option Mutual Funds 10.17
Cash and Other Assets 0.54
Net Assets 100.00
FUND FEATURES (As on December 31, 2015)
MAAUM: ` 22.01 crore • AUM: ` 22.35 crore
NAV Per Unit (As on December 31, 2015):Direct Sub-Plan Regular Sub-Plan
Growth Option: ` 10.1446 ` 10.1403
INVESTMENT OBJECTIVEThe objective of the Plan is to provide long term total return by seeking capitalappreciation and income through investments made in a basket of equity mutual funds,debt/money market mutual funds and Gold ETFs.
TOTAL EXPENSE RATIO# (As on December 31, 2015)
Direct Sub-Plan- 0.32% • Regular Sub-Plan - 1.21%# MTD ratio to Average AUM including Service Tax on Management Fees which is over and aboveto TER & after deducting rebate. Expenses charged by the underlying funds are not included inthe Expense Ratios given above.
MODERATE PLAN
PORTFOLIO (As on December 31, 2015)
Instrument % of NAV
Investment Funds/Mutual Funds 99.61
Principal Large Cap Fund - Direct Plan -Growth Option Mutual Funds 60.01
Principal Income Fund - Short Term Plan -Direct Plan - Growth Option Mutual Funds 17.50
Principal Emerging Bluechip Fund -Direct Plan- Growth Option Mutual Funds 15.18
Principal Debt Opportunities Fund -Conservative Plan - Direct Plan - Growth Option Mutual Funds 6.92
Cash and Other Assets 0.39
Net Assets 100.00
FUND FEATURES (As on December 31, 2015)
MAAUM: ` 2.20 crore • AUM: ` 1.97 crore
NAV Per Unit (As on December 31, 2015):Direct Sub-Plan Regular Sub-Plan
Growth Option: ` 10.2183 ` 10.2157
INVESTMENT OBJECTIVEThe objective of the Plan is to provide long term total return by seeking capitalappreciation through investments made primarily in equity mutual funds with someallocation to debt/money market mutual funds and Gold ETFs.
TOTAL EXPENSE RATIO# (As on December 31, 2015)
Direct Sub-Plan- 0.32% • Regular Sub-Plan - 1.31%# MTD ratio to Average AUM including Service Tax on Management Fees which is over and aboveto TER & after deducting rebate. Expenses charged by the underlying funds are not included inthe Expense Ratios given above.
AGGRESSIVE PLAN
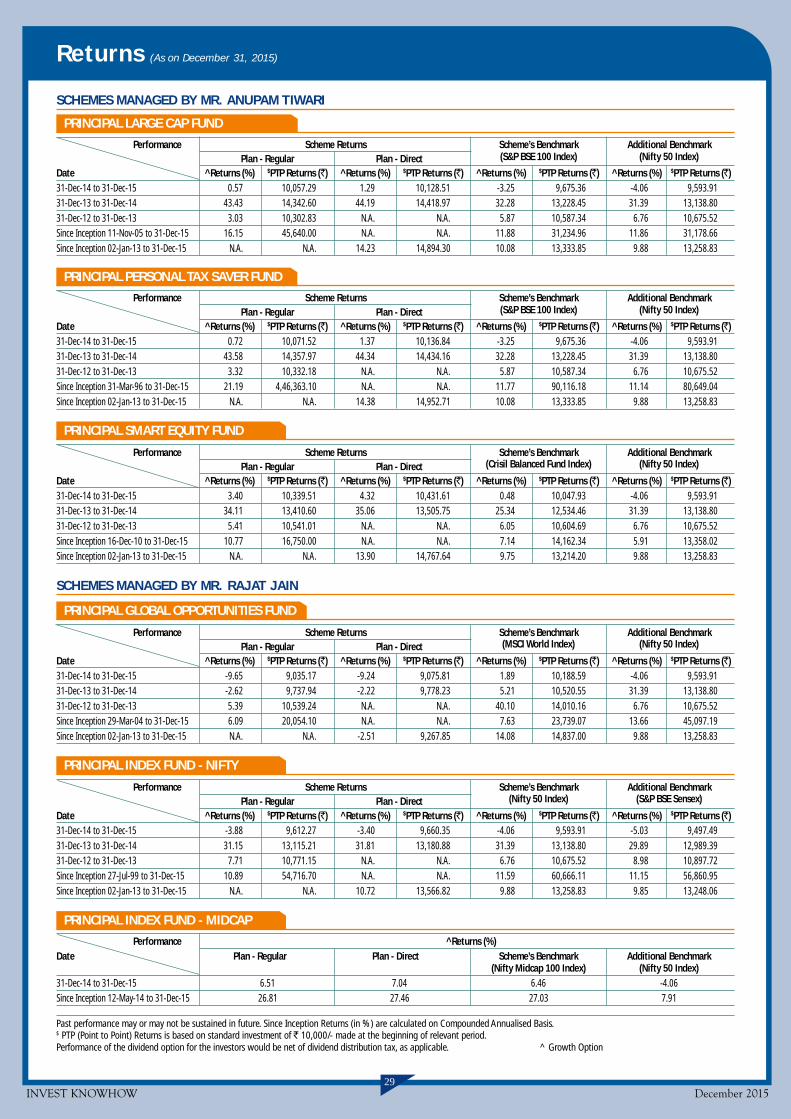
INVEST KNOWHOW December 201529
SCHEMES MANAGED BY MR. ANUPAM TIWARI
Returns (As on December 31, 2015)
SCHEMES MANAGED BY MR. RAJAT JAIN
PRINCIPAL LARGE CAP FUND
Performance Scheme Returns Scheme’s Benchmark Additional BenchmarkPlan - Regular Plan - Direct (S&P BSE 100 Index) (Nifty 50 Index)
Date ^Returns (%) $PTP Returns (`) ^Returns (%) $PTP Returns (`) ^Returns (%) $PTP Returns (`) ^Returns (%) $PTP Returns (`)31-Dec-14 to 31-Dec-15 0.57 10,057.29 1.29 10,128.51 -3.25 9,675.36 -4.06 9,593.9131-Dec-13 to 31-Dec-14 43.43 14,342.60 44.19 14,418.97 32.28 13,228.45 31.39 13,138.8031-Dec-12 to 31-Dec-13 3.03 10,302.83 N.A. N.A. 5.87 10,587.34 6.76 10,675.52Since Inception 11-Nov-05 to 31-Dec-15 16.15 45,640.00 N.A. N.A. 11.88 31,234.96 11.86 31,178.66Since Inception 02-Jan-13 to 31-Dec-15 N.A. N.A. 14.23 14,894.30 10.08 13,333.85 9.88 13,258.83
PRINCIPAL SMART EQUITY FUND
Performance Scheme Returns Scheme’s Benchmark Additional BenchmarkPlan - Regular Plan - Direct (Crisil Balanced Fund Index) (Nifty 50 Index)
Date ^Returns (%) $PTP Returns (`) ^Returns (%) $PTP Returns (`) ^Returns (%) $PTP Returns (`) ^Returns (%) $PTP Returns (`)31-Dec-14 to 31-Dec-15 3.40 10,339.51 4.32 10,431.61 0.48 10,047.93 -4.06 9,593.9131-Dec-13 to 31-Dec-14 34.11 13,410.60 35.06 13,505.75 25.34 12,534.46 31.39 13,138.8031-Dec-12 to 31-Dec-13 5.41 10,541.01 N.A. N.A. 6.05 10,604.69 6.76 10,675.52Since Inception 16-Dec-10 to 31-Dec-15 10.77 16,750.00 N.A. N.A. 7.14 14,162.34 5.91 13,358.02Since Inception 02-Jan-13 to 31-Dec-15 N.A. N.A. 13.90 14,767.64 9.75 13,214.20 9.88 13,258.83
PRINCIPAL GLOBAL OPPORTUNITIES FUND
Performance Scheme Returns Scheme’s Benchmark Additional BenchmarkPlan - Regular Plan - Direct (MSCI World Index) (Nifty 50 Index)
Date ^Returns (%) $PTP Returns (`) ^Returns (%) $PTP Returns (`) ^Returns (%) $PTP Returns (`) ^Returns (%) $PTP Returns (`)31-Dec-14 to 31-Dec-15 -9.65 9,035.17 -9.24 9,075.81 1.89 10,188.59 -4.06 9,593.9131-Dec-13 to 31-Dec-14 -2.62 9,737.94 -2.22 9,778.23 5.21 10,520.55 31.39 13,138.8031-Dec-12 to 31-Dec-13 5.39 10,539.24 N.A. N.A. 40.10 14,010.16 6.76 10,675.52Since Inception 29-Mar-04 to 31-Dec-15 6.09 20,054.10 N.A. N.A. 7.63 23,739.07 13.66 45,097.19Since Inception 02-Jan-13 to 31-Dec-15 N.A. N.A. -2.51 9,267.85 14.08 14,837.00 9.88 13,258.83
Past performance may or may not be sustained in future. Since Inception Returns (in %) are calculated on Compounded Annualised Basis.$ PTP (Point to Point) Returns is based on standard investment of ` 10,000/- made at the beginning of relevant period.Performance of the dividend option for the investors would be net of dividend distribution tax, as applicable. ^ Growth Option
PRINCIPAL INDEX FUND - NIFTY
Performance Scheme Returns Scheme’s Benchmark Additional BenchmarkPlan - Regular Plan - Direct (Nifty 50 Index) (S&P BSE Sensex)
Date ^Returns (%) $PTP Returns (`) ^Returns (%) $PTP Returns (`) ^Returns (%) $PTP Returns (`) ^Returns (%) $PTP Returns (`)31-Dec-14 to 31-Dec-15 -3.88 9,612.27 -3.40 9,660.35 -4.06 9,593.91 -5.03 9,497.4931-Dec-13 to 31-Dec-14 31.15 13,115.21 31.81 13,180.88 31.39 13,138.80 29.89 12,989.3931-Dec-12 to 31-Dec-13 7.71 10,771.15 N.A. N.A. 6.76 10,675.52 8.98 10,897.72Since Inception 27-Jul-99 to 31-Dec-15 10.89 54,716.70 N.A. N.A. 11.59 60,666.11 11.15 56,860.95Since Inception 02-Jan-13 to 31-Dec-15 N.A. N.A. 10.72 13,566.82 9.88 13,258.83 9.85 13,248.06
PRINCIPAL PERSONAL TAX SAVER FUND
Performance Scheme Returns Scheme’s Benchmark Additional BenchmarkPlan - Regular Plan - Direct (S&P BSE 100 Index) (Nifty 50 Index)
Date ^Returns (%) $PTP Returns (`) ^Returns (%) $PTP Returns (`) ^Returns (%) $PTP Returns (`) ^Returns (%) $PTP Returns (`)31-Dec-14 to 31-Dec-15 0.72 10,071.52 1.37 10,136.84 -3.25 9,675.36 -4.06 9,593.9131-Dec-13 to 31-Dec-14 43.58 14,357.97 44.34 14,434.16 32.28 13,228.45 31.39 13,138.8031-Dec-12 to 31-Dec-13 3.32 10,332.18 N.A. N.A. 5.87 10,587.34 6.76 10,675.52Since Inception 31-Mar-96 to 31-Dec-15 21.19 4,46,363.10 N.A. N.A. 11.77 90,116.18 11.14 80,649.04Since Inception 02-Jan-13 to 31-Dec-15 N.A. N.A. 14.38 14,952.71 10.08 13,333.85 9.88 13,258.83
PRINCIPAL INDEX FUND - MIDCAP
Performance ^Returns (%)Date Plan - Regular Plan - Direct Scheme’s Benchmark Additional Benchmark
(Nifty Midcap 100 Index) (Nifty 50 Index)31-Dec-14 to 31-Dec-15 6.51 7.04 6.46 -4.06Since Inception 12-May-14 to 31-Dec-15 26.81 27.46 27.03 7.91

INVEST KNOWHOW December 201530
SCHEMES MANAGED BY BEKXY KURIAKOSE
PRINCIPAL GOVERNMENT SECURITIES FUND
Performance Scheme Returns Scheme’s Benchmark Additional BenchmarkPlan - Regular Plan - Direct (I-Sec Composite Index) (CRISIL 10 Year Gilt Index)
Date ^Returns (%) $PTP Returns (`) ^Returns (%) $PTP Returns (`) ^Returns (%) $PTP Returns (`) ^Returns (%) $PTP Returns (`)
31-Dec-14 to 31-Dec-15 6.63 10,663.32 7.15 10,715.09 8.37 10,837.27 7.39 10,738.84
31-Dec-13 to 31-Dec-14 15.65 11,564.70 16.23 11,622.67 15.12 11,511.76 14.14 11,414.28
31-Dec-12 to 31-Dec-13 2.30 10,230.09 N.A. N.A. 4.12 10,411.73 -0.68 9,932.21
Since Inception 23-Aug-01 to 31-Dec-15 7.68 28,928.20 N.A. N.A. Not Available Not Available N.A. N.A.
Since Inception 02-Jan-13 to 31-Dec-15 N.A. N.A. 8.41 12,734.08 8.95 12,927.09 6.65 12,124.73
PRINCIPAL DEBT OPPORTUNITIES FUND - CORPORATE BOND PLAN
Performance Scheme Returns Scheme’s Benchmark Additional BenchmarkPlan - Regular Plan - Direct (Crisil Liquid Fund Index) (CRISIL 1 Year T-Bill Index)
Date ^Returns (%) $PTP Returns (`) ^Returns (%) $PTP Returns (`) ^Returns (%) $PTP Returns (`) ^Returns (%) $PTP Returns (`)
31-Dec-14 to 31-Dec-15 9.20 10,919.90 9.37 10,936.67 8.23 10,823.41 8.22 10,822.31
31-Dec-13 to 31-Dec-14 9.70 10,970.47 10.29 11,029.03 9.21 10,921.45 8.56 10,855.81
31-Dec-12 to 31-Dec-13 7.03 10,702.64 N.A. N.A. 9.03 10,903.13 5.86 10,586.45
Since Inception 14-Sep-04 to 31-Dec-15 7.62 22,939.99 N.A. N.A. 7.15 21,830.47 6.00 19,315.70
Since Inception 02-Jan-13 to 31-Dec-15 N.A. N.A. 8.99 12,940.86 8.83 12,883.03 7.51 12,421.15
PRINCIPAL DYNAMIC BOND FUND
Performance Scheme Returns Scheme’s Benchmark Additional BenchmarkPlan - Regular Plan - Direct (Crisil Composite Bond Fund Index) (CRISIL 10 Year Gilt Index)
Date ^Returns (%) $PTP Returns (`) ^Returns (%) $PTP Returns (`) ^Returns (%) $PTP Returns (`) ^Returns (%) $PTP Returns (`)
31-Dec-14 to 31-Dec-15 6.84 10,683.69 7.60 10,760.01 8.63 10,863.18 7.39 10,738.84
31-Dec-13 to 31-Dec-14 13.43 11,343.36 14.33 11,432.53 14.31 11,430.70 14.14 11,414.28
31-Dec-12 to 31-Dec-13 4.06 10,405.70 N.A. N.A. 3.79 10,378.55 -0.68 9,932.21
Since Inception 09-May-03 to 31-Dec-15 7.48 24,913.30 N.A. N.A. 6.37 21,849.07 5.57 19,862.98
Since Inception 02-Jan-13 to 31-Dec-15 N.A. N.A. 8.72 12,843.32 8.73 12,849.13 6.65 12,124.73
Returns (As on December 31, 2015)
Past performance may or may not be sustained in future. Since Inception Returns (in %) are calculated on Compounded Annualised Basis.$ PTP (Point to Point) Returns is based on standard investment of ` 10,000/- made at the beginning of relevant period.Performance of the dividend option for the investors would be net of dividend distribution tax, as applicable.^ Growth Option
SCHEMES MANAGED BY MR. DHIMANT SHAH
PRINCIPAL EMERGING BLUECHIP FUND
Performance Scheme Returns Scheme’s Benchmark Additional BenchmarkPlan - Regular Plan - Direct (Nifty Midcap 100 Index) (Nifty 50 Index)
Date ^Returns (%) $PTP Returns (`) ^Returns (%) $PTP Returns (`) ^Returns (%) $PTP Returns (`) ^Returns (%) $PTP Returns (`)
31-Dec-14 to 31-Dec-15 6.00 10,600.34 7.03 10,702.61 6.46 10,645.95 -4.06 9,593.91
31-Dec-13 to 31-Dec-14 80.18 18,017.84 81.31 18,130.71 55.91 15,590.86 31.39 13,138.80
31-Dec-12 to 31-Dec-13 5.84 10,584.24 N.A. N.A. -5.10 9,489.95 6.76 10,675.52
Since Inception 12-Nov-08 to 31-Dec-15 30.95 68,510.00 N.A. N.A. 19.93 36,589.01 15.46 27,897.10
Since Inception 02-Jan-13 to 31-Dec-15 N.A. N.A. 26.74 20,333.72 15.80 15,517.02 9.88 13,258.83
PRINCIPAL DIVIDEND YIELD FUND
Performance Scheme Returns Scheme’s Benchmark Additional BenchmarkPlan - Regular Plan - Direct (Nifty Dividend Opportunities 50 Index) (Nifty 50 Index)
Date ^Returns (%) $PTP Returns (`) ^Returns (%) $PTP Returns (`) ^Returns (%) $PTP Returns (`) ^Returns (%) $PTP Returns (`)
31-Dec-14 to 31-Dec-15 -3.39 9,661.11 -2.78 9,722.45 -11.32 8,868.25 -4.06 9,593.91
31-Dec-13 to 31-Dec-14 44.93 14,492.75 45.62 14,561.82 33.57 13,356.74 31.39 13,138.80
31-Dec-12 to 31-Dec-13 -5.30 9,470.07 N.A. N.A. -7.18 9,281.94 6.76 10,675.52
Since Inception 15-Oct-04 to 31-Dec-15 11.75 34,780.00 N.A. N.A. Not Available Not Available 14.18 44,269.36
Since Inception 02-Jan-13 to 31-Dec-15 N.A. N.A. 9.87 13,255.90 2.65 10,815.07 9.88 13,258.83

INVEST KNOWHOW December 201531
Returns (As on December 31, 2015)
SCHEMES MANAGED BY MR. P.V.K. MOHAN
SCHEMES MANAGED BY MR. GURVINDER SINGH WASAN
PRINCIPAL GROWTH FUND
Performance Scheme Returns Scheme’s Benchmark Additional BenchmarkPlan - Regular Plan - Direct (S&P BSE 200 Index) (Nifty 50 Index)
Date ^Returns (%) $PTP Returns (`) ^Returns (%) $PTP Returns (`) ^Returns (%) $PTP Returns (`) ^Returns (%) $PTP Returns (`)
31-Dec-14 to 31-Dec-15 2.76 10,275.66 3.47 10,346.73 -1.48 9,852.45 -4.06 9,593.91
31-Dec-13 to 31-Dec-14 49.36 14,935.92 50.22 15,022.30 35.47 13,546.66 31.39 13,138.80
31-Dec-12 to 31-Dec-13 8.31 10,831.16 N.A. N.A. 4.38 10,438.05 6.76 10,675.52
Since Inception 25-Oct-00 to 31-Dec-15 16.04 95,800.00 N.A. N.A. 14.93 82,796.31 13.35 67,120.11
Since Inception 02-Jan-13 to 31-Dec-15 N.A. N.A. 18.53 16,637.68 11.12 13,711.04 9.88 13,258.83
PRINCIPAL TAX SAVINGS FUND
Performance Scheme Returns Scheme’s Benchmark Additional BenchmarkPlan - Regular Plan - Direct (S&P BSE 200 Index) (Nifty 50 Index)
Date ^Returns (%) $PTP Returns (`) ^Returns (%) $PTP Returns (`) ^Returns (%) $PTP Returns (`) ^Returns (%) $PTP Returns (`)
31-Dec-14 to 31-Dec-15 2.70 10,269.60 3.27 10,326.74 -1.48 9,852.45 -4.06 9,593.91
31-Dec-13 to 31-Dec-14 49.45 14,944.62 50.07 15,007.02 35.47 13,546.66 31.39 13,138.80
31-Dec-12 to 31-Dec-13 8.55 10,854.65 N.A. N.A. 4.38 10,438.05 6.76 10,675.52
Since Inception 31-Mar-96 to 31-Dec-15 16.74 2,13,180.80 N.A. N.A. 12.23 97,785.47 11.14 80,649.04
Since Inception 02-Jan-13 to 31-Dec-15 N.A. N.A. 18.49 16,619.18 11.12 13,711.04 9.88 13,258.83
PRINCIPAL BALANCED FUND
Performance Scheme Returns Scheme’s Benchmark Additional BenchmarkPlan - Regular Plan - Direct (Crisil Balanced Fund Index) (Nifty 50 Index)
Date ^Returns (%) $PTP Returns (`) ^Returns (%) $PTP Returns (`) ^Returns (%) $PTP Returns (`) ^Returns (%) $PTP Returns (`)
31-Dec-14 to 31-Dec-15 3.05 10,305.24 3.84 10,383.70 0.48 10,047.93 -4.06 9,593.91
31-Dec-13 to 31-Dec-14 34.94 13,494.27 36.06 13,605.63 25.34 12,534.46 31.39 13,138.80
31-Dec-12 to 31-Dec-13 7.22 10,722.43 N.A. N.A. 6.05 10,604.69 6.76 10,675.52
Since Inception 14-Jan-00 to 31-Dec-15 10.74 50,980.00 N.A. N.A. Not Available Not Available 10.46 48,968.42
Since Inception 02-Jan-13 to 31-Dec-15 N.A. N.A. 14.72 15,086.66 9.75 13,214.20 9.88 13,258.83
PRINCIPAL BANK CD FUND
Performance Scheme Returns Scheme’s Benchmark Additional BenchmarkPlan - Regular Plan - Direct (CRISIL Liquid Fund Index) (CRISIL 1 Year T-Bill Index)
Date ^Returns (%) $PTP Returns (`) ^Returns (%) $PTP Returns (`) ^Returns (%) $PTP Returns (`) ^Returns (%) $PTP Returns (`)
31-Dec-14 to 31-Dec-15 8.54 10,854.09 8.93 10,893.23 8.23 10,823.41 8.22 10,822.31
31-Dec-13 to 31-Dec-14 8.86 10,885.56 9.49 10,949.36 9.21 10,921.45 8.56 10,855.81
31-Dec-12 to 31-Dec-13 9.07 10,907.23 N.A. N.A. 9.03 10,903.13 5.86 10,586.45
Since Inception 06-Nov-07 to 31-Dec-15 8.18 18,992.50 N.A. N.A. 7.67 18,272.96 6.37 16,548.15
Since Inception 02-Jan-13 to 31-Dec-15 N.A. N.A. 9.25 13,033.23 8.83 12,883.03 7.51 12,421.15
PRINCIPAL INCOME FUND - SHORT TERM PLAN
Performance Scheme Returns Scheme’s Benchmark Additional BenchmarkPlan - Regular Plan - Direct (CRISIL Short-Term Bond Fund Index) (CRISIL 10 Year Gilt Index)
Date ^Returns (%) $PTP Returns (`) ^Returns (%) $PTP Returns (`) ^Returns (%) $PTP Returns (`) ^Returns (%) $PTP Returns (`)
31-Dec-14 to 31-Dec-15 8.08 10,808.42 8.89 10,888.53 8.66 10,865.57 7.39 10,738.84
31-Dec-13 to 31-Dec-14 9.87 10,987.07 10.65 11,065.36 10.47 11,046.80 14.14 11,414.28
31-Dec-12 to 31-Dec-13 7.83 10,782.90 N.A. N.A. 8.27 10,827.20 -0.68 9,932.21
Since Inception 09-May-03 to 31-Dec-15 7.80 25,865.10 N.A. N.A. 7.06 23,721.08 5.57 19,862.98
Since Inception 02-Jan-13 to 31-Dec-15 N.A. N.A. 9.31 13,054.76 9.12 12,985.80 6.65 12,124.73
Past performance may or may not be sustained in future. Since Inception Returns (in %) are calculated on Compounded Annualised Basis.$ PTP (Point to Point) Returns is based on standard investment of ` 10,000/- made at the beginning of relevant period.Performance of the dividend option for the investors would be net of dividend distribution tax, as applicable.^ Growth Option

INVEST KNOWHOW December 201532
Returns (As on December 31, 2015)
SCHEMES MANAGED BY MR. PANKAJ JAIN
PRINCIPAL DEBT OPPORTUNITIES FUND - CONSERVATIVE PLAN
Performance Scheme Returns Scheme’s Benchmark Additional BenchmarkPlan - Regular Plan - Direct (CRISIL Liquid Fund Index) (CRISIL 1 Year T-Bill Index)
Date ^Returns (%) $PTP Returns (`) ^Returns (%) $PTP Returns (`) ^Returns (%) $PTP Returns (`) ^Returns (%) $PTP Returns (`)
31-Dec-14 to 31-Dec-15 8.18 10,817.80 9.19 10,918.57 8.23 10,823.41 8.22 10,822.31
31-Dec-13 to 31-Dec-14 8.39 10,839.44 9.37 10,937.33 9.21 10,921.45 8.56 10,855.81
31-Dec-12 to 31-Dec-13 8.98 10,898.32 N.A. N.A. 9.03 10,903.13 5.86 10,586.45
Since Inception 14-Sep-04 to 31-Dec-15 7.77 23,302.52 N.A. N.A. 7.15 21,830.47 6.00 19,315.70
Since Inception 02-Jan-13 to 31-Dec-15 N.A. N.A. 9.33 13,060.59 8.83 12,883.03 7.51 12,421.15
PRINCIPAL DEBT SAVINGS FUND - MONTHLY INCOME PLAN
Performance Scheme Returns Scheme’s Benchmark Additional BenchmarkPlan - Regular Plan - Direct (Crisil MIP Blended Index) (Crisil 10 year Gilt Index)
Date ^Returns (%) $PTP Returns (`) ^Returns (%) $PTP Returns (`) ^Returns (%) $PTP Returns (`) ^Returns (%) $PTP Returns (`)
31-Dec-14 to 31-Dec-15 3.55 10,355.15 4.30 10,429.51 6.79 10,679.00 7.39 10,738.84
31-Dec-13 to 31-Dec-14 12.80 11,280.42 13.65 11,365.17 16.83 11,682.80 14.14 11,414.28
31-Dec-12 to 31-Dec-13 1.24 10,123.90 N.A. N.A. 4.41 10,441.40 -0.68 9,932.21
Since Inception 23-May-02 to 31-Dec-15 8.01 28,548.10 N.A. N.A. 8.61 30,793.66 6.61 23,905.19
Since Inception 02-Jan-13 to 31-Dec-15 N.A. N.A. 6.37 12,032.22 9.06 12,964.88 6.65 12,124.73
PRINCIPAL DEBT SAVINGS FUND - RETAIL PLAN
Performance Scheme Returns Scheme’s Benchmark Additional BenchmarkPlan - Regular Plan - Direct (CRISIL Short-Term Bond Fund Index) (CRISIL 10 Year Gilt Index)
Date ^Returns (%) $PTP Returns (`) ^Returns (%) $PTP Returns (`) ^Returns (%) $PTP Returns (`) ^Returns (%) $PTP Returns (`)
31-Dec-14 to 31-Dec-15 7.52 10,752.18 8.33 10,832.97 8.66 10,865.57 7.39 10,738.84
31-Dec-13 to 31-Dec-14 9.40 10,939.83 10.22 11,022.20 10.47 11,046.80 14.14 11,414.28
31-Dec-12 to 31-Dec-13 6.11 10,610.65 N.A. N.A. 8.27 10,827.20 -0.68 9,932.21
Since Inception 30-Dec-03 to 31-Dec-15 8.18 25,706.10 N.A. N.A. 7.13 22,861.04 5.09 18,156.53
Since Inception 02-Jan-13 to 31-Dec-15 N.A. N.A. 8.45 12,750.21 9.12 12,985.80 6.65 12,124.73
PRINCIPAL CASH MANAGEMENT FUND
Performance Scheme Returns Scheme’s Benchmark Additional BenchmarkPlan - Regular Plan - Direct (CRISIL Liquid Fund Index) (CRISIL 1 Year T-Bill Index)
Date ^Returns (%) $PTP Returns (`) ^Returns (%) $PTP Returns (`) ^Returns (%) $PTP Returns (`) ^Returns (%) $PTP Returns (`)
31-Dec-14 to 31-Dec-15 8.43 10,842.51 8.50 10,850.09 8.23 10,823.41 8.22 10,822.31
31-Dec-13 to 31-Dec-14 9.07 10,907.45 9.16 10,916.29 9.21 10,921.45 8.56 10,855.81
31-Dec-12 to 31-Dec-13 9.17 10,917.45 N.A. N.A. 9.03 10,903.13 5.86 10,586.45
Since Inception 30-Aug-04 to 31-Dec-15 7.65 23,068.78 N.A. N.A. 7.14 21,863.86 5.98 19,331.57
Since Inception 01-Jan-13 to 31-Dec-15 N.A. N.A. 8.98 12,941.41 8.83 12,885.86 7.53 12,432.12
PRINCIPAL RETAIL MONEY MANAGER FUND
Performance Scheme Returns Scheme’s Benchmark Additional BenchmarkPlan - Regular Plan - Direct (CRISIL Liquid Fund Index) (CRISIL 1 Year T-Bill Index)
Date ^Returns (%) $PTP Returns (`) ^Returns (%) $PTP Returns (`) ^Returns (%) $PTP Returns (`) ^Returns (%) $PTP Returns (`)
31-Dec-14 to 31-Dec-15 8.82 10,882.38 8.90 10,890.01 8.23 10,823.41 8.22 10,822.31
31-Dec-13 to 31-Dec-14 9.44 10,944.39 9.55 10,955.16 9.21 10,921.45 8.56 10,855.81
31-Dec-12 to 31-Dec-13 9.78 10,978.23 N.A. N.A. 9.03 10,903.13 5.86 10,586.45
Since Inception 28-Dec-07 to 31-Dec-15 6.70 16,811.01 N.A. N.A. 7.68 18,099.17 6.42 16,470.81
Since Inception 01-Jan-13 to 31-Dec-15 N.A. N.A. 9.45 13,107.48 8.83 12,885.86 7.53 12,432.12
Past performance may or may not be sustained in future. Since Inception Returns (in %) are calculated on Compounded Annualised Basis.$ PTP (Point to Point) Returns is based on standard investment of ` 10,000/- made at the beginning of relevant period.Performance of the dividend option for the investors would be net of dividend distribution tax, as applicable.^ Growth Option

INVEST KNOWHOW December 201533
Systematic Investment Plan (SIP) Returns (As on December 31, 2015)
Returns shown above are for Regular Plan - Growth option. Past performance may or may not be sustained in the future.
PRINCIPAL INDEX FUND - NIFTY - GROWTH
Particulars Total Scheme’s Returns Scheme’s Benchmark Additional BenchmarkAmount (Nifty 50 Index) (S&P BSE Sensex)Invested Returns Yield MarketValue Returns Yield* MarketValue Returns Yield* MarketValue
(in `̀̀̀̀) (%) (in `̀̀̀̀) (%) (in `̀̀̀̀) (%) (in `̀̀̀̀)
1 Year SIP 120,000.00 -8.27 114,579.39 -8.43 114,473.53 -9.17 113,979.56
3 Years SIP 360,000.00 8.59 409,762.47 8.47 409,008.96 7.60 403,790.23
5 Years SIP 600,000.00 9.83 768,397.19 9.67 765,213.64 9.22 756,857.58
7 Years SIP 840,000.00 9.95 1,197,204.82 9.86 1,193,012.54 9.57 1,180,713.91
10 Years SIP 1,200,000.00 8.88 1,898,865.45 9.12 1,923,572.94 8.79 1,890,183.83
Since Inception SIP 1,970,000.00 12.35 5,970,930.18 13.16 6,450,962.15 13.38 6,590,539.22
Inception Date - July 27, 1999
SCHEMES MANAGED BY MR. RAJAT JAIN
PRINCIPAL INDEX FUND - MIDCAP - GROWTH
Particulars Total Amount Scheme’s Returns Scheme’s Benchmark Additional BenchmarkInvested (Nifty Midcap 100 Index) (Nifty 50 Index)
(in `̀̀̀̀) Returns Yield (%) MarketValue (in `̀̀̀̀) Returns Yield* (%) MarketValue (in `̀̀̀̀) Returns Yield* (%) MarketValue (in `̀̀̀̀)
1 Year SIP 120,000.00 3.78 122,431.95 3.57 122,295.80 -8.43 114,473.53
Since Inception SIP 190,000.00 9.65 205,305.64 9.65 205,300.41 -3.26 184,859.91
Inception Date - May 12, 2014
PRINCIPAL EMERGING BLUECHIP FUND - GROWTH
Particulars Total Scheme’s Returns Scheme’s Benchmark Additional BenchmarkAmount (Nifty Midcap 100 Index) (Nifty 50 Index)Invested Returns Yield MarketValue Returns Yield* MarketValue Returns Yield* MarketValue
(in `̀̀̀̀) (%) (in `̀̀̀̀) (%) (in `̀̀̀̀) (%) (in `̀̀̀̀)
1 Year SIP 120,000.00 0.62 120,399.54 3.57 122,295.80 -8.43 114,473.53
3 Years SIP 360,000.00 30.67 558,129.64 22.61 500,451.14 8.47 409,008.96
5 Years SIP 600,000.00 26.58 1,156,291.14 17.49 928,211.79 9.67 765,213.64
7 Years SIP 840,000.00 23.42 1,934,250.78 15.67 1,468,159.09 9.86 1,193,012.54
Since Inception SIP 850,000.00 23.76 2,002,966.92 15.91 1,509,249.45 10.09 1,222,630.97
Inception Date - November 12, 2008
PRINCIPAL DIVIDEND YIELD FUND - GROWTH
Particulars Total Scheme’s Returns Scheme’s Benchmark Additional BenchmarkAmount (Nifty Dividend Opportunities 50 Index) (Nifty 50 Index)Invested Returns Yield MarketValue Returns Yield* MarketValue Returns Yield* MarketValue
(in `̀̀̀̀) (%) (in `̀̀̀̀) (%) (in `̀̀̀̀) (%) (in `̀̀̀̀)
1 Year SIP 120,000.00 -3.77 117,546.73 -8.83 114,204.00 -8.43 114,473.53
3 Years SIP 360,000.00 12.92 436,448.94 3.78 381,373.39 8.47 409,008.96
5 Years SIP 600,000.00 11.99 810,792.19 5.54 690,092.92 9.67 765,213.64
7 Years SIP 840,000.00 12.14 1,294,284.05 8.84 1,150,311.93 9.86 1,193,012.54
10 Years SIP 1,200,000.00 10.49 2,067,440.84 8.59 1,870,229.94 9.12 1,923,572.94
Since Inception SIP 1,340,000.00 10.51 2,475,522.33 8.06 2,138,287.94 10.25 2,436,242.04
Inception Date - October 15, 2004
SCHEMES MANAGED BY MR. DHIMANT SHAH

INVEST KNOWHOW December 201534
Systematic Investment Plan (SIP) Returns (As on December 31, 2015)
PRINCIPAL TAX SAVINGS FUND
Particulars Total Scheme’s Returns Scheme’s Benchmark Additional BenchmarkAmount (S&P BSE 200 Index) (Nifty 50 Index)Invested Returns Yield MarketValue Returns Yield* MarketValue Returns Yield* MarketValue
(in `̀̀̀̀) (%) (in `̀̀̀̀) (%) (in `̀̀̀̀) (%) (in `̀̀̀̀)
1 Year SIP 120,000.00 0.73 120,471.43 -5.92 116,133.99 -8.43 114,473.53
3 Years SIP 360,000.00 20.00 482,614.72 11.40 426,945.64 8.47 409,008.96
5 Years SIP 600,000.00 19.03 963,846.94 11.37 798,289.35 9.67 765,213.64
7 Years SIP 840,000.00 16.47 1,510,512.70 11.05 1,244,910.67 9.86 1,193,012.54
10 Years SIP 1,200,000.00 12.23 2,268,097.39 9.83 1,996,489.39 9.12 1,923,496.66
Since Inception SIP 2,370,000.00 18.07 18,548,021.98 13.84 11,090,140.21 12.64 9,594,776.60
Inception Date - March 31, 1996
PRINCIPAL BALANCED FUND - GROWTH
Particulars Total Scheme’s Returns Scheme’s Benchmark Additional BenchmarkAmount (Crisil Balanced Fund Index) (Nifty 50 Index)Invested Returns Yield MarketValue Returns Yield* MarketValue Returns Yield* MarketValue
(in `̀̀̀̀) (%) (in `̀̀̀̀) (%) (in `̀̀̀̀) (%) (in `̀̀̀̀)
1 Year SIP 120,000.00 1.25 120,808.58 -2.79 118,183.94 -8.43 114,473.53
3 Years SIP 360,000.00 14.91 449,136.49 9.13 412,980.30 8.47 409,008.96
5 Years SIP 600,000.00 14.53 863,185.93 9.73 766,458.47 9.67 765,213.64
7 Years SIP 840,000.00 13.07 1,338,065.64 9.62 1,182,987.22 9.86 1,193,012.54
10 Years SIP 1,200,000.00 11.30 2,158,857.52 9.20 1,931,151.83 9.12 1,923,572.94
Since Inception SIP 1,910,000.00 13.75 6,344,248.79 11.40 5,109,983.12 13.33 6,104,506.85
Inception Date - January 14, 2000
PRINCIPAL GROWTH FUND - GROWTH
Particulars Total Scheme’s Returns Scheme’s Benchmark Additional BenchmarkAmount (S&P BSE 200 Index) (Nifty 50 Index)Invested Returns Yield MarketValue Returns Yield* MarketValue Returns Yield* MarketValue
(in `̀̀̀̀) (%) (in `̀̀̀̀) (%) (in `̀̀̀̀) (%) (in `̀̀̀̀)
1 Year SIP 120,000.00 0.73 120,473.66 -5.92 116,133.99 -8.43 114,473.53
3 Years SIP 360,000.00 19.97 482,446.29 11.40 426,945.64 8.47 409,008.96
5 Years SIP 600,000.00 18.86 959,707.84 11.37 798,289.35 9.67 765,213.64
7 Years SIP 840,000.00 16.26 1,499,199.57 11.05 1,244,910.67 9.86 1,193,012.54
10 Years SIP 1,200,000.00 11.91 2,229,403.42 9.83 1,996,513.71 9.12 1,923,501.43
Since Inception SIP 1,820,000.00 15.97 6,895,721.27 14.83 6,237,729.01 13.61 5,604,475.63
Inception Date - October 25, 2000
SCHEMES MANAGED BY MR. P.V.K. MOHAN
Returns shown above are for Regular Plan - Growth option. Past performance may or may not be sustained in the future.

INVEST KNOWHOW December 201535
Systematic Investment Plan (SIP) Returns (As on December 31, 2015)
Returns shown above are for Regular Plan - Growth option.
Past performance may or may not be sustained in the future.
The returns shown above are calculated using XIRR approach assuming investment of ̀ 10,000/- on the 1st business day of every month. XIRR helps in calculating return on investments given an initialand final value and a series of cash inflows and outflows with the correct allowance for the time impact of the transactions. Load is not taken into consideration for computation of performance.
For performance of all schemes, Investors are advised to refer ‘Returns’ section on page 28-31.
Disclaimer: The above investment simulation is for illustrative purposes only and should not be construed as a promise on minimum returns and safeguard of capital. The AMC / Mutual Fundis not guaranteeing or promising or forecasting any returns. SIP does not assure a profit or guarantee protection against a loss in a declining market.
PRINCIPAL SMART EQUITY FUND - GROWTH
Particulars Total Scheme’s Returns Scheme’s Benchmark Additional BenchmarkAmount (Crisil Balanced Fund Index) (Nifty 50 Index)Invested Returns Yield MarketValue Returns Yield* MarketValue Returns Yield* MarketValue
(in `̀̀̀̀) (%) (in `̀̀̀̀) (%) (in `̀̀̀̀) (%) (in `̀̀̀̀)
1 Year SIP 120,000.00 1.23 120,792.09 -2.79 118,183.94 -8.43 114,473.53
3 Years SIP 360,000.00 14.15 444,278.36 9.13 412,980.30 8.47 409,008.96
5 Years SIP 600,000.00 13.89 849,805.28 9.73 766,458.47 9.67 765,213.64
Since Inception SIP 600,000.00 13.89 849,805.28 9.73 766,458.47 9.67 765,213.64
Inception Date - December 16, 2010
PRINCIPAL PERSONAL TAX SAVER FUND
Particulars Total Scheme’s Returns Scheme’s Benchmark Additional BenchmarkAmount (S&P BSE 100 Index) (Nifty 50 Index)Invested Returns Yield MarketValue Returns Yield* MarketValue Returns Yield* MarketValue
(in `̀̀̀̀) (%) (in `̀̀̀̀) (%) (in `̀̀̀̀) (%) (in `̀̀̀̀)
1 Year SIP 120,000.00 -3.41 117,782.92 -7.65 114,987.11 -8.43 114,473.53
3 Years SIP 360,000.00 15.22 451,133.10 9.32 414,186.66 8.47 409,008.96
5 Years SIP 600,000.00 14.24 857,044.47 10.20 775,522.90 9.67 765,213.64
7 Years SIP 840,000.00 13.12 1,340,515.90 10.23 1,208,939.67 9.86 1,193,012.54
10 Years SIP 1,200,000.00 11.01 2,125,145.85 9.31 1,942,233.74 9.12 1,923,145.43
Since Inception SIP 2,360,000.00 19.53 21,959,981.21 13.43 10,453,071.33 12.62 9,489,156.90
Inception Date - March 31, 1996
SCHEMES MANAGED BY MR. ANUPAM TIWARI
PRINCIPAL LARGE CAP FUND - GROWTH
Particulars Total Scheme’s Returns Scheme’s Benchmark Additional BenchmarkAmount (S&P BSE 100 Index) (Nifty 50 Index)Invested Returns Yield MarketValue Returns Yield* MarketValue Returns Yield* MarketValue
(in `̀̀̀̀) (%) (in `̀̀̀̀) (%) (in `̀̀̀̀) (%) (in `̀̀̀̀)
1 Year SIP 120,000.00 -3.54 117,695.11 -7.65 114,987.11 -8.43 114,473.53
3 Years SIP 360,000.00 15.03 449,911.02 9.32 414,186.66 8.47 409,008.96
5 Years SIP 600,000.00 14.17 855,579.82 10.20 775,522.90 9.67 765,213.64
7 Years SIP 840,000.00 13.97 1,381,867.52 10.23 1,208,939.67 9.86 1,193,012.54
10 Years SIP 1,200,000.00 12.96 2,357,691.17 9.31 1,942,739.03 9.12 1,923,572.94
Since Inception SIP 1,210,000.00 13.01 2,399,295.54 9.36 1,972,243.34 9.18 1,953,014.97
Inception Date - November 11, 2005

INVEST KNOWHOW December 201536
Short Term Capital Long Term Capital Dividend Tax on Distributed TDS onGains Tax (STCG)2 Gains Tax (LTCG)2 Income Income Capital Gains7
Financial Year 2014-15 2015-16 2014-15 2015-16 2014-15 2015-16 2014-15 2015-16 2014-15 2015-16
Resident Individual / 15% 15% Nil Nil Exempt Exempt Nil Nil Nil NilHUF / AOP / BOI
Resident 15% 15% Nil Nil Exempt Exempt Nil Nil Nil NilPartnership Firms
Domestic 15% 15% Nil Nil Exempt Exempt Nil Nil Nil NilCompanies
NRIs4 15% 15% Nil Nil Exempt Exempt Nil Nil STCG - 15%2 STCG - 15%2
LTCG - Nil LTCG - Nil
FPIs4 & 10 15% 15% Nil Nil Exempt Exempt Nil Nil STCG - Nil 6 STCG - Nil 6
LTCG - Nil 6 LTCG - Nil 6
Short Term Long Term Dividend Tax on Distributed Tax on Distributed TDS onCapital Gains Capital Gains Income Income - Other than Income - Liquid / Capital Gains7
Tax 2 & 13 Tax 2 & 13 Liquid / Money Money MarketMarket Schemes Schemes
2014-15 2015-16 2014-15 2015-16 2014-15 2015-16 2014-1511&12 2015-1611&12 2014-1511&12 2015-1611&12 2014-15 2015-16
Resident As per As per 20% 20% Exempt Exempt 25% 25% 25% 25% Nil NilIndividual / slab rates slab rates (With Indexation) (With Indexation)HUF Option to tax
@10%Without Indexation
(if transferredbetween
1-4-2014 to10-7-2014)
AOP/BOI As per As per 20% 20% Exempt Exempt 30% 30% 30% 30% Nil Nil slab rates slab rates (With Indexation) (With Indexation)
Option to tax@10%
Without Indexation(if transferred
between1-4-2014 to10-7-2014)
Domestic 30% 30% 20% 20% Exempt Exempt 30% 30% 30% 30% Nil NilCompanies / (With Indexation) (With Indexation)Firms Option to tax
@10%Without Indexation
(if transferredbetween
1-4-2014 to10-7-2014)
NRIs4 As per As per Listed Units - Listed Units - Exempt Exempt 25% 25% 25% 25% STCG - 30%2 STCG - 30%2
slab rates slab rates 20% 20% LTCG - 20%2 LTCG - 20%2
(with Indexation) (with Indexation) 5% for IDFs 5% for IDFs with indexation with indexationOption to tax for listed units. for listed units.
@10% Unlisted 10%2 10%2
Without Indexation Units - 10% without indexation without indexation(if transferred (without Indexation)5 for unlisted units5 for unlisted units5
between1-4-2014 to10-7-2014)Unlisted
Units - 10%(without Indexation)5
FPI 4 & 10 30% 30% 10% 10% Exempt Exempt 30% 30% 30% 30% STCG - Nil6 STCG - Nil6without Indexation without Indexation LTCG - Nil6 LTCG - Nil6
5% for IDFs 5% for IDFs
EQUITY ORIENTED FUNDS (SUBJECT TO STT3)
OTHER THAN EQUITY ORIENTED FUNDS (including Infrastructure Debt Funds8)
(Contd. on next page)
Tax Rates for Mutual Fund Investors1
as per the proposed Finance Act, 2015 – SNAPSHOT
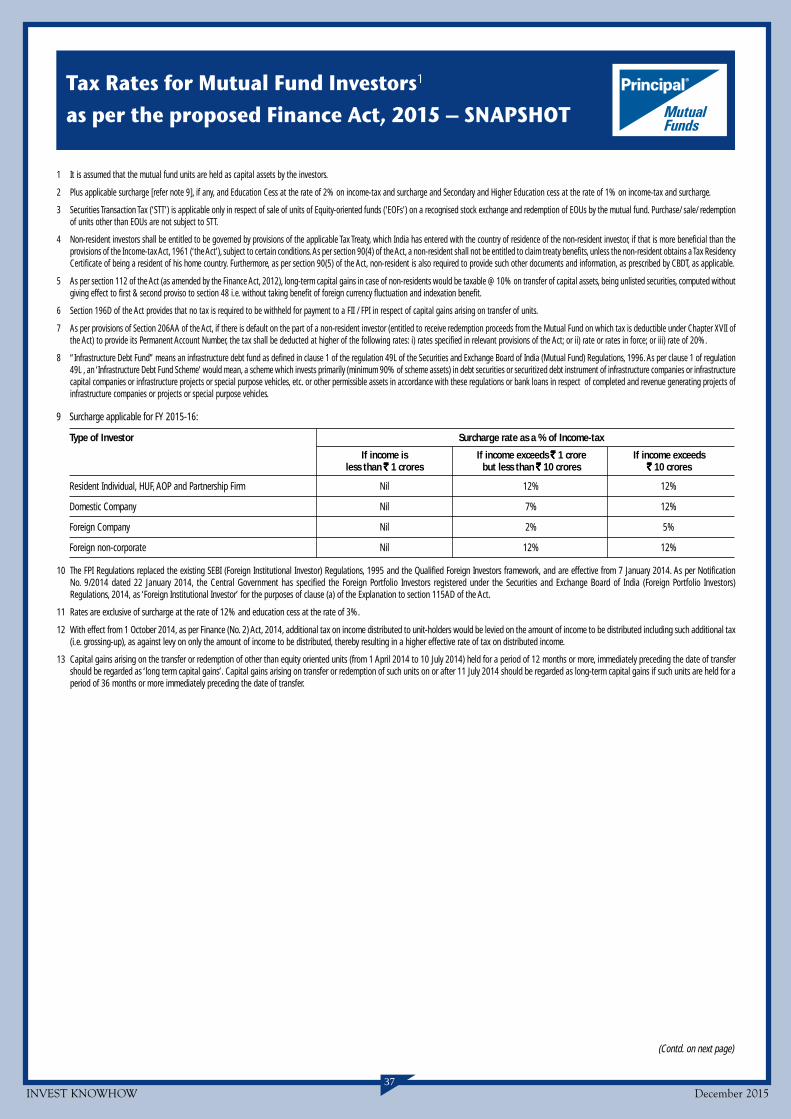
INVEST KNOWHOW December 201537
Tax Rates for Mutual Fund Investors1
as per the proposed Finance Act, 2015 – SNAPSHOT
1 It is assumed that the mutual fund units are held as capital assets by the investors.
2 Plus applicable surcharge [refer note 9], if any, and Education Cess at the rate of 2% on income-tax and surcharge and Secondary and Higher Education cess at the rate of 1% on income-tax and surcharge.
3 Securities Transaction Tax (‘STT’) is applicable only in respect of sale of units of Equity-oriented funds ('EOFs') on a recognised stock exchange and redemption of EOUs by the mutual fund. Purchase/ sale/ redemptionof units other than EOUs are not subject to STT.
4 Non-resident investors shall be entitled to be governed by provisions of the applicable Tax Treaty, which India has entered with the country of residence of the non-resident investor, if that is more beneficial than theprovisions of the Income-tax Act, 1961 (‘the Act’), subject to certain conditions. As per section 90(4) of the Act, a non-resident shall not be entitled to claim treaty benefits, unless the non-resident obtains a Tax ResidencyCertificate of being a resident of his home country. Furthermore, as per section 90(5) of the Act, non-resident is also required to provide such other documents and information, as prescribed by CBDT, as applicable.
5 As per section 112 of the Act (as amended by the Finance Act, 2012), long-term capital gains in case of non-residents would be taxable @ 10% on transfer of capital assets, being unlisted securities, computed withoutgiving effect to first & second proviso to section 48 i.e. without taking benefit of foreign currency fluctuation and indexation benefit.
6 Section 196D of the Act provides that no tax is required to be withheld for payment to a FII / FPI in respect of capital gains arising on transfer of units.
7 As per provisions of Section 206AA of the Act, if there is default on the part of a non-resident investor (entitled to receive redemption proceeds from the Mutual Fund on which tax is deductible under Chapter XVII ofthe Act) to provide its Permanent Account Number, the tax shall be deducted at higher of the following rates: i) rates specified in relevant provisions of the Act; or ii) rate or rates in force; or iii) rate of 20%.
8 “Infrastructure Debt Fund” means an infrastructure debt fund as defined in clause 1 of the regulation 49L of the Securities and Exchange Board of India (Mutual Fund) Regulations, 1996. As per clause 1 of regulation49L , an ‘Infrastructure Debt Fund Scheme’ would mean, a scheme which invests primarily (minimum 90% of scheme assets) in debt securities or securitized debt instrument of infrastructure companies or infrastructurecapital companies or infrastructure projects or special purpose vehicles, etc. or other permissible assets in accordance with these regulations or bank loans in respect of completed and revenue generating projects ofinfrastructure companies or projects or special purpose vehicles.
(Contd. on next page)
9 Surcharge applicable for FY 2015-16:
Type of Investor Surcharge rate as a % of Income-tax
If income is If income exceeds `̀̀̀̀ 1 crore If income exceedsless than `̀̀̀̀ 1 crores but less than `̀̀̀̀ 10 crores `̀̀̀̀ 10 crores
Resident Individual, HUF, AOP and Partnership Firm Nil 12% 12%
Domestic Company Nil 7% 12%
Foreign Company Nil 2% 5%
Foreign non-corporate Nil 12% 12%
10 The FPI Regulations replaced the existing SEBI (Foreign Institutional Investor) Regulations, 1995 and the Qualified Foreign Investors framework, and are effective from 7 January 2014. As per NotificationNo. 9/2014 dated 22 January 2014, the Central Government has specified the Foreign Portfolio Investors registered under the Securities and Exchange Board of India (Foreign Portfolio Investors)Regulations, 2014, as ‘Foreign Institutional Investor’ for the purposes of clause (a) of the Explanation to section 115AD of the Act.
11 Rates are exclusive of surcharge at the rate of 12% and education cess at the rate of 3%.
12 With effect from 1 October 2014, as per Finance (No. 2) Act, 2014, additional tax on income distributed to unit-holders would be levied on the amount of income to be distributed including such additional tax(i.e. grossing-up), as against levy on only the amount of income to be distributed, thereby resulting in a higher effective rate of tax on distributed income.
13 Capital gains arising on the transfer or redemption of other than equity oriented units (from 1 April 2014 to 10 July 2014) held for a period of 12 months or more, immediately preceding the date of transfershould be regarded as ‘long term capital gains’. Capital gains arising on transfer or redemption of such units on or after 11 July 2014 should be regarded as long-term capital gains if such units are held for aperiod of 36 months or more immediately preceding the date of transfer.

38
This information is being provided for basic guidance for investments in mutual funds and is based on provisions of the Income-tax Act, 1961, as proposed by the FinanceAct, 2015. The tax implications may vary for each assessee based on the details of his income. All rates and figures appearing are for illustrative purposes only. Tax benefitsare subject to change in tax laws. Contents of this note have been drawn for informative purpose only and the same should not be used or considered as an investment/tax advice.The AMC/Trustee/Sponsor accepts no liability whatsoever for any direct or consequential loss arising from any information provided in this note.
INVEST KNOWHOW December 2015
SECURITIES TRANSACTION TAX
Equity Oriented Fund
STT on sale of a unit of equity oriented mutual fund to the mutual fund is levied at 0.001%.
No STT is chargeable on purchase of units of an equity oriented mutual fund entered into in recognised stock exchange.
STT on sale of a unit of an equity oriented mutual fund where the transaction is entered into in recognized stock exchange and the contract for sale is settled by theactual delivery is levied at 0.001%.
Other than Equity Oriented Fund: Purchase/ sale/ redemption of units other than equity-oriented units shall not be subject to STT.
Mutual Fund would also pay securities transaction tax wherever applicable on the securities bought/sold.
As per Section 94(7): The loss due to sale of Units in the schemes (where income distributed on MF units is tax free) will not be available for set-off to the extent of thetax free income distributed; if units are: (A) Bought within three months prior to the record date fixed for income distribution; and (B) sold within nine months after therecord date fixed for income distribution.As per Section 94(8): The loss due to sale of original Units in the schemes, where bonus Units are issued, will not be available for setoff; if original units are :- (A) Boughtwithin three months prior to the record date fixed for allotment of bonus units; and (B) sold within nine months after the record date fixed for allotment of bonus units.However, the amount of loss so ignored shall be deemed to be the cost of purchase or acquisition of such unsold bonus units held on the date of transfer of original units.
INCOME TAX RATES FOR INDIVIDUAL / HUF / AOP / BOI for AY 2016-17Total Income Tax Rates (c)
Up to ` 250,000 (a)(b)(d) NIL
` 250,001 to ` 500,000 10%
` 500,001 to ` 1,000,000 20%
` 1,000,001 and above 30%
(a) In the case of a resident individual of the age of 60 years or more but less than 80 years, the basic exemption limit is ` 300,000.(b) In the case of a resident individual of the age of 80 years or more, the basic exemption limit is ` 5,00,000.(c) Plus, surcharge on income-tax, as applicable and education cess is applicable at the rate of 2% on income-tax and secondary and higher education cess at the rate
of 1% on income-tax(d) Rebate of upto ` 2,000 available for resident individuals whose total income does not exceed ` 5,00,000.
Tax Rates for Mutual Fund Investors1
as per the proposed Finance Act, 2015 – SNAPSHOT

INVEST KNOWHOW December 201539
DISCLAIMER:Mutual Fund investments are subject to market risks, read all scheme related documents carefully.This factsheet is for informative purpose only and under no circumstances is to be used or considered as an investment advice. Terms of issue / load structure/Scheme specific risk factors are set forth in the Scheme Information Document(SID). Copy of the same is available at all our Investor Service Centres.Alternatively, Investor can download the SID from our website - www.principalindia.com or can call us at 1800 425 5600 to get a copy of the same.
++ ICRA has assigned credit risk rating of [ICRA]A1+mfs to Principal Cash Management Fund and Principal Debt Opportunities Fund - Conservative Plan. The rating is the highest-credit-qualityshort-term rating assigned by ICRA to debt funds. Rating methodology used by ICRA is based on evaluating the inherent credit quality of the mutual funds portfolio. As a measure of the credit qualityof a debt fund’s assets, ICRA uses the concept of “credit scores”, based on ICRA’s assessment of credit risk associated with each exposure of the portfolio taking into account its maturity. To quantifythe credit risk scores, ICRA uses its database of historical default rates for various rating categories for various maturity buckets. The credit risk ratings incorporate ICRA’s assessment of a debt fund'spublished investment objectives and policies, its management characteristics, and the creditworthiness of its investment portfolio. ICRA reviews relevant fund information on an ongoing basis tosupport its published rating opinions. If the portfolio credit score meets the benchmark of the assigned rating during the review, the rating is retained. In an event that the benchmark credit scoreis breached, ICRA gives a month's time to the debt fund manager to bring the portfolio credit score within the benchmark credit score. If the debt fund manager is able to reduce the portfolio creditscore within the benchmark credit score, the rating is retained. If the portfolio still continues to breach the benchmark credit score, the rating is revised to reflect the change in credit quality. Theratings should, however, not be construed as an indication of the prospective performance of the Mutual fund scheme or of volatility in its returns. ICRA ratings should not be treated asrecommendation to buy, sell or hold the rated debt instruments. ICRA ratings are subject to a process of surveillance which may lead to a revision in ratings. Source: ICRA Ltd.
How to Read Factsheet
FUND MANAGER - An employee of the asset management company such as a mutual fund or life insurer, who manages investments ofthe scheme. He is usually part of a larger team of fund managers and research analysts.
APPLICATION AMOUNT FOR FRESH SUBSCRIPTION - This is the minimum investment amount for a new investor in a mutual fund scheme.
MINIMUM ADDITIONAL AMOUNT - This is the minimum investment amount for an existing investor in a mutual fund scheme.
YIELD TO MATURITY - The Yield to Maturity or the YTM is the rate of return anticipated on a bond if held until maturity. YTM isexpressed as an annual rate. The YTM factors in the bond's current market price, par value, coupon interest rate and time to maturity.
SIP - SIP or systematic investment plan works on the principle of making periodic investments of a fixed sum. It works similar to arecurring bank deposit. For instance, an investor may opt for an SlP that invests ` 500 every 15th of the month in an equity fund for aperiod of three years.
NAV - The NAV or the net asset value is the total asset value per unit of the mutual fund after deducting all related and permissibleexpenses. The NAV is calculated at the end of every business day. It is the value at which the investor enters or exits the mutual fund.
BENCHMARK - A group of securities, usually a market index, whose performance is used as a standard or benchmark to measureinvestment performance of mutual funds, among other investments. Some typical benchmarks include the Nifty, Sensex, BSE200,BSE500, 10-Year G-sec.
ENTRY LOAD - A mutual fund may have a sales charge or load at the time of entry and/or exit to compensate the distributor/agent.Entry load is charged at the time an investor purchases the units of a mutual fund. The entry load is added to the prevailing NAV at thetime of investment. For instance, if the NAV is ` 100 and the entry load is 1%, the investor will enter the fund at ` 101.
Note: SEBI, vide circular dated June 30, 2009 has abolished entry load and mandated that the upfront commission to distributors will be paid by theinvestor directly to the distributor, based on his assessment of various factors including the service rendered by the distributor.
EXIT LOAD - Exit load is charged at the time an investor redeems the units of a mutual fund. The exit load is deducted from the prevailingNAV at the time of redemption. For instance, if the NAV is ` 100 and the exit load is 1%, the redemption price would be ` 99 per unit.
MODIFIED DURATION - Modified duration is the price sensitivity and the percentage change in price for a unit change in yield.
STANDARD DEVIATION - Standard deviation is a statistical measure of the range of an investment’s performance. When a mutual fundhas a high standard deviation, its means its range of performance is wide, implying greater volatility.
SHARPE RATIO - The Sharpe Ratio, named after its founder, the Nobel Laureate William Sharpe, is a measure of risk-adjusted returns.It is calculated using standard deviation and excess return to determine reward per unit of risk.
BETA - Beta is a measure of an investment’s volatility vis-a-vis the market. Beta of less than 1 means that the security will be lessvolatile than the market. A beta of greater than 1 implies that the security's price will be more volatile than the market.
AUM - AUM or assets under management refers to the recent / updated cumulative market value of investments managed by a mutualfund or any investment firm.
HOLDINGS - The holdings or the portfolio is a mutual fund’s latest or updated reported statement of investments/securities. These areusually displayed in terms of percentage to net assets or the rupee value or both. The objective is to give investors an idea of wheretheir money is being invested by the fund manager.
NATURE OF SCHEME - The investment objective and underlying investments determine the nature of the mutual fund scheme. Forinstance, a mutual fund that aims at generating capital appreciation by investing in stock markets is an equity fund or growth fund.Likewise, a mutual fund that aims at capital preservation by investing in debt markets is a debt fund or income fund. Each of thesecategories may have sub-categories.
RATING PROFILE - Mutual funds invest in securities after evaluating their creditworthiness as disclosed by the ratings. A depiction of themutual fund in various investments based on their ratings becomes the rating profile of the fund. Typically, this is a feature of debt funds.
MAAUM - Monthly Average Asset Under Management

Offices of AMC Identified as Official Point of Acceptance (OPA) / Investor Service Centres (ISC)Principal Pnb Asset Management Company Private Limited - OPA & ISC:
• Mumbai: Exchange Plaza, ‘B’ wing, Ground Floor, NSE Building, Bandra Kurla Complex, Bandra (East), Mumbai-400 051
Principal Pnb Asset Management Company Private Limited - ISC:
• Ahmedabad: 102, Megha House, Opp. Kotak Mahindra Bank, Mithakhali Law Garden Road, Ahmedabad-380 006 • Bengaluru: Salarpuria Landmark,2nd Floor, Unit No. 2002, 100 Feet Road, HAL II Stage, Bengaluru-560 038 • Chandigarh: SCO No. 145-146, 1st Floor, Sector 9-C, Chandigarh-160 009• Chennai: Nirupama & Neelima Building, New Unit No.55, Vijaya Raghava Road, T. Nagar, Chennai-600 017 • Hyderabad: ANR Center, Unit No. 201,1st Floor, Road No.1, Banjara Hills, Hyderabad - 500 034 • Jaipur: 61-A, Vasanti, Sardar Patel Marg, C-Scheme, Jaipur-302 001 • Kolkata: BachhawatHouse, Premises No.2, Dr. Martin Luther King Sarani, (Formerly Upper Wood Street), Kolkata-700 016 • Lucknow: Rohtas Trident, 1st Floor, 10, RanaPratap Marg, Lucknow-226 001 • New Delhi: Unit No. 001 & 002, Gr. Floor, DLF Capitol Point, Baba Kharag Singh Marg, New Delhi-110 001• Pune: Unit No: 103 & 104, 1st Floor, Rainbow Plaza, Opp. Modern Highschool, Jangali Maharaj Road, Shivaji Nagar, Pune - 411 005.
Name, Address and Website of Registrar:Karvy Computershare Pvt. Ltd. (Unit: Principal Mutual Fund),
Karvy Registry House, #8-2-596, Avenue 4, Street No. 1, Banjara hills, Hyderabad-500 034. Website: www.karvycomputershare.com
For any enquiries and / or queries, investors are advised to address a suitable communication to AMC at:
Points of Service (“POS”) of MF UTILITIES INDIA PRIVATE LIMITED (“MFUI”) as Official Point of Acceptance:The Online Transaction Portal of MF Utility is www.mfuonline.com and the list of POS of MFUI is published on the website of MFUI at www.mfuindia.com,as updated from time to time.
Centres of Karvy Computershare Private Limited (R&T to Principal Mutual Fund) which have been identified as Official Point of Acceptance:Agra: 1st Floor, Deepak Wasan Plaza, Behind Holiday Inn, Opp. Megdoot Furnitures, Sanjay Place, Agra-282 002 • Ahmedabad: 201/202 Shail, Opp. Madhusudan House, Navrangpura, Ahmedabad-380 006• Ajmer: 302, 3rd Floor, Ajmer Auto Building, Opp. City Power House, Jaipur Road, Ajmer - 305 001 • Aligarh: 1st Floor, Kumar Plaza, Aligarh-202 001 • Allahabad: RSA Towers, 2nd Floor, Above SonyTV Showroom, 57, S.P. Marg, Civil Lines, Allahabad-211 001 • Amritsar: 72-A, Taylor's Road, Opp. Aga Heritage Club, Amritsar-143 001 • Anand: B-42 Vaibhav Commercial Center, Nr TVS Down TownShow Room, Grid Char Rasta, Anand-380 001 • Asansol: 114/71, G.T. Road, Near Sony Centre, Bhanga Pachil, Asansol-713 303 • Aurangabad: Ramkunj Niwas, Railway Station Road, Near OsmanpuraCircle, Aurangabad-431 005 • Bangalore: 59, Skanda Puttanna Road, Basavanagudi, Bangalore-560 004 • Bankura: Ambika Market Complex, Gr. Floor, Nutanganj, Post & Dist Bankura, Bankura-722 101• Bareilly: 1st Floor, 165, Civil Lines, Opp. Hotel Bareilly Palace, Near Railway Station, Bareilly-243 001 • Belgaum: CTS No. 3939/ A2 A1, Above Raymonds Show Room, Beside Harsha Appliances, ClubRoad, Belgaum-590 001 • Bharuch: Shop No. 147-148, Aditya Complex, Near Kasak Circle, Bharuch-392 001 • Bhatinda: #2047-A 2nd Floor, The Mall Road, Above Max New York Life Insurance, NewDelhi-151 001 • Bhavnagar: Krushna Darshan Complex, Parimal Chowk, Office No. 306-307, 3rd Floor, Above Jed Blue Show Room, Bhavnagar 364 002 • Bhilai: Shop No. 1, First Floor, Plot No.1,Commercial Complex, Nehru Nagar (East), Bhilai-490 020 • Bhopal: Kay Kay Business Centre, 133, Zone I, M.P. Nagar, Above City Bank, Bhopal-462 011 • Bhubaneshwar: A/181 , Back Side of ShivamHonda Show Room, Saheed Nagar, Bhubaneswar-751 007 • Bikaner: 70-71, 2nd Floor, Dr. Chahar Building, Panchsati Circle, Sadul Ganj, Bikaner-334 001 • Bokaro: B-1, 1st Floor, City Centre, Sector-4,Near Sona Chandi Jwellars, Bokaro-827 004 • Burdwan: 63 G.T. Road, Halder Complex 1st Floor, Burdwan-713 101 • Calicut: 2nd Floor, Soubhagya Shopping Complex, Arayidathpalam, Mavoor Road,Calicut-673 004 • Chandigarh: SCO 2423-2424, Sector 22-C, Chandigarh-160 022 • Chennai: F-11, Akshaya Plaza, 1st Floor, 108, Adhithanar Salai, Egmore, Opp. Chief Metropolitan Court, Chennai-600002 • Cochin: Ali Arcade, 1st Floor, Kizhavana Road, Panampilly Nagar, Near Atlantis Junction, Ernakualm-682 036 • Coimbatore: 3rd Floor, Jaya Enclave, 1056/1057 Avinashi Road, Coimbatore-641 018• Cuttack: P.O. - Buxi Bazar, Cuttack, Opp. Dargha Bazar, Dargha Bazar, Cuttack-753 001 • Dehradun: Kaulagarh Road, Near Sirmaur Margabove, Reliance Webworld, Dehradun-248 001 • Dhanbad: 208New Market, 2nd Floor, Bank More, Dhanbad-826 001 • Durgapur: Mwav-16 Bengal Ambuja, 2nd Floor, City Centre, 16 Dt Burdwan, Durgapur-713 216 • Erode: No. 4, Veerappan Traders Complex, KMYSalai, Sathy Road, Opp. Erode Bus Stand, Erode-638 003 • Faridabad: A-2B, 1st Floor, Nehru Groundnit, Faridabad-121 001 • Ghaziabad: 1st Floor, C-7, Lohia Nagar, Ghaziabad-201 001 • Goa: Flat No.1-A, H. No. 13/70, Timotio Bldg. Heliodoro Salgado Road, Next to Navhind Bhavan (Market Area), Panaji, Goa - 403 001 • Gorakhpur: Above V.I.P. Houseajdacent, A.D. Girls College, Bank Road, Gorakpur-273 001 • Gurgaon: Shop No.18, Gr. Floor, Sector-14, Opp. AKD Tower, Near Huda Office, Gurgaon-122 001 • Guwahati: 1st Floor, Bajrangbali Building, Near Bora Service Station, G.S. Road, Guwahati -781 007 • Gwalior: 2nd Floor, Rajeev Plaza, Jayendra Ganj, Lashkar, Gwalior. M.P.-474 009 • Hubli: CTC No. 483 / A1-A2, Gr. Floor, Shri Ram Plaza, Behind Kotak Mahindra Bank, Club Road, Hubli - 580029. • Hyderabad: KARVY CENTRE, 8-2-609/K, Avenue 4, Street No. 1, Banjara Hills, Hyderabad - 500 034. • KARVY SELENIUM, Plot No. 31 & 32, Tower B, Survey No. 115 /22, 115/24 &115/25, FinancialDistrict, Gachibowli, Nanakramguda, Serlingampally Mandal, Ranga Reddy District, Hyderabad - 500 032 • Indore: 2nd Floor, 203-205, Balaji Corporates, Above ICICI Bank, 19/1 New Palasia, Indore-452001 • Jabalpur: Grover Chamber, 43 Naya Bazar Malviya Chowk, Opp. Shyam Market, Jabalpur-482 002 • Jaipur: S-16/A 3rd Floor, Land Mark Building, Opp. Jai Club, Mahaver Marg C-Scheme, Jaipur-302 001 • Jalandhar: 1st Floor, Shanti Towers, SCO No. 37, PUDA Complex, Opp. Tehsil Complex, Jalandhar-144 001 • Jalgaon: 269 Jaee Vishwa, 1st Floor, Above United Bank of India, Baliram Peth, NearKishor Agencies, Jalgaon - 425 001 • Jammu: 5 A/D Extension 2, Near Panama Chowk Petrol Pump, Panama Chowk, Jammu-180 012 • Jamnagar: 136-138, Madhav Palaza, Opp. SBI Bank, Near LalBunglow, Jamnagar-361 001 • Jamshedpur: 2nd Floor, R.R. Square, SB Shop Area, Near Reliance Foot Print & Hotel, BS Park Plaza, Main Road, Bistupur, Jamshedpur-831 001 • Jodhpur: 203, ModiArcade, Chopasni Road, Jodhpur-342 001 • Junagadh: 124-125 Punit Shopping Center, M.G. Road, Ranavav Chowk, Junagadh-362 001 • Kanpur: 15/46, B, Gr. Floor, Opp. Muir Mills, Civil Lines, Kanpur-208 001 • Karnal: 18/369, Char Chaman, Kunjpura Road, Behind Miglani Hospital, Karnal-132 001 • Kolhapur: 605/1/4, E Ward, Shahupuri 2nd Lane, Laxmi Niwas, Near Sultane Chambers, Kolhapur-416001 • Kolkata: 166 A, Rashbihari Avenue, 2nd Floor, Opp. Fortish Hospital, Kolkata-700 029 • Kota: 29, 1st Floor, Near Lala Lajpat Rai Circle, Shopping Centre, Kota-324 007 • Kottayam: 1st FloorCsiascension Square, Railway Station Road, Collectorate P. O., Kottayam-686 002 • Lucknow: 1st Floor, A. A. Complex, Thaper House, 5 Park Road, Hazratganj, Lucknow - 226 001 • Ludhiana: SCO-136,1st Floor, Above Airtel Showroom, Feroze Gandhi Market, Ludhiana-141 001 • Madurai: Rakesh Towers, 30-C, 1st Floor, Bye Pass Road, Opp. Nagappa Motors, Madurai-625 010 • Malda: Sahis Tuli, UnderWard No.6, No.1 Govt Colony, English Bazar Municipality, Malda-732 101 • Mangalore: Mahendra Arcade, Opp. Court Road, Karangal Padi, Mangalore-575 003 • Meerut: 1st Floor, Medi Centre, Opp. ICICIBank, Hapur Road, Near Bachha Park, Meerut-250 002 • Mehsana: Ul-47, Apollo Enclave, Opp. Simandhar Temple, Modhera Cross Road, Mehsana-384 002 • Moradabad: Om Arcade, Parker Road, AboveSyndicate Bank, Chowk Tari Khana, Moradabad-244 001 • Mumbai: 24/B, Raja Bahadur Compound, Ambalal Doshi Marg, Behind BSE Bldg., Fort, Mumbai-400 001 • Mumbai - Borivali: Gr. Floor,Himanshu Bldg., Sodawala Lane, Lina Chandawarkar Road, Borivali, Mumbai-400 091 • Mumbai - Thane: 101, Yashwant Building, Ram Ganesh, Godkari Path, Ram Maruti Road, Naupada, Thane-400 602• Mumbai - Vashi: Shop No. 43-A, Ground Floor, Vashi Plaza Sector-17, Near Apna Bazar, Vashi-400 705 • Muzaffarpur: 1st Floor, Uma Market, Thana Gumtimoti Jheel, Muzaffarpur-842 001 • Mysore:L-350, Silver Tower, Ashoka Road, Opp. Clock Tower, Mysore-570 001 • Nadiad: 104/105, Near Paras Cinema, City Point Nadiad, Nadiad-387 001 • Nagpur: Plot No. 2/1, House No 102/1, MangaldeepAppartment, Mata Mandir Road, Opp. Khandelwal Jewelers, Dharampeth, Nagpur-440 010 • Nasik: S-12,Suyojit Sankul, Sharanpur Road, Near Rajiv Gandhi Bhavan, Nasik-422 002 • Navsari: 1/1 ChinmayAracade, Opp. Sattapir Road, Tower Road, Navsari-396 445 • New Delhi: 305, New Delhi House, 27, Barakhamba Road, New Delhi -110 001 • Noida: 405, 4th Floor, Vishal Chamber, Plot No. 1, Sector-18, Noida - 201 301 • Panipat: 1st Floor, Krishna Tower, Above Amertex, G.T. Road, Panipat-132 103 • Patiala: SCO-27 D, Chotti Baradari, Near Car Bazaar, Patiala-147 001 • Patna: 3-A, 3rd Floor, AnandTower, Exhibition Road, Opp. ICICI Bank, Patna-800 001 • Pondicherry: No. 7, Thiayagaraja Street, Pondicherry-605 001 • Pune: Mozaic Bldg, CTS No.1216/1, Final Plot No. 576/1 TP, Scheme No.1, F. C.Road, Bhamburda, Shivaji Nagar, Pune - 411 004 • Raipur: Shop No. 31 Third Floor, Millenium Plaza Above Indian House, Behind Indian Coffee House, Raipur 492 001 • Rajkot: 104, Siddhi Vinyak Complex,Opp. Ramkrishna Ashram, Dr. Yagnik Road, Rajkot, Rajkot-360 001 • Ranchi: Room No. 307, 3rd Floor, Commerce Tower, Beside Mahabir Tower, Ranchi-834 001 • Rourkela: 1st Floor, Sandhu Complex,Kachery Road, Uditnagar, Rourekla-769 012 • Salem: No. 40, 2nd Floor, Brindavan Road, Fairlands, Near Perumal Koil, Salem-636 016 • Shillong: Annex Mani Bhawan, Lower Thana Road, Near R K M LpSchool, Shillong-793 001 • Shimla: Triveni Building, By Pas Chowkkhallini, Shimla-171 002 • Siliguri: Nanak Complex, Sevoke Road, Siliguri-734 001 • Surat: G-5, Empire State Buliding, Near UdhnaDarwaja, Ring Road, Surat-395 002 • Tirunelveli: 55/18, Jeney Building, S.N. Road, Near Aravind Eye Hospital, Tirunelveli-627 001 • Trichur: 2nd Floor, Brothers Complex, Naikkanal Junction, ShornurRoad Near Dhanalakshmi Bank H O, Thrissur-680 001 • Trichy: 60, Sri Krishna Arcade, Thennur High Road, Trichy-620 017 • Trivandrum: 2nd Floor, Akshaya Tower, Sasthamangalam, Trivandrum-695 010• Udaipur: 201-202, Madhav Chambers, Opp. GPO, Chetak Circle, Udaipur-313 001 • Vadodara: 203, Corner point, Jetalpur Road, Vadodara - 390 007 • Valsad: Shop No. 2 , Phiroza Corner, Opp. NextShow Room, Tithal Road, Valsad-396 001 • Vapi: Shop No. 12, Ground Floor, Sheetal Appatment, Near K.P. Tower, Vapi-396 195 • Varanasi: D-64/132, 1st Floor, Anant Complex, Sigra, Varanashi-221 010• Vellore: No. 1, M. N. R. Arcade, Officers Line, Krishna Nagar, Vellore-632 001 • Vijayawada: 39-10-7, Opp. Municipal Water Tank, Labbipet, Vijayawada-520 010 • Visakhapatnam: Door No: 48-8-7,Dwaraka Dimond, Gr. Floor, Srinagar, Visakhapatnam - 530 016 • Warangal: 5-6-95, 1st Floor, Opp. B.Ed Collage, Lashkar Bazar, Chandra Complex, Hanmakonda, Warangal-506 001.


![Practicum 5, Spring 2015 Selective pulses: long pw90s ...€¦ · Selective pulses: long pw90s, presaturation and shaped pulses ! ... experiment"![4] ... Figure'18! [1]) ...](https://static.fdocuments.us/doc/165x107/5ac559387f8b9aa0518df036/practicum-5-spring-2015-selective-pulses-long-pw90s-selective-pulses-long.jpg)