
FACTS, TRENDS, M&A & VALUATION METRICS Q1 2020
38
SOFTWARE INDUSTRY REPORT FACTS, TRENDS, M&A & VALUATION METRICS Q1 2020
Transcript of FACTS, TRENDS, M&A & VALUATION METRICS Q1 2020

SOFTWARE INDUSTRY REPORT
FACTS, TRENDS, M&A & VALUATION METRICS
Q1 2020

Agenda
1. Introduction & Executive Summary Page 3
2. Software Market Page 5
3. Valuation and M&A activity Page 10
4. Introduction to IMAP and relevant expertise Page 33

Introduction and Executive Summary
3
Welcome to IMAP Germany‘s Software Industry Report
June 2020
▪ IMAP Germany is pleased to present the Software Industry Report Q1 2020. This report provides commentary and analysis on current market trends, valuation developments as well as M&A dynamics within the Software and IT Services sector in Q1 2020
▪ With each publication, we will highlight key trends and developments in different vertical subsectors
▪ For the analysis of valuation developments, we will focus on the following sub-verticals within the Software and IT Services Industry:
▪ Infrastructure and Cloud: companies providing hardware, software or services related to running and maintaining infrastructure and cloud environments
▪ Software as a Service: companies following a subscription based business model
▪ Application software: companies providing application software
▪ SW development: companies active in software development, either as service or technology providers
▪ IT service: companies providing a broader spectrum of IT services
▪ Conglomerates: a collection of software and IT companies with a market capitalization in excess of USD100bn
▪ IMAP has advised on more than 200 M&A transactions in the technology space in the past 10 years, comprising Internet Software & Services, IT consulting and services, Software companies, as well as Technology and High Tech companies
▪ In Germany, IMAP advised on eight software/ IT transactions within the last two years
▪ The global software market is continuously characterized by high levels of deal activity, though Q1 2020 has seen a two year low in terms of deal activity
▪ While revenue multiples paid in M&A transactions declined compared to the previous quarter, they still remained above their three-year average. EBITDA multiples even increased up to 18.8x which constitutes nearly a three-year high
▪ European deal volume has a lower share of global deal volume compared to the share in terms of deal activity, which indicates smaller transaction volumes on average for European targets. The share of financial buyers is higher in Europe compared with global M&A activity
▪ Valuations of publicly trades companies have experienced a sharp decline following the outbreak of the Covid crisis, analogue to the overall stock market decline.
▪ In the following recovery phase end of Q1 especially companies active in Infrastructure and Software development were able to exceed their last twelfth months stock prices again
▪ Providers of application software remain the highest valued sub-sector with a median revenue multiple for 2020E of 5.6x, followed by Conglomerates and Infrastructure companies with 4.8x and 4.4x respectively
Introduction Executive Summary
Agenda
1. Introduction & Management Summary Page 3
2. Software Market Page 5
3. Valuation and M&A activity Page 10
4. Introduction to IMAP and relevant expertise Page 33

429.9
456.1466.8
487.2
507.0
7%6%
2%
4% 4%
2017 2018 2019 2020E 2021E
Revenue Growth (%)
28%
22%11%
7%
6%
5%
4%4%
13%
Business app. Other custom app.Enterprise vertical app. Information mgmt. app.IT mgmt. tools Database mgmt.Desktop app. SecurityOther
CAGR: 4.2%
World Market
5
Growing global software market with the USA and Europe as a driving force
June 2020Source: CIQ, Statista
Programming language used by SW developers
1.6
2.0
2.9
3.6
4.2
4.8
5.3
9.0
14.7
18.3
Top investors in SW service R&D (in EUR bn)
Language Used LTM Plan to adopt
Javascript 69% 5%
HTML / CSS 61% 2%
SQL 56% 2%
Java 50% 4%
Python 49% 9%
Shell Shell script. 40% 2%
PHP 29% 2%
TypeScript 25% 7%
2%
8%
13%
14%
44%
44%
69%
82%
77%
3%
9%
10%
13%
44%
45%
71%
75%
80%
None
In-cloud Editor or IDE
Code review tool
Static analysis tool
Issue tracker
Continuous Integration (CI)
Lightweight Desktop Editor
Standalone DIE
Source code collaboration tool
2019 2018
Programming tools used by SW developers
Vol.: EUR 6.5 bnCount: 212
Vol.: EUR 0.8 bnCount: 78Vol.: EUR 14.2 bn
Count: 298
Global vol.: EUR 21.4 bnGlobal count: 618
M&A transactions in the software market in Q1 2020 Software market revenue (in EUR bn) IT spending by products (in %)

20.4 21.421.7 22.5
23.3
6%
5%
1%
4% 4%
2017 2018 2019 2020E 2021E
Revenue Growth (%)
23%
20%
18%
17%
12%
10%
Business SW Multimedia/ internet SW
SW components Firmware
Technical SW Other
38%
19%
16%
9%
8%4%
7%
Users of compl. SW packs Commerce
Banking & insurance Engineering & automot.
Civ. Engineer. & architect. Private persons
Other
German Market
6
German software development market
June 2020Source: CIQ, Statista, IbisWorld 1) Distribution of the software producers across federal states2) Number of employees in the IT software industry
10.2%
20.2%
13.8%
19.4%
8.4%
6.1%
<5%≥5%, <10%≥ 10%
Count: 57
Count: 29
Count: 28
Europe vol.: EUR 6.5 bnEurope count: 212
M&A transactions in the software market in Q1 2020 Software market revenue (in EUR bn) IT spending by products (in %)
Number of Software developers in Germany2Software developer heat map1 IT spending by end-markets (in EUR bn)
▪ Germany, a strong IT industry hub:
− 1 million2 out of 24 million software developers worldwide are located in Germany
CAGR: 3.5%

Industry Trends (I/II)
7
Selected industry trends
Infrastructure SaaS Application
Global sales of IaaS in EUR bn Global sales of SaaS in EUR bn Size of the global AR and VR market in EUR bn
Serverless computing may reduce the need for infrastructure software
AI is likely to increase the demand for storage capacity and thus leads to growing IT infrastructure
The demand for agile networks is driven by cloud computing, IoT, AI, etc.
Edge computing: Customers demand fast information processing for a seamless user experience
The shift to SaaS must be supported by robust IT infrastructure
Source: Gartner, Inc., Mc Kinsey & company, Statista
Vertical-specific SaaS applications for target niches are going to be more prevalent
Transition from SaaS to PaaS -from customer acquisition to customer retention
The shift of mobile messaging apps to real platforms may endorse a new trend for mobile SaaS
Blockchain can help SaaS companies to manage security challenges
Businesses require SaaS solutions that have enhanced integration and connection capabilities
Cloud computing facilitates data sharing and encourages the development of new applications
Industrial IT providers will continue to invest in robotic process automation (RPA)
Machine learning is a high priority for businesses globally, driving the demand for skilled AI specialists
Conversational platforms enabling human-like interactions with computer systems become increasingly popular
Augmented Reality has the potential to crossover to the mass consumer and corporate markets
June 2020
2.2 3.1 4.8 6.8 9.2 15.216.4
20.927.5
36.0
46.3
56.8
68.6
8.1 9.7 12.714.920.434.7
43.452.0
72.688.8
107.4123.1
139.9
5.47.7
10.89.7
17.4
2016 2017E 2018E 2019F 2020F

5G is attracting software developers due to presumed higher data security and enhanced VR applications
IoT growth is a major technology trend in 2020 demanding for applications to connect sensors, devices, machines etc.
In the field of software architecture, the trend towards microservice architecture is expected to continue
The demand for appropriate cyber security, particularly in the area of financial services, communication and data storage, is increasing
DARQ
Distributed Ledger Technology (DLT), Artificial Intelligence (AI), Extended Reality (XR) and Quantum Computing
HR: Changed employee skills requiring companies to adapt tech strategies to support a new way of working
Technology-driven interactions allow new ways of identifying and understanding the next generation of customers
Businesses require guidance in the area of IT security, as new technologies create both opportunities and risks
Machine learning, AI, IoT, blockchain, mixed reality
AI, self-driving cars, mobile image recognition applications, customized reality
AI, platform interconnection, Facebook AR/ VR, cryptocurrency and payments (Libra)
AI, autonomous driving, 5G network, cloud computing, edge computing
Cybersecurity, intent-based networking & AI, sourcing skilled employees, 5G, real time data
Industry Trends (II/II)
8
Selected industry trends
Software Development IT Services Conglomerates (Top 5)
Source: Statista, Accenture, CIQ, Welt.de, company information
Global number of software developers in mn Assumptions on the impact of the new techn. Indexed stock performance conglomerates1,2
41%19% 19% 18%
24%
24% 27% 22%
17%
26% 26% 28%
15%28% 25% 29%
AI DLT QuantumComputing
XR
Greatest Imapct Second greatest Imapct
Third greatest Imapct Fourth greatest Imapct
60%
70%
80%
90%
100%
110%
120%
1) Includes all companies grouped as ”Conglomerates”, see pg. 102) Time Period: Q1 2019 – Q1 2020
-5%
June 2020
23 23.9
27.7 28.7
2018 2019 2023E 2024E
Agenda
1. Introduction & Executive Summary Page 3
2. Software Market Page 5
3. Valuation and M&A activity Page 10
4. Introduction to IMAP and relevant expertise Page 33

Public Company Valuation
10
Selected public companies by sub-sector
Σ MCap:XY
∅ EV/Revenue 2020:XY
∅ EV/EBITDA 2020: XY
Infrastructure SaaS Application
Software Development IT Services Conglomerates
June 2020
Σ MCap:EURm 442,842
Median EV/Revenue:1.0x
Median EV/EBITDA:7.9x
Σ MCap:EURm 404,747
Median EV/Revenue:4.2x
Median EV/EBITDA:27.8x
Σ MCap:EURm 225,931
Median EV/Revenue:2.7x
Median EV/EBITDA:11.2x
Σ MCap:EURm 306,927
Median EV/Revenue:4.4x
Median EV/EBITDA:12.8x
Σ MCap:EURm 2,188,889
Median EV/Revenue:5.6x
Median EV/EBITDA:19.7x
Σ MCap:EURm 3,805,680
Median EV/Revenue:4.8x
Median EV/EBITDA:11.7x
1) 2020 Median EV/ Revenue and Median EV/EBITDA figures

Stock Performance
11
+11% -13% -13% +4% -4% -5%LTM Growth
Source: CIQ
Q1 2019 – Q1 2020 indexed stock performance
1) Weighting of shares based on market capitalization June 2020
60%
70%
80%
90%
100%
110%
120%
130%
140%
150%
160%
Date 5/10/2019 6/24/2019 8/6/2019 9/18/2019 10/30/2019 12/12/2019 1/28/2020 3/11/2020
Infrastructure SaaS Application Software Developer IT Services Conglomerates
Segmented, indexed stock performance1

Segment Valuation (I/III)
12
Median segment valuation metrics in 2020E
Source: CIQ June 2020
EV/ Revenue 2020E Revenue growth 2020E
EV/ EBITDA 2020E EBITDA-margin 2020E
4.4x 4.2x
5.6x
2.7x
1.0x
4.8x
Infrastructure &Cloud
SaaS Application SoftwareDeveloper
IT Service Conglomerates
12.8x
27.8x
19.7x
11.2x
7.9x
11.7x
Infrastructure &Cloud
SaaS Application SoftwareDeveloper
IT Service Conglomerates
5%
12%11%
5%4%
9%
Infrastructure &Cloud
SaaS Application SoftwareDeveloper
IT Service Conglomerates
36%
18%
33%
20%
15%
41%
Infrastructure &Cloud
SaaS Application SoftwareDeveloper
IT Service Conglomerates

Segment Valuation (II/III)
13
Development of the median segment valuation metrics between 2020E and 2022E
Source: CIQ June 2020
EV/ Revenue 2020E-2022E Revenue growth 2020E-2022E
EV/ EBITDA 2020E-2022E EBITDA-margin 2020E-2022E
4.6x4.7x
6.7x
2.8x
1.0x
5.0x
4.4x4.2x
5.6x
2.7x
1.0x
4.8x
4.1x4.5x 4.9x
2.5x
0.9x
4.5x
Infrastructure &Cloud
SaaS Application SoftwareDeveloper
IT Service Conglomerates
2020A 2021E 2022E
4%
18%
12%
4%
0%
7%
5%
12%11%
5% 4%
9%
5%
17%
9%7%
5%
10%
Infrastructure &Cloud
SaaS Application SoftwareDeveloper
IT Service Conglomerates
2020A 2021E 2022E
13.4x
38.4x
24.4x
10.9x8.7x
14.3x12.8x
27.8x
19.7x
11.2x7.9x
11.7x11.3x
25.9x
17.4x
10.4x7.3x
10.2x
Infrastructure &Cloud
SaaS Application SoftwareDeveloper
IT Service Conglomerates
2020A 2021E 2022E
36%
14%
30%
18%
14%
41%36%
18%
33%
20%
15%
41%
36%
18%
35%
20%
15%
42%
Infrastructure &Cloud
SaaS Application SoftwareDeveloper
IT Service Conglomerates
2020A 2021E 2022E
2020E 2020E
2020E2020E

Segment Valuation (III/III)
14
Correlation between EV/ 2020E revenue and 2020 revenue growth
Source: CIQ June 2020
Infrastructure Software Developer
SaaS IT Service
Application Conglomerates
AKAM ANETCHKP
CSCOCTXS
FFIVJNPRMCRO SCT
VMW
0.0x
5.0x
10.0x
15.0x
20.0x
-5.0% 0.0% 5.0% 10.0% 15.0%EV/2
02
0E
Rev
enu
e
2020E Revenue Growth
ADBE
BLKB BOX
DOCU
DBX
ENVGWRE
LOGM PFPT
PSTGQADA
CRM
WDAY
ZEN
ZUO
0.0x
5.0x
10.0x
15.0x
20.0x
25.0x
0.0% 5.0% 10.0% 15.0% 20.0% 25.0% 30.0% 35.0%EV/2
02
0E
Rev
enu
e
2020E Revenue Growth
ACN
APPN
GIB.A
CTSH
HCLTECHINFY
NRO0.0x
5.0x
10.0x
15.0x
0.0% 2.0% 4.0% 6.0% 8.0% 10.0% 12.0% 14.0%EV/2
02
0E
Rev
enu
e
2020E Revenue Growth
ADBEANSS
ADP CSU
DSY
HEXA B
INTUMSFT
OTEX
ORCL PEGA
PSANQADA
CRM
SAP
SNPSWDAY
ZEN
0.0x
5.0x
10.0x
15.0x
-5.0% 0.0% 5.0% 10.0% 15.0% 20.0% 25.0% 30.0%
EV/2
02
0E
Rev
enu
e
2020E Revenue Growth
ACN
ADN1
AEIN
ATOBC8 COK
CAPGIB.ACTSH
CCC
D6HDVTDXC IDR
INFY
IBM
9613 SOP
TCS
507685
0.0x
1.0x
2.0x
3.0x
4.0x
5.0x
-5.0% 0.0% 5.0% 10.0% 15.0%
EV/2
02
0E
Rev
enu
e
2020E Revenue Growth
ADBE
GOOG.LCSCOFB
INTCIBM
MSFTORCLCRM
SAP
0.0x
5.0x
10.0x
15.0x
-5.0% 0.0% 5.0% 10.0% 15.0% 20.0% 25.0%EV/2
02
0E
Rev
enu
e
2020E Revenue Growth
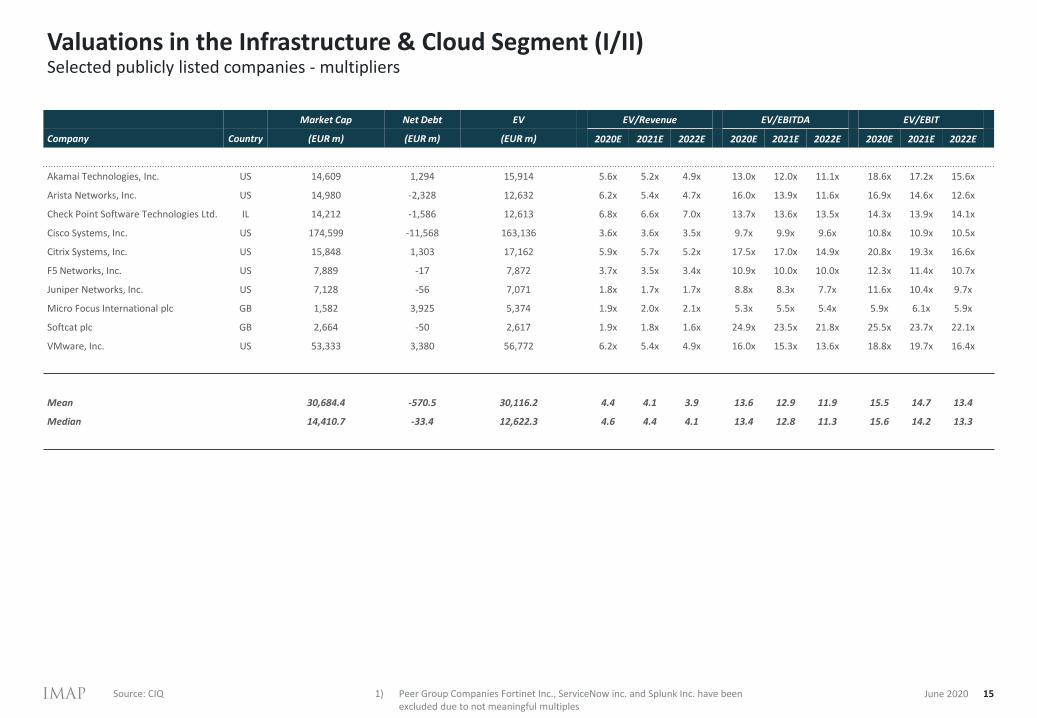
Valuations in the Infrastructure & Cloud Segment (I/II)
15
Selected publicly listed companies - multipliers
Source: CIQ June 2020
Market Cap Net Debt EV EV/Revenue EV/EBITDA EV/EBIT
Company Country (EUR m) (EUR m) (EUR m) 2020E 2021E 2022E 2020E 2021E 2022E 2020E 2021E 2022E
Akamai Technologies, Inc. US 14,609 1,294 15,914 5.6x 5.2x 4.9x 13.0x 12.0x 11.1x 18.6x 17.2x 15.6x
Arista Networks, Inc. US 14,980 -2,328 12,632 6.2x 5.4x 4.7x 16.0x 13.9x 11.6x 16.9x 14.6x 12.6x
Check Point Software Technologies Ltd. IL 14,212 -1,586 12,613 6.8x 6.6x 7.0x 13.7x 13.6x 13.5x 14.3x 13.9x 14.1x
Cisco Systems, Inc. US 174,599 -11,568 163,136 3.6x 3.6x 3.5x 9.7x 9.9x 9.6x 10.8x 10.9x 10.5x
Citrix Systems, Inc. US 15,848 1,303 17,162 5.9x 5.7x 5.2x 17.5x 17.0x 14.9x 20.8x 19.3x 16.6x
F5 Networks, Inc. US 7,889 -17 7,872 3.7x 3.5x 3.4x 10.9x 10.0x 10.0x 12.3x 11.4x 10.7x
Juniper Networks, Inc. US 7,128 -56 7,071 1.8x 1.7x 1.7x 8.8x 8.3x 7.7x 11.6x 10.4x 9.7x
Micro Focus International plc GB 1,582 3,925 5,374 1.9x 2.0x 2.1x 5.3x 5.5x 5.4x 5.9x 6.1x 5.9x
Softcat plc GB 2,664 -50 2,617 1.9x 1.8x 1.6x 24.9x 23.5x 21.8x 25.5x 23.7x 22.1x
VMware, Inc. US 53,333 3,380 56,772 6.2x 5.4x 4.9x 16.0x 15.3x 13.6x 18.8x 19.7x 16.4x
Mean 30,684.4 -570.5 30,116.2 4.4 4.1 3.9 13.6 12.9 11.9 15.5 14.7 13.4
Median 14,410.7 -33.4 12,622.3 4.6 4.4 4.1 13.4 12.8 11.3 15.6 14.2 13.3
1) Peer Group Companies Fortinet Inc., ServiceNow inc. and Splunk Inc. have been excluded due to not meaningful multiples

Valuations in the Infrastructure & Cloud Segment (II/II)
16
Selected publicly listed companies - key figures
Source: CIQ June 2020
Revenue (in EURm) Revenue Growth EBITDA-Margin EBIT-Margin
Company Country 2020E 2021E 2022E 2020E 2021E 2022E 2020E 2021E 2022E 2020E 2021E 2022E
Akamai Technologies, Inc. US 2,850.3 3,038.1 3,241.6 10.5% 6.6% 6.7% 43.0% 43.6% 44.4% 30.0% 30.5% 31.5%
Arista Networks, Inc. US 2,034.2 2,336.4 2,679.5 -5.3% 14.9% 14.7% 38.7% 39.0% 40.6% 36.8% 37.1% 37.6%
Check Point Software Technologies Ltd. IL 1,847.8 1,901.5 1,793.3 4.0% 2.9% -5.7% 49.6% 48.9% 52.0% 47.8% 47.6% 49.8%
Cisco Systems, Inc. US 45,167.8 45,495.0 47,124.0 -3.1% 0.7% 3.6% 37.1% 36.1% 36.0% 33.5% 32.8% 33.1%
Citrix Systems, Inc. US 2,914.5 3,006.6 3,272.7 8.9% 3.2% 8.9% 33.7% 33.5% 35.2% 28.4% 29.5% 31.5%
F5 Networks, Inc. US 2,130.7 2,240.5 2,327.8 4.0% 5.2% 3.9% 33.8% 35.0% 33.7% 30.0% 30.8% 31.6%
Juniper Networks, Inc. US 3,970.1 4,123.5 4,255.3 0.7% 3.9% 3.2% 20.2% 20.8% 21.6% 15.4% 16.5% 17.2%
Micro Focus International plc GB 2,811.3 2,693.8 2,613.3 n.m. n.m. n.m. 35.9% 36.3% 38.3% 32.4% 32.8% 34.7%
Softcat plc GB 1,348.9 1,479.5 1,632.3 7.2% 9.7% 10.3% 7.8% 7.5% 7.3% 7.6% 7.5% 7.2%
VMware, Inc. US 9,128.8 10,449.2 11,693.7 17.7% 14.5% 11.9% 38.9% 35.6% 35.7% 33.0% 27.6% 29.5%
Mean 7,420.4 7,676.4 8,063.4 5.0% 6.8% 6.4% 33.6% 33.3% 34.1% 29.2% 28.9% 29.9%
Median 2,830.8 2,850.2 2,960.6 4.0% 5.2% 6.7% 37.1% 35.6% 35.7% 30.0% 30.5% 31.5%
1) Peer Group Companies Fortinet Inc., ServiceNow inc. and Splunk Inc. have been excluded due to not meaningful multiples

Valuations in the SaaS Segment (I/II)
17
Selected publicly listed companies - multipliers
Source: CIQ June 2020
Market Cap Net Debt EV EV/Revenue EV/EBITDA EV/EBIT
Company Country (EUR m) (EUR m) (EUR m) 2020E 2021E 2022E 2020E 2021E 2022E 2020E 2021E 2022E
Adobe Inc. US 162,697 491 163,193 13.7x 11.8x 10.3x 29.7x 25.3x 21.8x n.m. n.m. n.m.
Blackbaud, Inc. US 2,359 567 2,931 3.6x 3.5x n.a. 18.6x 18.6x n.a. n.m. n.m. n.m.
Box, Inc. US 2,408 207 2,618 4.2x 3.7x 3.4x 50.1x 25.2x 19.5x n.m. n.m. n.m.
DocuSign, Inc. US 20,657 -7 20,650 23.7x 17.9x 14.1x n.m. n.m. n.m. n.m. n.m. n.m.
Dropbox, Inc. US 8,187 -15 8,171 4.7x 4.2x 3.8x 17.7x 14.7x 12.5x n.m. n.m. n.m.
Envestnet, Inc. US 3,357 572 3,932 4.5x 4.1x 3.7x 21.0x 18.2x 16.0x n.m. n.m. n.m.
Guidewire Software, Inc. US 7,216 -567 6,639 10.4x 9.3x 7.9x n.m. n.m. n.m. n.m. n.m. n.m.
LogMeIn, Inc. US 3,800 108 3,909 3.2x 3.0x n.a. 10.6x 9.6x n.a. n.m. n.m. n.m.
Proofpoint, Inc. US 6,001 -119 5,881 6.3x 5.3x 4.5x 44.9x 30.3x 25.3x n.m. n.m. n.m.
Pure Storage, Inc. US 3,606 -633 2,962 2.0x 1.8x 1.6x n.m. n.m. n.m. n.m. n.m. n.m.
QAD Inc. US 728 -94 631 2.3x 2.2x 2.0x 58.4x 50.0x 27.6x n.m. n.m. n.m.
salesforce.com, inc. US 142,380 -1,528 140,825 9.2x 7.4x 6.2x 31.8x 25.3x 21.5x n.m. n.m. n.m.
Workday, Inc. US 32,231 -338 31,887 9.8x 8.1x 6.9x 47.1x 34.6x 29.2x n.m. n.m. n.m.
Zendesk, Inc. US 7,967 118 8,086 8.7x 7.0x 5.6x n.m. n.m. n.m. n.m. n.m. n.m.
Zuora, Inc. US 1,152 -84 1,066 4.3x 3.9x 3.5x n.a. n.m. n.m. n.m. n.m. n.m.
Mean 26,983.1 -88.3 26,892.2 7.4 6.2 5.6 33.0 25.2 21.7 n.m. n.m. n.m.
Median 6,001.3 -15.5 5,881.4 4.7 4.2 4.5 30.8 25.3 21.7 n.m. n.m. n.m.
Note: EV/EBIT multiples have been excluded due to lack of meaningfulness
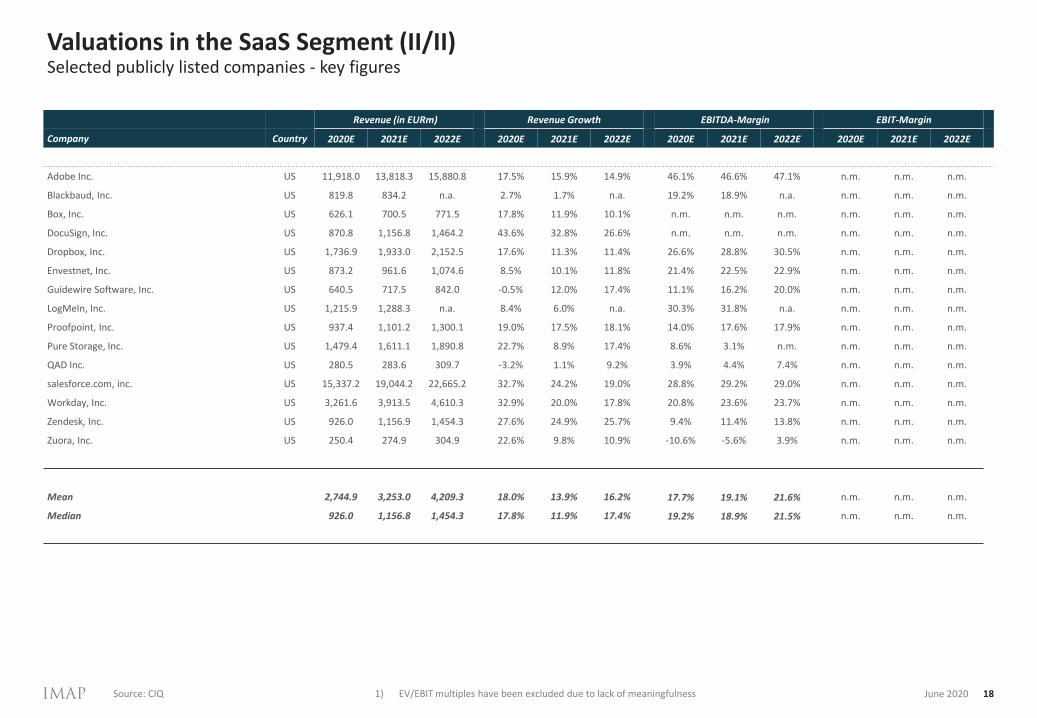
Valuations in the SaaS Segment (II/II)
18
Selected publicly listed companies - key figures
Source: CIQ June 2020
Revenue (in EURm) Revenue Growth EBITDA-Margin EBIT-Margin
Company Country 2020E 2021E 2022E 2020E 2021E 2022E 2020E 2021E 2022E 2020E 2021E 2022E
Adobe Inc. US 11,918.0 13,818.3 15,880.8 17.5% 15.9% 14.9% 46.1% 46.6% 47.1% n.m. n.m. n.m.
Blackbaud, Inc. US 819.8 834.2 n.a. 2.7% 1.7% n.a. 19.2% 18.9% n.a. n.m. n.m. n.m.
Box, Inc. US 626.1 700.5 771.5 17.8% 11.9% 10.1% n.m. n.m. n.m. n.m. n.m. n.m.
DocuSign, Inc. US 870.8 1,156.8 1,464.2 43.6% 32.8% 26.6% n.m. n.m. n.m. n.m. n.m. n.m.
Dropbox, Inc. US 1,736.9 1,933.0 2,152.5 17.6% 11.3% 11.4% 26.6% 28.8% 30.5% n.m. n.m. n.m.
Envestnet, Inc. US 873.2 961.6 1,074.6 8.5% 10.1% 11.8% 21.4% 22.5% 22.9% n.m. n.m. n.m.
Guidewire Software, Inc. US 640.5 717.5 842.0 -0.5% 12.0% 17.4% 11.1% 16.2% 20.0% n.m. n.m. n.m.
LogMeIn, Inc. US 1,215.9 1,288.3 n.a. 8.4% 6.0% n.a. 30.3% 31.8% n.a. n.m. n.m. n.m.
Proofpoint, Inc. US 937.4 1,101.2 1,300.1 19.0% 17.5% 18.1% 14.0% 17.6% 17.9% n.m. n.m. n.m.
Pure Storage, Inc. US 1,479.4 1,611.1 1,890.8 22.7% 8.9% 17.4% 8.6% 3.1% n.m. n.m. n.m. n.m.
QAD Inc. US 280.5 283.6 309.7 -3.2% 1.1% 9.2% 3.9% 4.4% 7.4% n.m. n.m. n.m.
salesforce.com, inc. US 15,337.2 19,044.2 22,665.2 32.7% 24.2% 19.0% 28.8% 29.2% 29.0% n.m. n.m. n.m.
Workday, Inc. US 3,261.6 3,913.5 4,610.3 32.9% 20.0% 17.8% 20.8% 23.6% 23.7% n.m. n.m. n.m.
Zendesk, Inc. US 926.0 1,156.9 1,454.3 27.6% 24.9% 25.7% 9.4% 11.4% 13.8% n.m. n.m. n.m.
Zuora, Inc. US 250.4 274.9 304.9 22.6% 9.8% 10.9% -10.6% -5.6% 3.9% n.m. n.m. n.m.
Mean 2,744.9 3,253.0 4,209.3 18.0% 13.9% 16.2% 17.7% 19.1% 21.6% n.m. n.m. n.m.
Median 926.0 1,156.8 1,454.3 17.8% 11.9% 17.4% 19.2% 18.9% 21.5% n.m. n.m. n.m.
1) EV/EBIT multiples have been excluded due to lack of meaningfulness

Valuations in the Application Software Segment (I/II)
19
Selected publicly listed companies - multipliers
Source: CIQ June 2020
Market Cap Net Debt EV EV/Revenue EV/EBITDA EV/EBIT
Company Country (EUR m) (EUR m) (EUR m) 2020E 2021E 2022E 2020E 2021E 2022E 2020E 2021E 2022E
Adobe Inc. US 162,697 491 163,193 13.7x 11.8x 10.3x 29.7x 25.3x 21.8x 33.3x 28.0x 24.0x
Amadeus IT Group, S.A. ES 18,212 3,031 21,243 6.7x 4.3x 4.0x 24.4x 12.1x 10.3x 69.6x 19.8x 16.3x
ANSYS, Inc. US 20,699 -154 20,544 14.1x 12.7x 11.4x 35.5x 29.6x 26.2x 34.4x 30.1x 26.3x
Automatic Data Processing, Inc. US 53,797 688 54,490 4.1x 4.1x 3.9x 16.5x 16.8x 14.9x 18.6x 18.8x 16.6x
Constellation Software Inc. CA 20,294 206 20,505 5.6x 4.8x 4.2x 21.0x 17.4x 15.4x 33.8x 27.8x n.a.
Dassault Systèmes SE FR 36,830 2,373 39,255 8.6x 7.8x 7.2x 27.4x 23.6x 20.5x 29.1x 25.0x 22.2x
Hexagon AB (publ) SE 16,388 2,054 18,514 5.0x 4.7x 4.4x 16.0x 13.4x 12.6x 22.5x 18.1x 16.7x
Intuit Inc. US 69,460 -1,364 68,073 10.1x 9.2x 8.4x 27.8x 25.0x 22.5x 31.5x 27.4x 24.8x
Microsoft Corporation US 1,286,848 -48,791 1,237,644 9.5x 8.6x 7.7x 20.7x 19.0x 16.8x 25.7x 23.7x 20.8x
Open Text Corporation CA 9,950 2,746 12,721 4.5x 4.2x 4.1x 12.6x 11.1x 10.5x 13.6x 11.5x n.a.
Oracle Corporation US 153,818 25,195 179,839 5.0x 5.0x 4.9x 10.7x 10.7x 10.2x 11.3x 11.2x 10.9x
Pegasystems Inc. US 6,421 28 6,449 6.6x 5.6x 4.7x n.m. n.m. n.a. n.m. n.m. n.a.
PSI Software AG DE 305 -21 284 1.3x 1.2x 1.1x 12.1x 9.3x 8.2x 20.4x 13.6x 11.6x
QAD Inc. US 728 -94 631 2.3x 2.2x 2.0x n.m. n.m. n.m. n.m. n.m. n.m.
salesforce.com, inc. US 142,380 -1,528 140,825 9.2x 7.4x 6.2x 31.8x 25.3x 21.5x 55.3x 41.4x 32.4x
SAP SE DE 127,847 9,475 137,395 4.9x 4.5x 4.2x 13.8x 12.4x 11.3x 16.6x 14.7x 13.0x
Synopsys, Inc. US 22,040 143 22,191 6.7x 6.2x 5.7x 22.3x 19.7x 18.0x 24.9x 21.8x 19.3x
Workday, Inc. US 32,231 -338 31,887 9.8x 8.1x 6.9x 47.1x 34.6x 29.2x n.m. n.m. n.m.
Zendesk, Inc. US 7,967 118 8,086 8.7x 7.0x 5.6x n.m. n.m. n.m. n.m. n.m. n.m.
Mean 115,206.0 -302.3 114,935.2 7.2 6.3 5.6 20.5 17.0 15.9 24.5 18.5 17.0
Median 22,040.2 142.7 22,190.8 6.7 5.6 4.9 20.9 17.1 15.4 23.7 19.3 16.7

Valuations in the Application Software Segment (II/II)
20
Selected publicly listed companies - key figures
Source: CIQ June 2020
Revenue (in EURm) Revenue Growth EBITDA-Margin EBIT-Margin
Company Country 2020E 2021E 2022E 2020E 2021E 2022E 2020E 2021E 2022E 2020E 2021E 2022E
Adobe Inc. US 11,918.0 13,818.3 15,880.8 17.5% 15.9% 14.9% 46.1% 46.6% 47.1% 41.1% 42.1% 42.8%
Amadeus IT Group, S.A. ES 3,189.1 4,920.7 5,371.7 -43.0% 54.3% 9.2% 27.3% 35.8% 38.5% 9.6% 21.8% 24.3%
ANSYS, Inc. US 1,457.5 1,621.0 1,805.2 8.6% 11.2% 11.4% 39.7% 42.9% 43.4% 40.9% 42.1% 43.2%
Automatic Data Processing, Inc. US 13,329.5 13,340.5 14,128.0 7.0% 0.1% 5.9% 24.7% 24.4% 26.0% 22.0% 21.7% 23.3%
Constellation Software Inc. CA 3,656.8 4,301.4 4,830.5 17.6% 17.6% 12.3% 26.7% 27.3% 27.6% 16.6% 17.1% n.a.
Dassault Systèmes SE FR 4,562.9 5,055.8 5,479.0 12.3% 10.8% 8.4% 31.4% 32.9% 34.9% 29.5% 31.1% 32.3%
Hexagon AB (publ) SE 3,667.6 3,976.2 4,186.2 -5.9% 8.4% 5.3% 31.5% 34.6% 35.2% 22.4% 25.7% 26.5%
Intuit Inc. US 6,771.6 7,420.4 8,090.1 11.6% 9.6% 9.0% 36.2% 36.8% 37.4% 32.0% 33.5% 33.9%
Microsoft Corporation US 130,147.3 143,661.3 160,547.4 18.6% 10.4% 11.8% 45.9% 45.3% 46.0% 37.1% 36.4% 37.1%
Open Text Corporation CA 2,834.9 3,059.6 3,091.9 11.8% 7.9% 1.1% 35.5% 37.6% 39.3% 32.9% 36.0% n.a.
Oracle Corporation US 36,286.7 36,165.1 36,757.7 2.9% -0.3% 1.6% 46.5% 46.7% 48.2% 43.8% 44.4% 45.0%
Pegasystems Inc. US 976.4 1,153.1 1,360.4 18.5% 18.1% 18.0% 4.6% 6.3% n.a. -0.3% 3.0% 6.6%
PSI Software AG DE 216.0 240.0 254.4 -1.5% 11.1% 6.0% 10.9% 12.7% 13.7% 6.4% 8.7% 9.7%
QAD Inc. US 280.5 283.6 309.7 -3.2% 1.1% 9.2% 3.9% 4.4% 7.4% 1.7% 1.0% 4.0%
salesforce.com, inc. US 15,337.2 19,044.2 22,665.2 32.7% 24.2% 19.0% 28.8% 29.2% 29.0% 16.6% 17.9% 19.2%
SAP SE DE 28,284.5 30,256.9 32,843.1 2.4% 7.0% 8.5% 35.3% 36.7% 37.1% 29.2% 30.8% 32.2%
Synopsys, Inc. US 3,323.0 3,600.7 3,868.0 10.3% 8.4% 7.4% 30.0% 31.3% 31.9% 26.8% 28.2% 29.7%
Workday, Inc. US 3,261.6 3,913.5 4,610.3 32.9% 20.0% 17.8% 20.8% 23.6% 23.7% 13.2% 14.3% 16.3%
Zendesk, Inc. US 926.0 1,156.9 1,454.3 27.6% 24.9% 25.7% 9.4% 11.4% 13.8% 4.6% 6.7% 10.5%
Mean 14,233.0 15,631.0 17,238.6 9.4% 13.7% 10.7% 28.2% 29.8% 32.2% 22.4% 24.3% 25.7%
Median 3,656.8 4,301.4 4,830.5 11.6% 10.8% 9.2% 30.0% 32.9% 35.1% 22.4% 25.7% 26.5%
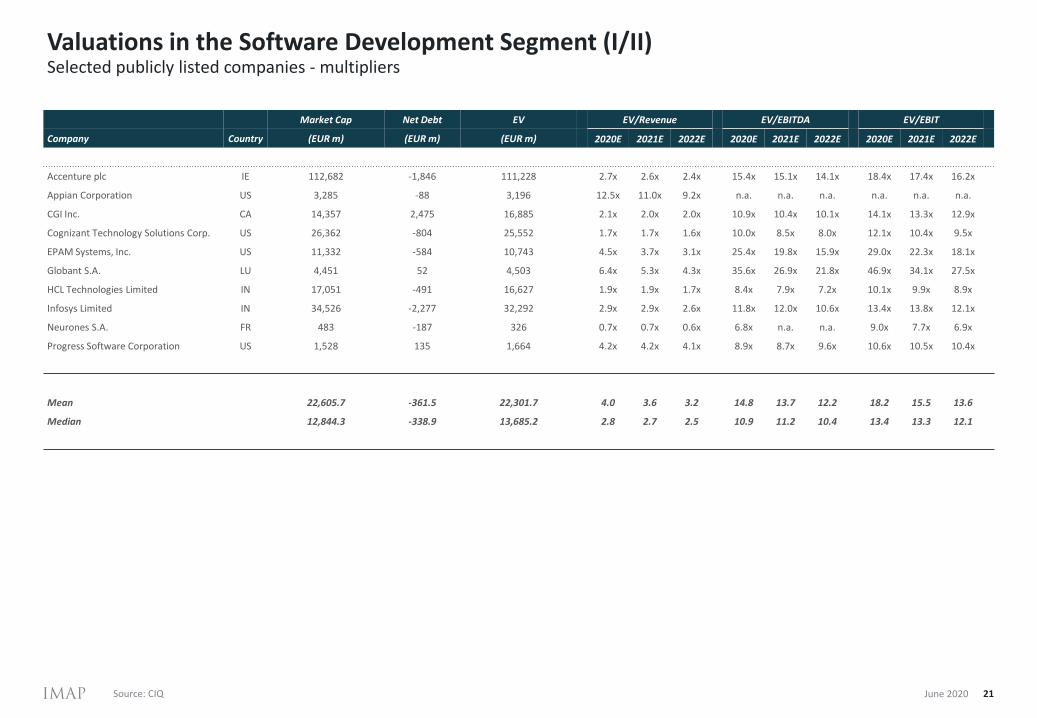
Valuations in the Software Development Segment (I/II)
21
Selected publicly listed companies - multipliers
Source: CIQ June 2020
Market Cap Net Debt EV EV/Revenue EV/EBITDA EV/EBIT
Company Country (EUR m) (EUR m) (EUR m) 2020E 2021E 2022E 2020E 2021E 2022E 2020E 2021E 2022E
Accenture plc IE 112,682 -1,846 111,228 2.7x 2.6x 2.4x 15.4x 15.1x 14.1x 18.4x 17.4x 16.2x
Appian Corporation US 3,285 -88 3,196 12.5x 11.0x 9.2x n.a. n.a. n.a. n.a. n.a. n.a.
CGI Inc. CA 14,357 2,475 16,885 2.1x 2.0x 2.0x 10.9x 10.4x 10.1x 14.1x 13.3x 12.9x
Cognizant Technology Solutions Corp. US 26,362 -804 25,552 1.7x 1.7x 1.6x 10.0x 8.5x 8.0x 12.1x 10.4x 9.5x
EPAM Systems, Inc. US 11,332 -584 10,743 4.5x 3.7x 3.1x 25.4x 19.8x 15.9x 29.0x 22.3x 18.1x
Globant S.A. LU 4,451 52 4,503 6.4x 5.3x 4.3x 35.6x 26.9x 21.8x 46.9x 34.1x 27.5x
HCL Technologies Limited IN 17,051 -491 16,627 1.9x 1.9x 1.7x 8.4x 7.9x 7.2x 10.1x 9.9x 8.9x
Infosys Limited IN 34,526 -2,277 32,292 2.9x 2.9x 2.6x 11.8x 12.0x 10.6x 13.4x 13.8x 12.1x
Neurones S.A. FR 483 -187 326 0.7x 0.7x 0.6x 6.8x n.a. n.a. 9.0x 7.7x 6.9x
Progress Software Corporation US 1,528 135 1,664 4.2x 4.2x 4.1x 8.9x 8.7x 9.6x 10.6x 10.5x 10.4x
Mean 22,605.7 -361.5 22,301.7 4.0 3.6 3.2 14.8 13.7 12.2 18.2 15.5 13.6
Median 12,844.3 -338.9 13,685.2 2.8 2.7 2.5 10.9 11.2 10.4 13.4 13.3 12.1

Valuations in the Software Development Segment (II/II)
22
Selected publicly listed companies - key figures
Source: CIQ June 2020
Revenue (in EURm) Revenue Growth EBITDA-Margin EBIT-Margin
Company Country 2020E 2021E 2022E 2020E 2021E 2022E 2020E 2021E 2022E 2020E 2021E 2022E
Accenture plc IE 40,765.9 42,809.5 45,617.4 3.8% 5.0% 6.6% 17.7% 17.2% 17.3% 14.8% 14.9% 15.1%
Appian Corporation US 256.0 290.4 345.6 8.1% 13.5% 19.0% -14.5% -9.9% -3.8% -17.0% -12.3% -5.8%
CGI Inc. CA 7,938.3 8,293.9 8,497.8 -5.6% 4.5% 2.5% 19.4% 19.6% 19.7% 15.1% 15.2% 15.4%
Cognizant Technology Solutions Corp. US 14,781.0 15,475.8 16,320.1 -0.8% 4.7% 5.5% 17.3% 19.3% 19.7% 14.3% 15.8% 16.4%
EPAM Systems, Inc. US 2,362.7 2,895.2 3,493.4 16.3% 22.5% 20.7% 17.9% 18.7% 19.3% 15.7% 16.6% 17.0%
Globant S.A. LU 698.3 847.3 1,046.1 19.1% 21.3% 23.5% 18.1% 19.7% 19.8% 13.8% 15.6% 15.7%
HCL Technologies Limited IN 8,572.6 8,912.9 9,652.0 10.4% 4.0% 8.3% 23.1% 23.6% 23.8% 19.2% 18.8% 19.4%
Infosys Limited IN 11,146.1 11,266.0 12,318.6 5.0% 1.1% 9.3% 24.6% 24.0% 24.7% 21.6% 20.7% 21.6%
Neurones S.A. FR 470.6 484.9 516.4 -7.4% 3.0% 6.5% 10.3% n.a. n.a. 7.7% 8.7% 9.1%
Progress Software Corporation US 397.7 396.2 401.3 2.7% -0.4% 1.3% 47.3% 48.1% 43.0% 39.7% 40.2% 40.0%
Mean 8,738.9 9,167.2 9,820.9 5.1% 7.9% 10.3% 18.1% 20.0% 20.4% 14.5% 15.4% 16.4%
Median 5,150.5 5,594.5 5,995.6 4.4% 4.6% 7.4% 18.0% 19.6% 19.7% 14.9% 15.7% 16.0%

Valuations in the IT Service Segment (I/II)
23
Selected publicly listed companies - multipliers
Source: CIQ June 2020
Market Cap Net Debt EV EV/Revenue EV/EBITDA EV/EBIT
Company Country (EUR m) (EUR m) (EUR m) 2020E 2021E 2022E 2020E 2021E 2022E 2020E 2021E 2022E
Accenture plc IE 112,682 -1,846 111,228 2.7x 2.6x 2.4x 15.4x 15.1x 14.1x 18.4x 17.4x 16.2x
adesso SE DE 338 84 422 0.9x 0.8x 0.7x 8.9x 7.4x 6.7x 17.6x 12.4x 10.7x
Allgeier SE DE 324 164 511 0.6x 0.6x 0.5x 6.4x 5.6x 4.2x 11.2x 8.7x 6.1x
Atos SE FR 7,096 3,009 10,117 0.9x 0.9x 0.9x 6.4x 6.0x 5.6x 10.8x 10.1x 9.0x
Bechtle AG DE 6,350 147 6,498 1.1x 1.1x 1.0x 19.0x 17.5x 16.1x 25.4x 22.4x 20.2x
Cancom SE DE 2,062 -269 1,794 1.1x 1.0x 0.9x 13.2x 11.7x 10.4x 21.3x 16.8x 14.7x
Capgemini SE FR 14,572 1,633 16,200 1.0x 0.9x 0.9x 7.2x 6.4x 5.8x 9.5x 8.3x 7.4x
CGI Inc. CA 14,357 2,475 16,885 2.1x 2.0x 2.0x 10.9x 10.4x 10.1x 14.1x 13.3x 12.9x
Cognizant Technology Solutions Corp. US 26,362 -804 25,552 1.7x 1.7x 1.6x 10.0x 8.5x 8.0x 12.1x 10.4x 9.5x
Computacenter plc GB 2,004 -24 1,981 0.3x 0.3x 0.3x 8.5x 8.4x 8.2x 12.2x 11.6x 11.4x
DATAGROUP SE DE 449 80 529 1.4x 1.3x 1.2x 10.4x 8.6x 8.0x 25.0x 16.5x 14.5x
Devoteam SA FR 573 -3 585 0.8x 0.7x 0.7x 7.5x 6.0x 5.6x 10.1x 7.7x 7.0x
DXC Technology Company US 3,895 7,067 11,497 0.6x 0.7x 0.7x 3.8x 4.2x 3.7x 5.9x 6.5x 5.9x
Indra Sistemas, S.A. ES 1,256 633 1,913 0.6x 0.6x 0.6x 6.2x 5.3x 4.9x 10.8x 8.2x 7.3x
Infosys Limited IN 34,526 -2,277 32,292 2.9x 2.9x 2.6x 11.8x 12.0x 10.6x 13.4x 13.8x 12.1x
International Business Machines Corp. US 99,049 52,405 152,016 2.3x 2.2x 2.2x 9.7x 8.8x 9.1x 14.9x 12.7x 12.5x
NTT DATA Corporation JP 13,915 4,572 18,943 1.0x 1.0x 0.9x 7.2x 6.9x 6.1x 15.3x 14.3x 12.5x
Sopra Steria Group SA FR 2,082 856 2,987 0.7x 0.7x 0.6x 7.0x 6.0x 5.3x 10.8x 8.9x 7.8x
Tata Consultancy Services Limited IN 88,655 -3,517 85,201 4.5x 4.4x 4.1x 16.7x 16.9x 15.0x 18.2x 18.4x 16.4x
Wipro Limited IN 12,723 -2,866 9,861 1.3x 1.3x 1.3x 6.5x 7.0x 6.6x 7.8x 8.5x 8.0x
Mean 22,163.5 3,076.1 25,350.6 1.4 1.4 1.3 9.6 8.9 8.2 14.2 12.4 11.1
Median 6,723.0 115.6 9,988.5 1.0 1.0 0.9 8.7 7.9 7.3 12.8 12.0 11.0

Valuations in the IT Service Segment (II/II)
24
Selected publicly listed companies - key figures
Source: CIQ June 2020
Revenue (in EURm) Revenue Growth EBITDA-Margin EBIT-Margin
Company Country 2020E 2021E 2022E 2020E 2021E 2022E 2020E 2021E 2022E 2020E 2021E 2022E
Accenture plc IE 40,765.9 42,809.5 45,617.4 3.8% 5.0% 6.6% 17.7% 17.2% 17.3% 14.8% 14.9% 15.1%
adesso SE DE 477.4 535.2 586.2 6.3% 12.1% 9.5% 10.0% 10.7% 10.7% 5.0% 6.4% 6.8%
Allgeier SE DE 815.9 870.9 932.5 4.3% 6.7% 7.1% 9.8% 10.6% 12.9% 5.6% 6.7% 9.0%
Atos SE FR 11,311.2 11,435.0 11,660.5 -2.2% 1.1% 2.0% 14.0% 14.8% 15.4% 8.3% 8.8% 9.6%
Bechtle AG DE 5,717.4 6,182.7 6,748.5 8.9% 8.1% 9.2% 6.0% 6.0% 6.0% 4.5% 4.7% 4.8%
Cancom SE DE 1,692.8 1,858.5 2,051.1 7.4% 9.8% 10.4% 8.0% 8.2% 8.4% 5.0% 5.7% 6.0%
Capgemini SE FR 15,779.7 17,208.8 18,000.3 11.6% 9.1% 4.6% 14.3% 14.7% 15.5% 10.8% 11.3% 12.1%
CGI Inc. CA 7,938.3 8,293.9 8,497.8 -5.6% 4.5% 2.5% 19.4% 19.6% 19.7% 15.1% 15.2% 15.4%
Cognizant Technology Solutions Corp. US 14,781.0 15,475.8 16,320.1 -0.8% 4.7% 5.5% 17.3% 19.3% 19.7% 14.3% 15.8% 16.4%
Computacenter plc GB 5,670.8 5,766.5 5,904.0 -6.2% 1.7% 2.4% 4.1% 4.1% 4.1% 2.9% 3.0% 3.0%
DATAGROUP SE DE 372.0 411.6 434.0 24.9% 10.6% 5.4% 13.7% 15.0% 15.2% 5.7% 7.8% 8.4%
Devoteam SA FR 737.6 786.5 833.0 -3.3% 6.6% 5.9% 10.6% 12.3% 12.5% 7.8% 9.6% 10.0%
DXC Technology Company US 17,872.7 17,041.7 17,432.3 -3.5% -4.6% 2.3% 17.1% 16.0% 17.8% 11.0% 10.4% 11.3%
Indra Sistemas, S.A. ES 3,195.2 3,293.8 3,443.3 -1.2% 3.1% 4.5% 9.7% 11.0% 11.3% 5.6% 7.1% 7.6%
Infosys Limited IN 11,146.1 11,266.0 12,318.6 5.0% 1.1% 9.3% 24.6% 24.0% 24.7% 21.6% 20.7% 21.6%
International Business Machines Corp. US 67,492.4 69,372.8 69,434.7 -1.7% 2.8% 0.1% 23.3% 24.9% 24.0% 15.1% 17.2% 17.5%
NTT DATA Corporation JP 19,208.9 19,633.5 20,358.7 12.2% 2.2% 3.7% 13.7% 13.9% 15.1% 6.4% 6.7% 7.5%
Sopra Steria Group SA FR 4,319.6 4,466.6 4,630.7 -3.2% 3.4% 3.7% 9.9% 11.1% 12.1% 6.4% 7.5% 8.3%
Tata Consultancy Services Limited IN 19,126.2 19,225.5 20,987.8 1.5% 0.5% 9.2% 26.6% 26.3% 27.0% 24.5% 24.0% 24.8%
Wipro Limited IN 7,387.8 7,356.6 7,710.5 -2.2% -0.4% 4.8% 20.4% 19.3% 19.5% 17.1% 15.7% 16.0%
Mean 12,790.4 13,164.6 13,695.1 2.8% 4.4% 5.4% 14.5% 15.0% 15.5% 10.4% 11.0% 11.6%
Median 7,663.1 7,825.2 8,104.2 0.3% 3.9% 5.1% 13.9% 14.8% 15.3% 8.1% 9.2% 9.8%

Valuations in the Conglomerates Segment (I/II)
25
Selected publicly listed companies - multipliers
Source: CIQ June 2020
Market Cap Net Debt EV EV/Revenue EV/EBITDA EV/EBIT
Company Country (EUR m) (EUR m) (EUR m) 2020E 2021E 2022E 2020E 2021E 2022E 2020E 2021E 2022E
Adobe Inc. US 162,626 491 163,125 16.1x 13.6x 11.7x 35.7x 29.5x 25.1x 40.4x 33.1x 27.8x
Alphabet Inc. US 866,086 -91,387 773,293 5.3x 4.9x 4.1x 14.7x 14.6x 11.8x 25.0x 26.1x 19.8x
Cisco Systems, Inc. US 173,475 -11,568 161,934 3.5x 3.6x 3.5x 9.7x 9.6x 9.8x 10.9x 10.6x 10.8x
Facebook, Inc. US 555,157 -45,022 509,442 8.1x 7.2x 5.7x 14.4x 14.8x 11.4x 19.8x 22.0x 16.4x
Intel Corporation US 228,004 17,241 245,667 3.9x 3.6x 3.6x 8.7x 8.0x 7.9x 12.0x 11.0x 11.2x
International Business Machines Corp. US 95,972 52,405 149,302 2.2x 2.2x 2.1x 9.2x 9.4x 8.6x 13.5x 14.5x 12.4x
Microsoft Corporation US 1,283,420 -48,791 1,233,878 11.2x 9.4x 8.5x 26.2x 20.5x 18.8x 33.6x 25.4x 23.4x
Oracle Corporation US 154,204 25,195 180,403 5.1x 4.9x 4.9x 11.1x 10.6x 10.6x 11.7x 11.3x 11.2x
salesforce.com, inc. US 142,385 -1,528 140,820 12.2x 9.2x 7.3x 50.4x 31.8x 25.1x 71.8x 55.3x 41.0x
SAP SE DE 123,536 9,475 133,084 4.8x 4.7x 4.4x 13.4x 13.3x 12.0x 16.2x 16.1x 14.3x
Mean 380,482.2 -9,349.0 371,161.2 6.4 5.7 5.1 16.4 14.3 12.7 22.8 19.1 16.5
Median 168,648.0 -518.5 171,515.9 5.0 4.8 4.5 14.3 11.7 10.2 19.4 15.7 13.3

Valuations in the Conglomerates Segment (II/II)
26
Selected publicly listed companies - key figures
Source: CIQ June 2020
Revenue (in EURm) Revenue Growth EBITDA-Margin EBIT-Margin
Company Country 2020E 2021E 2022E 2020E 2021E 2022E 2020E 2021E 2022E 2020E 2021E 2022E
Adobe Inc. US 11,880.4 13,774.7 15,830.6 17.2% 15.9% 14.9% 46.1% 46.6% 47.1% 41.1% 42.1% 42.8%
Alphabet Inc. US 154,718.4 185,563.4 215,613.0 6.7% 19.9% 16.2% 33.8% 35.1% 34.8% 19.0% 20.8% 20.8%
Cisco Systems, Inc. US 45,025.1 45,351.2 46,975.1 -3.4% 0.7% 3.6% 37.1% 36.1% 36.0% 33.5% 32.8% 33.1%
Facebook, Inc. US 70,462.8 87,982.3 104,668.2 12.2% 24.9% 19.0% 48.3% 50.4% 52.1% 32.6% 35.0% 35.7%
Intel Corporation US 67,397.7 67,762.3 71,510.6 6.5% 0.5% 5.5% 45.2% 45.2% 47.4% 32.9% 32.0% 33.0%
International Business Machines Corp. US 67,279.1 69,153.5 69,215.3 -2.0% 2.8% 0.1% 23.3% 24.9% 24.0% 15.1% 17.2% 17.5%
Microsoft Corporation US 129,736.0 143,207.3 160,040.1 18.2% 10.4% 11.8% 45.9% 45.3% 46.0% 37.1% 36.4% 37.1%
Oracle Corporation US 36,172.1 36,050.8 36,641.6 2.6% -0.3% 1.6% 46.5% 46.7% 48.2% 43.8% 44.4% 45.0%
salesforce.com, inc. US 15,337.2 18,981.6 22,612.7 32.7% 23.8% 19.1% 28.8% 29.2% 28.9% 16.6% 17.8% 19.1%
SAP SE DE 28,284.5 30,256.9 32,843.1 2.4% 7.0% 8.5% 35.3% 36.7% 37.1% 29.2% 30.8% 32.2%
Mean 62,629.3 69,808.4 77,595.0 9.3% 10.6% 10.0% 39.0% 39.6% 40.2% 30.1% 30.9% 31.6%
Median 56,152.1 56,556.7 58,095.2 6.6% 8.7% 10.2% 41.2% 41.0% 41.5% 32.7% 32.4% 33.0%
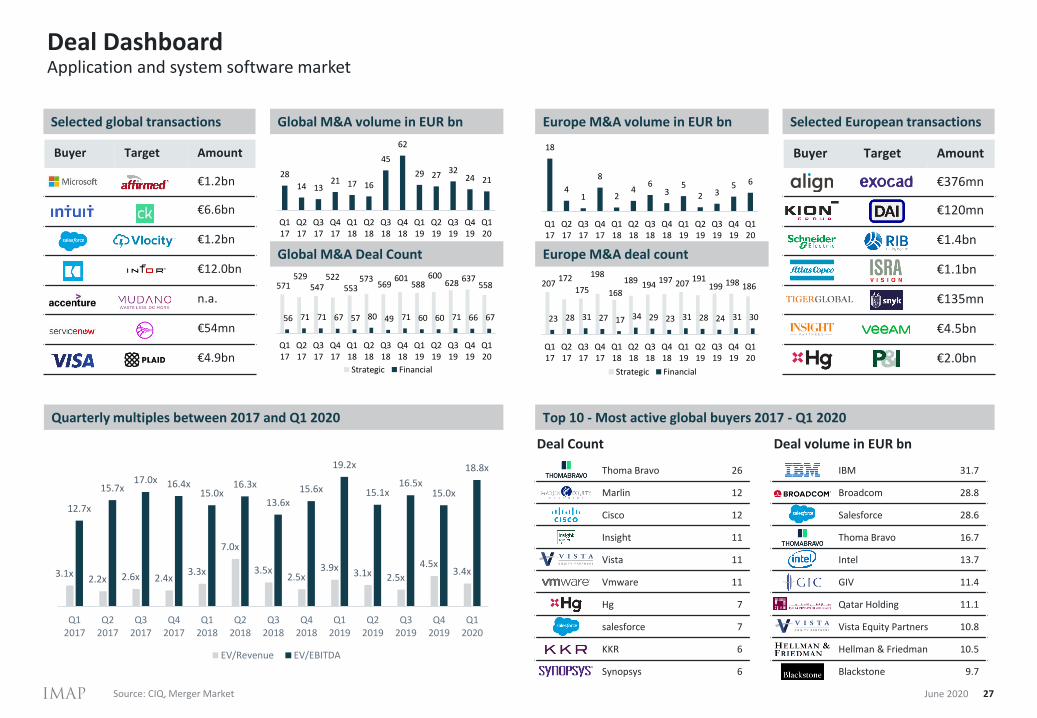
Deal Dashboard
27
Application and system software market
Selected global transactions
Quarterly multiples between 2017 and Q1 2020 Top 10 - Most active global buyers 2017 - Q1 2020
Buyer Target Amount
€1.2bn
€6.6bn
€1.2bn
€12.0bn
n.a.
€54mn
€4.9bn
Selected European transactions
Buyer Target Amount
€376mn
€120mn
€1.4bn
€1.1bn
€135mn
€4.5bn
€2.0bn
Global M&A volume in EUR bn Europe M&A volume in EUR bn
Global M&A Deal Count Europe M&A deal count
Source: CIQ, Merger Market
Deal Count Deal volume in EUR bn
June 2020
3.1x2.2x 2.6x 2.4x
3.3x
7.0x
3.5x2.5x
3.9x3.1x 2.5x
4.5x3.4x
12.7x
15.7x17.0x 16.4x
15.0x16.3x
13.6x
15.6x
19.2x
15.1x16.5x
15.0x
18.8x
Q12017
Q22017
Q32017
Q42017
Q12018
Q22018
Q32018
Q42018
Q12019
Q22019
Q32019
Q42019
Q12020
EV/Revenue EV/EBITDA
IBM 31.7
Broadcom 28.8
Salesforce 28.6
Thoma Bravo 16.7
Intel 13.7
GIV 11.4
Qatar Holding 11.1
Vista Equity Partners 10.8
Hellman & Friedman 10.5
Blackstone 9.7
Thoma Bravo 26
Marlin 12
Cisco 12
Insight 11
Vista 11
Vmware 11
Hg 7
salesforce 7
KKR 6
Synopsys 6
18
41
8
24
63
52 3
5 6
Q117
Q217
Q317
Q417
Q118
Q218
Q318
Q418
Q119
Q219
Q319
Q419
Q120
207 172
175
198
168
189 194 197 207
191 199 198 186
23 28 31 27 17 34 29 23 31 28 24 31 30
Q117
Q217
Q317
Q417
Q118
Q218
Q318
Q418
Q119
Q219
Q319
Q419
Q120
Strategic Financial
28
14 1321 17 16
45
62
29 2732
24 21
Q117
Q217
Q317
Q417
Q118
Q218
Q318
Q418
Q119
Q219
Q319
Q419
Q120
571 529
547 522
553 573
569 601
588 600
628 637
558
56 71 71 67 57 80 49 71 60 60 71 66 67
Q117
Q217
Q317
Q417
Q118
Q218
Q318
Q418
Q119
Q219
Q319
Q419
Q120
Strategic Financial

EV EV EV EV
Date Target company Country Buyer Target Description mEUR' Revenue EBITDA EBIT
03.04.2020
exocad GmbH
Germany
Align Technology, Inc.
Provider of computer aided design or computer aided manufacturing software for the dental industry
376 na na na
13.03.2020Mercury Trade Finance Solutions Sl.
Spain
Banco Santander, S.A.
Mercury Trade Finance Solutions Sl. operates as a subsidiary of Banco Santander, S.A.
20,0 na na na
11.03.2020
iBlocks Limited
United Kingdom
Tracsis plc
Developer of enterprise applications, including transit software.
24,0 na na na
10.03.2020
Orbicule BV
Belgium
Invitae Netherlands, B.V.
Developer of Moon, an artificial intelligence software that diagnoses genetic disorders.
83,9 na na na
06.03.2020
Context
United Kingdom
Accenture plc
Provider of cyber security consultancy and advisory services
123,1 na na na
06.03.2020
Data Respons ASA
Norway
AKKA Technologies SE
Provider of research and development services, and smart embedded solutions
78,9 na na na
03.03.2020Digital Applications International Limited
United Kingdom
KION Group AG
Logistics software company 120 3,0x na na
28.02.2020
CNL Software Ltd
United Kingdom
Everbridge, Inc.
Developer of Physical Security Information Management (PSIM) software for the homeland defense sector
32,5 na na na
27.02.2020Seal Software Group Limited (93% Stake)
United Kingdom,USA
DocuSign, Inc.
Provider of contract discovery, data extraction, and analytics software
na na na na
24.02.2020
Peoplevox Limited
United KingdomThe Descartes Systems Group Inc.
Provider of a software-based warehouse management system
22,5 na na na
Selected Transactions (I/III)
28
Q1 2020 with a focus on European MidCap transactions
June 2020

EV EV EV EV
Date Target company Country Buyer Target Description mEUR' Revenue EBITDA EBIT
24.02.2020
Behavox Limited
United Kingdom
SoftBank Vision Fund L.P.
Provider of an enterprise platform that unifies all types of data into a single data lake
na na na na
18.02.2020Wellbeing Software Group Ltd
United Kingdom
The Citadel Group Limited
Provider of software solutions and services to hospitals
123,6 6,2x 15,8x na
13.02.2020
RIB Software SE
Germany
Schneider Electric SE
Provider of technical Enterprise Resource Planning software solutions
1380,5 6,5x 27,6x na
06.02.2020
Living Lens Enterprise Ltd
United Kingdom
Medallia, Inc.
Provider of video mining and analytics solutions 23,7 na na na
05.02.2020
Funcom N.V. (71% Stake)
Netherlands,Norway
Tencent Holdings Ltd.
Developer and publisher of computer and console games
147,4 na na na
05.02.2020Cerner Corporation (IT Healthcare business)
Germany
CompuGroup Medical SE
Document archiving solution for healthcare providers
225,0 3,4x 19,1x na
05.02.2020Engineering Ingegneria Informatica SpA
Italy
Bain Capital, LP.
Computer engineering company 1600,0 1,2x 10,0x na
27.01.2020
Monsido ApS
DenmarkVaekstfonden; Level Equity Management, LLC
Provider of software solutions to scan websites and to improve user experience by reporting issues related to compliance, errors, dead links and breaches of current legislation
na na na na
22.01.2020
Ever Team Software SA
FranceKYOCERA Document Solutions Inc.
France-based company engaged in providing mamagement solutions
41,0 na na na
17.01.2020
Opportunity
France
Omnes Capital
France-based developer of SaaS platform for customer interaction management
35,0 na na na
Selected Transactions (II/III)
29
Q1 2020 with a focus on European MidCap transactions
June 2020

EV EV EV EV
Date Target company Country Buyer Target Description mEUR' Revenue EBITDA EBIT
16.01.2020Arrow Business Communications Limited
United Kingdom
MML Capital Partners LLP
UK-based company providing telecommunications solutions to businesses and corporate customers
128,9 na na na
16.01.2020
Clustree
FranceCornerstone OnDemand, Inc.
France-based HR SaaS Software company 16,6 na na na
07.01.2020
Webbhalsa AB
SwedenAccel; Index Ventures; Creandum
Sweden-based developer of an app enabling video consultations with medical professionals
na na na na
07.01.2020
Gastrofix GmbH
Germany
Lightspeed POS Inc.
Germany-based provider of cloud-based Point-of-Sales (POS) systems for the hospitality sector
106,7 9,5x na na
Selected Transactions (III/III)
30
Q1 2020 with a focus on European MidCap transactions
June 2020

Buyer Universe
31
Strategic & financial acquirers in the application and system software market
Most active strategic buyers of targets in the software sector by deal count, 2016 – Q1 2020
Most active financial investors of targets in the software sector by deal count, 2016 – Q1 2020
▪ In total, the 9 most active strategic buyers have closed over 86 transactions between 2016 and Q1 2020
▪ Cisco accounted for most of the acquisitions in area of application and system software with 15 transactions
▪ In Q1 2020 salesforce was the most active strategic buyer with 2 transactions
▪ In total, the 9 most active financial investors have closed over 119 transactionsbetween 2016 and Q1 2020
▪ Thoma Bravo accounted for most of the acquisitions in the area of application and system software with 29 transactions
▪ In Q1 2020 Insight was the most active financial investor with 2 transactions
38
2 15 5 4 2 4
72
4 5 1 2 31
94
2 3 1 1 2
31
9
5
3 34 1
3 1
1
2 1 1
29
19
13 13 12
9 9 8 7
2016 2017 2018 2019 2020
3
7
2
63 4 5
3 2
4
2
2
23 1
21
42
2
3
21 2
1
4
36
1
1
2 1
1
1514
13
11
98 8
6 4
2016 2017 2018 2019 2020 Summe
Source: CIQ June 2020
Agenda
1. Introduction & Executive Summary Page 3
2. Software Market Page 5
3. Valuation and M&A activity Page 10
4. Introduction to IMAP and relevant expertise Page 33

IMAP is specialized on mid-cap M&A transactions for privately owned companies
June 2020 33
With over 200 transactions annually, we are one of the leading M&A advisors globally
Execution Dedication Talent
Our values:
Informality
Global M&A-Organizationwith 60 offices in 43 countries
Successful since 1997 in the German market
c. 500 employeesthereof 40 in Germany
Managed by partners with long-term experience, who are only
responsible to the customer
Ø 220 transactions per year
thereof c. 20-25 in Germanyca. 80% company sales
International sector teams operating on a global IT platform
Transaction volume p.a. c. 13 bn- Ø deal value c. 60 mn
Among Top 10 M&A firmsin relevant industry rankings
23

IMAP International Over 230 transactions with c. 500 professionals in 43 countries completed in 2019
June 2020 34
Global partnership Transactions by sectors (2019 - # Deals: 234)
Publications
18%
15%
12%
11%8%
7%
5%
5%
3%
16%
Technology
Industrials
Consumer & Retail
Healtcare
Business Services
Food & Beverage
Building Products
Transport & Logistics
Automotive
others
International Distribution
IMAP Germany
▪ Combining local knowledge and contacts in the most important international markets
▪ Standardized, IMAP-wide working routines regarding market developments and market opportunities
▪ Globally rotating IMAP conferences & symposia
▪ International sector- and project teams▪ Resources and knowledge pool for all sector
specific projects▪ Access to all relevant national and
international databases
Europe & Africa ▪ 24 offices in the EU▪ 1 office each in UK, Turkey, Serbia and Bosnia and
Herzegovina▪ 9 offices in Africa▪ over 280 M&A professionals
North and South America▪ 17 offices in USA, 2 offices in Canada ▪ 1 office each in Argentina, Brazil, Chile, Colombia,
Mexico and Peru▪ over 170 M&A professionals
Asia▪ 2 offices in Japan, 1 office each in China and India▪ over 50 M&A professionals

IMAP Global Technology TeamGlobally active with experienced sector experts
June 2020 35
Expert team Germany
# dealmakers: >30
International sector cooperation IMAP Technology Deal Statistics
IMAP Germany Technology Team
Expert team Nordics
# dealmakers: >15
Expert team BeNeLux
# dealmakers: >40
Expert team Asia
# dealmakers: >20
Expert team UK & Ireland
# dealmakers: >10
Ø approx. 20 deals p.a.
Ø deal value approx. EUR 69 mn
206 deals in the technology sector since 2010
Dr. Carsten LehmannManaging [email protected]
Nils [email protected]
Martin [email protected]
Lennart [email protected]
Deal split by Technology sub-sector1
59
22
40
29
56
Internet Software & Services
IT Consulting & Services
Other High Tech
Telecommunications
Software
1) 2010 - Q1 2020
206Deals
Expert team South America
# dealmakers: >35
Expert team France
# dealmakers: >25
Expert team S/E Europe
# dealmakers: >60
Expert team North America
# dealmakers: >100
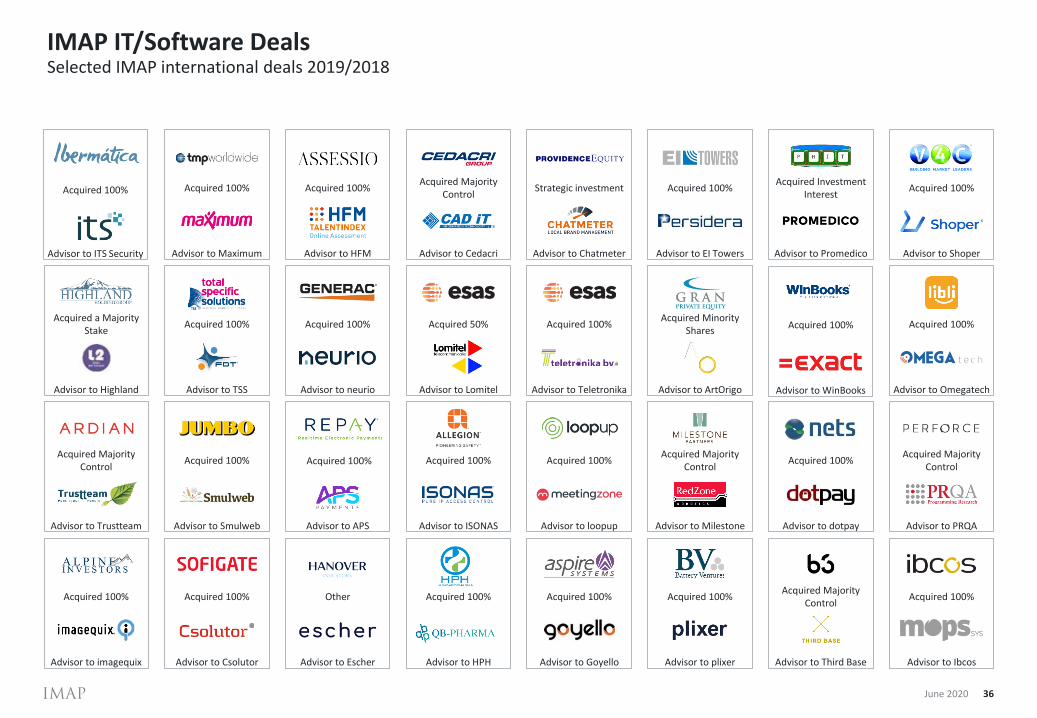
Acquired 100%
June 2020 36
IMAP IT/Software DealsSelected IMAP international deals 2019/2018
Advisor to WinBooks
Acquired 100%
Advisor to Maximum
Acquired 100%
Advisor to HFM
Acquired 100%
Advisor to Cedacri
Acquired Majority Control
Advisor to Chatmeter
Strategic investment
Advisor to EI Towers
Acquired 100%
Advisor to Promedico
Acquired Investment Interest
Advisor to Shoper
Acquired 100%
Advisor to Highland
Acquired a Majority Stake
Advisor to TSS
Acquired 100%
Advisor to neurio
Acquired 100%
Advisor to Lomitel
Acquired 50%
Advisor to Teletronika
Acquired 100%
Advisor to ArtOrigo
Acquired Minority Shares
Advisor to Omegatech
Acquired 100%
Advisor to Trustteam
Acquired Majority Control
Advisor to Smulweb
Acquired 100%
Advisor to APS Advisor to ISONAS
Acquired 100%
Advisor to loopup
Acquired 100%
Advisor to Milestone
Acquired Majority Control
Advisor to dotpay
Acquired 100%
Advisor to PRQA
Acquired Majority Control
Advisor to imagequix
Acquired 100%
Advisor to Csolutor
Acquired 100%
Advisor to Escher
Other
Advisor to HPH
Acquired 100%
Advisor to Goyello
Acquired 100%
Advisor to plixer
Acquired 100%
Advisor to Third Base
Acquired Majority Control
Advisor to Ibcos
Acquired 100%
Acquired 100%
Advisor to ITS Security
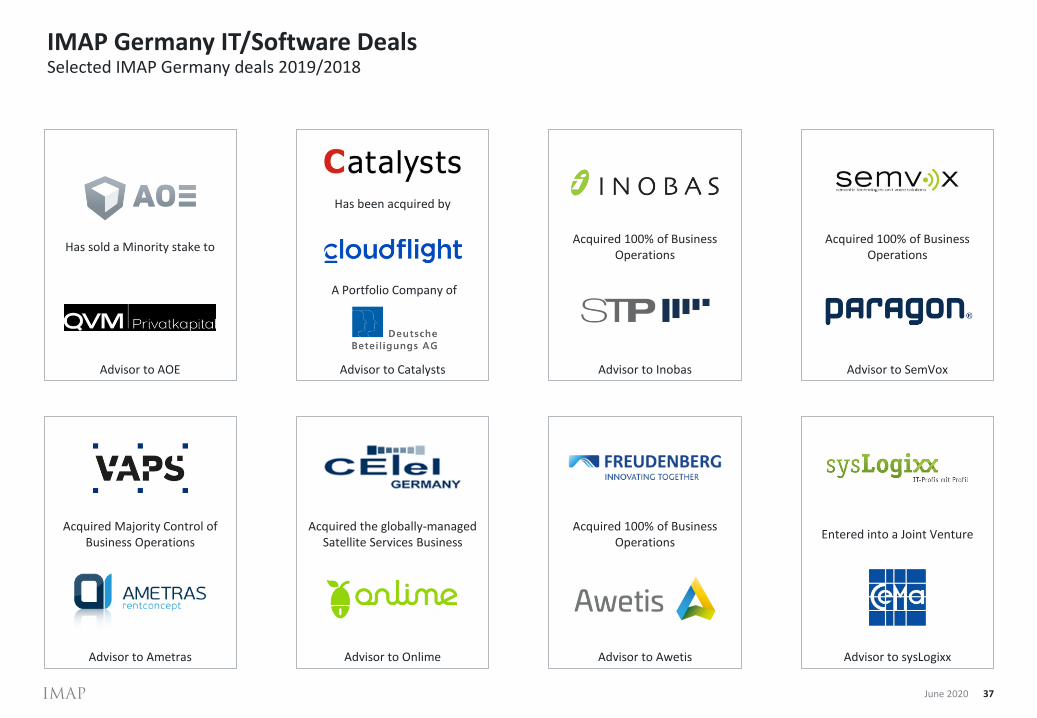
IMAP Germany IT/Software Deals
June 2020 37
Selected IMAP Germany deals 2019/2018
Advisor to AOE
Has sold a Minority stake to
Advisor to Ametras
Acquired Majority Control of Business Operations
Advisor to Catalysts
Has been acquired by
A Portfolio Company of
Advisor to Onlime
Acquired the globally-managed Satellite Services Business
Advisor to Inobas
Acquired 100% of Business Operations
Advisor to Awetis
Acquired 100% of Business Operations
Advisor to SemVox
Acquired 100% of Business Operations
Advisor to sysLogixx
Entered into a Joint Venture

IMAP M&A Consultants AG
38
Offices
June 2020
IMAP M&A Consultants AG
Mannheim
Harrlachweg 1
68163 Mannheim
Telefon: +49 621 3286-0
Fax: +49 621 3286-100
E-mail: [email protected]
Internet: www.imap.de
Frankfurt
Taunustor 160310 Frankfurt am MainTelefon: +49 69 5050604-190
München
Bernhard-Wicki-Straße 380636 MünchenTelefon: +49 89 5402273-0