Facts Q4, 2017i/@sbg/@gs/@ir/... · ATMs 1) Cards: 4.2m Employees: 8 127 Latvia Population: 2.0m...
83
Facts Q4, 2017 6 February 2018
Transcript of Facts Q4, 2017i/@sbg/@gs/@ir/... · ATMs 1) Cards: 4.2m Employees: 8 127 Latvia Population: 2.0m...

Facts Q4, 2017
6 February 2018

ContentsQ4, 2017
page page
General information 2 Asset quality 39
Swedbank in brief 2-3 Asset quality 39-41
Macro economic indicators 4-5 Credit impairments 42
Financial information, Group 6 Impaired loans and provisions 43-44
Income statement, 5-year summary 6 Loans past due 45
Income statement, 9-quarter summary 7 Private Mortgage loans 46
Balance sheet, 5-year summary 8 Concentration risk 47
Balance sheet, 9 quarters, Equity and Goodwill 9 Capital adequacy 48
Statement of changes in equity 10 Credit risks, EAD distribution by business segment and by customer segments 48
Net interest income analysis 11 Capital adequacy parameters for credit risk - business segments 49
Income analysis 12 Capital adequacy parameters for credit risk - customer segment 50-51
Expense analysis 13 Capital adequacy, consolidated situation and leverage ratio 52
Variable pay 14
Estimated capital requirements by entity, Change in REA and
Outstanding subordinated debt 53
Business segments 15 ICAAP 2015 - Scenario based stress test 54-55
Swedish Banking 15-16 Liquidity & Funding 56
Baltic Banking 17 Liquidity reserve and additional Liquid Assets 56
Baltic Banking 17-18 Survival horizon 57
Estonia 19 Liquidity ratios 58
Latvia 20 Debt securities in issue 59
Lithuania 21 Issued long-term debt, by currency 60
Other 22 Maturity distribution, long-term funding 61
Large Corporates & Institutions 23-24 Outstanding benchmark bonds 62
Group Functions & Other 25-26 Outstanding short-term funding 63
Group Treasury 27 Maturity distribution, total balance sheet 64-65
Other 28 Asset encumbrance 66-67
Eliminations 29 Cover pool data 68-70
Product companies 30 Swedbank Mortgage AB, loan data 71
Swedbank Robur AB 30-31 Rating 72
Swedbank Insurance 32-33 Key figures 73-74
Baltic Life Insurance 34 Market shares 75
Baltic P&C Insurance 35 Swedbank Group by geography 76
Business volumes 36 Employees 77
Loans 36 Currency distribution and exchange rates 78
Deposits and amounts owed to credit institutions 37 Sensitivity analysis and market risk 79
Interest-bearing Securities and Exposures towards the GIIPS
countries and Deferred Tax Assets 38 Shareholders and share data 80
Definitions 81
Contacts and financial calendar 82

General informationSwedbank in briefQ4, 2017
Purpose Financial targets
To promote a sustainable financial situation for the many
households and businesses
Return on equity: Return on equity of at least 15 per cent
Values
Cost efficiency: Market-leading cost efficiency
Simple, Open, Caring Capitalisation: Solid capitalisation
Long-term strategy
Swedbank has roots firmly entrenched in Sweden's savings bank history, the cooperative agricultural bank tradition
and Hansabanks's significant role in the Baltic countries. Swedbank has a leading position in its home markets of
Sweden, Estonia, Latvia and Lithuania.
Offering what our customers need: Offering customers what
they need and expect is critical to building trust and loyalty
when digitisation gives customers more choice. By analysing
the customer data we have and drawing on our advisors’
competence, we can more easily identify the financial services
and products our customers need and more precisely target
our offerings.
High cost efficiency: Greater transparency and more options for
customers through digitisation also mean more price pressure on a
number of banking products and services. To create value for
customers, which requires both investments and competitive
prices, our goal is to be the market leader in cost efficiency. This
affects everything from how much capital we tie up to how
effectively and well we work together.
Low risk: Keeping our risks low is the foundation to building public
trust. It allows us to finance our operations through deposits from
the public and funding from the capital markets as well as to lend
capital to households and businesses at competitive prices and
create sustainable growth. We achieve this through stable
profitability combined with high-quality lending and solid
capitalisation, but also through our ability to quickly adapt to
changes in the market.
Available full-service bank: We are convinced that simplicity
and availability are necessary to build the trust and loyalty of
our customers. So that customers can manage all their
finances with us, we offer a comprehensive range of loans,
payment services and savings products, ranging from basic
transactional services such as consumer debit and credit
cards to more complex advice for large companies and
institutions. Our customers in Sweden and the Baltic countries
can easily manage their finances through a distribution
network comprising efficient digital solutions for day-to-day
banking as well as more extensive personal advice.
2
General information
Swedbank in briefQ4, 2017
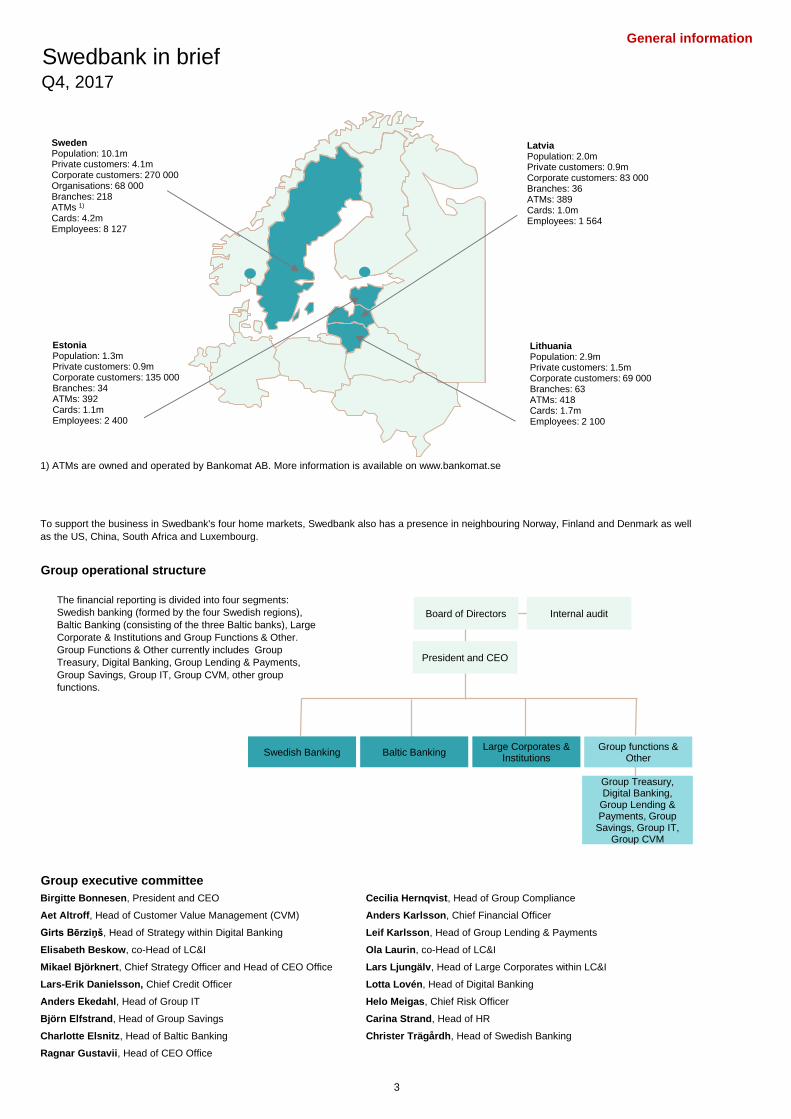
1) ATMs are owned and operated by Bankomat AB. More information is available on www.bankomat.se
Group operational structure
Group executive committee
Birgitte Bonnesen, President and CEO Cecilia Hernqvist, Head of Group Compliance
Aet Altroff, Head of Customer Value Management (CVM) Anders Karlsson, Chief Financial Officer
Girts Bērziņš, Head of Strategy within Digital Banking Leif Karlsson, Head of Group Lending & Payments
Elisabeth Beskow, co-Head of LC&I Ola Laurin, co-Head of LC&I
Mikael Björknert, Chief Strategy Officer and Head of CEO Office Lars Ljungälv, Head of Large Corporates within LC&I
Lars-Erik Danielsson, Chief Credit Officer Lotta Lovén, Head of Digital Banking
Anders Ekedahl, Head of Group IT Helo Meigas, Chief Risk Officer
Björn Elfstrand, Head of Group Savings Carina Strand, Head of HR
Charlotte Elsnitz, Head of Baltic Banking Christer Trägårdh, Head of Swedish Banking
Ragnar Gustavii, Head of CEO Office
To support the business in Swedbank's four home markets, Swedbank also has a presence in neighbouring Norway, Finland and Denmark as well
as the US, China, South Africa and Luxembourg.
Sweden Population: 10.1m Private customers: 4.1m Corporate customers: 270 000 Organisations: 68 000 Branches: 218 ATMs 1)
Cards: 4.2m Employees: 8 127
Latvia Population: 2.0m Private customers: 0.9m Corporate customers: 83 000 Branches: 36 ATMs: 389 Cards: 1.0m Employees: 1 564
Estonia Population: 1.3m Private customers: 0.9m Corporate customers: 135 000 Branches: 34 ATMs: 392 Cards: 1.1m Employees: 2 400
Lithuania Population: 2.9m Private customers: 1.5m Corporate customers: 69 000 Branches: 63 ATMs: 418 Cards: 1.7m Employees: 2 100
The financial reporting is divided into four segments:
Swedish banking (formed by the four Swedish regions),
Baltic Banking (consisting of the three Baltic banks), Large
Corporate & Institutions and Group Functions & Other.
Group Functions & Other currently includes Group
Treasury, Digital Banking, Group Lending & Payments,
Group Savings, Group IT, Group CVM, other group
functions.
Board of Directors
President and CEO
Internal audit
Baltic Banking Swedish Banking Large Corporates &
Institutions
Group Treasury, Digital Banking,
Group Lending & Payments, Group
Savings, Group IT, Group CVM
Group functions & Other
3

General information
Macro economic indicatorsQ4, 2017
GDP growth Average inflation rate (consumer price growth)
% 2019F 2018F 2017F 2016 2015 2014 2013 % 2019F 2018F 2017F 2016 2015 2014 2013
Sweden 2.1 2.7 2.6 3.0 3.9 2.4 1.3 Sweden 2.8 2.1 1.8 1.0 0.0 -0,2 0.0
Estonia 3.0 3.9 4.4 2.1 1.2 2.9 1.6 Estonia 2.5 3.0 3.4 0.1 -0.5 -0.1 2.8
Latvia 3.2 4.2 4.7 2.1 2.7 2.4 4.2 Latvia 2.5 3.5 2.9 0.1 0.2 0.6 0.0
Lithuania 2.5 3.2 3.8 2.3 1.6 3.0 3.3 Lithuania 2.5 3.3 3.7 0.9 -0.9 0.1 1.1
Current account balance, % of GDP General Government Financial Balance, % of GDP
2019F 2018F 2017F 2016 2015 2014 2013 2019F 2018F 2017F 2016 2015 2014 2013
Sweden 5.2 5.3 5.3 5.1 4.9 4.2 5.5 Sweden 1.0 0.7 1.2 1.1 -0.1 -1.7 -1.4
Estonia 1.6 2.0 2.2 1.9 1.9 1.0 -1.2 Estonia -0.3 -0.1 0.0 -0.3 0.4 0.7 -0.2
Latvia -4.4 -2.6 -0.7 1.4 -1.2 -2.0 -1.6 Latvia -0.8 -0.8 -0.8 0.0 -1.3 -1.6 -0.7
Lithuania -2.0 -1.7 -0.8 -0.9 -1.7 3.6 1.6 Lithuania 0.2 0.5 0.1 0.3 -0,2 -0.7 -2.6
General government debt, % of GDP
2019F 2018F 2017F 2016 2015 2014 2013
Sweden 35.1 36.9 38.7 42.2 43.4 40.6 38.7 Sweden 49 508 9.9 514.5
Estonia 8.5 8.5 9.0 9.4 9.7 10.4 10.1 Estonia 29 620 1.3 23.3
Latvia 33.3 35.0 37.2 40.3 36.4 40.8 38.2 Latvia 25 933 2.0 27.6
Lithuania 36.7 36.4 41.2 40.1 42.8 40.7 38.8 Lithuania 29 966 2.9 42.7
Household debt, % of disposable income 1)
Unemployment
% 2016 2015 2014 2013 % 2019F 2018F 2017F 2016 2015 2014 2013
Sweden 178.5 173.6 173.7 169.7 Sweden 6.3 6.4 6.7 6.9 7.4 7.9 8.0
Estonia 1) 69.7 68.6 70.2 70.8 Estonia 7.3 7.5 7.0 6.8 6.2 7.4 8.6
Latvia 1) 37.6 39.9 43.8 49.7 Latvia 7.2 7.5 8.5 9.6 9.9 10.8 11.9
Lithuania 1) 35.6 35.3 34.3 35.0 Lithuania 6.5 6.8 7.2 7.9 9.1 10.7 11.8
1) Gross debt-to-income ratio of households (ESA 2010)
Source: Swedbank Reasearch - Macro Research, Eurostat, the World Bank & the Riksbank
Inhabitants
2016 (millions)
GDP (2016,
USDbn)
GDP per capita (PPP)
2016, USD
4

General information
Macro economic indicatorsQ4, 2017
1) House price index per december and last quarter (2005=100) for a single family home
Source: © Valueguard Index Sweden AB 2015 (Hox index)
2) Average sales price per sqm for apartments
Source: Land boards of respective country
0
200
400
600
800
1 000
1 200
1 400
1 600
1 800
2 000
2006 2007 2008 2009 2010 2011 2012 2013 2014 2015 2016 Q32017
EUR
Tallin Riga Vilnius
Real estate price development, Baltics 2)
Interest rates: Sweden & Eurozone, %
Real estate price development, Sweden 1)
Index, 2005=100
100
120
140
160
180
200
220
240
2006 2007 2008 2009 2010 2011 2012 2013 2014 2015 2016 2017
Stockholm Gothenburg Sweden Malmoe
5
Financial information, GroupIncome statement, 5-year summaryQ4, 2017
Income statement, Group FY ∆ FY FY FY FY
SEKm 2017 % 2016 3)
2015 2)
2014 1)
2013
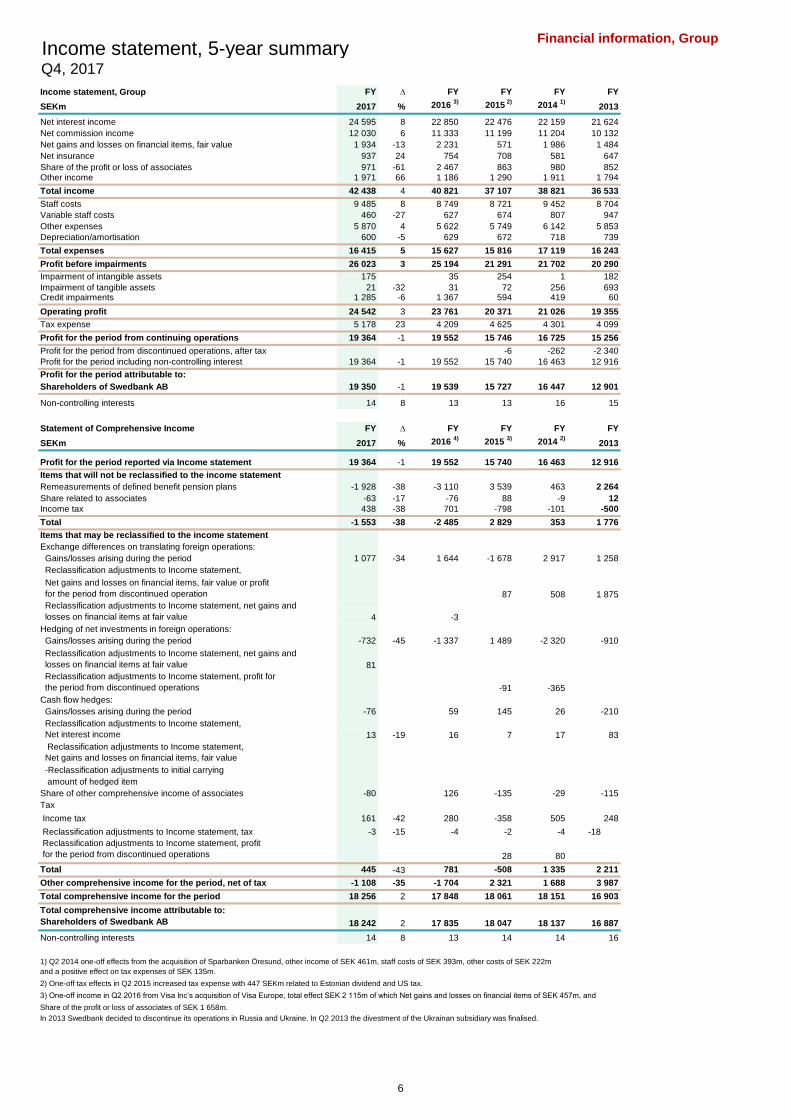
Net interest income 24 595 8 22 850 22 476 22 159 21 624
Net commission income 12 030 6 11 333 11 199 11 204 10 132
Net gains and losses on financial items, fair value 1 934 -13 2 231 571 1 986 1 484
Net insurance 937 24 754 708 581 647
Share of the profit or loss of associates 971 -61 2 467 863 980 852Other income 1 971 66 1 186 1 290 1 911 1 794
Total income 42 438 4 40 821 37 107 38 821 36 533
Staff costs 9 485 8 8 749 8 721 9 452 8 704
Variable staff costs 460 -27 627 674 807 947
Other expenses 5 870 4 5 622 5 749 6 142 5 853
Depreciation/amortisation 600 -5 629 672 718 739
Total expenses 16 415 5 15 627 15 816 17 119 16 243
Profit before impairments 26 023 3 25 194 21 291 21 702 20 290
Impairment of intangible assets 175 35 254 1 182
Impairment of tangible assets 21 -32 31 72 256 693Credit impairments 1 285 -6 1 367 594 419 60Non-recurring items
Operating profit 24 542 3 23 761 20 371 21 026 19 355
Tax expense 5 178 23 4 209 4 625 4 301 4 099
Profit for the period from continuing operations 19 364 -1 19 552 15 746 16 725 15 256
Profit for the period from discontinued operations, after tax -6 -262 -2 340
Profit for the period including non-controlling interest 19 364 -1 19 552 15 740 16 463 12 916
Profit for the period attributable to:
Shareholders of Swedbank AB 19 350 -1 19 539 15 727 16 447 12 901
Non-controlling interests 14 8 13 13 16 15
Statement of Comprehensive Income FY ∆ FY FY FY FY
SEKm 2017 % 2016 4)
2015 3)
2014 2)
2013
Profit for the period reported via Income statement 19 364 -1 19 552 15 740 16 463 12 916
Items that will not be reclassified to the income statement
Remeasurements of defined benefit pension plans -1 928 -38 -3 110 3 539 463 2 264
Share related to associates -63 -17 -76 88 -9 12
Income tax 438 -38 701 -798 -101 -500
Total -1 553 -38 -2 485 2 829 353 1 776
Items that may be reclassified to the income statement
Exchange differences on translating foreign operations:
Gains/losses arising during the period 1 077 -34 1 644 -1 678 2 917 1 258
Reclassification adjustments to Income statement,
Net gains and losses on financial items, fair value or profit
for the period from discontinued operation 87 508 1 875
Reclassification adjustments to Income statement, net gains and
losses on financial items at fair value 4 -3
Hedging of net investments in foreign operations:
Gains/losses arising during the period -732 -45 -1 337 1 489 -2 320 -910
Reclassification adjustments to Income statement, net gains and
losses on financial items at fair value 81
Reclassification adjustments to Income statement, profit for
the period from discontinued operations -91 -365
Cash flow hedges:
Gains/losses arising during the period -76 59 145 26 -210
Reclassification adjustments to Income statement,
Net interest income 13 -19 16 7 17 83
Reclassification adjustments to Income statement,
Net gains and losses on financial items, fair value
-Reclassification adjustments to initial carrying
amount of hedged item
Share of other comprehensive income of associates -80 126 -135 -29 -115
Tax
Income tax 161 -42 280 -358 505 248
Reclassification adjustments to Income statement, tax -3 -15 -4 -2 -4 -18
Reclassification adjustments to Income statement, profit
for the period from discontinued operations 28 80
Total 445 -43 781 -508 1 335 2 211
Other comprehensive income for the period, net of tax -1 108 -35 -1 704 2 321 1 688 3 987
Total comprehensive income for the period 18 256 2 17 848 18 061 18 151 16 903
Total comprehensive income attributable to:
Shareholders of Swedbank AB 18 242 2 17 835 18 047 18 137 16 887
Non-controlling interests 14 8 13 14 14 16
2) One-off tax effects in Q2 2015 increased tax expense with 447 SEKm related to Estonian dividend and US tax.
3) One-off income in Q2 2016 from Visa Inc’s acquisition of Visa Europe, total effect SEK 2 115m of which Net gains and losses on financial items of SEK 457m, and
Share of the profit or loss of associates of SEK 1 658m.
1) Q2 2014 one-off effects from the acquisition of Sparbanken Öresund, other income of SEK 461m, staff costs of SEK 393m, other costs of SEK 222m
and a positive effect on tax expenses of SEK 135m.
In 2013 Swedbank decided to discontinue its operations in Russia and Ukraine. In Q2 2013 the divestment of the Ukrainan subsidiary was finalised.
6

Financial information, GroupIncome statement, 9-quarter summaryQ4, 2017
Income statement, Group Q4 ∆ Q3 Q2 Q1 Q4 Q3 Q2 Q1 Q4
SEKm 2017 SEKm 2017 2017 2017 2016 2016 2016 1)
2016 2015
Net interest income 6 326 118 6 208 6 090 5 971 6 000 5 837 5 552 5 461 5 642
Net commission income 3 291 374 2 917 3 000 2 822 3 055 2 838 2 795 2 645 2 877
Net gains/losses on financial items, fair value 356 -169 525 567 486 285 669 877 400 165
Net insurance 304 74 230 207 196 220 174 203 157 193
Share of profit or loss of associates 347 102 245 204 175 109 238 1 929 191 155
Other income 352 59 293 325 1 001 278 284 334 290 308
Total income 10 976 558 10 418 10 393 10 651 9 947 10 040 11 690 9 144 9 340
Staff costs 2 667 394 2 273 2 269 2 276 2 283 2 138 2 153 2 175 2 194
Variable staff costs 30 -111 141 117 172 157 177 161 132 97
Other expenses 1 695 379 1 316 1 439 1 420 1 564 1 322 1 371 1 365 1 674
Depreciation/amortisation 171 18 153 141 135 153 167 155 154 157
Total expenses 4 563 680 3 883 3 966 4 003 4 157 3 804 3 840 3 826 4 122
Profit before impairments 6 413 -122 6 535 6 427 6 648 5 790 6 236 7 850 5 318 5 218
Impairment of intangible assets 79 -17 96 35
Impairment of tangible assets 7 -4 11 1 2 21 1 1 8 19
Credit Impairments 311 76 235 400 339 593 201 538 35 399
Operating profit 6 016 -177 6 193 6 026 6 307 5 141 6 034 7 311 5 275 4 800
Tax expense 1 277 -167 1 444 1 276 1 181 996 1 215 1 037 961 974
Profit for the period from continuing operations 4 739 -10 4 749 4 750 5 126 4 145 4 819 6 274 4 314 3 826
Profit for the period from discontinued operations, after tax
Profit for the period including non-controlling interest 4 739 -10 4 749 4 750 5 126 4 145 4 819 6 274 4 314 3 826
Profit for the period attributable to:
Shareholders of Swedbank AB 4 737 -6 4 743 4 746 5 124 4 142 4 816 6 270 4 311 3 825
Non-controlling interests 2 -4 6 4 2 3 3 4 3 1
Statement of comprehensive income Q4 ∆ Q3 Q2 Q1 Q4 Q3 Q2 Q1 Q4
SEKm 2017 SEKm 2017 2017 2017 2016 2016 2016 1)
2016 2015
Profit for the period reported via Income statement 4 739 -10 4 749 4 750 5 126 4 145 4 819 6 274 4 314 3 814
Items that will not be reclassified to the income statement
Remeasurements of defined benefit pension plans -776 -739 -37 -511 -604 1 782 -775 -1 762 -2 355 1 042
Share related to associates -22 -17 -5 -16 -20 65 -23 -58 -60 28
Income tax 176 167 9 116 137 -407 176 401 531 -236
Total -622 -589 -33 -411 -487 1 440 -622 -1 419 -1 884 834
Items that may be reclassified to the income statement
Exchange differences on translating foreign operations:
Gains/losses arising during the period 732 598 134 298 -87 -256 772 853 275 -1 192
Reclassification adjustments to income statement,
Net gains/losses on financial items at fair value or profit for the
period from discontinued operation
87
Reclassification adjustments to Income statement, net gains and
losses on financial items at fair value
4 4 -3
Hedging of net investments in foreign operations:
Gains/losses arising during the period -515 -393 -122 -176 81 221 -650 -666 -242 978
Reclassification adjustments to Income statement, net gains and
losses on financial items at fair value
81 81
Reclassification adjustments to Income statement,
profit for the period from discontinued operations -91
Cash flow hedges:
Gains/losses arising during the period 34 31 3 -113 -72 72 -22 81 -16
Reclassification adjustments to Income statement,
Net interest income 3 3 4 3 3 4 5 4
Share of other comprehensive income of associates -49 -74 25 -42 -14 -20 72 44 30 -42
Tax
Income tax relating to components of other comprehensive income 89 63 26 40 7 -35 127 152 36 -210
Reclassification adjustments to Income statement, tax -1 -0 -1 -1 -1 -1 -1 -1 -1
Reclassification adjustments to Income statement, profit for the
period from discontinued operations 28
Total 378 310 68 123 -124 -160 393 365 183 -458
Other comprehensive income for the period, net of tax -244 -279 35 -288 -611 1 280 -229 -1 054 -1 701 376
Total comprehensive income for the period 4 495 -289 4 784 4 462 4 515 5 425 4 590 5 220 2 613 4 190
Shareholders of Swedbank AB 4 493 -285 4 778 4 459 4 512 5 422 4 587 5 216 2 610 4 189
1) One-off income in Q2 2016 from Visa Inc’s acquisition of Visa Europe, total effect SEK 2 115m of which Net gains and losses on financial items of SEK 457m, and
Share of the profit or loss of associates of SEK 1 658m
7
Financial information, Group
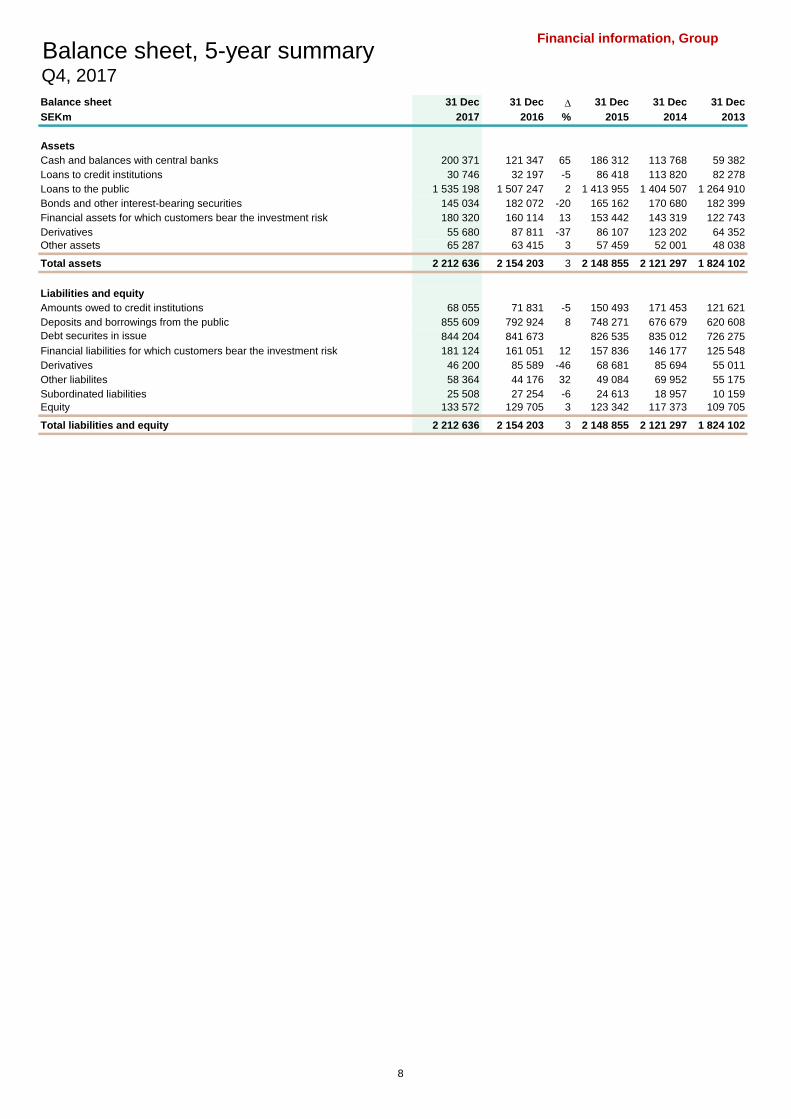
Balance sheet, 5-year summaryQ4, 2017
Balance sheet 31 Dec 31 Dec ∆ 31 Dec 31 Dec 31 Dec
SEKm 2017 2016 % 2015 2014 2013
Assets
Cash and balances with central banks 200 371 121 347 65 186 312 113 768 59 382
Loans to credit institutions 30 746 32 197 -5 86 418 113 820 82 278
Loans to the public 1 535 198 1 507 247 2 1 413 955 1 404 507 1 264 910
Bonds and other interest-bearing securities 145 034 182 072 -20 165 162 170 680 182 399
Financial assets for which customers bear the investment risk 180 320 160 114 13 153 442 143 319 122 743
Derivatives 55 680 87 811 -37 86 107 123 202 64 352
Other assets 65 287 63 415 3 57 459 52 001 48 038
Total assets 2 212 636 2 154 203 3 2 148 855 2 121 297 1 824 102
Liabilities and equity
Amounts owed to credit institutions 68 055 71 831 -5 150 493 171 453 121 621
Deposits and borrowings from the public 855 609 792 924 8 748 271 676 679 620 608
Debt securites in issue 844 204 841 673 0 826 535 835 012 726 275
Financial liabilities for which customers bear the investment risk 181 124 161 051 12 157 836 146 177 125 548
Derivatives 46 200 85 589 -46 68 681 85 694 55 011
Other liabilites 58 364 44 176 32 49 084 69 952 55 175
Subordinated liabilities 25 508 27 254 -6 24 613 18 957 10 159
Equity 133 572 129 705 3 123 342 117 373 109 705
Total liabilities and equity 2 212 636 2 154 203 3 2 148 855 2 121 297 1 824 102
8

Financial information, GroupBalance sheet 9 quarters, Equity and GoodwillQ4, 2017
Balance sheet 31 Dec ∆ 30 Sep 30 Jun 31 Mar 31 Dec 30 Sep 30 Jun 31 Mar 31 Dec
SEKm 2017 SEKm 2017 2017 2017 2016 2016 2016 2016 2015
Assets
Cash and balances with central banks 200 371 -135 912 336 283 432 540 407 299 121 347 262 773 356 146 339 306 186 312
Loans to credit institutions 30 746 -7 242 37 988 38 624 39 128 32 197 94 354 129 696 90 980 86 418
Loans to the public 1 535 198 -6 350 1 541 548 1 521 973 1 525 393 1 507 247 1 526 635 1 511 090 1 497 907 1 413 955
Interest-bearing securities 145 034 -65 171 210 205 127 112 174 754 182 072 182 525 160 236 162 994 165 162
Value change of interest hedged item in portfolio hedge 789 -129 918 1 007 1 228 1 482 2 413 2 478 1 941 1 009
Financial assets for which customers bear
the investment risk 180 320 4 124 176 196 173 051 168 293 160 114 155 859 146 885 150 022 153 442
Shares and participating interests 19 850 -5 682 25 532 12 501 46 014 23 897 24 200 19 432 8 600 11 074
Investments in associates 6 357 -1 066 7 423 7 211 7 265 7 319 7 228 6 975 5 473 5 382
Derivatives 55 680 -10 447 66 127 76 372 76 642 87 811 93 294 99 314 99 002 86 107
Intangible fixed assets 16 329 368 15 961 14 795 14 367 14 279 14 293 14 060 13 750 13 690
of which goodwill 13 100 177 12 923 12 463 12 385 12 408 12 468 12 272 12 064 12 010
Tangible assets 1 955 -15 1 970 1 867 1 845 1 864 1 928 1 929 1 961 1 989
Current tax assets 1 375 356 1 019 1 326 1 200 1 796 3 858 3 139 2 679 1 662
Deferred tax assets 173 12 161 155 187 160 183 180 191 192
Other assets 14 499 -18 761 33 260 12 408 20 331 8 067 18 948 19 081 22 664 15 951
Prepaid expenses and accrued income 3 960 -1 324 5 284 5 179 4 739 4 551 5 252 5 373 6 319 6 362
Group of assets classified as held for sale 0 0 0 0 0 0 0 0 0 148
Total assets 2 212 636 -247 239 2 459 875 2 426 121 2 488 685 2 154 203 2 393 743 2 476 014 2 403 789 2 148 855
Liabilities and equity
Liabilities
Amounts owed to credit institutions 68 055 -68 632 136 687 154 974 128 015 71 831 158 128 166 872 145 631 150 493
Deposits and borrowings from the public 855 609 -80 145 935 754 909 223 917 647 792 924 879 181 955 794 919 877 748 271
Debt securities in issue 844 204 -67 629 911 833 891 296 975 920 841 673 905 496 915 707 861 484 826 535
Financial liabilities for which customers bear
the investment risk 181 124 4 224 176 900 173 859 170 535 161 051 156 741 147 595 155 635 157 836
Derivatives 46 200 -7 131 53 331 70 813 62 657 85 589 81 014 82 900 85 601 68 681
Current tax liabilities 1 980 401 1 579 1 303 2 233 992 1 329 810 1 003 105
Deferred tax liabilities 2 182 -189 2 371 2 045 2 168 2 438 1 987 2 142 2 612 3 071
Short positions securities 14 459 -16 330 30 789 21 269 20 507 11 614 19 424 16 757 26 970 8 191
Other liabilities 24 580 -13 365 37 945 30 744 45 467 14 755 26 289 28 489 39 205 22 358
Accrued expenses and prepaid income 9 650 1 043 8 607 9 459 12 954 10 917 11 629 12 206 14 647 13 243
Provisions 5 513 944 4 569 4 436 3 975 3 460 5 443 4 568 2 985 2 102
Subordinated liabilities 25 508 -4 940 30 448 32 522 26 980 27 254 22 899 22 702 22 107 24 613
Liabilities directly associated with group of assets classified
as held for sale 0 0 0 0 0 0 0 0 0 14
Total liabilities 2 079 064 -251 749 2 330 813 2 301 943 2 369 058 2 024 498 2 269 560 2 356 542 2 277 757 2 025 513
Equity
Non-controlling interests 200 2 198 192 193 190 184 181 182 179
Equity attributable to shareholders of Swedbank AB 133 372 4 508 128 864 123 986 119 434 129 515 123 999 119 291 125 850 123 163
Total equity 133 572 4 510 129 062 124 178 119 627 129 705 124 183 119 472 126 032 123 342
Total liabilities and equity 2 212 636 -247 239 2 459 875 2 426 121 2 488 685 2 154 203 2 393 743 2 476 014 2 403 789 2 148 855
Equity attributable to shareholders of Swedbank AB, 31 Dec 2017 Goodwill, 31 Dec 2017
SEKm SEKm
Swedbank AB (Sweden) 87 177 Swedbank Robur 328
Swedbank Mortgage (Sweden) 46 354 Swedbank Försäkring 651
Swedbank Robur (Sweden) 1 525 Ölands Bank AB 9
Swedbank Försäkring (Sweden) 2 258 Swedbank (Estonia) 4 170
Sparia Försäkring Group (Sweden) 146 Swedbank (Latvia) 2 147
Swedbank (Estonia) 16 920 Swedbank (Lithuania) 3 647
Swedbank (Latvia) 7 452 PayEx AB 429
Swedbank (Lithuania) 7 454 Group total 11 381
PayEx AB 336 Goodwill within parent company:
Ektornet (Sweden) 152 Swedbank AB (Sweden) 1 719
Other subsidiaries 1 911
Total legal equity 171 685 Total goodwill 13 100
Group adjustments and eliminations -38 313
Total equity attributable to shareholders of Swedbank AB 133 372
9

Financial information, GroupStatement of changes in equity Q4, 2017
Statement of changes in equity
Non-
controlling
SEKm interest Total equity
Share capital
Other
contributed
equity
Exchange
differences,
subsidiaries
and
associates
Hedging of
net
investments
in foreign
operations
Cash flow
hedges
Retained
earnings Total
Opening balance 1 January 2017 24 904 17 275 2 601 -1 748 77 86 406 129 515 190 129 705
Dividends -14 695 -14 695 -4 -14 699
Share based payments to employees 310 310 310
Contribution 0
Total comprehensive income for the period 1 001 -507 -49 17 797 18 242 14 18 256
Closing balance 31 December 2017 24 904 17 275 3 602 -2 255 28 89 818 133 372 200 133 572
Specification of Exchange differences, subsidiaries and associates 31 Dec 31 Dec Q4 Q3 Q2 Q1 Q4 Q3 Q2
SEKm 2017 2016 2017 2017 2017 2017 2016 2016 2016
Estonian Operations 2 009 1 466 369 67 153 -46 -129 388 405
Latvian Operations 922 677 167 30 69 -21 -58 175 221
Lithuanian Operations 955 670 193 36 79 -23 -67 199 208
Norwegian Operations -280 -198 -50 26 -43 -15 -21 74 45
Robur, Ektornet and other -4 -14 8 0 -1 3 -2 5 18
Total 3 602 2 601 687 159 257 -102 -277 841 897
Specification of Hedging of net investment in foreign operations 31 Dec 31 Dec Q4 Q3 Q2 Q1 Q4 Q3 Q2
SEKm 2017 2016 2017 2017 2017 2017 2016 2016 2016
Estonian Operations -1 356 -1 024 -227 -40 -92 27 81 -234 -244
Latvian Operations -491 -346 -99 -18 -40 12 34 -102 -133
Lithuanian Operations -536 -392 -99 -18 -39 12 36 -99 -100
Norwegian Operations 167 114 28 -20 33 12 21 -58 -38
Robur, Ektornet and other -39 -100 59 1 1 0 -2 -14 -4
Total -2 255 -1 748 -338 -95 -137 63 170 -507 -519
Specification of Cash flow hedges 31 Dec 31 Dec Q4 Q3 Q2 Q1 Q4 Q3 Q2
SEKm 2017 2016 2017 2017 2017 2017 2016 2016 2016
Group Treasury 27 77 29 4 3 -86 -53 59 -13
Other 1 -0 0 0 1
Total 28 77 29 4 3 -85 -53 59 -13
Shareholders' equity
10

Financial information, GroupNet interest income analysis, GroupQ4, 2017
Net interest income analysis, Group FY FY ∆ % Q4 Q3 Q2 Q1 Q4 Q3 Q2 Q1 Q4
SEKm 2017 2016 Y/Y 2017 2017 2017 2017 2016 2016 2016 2016 2015
Interest income
Loans to credit institutions 60 64 -6 70 -19 8 1 -44 15 31 62 87
Loans to the public 30 022 30 031 0 7 502 7 534 7 523 7 463 7 555 7 507 7 447 7 522 7 715
Interest-bearing securities 182 651 -72 24 38 50 70 116 137 172 226 207
Derivatives, income 1 026 1 093 -6 302 226 209 289 179 256 226 432 -85
Other 1 241 764 62 242 358 367 274 9 231 272 252 198
Total interest income including negative yield
on financial assets 32 531 32 603 0 8 140 8 137 8 157 8 097 7 815 8 146 8 148 8 494 8 122
of which interest income reported in net gains/
losses on financial items at fair value 343 1 232 -72 79 16 61 187 264 309 434 225 136
Interest income, including negative yield on
financial assets, according to income
statement 32 188 31 371 3 8 061 8 121 8 096 7 910 7 551 7 837 7 714 8 269 7 986
Interest expense
Amounts owed to credit institutions -821 -269 -255 -243 -175 -148 98 -134 -122 -111 -96
Deposits and borrowings from the public -1 281 -1 100 16 -305 -371 -339 -266 -166 -293 -331 -310 -174
of which deposits guarantee fees -442 -466 -5 -106 -99 -119 -118 -110 -101 -131 -124 -98
Debt securities in issue -12 095 -13 013 -7 -3 054 -2 977 -2 935 -3 129 -3 164 -3 649 -3 096 -3 104 -3 221
of which state guarantee fees
Subordinated liabilities -1 193 -977 22 -268 -310 -311 -304 -251 -235 -228 -263 -270
Derivatives, expenses 9 334 7 638 22 2 548 2 357 2 089 2 340 2 192 2 507 1 784 1 155 1 567
Other -1 225 -689 78 -308 -304 -263 -350 -163 -176 -164 -186 -148
of which resolution fee 1)
-1 205 -646 87 -301 -300 -261 -343 -160 -164 -153 -169 -133
Total interest expense including negative
yield on financial liabilities -7 281 -8 410 -13 -1 642 -1 848 -1 934 -1 857 -1 454 -1 980 -2 157 -2 819 -2 342
of which interest expense reported in net
gains/ losses on financial items at fair value 312 111 93 65 72 82 97 20 5 -11 2
Interest expense, including negative yield on
financial liabilities, according to income
statement -7 593 -8 521 -11 -1 735 -1 913 -2 006 -1 939 -1 551 -2 000 -2 162 -2 808 -2 344
Net interest income 24 595 22 850 8 6 326 6 208 6 090 5 971 6 000 5 837 5 552 5 461 5 642
Average balances
Loans to credit institutions 38 206 89 523 -57 41 988 37 346 37 497 36 274 74 299 96 463 107 363 91 582 99 206
Loans to the public 1 532 472 1 497 557 2 1 545 913 1 527 893 1 528 059 1 525 898 1 525 959 1 523 849 1 496 853 1 454 306 1 437 248
Interest-bearing securities 172 551 161 071 7 181 247 151 360 144 609 193 452 167 561 157 181 152 654 156 732 158 989
Interest-bearing assets 1 743 229 1 748 151 0 1 769 148 1 716 599 1 710 165 1 755 624 1 767 819 1 777 493 1 756 870 1 702 620 1 695 443
Derivatives 75 474 95 730 -21 66 074 75 938 75 959 82 106 98 528 97 751 93 320 94 428 98 021
Other assets 603 728 530 049 14 598 191 621 077 678 812 548 737 463 497 573 923 575 883 515 737 509 361
Total assets 2 422 431 2 373 930 2 2 433 413 2 413 614 2 464 936 2 386 467 2 329 844 2 449 167 2 426 073 2 312 785 2 302 825
Amounts owed to credit institutions 138 757 154 798 -10 130 952 153 017 151 998 119 915 155 611 167 379 149 397 148 362 165 222
Deposits and borrowings from the public 907 184 907 906 0 925 144 911 538 927 254 875 069 860 757 959 840 947 840 870 972 807 480
Debt securities in issue 910 780 876 536 4 911 368 896 625 935 240 911 563 869 786 894 044 892 159 863 424 908 898
Subordinated liabilities 29 026 23 567 23 28 168 31 722 29 897 27 036 24 257 22 807 22 253 24 202 25 067
Interest-bearing liabilities 1 985 747 1 962 807 1 1 995 632 1 992 902 2 044 389 1 933 583 1 910 411 2 044 070 2 011 649 1 906 960 1 906 667
Derivatives 66 422 80 177 -17 51 503 69 040 65 250 76 780 85 826 82 278 81 543 73 308 73 986
Other liabilities 242 505 207 461 17 254 876 225 252 233 375 247 568 206 699 200 917 213 379 207 444 201 347
Total liabilities 2 294 674 2 250 445 2 2 302 011 2 287 194 2 343 014 2 257 931 2 202 936 2 327 265 2 306 571 2 187 712 2 182 000
Equity 127 757 123 485 3 131 402 126 420 121 922 128 536 126 908 121 902 119 502 125 073 120 825
Total liabilities and equity 2 422 431 2 373 930 2 2 433 413 2 413 614 2 464 936 2 386 467 2 329 844 2 449 167 2 426 073 2 312 785 2 302 825
Net interest income analysis, Group FY FY ∆ Q4 Q3 Q2 Q1 Q4 Q3 Q2 Q1 Q4
% 2017 2016 2017 2017 2017 2017 2016 2016 2016 2016 2015
Average interest rates
Loans to credit institutions 0.16 0.07 0.09 0.67 -0.20 0.09 0.01 -0.24 0.06 0.12 0.27 0.35
Loans to the public 1.96 2.01 -0.05 1.94 1.97 1.97 1.96 1.98 1.97 1.99 2.07 2.15
Interest-bearing securities 0.11 0.40 -0.29 0.05 0.10 0.14 0.14 0.28 0.35 0.45 0.58 0.52
Interest-bearing assets 1.74 1.76 -0.02 1.72 1.76 1.77 1.72 1.73 1.72 1.74 1.83 1.89
Amounts owed to credit institutions 0.59 0.17 0.42 0.78 0.64 0.46 0.49 -0.25 0.32 0.33 0.30 0.23
Deposits and borrowings from the public 0.14 0.12 0.02 0.13 0.16 0.15 0.12 0.08 0.12 0.14 0.14 0.09
Debt securities in issue 1.33 1.48 -0.16 1.34 1.33 1.26 1.37 1.46 1.63 1.39 1.44 1.42
Subordinated liabilities 4.11 4.15 -0.04 3.81 3.91 4.16 4.50 4.14 4.12 4.10 4.35 4.31
Interest-bearing liabilities 0.78 0.78 -0.01 0.78 0.78 0.74 0.80 0.73 0.84 0.75 0.79 0.79
Net interest margin 1.04 1.02 0.02 1.07 1.04 1.01 1.05 1.09 1.01 0.99 0.98 1.00
Interest-bearing securities are reported net less sold, not held, securities.Interest income on impaired loans is not accrued.
1) Stability fund until 2015
11

Financial information, GroupIncome analysisQ4, 2017
Income analysis, Group FY FY ∆ % Q4 Q3 Q2 Q1 Q4 Q3 Q2 Q1 Q4
SEKm 2017 2016 Y/Y 2017 2017 2017 2017 2016 2016 2016 2016 2015
Net interest income 24 595 22 850 8 6 326 6 208 6 090 5 971 6 000 5 837 5 552 5 461 5 642
Payment processing 694 743 -7 179 168 167 180 210 175 172 186 193
Card commissions 2 950 2 832 4 756 788 742 664 741 782 656 653 660
Service concepts 737 507 45 252 186 154 145 127 129 127 124 116
Asset management & Custody 4 872 4 245 15 1 396 1 174 1 172 1 130 1 205 1 063 992 985 1 178
Life insurance 471 472 -0 110 118 120 123 115 120 121 116 115
Securities 278 370 -25 89 13 84 92 134 42 74 120 54
Corporate Finance 137 277 -51 26 17 49 45 57 55 147 18 64
Lending and Guarantees 1 109 1 124 -1 279 273 292 265 286 291 280 267 285
Deposits 200 131 53 49 51 51 49 32 33 31 35 19
Real estate brokerage 198 226 -12 45 53 57 43 53 57 70 46 55
Non-Life insurance 57 55 4 19 14 15 9 17 14 13 11 19
Other commission income 327 351 -7 91 62 97 77 78 77 112 84 119
Net commission income 12 030 11 333 6 3 291 2 917 3 000 2 822 3 055 2 838 2 795 2 645 2 877
Financial instruments for trading-related business 1)
2 710 2 694 1 516 516 853 825 343 692 1 128 531 512
Financial instruments intended to hold until maturity -776 -463 68 -160 9 -286 -339 -58 -23 -251 -131 -347
Net gains and losses on financial
items at fair value 1 934 2 231 -13 356 525 567 486 285 669 877 400 165
Net insurance 937 754 24 304 230 207 196 220 174 203 157 193
Sparbanken Skåne/Färs & Frosta Sparbank 61 36 69 17 17 16 11 12 9 11 4 -15
Swedbank Sjuhärad 142 141 1 33 38 39 32 31 38 37 35 28
Other jointly owned banks in Sweden 72 63 14 18 19 19 16 10 18 16 19 12
EnterCard 563 509 11 212 124 139 88 82 120 187 120 123
VISA 2)
98 1 658 -94 48 25 -7 32 -31 31 1 659
Other companies 35 60 -42 19 22 -2 -4 5 23 20 13 7
Share of the profit or loss of associates 971 2 467 -61 347 245 204 175 109 238 1 929 191 155
IT/administrative services to savings banks 894 796 12 231 207 241 215 185 203 221 187 179
Assets taken over 69 35 97 27 25 7 10 5 -4 13 21 21
Other 3)
1 008 355 94 61 77 776 88 85 100 82 108
Other income 1 971 1 186 66 352 293 325 1 001 278 284 334 290 308
Total income 42 438 40 821 4 10 976 10 418 10 393 10 651 9 947 10 040 11 690 9 144 9 340
2) Q2 2016 one-off effect from Visa Inc’s acquisition of Visa Europe, Share of the profit or loss of associates of SEK 1 658m
3) Q1 2017 one-off effect from sale of Hemnet, Other income of SEK 680m
1) Q2 2016 one-off effect from Visa Inc’s acquisition of Visa Europe, Financial instruments held for trading-related business of SEK 457m
12

Financial information, GroupExpense analysisQ4, 2017
Expense analysis, Group FY FY ∆ % Q4 Q3 Q2 Q1 Q4 Q3 Q2 Q1 Q4
SEKm 2017 2016 Y/Y 2017 2017 2017 2017 2016 2016 2016 2016 2015
Staff costs
Salaries and other remunerations 6 176 5 784 7 1 770 1 468 1 465 1 473 1 477 1 417 1 439 1 451 1 422
Variable staff costs 1)
460 627 -27 30 141 117 172 157 177 161 132 97
Pension costs 1)
928 770 21 217 238 236 237 234 184 162 190 246
Social insurance charges 1) 1 938 1 795 8 542 466 465 465 451 451 451 442 415
Training costs 121 117 3 42 23 29 27 39 16 30 32 39
Other staff costs 322 283 14 96 78 74 74 82 70 71 60 72
Total staff costs 2) 9 945 9 376 6 2 697 2 414 2 386 2 448 2 440 2 315 2 314 2 307 2 291
Other expenses
Premises and rents 1 152 1 131 2 309 277 279 287 315 282 266 268 357
IT expenses 1 963 1 834 7 553 444 475 491 524 437 424 449 525
Telecommunications and postage 133 118 13 36 27 30 40 27 21 37 33 38
Advertising, PR and marketing 306 285 7 111 51 74 70 89 62 72 62 132
Consultants 326 314 4 99 67 90 70 76 76 92 70 94
Compensation to Savings Banks 223 236 -6 56 55 56 56 60 58 58 60 60
Other purchased services 777 708 10 237 194 169 177 192 177 175 164 170
Security transport and alarm systems 71 72 -1 21 17 19 14 21 18 17 16 23
Supplies 95 103 -8 36 20 21 18 37 17 26 23 25
Travel 238 226 5 67 45 67 59 74 39 65 48 62
Entertainment 53 51 4 21 10 11 11 18 10 13 10 22
Repair/maintenance of inventories 115 111 4 29 14 41 31 32 25 23 31 39Other expenses 418 433 -3 120 95 107 96 99 100 103 131 127
Total other expenses 5 870 5 622 4 1 695 1 316 1 439 1 420 1 564 1 322 1 371 1 365 1 674
Depreciation/amortisation 600 629 -5 171 153 141 135 153 167 155 154 157 0
Total expenses 16 415 15 627 5 4 563 3 883 3 966 4 003 4 157 3 804 3 840 3 826 4 122
IT-related expensesQ4, 2017
FY FY ∆ % Q4 Q3 Q2 Q1 Q4 Q3 Q2 Q1 Q4
SEKm 2017 2016 Y/Y 2017 2017 2017 2017 2016 2016 2016 2016 2015
IT expenses
Software incl. licenses 619 545 14 188 148 136 147 142 146 128 129 166
IT-consultants 412 372 11 93 89 112 118 108 75 99 90 106
IT expenses externally bought by business areas 600 614 -2 181 125 138 155 192 149 122 151 165
Other externally bought IT-services 332 303 10 90 82 89 71 82 67 75 79 87
Total IT expenses 1 963 1 834 7 553 444 475 491 524 437 424 449 525
Other IT-related expenses
Staff costs (Swedbank's internal IT-organisation) 2)
959 972 -1 253 235 237 234 245 245 238 244 218
Leasing and depreciation of IT-equipment 139 143 -3 39 37 33 30 30 36 39 38 38
Other IT-related expenses 304 165 84 90 73 87 54 19 56 38 52 78
Total other IT-related expenses 1 402 1 280 10 382 345 357 318 294 337 315 334 334
Total IT- and IT-related expenses 3 365 3 114 8 935 789 832 809 818 774 739 783 859
Capitalised IT-related expenses 763 424 80 226 198 231 108 138 86 111 89 82
1) Social insurance charges and pension costs related to variable pay are presented as variable staff costs.
2) IT-related staff costs outside the internal IT organisation are not included.
13
Financial information, Group
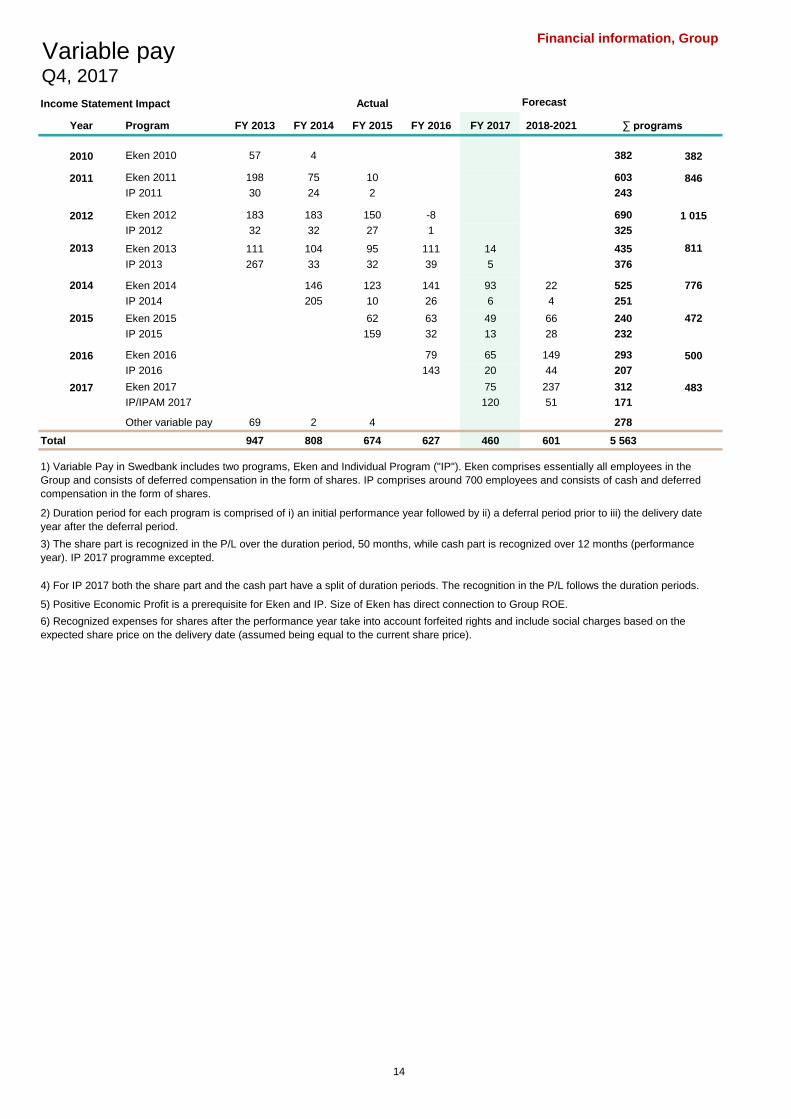
Variable payQ4, 2017
Income Statement Impact Forecast
Year Program FY 2013 FY 2014 FY 2015 FY 2016 FY 2017 2018-2021
2010 Eken 2010 57 4 382 382
2011 Eken 2011 198 75 10 603 846
IP 2011 30 24 2 243
2012 Eken 2012 183 183 150 -8 690 1 015
IP 2012 32 32 27 1 325
2013 Eken 2013 111 104 95 111 14 435 811
IP 2013 267 33 32 39 5 376
2014 Eken 2014 146 123 141 93 22 525 776
IP 2014 205 10 26 6 4 251
2015 Eken 2015 62 63 49 66 240 472
IP 2015 159 32 13 28 232
2016 Eken 2016 79 65 149 293 500
IP 2016 143 20 44 207
2017 Eken 2017 75 237 312 483
IP/IPAM 2017 120 51 171
Other variable pay 69 2 4 278
Total 947 808 674 627 460 601 5 563
Actual
∑ programs
2) Duration period for each program is comprised of i) an initial performance year followed by ii) a deferral period prior to iii) the delivery date
year after the deferral period.
5) Positive Economic Profit is a prerequisite for Eken and IP. Size of Eken has direct connection to Group ROE.
6) Recognized expenses for shares after the performance year take into account forfeited rights and include social charges based on the
expected share price on the delivery date (assumed being equal to the current share price).
1) Variable Pay in Swedbank includes two programs, Eken and Individual Program ("IP"). Eken comprises essentially all employees in the
Group and consists of deferred compensation in the form of shares. IP comprises around 700 employees and consists of cash and deferred
compensation in the form of shares.
3) The share part is recognized in the P/L over the duration period, 50 months, while cash part is recognized over 12 months (performance
year). IP 2017 programme excepted.
4) For IP 2017 both the share part and the cash part have a split of duration periods. The recognition in the P/L follows the duration periods.
14
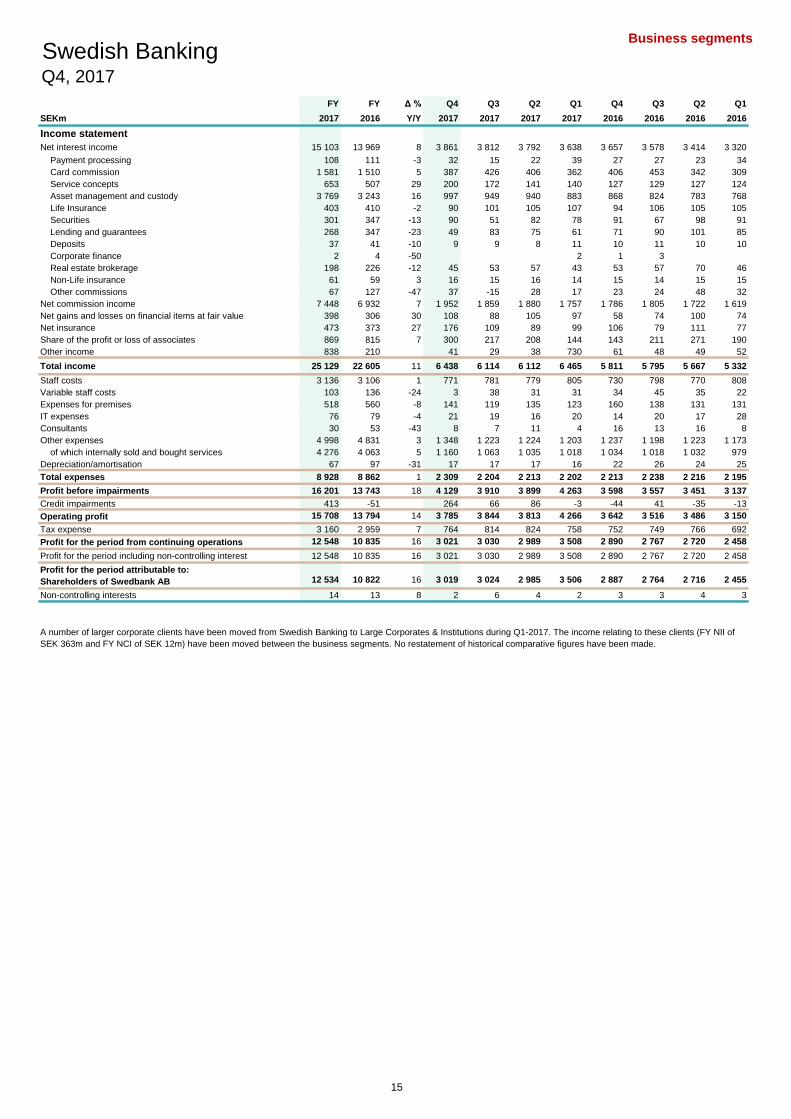
Business segments
FY FY Δ % Q4 Q3 Q2 Q1 Q4 Q3 Q2 Q1
SEKm 2017 2016 Y/Y 2017 2017 2017 2017 2016 2016 2016 2016
Income statement
Net interest income 15 103 13 969 8 3 861 3 812 3 792 3 638 3 657 3 578 3 414 3 320
Payment processing 108 111 -3 32 15 22 39 27 27 23 34
Card commission 1 581 1 510 5 387 426 406 362 406 453 342 309
Service concepts 653 507 29 200 172 141 140 127 129 127 124
Asset management and custody 3 769 3 243 16 997 949 940 883 868 824 783 768
Life Insurance 403 410 -2 90 101 105 107 94 106 105 105
Securities 301 347 -13 90 51 82 78 91 67 98 91
Lending and guarantees 268 347 -23 49 83 75 61 71 90 101 85
Deposits 37 41 -10 9 9 8 11 10 11 10 10
Corporate finance 2 4 -50 2 1 3
Real estate brokerage 198 226 -12 45 53 57 43 53 57 70 46
Non-Life insurance 61 59 3 16 15 16 14 15 14 15 15
Other commissions 67 127 -47 37 -15 28 17 23 24 48 32
Net commission income 7 448 6 932 7 1 952 1 859 1 880 1 757 1 786 1 805 1 722 1 619
Net gains and losses on financial items at fair value 398 306 30 108 88 105 97 58 74 100 74
Net insurance 473 373 27 176 109 89 99 106 79 111 77
Share of the profit or loss of associates 869 815 7 300 217 208 144 143 211 271 190
Other income 838 210 41 29 38 730 61 48 49 52
Total income 25 129 22 605 11 6 438 6 114 6 112 6 465 5 811 5 795 5 667 5 332
Staff costs 3 136 3 106 1 771 781 779 805 730 798 770 808
Variable staff costs 103 136 -24 3 38 31 31 34 45 35 22
Expenses for premises 518 560 -8 141 119 135 123 160 138 131 131
IT expenses 76 79 -4 21 19 16 20 14 20 17 28
Consultants 30 53 -43 8 7 11 4 16 13 16 8
Other expenses 4 998 4 831 3 1 348 1 223 1 224 1 203 1 237 1 198 1 223 1 173
of which internally sold and bought services 4 276 4 063 5 1 160 1 063 1 035 1 018 1 034 1 018 1 032 979
Depreciation/amortisation 67 97 -31 17 17 17 16 22 26 24 25
Total expenses 8 928 8 862 1 2 309 2 204 2 213 2 202 2 213 2 238 2 216 2 195
Profit before impairments 16 201 13 743 18 4 129 3 910 3 899 4 263 3 598 3 557 3 451 3 137
Credit impairments 413 -51 264 66 86 -3 -44 41 -35 -13
Operating profit 15 708 13 794 14 3 785 3 844 3 813 4 266 3 642 3 516 3 486 3 150
Tax expense 3 160 2 959 7 764 814 824 758 752 749 766 692
Profit for the period from continuing operations 12 548 10 835 16 3 021 3 030 2 989 3 508 2 890 2 767 2 720 2 458
Profit for the period including non-controlling interest 12 548 10 835 16 3 021 3 030 2 989 3 508 2 890 2 767 2 720 2 458
Profit for the period attributable to:
Shareholders of Swedbank AB 12 534 10 822 16 3 019 3 024 2 985 3 506 2 887 2 764 2 716 2 455
Non-controlling interests 14 13 8 2 6 4 2 3 3 4 3
Swedish BankingQ4, 2017
A number of larger corporate clients have been moved from Swedish Banking to Large Corporates & Institutions during Q1-2017. The income relating to these clients (FY NII of
SEK 363m and FY NCI of SEK 12m) have been moved between the business segments. No restatement of historical comparative figures have been made.
15
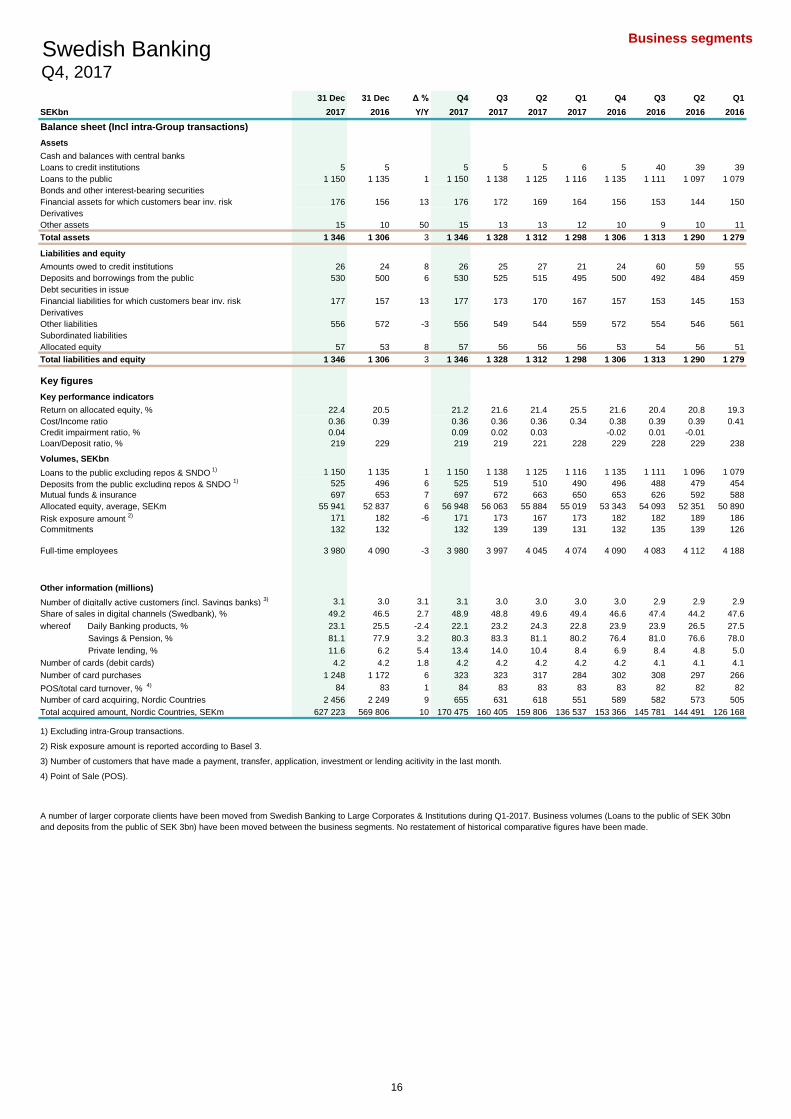
Business segments
31 Dec 31 Dec Δ % Q4 Q3 Q2 Q1 Q4 Q3 Q2 Q1
SEKbn 2017 2016 Y/Y 2017 2017 2017 2017 2016 2016 2016 2016
Balance sheet (Incl intra-Group transactions)
Assets
Cash and balances with central banks
Loans to credit institutions 5 5 0 5 5 5 6 5 40 39 39
Loans to the public 1 150 1 135 1 1 150 1 138 1 125 1 116 1 135 1 111 1 097 1 079
Bonds and other interest-bearing securities
Financial assets for which customers bear inv. risk 176 156 13 176 172 169 164 156 153 144 150
Derivatives
Other assets 15 10 50 15 13 13 12 10 9 10 11
Total assets 1 346 1 306 3 1 346 1 328 1 312 1 298 1 306 1 313 1 290 1 279
Liabilities and equity
Amounts owed to credit institutions 26 24 8 26 25 27 21 24 60 59 55
Deposits and borrowings from the public 530 500 6 530 525 515 495 500 492 484 459
Debt securities in issue
Financial liabilities for which customers bear inv. risk 177 157 13 177 173 170 167 157 153 145 153
Derivatives
Other liabilities 556 572 -3 556 549 544 559 572 554 546 561
Subordinated liabilities
Allocated equity 57 53 8 57 56 56 56 53 54 56 51
Total liabilities and equity 1 346 1 306 3 1 346 1 328 1 312 1 298 1 306 1 313 1 290 1 279
Key figures
Key performance indicators
Return on allocated equity, % 22.4 20.5 21.2 21.6 21.4 25.5 21.6 20.4 20.8 19.3
Cost/Income ratio 0.36 0.39 0.36 0.36 0.36 0.34 0.38 0.39 0.39 0.41
Credit impairment ratio, % 0.04 0.09 0.02 0.03 -0.02 0.01 -0.01
Loan/Deposit ratio, % 219 229 219 219 221 228 229 228 229 238
Volumes, SEKbn
Loans to the public excluding repos & SNDO 1) 1 150 1 135 1 1 150 1 138 1 125 1 116 1 135 1 111 1 096 1 079
Deposits from the public excluding repos & SNDO 1) 525 496 6 525 519 510 490 496 488 479 454
Mutual funds & insurance 697 653 7 697 672 663 650 653 626 592 588
Allocated equity, average, SEKm 55 941 52 837 6 56 948 56 063 55 884 55 019 53 343 54 093 52 351 50 890
Risk exposure amount 2) 171 182 -6 171 173 167 173 182 182 189 186
Commitments 132 132 0 132 139 139 131 132 135 139 126
Full-time employees 3 980 4 090 -3 3 980 3 997 4 045 4 074 4 090 4 083 4 112 4 188
Other information (millions)
Number of digitally active customers (incl. Savings banks) 3) 3.1 3.0 3.1 3.1 3.0 3.0 3.0 3.0 2.9 2.9 2.9
Share of sales in digital channels (Swedbank), % 49.2 46.5 2.7 48.9 48.8 49.6 49.4 46.6 47.4 44.2 47.6
whereof Daily Banking products, % 23.1 25.5 -2.4 22.1 23.2 24.3 22.8 23.9 23.9 26.5 27.5
Savings & Pension, % 81.1 77.9 3.2 80.3 83.3 81.1 80.2 76.4 81.0 76.6 78.0
Private lending, % 11.6 6.2 5.4 13.4 14.0 10.4 8.4 6.9 8.4 4.8 5.0
Number of cards (debit cards) 4.2 4.2 1.8 4.2 4.2 4.2 4.2 4.2 4.1 4.1 4.1
Number of card purchases 1 248 1 172 6 323 323 317 284 302 308 297 266
POS/total card turnover, % 4) 84 83 1 84 83 83 83 83 82 82 82
Number of card acquiring, Nordic Countries 2 456 2 249 9 655 631 618 551 589 582 573 505
Total acquired amount, Nordic Countries, SEKm 627 223 569 806 10 170 475 160 405 159 806 136 537 153 366 145 781 144 491 126 168
1) Excluding intra-Group transactions.
2) Risk exposure amount is reported according to Basel 3.
3) Number of customers that have made a payment, transfer, application, investment or lending acitivity in the last month.
4) Point of Sale (POS).
Swedish BankingQ4, 2017
A number of larger corporate clients have been moved from Swedish Banking to Large Corporates & Institutions during Q1-2017. Business volumes (Loans to the public of SEK 30bn
and deposits from the public of SEK 3bn) have been moved between the business segments. No restatement of historical comparative figures have been made.
16
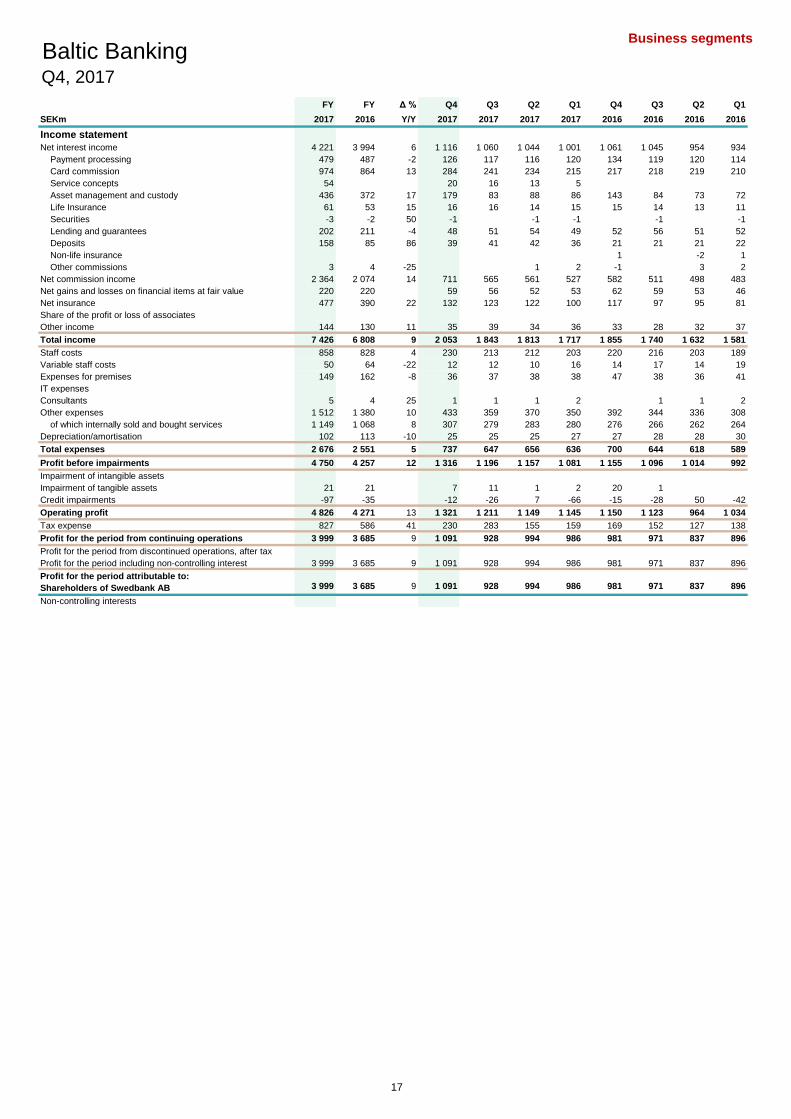
Business segments
FY FY Δ % Q4 Q3 Q2 Q1 Q4 Q3 Q2 Q1
SEKm 2017 2016 Y/Y 2017 2017 2017 2017 2016 2016 2016 2016
Income statement
Net interest income 4 221 3 994 6 1 116 1 060 1 044 1 001 1 061 1 045 954 934
Payment processing 479 487 -2 126 117 116 120 134 119 120 114
Card commission 974 864 13 284 241 234 215 217 218 219 210
Service concepts 54 20 16 13 5
Asset management and custody 436 372 17 179 83 88 86 143 84 73 72
Life Insurance 61 53 15 16 16 14 15 15 14 13 11
Securities -3 -2 50 -1 -1 -1 -1 -1
Lending and guarantees 202 211 -4 48 51 54 49 52 56 51 52
Deposits 158 85 86 39 41 42 36 21 21 21 22
Non-life insurance 1 -2 1
Other commissions 3 4 -25 1 2 -1 3 2
Net commission income 2 364 2 074 14 711 565 561 527 582 511 498 483
Net gains and losses on financial items at fair value 220 220 59 56 52 53 62 59 53 46
Net insurance 477 390 22 132 123 122 100 117 97 95 81
Share of the profit or loss of associates
Other income 144 130 11 35 39 34 36 33 28 32 37
Total income 7 426 6 808 9 2 053 1 843 1 813 1 717 1 855 1 740 1 632 1 581
Staff costs 858 828 4 230 213 212 203 220 216 203 189
Variable staff costs 50 64 -22 12 12 10 16 14 17 14 19
Expenses for premises 149 162 -8 36 37 38 38 47 38 36 41
IT expenses
Consultants 5 4 25 1 1 1 2 1 1 2
Other expenses 1 512 1 380 10 433 359 370 350 392 344 336 308
of which internally sold and bought services 1 149 1 068 8 307 279 283 280 276 266 262 264
Depreciation/amortisation 102 113 -10 25 25 25 27 27 28 28 30
Total expenses 2 676 2 551 5 737 647 656 636 700 644 618 589
Profit before impairments 4 750 4 257 12 1 316 1 196 1 157 1 081 1 155 1 096 1 014 992
Impairment of intangible assets
Impairment of tangible assets 21 21 7 11 1 2 20 1
Credit impairments -97 -35 -12 -26 7 -66 -15 -28 50 -42
Operating profit 4 826 4 271 13 1 321 1 211 1 149 1 145 1 150 1 123 964 1 034
Tax expense 827 586 41 230 283 155 159 169 152 127 138
Profit for the period from continuing operations 3 999 3 685 9 1 091 928 994 986 981 971 837 896
Profit for the period from discontinued operations, after tax
Profit for the period including non-controlling interest 3 999 3 685 9 1 091 928 994 986 981 971 837 896
Profit for the period attributable to:
Shareholders of Swedbank AB 3 999 3 685 9 1 091 928 994 986 981 971 837 896
Non-controlling interests
Baltic BankingQ4, 2017
17
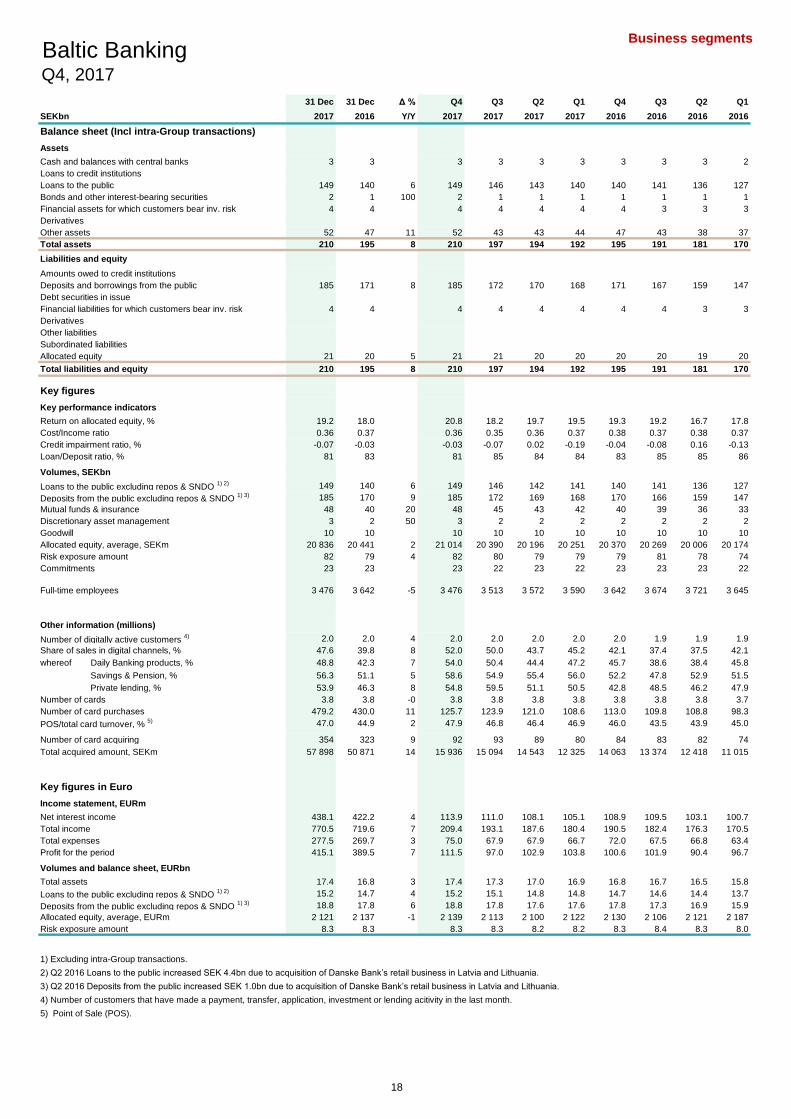
Business segments
31 Dec 31 Dec Δ % Q4 Q3 Q2 Q1 Q4 Q3 Q2 Q1
SEKbn 2017 2016 Y/Y 2017 2017 2017 2017 2016 2016 2016 2016
Balance sheet (Incl intra-Group transactions)
Assets
Cash and balances with central banks 3 3 3 3 3 3 3 3 3 2
Loans to credit institutions
Loans to the public 149 140 6 149 146 143 140 140 141 136 127
Bonds and other interest-bearing securities 2 1 100 2 1 1 1 1 1 1 1
Financial assets for which customers bear inv. risk 4 4 4 4 4 4 4 3 3 3
Derivatives
Other assets 52 47 11 52 43 43 44 47 43 38 37
Total assets 210 195 8 210 197 194 192 195 191 181 170
Liabilities and equity
Amounts owed to credit institutions
Deposits and borrowings from the public 185 171 8 185 172 170 168 171 167 159 147
Debt securities in issue
Financial liabilities for which customers bear inv. risk 4 4 4 4 4 4 4 4 3 3
Derivatives
Other liabilities
Subordinated liabilities
Allocated equity 21 20 5 21 21 20 20 20 20 19 20
Total liabilities and equity 210 195 8 210 197 194 192 195 191 181 170
Key figures
Key performance indicators
Return on allocated equity, % 19.2 18.0 20.8 18.2 19.7 19.5 19.3 19.2 16.7 17.8
Cost/Income ratio 0.36 0.37 0.36 0.35 0.36 0.37 0.38 0.37 0.38 0.37
Credit impairment ratio, % -0.07 -0.03 -0.03 -0.07 0.02 -0.19 -0.04 -0.08 0.16 -0.13
Loan/Deposit ratio, % 81 83 81 85 84 84 83 85 85 86
Volumes, SEKbn
Loans to the public excluding repos & SNDO 1) 2) 149 140 6 149 146 142 141 140 141 136 127
Deposits from the public excluding repos & SNDO 1) 3) 185 170 9 185 172 169 168 170 166 159 147
Mutual funds & insurance 48 40 20 48 45 43 42 40 39 36 33
Discretionary asset management 3 2 50 3 2 2 2 2 2 2 2
Goodwill 10 10 10 10 10 10 10 10 10 10
Allocated equity, average, SEKm 20 836 20 441 2 21 014 20 390 20 196 20 251 20 370 20 269 20 006 20 174
Risk exposure amount 82 79 4 82 80 79 79 79 81 78 74
Commitments 23 23 23 22 23 22 23 23 23 22
Full-time employees 3 476 3 642 -5 3 476 3 513 3 572 3 590 3 642 3 674 3 721 3 645
Other information (millions)
Number of digitally active customers 4) 2.0 2.0 4 2.0 2.0 2.0 2.0 2.0 1.9 1.9 1.9
Share of sales in digital channels, % 47.6 39.8 8 52.0 50.0 43.7 45.2 42.1 37.4 37.5 42.1
whereof Daily Banking products, % 48.8 42.3 7 54.0 50.4 44.4 47.2 45.7 38.6 38.4 45.8
Savings & Pension, % 56.3 51.1 5 58.6 54.9 55.4 56.0 52.2 47.8 52.9 51.5
Private lending, % 53.9 46.3 8 54.8 59.5 51.1 50.5 42.8 48.5 46.2 47.9
Number of cards 3.8 3.8 -0 3.8 3.8 3.8 3.8 3.8 3.8 3.8 3.7
Number of card purchases 479.2 430.0 11 125.7 123.9 121.0 108.6 113.0 109.8 108.8 98.3
POS/total card turnover, % 5) 47.0 44.9 2 47.9 46.8 46.4 46.9 46.0 43.5 43.9 45.0
Number of card acquiring 354 323 9 92 93 89 80 84 83 82 74
Total acquired amount, SEKm 57 898 50 871 14 15 936 15 094 14 543 12 325 14 063 13 374 12 418 11 015
Key figures in Euro
Income statement, EURm
Net interest income 438.1 422.2 4 113.9 111.0 108.1 105.1 108.9 109.5 103.1 100.7
Total income 770.5 719.6 7 209.4 193.1 187.6 180.4 190.5 182.4 176.3 170.5
Total expenses 277.5 269.7 3 75.0 67.9 67.9 66.7 72.0 67.5 66.8 63.4
Profit for the period 415.1 389.5 7 111.5 97.0 102.9 103.8 100.6 101.9 90.4 96.7
Volumes and balance sheet, EURbn
Total assets 17.4 16.8 3 17.4 17.3 17.0 16.9 16.8 16.7 16.5 15.8
Loans to the public excluding repos & SNDO 1) 2) 15.2 14.7 4 15.2 15.1 14.8 14.8 14.7 14.6 14.4 13.7
Deposits from the public excluding repos & SNDO 1) 3) 18.8 17.8 6 18.8 17.8 17.6 17.6 17.8 17.3 16.9 15.9
Allocated equity, average, EURm 2 121 2 137 -1 2 139 2 113 2 100 2 122 2 130 2 106 2 121 2 187
Risk exposure amount 8.3 8.3 0 8.3 8.3 8.2 8.2 8.3 8.4 8.3 8.0
1) Excluding intra-Group transactions.
2) Q2 2016 Loans to the public increased SEK 4.4bn due to acquisition of Danske Bank’s retail business in Latvia and Lithuania.
3) Q2 2016 Deposits from the public increased SEK 1.0bn due to acquisition of Danske Bank’s retail business in Latvia and Lithuania.
4) Number of customers that have made a payment, transfer, application, investment or lending acitivity in the last month.
5) Point of Sale (POS).
Baltic BankingQ4, 2017
18

Business segments
FY FY Δ % Q4 Q3 Q2 Q1 Q4 Q3 Q2 Q1
SEKm 2017 2016 Y/Y 2017 2017 2017 2017 2016 2016 2016 2016
Income statement
Net interest income 1 917 1 898 1 507 476 476 458 500 491 457 450
Payment processing 147 131 12 41 36 35 35 37 32 32 30
Card commission 350 324 8 104 85 86 75 80 80 84 80
Service concepts
Asset management and custody 143 128 12 39 34 35 35 34 33 31 30
Life Insurance 21 18 17 6 5 5 5 4 5 5 4
Securities -2 -3 -33 -1 -1 -1 -1 -1
Lending and guarantees 83 84 -1 19 21 22 21 20 24 19 21
Deposits 21 23 -9 4 5 6 6 6 5 6 6
Non-life insurance
Other commissions -3 -4 -25 -1 -1 -1 -1 -1 -1 -1
Net commission income 760 701 8 212 184 188 176 179 177 176 169
Net gains and losses on financial items at fair value 74 67 10 19 19 15 21 17 18 15 17
Net insurance 253 207 22 71 65 65 52 68 47 54 38
Share of the profit or loss of associates
Other income 50 49 2 10 13 15 12 19 11 9 10
Total income 3 054 2 922 5 819 757 759 719 783 744 711 684
Staff costs 308 298 3 80 74 80 74 79 75 75 69
Variable staff costs 20 21 -5 5 4 5 6 4 6 5 6
Expenses for premises 66 76 -13 15 17 17 17 21 17 18 20
IT expenses
Consultants 3 2 50 1 1 1 1 1
Other expenses 601 562 7 168 146 148 139 152 141 140 129
of which internally sold and bought services 484 451 7 127 118 119 120 118 112 114 107
Depreciation/amortisation 19 21 -10 5 4 5 5 5 5 6 5
Total expenses 1 017 980 4 274 245 256 242 262 244 245 229
Profit before impairments 2 037 1 942 5 545 512 503 477 521 500 466 455
Impairment of intangible assets
Impairment of tangible assets 2 2
Credit impairments -31 51 -15 -16 10 -10 20 -1 57 -25
Operating profit 2 068 1 889 9 560 528 493 487 499 501 409 480
Tax expense 428 235 82 120 184 61 63 67 63 47 58
Profit for the period from continuing operations 1 640 1 654 -1 440 344 432 424 432 438 362 422
Profit for the period from discontinued operations, after tax
Profit for the period including non-controlling interest 1 640 1 654 -1 440 344 432 424 432 438 362 422
Profit for the period attributable to:
Shareholders of Swedbank AB 1 640 1 654 -1 440 344 432 424 432 438 362 422
Non-controlling interests
Key figures
Key performance indicators
Return on allocated equity, % 19.1 19.7 20.2 16.4 20.8 20.4 20.8 21.1 17.5 20.4
Cost/Income ratio 0.33 0.34 0.33 0.32 0.34 0.34 0.33 0.33 0.34 0.33
Credit impairment ratio, % -0.05 0.08 -0.09 -0.09 0.06 -0.06 0.12 -0.01 0.38 -0.17
Loan/Deposit ratio, % 94 93 94 93 93 92 93 93 94 95
Volumes, SEKbn
Loans to the public excluding repos & SNDO 1) 71 65 9 71 68 66 66 65 66 63 60
Deposits from the public excluding repos & SNDO 1) 76 71 7 76 73 71 71 71 69 67 63
Mutual funds & insurance 20 17 18 20 19 18 17 17 17 15 14
Discretionary asset management 3 2 50 3 2 2 2 2 2 2 2
Goodwill 4 4 4 4 4 4 4 4 4 4
Allocated equity, average, SEKm 8 588 8 384 2 8 713 8 398 8 311 8 296 8 325 8 293 8 262 8 294
Risk exposure amount 35 33 6 35 34 33 34 33 35 33 31
Commitments 8 10 -20 8 8 9 10 10 10 10 10
Full-time employees 1 192 1 272 -6 1 192 1 209 1 285 1 269 1 272 1 272 1 303 1 266
Other information (millions)
Number of digitally active customers 2) 0.6 0.6 3 0.6 0.6 0.6 0.6 0.6 0.6 0.6 0.6
Share of sales in digital channels, % 45.6 43.3 2 46.5 46.4 44.6 44.9 44.9 42.5 41.0 45.0
whereof Daily Banking products, % 46.5 47.4 -1 48.0 45.1 44.6 48.2 49.2 45.6 44.4 50.2
Savings & Pension, % 52.3 50.5 2 53.5 53.4 53.1 49.8 52.1 48.5 49.0 52.4
Private lending, % 60.5 54.5 6 63.2 62.3 59.5 57.1 55.2 54.4 54.7 53.5
Number of cards 1.1 1.1 1 1.1 1.1 1.1 1.1 1.1 1.1 1.1 1.1
Number of card purchases 196.3 181.3 8 50.9 50.7 49.8 44.9 46.9 46.5 46.1 41.8
POS/total card turnover, % 3) 59.5 57.8 2 60.2 58.9 59.3 59.7 59.0 56.0 56.6 58.0
Number of card acquiring 187.8 177.7 6 47.9 49.1 47.7 43.0 45.0 45.9 45.3 41.5
Total acquired amount, SEKm 31 471 28 712 10 8 440 8 165 8 012 6 854 7 780 7 552 7 136 6 244
1) Excluding intra-Group transactions.
2) Number of customers that have made a payment, transfer, application, investment or lending acitivity in the last month.
3) Point of Sale (POS).
EstoniaQ4, 2017
19

Business segments
FY FY Δ % Q4 Q3 Q2 Q1 Q4 Q3 Q2 Q1
SEKm 2017 2016 Y/Y 2017 2017 2017 2017 2016 2016 2016 2016
Income statement
Net interest income 1 083 1 035 5 285 276 265 257 265 273 252 245
Payment processing 150 135 11 41 37 35 37 35 34 33 33
Card commission 304 255 19 90 76 71 67 59 60 67 69
Service concepts
Asset management and custody 205 169 21 116 28 30 31 88 30 24 27
Life Insurance 13 9 44 4 3 3 3 2 3 2 2
Securities
Lending and guarantees 59 61 -3 14 15 17 13 15 17 14 15
Deposits 46 42 10 12 13 10 11 10 11 10 11
Non-life insurance
Other commissions 7 6 17 1 2 2 2 1 1 2 2
Net commission income 784 677 16 278 174 168 164 210 156 152 159
Net gains and losses on financial items at fair value 70 81 -14 19 17 17 17 24 20 20 17
Net insurance 67 66 2 19 18 14 16 17 18 15 16
Share of the profit or loss of associates
Other income 51 38 34 11 19 9 12 6 6 4 22
Total income 2 055 1 897 8 612 504 473 466 522 473 443 459
Staff costs 227 225 1 59 58 55 55 55 61 56 53
Variable staff costs 11 20 -45 3 3 5 4 5 5 6
Expenses for premises 39 40 -3 9 10 10 10 11 10 9 10
IT expenses
Consultants 1 1 1 1
Other expenses 466 423 10 135 111 111 109 124 105 98 96
of which internally sold and bought services 349 318 10 94 86 84 85 82 80 78 78
Depreciation/amortisation 33 35 -6 8 8 8 9 9 9 8 9
Total expenses 777 744 4 214 190 185 188 203 190 176 175
Profit before impairments 1 278 1 153 11 398 314 288 278 319 283 267 284
Impairment of intangible assets
Impairment of tangible assets 18 12 50 4 11 1 2 11 1
Credit impairments -21 -10 8 -4 2 -27 -2 8 2 -18
Operating profit 1 281 1 151 11 386 307 285 303 310 274 265 302
Tax expense 191 170 12 58 46 42 45 47 41 39 43
Profit for the period from continuing operations 1 090 981 11 328 261 243 258 263 233 226 259
Profit for the period from discontinued operations, after tax
Profit for the period including non-controlling interest 1 090 981 11 328 261 243 258 263 233 226 259
Profit for the period attributable to:
Shareholders of Swedbank AB 1 090 981 11 328 261 243 258 263 233 226 259
Non-controlling interests
Key figures
Key performance indicators
Return on allocated equity, % 20.3 18.2 24.5 19.8 18.7 19.7 19.7 17.5 17.1 19.4
Cost/Income ratio 0.38 0.39 0.35 0.38 0.39 0.40 0.39 0.40 0.40 0.38
Credit impairment ratio, % -0.07 -0.03 0.10 -0.05 0.02 -0.35 -0.02 0.10 0.03 -0.24
Loan/Deposit ratio, % 76 77 76 81 79 80 77 77 80 82
Volumes, SEKbn
Loans to the public excluding repos & SNDO 1) 2) 32 31 3 32 32 32 31 31 31 31 29
Deposits from the public excluding repos & SNDO 1) 3) 42 40 5 42 40 40 39 40 41 39 35
Mutual funds & insurance 15 12 25 15 14 13 13 12 12 11 10
Discretionary asset management
Goodwill 2 2 2 2 2 2 2 2 2 2
Allocated equity, average, SEKm 5 364 5 390 -0 5 360 5 272 5 210 5 242 5 338 5 336 5 278 5 346
Risk exposure amount 23 23 23 23 23 22 23 23 23 22
Commitments 5 5 5 5 5 5 5 5 5 4
Full-time employees 962 1 025 -6 962 983 954 996 1 025 1 032 1 045 1 047
Other information (millions)
Number of digitally active customers 4) 0.7 0.7 2 0.7 0.7 0.7 0.7 0.7 0.6 0.6 0.6
Share of sales in digital channels, % 43.2 36.4 7 47.8 40.9 38.7 44.8 36.9 32.1 38.3 38.6
whereof Daily Banking products, % 40.9 37.1 4 44.3 36.2 38.5 44.3 39.1 32.1 36.1 41.5
Savings & Pension, % 42.2 39.6 3 43.4 25.5 30.1 55.2 33.4 31.0 51.3 39.9
Private lending, % 58.2 57.1 1 60.2 59.9 55.3 57.7 56.0 54.6 58.7 59.8
Number of cards 1.0 1.0 1 1.0 1.0 1.0 1.0 1.0 1.0 1.0 1.0
Number of card purchases 146.3 130.5 12 38.5 38.1 36.7 33.0 34.4 33.1 33.0 30.0
POS/total card turnover, % 5) 47.2 44.3 3 48.5 46.9 46.3 46.9 45.6 42.6 43.5 44.5
Number of card acquiring 81.5 70.7 15 21.7 21.4 20.3 18.0 19.4 18.3 17.4 15.5
Total acquired amount, SEKm 12 503 10 612 18 3 548 3 303 3 071 2 581 3 060 2 790 2 502 2 259
1) Excluding intra-Group transactions.
2) Q2 2016 Loans to the public increased SEK 0.7bn due to acquisition of Danske Bank’s retail business in Latvia.
3) Q2 2016 Deposits from the public increased SEK 0.1bn due to acquisition of Danske Bank’s retail business in Latvia.
4) Number of customers that have made a payment, transfer, application, investment or lending acitivity in the last month.
5) Point of Sale (POS).
LatviaQ4, 2017
20

Business segments
FY FY Δ % Q4 Q3 Q2 Q1 Q4 Q3 Q2 Q1
SEKm 2017 2016 Y/Y 2017 2017 2017 2017 2016 2016 2016 2016
Income statement
Net interest income 1 222 1 066 15 324 309 303 286 298 280 246 242
Payment processing 182 220 -17 45 42 47 48 62 52 56 50
Card commission 320 286 12 90 81 76 73 78 79 68 61
Service concepts 54 20 16 13 5
Asset management and custody 88 75 17 23 22 22 21 21 21 17 16
Life Insurance 28 25 12 7 7 7 7 7 7 7 4
Securities -1 -1 1 -1
Lending and guarantees 59 66 -11 14 14 16 15 17 15 18 16
Deposits 91 20 23 24 25 19 5 5 5 5
Non-life insurance 1 -2 1
Other commissions -1 3 -1 1 1 1
Net commission income 820 695 18 221 206 206 187 192 179 170 154
Net gains and losses on financial items at fair value 76 73 4 21 21 18 16 22 21 18 12
Net insurance 157 118 33 41 40 44 32 33 31 27 27
Share of the profit or loss of associates
Other income 38 37 3 12 8 8 10 6 10 16 5
Total income 2 313 1 989 16 619 584 579 531 551 521 477 440
Staff costs 245 236 4 68 62 59 56 66 63 55 52
Variable staff costs 15 17 -12 3 4 4 4 4 4 4 5
Expenses for premises 38 42 -10 9 10 9 10 14 10 8 10
IT expenses
Consultants 1 1 1 1
Other expenses 526 470 12 154 122 130 120 137 117 115 101
of which internally sold and bought services 402 378 6 112 96 100 94 99 92 90 97
Depreciation/amortisation 26 28 -7 6 7 7 6 7 7 7 7
Total expenses 851 794 7 240 205 209 197 228 201 189 176
Profit before impairments 1 462 1 195 22 379 379 370 334 323 320 288 264
Impairment of intangible assets
Impairment of tangible assets 2 7 -71 2 7
Credit impairments -45 -76 -41 -5 -6 -5 -29 -33 -35 -9 1
Operating profit 1 505 1 264 19 382 385 375 363 349 355 297 263
Tax expense 209 181 15 52 54 52 51 54 50 40 37
Profit for the period from continuing operations 1 296 1 083 20 330 331 323 312 295 305 257 226
Profit for the period from discontinued operations, after tax
Profit for the period including non-controlling interest 1 296 1 083 20 330 331 323 312 295 305 257 226
Profit for the period attributable to:
Shareholders of Swedbank AB 1 296 1 083 20 330 331 323 312 295 305 257 226
Non-controlling interests
Key figures
Key performance indicators
Return on allocated equity, % 18.8 16.2 19.0 19.7 19.4 18.6 17.6 18.4 15.9 13.8
Cost/Income ratio 0.37 0.40 0.39 0.35 0.36 0.37 0.41 0.39 0.40 0.40
Credit impairment ratio, % -0.10 -0.20 -0.05 -0.06 -0.04 -0.26 -0.29 -0.32 -0.10 0.01
Loan/Deposit ratio, % 69 74 69 77 76 76 74 80 79 77
Volumes, SEKbn
Loans to the public excluding repos & SNDO 1) 2) 46 44 5 46 46 44 44 44 44 42 38
Deposits from the public excluding repos & SNDO 1) 3) 67 59 14 67 59 58 58 59 56 53 49
Mutual funds & insurance 13 11 18 13 12 12 12 11 10 10 9
Discretionary asset management
Goodwill 4 4 4 4 4 4 4 4 4 4
Allocated equity, average, SEKm 6 884 6 667 3 6 941 6 720 6 675 6 713 6 707 6 640 6 466 6 534
Risk exposure amount 24 23 4 24 23 23 23 23 23 22 21
Commitments 10 8 25 10 9 9 7 8 8 8 8
Full-time employees 1 146 1 184 -3 1 146 1 151 1 174 1 166 1 184 1 213 1 221 1 199
Other information (millions)
Number of digitally active customers 4) 0.7 0.7 7 0.7 0.7 0.7 0.7 0.7 0.7 0.7 0.7
Share of sales in digital channels, % 50.8 39.1 12 58.6 57.7 45.4 45.4 42.6 36.5 34.2 41.9
whereof Daily Banking products, % 52.7 41.9 11 62.1 59.7 46.5 47.6 46.3 37.6 35.9 45.3
Savings & Pension, % 69.1 58.5 11 70.9 73.4 69.9 62.8 61.4 56.7 57.3 58.6
Private lending, % 42.0 31.4 11 41.1 54.8 37.2 36.9 23.4 35.4 31.4 36.8
Number of cards 1.7 1.7 -2 1.7 1.7 1.7 1.7 1.7 1.7 1.7 1.6
Number of card purchases 136.6 118.1 16 36.3 35.1 34.6 30.7 31.8 30.2 29.7 26.5
POS/total card turnover, % 5) 36.1 33.6 2 36.9 36.1 35.5 35.7 34.8 32.8 32.5 33.3
Number of card acquiring 84.4 74.8 13 22.4 22.1 21.2 18.7 19.1 19.2 19.1 17.4
Total acquired amount, SEKm 13 923 11 547 21 3 948 3 626 3 460 2 890 3 222 3 032 2 780 2 513
1) Excluding intra-Group transactions.
2) Q2 2016 Loans to the public increased SEK 3.7bn due to acquisition of Danske Bank’s retail business in Lithuania.
3) Q2 2016 Deposits from the public increased SEK 0.9bn due to acquisition of Danske Bank’s retail business in Lithuania.
4) Number of customers that have made a payment, transfer, application, investment or lending acitivity in the last month.
5) Point of Sale (POS).
LithuaniaQ4, 2017
21
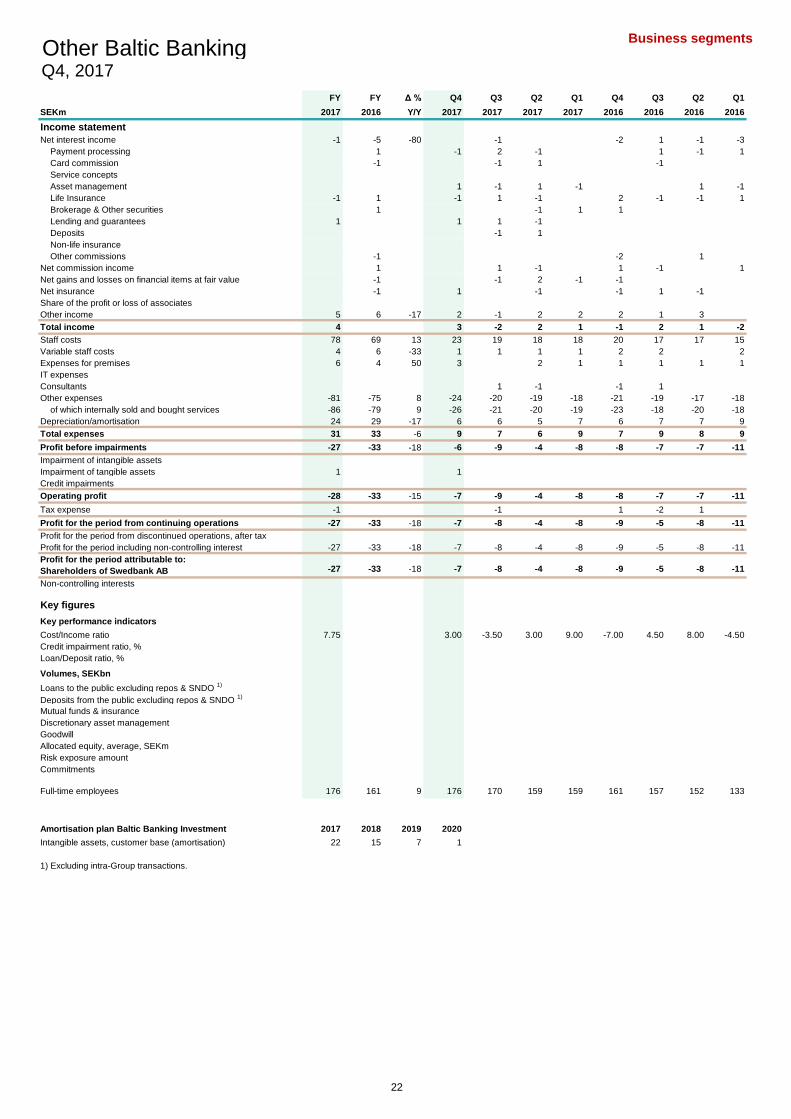
Business segments
FY FY Δ % Q4 Q3 Q2 Q1 Q4 Q3 Q2 Q1
SEKm 2017 2016 Y/Y 2017 2017 2017 2017 2016 2016 2016 2016
Income statement
Net interest income -1 -5 -80 -1 -2 1 -1 -3
Payment processing 1 -1 2 -1 1 -1 1
Card commission -1 -1 1 -1
Service concepts
Asset management 1 -1 1 -1 1 -1
Life Insurance -1 1 -1 1 -1 2 -1 -1 1
Brokerage & Other securities 1 -1 1 1
Lending and guarantees 1 1 1 -1
Deposits -1 1
Non-life insurance
Other commissions -1 -2 1
Net commission income 1 1 -1 1 -1 1
Net gains and losses on financial items at fair value -1 -1 2 -1 -1
Net insurance -1 1 -1 -1 1 -1
Share of the profit or loss of associates
Other income 5 6 -17 2 -1 2 2 2 1 3
Total income 4 3 -2 2 1 -1 2 1 -2
Staff costs 78 69 13 23 19 18 18 20 17 17 15
Variable staff costs 4 6 -33 1 1 1 1 2 2 2
Expenses for premises 6 4 50 3 2 1 1 1 1 1
IT expenses
Consultants 1 -1 -1 1
Other expenses -81 -75 8 -24 -20 -19 -18 -21 -19 -17 -18
of which internally sold and bought services -86 -79 9 -26 -21 -20 -19 -23 -18 -20 -18
Depreciation/amortisation 24 29 -17 6 6 5 7 6 7 7 9
Total expenses 31 33 -6 9 7 6 9 7 9 8 9
Profit before impairments -27 -33 -18 -6 -9 -4 -8 -8 -7 -7 -11
Impairment of intangible assets
Impairment of tangible assets 1 1
Credit impairments
Operating profit -28 -33 -15 -7 -9 -4 -8 -8 -7 -7 -11
Tax expense -1 -1 1 -2 1
Profit for the period from continuing operations -27 -33 -18 -7 -8 -4 -8 -9 -5 -8 -11
Profit for the period from discontinued operations, after tax
Profit for the period including non-controlling interest -27 -33 -18 -7 -8 -4 -8 -9 -5 -8 -11
Profit for the period attributable to:
Shareholders of Swedbank AB -27 -33 -18 -7 -8 -4 -8 -9 -5 -8 -11
Non-controlling interests
Key figures
Key performance indicators
Cost/Income ratio 7.75 3.00 -3.50 3.00 9.00 -7.00 4.50 8.00 -4.50
Credit impairment ratio, % 0.00 0.00 0.00 0.00 0.00 0.00 0.00 0.00
Loan/Deposit ratio, %
Volumes, SEKbn
Loans to the public excluding repos & SNDO 1)
Deposits from the public excluding repos & SNDO 1)
Mutual funds & insurance
Discretionary asset management
Goodwill
Allocated equity, average, SEKm
Risk exposure amount
Commitments
Full-time employees 176 161 9 176 170 159 159 161 157 152 133
Amortisation plan Baltic Banking Investment 2017 2018 2019 2020
Intangible assets, customer base (amortisation) 22 15 7 1
1) Excluding intra-Group transactions.
Other Baltic BankingQ4, 2017
22
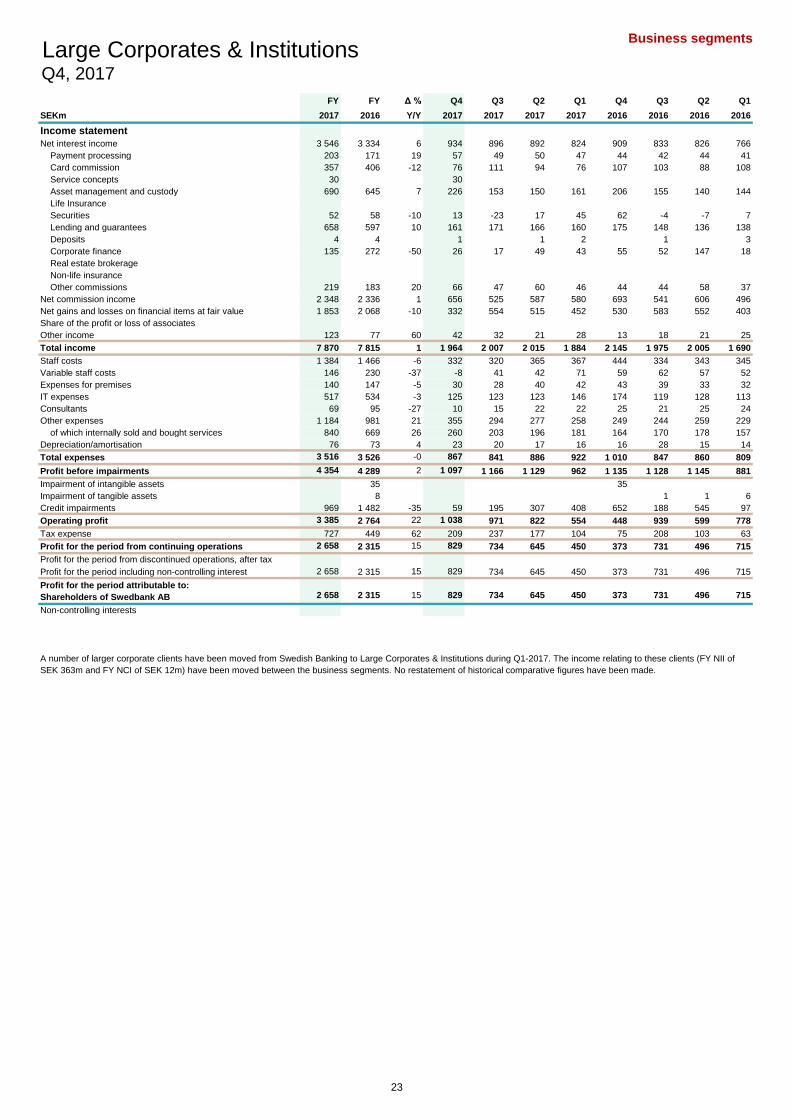
Business segments
FY FY Δ % Q4 Q3 Q2 Q1 Q4 Q3 Q2 Q1
SEKm 2017 2016 Y/Y 2017 2017 2017 2017 2016 2016 2016 2016
Income statement
Net interest income 3 546 3 334 6 934 896 892 824 909 833 826 766
Payment processing 203 171 19 57 49 50 47 44 42 44 41
Card commission 357 406 -12 76 111 94 76 107 103 88 108
Service concepts 30 30
Asset management and custody 690 645 7 226 153 150 161 206 155 140 144
Life Insurance
Securities 52 58 -10 13 -23 17 45 62 -4 -7 7
Lending and guarantees 658 597 10 161 171 166 160 175 148 136 138
Deposits 4 4 1 1 2 1 3
Corporate finance 135 272 -50 26 17 49 43 55 52 147 18
Real estate brokerage
Non-life insurance
Other commissions 219 183 20 66 47 60 46 44 44 58 37
Net commission income 2 348 2 336 1 656 525 587 580 693 541 606 496
Net gains and losses on financial items at fair value 1 853 2 068 -10 332 554 515 452 530 583 552 403
Share of the profit or loss of associates
Other income 123 77 60 42 32 21 28 13 18 21 25
Total income 7 870 7 815 1 1 964 2 007 2 015 1 884 2 145 1 975 2 005 1 690
Staff costs 1 384 1 466 -6 332 320 365 367 444 334 343 345
Variable staff costs 146 230 -37 -8 41 42 71 59 62 57 52
Expenses for premises 140 147 -5 30 28 40 42 43 39 33 32
IT expenses 517 534 -3 125 123 123 146 174 119 128 113
Consultants 69 95 -27 10 15 22 22 25 21 25 24
Other expenses 1 184 981 21 355 294 277 258 249 244 259 229
of which internally sold and bought services 840 669 26 260 203 196 181 164 170 178 157
Depreciation/amortisation 76 73 4 23 20 17 16 16 28 15 14
Total expenses 3 516 3 526 -0 867 841 886 922 1 010 847 860 809
Profit before impairments 4 354 4 289 2 1 097 1 166 1 129 962 1 135 1 128 1 145 881
Impairment of intangible assets 35 35
Impairment of tangible assets 8 1 1 6
Credit impairments 969 1 482 -35 59 195 307 408 652 188 545 97
Operating profit 3 385 2 764 22 1 038 971 822 554 448 939 599 778
Tax expense 727 449 62 209 237 177 104 75 208 103 63
Profit for the period from continuing operations 2 658 2 315 15 829 734 645 450 373 731 496 715
Profit for the period from discontinued operations, after tax
Profit for the period including non-controlling interest 2 658 2 315 15 829 734 645 450 373 731 496 715
Profit for the period attributable to:
Shareholders of Swedbank AB 2 658 2 315 15 829 734 645 450 373 731 496 715
Non-controlling interests
Large Corporates & InstitutionsQ4, 2017
A number of larger corporate clients have been moved from Swedish Banking to Large Corporates & Institutions during Q1-2017. The income relating to these clients (FY NII of
SEK 363m and FY NCI of SEK 12m) have been moved between the business segments. No restatement of historical comparative figures have been made.
23

Business segments
31 Dec 31 dec Δ % Q4 Q3 Q2 Q1 Q4 Q3 Q2 Q1
SEKbn 2017 2016 Y/Y 2017 2017 2017 2017 2016 2016 2016 2016
Balance sheet (Incl intra-Group transactions)
Assets
Cash and balances with central banks 8 2 8 8 8 7 2 3 4 1
Loans to credit institutions 54 43 26 54 58 57 49 43 70 70 70
Loans to the public 228 228 228 258 253 269 228 267 273 289
Bonds and other interest-bearing securities 27 34 -21 27 48 44 46 34 73 67 71
Financial assets for which customers bear inv. risk
Derivatives 63 97 -35 63 73 86 84 97 101 107 111
Other assets 39 33 18 39 49 26 63 33 45 39 32
Total assets 419 437 -4 419 494 474 518 437 559 560 574
Liabilities and equity
Amounts owed to credit institutions 179 164 9 179 187 172 195 164 191 200 178
Deposits and borrowings from the public 138 127 9 138 155 148 167 127 133 141 144
Debt securities in issue 18 18 18 18 18 18 18 18 18 17
Financial liabilities for which customers bear inv. risk
Derivatives 60 103 -42 60 71 82 82 103 106 110 107
Other liabilities 5 41 31 34 5 91 70 108
Subordinated liabilities
Allocated equity 24 20 20 24 22 23 22 20 20 21 20
Total liabilities and equity 419 437 -4 419 494 474 518 437 559 560 574
Key figures
Key performance indicators
Return on allocated equity, % 12.0 11.9 14.2 13.0 11.3 9.0 7.6 14.6 10.1 15.0
Cost/Income ratio 0.45 0.45 0.44 0.42 0.44 0.49 0.47 0.43 0.43 0.48
Credit impairment ratio, % 0.40 0.59 0.08 0.28 0.43 0.67 0.84 0.24 0.66 0.15
Loan/Deposit ratio, % 158 148 158 158 160 137 148 153 149 132
Volumes, SEKbn
Loans to the public excluding repos & SNDO 1) 203 178 14 203 204 203 200 178 187 188 180
Deposits from the public excluding repos & SNDO 1) 128 116 10 128 129 126 146 116 123 126 137
Mutual funds & insurance 132 101 31 132 137 134 141 101 104 98 96
Discretionary asset management 380 381 -0 380 382 384 381 381 367 365 356
Goodwill
Allocated equity, average, SEKm 22 090 19 527 13 23 299 22 512 22 760 19 966 19 720 20 012 19 615 19 049
Risk exposure amount 137 110 25 137 140 135 134 110 119 124 120
Commitments 105 107 -2 105 104 101 103 107 103 96 98
Full-time employees 1 173 1 218 -4 1 173 1 188 1 208 1 204 1 218 1 206 1 203 1 187
1) Excluding intra-Group transactions.
Large Corporates & InstitutionsQ4, 2017
A number of larger corporate clients have been moved from Swedish Banking to Large Corporates & Institutions during Q1-2017. Business volumes (Loans to the public of
SEK 30bn and deposits from the public of SEK 3bn) have been moved between the business segments. No restatement of historical comparative figures have been made.
24
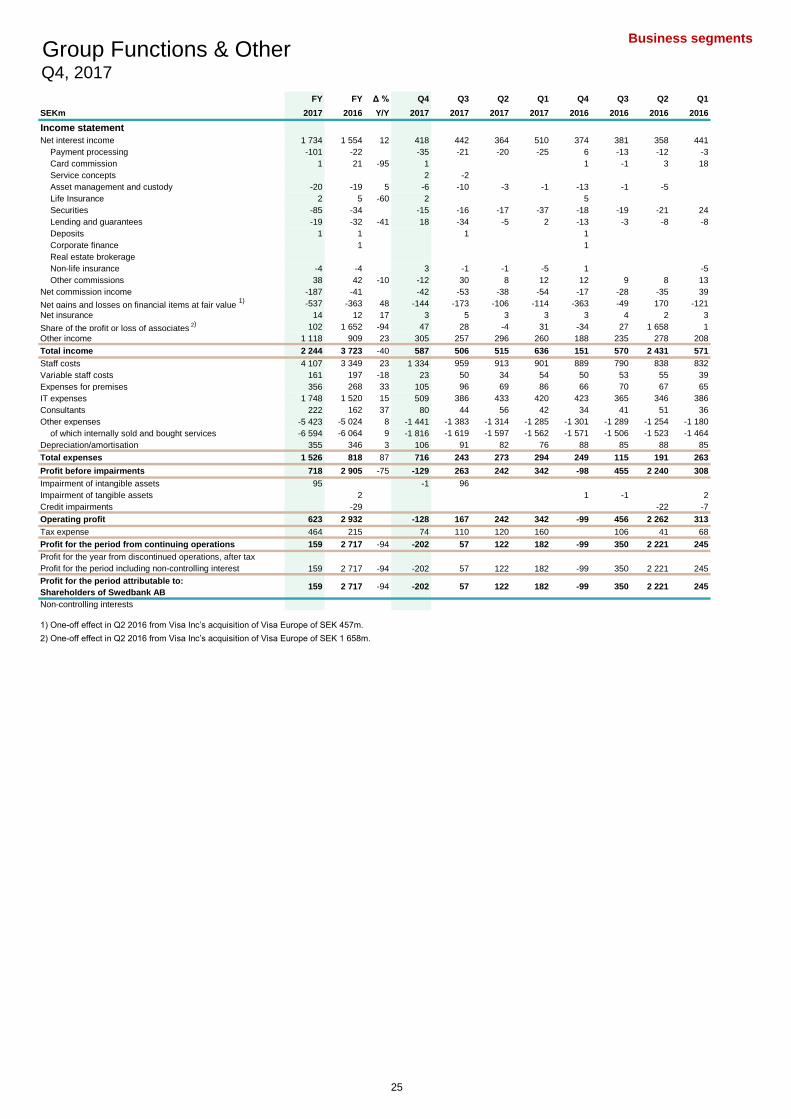
Business segments
FY FY Δ % Q4 Q3 Q2 Q1 Q4 Q3 Q2 Q1
SEKm 2017 2016 Y/Y 2017 2017 2017 2017 2016 2016 2016 2016
Income statement
Net interest income 1 734 1 554 12 418 442 364 510 374 381 358 441
Payment processing -101 -22 -35 -21 -20 -25 6 -13 -12 -3
Card commission 1 21 -95 1 1 -1 3 18
Service concepts 2 -2
Asset management and custody -20 -19 5 -6 -10 -3 -1 -13 -1 -5
Life Insurance 2 5 -60 2 5
Securities -85 -34 -15 -16 -17 -37 -18 -19 -21 24
Lending and guarantees -19 -32 -41 18 -34 -5 2 -13 -3 -8 -8
Deposits 1 1 1 1
Corporate finance 1 1
Real estate brokerage
Non-life insurance -4 -4 3 -1 -1 -5 1 -5
Other commissions 38 42 -10 -12 30 8 12 12 9 8 13
Net commission income -187 -41 -42 -53 -38 -54 -17 -28 -35 39
Net gains and losses on financial items at fair value 1) -537 -363 48 -144 -173 -106 -114 -363 -49 170 -121
Net insurance 14 12 17 3 5 3 3 3 4 2 3
Share of the profit or loss of associates 2) 102 1 652 -94 47 28 -4 31 -34 27 1 658 1
Other income 1 118 909 23 305 257 296 260 188 235 278 208
Total income 2 244 3 723 -40 587 506 515 636 151 570 2 431 571
Staff costs 4 107 3 349 23 1 334 959 913 901 889 790 838 832
Variable staff costs 161 197 -18 23 50 34 54 50 53 55 39
Expenses for premises 356 268 33 105 96 69 86 66 70 67 65
IT expenses 1 748 1 520 15 509 386 433 420 423 365 346 386
Consultants 222 162 37 80 44 56 42 34 41 51 36
Other expenses -5 423 -5 024 8 -1 441 -1 383 -1 314 -1 285 -1 301 -1 289 -1 254 -1 180
of which internally sold and bought services -6 594 -6 064 9 -1 816 -1 619 -1 597 -1 562 -1 571 -1 506 -1 523 -1 464
Depreciation/amortisation 355 346 3 106 91 82 76 88 85 88 85
Total expenses 1 526 818 87 716 243 273 294 249 115 191 263
Profit before impairments 718 2 905 -75 -129 263 242 342 -98 455 2 240 308
Impairment of intangible assets 95 -1 96
Impairment of tangible assets 2 1 -1 2
Credit impairments -29 -22 -7
Operating profit 623 2 932 -128 167 242 342 -99 456 2 262 313
Tax expense 464 215 74 110 120 160 106 41 68
Profit for the period from continuing operations 159 2 717 -94 -202 57 122 182 -99 350 2 221 245
Profit for the year from discontinued operations, after tax
Profit for the period including non-controlling interest 159 2 717 -94 -202 57 122 182 -99 350 2 221 245
Profit for the period attributable to:
Shareholders of Swedbank AB159 2 717 -94 -202 57 122 182 -99 350 2 221 245
Non-controlling interests
1) One-off effect in Q2 2016 from Visa Inc’s acquisition of Visa Europe of SEK 457m.
2) One-off effect in Q2 2016 from Visa Inc’s acquisition of Visa Europe of SEK 1 658m.
Group Functions & OtherQ4, 2017
25

Business segments
31 Dec 31 Dec Δ % Q4 Q3 Q2 Q1 Q4 Q3 Q2 Q1
SEKbn 2017 2016 Y/Y 2017 2017 2017 2017 2016 2016 2016 2016
Balance sheet (Incl intra-Group transactions)
Assets
Cash and balances with central banks 189 116 63 189 325 422 397 116 257 349 336
Loans to credit institutions 191 194 -2 191 205 196 224 194 201 229 181
Loans to the public 8 4 100 8 1 4 8 5 3
Bonds and other interest-bearing securities 118 152 -22 118 164 85 130 152 113 97 102
Financial assets for which customers bear inv. risk
Derivatives 24 34 -29 24 28 26 33 34 45 51 46
Other assets 461 511 -10 461 494 483 489 511 562 541 570
Total assets 991 1 011 -2 991 1 216 1 213 1 273 1 011 1 186 1 272 1 238
Liabilities and equity
Amounts owed to credit institutions 74 90 -18 74 148 169 146 90 120 111 106
Deposits and borrowings from the public 11 11 91 82 94 91 177 177
Debt securities in issue 831 831 831 900 879 964 831 894 906 861
Financial liabilities for which customers bear inv. risk
Derivatives 18 26 -31 18 17 25 21 26 28 32 37
Other liabilities
Subordinated liabilities 26 27 -4 26 30 33 27 27 23 23 22
Allocated equity 31 37 -16 31 30 25 21 37 30 23 35
Total liabilities and equity 991 1 011 -2 991 1 216 1 213 1 273 1 011 1 186 1 272 1 238
Key figures
Key performance indicators
Return on allocated equity, % 0.6 8.9 -2.7 0.8 2.1 2.2 -1.2 5.1 32.5 2.8
Cost/Income ratio 0.68 0.22 1.22 0.48 0.53 0.46 1.65 0.20 0.08 0.46
Credit impairment ratio, % -0.13 -0.47 -0.13
Loan/Deposit ratio, % 0 0 0 0 0 0 0 0 0 0
Volumes, SEKbn
Loans to the public excluding repos & SNDO 1) 0
Deposits from the public excluding repos & SNDO 1) 9 0 9 90 83 94 0 88 172 171
Mutual funds & insurance
Discretionary asset management
Goodwill
Allocated equity, average, SEKm 28 889 30 497 -5 30 141 27 462 23 079 33 300 33 287 27 527 27 349 34 960
Risk exposure amount 18 23 -22 18 27 26 25 23 22 22 19
Commitments 3 1 3 2 3 1 1 4 2 2
Full-time employees 5 959 5 111 17 5 959 5 822 5 361 5 199 5 111 5 039 5 011 4 874
1) Excluding intra-Group transactions.
Group Functions & OtherQ4, 2017
26
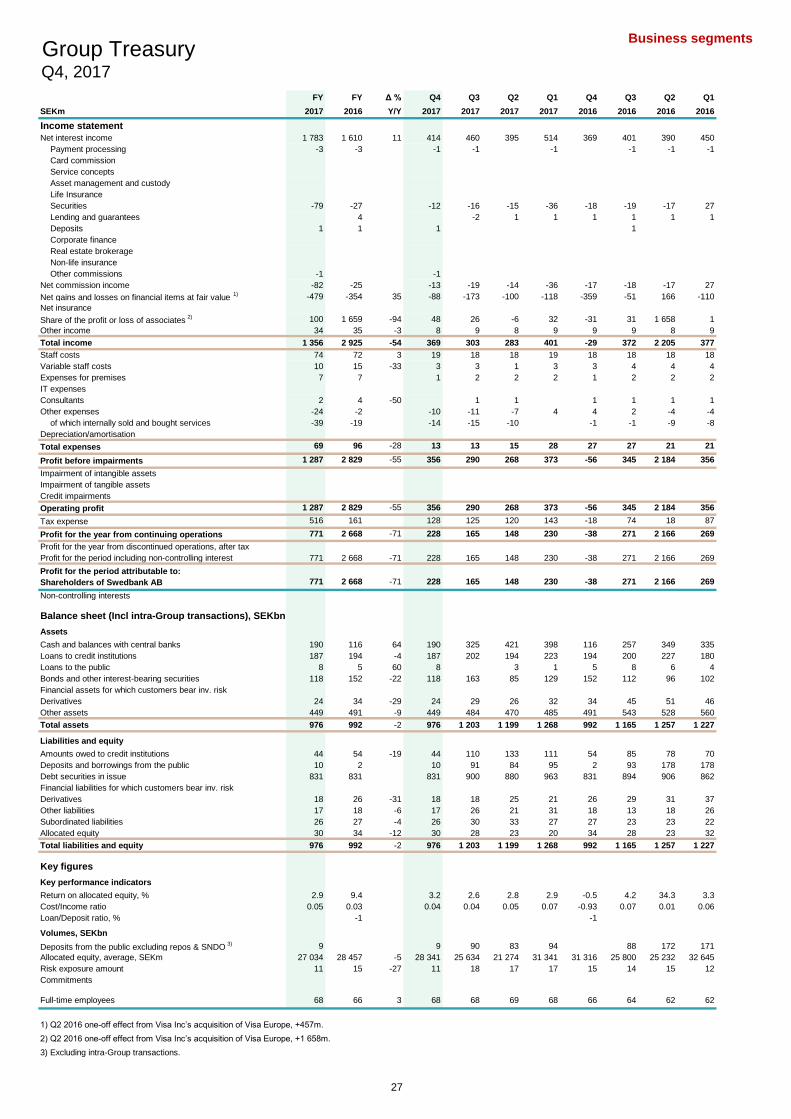
Business segments
FY FY Δ % Q4 Q3 Q2 Q1 Q4 Q3 Q2 Q1
SEKm 2017 2016 Y/Y 2017 2017 2017 2017 2016 2016 2016 2016
Income statement
Net interest income 1 783 1 610 11 414 460 395 514 369 401 390 450
Payment processing -3 -3 -1 -1 -1 -1 -1 -1
Card commission
Service concepts
Asset management and custody
Life Insurance
Securities -79 -27 -12 -16 -15 -36 -18 -19 -17 27
Lending and guarantees 4 -2 1 1 1 1 1 1
Deposits 1 1 1 1
Corporate finance
Real estate brokerage
Non-life insurance
Other commissions -1 -1
Net commission income -82 -25 -13 -19 -14 -36 -17 -18 -17 27
Net gains and losses on financial items at fair value 1) -479 -354 35 -88 -173 -100 -118 -359 -51 166 -110
Net insurance
Share of the profit or loss of associates 2) 100 1 659 -94 48 26 -6 32 -31 31 1 658 1
Other income 34 35 -3 8 9 8 9 9 9 8 9
Total income 1 356 2 925 -54 369 303 283 401 -29 372 2 205 377
Staff costs 74 72 3 19 18 18 19 18 18 18 18
Variable staff costs 10 15 -33 3 3 1 3 3 4 4 4
Expenses for premises 7 7 1 2 2 2 1 2 2 2
IT expenses
Consultants 2 4 -50 1 1 1 1 1 1
Other expenses -24 -2 -10 -11 -7 4 4 2 -4 -4
of which internally sold and bought services -39 -19 -14 -15 -10 -1 -1 -9 -8
Depreciation/amortisation
Total expenses 69 96 -28 13 13 15 28 27 27 21 21
Profit before impairments 1 287 2 829 -55 356 290 268 373 -56 345 2 184 356
Impairment of intangible assets
Impairment of tangible assets
Credit impairments
Operating profit 1 287 2 829 -55 356 290 268 373 -56 345 2 184 356
Tax expense 516 161 128 125 120 143 -18 74 18 87
Profit for the year from continuing operations 771 2 668 -71 228 165 148 230 -38 271 2 166 269
Profit for the year from discontinued operations, after tax
Profit for the period including non-controlling interest 771 2 668 -71 228 165 148 230 -38 271 2 166 269
Profit for the period attributable to:
Shareholders of Swedbank AB 771 2 668 -71 228 165 148 230 -38 271 2 166 269
Non-controlling interests
Balance sheet (Incl intra-Group transactions), SEKbn
Assets
Cash and balances with central banks 190 116 64 190 325 421 398 116 257 349 335
Loans to credit institutions 187 194 -4 187 202 194 223 194 200 227 180
Loans to the public 8 5 60 8 3 1 5 8 6 4
Bonds and other interest-bearing securities 118 152 -22 118 163 85 129 152 112 96 102
Financial assets for which customers bear inv. risk
Derivatives 24 34 -29 24 29 26 32 34 45 51 46
Other assets 449 491 -9 449 484 470 485 491 543 528 560
Total assets 976 992 -2 976 1 203 1 199 1 268 992 1 165 1 257 1 227
Liabilities and equity
Amounts owed to credit institutions 44 54 -19 44 110 133 111 54 85 78 70
Deposits and borrowings from the public 10 2 10 91 84 95 2 93 178 178
Debt securities in issue 831 831 831 900 880 963 831 894 906 862
Financial liabilities for which customers bear inv. risk
Derivatives 18 26 -31 18 18 25 21 26 29 31 37
Other liabilities 17 18 -6 17 26 21 31 18 13 18 26
Subordinated liabilities 26 27 -4 26 30 33 27 27 23 23 22
Allocated equity 30 34 -12 30 28 23 20 34 28 23 32
Total liabilities and equity 976 992 -2 976 1 203 1 199 1 268 992 1 165 1 257 1 227
Key figures
Key performance indicators
Return on allocated equity, % 2.9 9.4 3.2 2.6 2.8 2.9 -0.5 4.2 34.3 3.3
Cost/Income ratio 0.05 0.03 0.04 0.04 0.05 0.07 -0.93 0.07 0.01 0.06
Loan/Deposit ratio, % 0 -1 0 0 0 0 -1 0 0 0
Volumes, SEKbn
Deposits from the public excluding repos & SNDO 3) 9 0 9 90 83 94 88 172 171
Allocated equity, average, SEKm 27 034 28 457 -5 28 341 25 634 21 274 31 341 31 316 25 800 25 232 32 645
Risk exposure amount 11 15 -27 11 18 17 17 15 14 15 12
Commitments
Full-time employees 68 66 3 68 68 69 68 66 64 62 62
1) Q2 2016 one-off effect from Visa Inc’s acquisition of Visa Europe, +457m.
2) Q2 2016 one-off effect from Visa Inc’s acquisition of Visa Europe, +1 658m.
3) Excluding intra-Group transactions.
Group TreasuryQ4, 2017
27

Business segments
FY FY Δ % Q4 Q3 Q2 Q1 Q4 Q3 Q2 Q1
SEKm 2017 2016 Y/Y 2017 2017 2017 2017 2016 2016 2016 2016
Income statement
Net interest income -49 -56 -13 4 -18 -31 -4 5 -20 -32 -9
Payment processing -98 -19 -34 -20 -20 -24 6 -12 -11 -2
Card commissions 1 21 -95 1 1 -1 3 18
Service concepts 2 -2
Asset management and custody -20 -19 5 -6 -10 -3 -1 -13 -1 -5
Life insurance 2 5 -60 2 5
Securities -6 -7 -14 -3 -2 -1 -4 -3
Lending and guarantees -19 -36 -47 18 -32 -6 1 -14 -4 -9 -9
Deposits -1 1 1 -1
Non-life insurance -4 -4 3 -1 -1 -5 1 -5
Other commissions 39 42 -7 -11 30 8 12 12 9 8 13
Net commission income -105 -16 -29 -34 -24 -18 -10 -18 12
Net gains and losses on financial items at fair value -58 -9 -56 -6 4 -4 2 4 -11
Net insurance 14 12 17 3 5 3 3 3 4 2 3
Share of the profit or loss of associates 2 -7 -1 2 2 -1 -3 -4
Other income 1 084 874 24 297 248 288 251 179 226 270 199
Total income 888 798 11 218 203 232 235 180 198 226 194
Staff costs 4 033 3 277 23 1 315 941 895 882 871 772 820 814
Variable staff costs 151 182 -17 20 47 33 51 47 49 51 35
Expenses for premises 349 261 34 104 94 67 84 65 68 65 63
IT expenses 1 748 1 520 15 509 386 433 420 423 365 346 386
Consultants 220 158 39 80 43 55 42 33 40 50 35
Other expenses -5 399 -5 022 -8 -1 431 -1 372 -1 307 -1 289 -1 305 -1 291 -1 250 -1 176
of which internally sold and bought services -6 555 -6 045 -8 -1 802 -1 604 -1 587 -1 562 -1 570 -1 505 -1 514 -1 456
Depreciation/amortisation 355 346 3 106 91 82 76 88 85 88 85
Total expenses 1 457 722 703 230 258 266 222 88 170 242
Profit before impairments -569 76 -485 -27 -26 -31 -42 110 56 -48
Impairment of intangible assets 95 -1 96
Impairment of tangible assets 2 1 -1 2
Credit impairments -29 -22 -7
Operating profit -664 103 -484 -123 -26 -31 -43 111 78 -43
Tax expense -52 54 -54 -15 17 18 32 23 -19
Profit for the period from continuing operations -612 49 -430 -108 -26 -48 -61 79 55 -24
Profit for the period from discontinued operations, after tax
Profit for the period including non-controlling interest -612 49 -430 -108 -26 -48 -61 79 55 -24
Profit for the period attributable to:
Shareholders of Swedbank AB -612 49 -430 -108 -26 -48 -61 79 55 -24
Non-controlling interests
Key figures
Key performance indicators
Return on allocated equity, % -33.0 2.4 -95.6 -23.6 -5.8 -9.8 -12.4 18.3 10.4 -4.1
Cost/Income ratio 1.64 0.90 3.22 1.13 1.11 1.13 1.23 0.44 0.75 1.25
Volumes, SEKbn
Allocated equity, average, SEKm 1 855 2 040 -9 1 800 1 828 1 805 1 959 1 971 1 727 2 117 2 315
Risk exposure amount 7 8 -13 7 9 9 8 8 8 7 7
Commitments 3 1 3 2 3 1 1 4 2 2
Full-time employees 5 891 5 045 17 5 891 5 754 5 292 5 131 5 045 4 975 4 949 4 812
Other Group FunctionsQ4, 2017
28

Business segments
FY FY Δ % Q4 Q3 Q2 Q1 Q4 Q3 Q2 Q1
SEKm 2017 2016 Y/Y 2017 2017 2017 2017 2016 2016 2016 2016
Income statement
Net interest income -9 -1 -3 -2 -2 -2 -1
Payment processing 5 -4 -1 8 -1 -1 -1 -3
Card commissions 37 31 19 8 10 8 11 10 9 4 8
Service concepts
Asset management and custody -3 4 -1 -3 1 1 1 1 1
Life insurance 5 4 25 2 1 1 1 1 3
Securities 13 1 2 1 3 7 -1 -1 4 -1
Lending and guarantees 1 3 2 2 -7 1
Deposits
Corporate finance
Real estate brokerage
Non-life insurance
Other commissions -5 -5
Net commission income 57 32 78 14 21 10 12 11 9 4 8
Net gains and losses on financial items at fair value 1 1 -2 -2 2 2 -2
Net insurance -27 -21 29 -7 -7 -7 -6 -6 -6 -5 -4
Share of the profit or loss of associates
Other income -252 -140 -80 -71 -64 -64 -53 -17 -45 -46 -32
Total income -231 -130 -78 -66 -52 -62 -51 -15 -40 -45 -30
Staff costs -1 1
Expenses for premises -11 -6 83 -3 -3 -3 -2 -1 -3 -1 -1
IT expenses -378 -299 -26 -102 -84 -97 -95 -87 -67 -67 -78
Consultants 1 -1
Other expenses 158 175 -10 39 35 38 46 72 30 25 48
of which internally sold and bought services 329 264 25 89 74 83 83 97 52 51 64
Depreciation/amortisation
Total expenses -231 -130 -78 -66 -52 -62 -51 -15 -40 -45 -30
Key figures
Volumes, SEKbn
Index linked bonds -10 -10 -10 -9 -10 -10 -10 -10 -10 -9
EliminationsQ4, 2017
29

Product companies
Swedbank Robur
FY FY Δ % Q4 Q3 Q2 Q1 Q4 Q3 Q2 Q1
SEKm 2017 2016 Y/Y 2017 2017 2017 2017 2016 2016 2016 2016
Income statement
Net interest income -9 -11 neg -2 -2 -2 -3 -2 -3 -2 -4
Net commission income 2 092 1 863 12 609 492 498 493 532 467 433 431
Net gains & losses on financial intems at fair value 7 3 2 2 3 3 2 1 -3
Net insurance
Other income 19 2 4 3 3 9 -7 3 3 3
Total income 2 109 1 857 14 613 495 499 502 526 469 435 427
Staff costs 291 292 -0 76 71 73 71 71 72 75 74
Variable staff costs 34 29 17 6 10 3 15 3 12 5 9
Expenses for premises 18 22 -18 4 3 5 6 5 5 6 6
IT expenses 88 89 -2 22 21 25 20 23 20 23 23
Consultants 1 4 -75 1 1 2 1
Other expenses 135 123 10 31 27 37 40 23 41 44 15
Depreciation/amortisation 37 35 6 9 10 9 9 9 9 8 9
Total expenses 604 594 2 148 142 153 161 134 160 163 137
Profit before impairments 1 505 1 263 19 465 353 346 341 392 309 272 290
Impairment of intangible assets
Impairment of tangible assets
Credit impairments
Operating profit 1 505 1 263 19 465 353 346 341 392 309 272 290
Tax expense 331 277 20 96 88 75 72 87 67 60 63
Profit for the period from continuing operations 1 174 986 19 369 265 271 269 305 242 212 227
Profit for the year from discontinued operations, after tax
Profit for the period including non-controlling interest 1 174 986 19 369 265 271 269 305 242 212 227
Profit for the period attributable to:
Shareholders of Swedbank AB 1 174 986 19 369 265 271 269 305 242 212 227
Key performance indicators
Cost/Income ratio 0.29 0.32 -11 0.24 0.29 0.31 0.32 0.25 0.34 0.37 0.32
Full-time employees 238 237 0 238 222 233 231 237 243 256 260
Q4, 2017
30

Product companies
Swedbank Robur
31 Dec 31 Dec Δ % Q4 Q3 Q2 Q1 Q4 Q3 Q2 Q1
SEKbn 2017 2016 Y/Y 2017 2017 2017 2017 2016 2016 2016 2016
Volumes
Mutual funds, period end 871 789 10 871 848 835 829 789 764 721 713
Average balance mutual funds 838 738 14 868 831 844 809 776 752 721 704
Discretionary asset management, period end 381 381 0 381 382 384 382 381 367 365 356
Fund assets under management by country
Sweden 829 754 10 829 808 796 791 754 724 687 681
Estonia 17 14 20 17 16 16 15 14 14 13 12
Latvia 15 12 23 15 14 13 13 12 12 11 10
Lithuania 11 9 19 11 10 10 9 9 8 7 7
Norway 4 4 4
Fund assets under management, per asset type, %
Interest-bearing securities 19 25 -21 19 21 22 24 25 27 28 29
Swedish equities 23 24 -4 23 25 25 24 24 24 23 22
Foreign equities 43 40 8 43 41 40 38 40 38 37 36
Funds in funds 11 9 23 11 10 10 9 9 9 9 9
Liqiudity and other 3 2 47 3 4 4 4 2 2 2 3
Fund asset under management, per product type, %
Equity 61 58 5 61 59 60 59 58 57 55 54
Asia 2 1 27 2 2 2 2 1 1 1 1
Emerging Markets 2 2 -2 2 2 2 2 2 2 2 2
Europe 5 4 10 5 5 5 4 4 4 5 5
Global 9 8 11 9 9 9 9 8 8 8 8
Northern America 1 2 -21 1 1 2 2 2 2 2 2
Sector 7 5 23 7 6 6 6 5 5 5 5
Sweden 14 15 -1 14 15 15 15 15 15 14 14
Sweden Global 20 20 3 20 20 20 20 20 19 19 19
Total fixed income 14 17 -18 14 16 15 16 17 19 20 20
Long term fixed income 8 11 -23 8 9 10 10 11 11 12 11
Short term fixed income 6 7 -10 6 7 6 6 7 7 8 10
Balanced 25 25 1 25 25 25 25 25 25 25 25
Asset Allocation 9 8 11 9 9 9 9 8 8 8 8
Market share Sweden, %
Asset under Management 21 21 -3 21 21 21 21 21 21 21 21
Gross sales 16 17 -6 16 14 18 15 17 12 16 13
Net sales neg neg 0 1 neg neg 10 9 neg neg neg
Net sales, SEKbn
Mutual funds 0.3 0.6 -58 1.6 -0.6 -4.6 3.9 5.0 0.4 -1.7 -3.0
Sweden -4.1 -3.4 21 0.5 -1.7 -5.6 2.6 3.8 -0.6 -2.9 -3.7
of which Equity -1.0 -1.1 -10 5.2 -1.9 -4.8 0.5 2.8 -1.4 -0.4 -2.1
of which Fixed income -11.4 -9.5 19 -4.6 -0.9 -4.8 -1.1 -3.3 -0.4 -3.4 -2.4
of which Balanced 8.2 7.2 14 -0.1 1.1 4.0 3.3 4.4 1.2 1.0 0.7
Other countries 4.6 4.0 13 1.1 1.0 1.1 1.3 1.1 1.0 1.2 0.7
Discretionary asset management -4.4 -11.0 -60 -8.6 -2.5 -8.1 14.8 -10.4 -0.7 -2.4 2.6
Q4, 2017
31
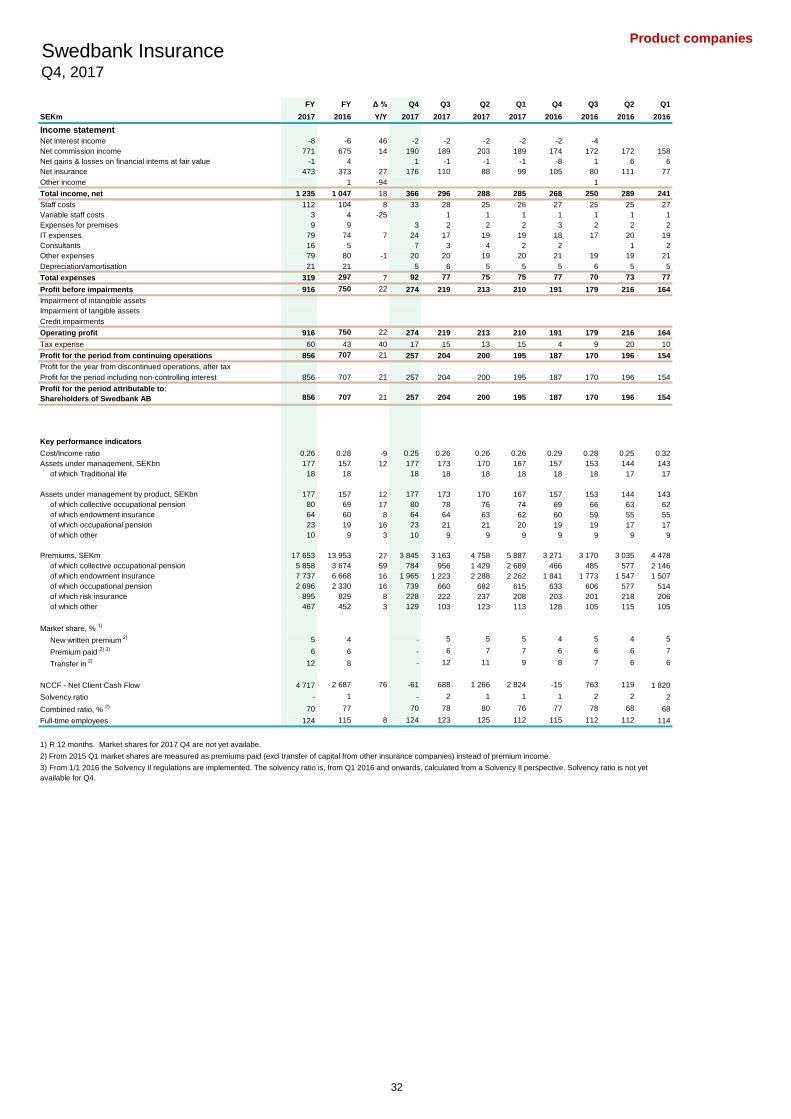
Product companies
FY FY Δ % Q4 Q3 Q2 Q1 Q4 Q3 Q2 Q1
SEKm 2017 2016 Y/Y 2017 2017 2017 2017 2016 2016 2016 2016
Income statement
Net interest income -8 -6 46 -2 -2 -2 -2 -2 -4 0 0
Net commission income 771 675 14 190 189 203 189 174 172 172 158
Net gains & losses on financial intems at fair value -1 4 1 -1 -1 -1 -8 1 6 6
Net insurance 473 373 27 176 110 88 99 105 80 111 77
Other income 0 1 -94 0 -0 1 -0 0
Total income, net 1 235 1 047 18 366 296 288 285 268 250 289 241
Staff costs 112 104 8 33 28 25 26 27 25 25 27
Variable staff costs 3 4 -25 1 1 1 1 1 1 1
Expenses for premises 9 9 3 2 2 2 3 2 2 2
IT expenses 79 74 7 24 17 19 19 18 17 20 19
Consultants 16 5 7 3 4 2 2 1 2
Other expenses 79 80 -1 20 20 19 20 21 19 19 21
Depreciation/amortisation 21 21 5 6 5 5 5 6 5 5
Total expenses 319 297 7 92 77 75 75 77 70 73 77
Profit before impairments 916 750 22 274 219 213 210 191 179 216 164
Impairment of intangible assets
Impairment of tangible assets
Credit impairments
Operating profit 916 750 22 274 219 213 210 191 179 216 164
Tax expense 60 43 40 17 15 13 15 4 9 20 10
Profit for the period from continuing operations 856 707 21 257 204 200 195 187 170 196 154
Profit for the year from discontinued operations, after tax
Profit for the period including non-controlling interest 856 707 21 257 204 200 195 187 170 196 154
Profit for the period attributable to:
Shareholders of Swedbank AB 856 707 21 257 204 200 195 187 170 196 154
Key performance indicators
Cost/Income ratio 0.26 0.28 -9 0.25 0.26 0.26 0.26 0.29 0.28 0.25 0.32
Assets under management, SEKbn 177 157 12 177 173 170 167 157 153 144 143
of which Traditional life 18 18 0 18 18 18 18 18 18 17 17
Assets under management by product, SEKbn 177 157 12 177 173 170 167 157 153 144 143
of which collective occupational pension 80 69 17 80 78 76 74 69 66 63 62
of which endowment insurance 64 60 8 64 64 63 62 60 59 55 55
of which occupational pension 23 19 16 23 21 21 20 19 19 17 17
of which other 10 9 3 10 9 9 9 9 9 9 9
Premiums, SEKm 17 653 13 953 27 3 845 3 163 4 758 5 887 3 271 3 170 3 035 4 478
of which collective occupational pension 5 858 3 674 59 784 956 1 429 2 689 466 485 577 2 146
of which endowment insurance 7 737 6 668 16 1 965 1 223 2 288 2 262 1 841 1 773 1 547 1 507
of which occupational pension 2 696 2 330 16 739 660 682 615 633 606 577 514
of which risk insurance 895 829 8 228 222 237 208 203 201 218 206
of which other 467 452 3 129 103 123 113 128 105 115 105
Market share, % 1)
New written premium 2) 5 4 - 5 5 5 4 5 4 5
Premium paid 2) 3) 6 6 - 6 7 7 6 6 6 7
Transfer in 2) 12 8 - 12 11 9 8 7 6 6
NCCF - Net Client Cash Flow 4 717 2 687 76 -61 688 1 266 2 824 -15 763 119 1 820
Solvency ratio - 1 0 - 2 1 1 1 2 2 2
Combined ratio, % 2) 70 77 70 78 80 76 77 78 68 68
Full-time employees 124 115 8 124 123 125 112 115 112 112 114
1) R 12 months. Market shares for 2017 Q4 are not yet availabe.
2) From 2015 Q1 market shares are measured as premiums paid (excl transfer of capital from other insurance companies) instead of premium income.
Swedbank InsuranceQ4, 2017
3) From 1/1 2016 the Solvency II regulations are implemented. The solvency ratio is, from Q1 2016 and onwards, calculated from a Solvency II perspective. Solvency ratio is not yet
available for Q4.
32
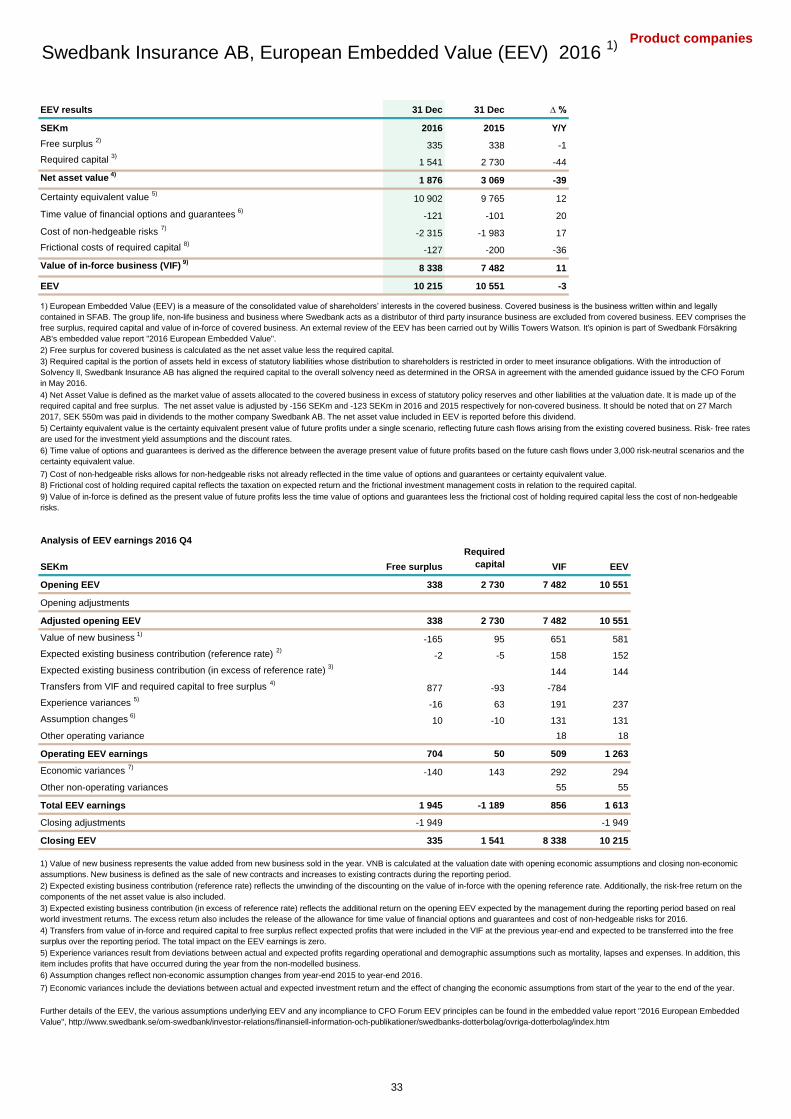
Product companies
Swedbank Insurance AB, European Embedded Value (EEV) 2016 1)
EEV results 31 Dec 31 Dec ∆ %
SEKm 2016 2015 Y/Y
Free surplus 2)
335 338 -1
Required capital 3)
1 541 2 730 -44
Net asset value 4)
1 876 3 069 -39
Certainty equivalent value 5)
10 902 9 765 12
Time value of financial options and guarantees 6)
-121 -101 20
Cost of non-hedgeable risks 7)
-2 315 -1 983 17
Frictional costs of required capital 8)
-127 -200 -36
Value of in-force business (VIF) 9)
8 338 7 482 11
EEV 10 215 10 551 -3
2) Free surplus for covered business is calculated as the net asset value less the required capital.
Analysis of EEV earnings 2016 Q4
SEKm Free surplus
Required
capital VIF EEV
Opening EEV 338 2 730 7 482 10 551
Opening adjustments
Adjusted opening EEV 338 2 730 7 482 10 551
Value of new business 1)
-165 95 651 581
Expected existing business contribution (reference rate) 2)
-2 -5 158 152
Expected existing business contribution (in excess of reference rate) 3)
144 144
Transfers from VIF and required capital to free surplus 4)
877 -93 -784
Experience variances 5)
-16 63 191 237
Assumption changes 6)
10 -10 131 131
Other operating variance 18 18
Operating EEV earnings 704 50 509 1 263
Economic variances 7)
-140 143 292 294
Other non-operating variances 55 55
Total EEV earnings 1 945 -1 189 856 1 613
Closing adjustments -1 949 -1 949
Closing EEV 335 1 541 8 338 10 215
7) Economic variances include the deviations between actual and expected investment return and the effect of changing the economic assumptions from start of the year to the end of the year.
Further details of the EEV, the various assumptions underlying EEV and any incompliance to CFO Forum EEV principles can be found in the embedded value report "2016 European Embedded
Value", http://www.swedbank.se/om-swedbank/investor-relations/finansiell-information-och-publikationer/swedbanks-dotterbolag/ovriga-dotterbolag/index.htm
2) Expected existing business contribution (reference rate) reflects the unwinding of the discounting on the value of in-force with the opening reference rate. Additionally, the risk-free return on the
components of the net asset value is also included.
3) Expected existing business contribution (in excess of reference rate) reflects the additional return on the opening EEV expected by the management during the reporting period based on real
world investment returns. The excess return also includes the release of the allowance for time value of financial options and guarantees and cost of non-hedgeable risks for 2016.
4) Transfers from value of in-force and required capital to free surplus reflect expected profits that were included in the VIF at the previous year-end and expected to be transferred into the free
surplus over the reporting period. The total impact on the EEV earnings is zero.
5) Experience variances result from deviations between actual and expected profits regarding operational and demographic assumptions such as mortality, lapses and expenses. In addition, this
item includes profits that have occurred during the year from the non-modelled business.
6) Assumption changes reflect non-economic assumption changes from year-end 2015 to year-end 2016.
1) European Embedded Value (EEV) is a measure of the consolidated value of shareholders’ interests in the covered business. Covered business is the business written within and legally
contained in SFAB. The group life, non-life business and business where Swedbank acts as a distributor of third party insurance business are excluded from covered business. EEV comprises the
free surplus, required capital and value of in-force of covered business. An external review of the EEV has been carried out by Willis Towers Watson. It's opinion is part of Swedbank Försäkring
AB's embedded value report "2016 European Embedded Value".
4) Net Asset Value is defined as the market value of assets allocated to the covered business in excess of statutory policy reserves and other liabilities at the valuation date. It is made up of the
required capital and free surplus. The net asset value is adjusted by -156 SEKm and -123 SEKm in 2016 and 2015 respectively for non-covered business. It should be noted that on 27 March
2017, SEK 550m was paid in dividends to the mother company Swedbank AB. The net asset value included in EEV is reported before this dividend.
5) Certainty equivalent value is the certainty equivalent present value of future profits under a single scenario, reflecting future cash flows arising from the existing covered business. Risk- free rates
are used for the investment yield assumptions and the discount rates.
1) Value of new business represents the value added from new business sold in the year. VNB is calculated at the valuation date with opening economic assumptions and closing non-economic
assumptions. New business is defined as the sale of new contracts and increases to existing contracts during the reporting period.
3) Required capital is the portion of assets held in excess of statutory liabilities whose distribution to shareholders is restricted in order to meet insurance obligations. With the introduction of
Solvency II, Swedbank Insurance AB has aligned the required capital to the overall solvency need as determined in the ORSA in agreement with the amended guidance issued by the CFO Forum
in May 2016.
6) Time value of options and guarantees is derived as the difference between the average present value of future profits based on the future cash flows under 3,000 risk-neutral scenarios and the
certainty equivalent value.
7) Cost of non-hedgeable risks allows for non-hedgeable risks not already reflected in the time value of options and guarantees or certainty equivalent value.
8) Frictional cost of holding required capital reflects the taxation on expected return and the frictional investment management costs in relation to the required capital.
9) Value of in-force is defined as the present value of future profits less the time value of options and guarantees less the frictional cost of holding required capital less the cost of non-hedgeable
risks.
33

Product companies
Baltic Life insurance
FY FY Δ % Q4 Q3 Q2 Q1 Q4 Q3 Q2 Q1
SEKm 2017 2016 Y/Y 2017 2017 2017 2017 2016 2016 2016 2016
Income statement
Net interest income 34 40 -14 8 9 8 8 9 9 10 10
Net commission income 33 28 17 8 7 8 9 6 8 8 6
Net gains & losses on financial intems at fair value -10 -6 71 -2 -1 -5 -2 -2 1 -2 -3
Net insurance 232 181 29 64 58 56 55 50 48 39 43
Other income
Total income, net 289 242 19 79 73 68 70 64 66 55 57
Staff costs 16 14 16 4 5 4 4 4 4 3 3
Variable staff costs 1 1 -3 0 0 0 0 0 0 0 0
Expenses for premises 2 2 8 0 0 0 0 0 0 0 0
IT expenses 7 7 -4 2 1 2 2 1 2 2 2
Consultants 0 0 -1 0 0 0 0 0
Other expenses 24 21 12 7 6 6 6 6 6 5 4
Depreciation/amortisation 0 0 -10 0 0 0 0 0 0 0 0
Total expenses 50 46 10 13 12 13 13 11 12 11 11
Profit before impairments 238 197 21 66 61 55 57 52 54 44 47
Impairment of intangible assets
Impairment of tangible assets
Credit impairments
Operating profit 238 197 21 66 61 55 57 52 54 44 47
Tax expense 26 27 5 7 7 6 6 20 5 1 1
Profit for the period from continuing operations 212 169 26 59 54 49 50 32 49 43 46
Profit for the period from discontinued operations, after tax Profit for the period including non-controlling interest 212 169 26 59 54 49 50 32 49 43 46
Profit for the period attributable to:
Shareholders of Swedbank AB 212 169 26 59 54 49 50 32 49 43 46
Key performance indicators
Cost/Income ratio 0.17 0.19 -8 0.16 0.16 0.19 0.19 0.18 0.19 0.21 0.18
Assets under management, SEKm 5 258 4 799 10 5 258 5 034 4 931 4 894 4 799 4 599 4 359 4 188
of which Traditional life 999 1 125 -11 999 1 050 1 071 1 095 1 125 1 175 1 179 1 171
0 0 0 0
Assets under management by product, SEKm 5 258 4 799 10 5 258 5 034 4 931 4 894 4 799 4 599 4 359 4 188
of which collective occupational pension
of which endowment insurance 1 307 1 144 14 1 307 1 209 1 181 1 144 1 144 1 052 996 955
of which occupational pension
of which private pension 2 056 1 802 14 2 056 1 941 1 881 1 872 1 802 1 699 1 578 1 499
of which other 1 894 1 853 2 1 894 1 884 1 869 1 877 1 853 1 848 1 784 1 734
Premiums, SEKm 1 104 997 11 341 251 275 237 355 223 216 203
of which collective occupational pension
of which endowment insurance 219 196 12 92 34 59 34 114 28 31 22
of which occupational pension
of which private pension 325 294 10 99 78 77 71 100 67 64 64
of which risk insurance 268 221 21 72 68 67 62 61 57 53 50
of which other 291 285 2 78 71 72 70 80 70 67 67
NCCF - Net Client Cash Flow 159 245 -35 54 52 64 -12 133 37 43 32
Solvency ratio 1) N/A 2 N/A 2 2 2 2 2 2 2
Full-time employees 45 50 -10 45 46 47 48 50 49 49 47
Q4, 2017
1) From 1/1 2016 the Solvency II regulations are implemented. The solvency ratio is, from Q1 2016 and onwards, calculated from a Solvency II perspective. Solvency ratio is not
yet available for Q4.
34

Product companies
Baltic P&C insurance
FY FY Δ % Q4 Q3 Q2 Q1 Q4 Q3 Q2 Q1
SEKm 2017 2016 Y/Y 2017 2017 2017 2017 2016 2016 2016 2016
Income statement
Net interest income 6 6 2 2 2 1 1 2 1 1 1
Net commission income -55 -41 32 -16 -14 -13 -11 -11 -11 -10 -9
Net gains & losses on financial intems at fair value -6 -3 -2 -1 -2 -2 -2 -0 -1 0
Net insurance 276 229 21 77 74 74 52 73 53 60 42
Other income 37 34 9 10 8 10 10 10 9 7 9
Total income, net 258 225 15 71 68 69 50 72 52 58 43
Staff costs 28 26 10 8 7 7 6 7 7 6 6
Variable staff costs 2 2 -9 0 0 0 1 0 0 0 0
Expenses for premises 4 3 26 1 1 1 1 1 1 1 1
IT expenses 11 10 14 2 3 3 2 2 2 3 2
Consultants 0 0 -68 0 0 0 0 0 0 0
Other expenses 32 28 13 9 7 8 8 8 7 8 5
Depreciation/amortisation 0 0 -40 0 0 0 0 0 0 0 0
Total expenses 77 69 12 20 19 19 19 19 17 18 15
Profit before impairments 182 156 16 51 49 50 32 54 35 40 28
Operating profit 182 156 16 51 49 50 32 54 35 40 28
Tax expense 30 17 -74 14 6 6 5 2 18 -1 -1
Profit for the period from continuing operations 152 139 9 36 44 45 27 51 17 41 29
Profit for the period from discontinued operations, after tax
Profit for the period including non-controlling interest 152 139 9 36 44 45 27 51 17 41 29
Profit for the period attributable to:
Shareholders of Swedbank AB 152 139 9 36 44 45 27 51 17 41 29
Key performance indicators
Cost/Income ratio 0.30 0.31 -3 0.29 0.28 0.28 0.37 0.26 0.32 0.31 0.35
Premiums, SEKm 868 673 29 252 223 203 190 192 172 156 153
of which Loan payment protection 31 18 73 10 8 7 6 5 5 4 4
of which motor own Damage (MOD) 276 229 20 82 70 63 62 67 58 51 54
of which motor TPL (MTPL) 107 60 78 38 30 23 18 17 15 15 14
of which home 338 281 20 92 85 83 79 78 72 67 64
of which apartment, buildings 4 3 14 1 1 1 1 1 1 1 1
of which travel 67 45 48 18 17 16 15 14 12 10 10
of which payment protection 43 34 29 12 11 11 10 10 9 8 7
of which purchase protection 2 2 -18 0 0 0 0 1 1 1 1
of which senior card insurance 1 0 47 0 0 0 0 0 0 0 0
Combined ratio, % 1) 76 75 2 76 76 77 81 75 78 77 81
Solvency ratio 2) N/A 2 N/A 2 2 2 2 2 2 2
Full-time employees 112 104 8 112 110 114 106 104 105 111 104
Q4, 2017
2) From 1/1 2016 the Solvency II regulations are implemented. The solvency ratio is, from Q1 2016 and onwards, calculated from a Solvency II perspective. Solvency ratio is not yet
available for Q4.
1) Combined ratio = Claims ratio + Expense ratio / Premium Income.
35

Business volumes
LoansQ4, 2017
Loans net, by sector, Group 31 Dec ∆ SEKbn ∆ SEKbn ∆ % 30 Sep 30 Jun 31 Mar 31 Dec 30 Sep 30 Jun 31 Mar 31 Dec
SEKbn 1)
2017 YTD Q/Q Y/Y 2017 2017 2017 2016 2016 2016 2016 2015
Private customers 981 49 15 5 966 954 940 932 909 896 875 864
Private mortgage 829 46 16 6 813 802 790 783 761 749 732 723
Tenant owner associations 109 1 -1 1 110 110 109 108 107 106 103 102
Private other 43 2 4 43 42 41 41 41 41 40 39
Corporate customers 521 -1 -0 522 516 517 521 530 524 511 507
Agriculture, forestry, fishing 68 2 3 68 69 67 66 66 65 65 65
Manufacturing 48 3 3 7 45 44 45 45 45 44 43 42
Public sector and utilities 21 -4 -3 -16 24 23 24 25 27 25 26 26
Construction 20 -1 1 21 19 21 20 21 22 19 20
Retail 29 1 -1 2 30 28 29 28 30 30 31 30
Transportation 17 2 2 12 15 15 15 15 14 14 13 13
Shipping and offshore 23 -5 -1 -16 24 25 25 28 30 31 31 30
Hotels and restaurants 8 -1 1 -16 7 7 9 9 9 9 7 7
Information and communication 11 3 36 11 11 8 8 7 7 6 6
Finance and insurance 12 -1 12 14 12 12 13 14 13 13
Property management 219 -4 -2 -2 221 218 221 223 225 222 218 219
Residential properties 67 3 1 4 66 64 64 64 62 65 61 61
Commercial 83 -5 -1 -5 84 84 86 88 95 92 92 91
Industrial and Warehouse 44 -1 -1 -4 45 45 45 45 43 41 41 44
Other 25 -1 -1 -3 26 25 26 26 25 24 24 23
Professional services 26 3 1 13 25 24 24 23 26 23 24 21
Other corporate lending 19 3 19 19 17 19 17 18 15 15
Loans to the public 2)
1 502 49 14 3 1 488 1 470 1 457 1 453 1 439 1 420 1 386 1 371
Swedish National Debt Office 8 3 7 67 1 3 1 5 9 7 4 8
Repurchase agreements, Swedish National Debt Office 3 -1 -16 -25 19 8 5 4 7 6 2
Repurchase agreements, public 22 -23 -12 -51 34 41 62 45 71 78 108 33
Loans to the public 1 535 28 -7 2 1 542 1 522 1 525 1 507 1 526 1 511 1 498 1 414
Credit institutions 30 -1 -6 -4 36 35 36 31 83 124 79 85
Repurchase agreements, credit institutions 1 -1 -40 2 4 3 1 12 6 12 1
Loans to credit institutions 31 -1 -7 -5 38 39 39 32 95 130 91 86
Loans to the public and credit institutions 1 566 27 -14 2 1 580 1 561 1 564 1 539 1 621 1 641 1 589 1 500
Specification of loans to the public excluding Swedish National Debt Office and repurchase agreements
By business segment 31 Dec ∆ SEKbn ∆ SEKbn ∆ % 30 Sep 30 Jun 31 Mar 31 Dec 30 Sep 30 Jun 31 Mar 31 Dec
SEKbn (excl intra-Group transactions) 3)
2017 YTD Q/Q Y/Y 2017 2017 2017 2016 2016 2016 2016 2015
Private 898 41 12 5 886 876 864 857 833 821 805 795
Private mortgage 4)
760 41 13 6 747 737 726 719 698 687 674 666
Private other incl. tenant owner associations 138 -1 0 139 139 138 138 135 134 131 129
Corporate 5)
252 -26 -9 252 249 252 278 278 275 274 270
Total Swedish Banking 1)
1 150 15 12 1 1 138 1 125 1 116 1 135 1 111 1 096 1 079 1 065
Private 82 7 3 9 79 77 76 75 76 73 66 66
Private mortgage 6)
69 5 3 8 66 65 64 64 63 61 55 55
Private other incl. tenant owner associations 13 2 18 13 12 12 11 13 12 11 11
Corporate 67 2 3 67 65 65 65 65 63 61 59
Total Baltic Banking 149 9 3 6 146 142 141 140 141 136 127 125
Private 1 1 233 1 1 2 4 3
Private mortgage -99 1 3 2
Private other incl. tenant owner associations 1 1 376 1 1 1 1 1
Corporate 5)
202 24 -1 13 203 202 200 178 187 186 176 178
Total Large Corporates & Institutions 203 25 -1 14 204 203 200 178 187 188 180 181
Total Group Functions & Other
Loans to the public 2)
1 502 49 14 3 1 488 1 470 1 457 1 453 1 439 1 420 1 386 1 371
Specification of loans to the public excluding Swedish National Debt Office and repurchase agreements
By country 31 Dec ∆ SEKbn ∆ SEKbn ∆ % 30 Sep 30 Jun 31 Mar 31 Dec 30 Sep 30 Jun 31 Mar 31 Dec
SEKbn (excl intra-Group transactions) 2017 YTD Q/Q Y/Y 2017 2017 2017 2016 2016 2016 2016 2015
Sweden 1 288 33 13 3 1 275 1 265 1 258 1 255 1 237 1 222 1 196 1 186
Estonia 71 6 3 9 68 67 66 65 65 63 61 59
Latvia 32 1 3 32 31 31 31 32 31 29 29
Lithuania 46 2 4 46 44 44 44 44 42 38 37
Norway 49 7 18 49 46 41 42 44 45 46 44
USA 1 -3 1 1 1 1 1 1 2 2
Finland 10 -1 -2 -15 12 12 12 11 12 12 10 11
Denmark 3 1 31 3 2 2 2 2 2 2 2
Other 2 2 2 2 2 2 2 2 2 1
Loans to the public 2)
1 502 49 14 3 1 488 1 470 1 457 1 453 1 439 1 420 1 386 1 371
1) Historical data (for 31 Mar 2016 and 31 Dec 2015) updated due to industry structure changes for Swedish Banking.
2) Excluding Swedish National Debt Office and repurchase agreements.
3) Historical data (starting from 31 Dec 2015) updated due to structure changes for Swedish Banking and Large Corporates & Institutions.
4) Q4 2016 Loans to the public increased SEK 13bn due to technical transfer of remaining private mortgage volume related to the acquisition of Sparbanken Öresund in May 2014.
5) Q1 2017 Loans to the public of SEK 30bn were moved from Swedish banking to Large Corporates & Institutions due to transfer of corporate customers.
6) Q2 2016 Loans to the public increased SEK 4.4bn due to acquisition of Danske Bank’s retail business in Latvia and Lithuania.
36

Business volumes
Deposits from the public and amounts owed to credit institutionsQ4, 2017
Deposits from the public 31 Dec ∆ SEKbn ∆ SEKbn ∆ % 30 Sep 30 Jun 31 Mar 31 Dec 30 Sep 30 Jun 31 Mar
SEKbn (excl intra-Group transactions) 2017 YTD Q/Q Y/Y 2017 2017 2017 2016 2016 2016 2016
Swedish Banking 525 29 6 6 519 510 490 496 488 479 454
of which on demand deposits 220 21 4 10 216 208 194 199 191 188 171
of which savings account 305 8 2 3 303 302 296 297 297 291 283
of which private 362 19 -1 6 363 355 343 343 341 335 320
of which corporate 163 10 7 6 156 155 147 153 147 144 134
Baltic Banking 1)
185 15 13 9 172 169 168 170 166 159 147
of which on demand deposits 158 18 13 13 145 142 141 140 136 131 120
of which savings account 27 -3 -10 27 27 27 30 30 28 27
of which private 111 12 7 12 104 102 99 99 94 92 86
of which corporate 74 3 6 4 68 67 69 71 72 67 61
Large Corporates & Institutions 128 12 -1 6 129 126 146 116 123 126 137
of which on demand deposits 118 13 -1 15 119 115 134 105 111 111 127
of which savings account 10 -1 -7 10 11 12 11 12 15 10
Group Functions & Other 9 9 -81 -313 90 83 94 88 172 171
of which Group Treasury 9 9 -81 -307 90 83 94 88 172 171
Deposits from the public 2)
847 65 -63 8 910 888 898 782 865 936 909
of which private 473 31 6 7 467 457 442 442 435 427 406
of which corporate 374 34 -69 10 443 431 456 340 430 509 503 of which US based money-market funds 9 9 -80 #DIV/0! 89 82 91 91 175 177
Repurchase agreements & deposits, Swedish National Debt Office 27 400
Repurchase agreements from the public 9 -2 -17 -20 26 21 20 11 14 19 11
Total deposits and borrowings from the public 856 63 -80 8 936 909 918 793 879 955 920
Deposits from the public, currency distribution 31 Dec
SEKbn (excl intra-Group transactions) 2017 SEK EUR USD Other
Private 473 358 109 5 1
Corporate 374 263 77 25 9
of which insurance 19 17 2
of which sovereigns, municipalities etc. 46 36 10
of which US based money-market funds 9 9
of which other 300 210 65 16 9
Deposits from the public 847 621 186 30 10
Amounts owed to credit institutions, Group 31 Dec ∆ SEKbn ∆ SEKbn ∆ % 30 Sep 30 Jun 31 Mar 31 Dec 30 Sep 30 Jun 31 Mar
SEKbn 2017 YTD Q/Q Y/Y 2017 2017 2017 2016 2016 2016 2016
Central banks 23 1 5 5 18 16 18 22 25 31 23
Banks 42 -6 -74 -13 116 136 106 48 128 125 119Other credit institutions 3 1 1 65 2 3 2 2 3 2 Repurchase agreements, banks -1 -100 1 2 2 9 2Repurchase agreements, other credit institutions #DIV/0! 1
Amounts owed to credit institutions 68 -4 -69 -5 137 155 128 72 158 167 146
1) Q2 2016 Deposits from the public increased SEK 1.0bn due to acquisition of Danske Bank’s retail business in Latvia and Lithuania.
2) Excluding Swedish National Debt Office and repurchase agreements.
37
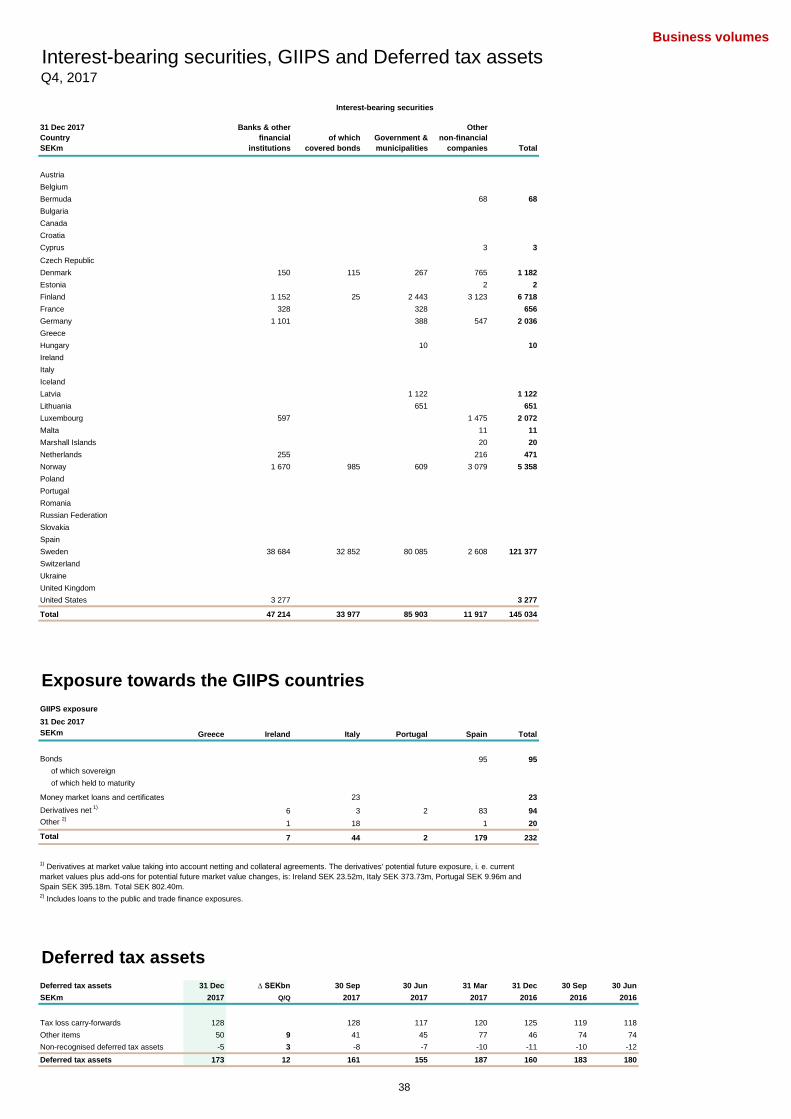
Business volumes
Interest-bearing securities, GIIPS and Deferred tax assetsQ4, 2017
31 Dec 2017
Country
SEKm
Banks & other
financial
institutions
of which
covered bonds
Government &
municipalities
Other
non-financial
companies Total
Austria 0
Belgium 0
Bermuda 68 68
Bulgaria 0
Canada 0
Croatia 0
Cyprus 3 3
Czech Republic 0
Denmark 150 115 267 765 1 182
Estonia 2 2
Finland 1 152 25 2 443 3 123 6 718
France 328 328 656
Germany 1 101 388 547 2 036
Greece 0
Hungary 10 10
Ireland 0
Italy 0
Iceland 0
Latvia 1 122 1 122
Lithuania 651 651
Luxembourg 597 1 475 2 072
Malta 11 11
Marshall Islands 20 20
Netherlands 255 216 471
Norway 1 670 985 609 3 079 5 358
Poland 0
Portugal 0
Romania 0
Russian Federation 0
Slovakia 0
Spain 0
Sweden 38 684 32 852 80 085 2 608 121 377
Switzerland 0
Ukraine 0
United Kingdom 0
United States 3 277 3 277
Total 47 214 33 977 85 903 11 917 145 034
Exposure towards the GIIPS countries
GIIPS exposure
31 Dec 2017
SEKm Greece Ireland Italy Portugal Spain Total
Bonds 95 95
of which sovereign
of which held to maturity
Money market loans and certificates 23 23
Derivatives net 1)
6 3 2 83 94
Other 2)
1 18 1 20
Total 7 44 2 179 232
Deferred tax assets
Deferred tax assets 31 Dec ∆ SEKbn 30 Sep 30 Jun 31 Mar 31 Dec 30 Sep 30 Jun
SEKm 2017 Q/Q 2017 2017 2017 2016 2016 2016
Tax loss carry-forwards 128 0 128 117 120 125 119 118
Other items 50 9 41 45 77 46 74 74
Non-recognised deferred tax assets -5 3 -8 -7 -10 -11 -10 -12
Deferred tax assets 173 12 161 155 187 160 183 180
2) Includes loans to the public and trade finance exposures.
Interest-bearing securities
1) Derivatives at market value taking into account netting and collateral agreements. The derivatives' potential future exposure, i. e. current
market values plus add-ons for potential future market value changes, is: Ireland SEK 23.52m, Italy SEK 373.73m, Portugal SEK 9.96m and
Spain SEK 395.18m. Total SEK 802.40m.
38

Asset qualityAsset qualityQ4, 2017
Credit risks, Group Provisions
Sector/industry for individually
31 Dec 2017 Loans assessed Portfolio Loans
gross impaired loans provisions net
Private customers 981 424 496 279 980 649
Private mortgage 829 385 305 156 828 924
Tenant owner associations 109 221 47 109 174
Private other 42 818 191 76 42 551
Corporate customers 524 112 2 380 731 521 001
Agriculture, forestry, fishing 67 810 64 41 67 705
Manufacturing 48 333 160 102 48 071
Public sector and utilities 21 252 3 18 21 231
Construction 20 136 65 38 20 033
Retail 29 066 145 52 28 869
Transportation 17 065 9 16 17 040
Shipping and offshore 24 612 1 236 122 23 254
Hotels and restaurants 7 472 16 15 7 441
Information and communication 11 081 106 11 10 964
Finance and insurance 12 339 7 13 12 319
Property management 218 989 122 139 218 728
Residential properties 66 582 21 33 66 528
Commercial 83 503 29 65 83 409
Industrial and Warehouse 43 578 12 24 43 542
Other 25 326 60 17 25 249
Professional services 26 748 364 135 26 249
Other corporate lending 19 209 83 29 19 097
Loans to the public excluding
the Swedish National Debt Office
and repurchase agreements 1 505 536 2 876 1 010 1 501 650
Swedish National Debt Office 8 501 8 501
Repurchase agreements, Swedish National Debt Office 2 862 2 862
Repurchase agreements, public 22 185 22 185
Loans to the public 1 539 084 2 876 1 010 1 535 198
Credit institutions 30 235 30 235
Repurchase agreements, credit institutions 511 511
Loans to credit institutions 30 746 30 746
Loans to the public and
credit institutions 1 569 830 2 876 1 010 1 565 944
Total loans by collateral type, net, Group
SEKm
Swedish
Banking Baltic Banking
- of which
Estonia
- of which
Latvia
- of which
Lithuania
Large
Corporates &
Institutions
Group
Functions &
Other Total
Real Estate Residential 905 438 69 262 31 387 13 593 24 282 10 090 984 790
Real Estate Commercial 138 858 32 115 16 561 6 886 8 668 19 998 190 971
Guarantees 18 584 3 341 2 436 318 587 12 015 33 940
Cash 4 079 1 293 351 500 442 334 5 706
Other 49 096 27 291 13 388 6 680 7 223 68 126 48 144 561
Unsecured 33 759 15 827 7 243 3 872 4 712 92 096 141 682
Total loans to the public, net 1 149 814 149 129 71 366 31 849 45 914 202 659 48 1 501 650
Private loans by collateral type, net, Group
SEKm
Swedish
Banking Baltic Banking
- of which
Estonia
- of which
Latvia
- of which
Lithuania
Large
Corporates &
Institutions
Group
Functions &
Other Total
Real Estate Residential 848 995 66 992 29 907 13 009 24 076 231 916 218
Real Estate Commercial 10 499 745 142 112 491 11 244
Guarantees 9 203 728 589 125 14 803 10 734
Cash 452 704 15 258 431 1 156
Other 5 727 3 453 2 142 699 612 9 180
Unsecured 22 895 9 150 3 810 2 423 2 917 72 32 117
Total private loans to the public, net 897 771 81 772 36 605 16 626 28 541 1 106 980 649
Corporate loans by collateral type, net, Group
SEKm
Swedish
Banking Baltic Banking
- of which
Estonia
- of which
Latvia
- of which
Lithuania
Large
Corporates &
Institutions
Group
Functions &
Other Total
Real Estate Residential 56 443 2 270 1 480 584 206 9 859 68 572
Real Estate Commercial 128 359 31 370 16 419 6 774 8 177 19 998 179 727
Guarantees 9 381 2 613 1 847 193 573 11 212 23 206
Cash 3 627 589 336 242 11 334 4 550
Other 43 369 23 838 11 246 5 981 6 611 68 126 48 135 381
Unsecured 10 864 6 677 3 433 1 449 1 795 92 024 109 565
Total corporate loans to the public, net 252 043 67 357 34 761 15 223 17 373 201 553 48 521 001
SEKm
39

Asset qualityAsset quality Q4, 2017
Loans net, by business area
31 Dec 2017
SEKm
Swedish
Banking
Baltic
Banking
- of which
Estonia
- of which
Latvia
- of which
Lithuania
Large
Corporates &
Institutions
Group
Functions &
Other Group
Private customers 897 771 81 772 36 605 16 626 28 541 1 106 980 649
Private mortgage 760 217 68 706 30 103 13 910 24 693 1 828 924
Tenant owner associations 108 154 1 020 109 174
Private other 29 400 13 066 6 502 2 716 3 848 85 42 551
Corporate customers 252 043 67 357 34 761 15 223 17 373 201 553 48 521 001
Agriculture, forestry, fishing 61 966 4 675 2 239 1 941 495 1 064 67 705
Manufacturing 14 287 9 692 3 669 2 151 3 872 24 092 48 071
Public sector and utilities 6 393 6 073 2 975 1 101 1 997 8 765 21 231
Construction 12 513 2 107 1 437 281 389 5 413 20 033
Retail 11 914 7 780 2 680 1 898 3 202 9 175 28 869
Transportation 8 012 6 542 3 338 2 066 1 138 2 486 17 040
Shipping and offshore 72 396 396 22 786 23 254
Hotels and restaurants 3 910 2 925 1 755 568 602 606 7 441
Information and communication 1 326 1 540 218 457 865 8 098 10 964
Finance and insurance 2 877 341 303 27 11 9 053 48 12 319
Property management, including 108 471 17 775 9 773 3 852 4 150 92 482 218 728
Residential properties 47 732 528 107 290 131 18 268 66 528
Commercial 29 989 12 145 5 930 2 967 3 248 41 275 83 409
Industrial and Warehouse 17 896 2 530 1 725 367 438 23 116 43 542
Other 12 854 2 572 2 011 228 333 9 823 25 249
Professional services 8 376 5 154 3 692 831 631 12 719 26 249
Other corporate lending 11 926 2 357 2 286 50 21 4 814 19 097
Loans to the public excluding the Swedish National Debt
Office and repurchase agreements 1 149 814 149 129 71 366 31 849 45 914 202 659 48 1 501 650
Swedish National Debt Office 501 8 000 8 501
Repurchase agreements, Swedish National Debt Office 2 862 2 862
Repurchase agreements, public 22 185 22 185
Loans to the public 1 149 814 149 129 71 366 31 849 45 914 228 207 8 048 1 535 198
Credit institutions 284 7 2 3 2 13 901 16 043 30 235
Repurchase agreements, credit institutions 511 511
Loans to credit institutions 284 7 2 3 2 14 412 16 043 30 746
Loans to the public and credit institutions 1)1 150 098 149 136 71 368 31 852 45 916 242 619 24 091 1 565 944
1) Excluding intra-Group transactions.
Loans net, by geography
31 Dec 2017
SEKm Sweden
Baltic
countries
-of which
Estonia
-of which
Latvia
-of which
Lithuania Norway Denmark Finland USA Other Group
Private customers 896 731 81 772 36 605 16 626 28 541 70 1 171 905 980 649
Private mortgage 759 088 68 706 30 103 13 910 24 693 1 1 129 828 924
Tenant owner associations 109 174 109 174
Private other 28 469 13 066 6 502 2 716 3 848 69 42 905 42 551
Corporate customers 390 853 67 357 34 761 15 223 17 373 49 398 1 599 9 692 753 1 349 521 001
Agriculture, forestry, fishing 63 030 4 675 2 239 1 941 495 67 705
Manufacturing 26 609 9 692 3 669 2 151 3 872 8 158 6 3 166 440 48 071
Public sector and utilities 7 878 6 073 2 975 1 101 1 997 6 059 1 221 21 231
Construction 16 122 2 107 1 437 281 389 797 3 1 004 20 033
Retail 18 693 7 780 2 680 1 898 3 202 873 208 1 078 237 28 869
Transportation 9 264 6 542 3 338 2 066 1 138 1 233 1 17 040
Shipping and offshore 8 032 396 396 14 826 23 254
Hotels and restaurants 4 457 2 925 1 755 568 602 29 26 4 7 441
Information and communication 5 931 1 540 218 457 865 3 400 37 56 10 964
Finance and insurance 10 004 341 303 27 11 1 868 43 63 12 319
Property management, including: 187 034 17 775 9 773 3 852 4 150 9 666 1 264 2 868 121 218 728
Residential properties 63 993 528 107 290 131 1 890 117 66 528
Commercial 61 646 12 145 5 930 2 967 3 248 6 698 2 836 84 83 409
Industrial and Warehouse 38 774 2 530 1 725 367 438 1 078 1 128 32 43 542
Other 22 621 2 572 2 011 228 333 19 37 25 249
Professional services 17 916 5 154 3 692 831 631 2 489 294 395 1 26 249
Other corporate lending 15 883 2 357 2 286 50 21 12 845 19 097
Loans to the public excluding the Swedish National Debt
Office and repurchase agreements 1 287 584 149 129 71 366 31 849 45 914 49 468 2 770 9 692 753 2 254 1 501 650
40

Asset qualityAsset quality Q4, 2017
Impaired loans, gross, by
business area
31 Dec 2017
SEKm Swedish Banking Baltic Banking - of which Estonia - of which Latvia - of which Lithuania
Large Corporates
& Institutions Group
Impaired loans, private customers 404 1 010 205 380 425 1 1 415
Private mortgage 130 926 193 326 407 1 056
Tenant owner associations 32 32
Private other 242 84 12 54 18 1 327
Impaired loans, corporate customers 1 285 1 173 779 147 247 4 706 7 164
Agriculture, forestry, fishing 194 32 20 3 9 226
Manufacturing 67 284 127 6 151 3 354
Public sector and utilities 61 1 1 62
Construction 78 43 8 23 12 121
Retail 236 86 31 47 8 322
Transportation 19 19 8 3 8 38
Shipping and offshore 18 18 4 491 4 509
Hotels and restaurants 36 7 1 4 2 43
Information and communication 164 3 1 1 1 167
Finance and insurance 7 7
Property management, including: 152 326 216 56 54 478
Residential properties 29 93 51 42 122
Commercial 63 3 3 66
Industrial and Warehouse 53 34 22 12 87
Other 7 196 194 2 203
Professional services 157 350 348 2 154 661
Other corporate lending 114 4 4 58 176
Loans to the public 1 689 2 183 984 527 672 4 707 8 579
Credit institutions
Total 1 689 2 183 984 527 672 4 707 8 579
Total provision ratio for impaired loans by
business area
31 Dec 2017
% Swedish Banking Baltic Banking - of which Estonia - of which Latvia - of which Lithuania
Large Corporates
& Institutions Group
Private customers 74 47 36 64 37 200 55
Private mortgage 48 43 27 63 34 44
Tenant owner associations 144 147
Private other 78 93 175 67 117 100 82
Corporate customers 64 50 55 57 33 36 43
Agriculture, forestry, fishing 42 75 45 367 44 46
Manufacturing 81 48 59 133 34 2 433 74
Public sector and utilities 18 500 300 34
Construction 110 30 50 26 25 85
Retail 68 33 29 28 75 61
Transportation 63 63 50 167 38 66
Shipping and offshore 39 39 30 30
Hotels and restaurants 69 86 100 100 50 72
Information and communication 67 100 100 100 100 70
Finance and insurance 171 286
Property management, including 72 33 34 46 17 55
Residential properties 110 18 25 10 44
Commercial 78 533 300 142
Industrial and Warehouse 30 35 45 8 41
Other 171 32 30 150 38
Professional services 63 69 67 50 103 75
Other corporate lending 60 200 25 62 64
Loans to the public 67 49 51 62 36 36 45
Credit institutions
Total 67 49 51 62 36 36 45
Share of impaired loans gross by business area
31 Dec 2017
%
Swedish Banking Baltic Banking - of which Estonia - of which Latvia - of which Lithuania
Large Corporates
& Institutions Group
Private customers 0.04 1.23 0.56 2.25 1.48 0.09 0.14
Private mortgage 0.02 1.34 0.64 2.31 1.64 0.13
Tenant owner associations 0.03 0.03
Private other 0.82 0.64 0.18 1.96 0.47 1.16 0.76
Corporate customers 0.51 1.73 2.21 0.96 1.42 2.32 1.37
Agriculture, forestry, fishing 0.31 0.68 0.89 0.15 1.80 0.33
Manufacturing 0.47 2.89 3.39 0.28 3.85 0.01 0.73
Public sector and utilities 0.95 0.02 0.03 0.29
Construction 0.62 2.03 0.56 8.01 3.06 0.60
Retail 1.95 1.10 1.15 2.46 0.25 1.11
Transportation 0.24 0.29 0.24 0.14 0.70 0.22
Shipping and offshore 4.47 4.47 18.61 18.32
Hotels and restaurants 0.91 0.24 0.06 0.70 0.33 0.58
Information and communication 11.42 0.19 0.46 0.22 0.12 1.51
Finance and insurance 0.24 0.06
Property management, including 0.14 1.82 2.19 1.44 1.30 0.22
Residential properties 0.06 17.06 16.83 31.11 0.18
Commercial 0.21 0.02 0.10 0.08
Industrial and Warehouse 0.30 1.34 1.27 2.73 0.20
Other 0.05 7.44 9.37 0.87 0.80
Professional services 1.85 6.49 8.87 0.32 1.20 2.47
Other corporate lending 0.95 0.17 7.84 1.20 0.92
Loans to the public 0.15 1.45 1.37 1.64 1.46 2.30 0.57
Credit institutions
Total 0.15 1.45 1.37 1.64 1.46 1.93 0.55
41
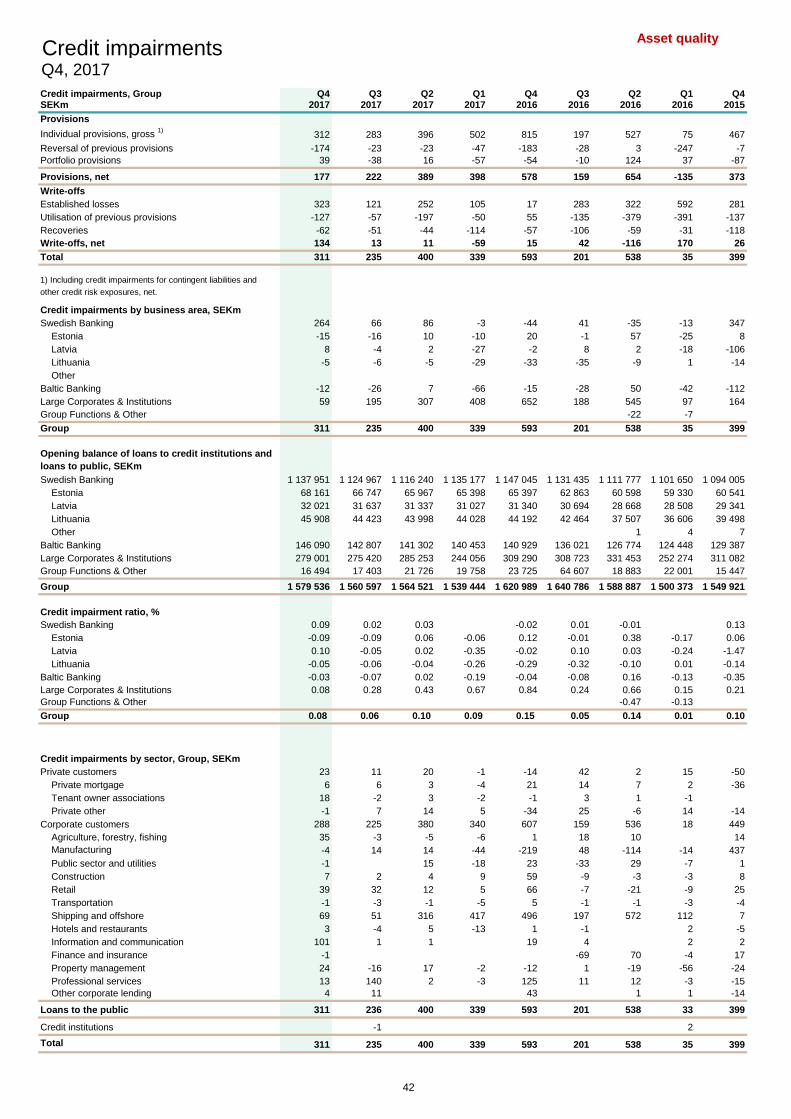
Asset qualityCredit impairmentsQ4, 2017
Credit impairments, Group Q4 Q3 Q2 Q1 Q4 Q3 Q2 Q1 Q4SEKm 2017 2017 2017 2017 2016 2016 2016 2016 2015
Provisions
Individual provisions, gross 1)
312 283 396 502 815 197 527 75 467
Reversal of previous provisions -174 -23 -23 -47 -183 -28 3 -247 -7
Portfolio provisions 39 -38 16 -57 -54 -10 124 37 -87
Provisions, net 177 222 389 398 578 159 654 -135 373
Write-offs
Established losses 323 121 252 105 17 283 322 592 281
Utilisation of previous provisions -127 -57 -197 -50 55 -135 -379 -391 -137
Recoveries -62 -51 -44 -114 -57 -106 -59 -31 -118
Write-offs, net 134 13 11 -59 15 42 -116 170 26
Total 311 235 400 339 593 201 538 35 399
1) Including credit impairments for contingent liabilities and
other credit risk exposures, net.
Credit impairments by business area, SEKm
Swedish Banking 264 66 86 -3 -44 41 -35 -13 347
Estonia -15 -16 10 -10 20 -1 57 -25 8
Latvia 8 -4 2 -27 -2 8 2 -18 -106
Lithuania -5 -6 -5 -29 -33 -35 -9 1 -14
Other
Baltic Banking -12 -26 7 -66 -15 -28 50 -42 -112
Large Corporates & Institutions 59 195 307 408 652 188 545 97 164
Group Functions & Other -22 -7
Group 311 235 400 339 593 201 538 35 399
Opening balance of loans to credit institutions and
loans to public, SEKm
Swedish Banking 1 137 951 1 124 967 1 116 240 1 135 177 1 147 045 1 131 435 1 111 777 1 101 650 1 094 005
Estonia 68 161 66 747 65 967 65 398 65 397 62 863 60 598 59 330 60 541
Latvia 32 021 31 637 31 337 31 027 31 340 30 694 28 668 28 508 29 341
Lithuania 45 908 44 423 43 998 44 028 44 192 42 464 37 507 36 606 39 498
Other 0 0 0 1 4 7
Baltic Banking 146 090 142 807 141 302 140 453 140 929 136 021 126 774 124 448 129 387
Large Corporates & Institutions 279 001 275 420 285 253 244 056 309 290 308 723 331 453 252 274 311 082
Group Functions & Other 16 494 17 403 21 726 19 758 23 725 64 607 18 883 22 001 15 447
Group 1 579 536 1 560 597 1 564 521 1 539 444 1 620 989 1 640 786 1 588 887 1 500 373 1 549 921
Credit impairment ratio, %
Swedish Banking 0.09 0.02 0.03 0.00 -0.02 0.01 -0.01 0.00 0.13
Estonia -0.09 -0.09 0.06 -0.06 0.12 -0.01 0.38 -0.17 0.06
Latvia 0.10 -0.05 0.02 -0.35 -0.02 0.10 0.03 -0.24 -1.47
Lithuania -0.05 -0.06 -0.04 -0.26 -0.29 -0.32 -0.10 0.01 -0.14
Baltic Banking -0.03 -0.07 0.02 -0.19 -0.04 -0.08 0.16 -0.13 -0.35
Large Corporates & Institutions 0.08 0.28 0.43 0.67 0.84 0.24 0.66 0.15 0.21
Group Functions & Other -0.47 -0.13
Group 0.08 0.06 0.10 0.09 0.15 0.05 0.14 0.01 0.10
Credit impairments by sector, Group, SEKm
Private customers 23 11 20 -1 -14 42 2 15 -50
Private mortgage 6 6 3 -4 21 14 7 2 -36
Tenant owner associations 18 -2 3 -2 -1 3 1 -1
Private other -1 7 14 5 -34 25 -6 14 -14
Corporate customers 288 225 380 340 607 159 536 18 449
Agriculture, forestry, fishing 35 -3 -5 -6 1 18 10 14
Manufacturing -4 14 14 -44 -219 48 -114 -14 437
Public sector and utilities -1 15 -18 23 -33 29 -7 1
Construction 7 2 4 9 59 -9 -3 -3 8
Retail 39 32 12 5 66 -7 -21 -9 25
Transportation -1 -3 -1 -5 5 -1 -1 -3 -4
Shipping and offshore 69 51 316 417 496 197 572 112 7
Hotels and restaurants 3 -4 5 -13 1 -1 2 -5
Information and communication 101 1 1 19 4 2 2
Finance and insurance -1 -69 70 -4 17
Property management 24 -16 17 -2 -12 1 -19 -56 -24
Professional services 13 140 2 -3 125 11 12 -3 -15
Other corporate lending 4 11 43 1 1 -14
Loans to the public 311 236 400 339 593 201 538 33 399
Credit institutions -1 2
Total 311 235 400 339 593 201 538 35 399
42

Asset qualityImpaired loans and provisionsQ4, 2017
Impaired loans by business area 31 Dec 30 Sep 30 Jun 31 Mar 31 Dec 30 Sep 30 Jun 31 Mar 31 Dec
SEKm 2017 2017 2017 2017 2016 2016 2016 2016 2015
Impaired loans, gross
Swedish Banking 1 689 1 566 1 337 1 309 1 390 1 302 1 185 1 521 1 899
Estonia 984 1 017 1 047 1 104 1 146 1 187 1 167 1 174 1 196
Latvia 527 562 599 608 669 750 865 914 1 034
Lithuania 672 735 767 771 833 836 904 942 968
Baltic Banking 2 183 2 314 2 413 2 483 2 648 2 773 2 936 3 030 3 198
Large Corporates & Institutions 4 707 4 775 4 475 4 075 4 057 1 633 1 427 557 938
Group Functions & Other 103
Group 8 579 8 655 8 225 7 867 8 095 5 708 5 548 5 211 6 035
Individually identified impaired loan provisions
Swedish Banking 750 622 581 549 539 424 440 537 801
Estonia 336 321 346 442 451 412 403 397 419
Latvia 204 212 228 254 292 325 368 389 440
Lithuania 177 192 201 205 225 246 286 295 304
Baltic Banking 717 725 775 901 968 983 1 057 1 081 1 163
Large Corporates & Institutions 1 409 1 535 1 360 1 535 1 200 697 547 207 460
Group Functions & Other 86
Group 2 876 2 882 2 716 2 985 2 707 2 104 2 044 1 911 2 424
Impaired loans, net
Swedish Banking 939 944 756 760 851 878 745 984 1 098
Estonia 648 696 701 662 695 775 764 777 777
Latvia 323 350 371 354 377 425 497 525 594
Lithuania 495 543 566 566 608 590 618 647 664
Baltic Banking 1 466 1 589 1 638 1 582 1 680 1 790 1 879 1 949 2 035
Large Corporates & Institutions 3 298 3 240 3 115 2 540 2 857 936 880 350 478
Group Functions & Other 17
Group 5 703 5 773 5 509 4 882 5 388 3 604 3 504 3 300 3 611
All provisions for impaired loans
Swedish Banking 1 124 980 959 915 927 816 823 933 1 210
Estonia 499 494 517 620 628 641 636 551 573
Latvia 327 334 353 392 432 497 529 542 594
Lithuania 241 254 260 264 287 343 382 382 386
Baltic Banking 1 067 1 082 1 130 1 276 1 347 1 481 1 547 1 475 1 553
Large Corporates & Institutions 1 695 1 791 1 623 1 782 1 481 980 848 438 618
Group Functions & Other 86
Group 3 886 3 853 3 712 3 973 3 755 3 277 3 218 2 932 3 381
43

Asset qualityImpaired loans and provisionsQ4, 2017
Provision ratio
for impaired loans, %
(including portfolio provisions)
31 Dec
2017
30 Sep
2017
30 Jun
2017
31 Mar
2017
31 Dec
2016
30 Sep
2016
30 Jun
2016
31 Mar
2016
31 Dec
2015
Swedish Banking 67 63 72 70 67 63 69 61 64
Estonia 51 49 49 56 55 54 54 47 48
Latvia 62 59 59 64 65 66 61 59 57
Lithuania 36 35 34 34 34 41 42 41 40
Baltic Banking 49 47 47 51 51 53 53 49 49
Large Corporates & Institutions 36 38 36 44 37 60 59 79 66
Group Functions & Other 83
Group 45 45 45 51 46 57 58 56 56
Share of impaired loans, gross, %
Swedish Banking 0.15 0.14 0.12 0.12 0.12 0.11 0.10 0.14 0.17
Estonia 1.37 1.48 1.56 1.66 1.74 1.80 1.84 1.92 2.00
Latvia 1.64 1.74 1.87 1.92 2.13 2.36 2.77 3.13 3.55
Lithuania 1.46 1.59 1.72 1.74 1.88 1.88 2.11 2.49 2.62
Baltic Banking 1.45 1.57 1.68 1.74 1.87 1.95 2.13 2.36 2.54
Large Corporates & Institutions 1.93 1.70 1.62 1.42 1.65 0.53 0.46 0.17 0.37
Group Functions & Other 0.54
Group 0.55 0.55 0.53 0.50 0.52 0.35 0.34 0.33 0.40
Change in impaired loans Q4 Q3 Q2 Q1 Q4 Q3 Q2 Q1 Q4
SEKm 2017 2017 2017 2017 2016 2016 2016 2016 2015
Impaired loans at period beginning 8 655 8 225 7 867 8 095 5 708 5 548 5 211 6 035 5 458
Amortisation -106 -88 -27 141 -144 -235 -365 -199 -167
New inflows 642 976 1 309 445 2 925 580 1 743 594 1 504
Write-offs -326 -161 -250 -154 -173 -118 -593 -669 -390
Start performing -325 -200 -505 -586 -248 -152 -541 -572 -265
FX changes 39 -97 -169 -74 27 85 93 22 -105
Impaired loans at period end 8 579 8 655 8 225 7 867 8 095 5 708 5 548 5 211 6 035
Change in impaired loans
SEKm
Swedish
Banking
Baltic
Banking Estonia Latvia Lithuania
Large
Corporates
&
Institutions
Group
Functions
& Other Total
Impaired loans at Q3 2017 1 566 2 314 1 017 562 735 4 775 8 655
Amortisation -8 -22 26 -24 -24 -76 -106
New inflows 351 133 29 44 60 158 642
Write-offs -99 -78 -9 -51 -18 -149 -326
Start performing -121 -204 -96 -14 -94 -325
FX changes 40 17 10 13 -1 39
Impaired loans at Q4 2017 1 689 2 183 984 527 672 4 707 8 579
Asset taken over and cancelled leases 31 Dec 30 Sep 30 Jun 31 Mar 31 Dec 30 Sep 30 Jun 31 Mar 31 Dec
by business area, SEKm 2017 2017 2017 2017 2016 2016 2016 2016 2015
Swedish Banking
Baltic Banking 167 188 242 238 287 300 309 319 107
Estonia 1 1 1 2 2 26 40 41 2
Latvia 77 91 142 151 196 203 202 205 57
Lithuania 88 96 99 85 89 71 67 73 48
Large Corporates & Institutions 54 113 150 115 115 131 131 36 66
Group Functions & Other 3 3 3 3 24 268
Ektornet 3 3 3 3 19 262
Sweden 3 3 3 3 17 17
Estonia 41
Latvia 173
Lithuania 26
Ukraine 2 5
Other 0 0 0 5 5
Total 221 301 392 356 405 434 443 379 441
44

Asset qualityLoans past dueQ4, 2017
Loans past due 31 Dec 30 Sep 30 Jun 31 Mar 31 Dec 30 Sep 30 Jun 31 Mar 31 Dec
SEKm 2017 2017 2017 2017 2016 2016 2016 2016 2015
31 to 60 days
Swedish Banking 376 338 388 398 369 387 331 377 513
Estonia 148 121 120 159 146 148 169 171 143
Latvia 64 79 84 120 106 102 96 116 94
Lithuania 213 266 232 276 230 220 267 278 157
Baltic Banking 425 466 436 555 482 470 532 565 394
Large Corporates & Institutions 12 11 13 58 114 20 41 151 7
Group Functions & Other
Group 813 815 837 1 011 965 877 904 1 093 914
61 to 90 days
Swedish Banking 456 177 150 166 175 164 158 231 313
Estonia 29 31 36 21 38 56 62 38 28
Latvia 25 22 27 81 17 109 36 31 32
Lithuania 96 113 113 88 69 180 101 102 91
Baltic Banking 150 166 176 190 124 345 199 171 151
Large Corporates & Institutions 1 4 11 15 22 46 3
Group Functions & Other
Group 606 344 330 356 310 524 379 448 467
over 90 days
Swedish Banking 926 977 995 987 938 1 055 1 137 1 158 1 067
Estonia 301 307 308 431 440 447 443 449 457
Latvia 379 429 461 459 497 584 677 681 732
Lithuania 584 602 629 573 626 690 881 781 785
Baltic Banking 1 264 1 338 1 398 1 463 1 563 1 721 2 001 1 911 1 974
Large Corporates & Institutions 5 10 27 79 41 211 48 60 91
Group Functions & Other 95
Group 2 195 2 325 2 420 2 529 2 542 2 987 3 186 3 224 3 132
Loans past due ratio (over 60 days)
%
Swedish Banking 0.12 0.10 0.10 0.10 0.10 0.11 0.11 0.12 0.13
Estonia 0.46 0.49 0.51 0.68 0.72 0.76 0.80 0.80 0.81
Latvia 1.26 1.39 1.53 1.70 1.63 2.18 2.28 2.43 2.63
Lithuania 1.47 1.55 1.66 1.49 1.57 1.96 2.29 2.33 2.37
Baltic Banking 0.94 1.02 1.09 1.16 1.19 1.45 1.60 1.62 1.69
Large Corporates & Institutions 0.01 0.03 0.02 0.07 0.02 0.03 0.04
Group Functions & Other 0.50
Group 0.18 0.17 0.18 0.18 0.18 0.22 0.22 0.23 0.24
45

Asset quality
Private mortgage loans 1)
Q4, 2017
Average Loan-to-value (LTV), % 2)
31 Dec 30 Sep 30 Jun 31 Mar 31 Dec 30 Sep 30 Jun 31 Mar 31 Dec
2017 2017 2017 2017 2016 2016 2016 2016 2015
Total portfolio
Sweden 54 53 53 54 54 54 56 56 57
Estonia 48 48 48 48 49 49 48 48 51
Latvia 79 83 82 86 91 92 97 96 98
Lithuania 64 67 67 67 71 73 73 73 79
New lending 3)
Sweden 68 68 68 68 68 69 69 69 69
Estonia 69 69 68 69 69 68 66 67 67
Latvia 75 74 74 75 74 74 72 72 71
Lithuania 75 75 74 75 75 75 75 75 73
Share of portfolio which amortises, %
Total portfolio
Sweden 4) 68 68 67 66 65 65 64 63 63
Estonia 100 100 100 100 100 100 100 100 100
Latvia 100 100 100 100 100 100 100 100 100
Lithuania 100 100 100 100 100 100 100 100 100
New lending 5)
Sweden 86 87 87 86 86 85 81 80 81
Estonia 100 100 100 100 100 100 100 100 100
Latvia 100 100 100 100 100 100 100 100 100
Lithuania 100 100 100 100 100 100 100 100 100
Share of properties with LTV > 70% 6)
Total portfolio
Sweden 11 10 10 11 11 11 13 13 14
Estonia 7 7 7 7 7 7 6 7 9
Latvia 32 35 34 37 41 41 44 43 45
Lithuania 26 30 29 29 33 35 34 34 42
New lending 5)
Sweden 43 43 42 42 42 45 44 46 44
Estonia 52 56 54 49 48 44 42 43 42
Latvia 68 68 63 68 66 61 64 66 62
Lithuania 83 79 78 79 79 80 80 79 78
Share of properties with LTV > 50% - 70% 6)
Total portfolio
Sweden 26 25 27 27 28 28 33 33 35
Estonia 19 19 20 21 22 22 22 23 25
Latvia 20 19 19 19 18 18 18 18 17
Lithuania 28 27 27 28 26 25 26 26 23
New lending 5)
Sweden 29 30 30 29 29 28 29 28 29
Estonia 33 33 34 32 32 34 35 35 34
Latvia 22 19 25 19 22 27 21 22 27
Lithuania 11 14 15 14 14 14 14 15 14
Share of properties with LTV 0% - 50% 6)
Total portfolio
Sweden 63 64 63 62 61 61 54 54 52
Estonia 74 74 74 73 71 70 72 70 66
Latvia 48 46 46 44 41 40 38 40 38
Lithuania 47 43 44 44 41 39 40 39 35
New lending 5)
Sweden 28 28 28 29 29 27 27 26 27
Estonia 15 11 12 19 20 21 23 21 24
Latvia 10 12 11 13 12 12 15 12 11
Lithuania 6 7 7 6 7 6 6 6 8
1) Based on property level and private individuals loans collateralised by single-family homes, vacation houses and tenant owner rights.
2) LTV calculation method - see cover pool, page 68.
3) New lending LTV is calculated year to date.
4) This includes only households with agreed amortisation plans. In recent years extra amortisation has been around 30% of the volume of
amortisations according to an agreed plan.
5) New Lending - Rolling 3 months data.
6) Share of contracts for Baltic countries.
46

Asset qualityPrivate mortgage loans (cont.) 1)
Q4, 2017
Share of properties with LTV > 70% which
amortises 2)
31 Dec 30 Sep 30 Jun 31 Mar 31 Dec 30 Sep 30 Jun 31 Mar 31 Dec2017 2017 2017 2017 2016 2016 2016 2016 2015
Total portfolio
Sweden 3)
96 95 94 94 93 94 92 90 89
Estonia 100 100 100 100 100 100 100 100 100
Latvia 100 100 100 100 100 100 100 100 100
Lithuania 100 100 100 100 100 100 100 100 100
New lending 4)
Sweden 99 99 99 98 98 98 95 94 95
Estonia 100 100 100 100 100 100 100 100 100
Latvia 100 100 100 100 100 100 100 100 100
Lithuania 100 100 100 100 100 100 100 100 100
Share of properties with LTV > 50% - 70% which amortises
Total portfolio
Sweden 3)
81 81 77 74 71 69 61 58 56
Estonia 100 100 100 100 100 100 100 100 100
Latvia 100 100 100 100 100 100 100 100 100
Lithuania 100 100 100 100 100 100 100 100 100
New lending 4)
Sweden 98 98 98 98 97 94 86 83 83
Estonia 100 100 100 100 100 100 100 100 100
Latvia 100 100 100 100 100 100 100 100 100
Lithuania 100 100 100 100 100 100 100 100 100
Share of properties with LTV 0% - 50% which amortises
Total portfolio
Sweden 3)
58 58 58 58 58 58 59 60 60
Estonia 100 100 100 100 100 100 100 100 100
Latvia 100 100 100 100 100 100 100 100 100
Lithuania 100 100 100 100 100 100 100 100 100
New lending 4)
Sweden 55 56 57 57 56 55 52 53 55
Estonia 100 100 100 100 100 100 100 100 100
Latvia 100 100 100 100 100 100 100 100 100
Lithuania 100 100 100 100 100 100 100 100 100
1) Based on property level and private individuals loans collateralised by single-family homes, vacation houses and tenant owner rights.
2) LTV calculation method - see cover pool, page 68.
3) This includes only households with agreed amortisation plans. In recent years extra amortisation has been around 30% of the volume of amortisations
according to an agreed plan.
4) New Lending - Rolling 3 months data.
Concentration risk - Top 20 Corporate ClientsQ4, 2017
Top 20 corporate exposures,
SEKm
Top 20 corporate exposures 100 915
in % of Common Equity Tier 1 Capital 100
Out of that municipalities 7 094
Out of that to investment grade 93 821
Collateral value of the top 20 61 443
Top 20 corporate exposures by Industry,
SEKm Total
Investment
grade
Collateral
value
Construction 5 320 5 320 549
Finance and Insurance
Manufacturing 17 867 17 867 6 969
Property Management 57 776 57 776 46 299
Public sector and utilities 7 094
Shipping and offshore 12 858 12 858 7 626
Total 100 915 93 821 61 443
Excluding exposures on partly owned subsidiaries.
47
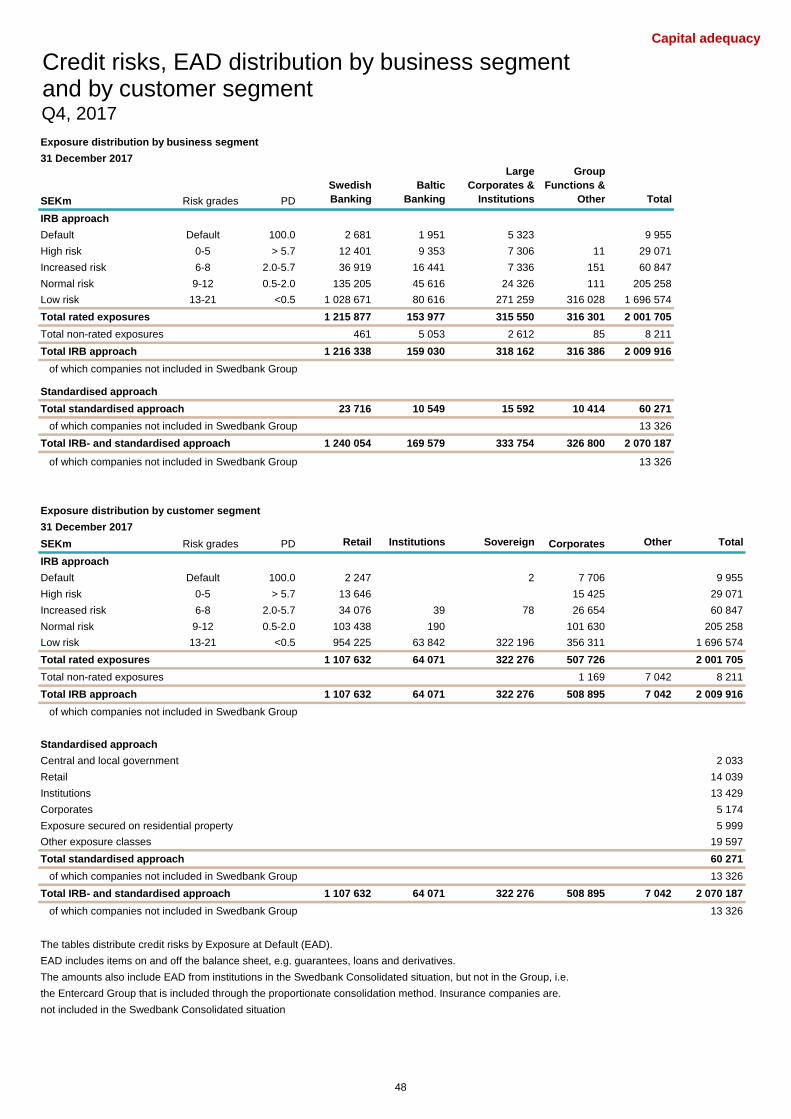
Capital adequacy
Credit risks, EAD distribution by business segmentand by customer segmentQ4, 2017
Exposure distribution by business segment
31 December 2017
SEKm Risk grades PD
Swedish
Banking
Baltic
Banking
Large
Corporates &
Institutions
Group
Functions &
Other Total
IRB approach
Default Default 100.0 2 681 1 951 5 323 9 955
High risk 0-5 > 5.7 12 401 9 353 7 306 11 29 071
Increased risk 6-8 2.0-5.7 36 919 16 441 7 336 151 60 847
Normal risk 9-12 0.5-2.0 135 205 45 616 24 326 111 205 258
Low risk 13-21 <0.5 1 028 671 80 616 271 259 316 028 1 696 574
Total rated exposures 1 215 877 153 977 315 550 316 301 2 001 705
Total non-rated exposures 461 5 053 2 612 85 8 211
Total IRB approach 1 216 338 159 030 318 162 316 386 2 009 916
of which companies not included in Swedbank Group
Standardised approach
Total standardised approach 23 716 10 549 15 592 10 414 60 271
of which companies not included in Swedbank Group 13 326
Total IRB- and standardised approach 1 240 054 169 579 333 754 326 800 2 070 187
of which companies not included in Swedbank Group 13 326
Exposure distribution by customer segment
31 December 2017
SEKm Risk grades PD Retail Institutions Sovereign Corporates Other Total
IRB approach
Default Default 100.0 2 247 2 7 706 9 955
High risk 0-5 > 5.7 13 646 15 425 29 071
Increased risk 6-8 2.0-5.7 34 076 39 78 26 654 60 847
Normal risk 9-12 0.5-2.0 103 438 190 101 630 205 258
Low risk 13-21 <0.5 954 225 63 842 322 196 356 311 1 696 574
Total rated exposures 1 107 632 64 071 322 276 507 726 2 001 705
Total non-rated exposures 1 169 7 042 8 211
Total IRB approach 1 107 632 64 071 322 276 508 895 7 042 2 009 916
of which companies not included in Swedbank Group
Standardised approach
Central and local government 2 033
Retail 14 039
Institutions 13 429
Corporates 5 174
Exposure secured on residential property 5 999
Other exposure classes 19 597
Total standardised approach 60 271
of which companies not included in Swedbank Group 13 326
Total IRB- and standardised approach 1 107 632 64 071 322 276 508 895 7 042 2 070 187
of which companies not included in Swedbank Group 13 326
The tables distribute credit risks by Exposure at Default (EAD).
EAD includes items on and off the balance sheet, e.g. guarantees, loans and derivatives.
The amounts also include EAD from institutions in the Swedbank Consolidated situation, but not in the Group, i.e.
the Entercard Group that is included through the proportionate consolidation method. Insurance companies are.
not included in the Swedbank Consolidated situation
48

Capital adequacy
31 December 2017
SEKm
Swedish
Banking Baltic Banking
- of which
Estonia - of which Latvia
- of which
Lithuania
- of which
Investment and
Other
Large
Corporates &
Institutions
Group
Functions &
Other Total
Retail - mortgages 1)
Exposure 934 688 66 267 30 774 13 288 22 205 264 1 332 1 002 551
Risk exposure amount, pillar 1 34 208 13 385 5 026 3 816 4 543 15 38 47 646
Exposure weighted average PD (incl defaults), % 0.32 3.34 2.37 5.37 3.48 0.17 0.28 0.52
Exposure weighted average PD (excl defaults), % 0.25 2.02 1.75 3.13 1.74 0.17 0.28 0.37
Exposure weighted average LGD, % 10.3 15.2 13.2 17.3 16.8 19.0 12.1 10.6
Average risk weight, % 3.7 20.2 16.3 28.7 20.5 5.5 2.8 4.8
Retail - other
Exposure 83 332 18 831 8 621 4 837 5 373 2 904 14 105 081
Risk exposure amount, pillar 1 17 710 9 026 3 971 3 046 2 009 1 426 3 28 165
Exposure weighted average PD (incl defaults), % 1.62 3.68 2.92 5.49 3.28 2.41 1.76 2.01
Exposure weighted average PD (excl defaults), % 1.03 2.86 2.36 4.25 2.41 2.41 1.76 1.40
Exposure weighted average LGD, % 33.1 45.3 45.6 50.8 39.9 47.7 22.7 35.7
Average risk weight, % 21.3 47.9 46.1 63.0 37.4 49.1 24.5 26.8
Corporate - Avanced-IRB
Exposure 158 580 265 393 721 424 694
Risk exposure amount, pillar 1 48 423 70 183 45 118 651
Exposure weighted average PD (incl defaults), % 1.74 2.58 0.04 2.26
Exposure weighted average PD (excl defaults), % 1.08 0.59 0.04 0.77
Exposure weighted average LGD, % 18.1 21.2 26.8 20.1
Average risk weight, % 30.5 26.5 6.4 27.9
Corporate - Foundation-IRB
Exposure 8 219 64 985 30 144 14 789 20 052 8 993 836 83 033
Risk exposure amount, pillar 1 3 638 40 802 17 408 11 465 11 929 5 191 383 50 014
Exposure weighted average PD (incl defaults), % 5.94 2.97 3.30 3.19 2.32 0.87 0.49 3.01
Exposure weighted average PD (excl defaults), % 0.77 1.62 1.54 2.56 1.03 0.86 0.49 1.44
Exposure weighted average LGD, % 35.5 44.5 44.5 44.5 44.4 45.0 44.5 43.6
Average risk weight, % 44.3 62.8 57.8 77.5 59.5 57.7 45.7 60.2
Corporate - specialised lending
Exposure 1 168 631 396 141 1 168
Risk exposure amount, pillar 1 1 137 657 406 74 1 137
Average risk weight, % 97.4 104.1 102.4 52.8 97.4
Sovereigns - Foundation-IRB
Exposure 24 325 3 141 1 506 521 1 114 18 620 276 190 322 276
Risk exposure amount, pillar 1 901 240 77 77 86 519 3 261 4 921
Exposure weighted average PD (incl defaults), % 0.01 0.09 0.17 0.03 0.01 0.00 0.00 0.00
Exposure weighted average PD (excl defaults), % 0.01 0.01 0.01 0.03 0.01 0.00 0.00 0.00
Exposure weighted average LGD, % 44.8 45.0 45.0 45.0 45.0 44.8 45.0 45
Average risk weight, % 3.7 7.7 5.1 14.7 7.7 2.8 1.2 1.5
Institutions
Exposure 6 733 753 334 168 251 19 377 37 208 64 071
Risk exposure amount, pillar 1 1 639 220 100 52 68 6 022 3 360 11 241
Exposure weighted average PD (incl defaults), % 0.07 0.10 0.09 0.09 0.11 0.08 0.04 0.06
Exposure weighted average PD (excl defaults), % 0.07 0.10 0.09 0.09 0.11 0.08 0.04 0.06
Exposure weighted average LGD, % 45.0 44.9 44.8 45.0 45.0 45.0 15.7 28.0
Average risk weight, % 24.3 29.2 30.0 30.8 27.1 31.1 9.0 17.5
Other IRB exposure classes
Exposure 461 3 885 1 259 1 391 1 235 2 611 85 7 042
Risk exposure amount, pillar 1 326 832 287 545 2 557 73 3 788
Average risk weight, % 70.7 21.4 22.8 39.2 97.9 85.9 53.8
Total IRB approach
Exposure 1 216 338 159 030 73 269 35 390 50 371 0 318 162 316 386 2 009 916
Risk exposure amount, pillar 1 106 845 65 642 27 526 19 407 18 709 0 85 913 7 163 265 563
Exposure weighted average PD (incl defaults), % 0.63 3.14 2.77 4.32 2.89 2.22 0.01 0.98
Exposure weighted average PD (excl defaults), % 0.41 1.90 1.69 2.97 1.47 0.55 0.01 0.48
Exposure weighted average LGD, % 13.9 32.0 31.1 34.7 31.4 25.0 41.4 21.4
Average risk weight, % 8.8 41.3 37.6 54.8 37.1 27.0 2.3 13.2
Standardised approach
Exposure 23 716 10 549 4 642 1 256 4 135 516 15 592 10 414 60 271
Risk exposure amount, pillar 1 25 855 6 749 2 221 614 2 623 1 291 3 225 2 245 38 074
Average risk weight, % 109.0 64.0 47.8 48.9 63.4 250.0 20.7 21.6 63.2
Total exposures
Exposure 1 240 054 169 579 77 911 36 646 54 506 516 333 754 326 800 2 070 187
Risk exposure amount, pillar 1 132 700 72 391 29 747 20 021 21 332 1 291 89 138 9 408 303 637
Average risk weight, % 10.7 42.7 38.2 54.6 39.1 250.0 26.7 2.9 14.7
1) Average risk weights and capital requirements is presented for Pillar 1. Because of the risk weight floor of 25 percent for the Swedish mortgage portfolio, Swedbank has to maintain additional
CET 1 capital within Pillar 2.
The IRB approach tables distribute credit risks by Exposure at Default (EAD).
EAD includes items on and off the balance sheet, e.g. guarantees, loans and derivatives.
The amounts comprise the Swedbank Group with the exception of insurance companies.
The Entercard Group is included as well through the proportionate consolidation method.
The breakdown into exposure classes is made in accordance to the capital adequacy framework in Basel 3.
Capital adequacy parameters for credit risk - business segmentsQ4, 2017
49
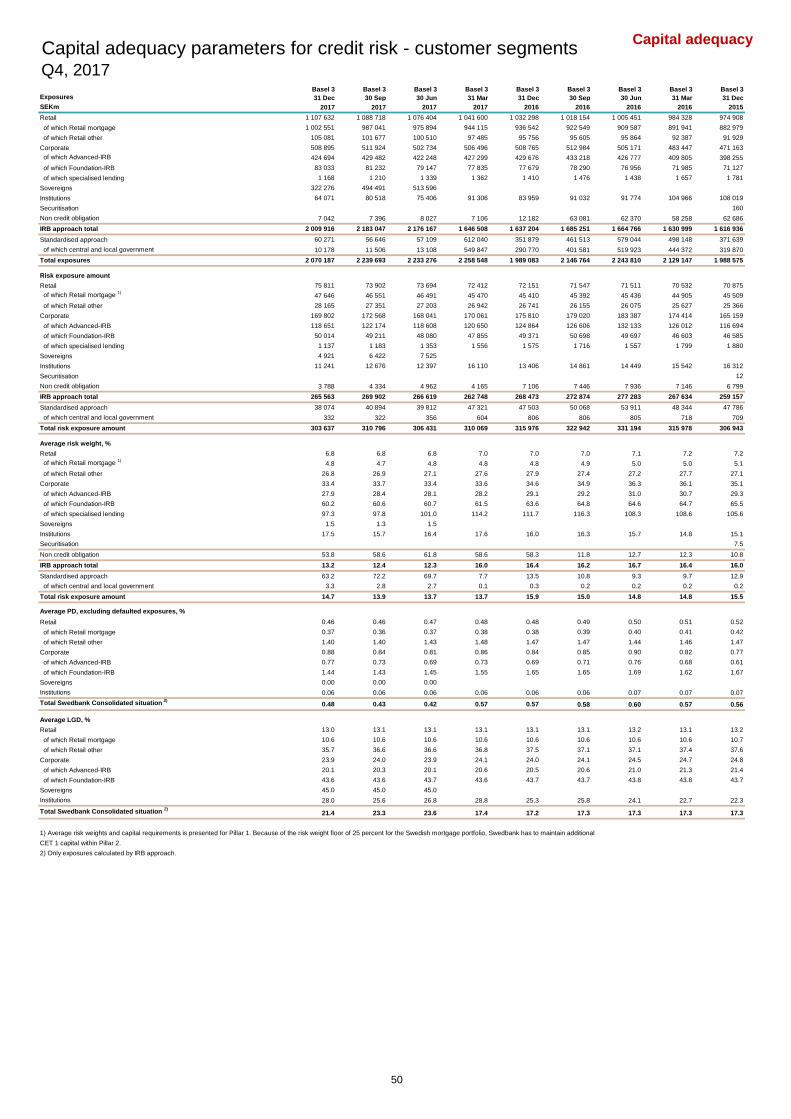
Capital adequacy
ExposuresBasel 3
31 Dec
Basel 3
30 Sep
Basel 3
30 Jun
Basel 3
31 Mar
Basel 3
31 Dec
Basel 3
30 Sep
Basel 3
30 Jun
Basel 3
31 Mar
Basel 3
31 Dec
SEKm 2017 2017 2017 2017 2016 2016 2016 2016 2015
Retail 1 107 632 1 088 718 1 076 404 1 041 600 1 032 298 1 018 154 1 005 451 984 328 974 908
of which Retail mortgage 1 002 551 987 041 975 894 944 115 936 542 922 549 909 587 891 941 882 979
of which Retail other 105 081 101 677 100 510 97 485 95 756 95 605 95 864 92 387 91 929
Corporate 508 895 511 924 502 734 506 496 508 765 512 984 505 171 483 447 471 163
of which Advanced-IRB 424 694 429 482 422 248 427 299 429 676 433 218 426 777 409 805 398 255
of which Foundation-IRB 83 033 81 232 79 147 77 835 77 679 78 290 76 956 71 985 71 127
of which specialised lending 1 168 1 210 1 339 1 362 1 410 1 476 1 438 1 657 1 781
Sovereigns 322 276 494 491 513 596
Institutions 64 071 80 518 75 406 91 306 83 959 91 032 91 774 104 966 108 019
Securitisation 160
Non credit obligation 7 042 7 396 8 027 7 106 12 182 63 081 62 370 58 258 62 686
IRB approach total 2 009 916 2 183 047 2 176 167 1 646 508 1 637 204 1 685 251 1 664 766 1 630 999 1 616 936
Standardised approach 60 271 56 646 57 109 612 040 351 879 461 513 579 044 498 148 371 639
of which central and local government 10 178 11 506 13 108 549 847 290 770 401 581 519 923 444 372 319 870
Total exposures 2 070 187 2 239 693 2 233 276 2 258 548 1 989 083 2 146 764 2 243 810 2 129 147 1 988 575
Risk exposure amount
Retail 75 811 73 902 73 694 72 412 72 151 71 547 71 511 70 532 70 875
of which Retail mortgage 1)
47 646 46 551 46 491 45 470 45 410 45 392 45 436 44 905 45 509
of which Retail other 28 165 27 351 27 203 26 942 26 741 26 155 26 075 25 627 25 366
Corporate 169 802 172 568 168 041 170 061 175 810 179 020 183 387 174 414 165 159
of which Advanced-IRB 118 651 122 174 118 608 120 650 124 864 126 606 132 133 126 012 116 694
of which Foundation-IRB 50 014 49 211 48 080 47 855 49 371 50 698 49 697 46 603 46 585
of which specialised lending 1 137 1 183 1 353 1 556 1 575 1 716 1 557 1 799 1 880
Sovereigns 4 921 6 422 7 525
Institutions 11 241 12 676 12 397 16 110 13 406 14 861 14 449 15 542 16 312
Securitisation 12
Non credit obligation 3 788 4 334 4 962 4 165 7 106 7 446 7 936 7 146 6 799
IRB approach total 265 563 269 902 266 619 262 748 268 473 272 874 277 283 267 634 259 157
Standardised approach 38 074 40 894 39 812 47 321 47 503 50 068 53 911 48 344 47 786
of which central and local government 332 322 356 604 806 806 805 718 709
Total risk exposure amount 303 637 310 796 306 431 310 069 315 976 322 942 331 194 315 978 306 943
Average risk weight, %
Retail 6.8 6.8 6.8 7.0 7.0 7.0 7.1 7.2 7.2
of which Retail mortgage 1)
4.8 4.7 4.8 4.8 4.8 4.9 5.0 5.0 5.1
of which Retail other 26.8 26.9 27.1 27.6 27.9 27.4 27.2 27.7 27.1
Corporate 33.4 33.7 33.4 33.6 34.6 34.9 36.3 36.1 35.1
of which Advanced-IRB 27.9 28.4 28.1 28.2 29.1 29.2 31.0 30.7 29.3
of which Foundation-IRB 60.2 60.6 60.7 61.5 63.6 64.8 64.6 64.7 65.5
of which specialised lending 97.3 97.8 101.0 114.2 111.7 116.3 108.3 108.6 105.6
Sovereigns 1.5 1.3 1.5
Institutions 17.5 15.7 16.4 17.6 16.0 16.3 15.7 14.8 15.1
Securitisation 7.5
Non credit obligation 53.8 58.6 61.8 58.6 58.3 11.8 12.7 12.3 10.8
IRB approach total 13.2 12.4 12.3 16.0 16.4 16.2 16.7 16.4 16.0
Standardised approach 63.2 72.2 69.7 7.7 13.5 10.8 9.3 9.7 12.9
of which central and local government 3.3 2.8 2.7 0.1 0.3 0.2 0.2 0.2 0.2
Total risk exposure amount 14.7 13.9 13.7 13.7 15.9 15.0 14.8 14.8 15.5
Average PD, excluding defaulted exposures, %
Retail 0.46 0.46 0.47 0.48 0.48 0.49 0.50 0.51 0.52
of which Retail mortgage 0.37 0.36 0.37 0.38 0.38 0.39 0.40 0.41 0.42
of which Retail other 1.40 1.40 1.43 1.48 1.47 1.47 1.44 1.46 1.47
Corporate 0.88 0.84 0.81 0.86 0.84 0.85 0.90 0.82 0.77
of which Advanced-IRB 0.77 0.73 0.69 0.73 0.69 0.71 0.76 0.68 0.61
of which Foundation-IRB 1.44 1.43 1.45 1.55 1.65 1.65 1.69 1.62 1.67
Sovereigns 0.00 0.00 0.00
Institutions 0.06 0.06 0.06 0.06 0.06 0.06 0.07 0.07 0.07
Total Swedbank Consolidated situation 2)
0.48 0.43 0.42 0.57 0.57 0.58 0.60 0.57 0.56
Average LGD, %
Retail 13.0 13.1 13.1 13.1 13.1 13.1 13.2 13.1 13.2
of which Retail mortgage 10.6 10.6 10.6 10.6 10.6 10.6 10.6 10.6 10.7
of which Retail other 35.7 36.6 36.6 36.8 37.5 37.1 37.1 37.4 37.6
Corporate 23.9 24.0 23.9 24.1 24.0 24.1 24.5 24.7 24.8
of which Advanced-IRB 20.1 20.3 20.1 20.6 20.5 20.6 21.0 21.3 21.4
of which Foundation-IRB 43.6 43.6 43.7 43.6 43.7 43.7 43.8 43.8 43.7
Sovereigns 45.0 45.0 45.0
Institutions 28.0 25.6 26.8 28.8 25.3 25.8 24.1 22.7 22.3
Total Swedbank Consolidated situation 2)
21.4 23.3 23.6 17.4 17.2 17.3 17.3 17.3 17.3
1) Average risk weights and capital requirements is presented for Pillar 1. Because of the risk weight floor of 25 percent for the Swedish mortgage portfolio, Swedbank has to maintain additional
CET 1 capital within Pillar 2.
2) Only exposures calculated by IRB approach.
Capital adequacy parameters for credit risk - customer segmentsQ4, 2017
50

Capital adequacy
ExposuresBasel 3
31 Dec
Basel 3
30 Sep
Basel 3
30 Jun
Basel 3
31 Mar
Basel 3
31 Dec
Basel 3
30 Sep
Basel 3
30 Jun
Basel 3
31 Mar
Basel 3
31 Dec
SEKm 2017 2017 2017 2017 2016 2016 2016 2016 2015
Expected loss
Retail 1 702 1 697 1 746 1 784 1 809 1 832 1 869 1 874 1 951
of which Retail mortgage 791 792 831 865 913 942 965 981 1 038
of which Retail other 911 905 915 919 896 890 904 893 913
Corporate 3 938 3 743 3 536 3 882 3 428 2 853 2 701 2 374 2 460
of which Advanced-IRB 2 645 2 609 2 392 2 536 2 183 1 593 1 416 1 125 1 176
of which Foundation-IRB 1 110 951 957 1 178 1 076 1 073 1 099 1 040 1 076
of which specialised lending 183 183 187 168 169 187 186 209 208
Sovereigns 5 8 8
Institutions 12 14 25 17 16 17 17 19 18
Total Swedbank Consolidated situation 1)
5 657 5 462 5 315 5 683 5 253 4 702 4 587 4 267 4 429
Expected loss, non defaulted exposures
Retail 1 099 1 070 1 078 1 070 1 066 1 069 1 064 1 049 1 065
of which Retail mortgage 504 494 503 495 496 503 506 503 517
of which Retail other 595 576 575 575 570 566 558 546 548
Corporate 1 241 1 185 1 137 1 239 1 245 1 281 1 334 1 158 1 063
of which Advanced-IRB 697 654 606 681 652 679 731 610 507
of which Foundation-IRB 517 503 499 520 554 559 564 504 512
of which specialised lending 27 28 32 38 39 44 38 44 44
Sovereigns 4 7 8
Institutions 12 14 25 17 16 17 17 19 18
Total Swedbank Consolidated situation 1)
2 356 2 276 2 248 2 326 2 327 2 367 2 415 2 226 2 146
Expected loss, defaulted exposures
Retail 603 627 668 714 743 763 805 825 886
of which Retail mortgage 287 298 328 370 417 439 459 479 522
of which Retail other 316 329 340 344 326 324 346 346 364
Corporate 2 697 2 558 2 399 2 643 2 183 1 572 1 367 1 216 1 398
of which Advanced-IRB 1 948 1 955 1 786 1 855 1 531 914 685 515 669
of which Foundation-IRB 593 448 458 658 522 514 535 536 564
of which specialised lending 156 155 155 130 130 143 148 165 165
Sovereigns 1 1
Institutions
Total Swedbank Consolidated situation 1)
3 301 3 186 3 067 3 357 2 926 2 335 2 172 2 041 2 284
Defaulted exposures
Retail 2 248 2 349 2 461 2 590 2 681 2 795 2 907 3 075 3 232
of which Retail mortgage 1 589 1 652 1 753 1 860 1 954 2 078 2 159 2 301 2 441
of which Retail other 659 697 708 730 727 717 748 774 791
Corporate 8 017 7 700 7 708 7 866 7 809 4 366 4 230 2 875 3 055
of which Advanced-IRB 6 381 6 388 6 372 6 139 6 383 2 889 2 787 1 394 1 523
of which Foundation-IRB 1 324 1 002 1 026 1 467 1 166 1 150 1 195 1 197 1 259
of which specialised lending 312 310 309 260 260 327 248 284 273
Sovereigns 2 2
Institutions
Total Swedbank Consolidated situation 1)
10 267 10 051 10 169 10 456 10 490 7 161 7 137 5 950 6 287
1) Only exposures calculated by IRB approach.
Capital adequacy parameters for credit risk - customer segments cont.Q4, 2017
51
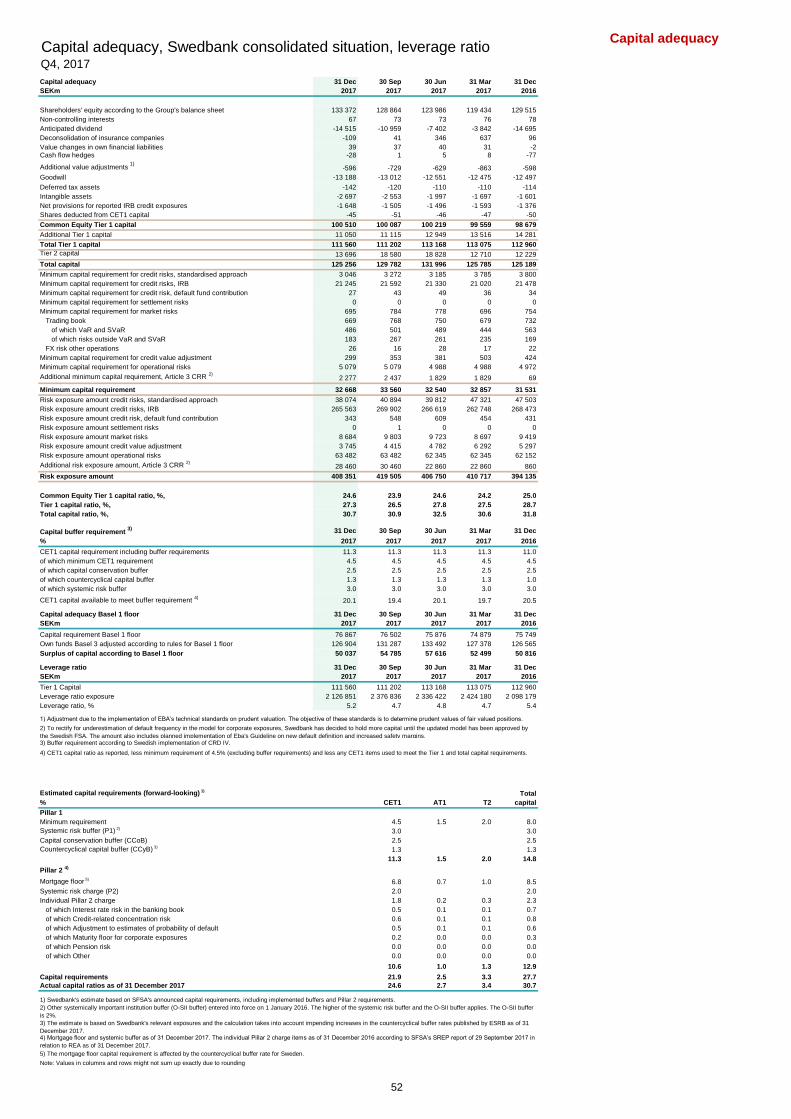
Capital adequacyCapital adequacy, Swedbank consolidated situation, leverage ratioQ4, 2017
Capital adequacy 31 Dec 30 Sep 30 Jun 31 Mar 31 Dec
SEKm 2017 2017 2017 2017 2016
Shareholders' equity according to the Group's balance sheet 133 372 128 864 123 986 119 434 129 515
Non-controlling interests 67 73 73 76 78
Anticipated dividend -14 515 -10 959 -7 402 -3 842 -14 695
Deconsolidation of insurance companies -109 41 346 637 96
Value changes in own financial liabilities 39 37 40 31 -2Cash flow hedges -28 1 5 8 -77
Additional value adjustments 1)
-596 -729 -629 -863 -598
Goodwill -13 188 -13 012 -12 551 -12 475 -12 497
Deferred tax assets -142 -120 -110 -110 -114
Intangible assets -2 697 -2 553 -1 997 -1 697 -1 601
Net provisions for reported IRB credit exposures -1 648 -1 505 -1 496 -1 593 -1 376
Shares deducted from CET1 capital -45 -51 -46 -47 -50
Common Equity Tier 1 capital 100 510 100 087 100 219 99 559 98 679
Additional Tier 1 capital 11 050 11 115 12 949 13 516 14 281
Total Tier 1 capital 111 560 111 202 113 168 113 075 112 960
Tier 2 capital 13 696 18 580 18 828 12 710 12 229
Total capital 125 256 129 782 131 996 125 785 125 189
Minimum capital requirement for credit risks, standardised approach 3 046 3 272 3 185 3 785 3 800
Minimum capital requirement for credit risks, IRB 21 245 21 592 21 330 21 020 21 478
Minimum capital requirement for credit risk, default fund contribution 27 43 49 36 34
Minimum capital requirement for settlement risks 0 0 0 0 0
Minimum capital requirement for market risks 695 784 778 696 754
Trading book 669 768 750 679 732
of which VaR and SVaR 486 501 489 444 563
of which risks outside VaR and SVaR 183 267 261 235 169
FX risk other operations 26 16 28 17 22
Minimum capital requirement for credit value adjustment 299 353 381 503 424
Minimum capital requirement for operational risks 5 079 5 079 4 988 4 988 4 972
Additional minimum capital requirement, Article 3 CRR 2)
2 277 2 437 1 829 1 829 69
Minimum capital requirement 32 668 33 560 32 540 32 857 31 531
Risk exposure amount credit risks, standardised approach 38 074 40 894 39 812 47 321 47 503
Risk exposure amount credit risks, IRB 265 563 269 902 266 619 262 748 268 473
Risk exposure amount credit risk, default fund contribution 343 548 609 454 431
Risk exposure amount settlement risks 0 1 0 0 0
Risk exposure amount market risks 8 684 9 803 9 723 8 697 9 419
Risk exposure amount credit value adjustment 3 745 4 415 4 782 6 292 5 297
Risk exposure amount operational risks 63 482 63 482 62 345 62 345 62 152
Additional risk exposure amount, Article 3 CRR 2)
28 460 30 460 22 860 22 860 860
Risk exposure amount 408 351 419 505 406 750 410 717 394 135
Common Equity Tier 1 capital ratio, %, 24.6 23.9 24.6 24.2 25.0
Tier 1 capital ratio, %, 27.3 26.5 27.8 27.5 28.7
Total capital ratio, %, 30.7 30.9 32.5 30.6 31.8
Capital buffer requirement 3) 31 Dec 30 Sep 30 Jun 31 Mar 31 Dec
% 2017 2017 2017 2017 2016
CET1 capital requirement including buffer requirements 11.3 11.3 11.3 11.3 11.0
of which minimum CET1 requirement 4.5 4.5 4.5 4.5 4.5
of which capital conservation buffer 2.5 2.5 2.5 2.5 2.5
of which countercyclical capital buffer 1.3 1.3 1.3 1.3 1.0
of which systemic risk buffer 3.0 3.0 3.0 3.0 3.0
CET1 capital available to meet buffer requirement 4)
20.1 19.4 20.1 19.7 20.5
Capital adequacy Basel 1 floor 31 Dec 30 Sep 30 Jun 31 Mar 31 Dec
SEKm 2017 2017 2017 2017 2016
Capital requirement Basel 1 floor 76 867 76 502 75 876 74 879 75 749
Own funds Basel 3 adjusted according to rules for Basel 1 floor 126 904 131 287 133 492 127 378 126 565
Surplus of capital according to Basel 1 floor 50 037 54 785 57 616 52 499 50 816
Leverage ratio 31 Dec 30 Sep 30 Jun 31 Mar 31 Dec
SEKm 2017 2017 2017 2017 2016
Tier 1 Capital 111 560 111 202 113 168 113 075 112 960
Leverage ratio exposure 2 126 851 2 376 836 2 336 422 2 424 180 2 098 179
Leverage ratio, % 5.2 4.7 4.8 4.7 5.4
3) Buffer requirement according to Swedish implementation of CRD IV.
Estimated capital requirements (forward-looking) 1)Total
% CET1 AT1 T2 capital
Pillar 1
Minimum requirement 4.5 1.5 2.0 8.0
Systemic risk buffer (P1) 2)3.0 3.0
Capital conservation buffer (CCoB) 2.5 2.5
Countercyclical capital buffer (CCyB) 3)1.3 1.3
11.3 1.5 2.0 14.8
Pillar 2 4)
Mortgage floor 5)6.8 0.7 1.0 8.5
Systemic risk charge (P2) 2.0 2.0
Individual Pillar 2 charge 1.8 0.2 0.3 2.3
of which Interest rate risk in the banking book 0.5 0.1 0.1 0.7
of which Credit-related concentration risk 0.6 0.1 0.1 0.8
of which Adjustment to estimates of probability of default 0.5 0.1 0.1 0.6
of which Maturity floor for corporate exposures 0.2 0.0 0.0 0.3
of which Pension risk 0.0 0.0 0.0 0.0
of which Other 0.0 0.0 0.0 0.0
10.6 1.0 1.3 12.9
Capital requirements 21.9 2.5 3.3 27.7
Actual capital ratios as of 31 December 2017 24.6 2.7 3.4 30.7
1) Swedbank's estimate based on SFSA's announced capital requirements, including implemented buffers and Pillar 2 requirements.
Note: Values in columns and rows might not sum up exactly due to rounding
5) The mortgage floor capital requirement is affected by the countercyclical buffer rate for Sweden.
1) Adjustment due to the implementation of EBA’s technical standards on prudent valuation. The objective of these standards is to determine prudent values of fair valued positions.
4) CET1 capital ratio as reported, less minimum requirement of 4.5% (excluding buffer requirements) and less any CET1 items used to meet the Tier 1 and total capital requirements.
4) Mortgage floor and systemic buffer as of 31 December 2017. The individual Pillar 2 charge items as of 31 December 2016 according to SFSA’s SREP report of 29 September 2017 in
relation to REA as of 31 December 2017.
3) The estimate is based on Swedbank's relevant exposures and the calculation takes into account impending increases in the countercyclical buffer rates published by ESRB as of 31
December 2017.
2) Other systemically important institution buffer (O-SII buffer) entered into force on 1 January 2016. The higher of the systemic risk buffer and the O-SII buffer applies. The O-SII buffer
is 2%.
2) To rectify for underestimation of default frequency in the model for corporate exposures, Swedbank has decided to hold more capital until the updated model has been approved by
the Swedish FSA. The amount also includes planned implementation of Eba's Guideline on new default definition and increased safety margins.
52

Capital adequacy
Estimated capital requirements (forward-looking) by entity, Change in Risk exposure amount and
Outstanding subordinated debtQ4, 2017
Estimated capital requirements (forward-looking) 1)
% CET1 AT1 T2
Total
capital CET1 AT1 T2
Total
capital
Pillar 1
Minimum requirement 4.5 1.5 2.0 8.0 4.5 1.5 2.0 8.0
Systemic risk buffer/O-SII buffer 2)
Capital conservation buffer (CCoB) 2.5 2.5 2.5 2.5
Countercyclical capital buffer (CCyB) 3)
1.6 1.6 2.0 2.0
Total Pillar 1 8.6 1.5 2.0 12.1 9.0 1.5 2.0 12.5
Pillar 2 4)
Mortgage floor 0.0 0.0 0.0 0.0 31.1 5.2 6.9 43.2
Systemic risk charge
Individual pillar 2 charge 0.9 0.2 0.2 1.6 2.6 0.5 0.7 3.9
Total Pillar 2 0.9 0.2 0.2 1.6 33.7 5.7 7.6 47.1
Capital requirements 9.5 1.7 2.2 13.7 42.7 7.2 9.6 59.6
Capital ratios as of 31 December 2017 25.2 3.5 4.4 33.1 81.3 81.3
Estimated capital requirements (forward-looking) 1)
% CET1 AT1 T2
Total
capital CET1 AT1 T2
Total
capital CET1 AT1 T2
Total
capital
Pillar 1
Minimum requirement 4.5 1.5 2.0 8.0 4.5 1.5 2.0 8.0 4.5 1.5 2.0 8.0
Systemic risk buffer 2)
1.0 1.0 0.0 0.0
O-SII buffer 2)
2.0 2.0 2.0 2.0 2.0 2.0
Capital conservation buffer (CCoB) 2.5 2.5 2.5 2.5 2.5 2.5
Countercyclical capital buffer (CCyB) 3)
0.0 0.0 0.0 0.0 0.5 0.5
Total Pillar 1 10.0 1.5 2.0 13.5 9.0 1.5 2.0 12.5 9.5 1.5 2.0 13.0
Pillar 2 5)
Individual pillar 2 charge 1.2 1.2 1.0 1.0 1.8 1.8
Individual pillar 2 guidance 6)
1.0 1.0 1.0 1.0 1.0 1.0
Total Pillar 2 2.2 2.2 2.0 2.0 2.8 2.8
Capital requirements 12.2 1.5 2.0 15.7 11.0 1.5 2.0 14.5 12.3 1.5 2.0 15.8
Capital ratios as of 31 December 2017 40.1 40.1 25.8 25.8 22.9 22.9
1) Swedbank's estimate based on announced capital requirements, including implemented buffers and Pillar 2 requirements.
2) For Swedbank Latvia O-SII buffer of 1% will be applicable from 30 June 2017 and 2% from 30 June 2018.
3)The estimate is based on the relevant exposures and the calculation takes into account impending increases in the countercyclical buffer rates published by ESRB as of 30 December 2017.
4) Mortgage floor as of 30 December 2017. The individual Pillar 2 charge as of 31 December 2016 according to SFSA’s SREP report of 29 September 2017 in relation to REA as of 30 December 2017.
5) According to the ECBs 2017 SREP report of 29 September 2017 as of 31 December 2016.
6) Failure to comply is not in itself a breach of own funds requirements. P2G also does not stipulate any limitation on the Maximum Distributable Amount.
Note: There might be a case when values in columns and rows don’t sum up exactly due to rounding.
Change in Risk exposure amount
(REA), Basel 3 Q4 Q3 Q2 Q1 Q4 Q3 Q2 Q1 Q4 Q3 Q2 Q1
SEKm 2017 2017 2017 2017 2016 2016 2016 2016 2015 2015 2015 2015
REA at beginning of period, Basel 3 419 505 406 750 410 717 394 135 403 711 413 366 398 831 389 098 404 196 406 754 422 339 414 214
Exposure change (EAD) -1 143 6 339 384 -1 776 357 1 686 14 742 8 182 -5 264 4 199 -1 808 8 130
Rating migration (PD) 2 156 219 -2 989 -607 -2 702 -4 484 2 785 5 236 -159 -3 256 -3 701 -939
LGD change -3 203 -1 544 -2 928 1 236 -2 429 -2 111 -2 829 -2 768 -3 103 -1 925 -2 441 -3 651
Credit risk other -5 174 -711 2 051 -4 737 -1 799 -3 335 486 -1 613 -2 131 1 351 -1 695 -3 830
CVA risk -670 -366 -1 511 995 -950 -1 538 -389 752 -301 154 -1 740 2 066
Market risk -1 120 80 1 026 -722 -2 053 127 -260 875 -3 835 -3 081 -3 707 2 270
Operational risk 1 138 193 -931 -305 0 4 078
Add-on according to article 3 -2 000 7 600 22 000
REA at period end, Basel 3 408 351 419 505 406 750 410 717 394 135 403 711 413 366 398 831 389 098 404 196 406 754 422 339
Outstanding subordinated debt - Swedbank AB (parent company)
31 Dec 2017 Nominal Carrying
ISIN Value date Maturity date Coupon Call date
Coupon after
call date Currency
amount, local
currency, m
amount,
SEKm 1) Fitch Moody's S&P
Tier 2
SE0000122111 26-Apr-89 26-Apr-19 11.00% n.a.
Fixed 11% until
maturity SEK 111 120
XS1036494638 26-Feb-14 26-Feb-24 2.38% 26-Feb-19
Fixed rate equiv.
to EUR MS
+140bps EUR 750 7 441 A+ A-
SE0005497781 25-Oct-13 25-Oct-23
3mStibor
+310bps 25-Oct-18
3mStibor
+310bps SEK 395 395
SE0005561594 27-Nov-13 27-Nov-23
3mStibor
+300bps 27-Nov-18
3mStibor
+300bps SEK 142 142
XS1617859464 22-May-17 22-Nov-27 1.00% 22-Nov-22
Fixed rate equiv.
to EUR MS
82bps EUR 650 6 324 A+ Baa1 A-
Total Tier 2 14 422
Additional Tier 1
XS0363160127 2) 12-May-08 Perpetual 8.28% 17-Sep-18
Float 6mStibor
+450bps SEK 869 1 005
XS1190655776 19-Feb-15 Perpetual 5.50% 17-Mar-20
Fixed rate eq. to
USD MS
+377bps USD 750 6 066 BBB BBB
XS1535953134 16-Dec-16 Perpetual 6.00% 17-Mar-22
Fixed rate eq. to
USD
MS+411bps USD 500 4 015 BBB Baa3 BBB
Total Additional Tier 1 11 086
Total 25 508
1) Excluding intragroup holdings.
2) Grandfathered under CRR.
Rating
Swedbank AB
Swedbank Estonia Swedbank Latvia Swedbank Lithuania
Swedbank Mortgage AB
53
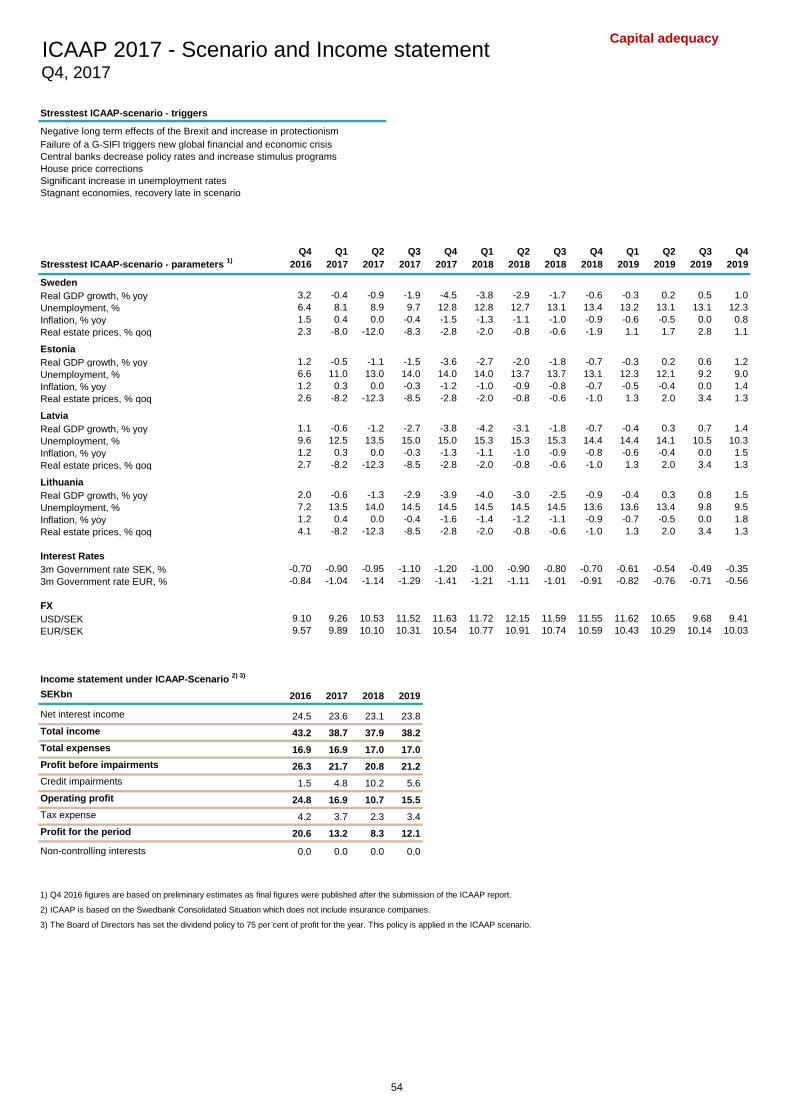
Capital adequacyICAAP 2017 - Scenario and Income statementQ4, 2017
Stresstest ICAAP-scenario - triggers
Negative long term effects of the Brexit and increase in protectionism
Failure of a G-SIFI triggers new global financial and economic crisis
Central banks decrease policy rates and increase stimulus programs
House price corrections
Significant increase in unemployment rates
Stagnant economies, recovery late in scenario
Stresstest ICAAP-scenario - parameters 1)
Q4
2016
Q1
2017
Q2
2017
Q3
2017
Q4
2017
Q1
2018
Q2
2018
Q3
2018
Q4
2018
Q1
2019
Q2
2019
Q3
2019
Q4
2019
Sweden
Real GDP growth, % yoy 3.2 -0.4 -0.9 -1.9 -4.5 -3.8 -2.9 -1.7 -0.6 -0.3 0.2 0.5 1.0
Unemployment, % 6.4 8.1 8.9 9.7 12.8 12.8 12.7 13.1 13.4 13.2 13.1 13.1 12.3
Inflation, % yoy 1.5 0.4 0.0 -0.4 -1.5 -1.3 -1.1 -1.0 -0.9 -0.6 -0.5 0.0 0.8
Real estate prices, % qoq 2.3 -8.0 -12.0 -8.3 -2.8 -2.0 -0.8 -0.6 -1.9 1.1 1.7 2.8 1.1
Estonia
Real GDP growth, % yoy 1.2 -0.5 -1.1 -1.5 -3.6 -2.7 -2.0 -1.8 -0.7 -0.3 0.2 0.6 1.2
Unemployment, % 6.6 11.0 13.0 14.0 14.0 14.0 13.7 13.7 13.1 12.3 12.1 9.2 9.0
Inflation, % yoy 1.2 0.3 0.0 -0.3 -1.2 -1.0 -0.9 -0.8 -0.7 -0.5 -0.4 0.0 1.4
Real estate prices, % qoq 2.6 -8.2 -12.3 -8.5 -2.8 -2.0 -0.8 -0.6 -1.0 1.3 2.0 3.4 1.3
Latvia
Real GDP growth, % yoy 1.1 -0.6 -1.2 -2.7 -3.8 -4.2 -3.1 -1.8 -0.7 -0.4 0.3 0.7 1.4
Unemployment, % 9.6 12.5 13.5 15.0 15.0 15.3 15.3 15.3 14.4 14.4 14.1 10.5 10.3
Inflation, % yoy 1.2 0.3 0.0 -0.3 -1.3 -1.1 -1.0 -0.9 -0.8 -0.6 -0.4 0.0 1.5
Real estate prices, % qoq 2.7 -8.2 -12.3 -8.5 -2.8 -2.0 -0.8 -0.6 -1.0 1.3 2.0 3.4 1.3
Lithuania
Real GDP growth, % yoy 2.0 -0.6 -1.3 -2.9 -3.9 -4.0 -3.0 -2.5 -0.9 -0.4 0.3 0.8 1.5
Unemployment, % 7.2 13.5 14.0 14.5 14.5 14.5 14.5 14.5 13.6 13.6 13.4 9.8 9.5
Inflation, % yoy 1.2 0.4 0.0 -0.4 -1.6 -1.4 -1.2 -1.1 -0.9 -0.7 -0.5 0.0 1.8
Real estate prices, % qoq 4.1 -8.2 -12.3 -8.5 -2.8 -2.0 -0.8 -0.6 -1.0 1.3 2.0 3.4 1.3
Interest Rates
3m Government rate SEK, % -0.70 -0.90 -0.95 -1.10 -1.20 -1.00 -0.90 -0.80 -0.70 -0.61 -0.54 -0.49 -0.35
3m Government rate EUR, % -0.84 -1.04 -1.14 -1.29 -1.41 -1.21 -1.11 -1.01 -0.91 -0.82 -0.76 -0.71 -0.56
FX
USD/SEK 9.10 9.26 10.53 11.52 11.63 11.72 12.15 11.59 11.55 11.62 10.65 9.68 9.41
EUR/SEK 9.57 9.89 10.10 10.31 10.54 10.77 10.91 10.74 10.59 10.43 10.29 10.14 10.03
Income statement under ICAAP-Scenario 2) 3)
SEKbn 2016 2017 2018 2019
Net interest income 24.5 23.6 23.1 23.8
Total income 43.2 38.7 37.9 38.2
Total expenses 16.9 16.9 17.0 17.0
Profit before impairments 26.3 21.7 20.8 21.2
Credit impairments 1.5 4.8 10.2 5.6
Operating profit 24.8 16.9 10.7 15.5
Tax expense 4.2 3.7 2.3 3.4
Profit for the period 20.6 13.2 8.3 12.1
Non-controlling interests 0.0 0.0 0.0 0.0
1) Q4 2016 figures are based on preliminary estimates as final figures were published after the submission of the ICAAP report.
2) ICAAP is based on the Swedbank Consolidated Situation which does not include insurance companies.
3) The Board of Directors has set the dividend policy to 75 per cent of profit for the year. This policy is applied in the ICAAP scenario.
54
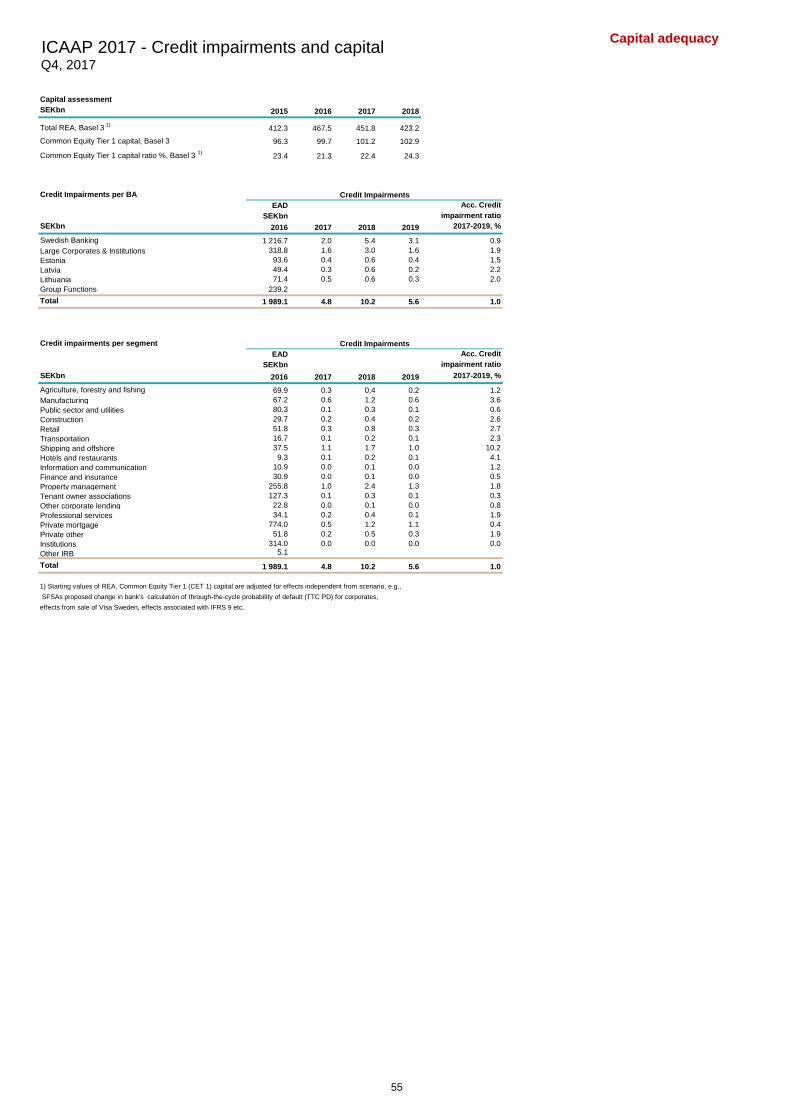
Capital adequacyICAAP 2017 - Credit impairments and capitalQ4, 2017
Capital assessment
SEKbn 2015 2016 2017 2018
Total REA, Basel 3 1)
412.3 467.5 451.8 423.2
Common Equity Tier 1 capital, Basel 3 96.3 99.7 101.2 102.9
Common Equity Tier 1 capital ratio %, Basel 3 1)
23.4 21.3 22.4 24.3
Credit Impairments per BA
EAD Acc. Credit
SEKbn impairment ratio
SEKbn 2016 2017 2018 2019 2017-2019, %
Swedish Banking 1 216.7 2.0 5.4 3.1 0.9
Large Corporates & Institutions 318.8 1.6 3.0 1.6 1.9
Estonia 93.6 0.4 0.6 0.4 1.5
Latvia 49.4 0.3 0.6 0.2 2.2
Lithuania 71.4 0.5 0.6 0.3 2.0
Group Functions 239.2
Total 1 989.1 4.8 10.2 5.6 1.0
Credit impairments per segment
EAD Acc. Credit
SEKbn impairment ratio
SEKbn 2016 2017 2018 2019 2017-2019, %
Agriculture, forestry and fishing 69.9 0.3 0.4 0.2 1.2
Manufacturing 67.2 0.6 1.2 0.6 3.6
Public sector and utilities 80.3 0.1 0.3 0.1 0.6
Construction 29.7 0.2 0.4 0.2 2.6
Retail 51.8 0.3 0.8 0.3 2.7
Transportation 16.7 0.1 0.2 0.1 2.3
Shipping and offshore 37.5 1.1 1.7 1.0 10.2
Hotels and restaurants 9.3 0.1 0.2 0.1 4.1
Information and communication 10.9 0.0 0.1 0.0 1.2
Finance and insurance 30.9 0.0 0.1 0.0 0.5
Property management 255.8 1.0 2.4 1.3 1.8
Tenant owner associations 127.3 0.1 0.3 0.1 0.3
Other corporate lending 22.8 0.0 0.1 0.0 0.8
Professional services 34.1 0.2 0.4 0.1 1.9
Private mortgage 774.0 0.5 1.2 1.1 0.4
Private other 51.8 0.2 0.5 0.3 1.9
Institutions 314.0 0.0 0.0 0.0 0.0
Other IRB 5.1
Total 1 989.1 4.8 10.2 5.6 1.0
1) Starting values of REA, Common Equity Tier 1 (CET 1) capital are adjusted for effects independent from scenario, e.g.,
SFSAs proposed change in bank's calculation of through-the-cycle probability of default (TTC PD) for corporates,
effects from sale of Visa Sweden, effects associated with IFRS 9 etc.
Credit Impairments
Credit Impairments
55

Liquidity and FundingLiquidity reserveQ4, 2017
Liquidity Reserve, Group SEKm 1)
According to the template defined by the Swedish Bankers' Association
Total SEK EUR USD Other
Cash and holdings in central banks 2)
208 370 9 658 153 931 40 230 4 552
Deposits in other banks available overnight 3 3
Securities issued or guaranteed by sovereigns, central banks or multilateral
development banks 88 006 78 228 4 046 4 872 860
Securities issued or guaranteed by municipalities or Public sector entities 5 636 4 416 656 564
Covered bonds 46 621 43 525 1 062 2 034
- Issued by other institutions 44 349 41 475 860 2 014
- Own issued 2 272 2 050 202 20
Securities issued by non-financial corporates 292 126 166
Securities issued by financial corporates (excl. covered bonds) 409 153 145 111
Other
Total 349 337 135 953 159 360 45 903 8 121
1) 95 % of the securities in the liquidity reserve are rated AAA.
2) Including loans to the Swedish National Debt Office.
Assets included in the liquidity reserve should comply with the following:
- assets shall be under the control of the Treasury function in the bank
- assets can not be encumbered
- market values are used for the assets
- only unencumbered securities receiving 0-20% risk weight under the standardised approach to credit risk of the Basel II framework can be included
- securities received in reverse repo transactions shall be included in the liquidity reserve and securities used as collateral for repo transactions shall be excluded
Currency distribution
56

Liquidity and Funding
Survival horizonQ4, 2017SEKbn
The survival horizon represents the number of days with positive cumulative net cash flows taking into consideration the Group’s future cash
flows assuming no access to wholesale funding markets as well as a considerate deposit run. Lending to private and corporate customers is
not generating cash inflows. The survival horizon is hence considered as a base stress scenario from a going concern perspective.
The below main principles are used in the calculation:
- Central banks holdings and highly liquid securities (i.e. interest-bearing securities that are pledgeable at central banks) are assumed to
generate liquidity day 1, and it is assumed that the liqudity generating capacity of the highly liquid securities is intact
- The corresponding cash equivalent of the highly liquid securities is market value reduced for haircuts set by central banks
- Highly liquid securities are available from the day they are registered on an account with a Swedbank clearer
- Non-pledgeable securities are assumed to generate cash flow at coupon payment days and at maturity
- Holdings of securities issued by entities within Swedbank Group are not part of highly liquid securities
- Cash flows from debt security funding transactions are assumed to occur according to contractual terms and are not rolled over
- Deposits from financial customers are assumed to occur according to contractual terms and are not rolled over
- Deposits from private and non-financial customers are considered to gradually be withdrawn and cash outflows occur from these deposits
- Undrawn committed and non-committed customer credit and/or liqudity facilities are not utilised
Exceptions and clarifications:
- The survival horizon takes into account management actions to create liquidity and include the effect from these in the curve. As an example
consideration is taken to facilities for issuing and pledging covered bonds
- Securities issued by Swedbank Mortgage AB and overcollateralisation in Swedbank Mortgage AB’s cover pool may be used as intraday
collateral in the Riksbank and Norges Bank
Exceptions and clarifications - liquid assets:
- The liquidity effect of repo/reversed repo transactions, with highly liquid securities as collateral, is assumed to be zero
- The liquidity effect of repo/reversed repo transactions with non-pledgeable securities occur on the start day and end day of the
repotransaction. The cash flows from the securities in a reversed repo transaction are modeled to generate contractual
cash flows at coupon payment days and at maturity day from the day it is registered on account with a Swedbank clearer- The liquidity effect of repo/reversed repo transactions with securities issued by Swedbank Group is confined to the cashleg’s cash flows,
since such securities are not part of highly liquid securities.
57

Liquidity and Funding
Liquidity ratiosQ4, 2017
Liquidity coverage ratios (Swedish regulation FFFS 2012:6) 1)
31 Dec 30 Sep 30 Jun 31 Mar 31 Dec
2017 2017 2017 2017 2016
Liquidity coverage ratio (LCR), Total, % 173 145 128 137 156
Liquid Assets, SEKbn 328 495 505 501 297
Liquid assets level 1, SEKbn 290 450 459 447 239
Liquid assets level 2, SEKbn 38 45 46 54 58
Cash outflows, SEKbn 229 427 464 490 226
Customer deposits, SEKbn 118 172 157 185 103
Market borrowing, SEKbn 65 199 256 255 83
Other cash outflows, SEKbn 46 56 51 50 40
Cash inflows, SEKbn 40 85 70 124 36
Inflow from maturing lending to non-financial customers, SEKbn 7 9 4 6 6
Other cash inflow, SEKbn 33 76 66 118 30
Liquidity coverage ratio (LCR), EUR, % 374 191 192 166 330
Liquidity coverage ratio (LCR), USD, % 362 121 161 216 160
Liquidity coverage ratio (LCR), SEK, % 2)
76 78 63 87 85
Liquidity coverage ratio (EU 2015/61) 3)
31 Dec 30 Sep 30 Jun 31 Mar 31 Dec
% 2017 2017 2017 2017 2016
Liquidity coverage ratio (LCR), Total 171 133 121 127 155
Liquidity and funding ratios 31 Dec 30 Sep 30 Jun 31 Mar 31 Dec
% 2017 2017 2017 2017 2016
Net stable funding ratio (NSFR) according to BCBS recommendation 4)
110 109 110 109 108
Available stable funding (ASF), SEKbn 1457 1 445 1 451 1 460 1 411
Required stable funding (RSF), SEKbn 1323 1 331 1 324 1 339 1 305
Liquid reserve in relation to maturing funding during next 3, 6 and 12 months 5)
liquidity reserve 3 months 189 158 200 195 200
liquidity reserve 6 months 152 136 150 167 160
liquidity reserve 12 months 118 109 134 133 106
Definitions
1) LCR - calculated in accordance with FFFS 2012:6. LCR = Liquidity reserve / (cash outflows - cash inflows).
2) LCR in SEK is lower in comparison to EUR and USD LCRs due to capped Liquid assets and capped cash inflows denominated in SEK and cash flows in
general as main operations are conducted in SEK. It is also due to foreign currency funding and the corresponding swap agreements used to hedge FX risks.
In constrast to EUR and USD it is also more restrictive to invest in SEK denominated Liquid assets due to the low availability/restrictions of these assets.
There is currently no regulatory requirement to reach 100%.
3) LCR - calculated in accordance with Commission Delegated Regulation (EU) 2015/61) of 10 October 2014.
4) NSFR according to Swedbank's best understanding of BCBS's consultative document on new NSFR recommendation (BCBS295).
5) Liquidity ratios: liquid assets in relation to maturing wholesale funding during next 3, 6 and 12 months:
- Liquidity reserve according to template defined by the Swedish Bankers' Association
- Maturing funding during 3, 6 and 12 months: All wholesale funding maturing within 3, 6 and 12 months, including short-term CP/CD's, and net of lending and
borrowing to/from credit institutions (net Interbank)
Additional information on LCR according to FFFS 2012:6
The main drivers of the LCR result are the wholesale cash flows related to issued debt, lending and borrowing from financial institutions and large corporates.
The Liquid asset composition is important, especially for individual currencies. Another important driver for individual currencies is also the derivative cash flows.
The composition of Liquid assets are shown broken down by Level 1 and Level 2 assets. Further breakdown of liquid assets can be found in this Fact book.
Concentration of funding sources is an important factor for the LCR result. Further information on Swedbank Group's funding sources can be found in this
Fact book.
Swedbank matches its assets and liabilities in currencies to the extent that it is in line with the Group's risk appetite.
Swedbank has a currency mismatch in the LCR due to the regulatory approach in LCR e.g. Liquid assets (Level 2 assets) are capped and the cash inflow cap.
The need for foreign currency is deemed higher from a risk perspective and hence the composition of Liquid assets and the currency mismatch in the LCR.
The liquidity management is centralised to the Group Treasury function in Swedbank Group. The centralised approach facilitates an efficient monitoring and
control of Swedbank’s liquidity risks. In order to be able to monitor and manage liquidity risk in the whole Group on all markets, Group Treasury is located in
relevant markets and jurisdictions where Swedbank performs business operations. Swedbank support its entities through effective agreements of liquidity
transfer.
58

Liquidity and FundingDebt securities in issue and subordinated liabilitiesQ4, 2017
Group 31 Dec 30 Sep 30 Jun 31 Mar 30 Dec Y/YSEKm 2017 2017 2017 2017 2016 %
Commercial papers 149 974 188 056 159 016 229 685 102 225 47
Covered bonds 519 845 554 723 540 357 545 863 558 295 -7
Senior unsecured bonds 159 536 154 291 176 884 185 168 166 161 -4
Structured retail bonds 14 849 14 763 15 039 15 203 14 992 -1
Total debt securities in issue 844 204 911 833 891 296 975 919 841 673 0
Q4 Q3 Q2 Q1 Q4
Turnover during the period 2017 2017 2017 2017 2016
Commercial papers
Opening balance 188 056 159 016 229 685 102 225 162 544
Issued 227 934 284 209 262 018 274 641 100 298
Repurchased
Repaid -266 252 -246 439 -328 413 -144 479 -171 445
Change in market value -2
Changes in exchange rates 236 -8 730 -4 274 -2 702 10 830
Closing balance 149 974 188 056 159 016 229 685 102 225
Covered bonds
Opening balance 554 723 540 357 545 863 558 295 563 218
Issued 12 893 39 387 27 059 53 126 38 623
Repurchased -20 648 -22 103 -14 754 -33 284 -23 837
Repaid -27 233 -614 -13 989 -28 202 -14 393
Change in market value or in hedged item in fair value
hedge accounting -2 190 -2 105 -3 052 -3 176 -6 360
Changes in exchange rates 2 300 -199 -770 -896 1 044
Closing balance 519 845 554 723 540 357 545 863 558 295
Senior unsecured bonds
Opening balance 154 291 176 884 185 168 166 161 164 665
Issued 5 789 6 481 983 32 285 4 872
Repurchased -50 -225 -286
Repaid -808 -26 725 -4 606 -12 246 -2 137
Change in market value -1 161 -142 -87 -30 -2 351
Changes in exchange rates 1 475 -2 207 -4 349 -1 002 1 398
Closing balance 159 536 154 291 176 884 185 168 166 161
Structured retail bonds
Opening balance 14 763 15 039 15 203 14 992 15 069
Issued 1 149 271 746 667 971
Repurchased -3
Repaid -833 -455 -585 -631 -1 195
Change in market value -230 -89 -325 175 147
Changes in exchange rates
Closing balance 14 849 14 763 15 039 15 203 14 992
Group 31 Dec 30 Sep 30 Jun 31 Mar 30 Dec Y/Y
SEKm 2017 2017 2017 2017 2016 %
Subordinated liabilities 25 508 30 448 32 522 26 980 27 254 -6
Total subordinated liabilities 25 508 30 448 32 522 26 980 27 254 -6
Q4 Q3 Q2 Q1 Q4
Turnover during the period 2017 2017 2017 2017 2016
Subordinated liabilities
Opening balance 30 448 32 522 26 980 27 254 22 899
Issued 160 40 6 186 4 530
Repurchased
Repaid -5 077 -2 071 -35
Change in market value 102 -10 -61 -91 -101
Changes in exchange rates -125 -33 -548 -183 -74
Closing balance 25 508 30 448 32 522 26 980 27 254
Weighted average maturity of wholesale funding Q4 Q3 Q2 Q1 Q4
(months) 2017 2017 2017 2017 2016
Total (incl. short term-debt) 32 31 31 30 33
of which term funding 40 40 40 40 38
of which covered bonds 39 38 38 38 36
of which senior unsecured 30 33 30 32 27
59

Liquidity and Funding
Issued long-term debt, by currencyQ4, 2017
Issued long-term debt - distribution by currency Q4 Q3 Q2 Q1 Q4
SEKm 1)
2017 2017 2017 2017 2016
Covered bonds
SEK 12 893 35 597 16 970 42 966 35 118
EUR 9 516 10 160 490
Other 3 789 573 3 015
Senior unsecured
SEK
EUR 5 793 489 193 12 970 1 299
USD 13 384
Other 5 992 790 5 931 3 573
Structured retail bonds
SEK 1 149 271 746 667 971
Total 19 835 46 139 28 788 86 078 44 466
1) FX-rates as per 31 December 2017.
60

Liquidity and Funding
Maturity distribution, long-term fundingQ4, 2017
Nominal amount, SEKm 1)
Domestic
covered bonds 2)
International
covered bonds 2)
Senior
unsecured
bonds 2)
Structured
retail bonds 2)
Total
Q1 2018 9 023 18 818 1 353 29 194
Q2 2018 6 063 4 926 2 026 13 015
Q3 2018 52 720 495 2 621 636 56 472
Q4 2018 595 6 500 4 023 1 157 12 275
Q1 2019 175 20 571 1 098 21 844
Q2 2019 37 300 2 064 4 974 1 042 45 380
Q3 2019 2 622 210 765 3 597
Q4 2019 1 997 12 101 1 146 15 244
Q1 2020 923 13 993 760 15 676
Q2 2020 67 009 19 925 3 278 1 030 91 242
Q3 2020 14 982 7 540 134 22 656
Q4 2020 59 700 3 494 196 908 64 298
Q1 2021 17 448 17 801 451 35 700
Q2 2021 11 154 165 496 11 815
Q3 2021 48 855 98 157 49 110
Q4 2021 8 561 5 632 296 14 489
Q1 2022 11 138 15 168 488 26 794
Q2 2022 50 350 2 054 11 289 274 63 967
Q3 2022 9 824 7 368 141 17 333
Q4 2022 147 5 158 262 5 567
Q1 2023 21 802 737 86 22 625
Q2 2023 295 134 429
Q3 2023 295 62 357
Q4 2023 174 174
2024- 34 554 3 982 835 39 371
Total 338 331 164 568 159 814 15 911 678 624
1) FX-rates as per 31 December, closing.
2) Including intra-group holdings.
FX distribution
Nominal amount, SEKm SEK EUR USD GBP Other Total
Q1 2018 4 833 4 471 19 744 146 29 194
Q2 2018 5 126 914 246 5 534 1 195 13 015
Q3 2018 55 506 884 82 56 472
Q4 2018 3 052 1 562 1 155 4 427 2 079 12 275
Q1 2019 1 273 12 378 8 193 21 844
Q2 2019 40 867 639 3 874 45 380
Q3 2019 1 565 1 822 210 3 597
Q4 2019 1 746 1 434 4 301 5 534 2 229 15 244
Q1 2020 760 6 327 8 275 314 15 676
Q2 2020 71 039 11 592 8 275 336 91 242
Q3 2020 134 22 522 22 656
Q4 2020 61 178 2 013 1 107 64 298
Q1 2021 451 20 827 10 241 4 181 35 700
Q2 2021 496 10 315 82 922 11 815
Q3 2021 49 012 98 49 110
Q4 2021 896 1 817 11 776 14 489
Q1 2022 1 488 10 139 12 289 2 878 26 794
Q2 2022 50 624 8 910 4 433 63 967
Q3 2022 141 17 192 17 333
Q4 2022 262 5 305 5 567
Q1 2023 21 888 688 49 22 625
Q2 2023 134 295 429
Q3 2023 62 295 357
Q4 2023 174 174
2024- 2 135 34 825 2 411 39 371
Total 374 842 177 264 72 932 32 252 21 334 678 624
61
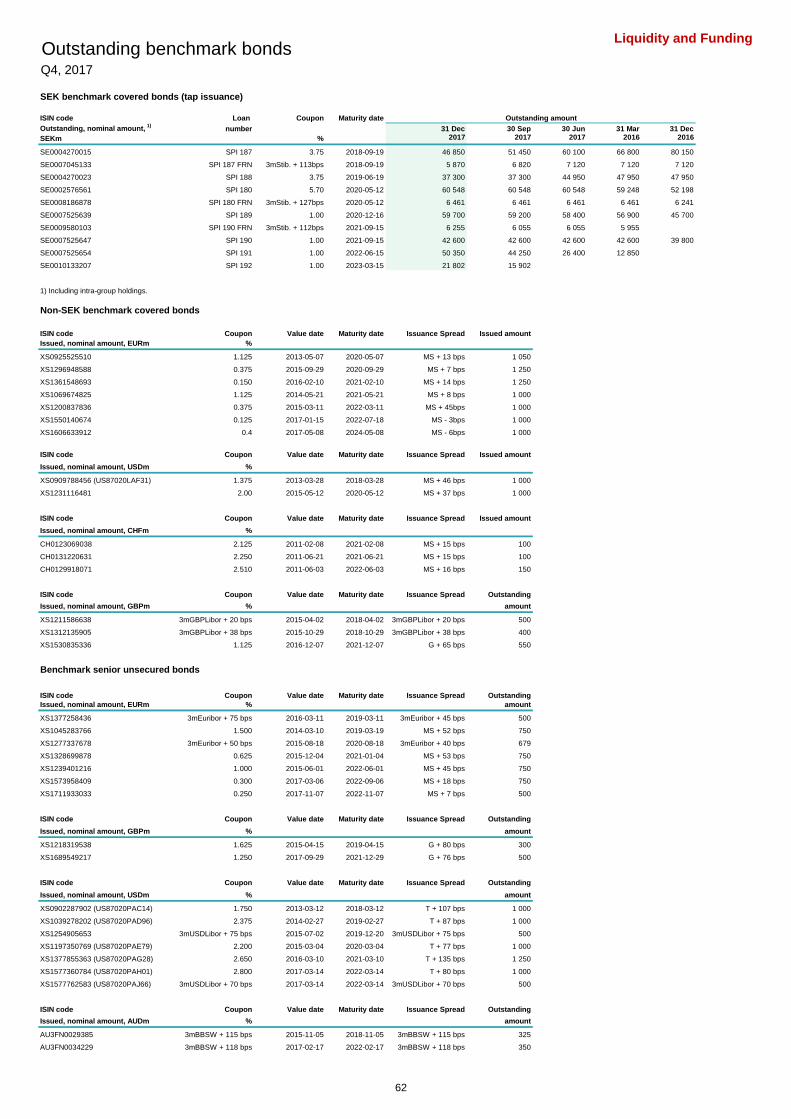
Liquidity and FundingOutstanding benchmark bondsQ4, 2017
SEK benchmark covered bonds (tap issuance)
ISIN code Loan Coupon Maturity date
Outstanding, nominal amount, 1)
number 31 Dec 30 Sep 30 Jun 31 Mar 31 Dec
SEKm % 2017 2017 2017 2016 2016
SE0004270015 SPI 187 3.75 2018-09-19 46 850 51 450 60 100 66 800 80 150
SE0007045133 SPI 187 FRN 3mStib. + 113bps 2018-09-19 5 870 6 820 7 120 7 120 7 120
SE0004270023 SPI 188 3.75 2019-06-19 37 300 37 300 44 950 47 950 47 950
SE0002576561 SPI 180 5.70 2020-05-12 60 548 60 548 60 548 59 248 52 198
SE0008186878 SPI 180 FRN 3mStib. + 127bps 2020-05-12 6 461 6 461 6 461 6 461 6 241
SE0007525639 SPI 189 1.00 2020-12-16 59 700 59 200 58 400 56 900 45 700
SE0009580103 SPI 190 FRN 3mStib. + 112bps 2021-09-15 6 255 6 055 6 055 5 955
SE0007525647 SPI 190 1.00 2021-09-15 42 600 42 600 42 600 42 600 39 800
SE0007525654 SPI 191 1.00 2022-06-15 50 350 44 250 26 400 12 850
SE0010133207 SPI 192 1.00 2023-03-15 21 802 15 902
1) Including intra-group holdings.
Non-SEK benchmark covered bonds
ISIN code Coupon Value date Maturity date Issuance Spread Issued amount
Issued, nominal amount, EURm %
XS0925525510 1.125 2013-05-07 2020-05-07 MS + 13 bps 1 050
XS1296948588 0.375 2015-09-29 2020-09-29 MS + 7 bps 1 250
XS1361548693 0.150 2016-02-10 2021-02-10 MS + 14 bps 1 250
XS1069674825 1.125 2014-05-21 2021-05-21 MS + 8 bps 1 000
XS1200837836 0.375 2015-03-11 2022-03-11 MS + 45bps 1 000
XS1550140674 0.125 2017-01-15 2022-07-18 MS - 3bps 1 000
XS1606633912 0.4 2017-05-08 2024-05-08 MS - 6bps 1 000
ISIN code Coupon Value date Maturity date Issuance Spread Issued amount
Issued, nominal amount, USDm %
XS0909788456 (US87020LAF31) 1.375 2013-03-28 2018-03-28 MS + 46 bps 1 000
XS1231116481 2.00 2015-05-12 2020-05-12 MS + 37 bps 1 000
ISIN code Coupon Value date Maturity date Issuance Spread Issued amount
Issued, nominal amount, CHFm %
CH0123069038 2.125 2011-02-08 2021-02-08 MS + 15 bps 100
CH0131220631 2.250 2011-06-21 2021-06-21 MS + 15 bps 100
CH0129918071 2.510 2011-06-03 2022-06-03 MS + 16 bps 150
ISIN code Coupon Value date Maturity date Issuance Spread Outstanding
Issued, nominal amount, GBPm % amount
XS1211586638 3mGBPLibor + 20 bps 2015-04-02 2018-04-02 3mGBPLibor + 20 bps 500
XS1312135905 3mGBPLibor + 38 bps 2015-10-29 2018-10-29 3mGBPLibor + 38 bps 400
XS1530835336 1.125 2016-12-07 2021-12-07 G + 65 bps 550
Benchmark senior unsecured bonds
ISIN code Coupon Value date Maturity date Issuance Spread Outstanding
Issued, nominal amount, EURm % amount
XS1377258436 3mEuribor + 75 bps 2016-03-11 2019-03-11 3mEuribor + 45 bps 500
XS1045283766 1.500 2014-03-10 2019-03-19 MS + 52 bps 750
XS1277337678 3mEuribor + 50 bps 2015-08-18 2020-08-18 3mEuribor + 40 bps 679
XS1328699878 0.625 2015-12-04 2021-01-04 MS + 53 bps 750
XS1239401216 1.000 2015-06-01 2022-06-01 MS + 45 bps 750
XS1573958409 0.300 2017-03-06 2022-09-06 MS + 18 bps 750
XS1711933033 0.250 2017-11-07 2022-11-07 MS + 7 bps 500
ISIN code Coupon Value date Maturity date Issuance Spread Outstanding
Issued, nominal amount, GBPm % amount
XS1218319538 1.625 2015-04-15 2019-04-15 G + 80 bps 300
XS1689549217 1.250 2017-09-29 2021-12-29 G + 76 bps 500
ISIN code Coupon Value date Maturity date Issuance Spread Outstanding
Issued, nominal amount, USDm % amount
XS0902287902 (US87020PAC14) 1.750 2013-03-12 2018-03-12 T + 107 bps 1 000
XS1039278202 (US87020PAD96) 2.375 2014-02-27 2019-02-27 T + 87 bps 1 000
XS1254905653 3mUSDLibor + 75 bps 2015-07-02 2019-12-20 3mUSDLibor + 75 bps 500
XS1197350769 (US87020PAE79) 2.200 2015-03-04 2020-03-04 T + 77 bps 1 000
XS1377855363 (US87020PAG28) 2.650 2016-03-10 2021-03-10 T + 135 bps 1 250
XS1577360784 (US87020PAH01) 2.800 2017-03-14 2022-03-14 T + 80 bps 1 000
XS1577762583 (US87020PAJ66) 3mUSDLibor + 70 bps 2017-03-14 2022-03-14 3mUSDLibor + 70 bps 500
ISIN code Coupon Value date Maturity date Issuance Spread Outstanding
Issued, nominal amount, AUDm % amount
AU3FN0029385 3mBBSW + 115 bps 2015-11-05 2018-11-05 3mBBSW + 115 bps 325
AU3FN0034229 3mBBSW + 118 bps 2017-02-17 2022-02-17 3mBBSW + 118 bps 350
Outstanding amount
62

Liquidity and FundingOutstanding short-term fundingQ4, 2017
Outstanding, nominal amount
31 Dec 30 Sep 30 Jun 31 Mar 31 Dec 30 Sep 30 Jun 31 Mar 31 DecSEKm Limit 2017 2017 2017 2017 2016 2016 2016 2016 2015
Swedbank AB
European CP/CD EUR 6bn 14 739 10 567 10 517 9 782 13 386 16 027 7 190 8 850 14 585
USCP USD 20bn 72 984 81 461 59 898 76 810 33 391 38 838 54 107 43 025 60 852
Yankee CD USD 20bn 62 566 98 339 87 916 142 886 55 872 108 438 106 640 71 119 32 882
Finnish CD EUR 4bn
Swedbank Mortgage AB
Domestic CP SEK 50bn
Total, Group 150 289 190 367 158 331 229 478 102 649 163 303 167 937 122 994 108 319
Outstanding volumes
63
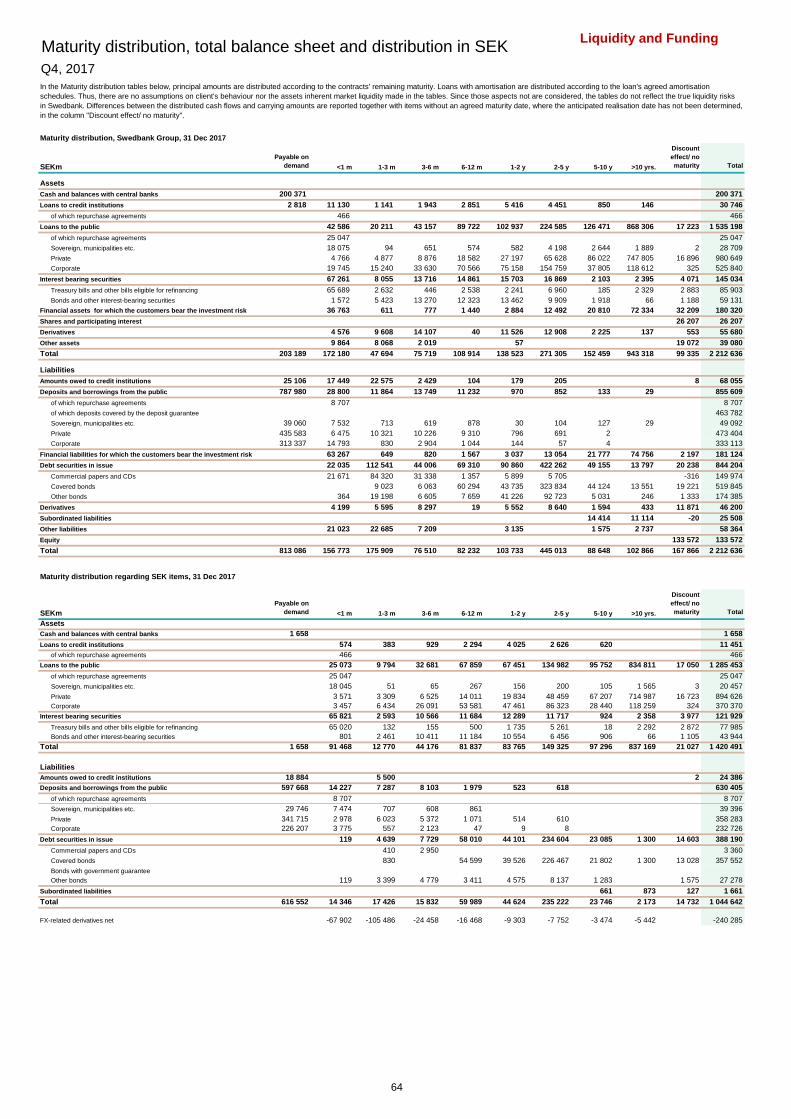
Liquidity and FundingMaturity distribution, total balance sheet and distribution in SEK
Q4, 2017
Maturity distribution, Swedbank Group, 31 Dec 2017
SEKm
Payable on
demand <1 m 1-3 m 3-6 m 6-12 m 1-2 y 2-5 y 5-10 y >10 yrs.
Discount
effect/ no
maturity Total
Assets
Cash and balances with central banks 200 371 200 371
Loans to credit institutions 2 818 11 130 1 141 1 943 2 851 5 416 4 451 850 146 30 746
of which repurchase agreements 466 466
Loans to the public 42 586 20 211 43 157 89 722 102 937 224 585 126 471 868 306 17 223 1 535 198
of which repurchase agreements 25 047 25 047
Sovereign, municipalities etc. 18 075 94 651 574 582 4 198 2 644 1 889 2 28 709
Private 4 766 4 877 8 876 18 582 27 197 65 628 86 022 747 805 16 896 980 649
Corporate 19 745 15 240 33 630 70 566 75 158 154 759 37 805 118 612 325 525 840
Interest bearing securities 67 261 8 055 13 716 14 861 15 703 16 869 2 103 2 395 4 071 145 034
Treasury bills and other bills eligible for refinancing 65 689 2 632 446 2 538 2 241 6 960 185 2 329 2 883 85 903
Bonds and other interest-bearing securities 1 572 5 423 13 270 12 323 13 462 9 909 1 918 66 1 188 59 131
Financial assets for which the customers bear the investment risk 36 763 611 777 1 440 2 884 12 492 20 810 72 334 32 209 180 320
Shares and participating interest 26 207 26 207
Derivatives 4 576 9 608 14 107 40 11 526 12 908 2 225 137 553 55 680
Other assets 9 864 8 068 2 019 57 19 072 39 080
Total 203 189 172 180 47 694 75 719 108 914 138 523 271 305 152 459 943 318 99 335 2 212 636
Liabilities
Amounts owed to credit institutions 25 106 17 449 22 575 2 429 104 179 205 8 68 055
Deposits and borrowings from the public 787 980 28 800 11 864 13 749 11 232 970 852 133 29 855 609
of which repurchase agreements 8 707 8 707
of which deposits covered by the deposit guarantee 463 782
Sovereign, municipalities etc. 39 060 7 532 713 619 878 30 104 127 29 49 092
Private 435 583 6 475 10 321 10 226 9 310 796 691 2 473 404
Corporate 313 337 14 793 830 2 904 1 044 144 57 4 333 113
Financial liabilities for which the customers bear the investment risk 63 267 649 820 1 567 3 037 13 054 21 777 74 756 2 197 181 124
Debt securities in issue 22 035 112 541 44 006 69 310 90 860 422 262 49 155 13 797 20 238 844 204
Commercial papers and CDs 21 671 84 320 31 338 1 357 5 899 5 705 -316 149 974
Covered bonds 9 023 6 063 60 294 43 735 323 834 44 124 13 551 19 221 519 845
Other bonds 364 19 198 6 605 7 659 41 226 92 723 5 031 246 1 333 174 385
Derivatives 4 199 5 595 8 297 19 5 552 8 640 1 594 433 11 871 46 200
Subordinated liabilities 14 414 11 114 -20 25 508
Other liabilities 21 023 22 685 7 209 3 135 1 575 2 737 58 364
Equity 133 572 133 572
Total 813 086 156 773 175 909 76 510 82 232 103 733 445 013 88 648 102 866 167 866 2 212 636
Maturity distribution regarding SEK items, 31 Dec 2017
SEKm
Payable on
demand <1 m 1-3 m 3-6 m 6-12 m 1-2 y 2-5 y 5-10 y >10 yrs.
Discount
effect/ no
maturity Total
Assets
Cash and balances with central banks 1 658 1 658
Loans to credit institutions 574 383 929 2 294 4 025 2 626 620 11 451
of which repurchase agreements 466 466
Loans to the public 25 073 9 794 32 681 67 859 67 451 134 982 95 752 834 811 17 050 1 285 453
of which repurchase agreements 25 047 25 047
Sovereign, municipalities etc. 18 045 51 65 267 156 200 105 1 565 3 20 457
Private 3 571 3 309 6 525 14 011 19 834 48 459 67 207 714 987 16 723 894 626
Corporate 3 457 6 434 26 091 53 581 47 461 86 323 28 440 118 259 324 370 370
Interest bearing securities 65 821 2 593 10 566 11 684 12 289 11 717 924 2 358 3 977 121 929
Treasury bills and other bills eligible for refinancing 65 020 132 155 500 1 735 5 261 18 2 292 2 872 77 985
Bonds and other interest-bearing securities 801 2 461 10 411 11 184 10 554 6 456 906 66 1 105 43 944
Total 1 658 91 468 12 770 44 176 81 837 83 765 149 325 97 296 837 169 21 027 1 420 491
Liabilities
Amounts owed to credit institutions 18 884 5 500 2 24 386
Deposits and borrowings from the public 597 668 14 227 7 287 8 103 1 979 523 618 630 405
of which repurchase agreements 8 707 8 707
Sovereign, municipalities etc. 29 746 7 474 707 608 861 39 396
Private 341 715 2 978 6 023 5 372 1 071 514 610 358 283
Corporate 226 207 3 775 557 2 123 47 9 8 232 726
Debt securities in issue 119 4 639 7 729 58 010 44 101 234 604 23 085 1 300 14 603 388 190
Commercial papers and CDs 410 2 950 3 360
Covered bonds 830 54 599 39 526 226 467 21 802 1 300 13 028 357 552
Bonds with government guarantee
Other bonds 119 3 399 4 779 3 411 4 575 8 137 1 283 1 575 27 278
Subordinated liabilities 661 873 127 1 661
Total 616 552 14 346 17 426 15 832 59 989 44 624 235 222 23 746 2 173 14 732 1 044 642
FX-related derivatives net -67 902 -105 486 -24 458 -16 468 -9 303 -7 752 -3 474 -5 442 -240 285
In the Maturity distribution tables below, principal amounts are distributed according to the contracts' remaining maturity. Loans with amortisation are distributed according to the loan's agreed amortisation
schedules. Thus, there are no assumptions on client's behaviour nor the assets inherent market liquidity made in the tables. Since those aspects not are considered, the tables do not reflect the true liquidity risks
in Swedbank. Differences between the distributed cash flows and carrying amounts are reported together with items without an agreed maturity date, where the anticipated realisation date has not been determined,
in the column "Discount effect/ no maturity".
64

Liquidity and Funding
Maturity distribution in EUR and USDQ4, 2017
Maturity distribution regarding EUR items, 31 Dec 2017
SEKm
Payable on
demand <1 m 1-3 m 3-6 m 6-12 m 1-2 y 2-5 y 5-10 y >10 yrs.
Discount
effect/ no
maturity Total
Assets
Cash and balances with central banks 153 931 153 931
Loans to credit institutions 964 7 268 34 6 133 14 99 93 8 611
Loans to the public 5 400 8 614 8 397 16 375 25 274 52 338 24 784 33 345 174 527
Sovereign, municipalities etc. 20 43 56 131 244 613 490 324 1 921
Private 1 111 1 556 2 322 4 488 7 322 17 106 18 741 32 669 85 315
Corporate 4 269 7 015 6 019 11 756 17 708 34 619 5 553 352 87 291
Interest bearing securities 761 990 1 132 1 183 1 454 1 958 847 38 8 363
Treasury bills and other bills eligible for refinancing 669 297 291 502 30 428 111 38 2 366
Bonds and other interest-bearing securities 92 693 841 681 1 424 1 530 736 5 997
Total 154 895 13 429 9 638 9 535 17 691 26 742 54 395 25 631 33 476 345 432
Liabilities
Amounts owed to credit institutions 2 368 10 867 28 4 19 29 65 13 380
Deposits and borrowings from the public 162 646 4 188 4 209 4 569 8 667 419 213 133 29 185 073
Sovereign, municipalities etc. 9 200 58 6 11 18 30 104 127 29 9 583
Private 89 118 3 274 4 016 4 308 7 718 254 61 2 108 751
Corporate 64 328 856 187 250 931 135 48 4 66 739
Debt securities in issue 246 4 225 914 2 446 16 273 116 864 23 610 12 497 6 024 183 099
Commercial papers and CDs 12 12
Covered bonds 29 1 267 2 608 75 422 22 273 12 251 7 453 121 303
Other bonds 246 4 225 885 1 179 13 665 41 442 1 337 246 -1 441 61 784
Subordinated liabilities 13 754 11 13 765
Total 165 014 15 301 8 462 5 487 11 132 16 721 117 142 37 497 12 526 6 035 395 317
FX-related derivatives net -732 5 059 6 451 8 017 3 830 -1 095 4 476 6 049 32 055
Maturity distribution regarding USD items, 31 Dec 2017
SEKm
Payable on
demand <1 m 1-3 m 3-6 m 6-12 m 1-2 y 2-5 y 5-10 y >10 yrs.
Discount
effect/ no
maturity Total
Assets
Cash and balances with central banks 40 230 40 230
Loans to credit institutions 638 652 249 529 424 514 440 190 53 3 689
Loans to the public 680 928 758 2 078 7 462 20 518 3 821 143 36 388
Sovereign, municipalities etc.
Private 18 5 10 14 20 58 71 143 339
Corporate 662 923 748 2 064 7 442 20 460 3 750 36 049
Interest bearing securities 655 4 331 1 046 1 245 2 1 818 8 9 105
Treasury bills and other bills eligible for refinancing 2 200 1 245 2 1 224 2 4 673
Bonds and other interest-bearing securities 655 2 131 1 046 594 6 4 432
Total 40 868 1 987 5 508 2 333 3 747 7 978 22 776 4 019 196 89 412
Liabilities
Amounts owed to credit institutions 652 6 581 16 754 1 722 84 150 140 26 083
Deposits and borrowings from the public 19 089 8 844 295 1 021 521 25 18 29 813
Sovereign, municipalities etc. 83 83
Private 3 598 170 225 499 466 25 18 5 001
Corporate 15 408 8 674 70 522 55 24 729
Debt securities in issue 21 539 98 825 25 458 1 319 18 639 44 866 49 -861 209 834
Commercial papers and CDs 21 539 79 204 25 212 328 5 899 5 705 -198 137 689
Covered bonds 8 193 8 193 49 -117 16 318
Other bonds 11 428 246 991 12 740 30 968 -546 55 827
Subordinated liabilities 10 241 -160 10 081
Total 19 741 36 964 115 874 28 201 1 924 18 814 45 024 49 10 241 -1 021 275 811
FX-related derivatives net 70 937 71 151 15 258 14 428 7 674 2 895 -501 -168 181 674
65

Liquidity and Funding
Asset encumbranceQ4, 2017
Type of assets (Balance Sheet items)
SEKm
Carry Amount Fair Value Carry Amount Fair Value
Assets of the reporting institution 542 520 1 489 970
Loans on demand 202 199
Equity instruments 19 754 19 754
Debt securities 16 077 16 075 128 542 129 120
Loans and advances other than loans on demand 526 443 1 051 532
of which mortgage loans 516 803 665 657
Other assets 87 943
Type of assets (Off-balance sheet items)
SEKm
Encumbered
received
collateral
Unencumbered
received collateral
available for secured
funding
Fair value Fair value
Collateral received by the reporting institution 3 851 28 805
Loans on demand
Equity instruments 2 943
Debt securities 3 851 15 010
Loans and advances other than loans on demand 9 135
Other collateral received 1 717
Own debt securities issued other than own
covered bonds or ABSs
Purpose for encumbrance (On- and off-balance sheet items)
SEKm 31 Dec 30 Sep 30 Jun 31 Mar
2017 2017 2017 2017
Carrying amount of selected financial liabilities 524 837 572 846 557 305 552 721
of which Derivatives 12 138 12 358 16 795 13 983
of which Deposits 14 104 30 183 24 579 23 850
of which Debt securities issued 498 595 530 305 515 931 514 888
Other sources of encumbrance 21 534 25 382 23 854 21 835
Total 546 371 598 228 581 159 574 556
Information on importance of encumbrance
-Outside of mortgage loans, used for Swedbanks main funding source covered bonds, small volumes derives
from derivatives and repos
-Outside of mortgage loans, originated out of the 100% owned subsidiary Swedbank Mortgage AB, the
absolute main part belongs to Swedbank AB (less than 1% from other subsidiaries within the Group)
-Overcollateralisation level including historic levels can be found on page 68
-Unencumbered assets under 'other assets' include assets not eligible for pledging in central banks (e.g. intangible assets) and cash on hand
encumbered mortgage loans as well as reflected in other sources of encumbrance.
1) All amounts according to Swedbank consolidated situation.
Encumbered assets
Unencumbered assets,
additional assets available for
secured funding
Encumbered Assets
-The Swedish minimum statutory over-collateralisation requirement of 2% is included in the carrying amount of
66
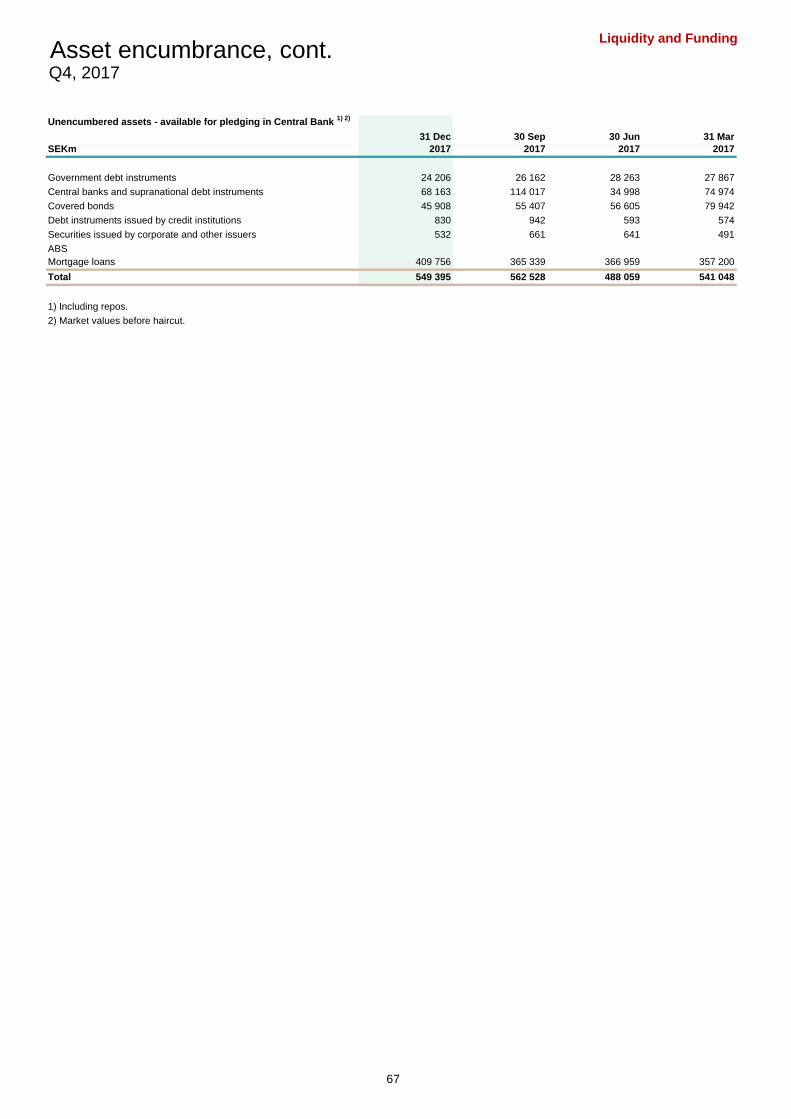
Liquidity and FundingAsset encumbrance, cont.Q4, 2017
Unencumbered assets - available for pledging in Central Bank 1) 2)
31 Dec 30 Sep 30 Jun 31 Mar
SEKm 2017 2017 2017 2017
Government debt instruments 24 206 26 162 28 263 27 867
Central banks and supranational debt instruments 68 163 114 017 34 998 74 974
Covered bonds 45 908 55 407 56 605 79 942
Debt instruments issued by credit institutions 830 942 593 574
Securities issued by corporate and other issuers 532 661 641 491
ABS
Mortgage loans 409 756 365 339 366 959 357 200
Total 549 395 562 528 488 059 541 048
1) Including repos.
2) Market values before haircut.
67

Liquidity and Funding
Cover pool dataQ4, 2017
Cover pool 1)
- Sweden 100% 31 Dec 30 Sep 30 Jun 31 Mar 31 Dec 30 Sep 30 Jun 31 Mar 31 Dec2017 2017 2017 2017 2016 2016 2016 2016 2015
Total assets in the cover pool, SEKbn 2)
928.6 915.7 904.0 890.8 878.4 856.3 843.8 830.1 817.9
Number of borrowers 1 119 065 1 119 475 1 121 652 1 123 353 1 126 971 1 110 669 1 111 910 1 113 977 1 115 334
Number of properties 752 474 751 909 752 889 752 859 754 463 742 981 743 368 743 744 744 300
Average loan size, SEK 577 975 570 469 563 164 555 390 546 803 540 454 532 826 524 238 517 196
Number of loans outstanding 1 606 567 1 605 238 1 605 290 1 603 875 1 606 416 1 584 410 1 583 691 1 583 420 1 581 490
Over-collateralisation level, percent 85.5 72.0 74.1 72.6 67.3 63.1 59.5 52.4 57.9
Average seasoning 66 months 66 months 66 months 65 months 66 months 66 months 66 months 65 months 66 months
Type of loans in the pool, per cent
Residentials 91.9 91.9 92.0 92.0 92.0 91.7 91.6 91.4 91.3
of which Single-family housing 56.9 56.9 57.1 57.2 57.5 57.4 57.5 57.4 57.4
of which Tenant owner rights 20.7 20.5 20.3 20.0 19.9 19.6 19.3 19.0 18.8
of which Tenant owner associations 9.6 9.8 10.0 10.2 10.2 10.3 10.4 10.4 10.4
of which Multi-family housing 4.7 4.7 4.6 4.6 4.4 4.4 4.4 4.6 4.7
Public 3)
0.7 0.8 0.7 0.8 0.8 0.8 0.9 0.9 0.9
Commercial 0.8 0.7 0.6 0.5 0.4 0.6 0.5 0.6 0.6
Forestry & Agriculture 6.6 6.6 6.7 6.7 6.8 6.9 7.0 7.1 7.2
Supplemental assets 0.0 0.0 0.0 0.0 0.0 0.0 0.0 0.0 0.0
Loan-to-value (LTV), per cent
Weighted Average LTV (property level) 49 49 50 50 50 51 52 51 53
Single-family housing 50 49 51 51 50 51 52 51 52
Tenant owner rights 54 53 52 53 53 59 58 58 58
Tenant owner associations 38 38 45 43 41 41 43 41 40
Multi-family housing 52 51 55 55 54 54 52 51 51
Commercial 48 47 50 49 48 48 49 45 46
Forestry & Agriculture 44 45 46 46 46 47 47 46 47
Public 3)
n.a. n.a. n.a. n.a. n.a. n.a. n.a. n.a. n.a.
Weighted Average LTV distribution 3)
4)
LTV %
00-10 24.4 24.4 23.6 23.7 23.7 22.8 22.8 23.2 22.8
10-20 21.8 21.9 21.3 21.4 21.4 20.6 20.7 20.9 20.8
20-30 18.5 18.6 18.3 18.4 18.4 17.7 18.0 18.1 18.1
30-40 14.9 14.9 15.0 15.0 15.0 14.5 15.0 15.0 15.0
40-50 10.7 10.7 11.1 11.1 11.0 11.2 11.6 11.5 11.7
50-60 6.3 6.3 6.8 6.7 6.7 7.8 7.6 7.5 7.7
60-70 2.9 2.8 3.2 3.2 3.1 4.1 3.6 3.3 3.4
70-75 0.5 0.4 0.7 0.5 0.7 1.3 0.7 0.5 0.5
100 100 100 100 100 100 100 100 100
LTV calculation
1) Type of pool: Dynamic.
2) Loans originated by Swedbank and the independent savings banks under a specific cooperation agreement.
3) Public loans are guaranteed either by a Swedish municipality or the state and have therefore no LTV assigned to them.
4) As defined by the Association of Swedish Covered Bond Issuers (www.ascb.se).
The calculation of the weighted average loan-to-value (WA LTV) for Swedbank's cover pool follows the method defined by the Association of Swedish Covered Bond Issuers
(ASCB). In Sweden, one property can be financed with more than one mortgage. The ASCB LTV definition accounts for the highest LTV among all issued mortgages against a
specific property.
Public loans are not backed by property collateral, but rather government guarantees, and are hence not part of the LTV calculations.
The presentation of the LTV distribution accounts for the total volume of mortgages within each LTV bracket. E.g. a loan with a LTV of 50% is sliced and accounted for in equal
parts, in all LTV brackets up to 50%.
For more detailed description of the ASCB LTV definition, please visit www.ascb.se.
When calculating eligible loan amounts in the cover pool, the value component of the LTV is adjusted upwards only when a price increase can be statistically verified and only
limited to certain single family properties. Statistically verified property price declines are however always taken into account, on all property types, when calculating eligible loan
amounts in the cover pool.
68

Liquidity and Funding
Cover pool data, cont.Q4, 2017
Geographical distribution, Sweden, per cent 31 Dec 30 Sep 30 Jun 31 Mar 31 Dec 30 Sep 30 Jun 31 Mar 31 Dec
2017 2017 2017 2017 2016 2016 2016 2016 2015
North 6.5 6.4 6.4 6.4 6.4 6.5 6.5 6.5 6.5
Norrbotten county (BD) 1.4 1.3 1.3 1.3 1.3 1.4 1.4 1.4 1.4
Västerbotten county (AC) 2.4 2.4 2.4 2.4 2.4 2.4 2.4 2.4 2.4
Västernorrland county (Y) 1.5 1.5 1.5 1.5 1.5 1.5 1.5 1.5 1.5
Jämtland county (Z) 1.2 1.2 1.2 1.2 1.2 1.2 1.2 1.2 1.2
Middle (including Stockholm) 43.9 44.0 44.2 44.2 44.2 44.8 44.9 44.9 44.9
Dalarna county (W) 2.0 2.0 2.0 2.0 2.0 2.1 2.1 2.1 2.1
Gävleborg county (X) 2.1 2.1 2.1 2.1 2.1 2.1 2.1 2.1 2.1
Värmland county (S) 2.0 2.0 2.1 2.1 2.1 2.1 2.1 2.2 2.2
Örebro county (T) 2.5 2.5 2.5 2.5 2.4 2.5 2.5 2.5 2.5
Västmanland county (U) 2.4 2.4 2.4 2.4 2.4 2.5 2.5 2.5 2.5
Uppsala county ( C) 4.1 4.0 4.0 4.0 4.0 4.0 4.0 4.0 4.0
Södermanland county (D) 2.1 2.1 2.3 2.3 2.3 2.3 2.4 2.4 2.4
Stockholm county (including Stockholm) (AB) 26.7 26.9 26.8 26.8 26.9 27.2 27.2 27.1 27.1
South (including Göteborg and Malmö) 49.6 49.6 49.4 49.4 49.4 48.7 48.6 48.6 48.6
Västra götaland county (Including Göteborg) (O) 17.9 17.8 17.7 17.6 17.5 17.7 17.6 17.5 17.5
Östergötland county (E) 4.2 4.2 4.1 4.1 4.1 4.1 4.1 4.1 4.1
Jönköping county (F) 3.5 3.5 3.5 3.5 3.5 3.5 3.5 3.5 3.6
Halland county (N) 4.1 4.0 4.0 3.9 3.8 3.8 3.8 3.8 3.8
Kronoberg county (G) 2.1 2.1 2.1 2.1 2.1 2.1 2.1 2.1 2.1
Kalmar county (H) 2.9 2.9 2.9 2.9 2.8 2.9 2.9 3.0 3.0
Skåne county (including Malmö) (M) 12.9 13.1 13.2 13.4 13.5 12.5 12.5 12.5 12.4
Blekinge county (K) 1.4 1.4 1.4 1.4 1.4 1.5 1.5 1.5 1.5
Gotland county (I) 0.6 0.6 0.5 0.5 0.7 0.6 0.6 0.6 0.6
100.0 100.0 100.0 100.0 100.0 100.0 100.0 100.0 100.0
Interest rate fixing, floating/fixed, current, per cent 1)
Floating, reset in < 365 days 70.8 71.9 72.5 73.1 73.5 72.0 71.3 71.1 70.7
Fixed, reset period 1-2Y 9.1 8.7 8.7 8.6 9.4 10.3 10.9 11.7 11.6
Fixed, reset period 2-5Y 18.4 17.6 16.9 16.5 15.2 15.8 15.9 15.4 16.0
Fixed, reset period > 5Y 1.7 1.8 1.9 1.8 1.9 1.9 1.9 1.8 1.7
Repayment structure, property level, per cent
Amortising 68 66 65 64 63 62 61 59 58
Interest only 32 34 35 36 37 38 39 41 42
Seasoning structure, year of origination 2017 2016 2015 2014 2013 2012 2011 2010 <2009
% of total cover pool 17 15 12 9 6 5 5 5 26
Collateral ranking 2)
as % of total cover pool LTV distributed
Total Total 0-10% 10-20% 20-30% 30-40% 40-50% 50-60% 60-70%
No prior ranks 96.7 23.8 20.9 17.8 14.3 10.4 6.1 2.9 0.5
Prior ranks 3.3 0.5 0.8 0.7 0.6 0.4 0.2 0.1 0.0
Total 100.0 24.3 21.7 18.5 14.9 10.8 6.3 3.0 0.5
Loans past due < 60 days 31 Dec 30 Sep 30 Jun 31 Mar 31 Dec 30 Sep 30 Jun 31 Mar 31 Dec
as % of the total cover pool 3)
2017 2017 2017 2017 2016 2016 2016 2016 2015
Total 0-60 days 0.16 0.03 0.03 0.10 0.12 0.03 0.04 0.13 0.11
of which 0-30 days 0.14 0.01 0.01 0.08 0.10 0.01 0.02 0.11 0.08
of which 31-60 days 0.02 0.02 0.02 0.02 0.02 0.02 0.02 0.02 0.03
1) Distribution by refixing period as percentage of total cover pool.
3) Loans past due > 60 days are not eligible for the cover pool.
2) ”No prior ranks” indicates that the loan will be repaid out of the collateral proceeds in the event of a forced sale, prior to any other claim secured by a
contractual pledge over the same collateral being repaid. ”Prior ranks” indicates that there are other claims secured by a contractual pledge over the same
collateral which will be repaid prior to the loan. Please note that under Swedish law there are restrictions regarding expansion of prior ranks at the expense
of claims with subsequent ranks.
69

Liquidity and Funding
Cover pool data, cont.Q4, 2017
Covered bonds 31 Dec 30 Sep 30 Jun 31 Mar 31 Dec 30 Sep 30 Jun 31 Mar 31 Dec
2017 2017 2017 2017 2016 2016 2016 2016 2015
AAA/Aaa AAA/Aaa AAA/Aaa AAA/Aaa AAA/Aaa AAA/Aaa AAA/Aaa AAA/Aaa AAA/Aaa
500 598 532 449 519 360 516 115 525 055 524 873 529 019 544 561 517 904
Weighted average maturity 39 months 38 months 38 months 38 months 36 months 36 months 37 months 37 months 36 months
FX distribution, percent SEK 69 71 71 70 70 69 67 68 66
EUR 22 21 21 19 20 22 22 21 22
USD 3 3 3 5 5 5 6 6 7
Other 6 5 5 6 5 4 5 5 5
Cover pool sensitivity analysis
Current -5% -10% -15% -20% -25% -30% -35% -40%
Total assets in the cover pool 928.6 924.9 918.6 908.7 895.0 876.9 854.1 825.6 791.2
Total outstanding covered bonds 500.6 500.6 500.6 500.6 500.6 500.6 500.6 500.6 500.6
Over-collateralisation level, percent 85.5 84.8 83.5 81.5 78.8 75.2 70.6 64.9 58.0
1) FX-rate as per trade date; Gross outstanding amount, i.e. including intra-group holdings.
Rating of the covered bond programme
(S&P / Moody's)
Total outstanding amount, nominal SEKm 1)
House price decline, SEKbn
70

Liquidity and Funding
Swedbank Mortgage AB, loan dataQ4, 2017
100% Swedish assets 31 Dec 30 Sep 30 Jun 31 Mar 31 Dec 30 Sep 30 Jun 31 Mar 31 Dec2017 2017 2017 2017 2016 2016 2016 2016 2015
Loans to the public net, SEKbn 1)
968 954 941 927 918 892 880 864 855
Number of borrowers 1 127 789 1 127 715 1 129 592 1 131 026 1 134 457 1 117 998 1 118 914 1 120 473 1 122 705
Number of properties 758 890 758 005 758 780 758 616 760 146 748 575 748 687 748 741 749 847
Average loan size 592 574 584 936 577 029 568 811 561 576 553 894 546 030 536 511 530 199
Number of loans outstanding 1 633 009 1 630 959 1 631 073 1 630 250 1 634 337 1 610 836 1 611 590 1 610 098 1 612 255
Type of loans, per cent
Residentials 92.2 92.0 92.0 92.1 92.1 92.0 91.9 91.8 91.7
of which Single-family homes 57.0 57.0 57.0 57.2 57.5 57.5 57.6 57.7 57.9
of which Tenant-owner rights 20.8 20.6 20.4 20.1 19.9 19.7 19.4 19.1 18.8
of which Tenant-owner associations 9.7 9.8 10.0 10.2 10.3 10.4 10.5 10.4 10.3
of which Multi-family housing 4.7 4.7 4.6 4.6 4.4 4.4 4.4 4.6 4.7
Public 0.6 0.6 0.7 0.7 0.7 0.7 0.7 0.7 0.7
Commercial 0.8 0.8 0.7 0.6 0.6 0.5 0.6 0.6 0.6
Forestry & Agriculture 6.4 6.5 6.6 6.6 6.6 6.8 6.8 6.9 7.0
Loan-to-value (LTV) 2)
, per cent
Weighted average LTV (property level) 51 51 52 52 52 53 54 53 54
Single-family housing 52 51 53 53 53 53 54 54 55
Tenant owner rights 57 56 55 56 56 62 61 61 61
Tenant owner associations 39 39 46 44 42 43 44 42 41
Multi-family housing 53 52 56 56 55 55 54 52 52
Commercial 50 48 52 51 50 50 51 47 48
Forestry & Agriculture 46 47 48 48 49 49 50 49 49
Public 3)
n.a. n.a. n.a. n.a. n.a. n.a. n.a. n.a. n.a.
Weighted Average LTV distribution
(property level)
LTV %
00-10 23.6 23.8 22.9 23.0 23.1 22.4 22.1 22.4 22.1
10-20 21.2 21.3 20.8 20.8 20.8 20.4 20.1 20.3 20.2
20-30 18.1 18.2 17.9 17.9 18.0 17.7 17.5 17.7 17.6
30-40 14.7 14.7 14.8 14.8 14.8 14.7 14.7 14.7 14.7
40-50 10.9 10.8 11.2 11.2 11.2 11.5 11.6 11.6 11.6
50-60 6.6 6.5 7.1 7.1 7.1 7.7 8.0 7.9 8.2
60-70 3.3 3.2 3.6 3.6 3.5 3.9 4.1 3.9 4.1
70-80 1.2 1.1 1.4 1.3 1.3 1.4 1.5 1.3 1.3
80-90 0.2 0.2 0.3 0.2 0.2 0.2 0.3 0.2 0.2
90-100 0.0 0.0 0.0 0.1 0.0 0.0 0.0 0.0 0.0
>100 0.1 0.1 0.1 0.1 0.0 0.1 0.1 0.1 0.1
Loans past due, per cent 31 Dec 30 Sep 30 Jun 31 Mar 31 Dec 30 Sep 30 Jun 31 Mar 31 Dec2017 2017 2017 2017 2016 2016 2016 2016 2015
Loans past due as % of total net loans to
the publicTotal 0.21 0.07 0.07 0.14 0.17 0.09 0.09 0.20 0.17
of which 0-60 days 0.17 0.03 0.04 0.10 0.13 0.04 0.05 0.16 0.12
of which >60 days 0.04 0.04 0.04 0.04 0.04 0.05 0.04 0.04 0.05
Impairments and provisions Q4 Q3 Q2 Q1 Q4 Q3 Q2 Q1 Q42017 2017 2017 2017 2016 2016 2016 2016 2015
Credit impairments net, SEKm 4)
62 13 15 10 21 19 12 -3 30
Impaired loans, SEKm 270 141 184 196 222 251 225 240 241
Provisions, SEKm 124 94 100 95 93 96 95 107 117
of which portfolio provisions, private 60 61 62 62 62 63 63 63 73
1) Nominal amount
2) LTV calculation method - see cover pool, page 68
3) Public loans are guaranteed either by a Swedish municipality or the state and have therefore no LTV assigned to them
4) Annually accumulated impairments including recoveries, year on year
71
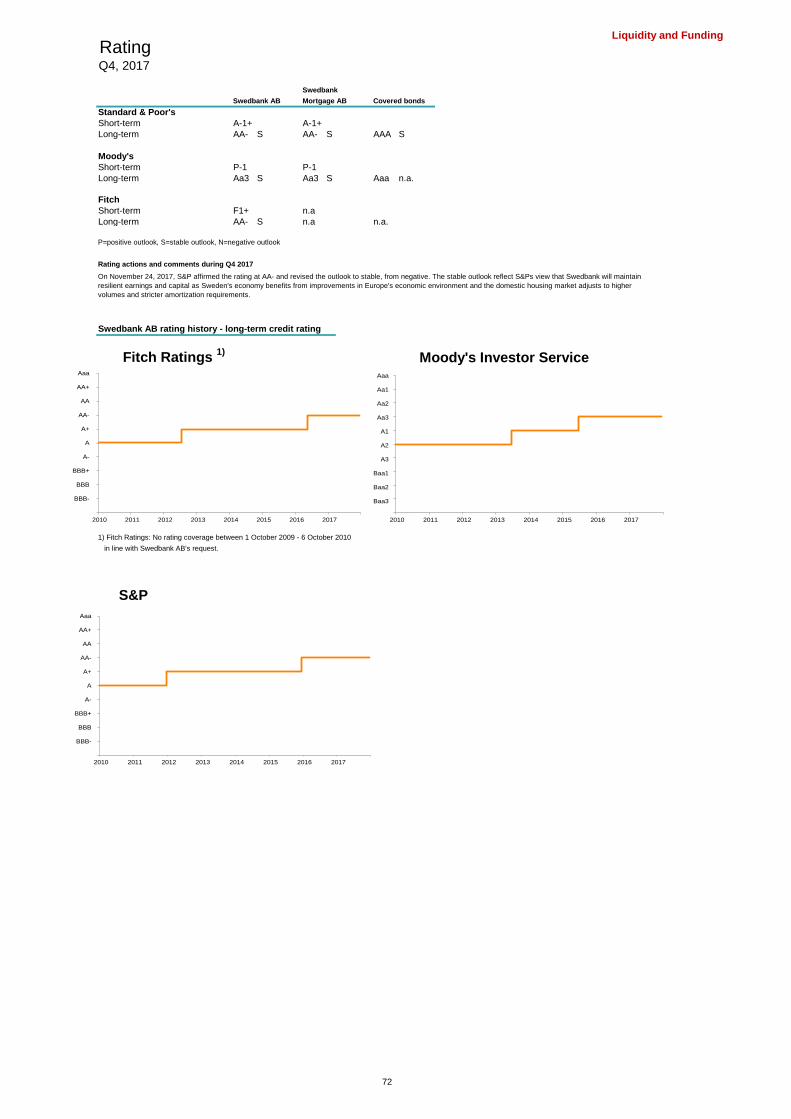
Liquidity and Funding
RatingQ4, 2017
Swedbank
Swedbank AB Mortgage AB Covered bonds
Standard & Poor's
Short-term A-1+ A-1+
Long-term AA- S AA- S AAA S
Moody's
Short-term P-1 P-1
Long-term Aa3 S Aa3 S Aaa n.a.
Fitch
Short-term F1+ n.a
Long-term AA- S n.a n.a.
P=positive outlook, S=stable outlook, N=negative outlook
Rating actions and comments during Q4 2017
Swedbank AB rating history - long-term credit rating
Fitch Ratings 1)
Moody's Investor Service
1) Fitch Ratings: No rating coverage between 1 October 2009 - 6 October 2010
in line with Swedbank AB's request.
S&P
On November 24, 2017, S&P affirmed the rating at AA- and revised the outlook to stable, from negative. The stable outlook reflect S&Ps view that Swedbank will maintain
resilient earnings and capital as Sweden's economy benefits from improvements in Europe's economic environment and the domestic housing market adjusts to higher
volumes and stricter amortization requirements.
0
1
2
3
4
5
6
7
8
9
10
2010 2011 2012 2013 2014 2015 2016 2017
Aaa
AA+
AA
AA-
A+
A
A-
BBB+
BBB
BBB-
0
1
2
3
4
5
6
7
8
9
10
2010 2011 2012 2013 2014 2015 2016 2017
Aaa
Aa1
Aa2
Aa3
A1
A2
A3
Baa1
Baa2
Baa3
0
1
2
3
4
5
6
7
8
9
10
2010 2011 2012 2013 2014 2015 2016 2017
Aaa
AA+
AA
AA-
A+
A
A-
BBB+
BBB
BBB-
72

Key figures
Key figures, 5-yearsQ4, 2017
Key figures, Group FY FY FY FY FY
2017 2016 2015 2014 2013
Profit
Return on equity, % 15.1 15.8 13.5 15.0 12.5
Return on equity continuing operations, % 15.1 15.8 13.5 15.2 14.7
Return on total assets, % 0.79 0.82 0.67 0.80 0.68
Cost/Income ratio 0.39 0.38 0.43 0.44 0.44
Net interest margin, % 1)
1.04 1.02 0.99 1.11 1.15
Business Volumes SEKbn
Loans to the public excl. repos & SNDO 1 502 1 453 1 371 1 325 1 215
Deposits to the public excluding repos & SNDO 847 782 744 661 599
Loan/Deposit ratio, % 177 186 184 201 203
Asset quality
Credit impairment ratio, % 0.08 0.09 0.04 0.03 0.00
Total provision ratio for impaired loans, % 45 46 56 53 54
Share of impaired loans gross, % 0.55 0.52 0.40 0.41 0.55
Capital
Common Equity Tier 1 ratio, %, Basel 3 2)
24.6 25.0 24.1 21.2 18.3
Leverage ratio, %, Basel 3 5.20 5.40 4.97 4.50 4.63
Risk exposure amount, SEKm, Basel 3 2)
408 351 394 135 389 098 414 214 440 620
Risk exposure amount/total assets, %, Basel 3 2)
18 18 17 20 24
Liquidity & Funding
Liquidity coverage ratio (LCR) 3)
173 156 159 120 142
Net stable funding ratio (NSFR) 4)
110 108 107 98 97
Share of wholesale funding > 1 year, % 77 75 73 64 69
Share data
Earnings per share before dilution, SEK 17.38 17.60 14.23 14.93 11.76
Earnings per share before dilution continuing operations, SEK 17.38 17.60 14.24 15.17 13.89
Earnings per share after dilution, SEK 17.30 17.50 14.13 14.81 11.66
Earnings per share after dilution continuing operations, SEK 17.30 17.50 14.14 15.05 13.79
Cash dividend per ordinary share, SEK 5)
13.00 13.20 10.70 11.35 10.10
Equity
Shareholders Equity, average SEKm 127 756 123 302 116 315 109 953 103 412
1) Net interest margin before trading interest are deducted.
2) 2013 are estimates based on Swedbank's previous calculation according to the new regulations.
3) LCR - calculated in accordance with the new Swedish regulation 2012:6. LCR = Liqudity reserve / (cash outflows - cash inflows).
4) NSFR according to Swedbank's best understanding of BCBS's consultative document on new NSFR recommendation (BCBS295).
5) Proposed dividend by the Board of Directors´ to the Annual General Meeting.
73
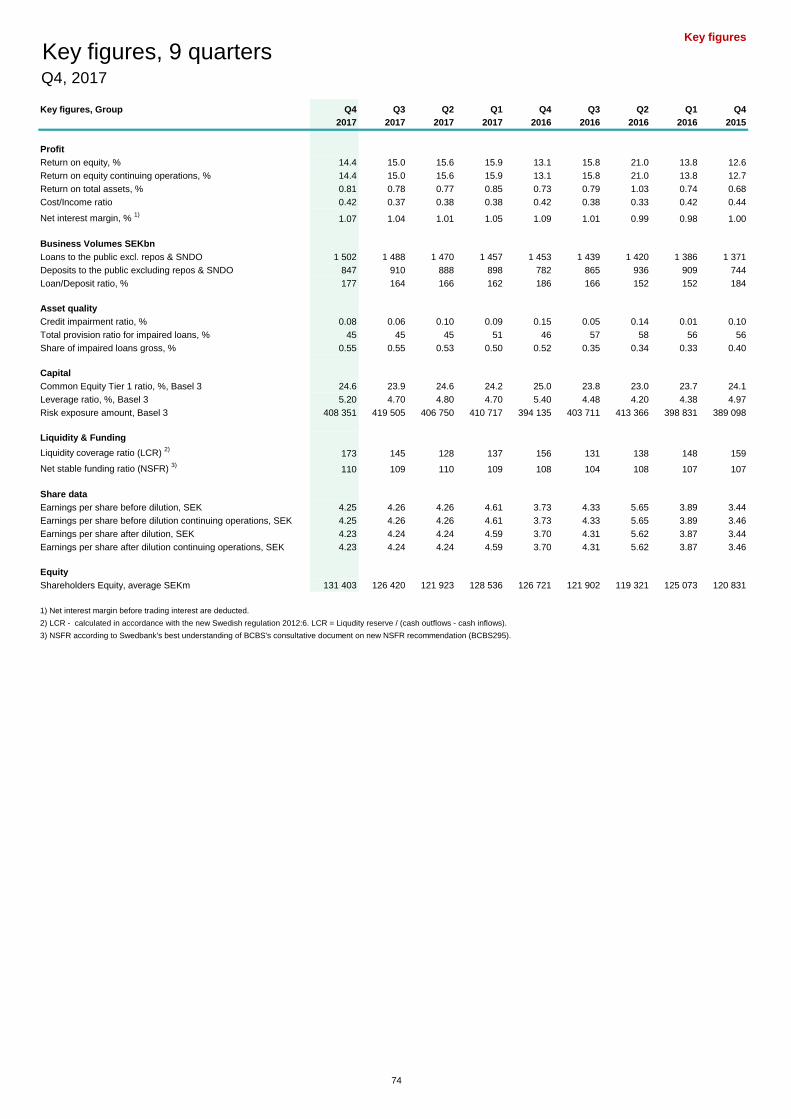
Key figures
Key figures, 9 quartersQ4, 2017
Key figures, Group Q4 Q3 Q2 Q1 Q4 Q3 Q2 Q1 Q4
2017 2017 2017 2017 2016 2016 2016 2016 2015
Profit
Return on equity, % 14.4 15.0 15.6 15.9 13.1 15.8 21.0 13.8 12.6
Return on equity continuing operations, % 14.4 15.0 15.6 15.9 13.1 15.8 21.0 13.8 12.7
Return on total assets, % 0.81 0.78 0.77 0.85 0.73 0.79 1.03 0.74 0.68
Cost/Income ratio 0.42 0.37 0.38 0.38 0.42 0.38 0.33 0.42 0.44
Net interest margin, % 1)
1.07 1.04 1.01 1.05 1.09 1.01 0.99 0.98 1.00
Business Volumes SEKbn
Loans to the public excl. repos & SNDO 1 502 1 488 1 470 1 457 1 453 1 439 1 420 1 386 1 371
Deposits to the public excluding repos & SNDO 847 910 888 898 782 865 936 909 744
Loan/Deposit ratio, % 177 164 166 162 186 166 152 152 184
Asset quality
Credit impairment ratio, % 0.08 0.06 0.10 0.09 0.15 0.05 0.14 0.01 0.10
Total provision ratio for impaired loans, % 45 45 45 51 46 57 58 56 56
Share of impaired loans gross, % 0.55 0.55 0.53 0.50 0.52 0.35 0.34 0.33 0.40
Capital
Common Equity Tier 1 ratio, %, Basel 3 24.6 23.9 24.6 24.2 25.0 23.8 23.0 23.7 24.1
Leverage ratio, %, Basel 3 5.20 4.70 4.80 4.70 5.40 4.48 4.20 4.38 4.97
Risk exposure amount, Basel 3 408 351 419 505 406 750 410 717 394 135 403 711 413 366 398 831 389 098
Liquidity & Funding
Liquidity coverage ratio (LCR) 2)
173 145 128 137 156 131 138 148 159
Net stable funding ratio (NSFR) 3)
110 109 110 109 108 104 108 107 107
Share data
Earnings per share before dilution, SEK 4.25 4.26 4.26 4.61 3.73 4.33 5.65 3.89 3.44
Earnings per share before dilution continuing operations, SEK 4.25 4.26 4.26 4.61 3.73 4.33 5.65 3.89 3.46
Earnings per share after dilution, SEK 4.23 4.24 4.24 4.59 3.70 4.31 5.62 3.87 3.44
Earnings per share after dilution continuing operations, SEK 4.23 4.24 4.24 4.59 3.70 4.31 5.62 3.87 3.46
Equity
Shareholders Equity, average SEKm 131 403 126 420 121 923 128 536 126 721 121 902 119 321 125 073 120 831
1) Net interest margin before trading interest are deducted.
2) LCR - calculated in accordance with the new Swedish regulation 2012:6. LCR = Liqudity reserve / (cash outflows - cash inflows).
3) NSFR according to Swedbank's best understanding of BCBS's consultative document on new NSFR recommendation (BCBS295).
74

Market sharesMarket sharesQ4, 2017
Balance Net growth
31 Dec 31 Dec 31 Dec 31 Dec 31 Dec FY FY FY FY FY
Market shares, % 2017 2016 2015 2014 2013 2017 2016 1)
2015 2014 2)
2013
Sweden
Loans 3)
, private 23 23 23 24 24 17 24 16 25 13
of which mortgage loans 24 25 25 25 25 20 26 19 24 14
Deposits, private 21 21 21 21 21 17 21 18 23 3
Life insurance 4)
, new premiums (Sep 2017) 5 4 6 5 6
Life insurance 4)
, premium paid (Sep 2017) 6 6 7 7 7
Mutual funds 21 21 22 23 24 neg. neg. neg. 13 9
Loans 3)
, corporate 17 19 19 19 17 neg. 14 15 69 37
Deposits, corporate 20 20 19 19 18 15 33 25 39 48
Bank Giro, transactions YTD (Sep 2017) 36 34 34 34 34
Estonia
Loans 3)
, private (Nov 2017) 46 47 47 46 46 43 43 60 39 56
of which mortgage loans (Nov 2017) 46 46 46 45 46 45 42 57 26 12
Deposits, private (Nov 2017) 55 55 55 54 54 58 64 67 53 53
Pensions, private (Nov 2017) 42 41 41 40 41 44 43 45 38 36
Life insurance, total premium YTD (Sep 2017) 43 39 40 37 37
P&C Insurance, total premium YTD (Sep 2017) 16 16 15 15 14
Loans 3)
, corporate (Nov 2017) 37 34 34 34 35 >100 47 28 4 28
Deposits, corporate (Nov 2017) 44 43 41 36 37 >100 >100 >100 22 15
Domestic Payments (Sep 2017) 59 59 59 59 59
International payments (Sep 2017) 26 28 32 33 37
Latvia
Loans 3)
, private 31 31 29 29 29 34 neg. 23 neg. neg.
of which mortgage loans (Sep 2017) 34 34 32 31 31 35 neg. 21 neg. neg.
Deposits, private 32 31 28 28 29 50 67 26 20 35
Pensions, private 42 41 42 42 41 42 40 42 46 43
Life insurance, total premium YTD (Sep 2017) 24 20 20 17 15
P&C Insurance, total premium YTD (Sep 2017) 5 4 4 3 3
Loans 3)
, corporate 17 16 17 17 17 5 50 neg. neg. neg.
Deposits, corporate 15 15 12 12 14 6 neg. 26 neg. 32
Domestic Payments (Jun 2017) 50 52 53 53 40
International payments (Jun 2017) 4 5 6 4 21
Lithuania
Loans 3)
, private (Sep 2017) 34 34 28 28 27 34 >100 33 >100 >100
of which mortgage loans (Sep 2017) 33 33 27 27 26 35 >100 35 >100 >100
Deposits, private (Sep 2017) 40 40 38 37 37 39 66 43 38 11
Pensions, private (Sep 2017) 37 37 35 35 35 35 36 34 36 25
Life insurance, total premium YTD (Sep 2017) 23 22 22 21 22
P&C Insurance, total premium YTD (Sep 2017) 4 3 2 2 1
Loans 3)
, corporate (Sep 2017) 18 20 21 23 21 neg. 3 neg. 8 86
Deposits, corporate (Sep 2017) 23 25 21 22 25 neg. 52 neg. 5 neg.
Domestic Payments (Sep 2017) 49 48 42 41 40
International payments (Sep 2017) 27 27 26 25 27
1) Includes volumes taken over from SBAB in Q3 (Latvia and Lithuania).
2) Includes volumes from Sparbanken Öresund from May 2014.
3) Excluding credit institutions, Swedish National Debt Office and repurchase agreements.
4) Rolling 12 months. From 2015 market shares are measured as premiums paid (excl transfer of capital from other insurance companies) instead of premium income.
75
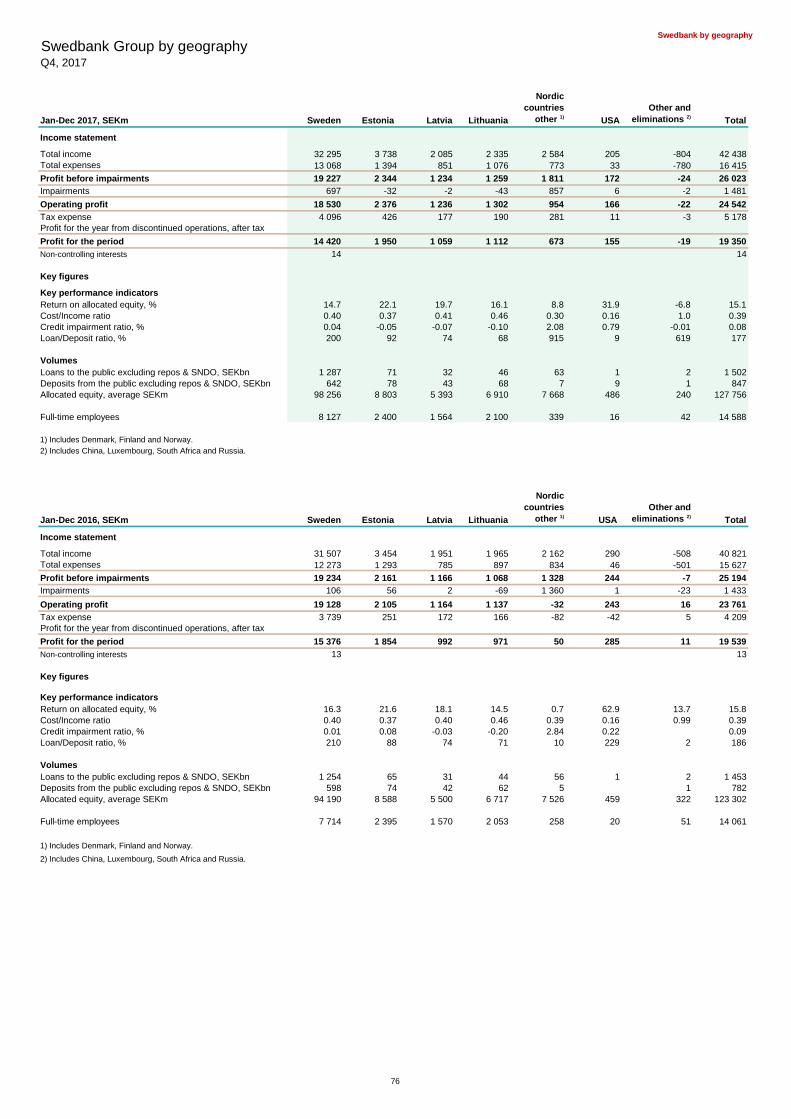
Swedbank by geography
Swedbank Group by geographyQ4, 2017
Jan-Dec 2017, SEKm Sweden Estonia Latvia Lithuania
Nordic
countries
other 1)USA
Other and
eliminations 2)Total
Income statement
Total income 32 295 3 738 2 085 2 335 2 584 205 -804 42 438
Total expenses 13 068 1 394 851 1 076 773 33 -780 16 415
Profit before impairments 19 227 2 344 1 234 1 259 1 811 172 -24 26 023
Impairments 697 -32 -2 -43 857 6 -2 1 481
Operating profit 18 530 2 376 1 236 1 302 954 166 -22 24 542
Tax expense 4 096 426 177 190 281 11 -3 5 178
Profit for the year from discontinued operations, after tax
Profit for the period 14 420 1 950 1 059 1 112 673 155 -19 19 350
Non-controlling interests 14 14
Key figures
Key performance indicators
Return on allocated equity, % 14.7 22.1 19.7 16.1 8.8 31.9 -6.8 15.1
Cost/Income ratio 0.40 0.37 0.41 0.46 0.30 0.16 1.0 0.39
Credit impairment ratio, % 0.04 -0.05 -0.07 -0.10 2.08 0.79 -0.01 0.08
Loan/Deposit ratio, % 200 92 74 68 915 9 619 177
Volumes
Loans to the public excluding repos & SNDO, SEKbn 1 287 71 32 46 63 1 2 1 502
Deposits from the public excluding repos & SNDO, SEKbn 642 78 43 68 7 9 1 847
Allocated equity, average SEKm 98 256 8 803 5 393 6 910 7 668 486 240 127 756
Full-time employees 8 127 2 400 1 564 2 100 339 16 42 14 588
1) Includes Denmark, Finland and Norway.
2) Includes China, Luxembourg, South Africa and Russia.
Jan-Dec 2016, SEKm Sweden Estonia Latvia Lithuania
Nordic
countries
other 1)USA
Other and
eliminations 2)Total
Income statement
Total income 31 507 3 454 1 951 1 965 2 162 290 -508 40 821
Total expenses 12 273 1 293 785 897 834 46 -501 15 627
Profit before impairments 19 234 2 161 1 166 1 068 1 328 244 -7 25 194
Impairments 106 56 2 -69 1 360 1 -23 1 433
Operating profit 19 128 2 105 1 164 1 137 -32 243 16 23 761
Tax expense 3 739 251 172 166 -82 -42 5 4 209
Profit for the year from discontinued operations, after tax
Profit for the period 15 376 1 854 992 971 50 285 11 19 539
Non-controlling interests 13 13
Key figures
Key performance indicators
Return on allocated equity, % 16.3 21.6 18.1 14.5 0.7 62.9 13.7 15.8
Cost/Income ratio 0.40 0.37 0.40 0.46 0.39 0.16 0.99 0.39
Credit impairment ratio, % 0.01 0.08 -0.03 -0.20 2.84 0.22 0.09
Loan/Deposit ratio, % 210 88 74 71 10 229 2 186
Volumes
Loans to the public excluding repos & SNDO, SEKbn 1 254 65 31 44 56 1 2 1 453
Deposits from the public excluding repos & SNDO, SEKbn 598 74 42 62 5 1 782
Allocated equity, average SEKm 94 190 8 588 5 500 6 717 7 526 459 322 123 302
Full-time employees 7 714 2 395 1 570 2 053 258 20 51 14 061
1) Includes Denmark, Finland and Norway.
2) Includes China, Luxembourg, South Africa and Russia.
76

EmployeesEmployeesQ4, 2017
31 Dec ∆ FTE's 30 Sep 30 Jun 31 Mar 31 Dec 30 Sep 30 Jun 31 Mar 31 Dec
Number of full-time employees 2017 Q/Q 2017 2017 2017 2016 2016 2016 2016 2015
Sweden 3 956 -17 3 973 4 021 4 050 4 065 4 057 4 087 4 163 4 299
Denmark 20 20 20 20 21 22 22 22 21
Other 1)
4 4 4 4 4 4 3 3 0
Swedish Banking 3 980 -17 3 997 4 045 4 074 4 090 4 083 4 112 4 188 4 320
Estonia 1 254 -23 1 277 1 347 1 331 1 338 1 334 1 366 1 319 1 342
Latvia 1 006 -14 1 020 987 1 030 1 058 1 064 1 074 1 074 1 087
Lithuania 1 214 -1 1 215 1 237 1 228 1 244 1 271 1 276 1 250 1 230
Sweden 2 1 1 1 1 2 3 3 2 2
Other 0 0 0 0 0 2 2 0 0
Baltic Banking 3 476 -37 3 513 3 572 3 590 3 642 3 674 3 721 3 645 3 661
Sweden 689 -12 701 705 705 684 674 658 657 652
Baltic countries 283 283 285 272 269 270 273 259 269
Norway 122 1 121 137 147 172 174 175 177 176
Other 1)
79 -4 83 81 80 93 88 97 94 88
Large Corporate & Institutions 1 173 -15 1 188 1 208 1 204 1 218 1 206 1 203 1 187 1 185
Sweden 3 480 78 3 402 3 080 2 983 2 957 2 934 3 067 2 868 2 838
Baltic countries 2 307 53 2 254 2 239 2 174 2 115 2 048 2 025 1 951 1 825
Norway 135 5 130 30 31 28 37 36 36 36
Other 1)
37 1 36 12 11 11 20 -117 19 28
Group Functions & Other 5 959 137 5 822 5 361 5 199 5 111 5 039 5 011 4 874 4 727
Total number of full-time employees 14 588 68 14 520 14 186 14 067 14 061 14 002 14 047 13 894 13 893
1) China, Finland, Luxembourg, and USA.
77

Currency distribution
Q4, 2017
Currency distribution, 31 Dec 2017
Swedbank Group
SEKm SEK EUR USD GBP DKK NOK Other Total
Assets
Cash and balances with central banks 1 658 153 931 40 230 32 76 4 297 147 200 371
Loans to credit institutions 11 451 8 611 3 689 167 1 728 2 931 2 171 30 746
Loans to the public 1 285 453 174 527 36 388 3 421 4 856 28 989 1 564 1 535 198
Interest-bearing securities 121 929 8 363 9 105 649 267 4 722 145 034
Other assets, not distributed 301 287 301 287
Total 1 721 777 345 431 89 411 4 268 6 927 40 939 3 882 2 212 636
Liabilities
Amounts owed to credit institutions 24 386 13 380 26 083 1 015 2 043 1 012 135 68 055
Deposits and borrowings from the public 630 405 185 073 29 813 1 324 1 781 4 897 2 317 855 609
Debt securities in issue, etc. 389 851 196 864 219 915 41 249 6 870 14 963 869 712
Other liabilities, not distributed 285 688 285 688Equity 133 572 133 572
Total 1 463 902 395 317 275 811 43 589 3 825 12 779 17 415 2 212 636
Other assets and liabilities,
including positions in derivatives 59 397 186 329 39 372 -3 065 -27 996 13 515
Net position in currency 9 512 -71 51 37 165 -18 9 676
31 Dec 30 Sep 30 Jun 31 Mar 31 Dec 30 Sep 30 Jun 31 Mar 31 Dec
Exchange rates 2017 2017 2017 2017 2016 2016 2016 2016 2015
SEK/EUR, YTD average rate 9.638 9.580 9.592 9.531 9.447 9.361 9.272 9.258 9.344
SEK/EUR, Quarterly average rate 9.784 9.570 9.640 9.531 9.708 9.533 9.275 9.258 9.297
SEK/EUR, closing day rate 9.824 9.649 9.619 9.543 9.565 9.624 9.431 9.226 9.172
SEK/USD, YTD average rate 8.529 8.600 8.817 8.941 8.574 8.416 8.353 8.412 8.396
SEK/USD, Quarterly average rate 8.264 8.175 8.722 8.941 8.974 8.547 8.228 8.412 8.512
SEK/USD, closing day rate 8.193 8.175 8.421 8.936 9.060 8.588 8.497 8.094 8.393
Q4, 2017
Q4 2017/ Q4 2017/ YTD 2017/
Q4 2016 Q3 2017 YTD 2016
Income -13 53 152
of which Baltic Banking 12 53 137
of which LC&I -23 -1 14
Expenses -2 22 64
of which Baltic Banking 5 19 50
of which LC&I -7 2 5
Credit impairments -3 2 4
Net profit -10 27 68
of which Baltic Banking 6 28 73
of which LC&I -16 -2 0
Dec 2017/ Dec 2017/
Sep 2017 Dec 2016
Loans to the public 2.8 0.3
of which Baltic Banking 2.7 4.0
of which LC&I 0.2 -3.7
Deposit from the public 3.1 4.3
of which Baltic Banking 3.3 4.9
of which LC&I -0.2 -0.5
Currency distribution and exchange rates
Impact from exchange rate fluctuations
SEKm
SEKbn
78
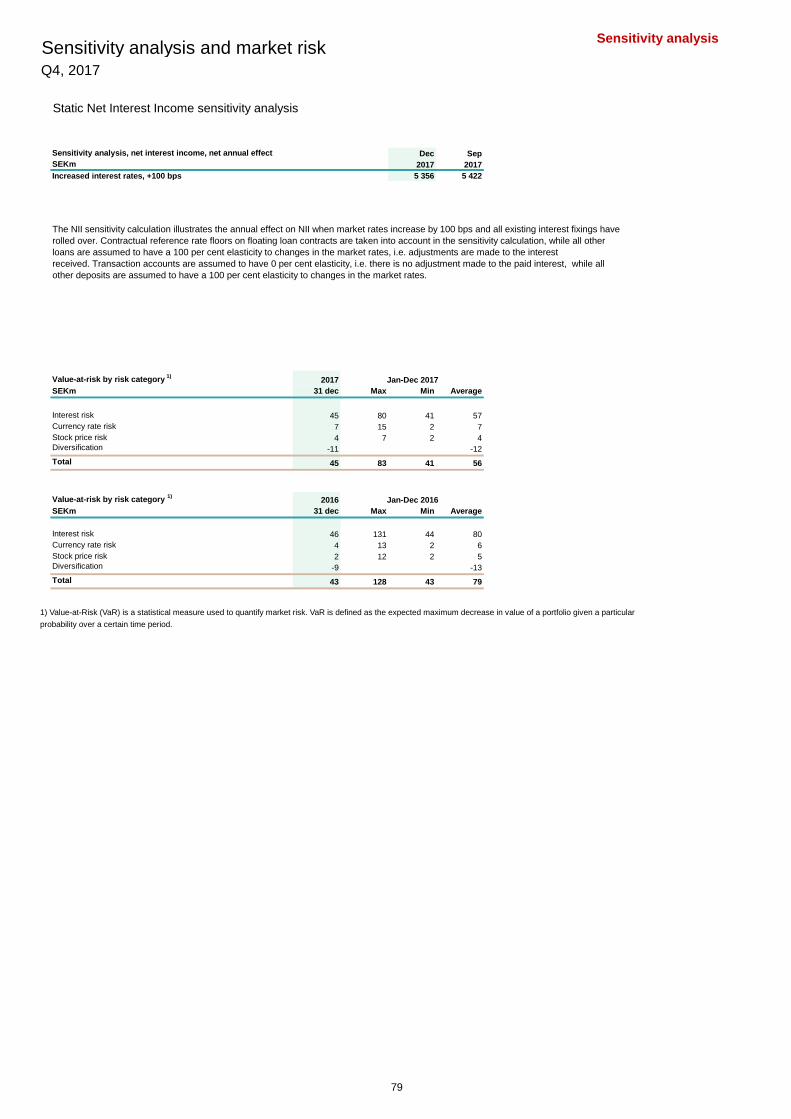
Sensitivity analysisSensitivity analysis and market riskQ4, 2017
Static Net Interest Income sensitivity analysis
Dec Sep
2017 2017
Increased interest rates, +100 bps 5 356 5 422
Value-at-risk by risk category 1)
2017
SEKm 31 dec Max Min Average
Interest risk 45 80 41 57
Currency rate risk 7 15 2 7
Stock price risk 4 7 2 4Diversification -11 -12
Total 45 83 41 56
Value-at-risk by risk category 1)
2016
SEKm 31 dec Max Min Average
Interest risk 46 131 44 80
Currency rate risk 4 13 2 6
Stock price risk 2 12 2 5Diversification -9 -13
Total 43 128 43 79
1) Value-at-Risk (VaR) is a statistical measure used to quantify market risk. VaR is defined as the expected maximum decrease in value of a portfolio given a particular
probability over a certain time period.
Sensitivity analysis, net interest income, net annual effect
SEKm
Jan-Dec 2016
Jan-Dec 2017
The NII sensitivity calculation illustrates the annual effect on NII when market rates increase by 100 bps and all existing interest fixings have
rolled over. Contractual reference rate floors on floating loan contracts are taken into account in the sensitivity calculation, while all other
loans are assumed to have a 100 per cent elasticity to changes in the market rates, i.e. adjustments are made to the interest
received. Transaction accounts are assumed to have 0 per cent elasticity, i.e. there is no adjustment made to the paid interest, while all
other deposits are assumed to have a 100 per cent elasticity to changes in the market rates.
79
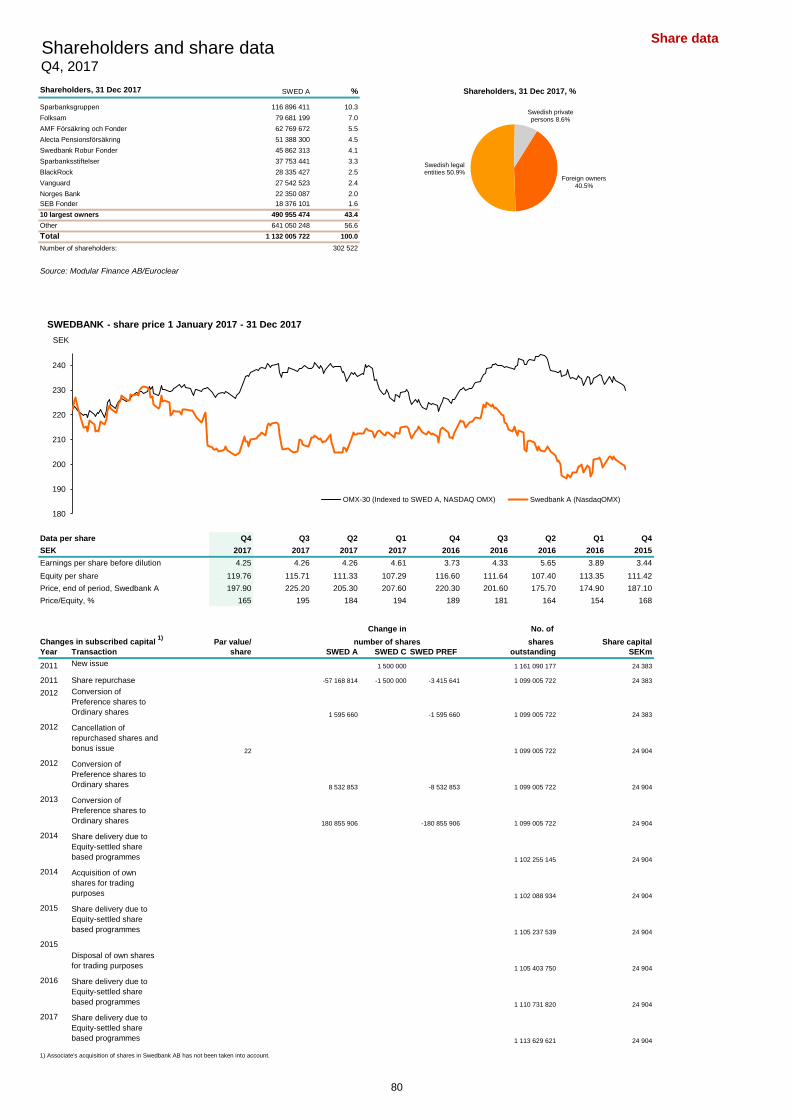
Share dataShareholders and share dataQ4, 2017
Shareholders, 31 Dec 2017 SWED A % Shareholders, 31 Dec 2017, %
Sparbanksgruppen 116 896 411 10.3
Folksam 79 681 199 7.0
AMF Försäkring och Fonder 62 769 672 5.5
Alecta Pensionsförsäkring 51 388 300 4.5
Swedbank Robur Fonder 45 862 313 4.1
Sparbanksstiftelser 37 753 441 3.3
BlackRock 28 335 427 2.5
Vanguard 27 542 523 2.4
Norges Bank 22 350 087 2.0
SEB Fonder 18 376 101 1.6
10 largest owners 490 955 474 43.4
Other 641 050 248 56.6
Total 1 132 005 722 100.0
Number of shareholders: 302 522
Source: Modular Finance AB/Euroclear
Data per share Q4 Q3 Q2 Q1 Q4 Q3 Q2 Q1 Q4
SEK 2017 2017 2017 2017 2016 2016 2016 2016 2015
Earnings per share before dilution 4.25 4.26 4.26 4.61 3.73 4.33 5.65 3.89 3.44
Equity per share 119.76 115.71 111.33 107.29 116.60 111.64 107.40 113.35 111.42
Price, end of period, Swedbank A 197.90 225.20 205.30 207.60 220.30 201.60 175.70 174.90 187.10
Price/Equity, % 165 195 184 194 189 181 164 154 168
Changes in subscribed capital 1)
Par value/
Year Transaction share SWED A SWED C SWED PREF
2011 New issue 1 500 000 1 161 090 177 24 383
2011 Share repurchase -57 168 814 -1 500 000 -3 415 641 1 099 005 722 24 383
2012 Conversion of
Preference shares to
Ordinary shares 1 595 660 -1 595 660 1 099 005 722 24 383
2012 Cancellation of
repurchased shares and
bonus issue 22 1 099 005 722 24 904
2012 Conversion of
Preference shares to
Ordinary shares 8 532 853 -8 532 853 1 099 005 722 24 904
2013 Conversion of
Preference shares to
Ordinary shares 180 855 906 -180 855 906 1 099 005 722 24 904
2014 Share delivery due to
Equity-settled share
based programmes 1 102 255 145 24 904
2014 Acquisition of own
shares for trading
purposes 1 102 088 934 24 904
2015 Share delivery due to
Equity-settled share
based programmes 1 105 237 539 24 904
2015
Disposal of own shares
for trading purposes 1 105 403 750 24 904
2016 Share delivery due to
Equity-settled share
based programmes 1 110 731 820 24 904
2017 Share delivery due to
Equity-settled share
based programmes 1 113 629 621 24 904
1) Associate's acquisition of shares in Swedbank AB has not been taken into account.
Change in
number of shares
outstanding SEKm
No. of
shares Share capital
Foreign owners 40.5%
Swedish legal entities 50.9%
Swedish private persons 8.6%
180
190
200
210
220
230
240
SWEDBANK - share price 1 January 2017 - 31 Dec 2017
OMX-30 (Indexed to SWED A, NASDAQ OMX) Swedbank A (NasdaqOMX)
SEK
80

DefinitionsDefinitionsQ4, 2017
Capital Requirement Regulations, CRR, stated in EU Regulation No 575/2013. Provision ratio for impaired loans
Provisions for impaired loans assessed individually in relation to impaired loans, gross.
Additional Tier 1 capital
Capital instruments and related share premium accounts that fulfill certain regulatory conditions after considering Return on allocated equity
regulatory adjustments. Return on allocated equity for the operating segments is calculated based on profit for the period for the operating
segment (operating profit less estimated tax and non–controlling interests), in relation to average allocated equity
Average risk weight for the operating segment. The average is calculated using month-end figures, including the prior year end.
Total risk exposure amount divided by the total exposure value for a number of exposures.
Return on equity
Own funds Profit for the period (annualised) allocated to shareholders in relation to average equity attributable to
The sum of Tier 1 and Tier 2 capital. shareholders’ of the parent company. The average is calculated using month-end figures, including the prior year end.
Common Equity Tier 1 capital Share of impaired loans, gross
Capital consisting of capital instruments, related share premium accounts, retained earnings and other comprehensive income Carrying amount of impaired loans, gross, in relation to the carrying amount of loans to credit institutions and
after considering regulatory adjustments. the public excluding provisions.
Common Equity Tier 1 capital ratio Share of impaired loans, net
Common Equity Tier 1 capital in relation to the total risk exposure amount. Carrying amount of impaired loans, net, in relation to the carrying amount of loans to credit institutions and the public.
Expected loss (EL) Total provision ratio for impaired loans
Expected loss shall provide an indication of the mean value of the credit losses that Swedbank may reasonably be expected All provisions (individually assessed and portfolio) for loans in relation to impaired loans, gross.
to incur. The expected loss (EL) is the product of the parameters PD, LGD and exposure value.
Other
Exposure value IRB
The exposure after taking into account credit risk mitigation with substitution effects Cash flow per share
and credit conversion factors, the exposure value is the value to which the risk weight is applied when calculating the Cash flow for the period in relation to the weighted average number of shares outstanding during the period.
risk exposure amount.
Credit Impairment
Leverage ratio Established losses and provisions for the year less recoveries related to loans as well as the year’s net expenses
Tier 1 capital in relation to the total exposure measure, where the exposure measure includes both on- and off-balance sheet items. for guarantees and other contingent liabilities.
Loss given default (LGD) Default
Loss given default (LGD) measures how large a proportion of the exposure amount that is expected to be lost in the event of default. Credit exposures are regarded to be in default if there has been an assessment indicating that the counterpart
is unlikely to pay its credit obligations as agreed or if the counterpart is past due more than 90 days.
Minimum capital requirement
The minimum capital a bank must hold for its credit, market, credit value adjustment, settlement and operational risks according Earnings per share after dilution
to Pillar I, i.e. 8% of total risk exposure amount. Profit for the period allocated to shareholders in relation to the weighted average number of shares outstanding
during the period, rights issue adjustment factor included, adjusted for the dilution effect of potential shares.
Probability of default (PD)
The probability of default (PD) indicates the risk that a counterparty or contract will default within a 12-month period. Earnings per share before dilution
Profit for the period allocated to shareholders in relation to the weighted average number of shares outstanding
Risk exposure amount during the period, rights issue adjustment factor included.
Risk weighted exposure value i.e. the exposure value after considering the risk inherent in the asset.
Exposure at default (EAD)
Tier 1 capital Exposure at default (EAD) measures the utilised exposure at default. For off-balance sheet exposures, EAD is
The sum of Common Equity Tier 1 capital and Additional Tier 1 capital according to article 25 in CRR. calculated by using a credit conversion factor (CCF) estimating the future utilisation level of unutilised amounts.
Tier 1 capital ratio Impaired loans
Tier 1 capital in relation to the total risk exposure amount. Loans where there is, on individual level, objective evidence of a loss event, and where this loss event has
an impact on the cash flow of the exposure. Impaired loans, gross, less specific provisions for loans assessed
Tier 2 capital individually constitute impaired loans, net.
Capital instruments and subordinated loans and related share premium accounts that fulfill certain regulatory conditions
after considering regulatory adjustments. Individual provisions
Provisions for individual exposures classified as impaired.
Total capital ratio
Own funds in relation to the total risk exposure amount. Interest fixing period
Contracted period during which interest on an asset or liability is fixed.
Alternative Performance Measures
Liquidity Coverage Ratio (LCR)
Allocated equity The LCR was introduced by the EU through the Delegated act on LCR in October 2015. The LCR according to
Allocated equity is the operating segment’s equity measure and is not a measure that is directly required by IFRS. The Group’s Swedish definitions and through national SFSA's regulations (FFFR 2012:6) is in force since 2012.
equity attributable to shareholders is allocated to each operating segment based on capital adequacy rules and estimated The LCR is used to define a quantitative regulatory requirement on European banks'
capital requirements based on the bank’s internal Capital Adequacy Assessment Process (ICAAP). liquidity risk. A LCR ratio above 100% implies that the bank has enough of liquid assets to cover its liquidity
over 30 calendar day time horizon under a significantly severe liquidity stress scenario.
Cost/income ratio
Total expenses in relation to total income. Maturity
The time remaining until an asset or liability’s terms change or its maturity date.
Credit Impairment ratio
Credit impairment on loans and other credit risk provisions (annualised), net, in relation to the opening balance of Portfolio provisions
loans to credit institutions and loans to public after provisions. An interim step to individual provisions. The provisions are related to a loss event within a group of exposures with
similar credit risk characteristics. A loss event has taken place but the impact cannot yet be connected to
Equity per share an individual exposure. The impact of the loss event can be reliably calculated on a group of exposures.
Shareholders’ equity in relation to the number of shares outstanding.
Return on total assets
Loan/Deposit ratio Profit for the period (annualised) in relation to average total assets. The average is calculated using
Lending to the public excluding Swedish National Debt Office and repurchase agreements in relation to month-end figures, including the prior year end.
deposits from the public excluding Swedish National Debt Office and repurchase agreements.
Yield
Net interest margin before trading interest is deducted Dividend per share in relation to the share price at end of period.
Net interest margin before trading interest is deducted is calculated as Net interest income before trading interest is deducted,
in relation to average total assets. The average is calculated using month-end figures, including the prior year end.
Net stable funding ratio (NSFR)
NSFR aims to have a sufficiently large proportion of stable funding in relation to long-term assets. The measure is
governed by the EU’s Capital Requirements Regulation (CRR); however no calculation methods have yet been
established. Consequently, the measure cannot be calculated based on current rules. NSFR is presented in
accordance with Swedbank’s interpretation of the Basel Committee’s recommendation (BCBS295). Definitioner/ordlista på svenska finns på www.swedbank.se, under rubriken Finansiell information och publikationer
81
Contacts and calendar
Contacts and financial calendarQ4, 2017
For further information, please contact:
+46 8 585 938 75
Investor Relations
+46 727 40 63 38
Mattias Mauritzon, Equity Investor Relations +46 8 585 907 56
Annie Ho, Equity Investor Relations +46 8 585 922 69
Peter Stenborn, Debt Investor Relations +46 8 585 909 30
Magnus Alvesson, Debt Investor Relations +46 8 585 933 41
Mattias Frithiof, Investor Relations +46 8 585 929 94
Kristoffer Carlgren, Investor Relations +46 8 585 971 16
Investor Relations, e-mail [email protected]
Postal address: Visiting address:
Swedbank Landsvägen 40
SE-105 34 Stockholm, Sweden Sundbyberg, Sweden
Investor relations on the Internet:
This publication can be downloaded/accessed from Swedbank’s web-site:
www.swedbank.com/investor-relations/financial-information-and-publications/
Financial calendar
Annual report 2017 23 February 2018
Annual General Meeting 22 March 2018
Q1 2018 Interim report 24 April 2018
Q2 2018 Interim report 18 July 2018
Q3 2018 Interim report 23 October 2018
Anders Karlsson, CFO
Gregori Karamouzis, Head of Investor Relations
82