Factors that Influence Perceptions of Others: An Emphasis ...
52
University of Lynchburg Digital Showcase @ University of Lynchburg Undergraduate eses and Capstone Projects 2015 Factors that Influence Perceptions of Others: An Emphasis on Down syndrome Briana J. Walls University of Lynchburg Follow this and additional works at: hps://digitalshowcase.lynchburg.edu/utcp Part of the Cognition and Perception Commons , Other Psychology Commons , and the Social Psychology Commons is esis is brought to you for free and open access by Digital Showcase @ University of Lynchburg. It has been accepted for inclusion in Undergraduate eses and Capstone Projects by an authorized administrator of Digital Showcase @ University of Lynchburg. For more information, please contact [email protected]. Recommended Citation Walls, Briana J., "Factors that Influence Perceptions of Others: An Emphasis on Down syndrome" (2015). Undergraduate eses and Capstone Projects. 111. hps://digitalshowcase.lynchburg.edu/utcp/111
Transcript of Factors that Influence Perceptions of Others: An Emphasis ...
University of LynchburgDigital Showcase @ University of Lynchburg
Undergraduate Theses and Capstone Projects
2015
Factors that Influence Perceptions of Others: AnEmphasis on Down syndromeBriana J. WallsUniversity of Lynchburg
Follow this and additional works at: https://digitalshowcase.lynchburg.edu/utcp
Part of the Cognition and Perception Commons, Other Psychology Commons, and the SocialPsychology Commons
This Thesis is brought to you for free and open access by Digital Showcase @ University of Lynchburg. It has been accepted for inclusion inUndergraduate Theses and Capstone Projects by an authorized administrator of Digital Showcase @ University of Lynchburg. For more information,please contact [email protected].
Recommended CitationWalls, Briana J., "Factors that Influence Perceptions of Others: An Emphasis on Down syndrome" (2015). Undergraduate Theses andCapstone Projects. 111.https://digitalshowcase.lynchburg.edu/utcp/111

Running head: FACTORS THAT INFLUENCE PERCEPTIONS 1
Factors that Influence Perceptions of Others: An Emphasis on Down syndrome
Briana J. Walls
Lynchburg College
FACTORS THAT INFLUENCE PERCEPTIONS 2
Abstract
The current study examined how physical characteristics influence perceptions others have of
people with Down syndrome (DS). Participants were shown one of four pictures, which were an
adult male with Down syndrome facial characteristics, an adult male without Down syndrome
facial characteristic, a male child with Down syndrome facial characteristic and a male child
without Down syndrome facial characteristics. After viewing one of the four pictures with a
description of likes and dislikes of the person in the picture, the participants completed a
questionnaire examining perceptions of cognitive-behavioral competence, emotional distance-
discomfort, and occupational ability. The hypothesis of this study was that participants would
rate the people with DS characteristics more negatively than the people without DS
characteristics. In addition, the adult with DS characteristics would be rated more negatively than
the other combinations.
Keywords: Down syndrome (DS), Intellectual disability (ID), ability

FACTORS THAT INFLUENCE PERCEPTIONS 3
Factors that Influence Perceptions of Others: An Emphasis on Down syndrome
Worldwide there are an estimated 650 million people who suffer from a physical or
mental disability (Zheng et al., 2011). More specifically, the United States has approximately 4.6
million Americans with an intellectual or developmental disability (“Introduction to,” 2014). In
the Diagnostic and Statistical Manual o f Mental Disorder an intellectual disability (ID) is
characterized by restrictions in intellectual functioning, which consists of problem solving
abilities, abstract thinking, and reasoning (American Psychiatric Association, 2013). Intellectual
functioning is generally measured by an IQ test, which indicates an intellectual disability if an
individual’s score ranges from 65-70 (American Psychiatric Association, 2013). These scores
can be lower or higher, which determines the severity of the disability. In addition to the level of
intellectual functioning, adaptive behavior is also an indicator of an ID. Adaptive behavior
consists of failure to meet specific standards, developmental and social, for independence and
social responsibility (American Psychiatric Association, 2013). This includes limited
communication skills and social participation. In addition to intellectual and adaptive
functioning, the onset of these deficits during the developmental period, meaning deficits are
present during childhood or adolescent (American Psychiatric Association, 2013). ID does have
a stigma associated with it whether peer stigma or self-stigma. According to the Merriam-
Webster Encyclopedia Britannica, stigma is a set of negative beliefs that society or a group of
people have about another group of people, which is often unfair (Stigma, 2014). Self-stigma
occurs when an individual internalizes stigma from others (Ali, Hassiotis, Strydom, & King,
2012). People with an ID are sometimes excluded by others because they are different from
individuals who do not have ID, leaving them as outcasts when compared to the people who do
not have ID. This stigma is a result of the negative view toward people who have intellectual
FACTORS THAT INFLUENCE PERCEPTIONS 4
disabilities. Stigma can cause many hardships for an individual, including discrimination
throughout life and rejection from peers.
Stigma of Intellectual Disabilities
Stigma occurs when groups of individuals, such as people with intellectual disabilities,
are devalued by society based on values or characteristics differing from the norm (Ali et al.,
2012). Stigma occurs in multiple settings, such as at school, at work, or in the community (Ali et
al.). Stigma can present itself in many ways. The general willingness to integrate individuals
with an ID into the community can represent stigmatism; the discomfort of thinking about
holding a conversation or being near someone who has an ID is an example of how stigma can
manifest. Previous studies have examined the stigma that the public maintains for individuals
with intellectual disabilities. Antonak and Harth (1994) found that people in the general public
who were educated about ID or had a career that worked with this population did not show as
much stigma as people who were uneducated and had no personal experience with ID. Similarly,
Henry, Keys, Jopp, and Balcazar (1996) examined perceptions of individuals with ID among
workers in the field of human services and students pursuing their undergraduate degree. The
outcome of their experiment regarding community attitudes toward individuals with intellectual
disabilities shows favorability toward this population on scales concerning empowerment,
exclusion, sheltering scale, and similarity (Henry et al.). Although this study found that the
community thought positively about the ID population, the participants consisted of mostly
students who were educated on ID and adults working as social workers, human service
personal, and educators (Henry et al.). The experiences and education that the participants had
with ID could have made this disability seem less negative when compared to someone who had
no knowledge or never encountered an individual with ID, which could have impacted the results

FACTORS THAT INFLUENCE PERCEPTIONS 5
of this study. This supports the results of the study conducted by Antonak and Harth (1994)
because knowledge and experience with the population of ID could decrease stigma associated
with them. People who work with individuals who have an intellectual disability view this
population differently than those who do not since they have a better understanding of the
abilities they have and the growth that may be made as they develop. The interaction with this
population may cause them to not compare people with ID to the general population, which
influences a more positive outlook on individuals with ID than those who do not have this
firsthand experience. People who are not exposed to the population of ID have a harder time
grasping the differences that may appear when comparing ID to the general population, therefore
creating a stigma around these differences.
Negative perceptions of ID are also seen in children within the schooling system.
Children are stigmatizing others at a young age; elementary children have been found to rate
individuals with ID as more negative than other peers without a disability (Nowicki &
Sandieson, 2002). However, if presented with a child of the same gender and age who has ID,
the participant’s perception was more positive than the other children presented with a different
gender and age (Nowicki & Sandieson). Similarly, Scior, Addai-Davis, Kenyon, and Sheridan
(2013) evaluated whether knowledge of ID affected the participants rating on empowerment,
exclusion, sheltering, and similarity of the individual who showed symptoms of ID (e.g. low IQ).
Their results found that people who have interacted with and had knowledge of ID rated a person
with ID characteristics more similar to them and empowering than those who had limited
knowledge and encounters with ID individuals. Both studies, Nowicki and Sandieson (2002) and
Scior et al. (2013), showed the effect knowledge and similarities have on the perceived
stigmatism toward ID. The more knowledge people have and the more they relate to that

FACTORS THAT INFLUENCE PERCEPTIONS 6
individual with ID the less negatively they will judge them. People who do not know about ID
and have not interacted with an individual with ID may view them as more abnormal than those
who have the background and experience.
Stigma can unconsciously influence interactions between people. For example, a
caretaker may enable an individual with ID because this population is usually perceived as
incapable of making decisions or completing tasks independently (Ditchman, Werner, Kosyluk,
Jones, Elg, & Corrigan, 2013). The stigma also influences subtle discrimination within school
systems. In some instances students with ID are segregated in day programs and workshops
(Siperstein, Norins, Corbin, & Shriver, 2003). This exclusion of individuals with ID does not aid
in the education of this disability to others. They may be perceived as negative because they are
outsiders.
Stigmatism of ID continues into adulthood; once people with ID have the desire to start
working, they experience discrimination within the workforce, since many adults may view
individuals with ID as “unemployable” and doubt their ability (Shaw, Mackinnon, McWilliam,
& Sumsion, 2003). Furthermore, many studies have measured the discomfort and distance
people would want from a person with ID (Morin, Crocker, Beaulieu-Bergeron, & Caron, 2013;
Ditchman et al., 2013; Henry et al., 1996; Antonak et al., 1994). These studies have found that
generally people in society want to keep distance from people with ID and feel discomfort if they
are around people with ID. Individuals who have ID have experienced the stigmatism and
discrimination of the general population; however, these individuals still have a positive outlook
on themselves and their abilities (Ali et al., 2012), which implies that they may not comprehend
situations involving stigmatization towards them that occur on a daily basis.

FACTORS THAT INFLUENCE PERCEPTIONS 7
First Impressions and Judgments of Appearance
People tend to make assumptions about an individual’s personality based solely on their
appearance (Wolffhechel et al., 2014). The judgments that are made based upon appearances
influence the manner in which individuals interact with one another (Wolffhechel et al.). Within
the first 39ms of seeing a face people already make a judgment of whether an individual is
threatening or non-threatening (Bar, Maital, & Linz, 2006). Using first impressions based on
appearance can be useful. For example, individuals can determine whether a person is
threatening their safety by the cues on their faces, such as the angle of eyebrows (Wolffhechel et
al.), indicating anger. Once the brain notices the emotion of anger on an individual’s face the
autonomic system begins to function, which is a warning and can keep a person away from
danger (Blair, Morris, Frith, Perrett, & Dolan, 1999). Also, first judgments do lead to
assumptions made about someone’s personality, which may be accurate more often than not. In
Naumann, Vazire, Rentfrow, and Gosling’s (2009) study, they found that people mostly predict
accurate personality traits based on an individual’s face and body, which can aid in navigating
through conversation. Although first impressions can potentially save an individual from danger
and help in connecting with others, it can also influence some negative consequences, such as
stigma and discrimination. When viewing a child with Down Syndrome (DS), which has distinct
facial features, people are quick to associate this individual with negative traits (Enea-Drapeau,
Carlier, & Huguet, 2012). In addition to the initial negative assumptions, when presented with
photographs of children varying in the severity of typical DS facial characteristics, participants
rated the picture that presented severe DS facial features as less intelligent than the photographs
with people who did not carry as distinctive DS characteristics (Enea-Drapeau et al.), which
could influence the way others interact with those individuals and communicate. Altering

FACTORS THAT INFLUENCE PERCEPTIONS 8
communication styles and ways of interacting could cause a development of more stigmatized
opinions of people with DS. Also, the difference in communication and interaction can
potentially cause negative effects in progression and cognitive growth for an individual with DS.
Stigma of Down syndrome
Out of the 4.6 million people who have an ID, approximately 400,000 suffer from DS
(“What is Down,” 2012). DS is a chromosomal abnormality that causes delays in physical
development and coexists with intellectual disabilities (“What is Down,” 2012). Shin, Besser,
Kucik, Lu, Siffel, and Correa (2009) found the prevalence of DS increased from 1979 to 2003 by
31.1%, indicating that DS is becoming more widespread in the United States. This increase in
DS is correlated with women having children at a later age. In 1975 only 5% of women 30 years
or older were giving birth to their first child; however, in 2010, 25% of mothers 30 years and
older were having their first child (“National Vital,” 2010). This evidence helps explain the
increase in the diagnosis of DS over the course of the last several years. DS is the most common
genetic disorder associated with intellectual disability (Enea-Drapeau, Carlier, & Huguet, 2012).
There have been several studies examining the cognitive abilities of individuals with DS
suggesting that people with DS do not fully develop cognitively (Wishart, Cebula, Willis &
Pitcairn, 2007; Virji-Babul, Watt, Nathoo, & Johnson, 2012).
Researchers examined children’s ability to understand different facial expressions. The
results found that a child with DS made the most mistakes when compared to a typically
developing child and an autistic child, suggesting that DS children have the most intellectual
discrepancies (Wishart et al., 2007). In addition, Virji-Babul et al. (2012) found that adults who
have DS could identify happiness; however, they have difficulty identifying sad facial
expressions because interpretation requires awareness of social cues, as well as meanings of
FACTORS THAT INFLUENCE PERCEPTIONS 9
sadness. This implies that intelligence for a person with DS plateaus at a young age, which
results in not learning social cues and having the ability to interpret facial expression, such as
sadness, whereas typically developing children will continue to progress cognitively. The
intellectual discrepancies may influence people without DS to rate an individual with DS more
negatively when asked if they can handle their emotions or express their feelings.
Unlike other intellectual disabilities, DS is visible to any bystander. Some features that an
individual with DS would have include round face, epicanthal fold (skin folds on the inner corner
of eyes), oblique palpebral fissure (upper slant of the eyes), flat nasal bridge (Enea-Drapeau et
al., 2012; Down syndrome, n.d.). Having such obvious features associated with this disability
creates an instinctive first impression, which may influence communication and how the
individual will be perceived (Wolffhechel et al., 2014). The facial features that are directly
linked to DS has stigma associated with it, which influences individuals to perceive them
differently based on physical characteristics not just intellectual ability.
Enea-Drapeau et al. (2012) examined the effects of the facial features on first judgments
and found that the more distinct the DS facial features the more negative the individual was
perceived. However, if the participant had a relationship of any kind, even a professional
relationship, with a person who had DS, they subconsciously rated the pictures more positively
than the individuals who do not have a relationship with anyone with DS (Enea-Drapeau et al.,
2012; Lawson & Walls-Ingram, 2010). For example, parents of adolescents with DS perceived
them as very outgoing and happy individuals, which does not indicate stigma influencing the
parent-child relationship (Burke, Fisher, & Hodapp, 2012). This relates back to the previous
statement involving ID; the more experience a person has with an individual with DS the more
they will view them as positive, implying the idea of normalcy of DS.

FACTORS THAT INFLUENCE PERCEPTIONS 10
Stigma is found throughout the lifespan of an individual with DS, even when the mother
is pregnant with a child with DS. According to Feldman (2014), mothers have an opportunity to
get testing done that determines whether there are chromosomal abnormalities in the fetus, such
as an extra chromosome. This could lead to the possibility of terminating birth based on the
knowledge that the unborn child has DS. Lalvani (2008) found that in the medical field there is
stigma associated with DS. The doctors showed pity for a pregnant mother, and related a child
with DS to a vegetable (Lalvani). One mother stated that she was only informed about the
negative lifestyle that she was going to experience and nothing positive was stated once she
found out that she was going to have a child with DS (Lalvani). All the negative implications of
parenting a child with DS indicate great stigmatism connected to DS. In addition to the medical
field expressing their concerns, the families around these mothers also had negative things to
state, such as, relating the situation to a tragedy and advising starting pregnancy over again,
suggesting termination of the current fetus (Lalvani). This shows that stigma toward DS is
present in many areas, whether medical professionals or family members. Society also
contributes to this stigmatization of disability by pitying the caretakers of a DS child (Lalvani).
By expressing pity for an individual with DS or the family involved shows the negativity
associated with DS, which implies stigmatism toward that population.
Stigmatism of DS also occurs from the family during pregnancy, not just the medical
field. People may discuss or choose to terminate a pregnancy based on the stigma that is
associated with DS. Lawson (2006) studied the expectations of parenting a child with DS and
consideration of termination of pregnancy. The results showed that the expectations of parenting
a child with DS was perceived as negative, with lack of rewards and increased cost. This
negative outlook on the anticipation of parenting a child with DS does lead to the willingness to

FACTORS THAT INFLUENCE PERCEPTIONS 11
terminate the pregnancy (Lawson, 2006). This supports the previous results of studies regarding
the stigma of DS. Lawson and Walls-Ingram (2010) studied the influence of having contact with
a person with DS on the willingness to terminate a pregnancy. Their results suggest that having
contact with a person with DS decreases willingness to terminate a pregnancy of a child with DS
(Lawson & Walls-Ingram). This implies that having a relationship with someone who has DS
may impact the initial perception of an individual based on their characteristics, which would
influence more positive views toward the DS population, implying that the more you see and
interact with people with DS the more stigma decreases (Enea-Drapeau et al.; Lawson & Walls-
Ingram).
Stigma of DS is even seen in the schooling system. Freeman, Alkin, and Kasari (1999)
studied the parents’ satisfaction of the educational placement of their child with DS. Most
parents stated that they would change their child’s school if they could. The majority expressed
the reason behind the change is so their child could be better included (mainstreamed) in their
academics and social interactions (Freeman et al.). This suggests that there is a stigma associated
in the school system, other than special education classes, that excludes children with DS.
Although parents desire mainstreaming their child with DS, they also express concern of the
overwhelming feelings their child would feel if included in regular size classes (Kasari, Freeman,
Bauminger, & Alkin, 1999). This proposes special education classes are needed for children with
DS to focus however, exclusion from social events is not perceived as ideal in the parents’
opinion. The parents’ desire for inclusion was based on age of child (Kasari et al.). Parents
whose child was six to ten years old were more concerned about finding more inclusive
programs for their child, however as the child got older parents became less concerned with
finding alternative programs (Kasari et al.). This implies that there may be fewer options for

FACTORS THAT INFLUENCE PERCEPTIONS 12
alternative schools with inclusive programs as the child gets older, although social inclusion is
viewed as necessary by some parents. Inclusion of individuals with DS may positively impact
stigma of DS because individuals interact with individuals with DS tend to rate the DS
population more positively (Enea-Drapeau et al.; Lawson & Walls-Ingram).
Sirlopu, Gonzalez, Bohner, and Siebler (2008) examined the benefits of inclusion within
the schooling system. They found that inclusion increases positive opinions of people with DS
because peers are aware and surrounded by differences they are more accepting of others
(Sirlopu et al.). Since there is stigmatization associated with DS, inclusion may not occur in the
community or schools, however, families wish there was more inclusion (Kasari et al.). Based on
previous research, inclusion can benefit both parties involved, children with DS and without DS
(Sirlopu et al.). Although some individuals view the inclusion of DS more positively than others,
there is still stigma associated with the disability. The distinct characteristics of an individual
with DS grants others the opportunity to make judgments based on physical features without
interacting with an individual, which influences the perception of abilities of the person with DS.
Stigma of Age and ID
Children who have an intellectual disability may be judged less harshly than adults with
an intellectual disability because the intelligence discrepancy between individuals who are ID
and who are not ID is larger in adults than in children. This suggests that as people age
discrepancy grows between people with ID and without ID. For example, children are most
likely not judged when making mistakes because they are still developing cognitively; the human
brain does not stop developing until early adulthood (Feldman, 2014). Therefore, making
mistakes and learning as a child is a societal norm. The discrepancy between an ID child and a
normally developing child is present, however, is not as obvious since children are in the process

FACTORS THAT INFLUENCE PERCEPTIONS 13
of developing and growing cognitively. A typically developing child’s IQ on average is 100 with
a standard deviation of 15, whereas a child’s IQ with DS is on average 55-70 (Weis, 2014). This
suggests that there is discrepancy between children with and without DS; however, it seems to be
more socially acceptable for children rather than an adult to have an intellectual deficit since they
are in a critical developmental stage. Since children are at a point in their lives where they do not
have the intelligence to live on their own, it is normal for them to be dependent on a parent or a
caregiver. However, as a child begins adolescence they begin to assert their independence. This
is shown in Erikson’s theory of psychological developmental stage of identity-versus-identity-
confusion (Feldman). Adolescents start to become independent while developing into who they
want to be; however, adolescents with DS continuously depend on their family to aid in daily
activities, making independence nearly impossible. This causes a growth in differences between
those who have DS and those who do not. Teenagers with DS are probably judged more on thier
ability to be self-sufficient because they do not fit into the typical teenage role of independence.
This continues into adulthood because many adults with DS do not have the ability to live alone
and take care of themselves hindering their independence from guardians.
The societal norms for typically developing adults are to live alone, have a job, and raise
a family; however, most adults who have DS do not have this independence or the intelligence to
have a high paying job to support themselves and a family. Since society thinks adults are to be
completely independent from their family and adults with DS cannot, there may be more
judgment that occurs toward adults when discussing their ability to take care of themselves, such
as take care of their belongings or prepare food. Also, there is a greater difference between their
cognitive ability when comparing adults with and without DS, which influences judgment to be
associated with the adult population concerning DS. Knowing people’s judgments vary based on

FACTORS THAT INFLUENCE PERCEPTIONS 14
age may imply that stigma varies with age. For example, people may rate older people with DS
as less competent because of the discrepancies between adults with and without DS; however,
people may stigmatize less towards children with DS because they are more similar to those their
age, in that they make mistakes and are dependent.
Present Study
The present study tests whether stigma is associated with DS in college-aged individuals.
The independent variable is age and the presence of DS facial characteristics, which are
manipulated between groups of participants by providing them with different pictures. Based on
previous research there is a stigma associated with intellectual disabilities, however there is not
much research on stigma related to DS. There is research regarding the thoughts of the family
and the family’s experiences with discrimination and stigma towards their child with DS. Yet,
there is minimal research on how a person outside the family perceives this population. Since
the prevalence of DS has increased over the years (Enea-Drapeau et al., 2012), more research
needs to occur to gain knowledge on this specific population and on the general population’s
thoughts pertaining to DS. The goal of the research is to measure the stigma associated with
cognitions, emotions, and abilities of children and adults with DS.
It was hypothesized that adults would be perceived as having better occupational ability,
more cognitive and behavioral competence, and desire for more distance and experience more
discomfort when compared to the perceptions of the children. The second hypothesis predicted
that individuals who showed DS characteristics would be viewed as having less occupational
ability, less cognitive and behavioral competence, and desire for more distance and experience
more discomfort when compared to the perceptions of individuals who do not possess DS
features. Lastly, it was hypothesized that adults with DS characteristics would be perceived as

FACTORS THAT INFLUENCE PERCEPTIONS 15
having less occupational ability, less cognitive and behavioral competence, and desire more
distance and experience more discomfort when compared to perceptions of the other three
combinations (adult without DS, child with DS, and child without DS).
Methods
Participants
The overall number of people who agreed to participate in this study was 163; however,
due to not completing the survey and not providing valid answers to the validity questions,
57 responses had to be terminated. After the termination of invalid responses there were 106
participants in this study: 84 females and 22 males. Participants were volunteers enrolled in an
Introductory Psychology course and volunteers from other organizations on Lynchburg College
campus. An email was sent out to professors and directors to relay to students in their classes and
organizations. Students who wanted to participant in this study followed a link to Survey
Monkey within the email, which lead them to the location of the survey. The sample included 32
freshmen, 27 sophomores, 27 juniors, and 20 seniors. Ages of the participants ranged from 18 to
47 years old; the average age being 20.17 years old. There were 20 African American/Black, 77
Caucasion/white, 2 Latino, 1 Asian, and 6 other that participants classified their race as.
Participants who were enrolled in the psychology introductory course were able to print out
confirmation of participation and may have received extra credit depending upon the course.
Materials and Procedure
First, the participants received an email that informed them of the experiment and
provided instructions to participate in this study (Appendix A). The students who chose to
participate in the study clicked on a link that opened a new webpage, which directed them to the
survey. The first page of the survey that the participants viewed was the informed consent form.

FACTORS THAT INFLUENCE PERCEPTIONS 16
The informed consent form stated information regarding the purpose, required time for the study,
risks and benefits of participation, compensation, and confidentiality (Appendix B). The
informed consent form also provided the participants with contact information if questions would
arise following the experiment. To state that the participants read and understood the information
presented in the informed consent they clicked the continue button. After clicking the continue
button, the participants filled out demographic information (Appendix C). This included general
background information about the participants such as age, year, gender, and race. Following the
demographic information, the participants were shown one of the four independent variables.
The independent variables consisted of pictures; an adult male with DS facial characteristics, an
adult male without DS facial characteristics, a male child with DS facial characteristics and a
male child without DS facial characteristics. A description was provided about the individual in
the picture; the age of the individual (nine years old and 29 years old) was the only factor that
varied between all four descriptions (Appendix D). This description gave information regarding
the individual, such as his favorite things to do. The questions following the description validated
whether the participants were paying attention or not; questions asked about important
information in the description and details from the picture provided (e.g. age and facial
characteristics) (Appendix E). The participants then clicked a next button and filled out a
questionnaire regarding the person in the picture.
The questionnaire used in this study was developed based on reliable questionnaires used
in previous research; Attitudes Toward Intellectual Disability Questionnaire (ATTID) (Morin,
Crocker, Beaulieu-Bergeron, & Caron, 2013), Child Occupational Self Assessment (Kramer,
Kielhofner, & Smith, 2010), The Mental Retardation Attitude Inventory (Antonak & Harth,
1994), and Community Living Attitude Scale- Mental Retardation (Henry, Keys, Jopp, Balcazar,

FACTORS THAT INFLUENCE PERCEPTIONS 17
1996). The questionnaire used a Likert scale, which measured the participant’s judgments that
translated into potential stigma. The Likert scale measured negative, positive, or neutral
thoughts/emotions toward the individual presented in the beginning of the study. The participants
rated on a 5-point Likert scale whether they strongly agreed, agreed, disagreed, strongly
disagreed, or whether they felt neutrally about the statement that was presented. The three
subscales that measured stigma toward an individual were cognitive-behavioral, distance-
discomfort, and occupational ability.
The cognitive-behavioral subscale had 11 items, which measured how competent and
self-controlled the participant viewed the individual (Cronbach’s α = .83). This subscale was
measured with questions developed from the ATTID (Morin et al.), for example, “Jesse is able to
learn new things”. The distance-discomfort subscale had 12 items that measured how close the
participant would get to the individual along with their discomfort level when interacting with
the individual (Cronbach’s α = .87). Questions that measured distance-discomfort were
developed through the ATTID, Community Living Attitude Scale- Mental Retardation and The
Mental Retardation Attitude Inventory (Morin, et al.; Henry, et al.; Antonak & Harth, 1994).
Questions rating distance-discomfort included “I would have high anxiety around Jesse” and “I
would allow my child to accept an invitation to a birthday party given for a child with an
intellectual disability”. The occupational ability subscale had 7 items, which measured how
capable the participant perceived the individual to complete daily activities (Cronbach’s α = .76).
Questions were altered from Child Occupational Self Assessment (Kramer et al.), which included
“Jesse is not able to perform chores around the house”. The researcher altered several questions
to fit modern terminology. For example, mentally retarded was substituted with intellectual
disability. The researcher also created and altered questions so they pertained to both adults and

FACTORS THAT INFLUENCE PERCEPTIONS 18
children in order to keep the questions standardized. Throughout the questionnaire there were
questions that asked the participant to choose a specific answer, which tested the validity of the
results. If these specific questions were not answered correctly, those particular results were
terminated based on their invalidity. After the completion of the questionnaire, the participants
were presented with a debriefing statement (Appendix F), which informed the participants of the
purpose of the study and provided contact information for the counseling center in the case of
discomfort. After the participants viewed the debriefing statement, they were thanked for their
participation and provided with extra credit that they could print out and give their professor, if
accepted. Then the participants were advised to exit out of the webpage and the study was
complete.
Results
A 2 (age) X 2 (presence/absence of DS) factorial ANOVA was conducted to determine
differences in scores on the three scales (cognitive/behavioral competence, distance/discomfort,
and occupational ability).
It was hypothesized that adults would be perceived as having more occupational ability
than children. The mean occupational ability for the adults was 28.06 (SD = 4.14, N = 55),
whereas the mean for the children was 25.24 (SD = 3.04, N = 51). The results showed a
significant difference between the means of the occupational ability of adults and children, F(1,
102)= 13.23, p < .05. The hypothesis was supported because adults scored higher on
occupational ability than children. Refer to Figure 1.
In addition to occupational ability, it was also hypothesized that adults would be
perceived as more cognitively and behaviorally competent than children. The mean cognitive
and behavior competence for adults was 40.67 (SD = 5.34, N = 55), whereas the mean for

FACTORS THAT INFLUENCE PERCEPTIONS 19
children was 39.47 (SD = 4.47, N = 51). The results did not show a significance difference
between adults and children, F(1, 102)= 1.08, p > .05, which did not support the hypothesis.
It was also hypothesized that adults would cause more discomfort and people would
desire more distance than children. The mean distance and discomfort for adults was 50.69 (SD =
6.33, N = 55), whereas the mean for the children was 50.24 (SD = 5.64, N = 51). This test
showed that there was no significant difference between perceptions of adults and children, F(1,
120) = .93, p > .05, therefore the hypothesis was not supported.
The presence of DS was also a variable in this study. It was hypothesized that an
individual with facial characteristics related to DS would be perceived as having less
occupational ability than an individual without DS facial characteristics. The mean occupational
ability for the individuals who showed DS characteristics was 25.6 (SD = 3.78, N = 55), whereas
the mean for the individuals who did not show DS characteristics was 27.88 (SD = 3.71, N = 51).
The hypothesis test showed a significant difference between individuals who do and do not
possess DS characteristics, F(1, 102) = 7.98, p < .05, which showed the hypothesis was
supported. See Figure 2.
It was also hypothesized that individuals with DS facial characteristics would be
perceived as less cognitively and behaviorally competent than individuals without DS facial
characteristics. The mean for individual who possessed DS characteristics was 39.18 (SD = 4.67,
N = 55), whereas those who did not have DS characteristics had a mean of 41.08 (SD = 5.11, N =
51). The results did not show a significant difference between the means, F(1, 102) = 3.25, p >
.05. The hypothesis was not supported since those with and without DS characteristics had
similar means.

FACTORS THAT INFLUENCE PERCEPTIONS 20
It was also hypothesized that the individuals who showed characteristics of DS would
cause more discomfort and people would desire more distance than those who did not show signs
of DS. The mean of distance and discomfort for the individuals who showed DS was 52.69 (SD
= 5.57, N = 55), whereas those who did not show DS had a mean of 48.08 (SD = 5.53, N = 51).
The hypothesis test showed a significant difference between the means, F(1, 102)= 18.67, p <
.05, however in the opposite direction as hypothesized. People did not have as much discomfort
toward individuals with DS characteristics. In addition people did not desire more distance from
individuals who had DS characteristics. However, they had more discomfort and wanted more
distance with those who did not show DS characteristics. Therefore, the hypothesis was not
supported. Figure 3.
An interaction between age and presence of DS was also hypothesized and tested. It was
hypothesized that adults with DS features would be perceived as having less occupational ability
than all other combinations (child with DS, child without DS, and an adult without DS). Refer to
Table 1 for descriptive statistics. The results did not show a significant difference between the
means, F(1, 102) = .62, p > .05, which means that this hypothesis was not supported and there
was no interaction between age and DS that influenced the perception of occupational ability.
It was also hypothesized that adults with DS would be perceived as less cognitively and
behaviorally competent than the other combinations (adult without DS, child with DS, and child
without DS). Refer to Table 1 for descriptive statistics. This test did not show a significance
difference between the means, F(1, 102)= .49, p > .05. Therefore the hypothesis was not
supported, suggesting that there was no interaction between age and the presence of DS that
influenced the perception of cognitive and behavioral competence.

FACTORS THAT INFLUENCE PERCEPTIONS 21
Finally, it was hypothesized that adults with DS would cause more discomfort and people
with desire more distance between them and that individual than all other combinations. Refer to
Table 1 for descriptive statistics. The hypothesis test did not show a significant difference
between the means, F(1, 102)= .59, p > .05, which means the hypothesis was not supported. This
suggests that there is no interaction between age and presence of DS that effected perceived
discomfort and desired distance.
Discussion
The results of this study supported two of the nine hypotheses. The first hypothesis
supported was adults would be rated as having more occupational ability than children. Another
hypothesis that was supported was individuals that had DS facial features would be rated as
having less occupational ability than those individuals who did not present DS characteristics.
The results revealed that adults were perceived as having more occupational ability than
children; therefore, the hypothesis was supported. This finding coincides with everyday
discrepancies between adults and children. However, the statements used for this subscale were
basic tasks that were age appropriate for adults and children, such as fixing a snack for oneself.
Based on the level of ability needed to perform the tasks that were stated throughout the survey,
the ratings of occupational ability of adults and children should have been closer. This suggests
that although children may be able to perform certain tasks, adults will be viewed as superior and
therefore, are perceived as having more ability. This can be generalized to the structure of
relationships, especially adult and child relationships, within our society. For example, adults are
usually viewed as the authority figure in our society, which implies that they have more ability to
do specific tasks (like making a snack) than a child.

FACTORS THAT INFLUENCE PERCEPTIONS 22
When a person was shown a picture of an individual with DS facial characteristics, he
was perceived as having less occupational ability than if shown an individual who did not show
characteristics of DS. This finding is similar to the results of previous studies conducted by
Enea-Drapeau et al. (2012) and Ditchman, Werner, Kosyluk, Jones, Elg, and Corrigan (2013),
which suggests that when people see someone with a characteristic that is consistent with DS
they viewed that individual as having more negative traits and as more incapable. However,
individuals with DS and without DS were both able to perform the tasks that the survey
described, meaning that the results should not have shown any differences of occupational ability
between these two groups. This discrepancy of perceived ability between people with DS and
without DS suggests people with DS are stigmatized, which relates to findings in multiple
studies (Enea-Drapeau, et al.; Lalvani, 2008; Lawson, 2006).
The results of this study did not show any discrepancies between adults and children or
individuals with DS and without DS facial features in cognitive/behavioral competence. Based
on the significant results for the occupational ability scale, one may predict that the cognitive/
behavioral scale would reflect the same results for both variables (age and presences of DS),
especially since adults and people without DS are generally viewed as having more cognitive
ability and behavior control. The results showed that adults and children were perceived as
having similar cognitive and behavioral competencies. This may be a consequence of all the
statements pertaining to the cognitive/behavioral competency scale being neutral to age, meaning
both adults and children were able to complete the tasks in the survey. This was also true for the
individuals who presented DS and those who did not. Every individual presented to the
participants had the capability, cognitively and behaviorally, to accomplish the tasks that were
stated in the survey, which could explain why both hypotheses pertaining to these variables were

FACTORS THAT INFLUENCE PERCEPTIONS 23
not supported. Although the cognitive/behavioral competence scale was similar to the
occupational ability scale in regards to the capability of each individual presented to the
participants, the results varied. Participants may have rated individuals with DS as having more
discrepancies in occupational ability rather than cognitive/behavioral competencies because of
the physical presence of DS. They may have only associated the facial characteristics of DS with
physical deficits and not cognitive or behavioral deficits, since the disability was only shown
through physical features in this study. The non-significant results for this scale differs from
previous studies that found people with DS were viewed as, and in fact are, less intelligent than
people who did not exhibit DS (Enea-Drapeau, Huguet, & Carlier, 2014; Wishart, Cebula, Willis
& Pitcairn, 2007; Virji-Babul, Watt, Nathoo, & Johnson, 2012). This implies that students of
Lynchburg College may differ on stigmatization of individuals with DS, which may be a result
of the diversity of the student body. The diversity on campus could make Lynchburg’s students
more accepting of differences, therefore rating individuals with differences as similar to
themselves. Specifically, the sample in this study consisted of people from psychology classes
who may have been exposed to DS and information regarding ageism. Also, Bonner leader
students participated in this study and they have volunteered to help individuals with ID, which
may make them more sensitive to their cognitive state and behavioral tendencies. Also, there is a
wide range of ages within the classroom setting at Lynchburg. This interaction with the older
generation could make discrepancies between ages more vague. Generalizing this information to
the public would suggest that there is no stigma associated with the cognitive and behavioral
ability of individuals with DS. However, stigma related to an individual’s ability that has DS
could be seen in the education system with special education classes for those who have an ID
(Freeman, Alkin, & Kasari, 1999; Kasari, Freeman, Bauminger, & Alkin, 1999).
FACTORS THAT INFLUENCE PERCEPTIONS 24
It was hypothesized that individuals who presented DS characteristics would cause more
discomfort and people would desire more distance from the individuals who showed
characteristics of DS. The hypothesis was not supported, but the data was significant revealing
means in a direction that was not predicted. People showed less discomfort with the individuals
who had DS characteristics and desired to be closer to them. This suggests that there is no stigma
toward the DS population. The results may have occurred in response to the participants
overcompensating in order to make themselves look more accepting and less judgmental than
they truly are. These findings differed from previous research that found that in general, people
feel more discomfort and wanted more distance from people with ID than a person without ID
(Morin, Crocker, Beaulieu-Bergeron, & Caron, 2013; Ditchman et al. 2013; Henry et al., 1996;
Antonak et al., 1994). Another reason behind this finding may be where the population was
recruited from to participate in this study. Participants were majority students in a psychology
course and Bonner Leaders. The students that were in a psychology course had learned about DS
and its deficits, which could have altered the way they viewed this population. Also, these
students are exposed to many different mental illnesses and disabilities throughout the course,
which may cause them to be more opened-minded and accepting of differences. Bonner Leaders
participate in 900 hours of community service that offers them many diverse experiences
exposing them to many differences. One community partner is an organization that helps adults
with disabilities, including DS, in which most Bonners participate. This creates a bias since the
Bonners have experiences with the disabled population and has witnessed people with DS excel.
The hypotheses regarding the interactions between age and presence of DS (adult with
DS, adult without DS, child with DS, and child without DS) were not supported on any of the
three subscales (occupational ability, cognitive/behavioral competence, and distance/discomfort).

FACTORS THAT INFLUENCE PERCEPTIONS 25
This contradicts the predictions, which states adults with DS would be perceived as most
negative on all scales when compared to the other groups. This suggests that people with DS and
people without DS are perceived similarly by the general population, regardless of age. This
shows the students who participated in this study do not stigmatize toward people with DS. This
differs from past research because most studies found that individuals with DS were perceived as
more negative than those without DS (Nowicki & Sandieson, 2002; Enea-Drapeau, Carlier, &
Huguet, 2012). Adults with DS were hypothesized to score more negatively because the
discrepancy between adult with DS and adult without DS is greater than the discrepancy between
children with DS and children without DS. However, the hypotheses were not supported, which
shows that people view these four groups as similar on all scales. These findings could be a
result of the population in which the participants were recruited form, such as psychology
courses and organizations that are exposed to diversity, such as Bonner Leaders. Both
recruitment pools discuss and learn about differences in people. This bias may have resulted in
data that was not true to the general population, but for these specific groups. For example,
Nowicki and Sandieson (2002) studied how children perceived ID and found that children rated
those with ID as more negative. The discrepancies between that study and the present study
could be a result of age differences in the population examined. Children do not have as much
experiences as adults and therefore have not been exposed to or learned about ID or DS.
There were many limitations in this study. The recruitment pool in which participants
were drawn from consisted of students in a psychology courses and Bonner Leaders who have
experience working with the disabled population. Students that are in psychology courses are
exposed to information regarding DS, which may make the topic not as unfamiliar. Also, there
were more females than males who participated in this study. This could have influenced the
FACTORS THAT INFLUENCE PERCEPTIONS 26
results of the study, especially when discussing emotions toward a stigmatized population.
Females may be more sympathetic toward vulnerable populations and therefore more likely to be
comfortable around people with DS.
Another limitation was the design of the study. Participants took the survey on an online
site, which gave them the opportunity to quit the survey at any point by simply exiting out of the
website. In addition to answering randomly, which lead to the loss of many participants due to
unreliable answers. This design also provided them the choice of the time and environment in
which they would take the survey. The opinion of a participant could have been altered if they
were surrounded by friends or in a room alone. Also, the environment they were in could have
also swayed their perceptions, for example if the participants were in a formal setting (a
classroom) or an informal setting (a bedroom). In addition to these factors, the participants had
the ability to research DS from the computer that they were taking the survey on, which could
enable them to be more knowledgeable on DS than they actually are, therefore answering the
questions in a more positive way.
In addition, males were the only variable evaluated in this study. The gender was chosen
based on the fact that more males are diagnosed with DS than females (2009), which means
people are more likely to encounter a male with DS than a female with DS. Also, if females were
included it would have added an additional independent variable, which would increase the
number of conditions and the number of participants needed for each condition. Based on the
statistics of DS and gender, and the small recruitment pool, choosing male seemed the most
logical. Gender plays a huge role in how people perceive others and therefore representing only
the male population could be a limitation. This could have altered the way people answered
questions because they may have thought males were more capable, which would explain why

FACTORS THAT INFLUENCE PERCEPTIONS 27
people who displayed DS were in general rated more positively than hypothesized. If pictures of
females were used the results may have altered.
As for future research, many factors could be changed. For example, the design of the
study could be altered to make participants take the survey in similar environments with a
researcher present to make a formal setting. Also, gender of the people presented in the picture
for the independent variable could be examined, which would potentially alter the results of the
study. A future study could also provide information about DS to one group and not the other.
This would explore whether knowledge impacts an individual’s perspective of DS in a negative
or positive way, since previous studies have found that more knowledge on DS and ID is
correlated to less stigma (Enea-Drapeau et al.; Lawson & Walls-Ingram; Antonak & Harth; Scior
et al.). In addition, future researchers may examine whether personal relationships with a person
with DS influences the perception of the DS population. Therefore, future research may include
questions asking the participant to disclose whether they know someone with DS and what their
relationship is.
Future research could examine how perceptions change between participants studying
different majors, such as psychology, sociology, business, and accounting. This could validate
that exposure and knowledge influences the perceptions of DS because psychology majors are
exposed to DS and accounting majors are not exposed to DS within their curriculum. Also,
surveying different age groups such as professors and parents may result in different findings.
Adults may have more experience with DS and have more knowledge, which may influence
different responses for the survey.
The findings of this study show that DS may be less stigmatized than it has been in the
past, revealing that people believe individuals who have DS are more competent and are not

FACTORS THAT INFLUENCE PERCEPTIONS 28
uncomfortable around this population. This could potentially influence the inclusion of people
with DS in society, such as work places and schools. Regardless of the results and implications
of this study, more research is needed to understand the DS population and how people in
different positions perceive them.

FACTORS THAT INFLUENCE PERCEPTIONS 29
References
(2009). Down syndrome cases at birth increased. Centers for disease Control and Prevention.
Retrieved from http://www.cdc.gov/features/dsdownsyndrome/.
(2012). What is Down syndrome? National Down syndrome Society. Retrieved from
http://www.ndss.org/Down-Syndrome/What-Is-Down-Syndrome/.
(2014). Introduction to intellectual disabilities. The Arc. Retrieved from
http://www.thearc.org/page.aspx?pid=2448.
Ali, A., Hassiotis, A., Strydom, A., & King, M. (2012). Self stigma in people with intellectual
disabilities and courtesy stigma in family carers: A systematic review. SciVerse
ScienceDirect. http://dx.d0i.0rg/l0.1016/j.ridd.2012.06.013.
American Psychiatric Association. (2013). Diagnostic and statistical manual o f mental disorders
(5th ed.). Washington, DC: Author.
Antonak, R., & Harth, R. (1994). Psychometric analysis and revision of the mental retardation
attitude inventory. Mental Retardation, 32, pp. 272-280.
Bar, M., Maital, N., & Linz, H. (2006). Very first impressions. American Psychological
Association, 6, pp. 269-278. Doi: 10.1037/1528-3542.6.2.269.
Blair, R., Morris, J., Frith, C., Perrett, D., and Dolan R. (1999). Dissociable neural responses to
facial expressions of sadness and anger. Oxford University Press 1999 122, pp. 883-893.
Burke, M., Fisher, M., & Hodapp, R. (2012). Relations of parental perceptions
To the behavioural characteristics of adolescents with down syndrome. Journal on
Developmental Disabilities, 18, pp. 50-57.
Ditchman, N., Werner, S., Kosyluk, K., Jones, N., Elg, B., Corrigan, P. (2013). Stigma and
intellectual disability: potential application of mental illness research. Rehabilitation
FACTORS THAT INFLUENCE PERCEPTIONS 30
Psychology, 58, pp. 206-216. Doi: 10.1037/a0032466
Down syndrome, (n.d.). Retrieved from http://www.manbir-online.com/htm2/downs.3.htm.
Enea-Drapeau, C., Carlier, M. & Huguet, P., (2014). Tracking subtle stereotypes of children with
trisomy 21: from facial-feature-based to implicit stereotyping. PLoS ONE 7(4): e34369.
doi: 10.1371/journal.pone.0034369.
Enea-Drapeau, C., Huguet, P., & Carlier, M. (2014). Misleading face-based judgment of
cognitive level in intellectual disability: The case of trisomy 21 (Down syndrome).
ScienceDirect. http://dx.d0i.0rg/l0.1016/j.ridd.2014.09.003
Feldman, R. (2014). Life Span Development: A Topical Approach (2nd edition). Boston, MA.
Pearson.
Freeman, S., Alkin, M., & Kasari, C. (1999). Satisfaction and desire for change in educational
placement for children with Down syndrome. Remedial and Special Education, 20, pp.
143-151.
Henry, D., Key, C., Jopp, D., Balcazar, F. (1996). The community living attitudes scale, mental
retardation form: development and psychometric properties. Mental Retardation, 34, pp.
149-158.
Kasari, C., Freeman, S., Bauminger, N., & Alkin, M. (1999). Parental perspectives on inclusion:
effects of autism and Down syndrome. Journal o f Austism and Developmental Disorders,
29.
Kramer, J., Kielhorner, G., Smith, E. (2010). Validity evidence for the child occupational self-
assessment. American Journal o f Occupational Therapy. Vol. 64, 621-632.
doi: 10.5014/ajot.2010.08142

FACTORS THAT INFLUENCE PERCEPTIONS 31
Lalvani, P. (2008). Mothers of children with Down syndrome: constructing the sociocultural
meaning of disability. American Association on Intellectual and Developmental
Disabilities, 46, pp. 436-445. Doi: 10.1352/2008.46:436-445
Lawson, K. (2006). Expectations of the parenting experience and willingness to consider
selective termination for Down syndrome. Journal o f reproductive and infant psychology,
24, pp. 43-59. Doi: 10.1080/02646830500475351
Lawson, K., & Walls-Ingram, S. (2010). Selective abortion for Down syndrome: the relation
between the quality of intergroup contact, parenting expectations, and willingness to
terminate. Journal o f Applied Social Psychology, 2010, 40, 3, pp. 554-578.
Morin, D., Crocker, A., Beaulieu-Bergeron, R., Caron, J. (2012). Validation of the attitudes
toward intellectual disability- ATTD questionnaire. Journal o f Intellectual Disability
Research, 57, pp. 268-278. Doi: 10.1111/j.1365-2788.2012.01559.x
National Vital Statistics System. (2010). Measuring childbearing patterns in the United States.
Retrieved February 9, 2015, from
http://www.census.gov/newsroom/cspan/childbearing/20120817_cspan_childbearing_sl
ides.pdf.
Naumann, L., Vazire, S., Rentfrow, P., & Gosling, S. (2009). Personality judgments based on
physical appearance. Pers Soc Psychol Bull. Doi: 10.1177/0146167209346309.
Nowicki, E., & Sandieson, R. (2002). A meta-analysis of school-age children’s attitude towards
persons with physical or intellectual disabilities. International Journal o f Disability,
Development and Education, 49. Doi: 10.1080/1034912022000007270
FACTORS THAT INFLUENCE PERCEPTIONS 32
Scior, K., Addai-Davis, J., Kenyon, M., and Sheridan, J. (2013). Stigma, public awareness about
intellectual disability and attitudes to inclusion among different ethic groups. Journal o f
Intellectual Disability Research, 57, pp. 1014-1026. Doi: 10.1111/j.1365-
2788.2012.01597.x.
Shaw, L., Mackinnon, J., Me William, C., & Sumsion, T. (2003). Consumer participation in the
employment rehabilitation process: contextual factors and implications for practice.
Work, 23, 181-192. Retrieved form
http://web.a.ebscohost.com/ehost/pdfviewer/pdfviewer?sid=c4c40e0e-6075-49a0-8cbf-
bdlb5f683580%40sessionmgr4003&vid=l&hid=4207.
Shin, M., Besser, L., Kucik, J., Lu, C., Siffel, C., & Carrea, A.(2014 November 2). Prevalence of
Down syndrome among children and adolescents in 10 regions of the united states.
Pediatrics 2009, 124, 1565. Doi: 10.1542/peds.2009-0745
Siperstein, G. N., Norins, J., Corbin, S., & Shriver, T. (2003). Multinational study of attitudes
toward individuals with intellectual disabilities. Washington, DC: Special Olympics, Inc.
Sirlopu, D., Gonzalez, R., Bohner, G., & Siebler. F., Ordonez, G., Millar, A., Torres, D., &
Tezanos-Pinto, P. (2008). Promoting positive attitudes toward people with down
syndrome: the benefit of school inclusion programs. Journal o f Applied Social
Psychology, 38, pp. 2710-2736.
Stigma. (2014). In Merriam-Webster’s online dictionary (11th ed.) Retrieved from
http://www.merriam-webster.com/dictionary/stigma.
Zheng, X., Chen, G., Song, X., Liu, J., Yan, L., Du, W.,... & Zhang, J. (2011 July 14). Twenty-
year trend on the prevalence of disability in china. World Health Organization. Doi:
10.2471/BLT.l 1.089730

FACTORS THAT INFLUENCE PERCEPTIONS 33
Virji-Babul, N., Watt, K., Nathoo, F., and Johnson P. (2012). Recognition of facial expressions
of emotion in adults with Down syndrome. Physical & Occupational Therapy in
Pediatrics, 32(3), pp. 333-343. Doi: 10.3109/01942638.2011.653626.
Weis, R. (2014). Introduction to abnormal child and adolescent psychology (2nd ed.). Los
Angeles: Sage Publications.
Wishart, J., Cebula, K., Willis D., & Pitcairn, T. (2007). Understanding of facial expressions of
emotion by children with intellectual disabilities of differing aetiology. Journal o f
Intellectual Disability Research, 51, pp. 551-563. Doi: 10.1111/j.1365-
2788.2006.00947.x.
Wolffhechel, K., Fagertun, J., Jacobsen, U., Majewski, W., Hemmingsen, A., Larsen, C.,... &
Jarmer, H. (2014). Interpretation of appearance: the effect of facial features on first
impressions and personality. PLoS ONE 9(9): e107721.
doi:10.1371/journal.pone.0107721

FACTORS THAT INFLUENCE PERCEPTIONS 34
Appendix A
Hello!
My name is Briana Walls, and I am a psychology major working on my Senior Thesis this semester. For my research study, I will be examining factors that influence perceptions of others. I am currently collecting data for my research study, and I would greatly appreciate it if you were to participate! In order to participate you will need to answer some questions in an online survey. It will take 15-20 minutes of your time, and there is extra credit for students who are currently enrolled in PSYC 104 and PSYC 106. You may only participate in this study once! The link to participate is below.
*lf you are under 18 years old, please disregard this email. You are not eligible to participate*
https://www.survevmonkey.com/r/WallsThesis
If you have any questions regarding my study, please email me at [email protected].
Thank you very much for your help and your time!

FACTORS THAT INFLUENCE PERCEPTIONS 35
Appendix BInformed Consent Agreement
Please read this consent agreement carefully before you decide to participate in the research study.
Project Title: Factors that Influence PerceptionPurpose: The purpose of this study is to examine your perceptions of the individuals presented during this study.Participation: You are being asked to participate in this study because you are a student attending Lynchburg College and over the age of 18. This study will take place online. You will be asked to look at a picture, read about the individual in the picture, and answer questions pertaining to the individual.Time Required: Your participation is expected to take about 20 minutes.Risks & Benefits: The risk of this study is possible emotional distress due to being exposed to images that suggest a disability is present. If feelings of distress occur you can visit the counseling center, which is located on the Terrace level of Hundley Hall on the Lynchburg College campus. The hours are Monday-Friday, 8:30am-12pm, 1pm-5pm. If you need to contact the counseling center via phone, the number is (434) 544-8616. The benefit of this study is gaining knowledge about a particular populationCompensation: There is no compensation for participating in this study.Voluntary Participation: Please understand that participation is completely voluntary. You have the right to withdraw from the research study at any time without penalty. If you want to withdraw from the study please exit out of the online survey window. For participants enrolled in an introductory psychology courses, Psyc 103 and 104, you will have the opportunity to receive extra credit for your participation once the study is complete.Confidentiality: Your individual privacy will be maintained throughout this study. You will not be providing your name during this study, which keep the results anonymous. Also, in order to preserve the confidentiality/anonymity of your responses, I have made the results to the questionnaire password dependent, of which only the research has access to.Whom to Contact with Questions: If you have any questions or would like additional information about this research please contact the researcher, Briana Walls, at [email protected]. You can also contact my faculty research sponsor, who is the Principal Investigator (PI) for this project and is supervising my work on the study; at [email protected] Lynchburg College Institutional Review Board (IRB) for Human Subjects Research has approved this project. This IRB currently does not stamp approval on the informed consent/assent documents; however, an approval number is assigned to approved studies - the approval number for this study is LCHSA1415046. You may contact the IRB Director and Chair, Dr. Sharon Foreman-Kready, through the Office of the Associate Dean for Academic Affairs at Lynchburg College at 434.544.8327 or [email protected] with any questions or concerns related to this research study.Agreement: I understand the above information and have had all of my questions about participation in this research study answered. By typing clicking the continue button, I voluntarily agree to participate in the research study described above and verify that I am 18 years of age or older.

FACTORS THAT INFLUENCE PERCEPTIONS 36
Appendix CDemographic Information
Age____
Year: Freshman Sophomore Junior Senior Faculty/Staff
Gender: Male Female
Race: African American/Black Caucasian/White Hispanic Asian other:___________
FACTORS THAT INFLUENCE PERCEPTIONS 37
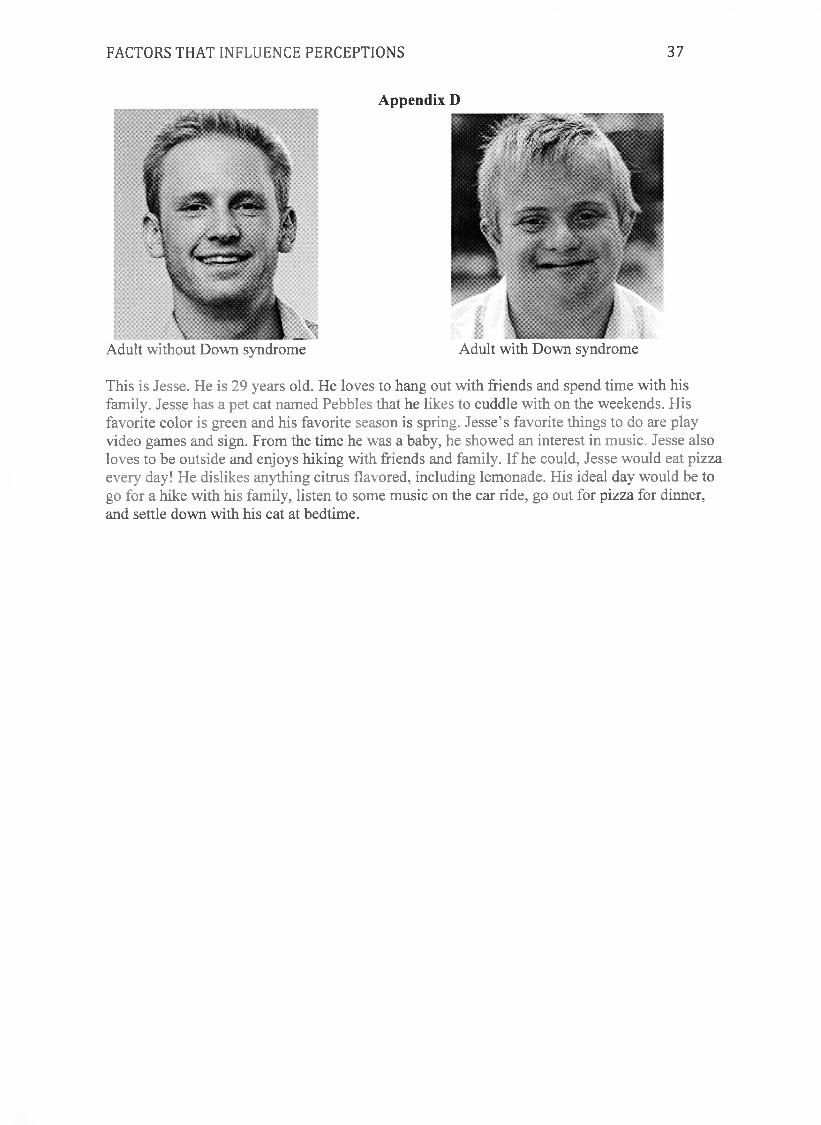
Adult without Down syndrome
Appendix D
Adult with Down syndrome
This is Jesse. He is 29 years old. He loves to hang out with friends and spend time with his family. Jesse has a pet cat named Pebbles that he likes to cuddle with on the weekends. His favorite color is green and his favorite season is spring. Jesse’s favorite things to do are play video games and sign. From the time he was a baby, he showed an interest in music. Jesse also loves to be outside and enjoys hiking with friends and family. If he could, Jesse would eat pizza every day! He dislikes anything citrus flavored, including lemonade. His ideal day would be to go for a hike with his family, listen to some music on the car ride, go out for pizza for dinner, and settle down with his cat at bedtime.

FACTORS THAT INFLUENCE PERCEPTIONS 38
Male child without Down syndrome Male child with Down syndrome
This is Jesse. He is 9 years old. He loves to hang out with friends and spend time with his family. Jesse has a pet cat named Pebbles that he likes to cuddle with on the weekends. His favorite color is green and his favorite season is spring. Jesse’s favorite things to do are play video games and sign. From the time he was a baby, he showed an interest in music. Jesse also loves to be outside and enjoys hiking with friends and family. If he could, Jesse would eat pizza every day! He dislikes anything citrus flavored, including lemonade. His ideal day would be to go for a hike with his family, listen to some music on the car ride, go out for pizza for dinner, and settle down with his cat at bedtime.

FACTORS THAT INFLUENCE PERCEPTIONS 39
Appendix E
Answer the following question about Jesse.
1. How old is Jesse?a. 9b. 15c. 20d. 29
2. What kind of pet does Jesse have?a. Dogb. Lizardc. Catd. Hamster
3. What color hair did Jesse have?a. Brownb. Blondec. Redd. No hair
4. What color eyes did Jesse have?a. Greenb. Brownc. Blued. Hazel
Please read the following questions carefully and mark the answer that best describes your thoughts.
1. Jesse is able purchase an item that he needs.
1 3Neutral
4Agree
5StronglyAgree
Strongly DisagreeDisagree
2. Jesse is able to calm himself down when he is upset.
Strongly DisagreeDisagree
1 3Neutral
4Agree
5StronglyAgree
2
2

FACTORS THAT INFLUENCE PERCEPTIONS 40
3. Jesse is not able to perform chores around the house.
1StronglyDisagree
2Disagree
3Neutral
4Agree
4. Jesse is able to make a snack without any help.
1StronglyDisagree
2Disagree
3Neutral
4Agree
5. I would feel comfortable talking to Jesse.
1StronglyDisagree
2Disagree
3Neutral
4Agree
6. Jesse is able to think of ways to fix a problem.
1StronglyDisagree
2Disagree
3Neutral
4Agree
StronglyAgree
5StronglyAgree
5StronglyAgree
5StronglyAgree
If I knew him, I would accept an invitation to a party from Jesse.
1StronglyDisagree
2Disagree
3Neutral
8. Jesse is happy most of the time.
1StronglyDisagree
2Disagree
3Neutral
4Agree
4Agree
5StronglyAgree
5StronglyAgree
9. For this question, choose agree.
1StronglyDisagree
2Disagree
3Neutral
4Agree
5StronglyAgree
7.

FACTORS THAT INFLUENCE PERCEPTIONS 41
10. Jesse is able to pick out his own outfit in the morning.
1 2 3 4Strongly Disagree Neutral AgreeDisagree
11. Jesse is not able to take a shower without assistance.
1 2 3 4Strongly Disagree Neutral AgreeDisagree
12. I would introduce Jesse to my friends and family.
1 2 3 4Strongly Disagree Neutral AgreeDisagree
5StronglyAgree
5Strongly
Agree
5StronglyAgree
13. I would accept Jesse helping me with a project.
1 2 3 4Strongly Disagree Neutral AgreeDisagree
14. Jesse is not able to follow the rules of a difficult task.
1 2 3 4Strongly Disagree Neutral AgreeDisagree
15. Jesse can make people understand ideas he has.
1 2 3 4Strongly Disagree Neutral AgreeDisagree
5StronglyAgree
5Strongly
Agree
5StronglyAgree
16. Jesse is able to stay focused on a task for a long period of time.
1 2 3 4 5Strongly Disagree Neutral Agree StronglyDisagree Agree
17. I would live in the same neighborhood as Jesse.
1Strongly
2Disagree
3Neutral
4Agree
5Strongly

FACTORS THAT INFLUENCE PERCEPTIONS 42
Disagree Agree
18. I would not sit at the same table as Jesse in the cafeteria.
1StronglyDisagree
2Disagree
3Neutral
4Agree
5StronglyAgree
19. Jesse is able to express his thoughts and feelings to others.
1StronglyDisagree
2Disagree
3Neutral
4Agree
5StronglyAgree
20. Jesse is able to take care of his belongings.
1StronglyDisagree
2Disagree
3Neutral
4Agree
5StronglyAgree
21. Jesse is able to play sports.
1StronglyDisagree
2Disagree
3Neutral
4Agree
5StronglyAgree
22. If we knew each other, I would invite Jesse to my house.
1StronglyDisagree
2Disagree
3Neutral
4Agree
5StronglyAgree
23. I would shake hands with Jesse.
1StronglyDisagree
2Disagree
3Neutral
4Agree
5StronglyAgree
24. Jesse would keep working on a task even if it becomes difficult.
1StronglyDisagree
2Disagree
3Neutral
4Agree
5StronglyAgree

FACTORS THAT INFLUENCE PERCEPTIONS 43
25. For this question, choose strongly disagree.1 2 3 4
Strongly Disagree Neutral AgreeDisagree
26. I would feel afraid to be near Jesse.
1 2 3 4Strongly Disagree Neutral AgreeDisagree
27. If Jesse asked me a question, I would answer him.
5StronglyAgree
5StronglyAgree
1 2 3Strongly Disagree NeutralDisagree
28. Jesse can hold a conversation.
1 2 3Strongly Disagree NeutralDisagree
4 5Agree Strongly
Agree
4 5Agree Strongly
Agree
29. I would move to a different seat if Jesse sat near me in the classroom.
1StronglyDisagree
2Disagree
3Neutral
4Agree
5StronglyAgree
30. Jesse gets angry often.1
StronglyDisagree
2Disagree
3Neutral
4Agree
5StronglyAgree
31. Jesse is able to learn new things.1
StronglyDisagree
2Disagree
3Neutral
4Agree
5StronglyAgree
32. I would have high anxiety around Jesse.1
StronglyDisagree
2Disagree
3Neutral
4Agree
5StronglyAgree

FACTORS THAT INFLUENCE PERCEPTIONS 44
Based on the picture that was displayed does Jesse appear to have any of the following? Check all that apply.
AutismADHDDown syndrome Intellectual disability Physical disability None of the above
Please read the following statements and answer honestly.
1. We should integrate people who are intellectually disabled and who are not intellectually disabled into the same neighborhood.
1StronglyDisagree
2Disagree
3Neutral
4Agree
5StronglyAgree
2. I would allow my child to accept an invitation to a birthday party given for a child with an intellectual disability.
1StronglyDisagree
2Disagree
3Neutral
4Agree
5StronglyAgree
3. I am willing for my child to have children who are intellectually disabled as close personal friends.
1StronglyDisagree
2Disagree
3Neutral
4Agree
5StronglyAgree
4. It is a good idea to have separate after-school programs for children who are intellectually disabled and children who are not intellectually disabled.
1StronglyDisagree
2Disagree
3Neutral
4Agree
5StronglyAgree
5. Even though children with an intellectual disability are in public school, it is doubtful whether they will gain much from it.
1StronglyDisagree
2Disagree
3Neutral
4Agree
5StronglyAgree

FACTORS THAT INFLUENCE PERCEPTIONS 45
6. Although social mixing of people who are intellectually disabled and notintellectually disabled may be right, it is impractical until people with intellectual disability learn to accept limits in their relations with the opposite sex.
7. I have no objection to attending the movies in the company of people who have an intellectual disability.
8. Laws requiring employers not to discriminate against people with an intellectual disability violate the rights of the individual who does not want to associate with people who have intellectual disability.
9. I would rather not have people with an intellectual disability as dinner guests with my friends who are not intellectually disabled.
10. Children who are intellectually disabled waste time playing in class instead of trying to do better.
11. Having people who are not intellectually disabled and are intellectually disabled work at the same jobsites will be beneficial to both.
1StronglyDisagree
2Disagree
3Neutral
4Agree
5StronglyAgree
1StronglyDisagree
2Disagree
3Neutral
4Agree
5StronglyAgree
1StronglyDisagree
2Disagree
3Neutral
4Agree
5StronglyAgree
1StronglyDisagree
2Disagree
3Neutral
4Agree
5StronglyAgree
1StronglyDisagree
2Disagree
3Neutral
4Agree
5StronglyAgree
1StronglyDisagree
2Disagree
3Neutral
4Agree
5StronglyAgree

FACTORS THAT INFLUENCE PERCEPTIONS 46
12.1 would be willing to introduce a person with intellectually disability to friends and neighbors in my home town.
13. Campground and amusement park owners have the right to refuse to serve anyone they please, even if it means refusing people with an intellectual disability.
14. The problem of prejudice toward people with an intellectual disability has been exaggerated.
1StronglyDisagree
17. Even with equality of social opportunity, people who are intellectually disabled could not show themselves equal in social situations to people who are not intellectually disabled.
1StronglyDisagree
2Disagree
3Neutral
4Agree
5StronglyAgree
1StronglyDisagree
2Disagree
3Neutral
4Agree
5StronglyAgree
1StronglyDisagree
2Disagree
3Neutral
4Agree
5StronglyAgree
1StronglyDisagree
2Disagree
3Neutral
4Agree
5StronglyAgree
15. Assigning high school students who are intellectually disabled and who are not intellectually disabled to the same classes is more trouble than it is worth.
1StronglyDisagree
2Disagree
3Neutral
4Agree
5StronglyAgree
16. I would be willing to go to a competent hairdresser who is intellectually disabled.
2Disagree
3Neutral
4Agree
5StronglyAgree
FACTORS THAT INFLUENCE PERCEPTIONS 47
Appendix FDebriefing
The purpose of the research is to determine whether people positively or negatively perceive visible indications of an intellectual disability. Individuals who have an intellectual disability, specifically Down syndrome, have gained a longer life expectancy in the last several decades (http://www.ndss.org). This suggests that these individuals are more integrated into society. Research conducted on the topic of perception of Down syndrome has mainly involved individuals that are closely related to or involved in the individual’s life that has Down syndrome (Lalvani, 2008; Starr, Foy, Cramer, & Singh, 2006). The focus of this study is to determine how people perceive physical characteristics related to Down syndrome, in addition to an age component.
My experiment is designed to measure how individual’s perceive different age groups of those who have facial characteristic that show a disability different from those who do not have any physical characteristics categorizing them to an intellectual disability. You are welcome to request an email from me, detailing the result of my study. If you have developed distress as a result of participating in my study you have the option to go to the Counseling Center, which is located on the first floor of Hundley Hall on Lynchburg College campus. If you need to contact the counseling center via phone, the number is (434) 544-8616. The hours are Monday-Friday, 8:30am-12pm, 1pm-5pm.

FACTORS THAT INFLUENCE PERCEPTIONS 48
Table 1Descriptive Statistics for All InteractionsInteraction N Occupational
AbilityCognitive/Behavioral
CompetenceDistance/Discomfort
Adult with 25 M: 27.28 M: 39.36 M: 53.72DS S D : 4 .2 8 S D : 5 .23 S D : 5 .4 5
Adult 30 M: 28.7 M: 41.77 M: 48.17without DS S D : 3 .9 9 S D : 5 .2 8 S D : 5 .9 7
Child with 30 M: 24.2 M: 39.03 M: 51.83DS S D : 2 .6 7 S D : 4 .2 3 S D : 5 .61
Child 21 M: 26.71 M: 40.1 M: 47.95without DS S D : 2 .9 7 S D : 4 .8 3 S D : 4 .9 7
Table 1. Descriptive Statistics

FACTORS THAT INFLUENCE PERCEPTIONS 49
Figure 1
Figure 1. Age and Occupational Ability. This figure illustrates discrepancies in ratings on adults
and children’s occupational ability.
Occupational Ability
Adult Child
2 8 .5
2 8
2 7 .5
2 7
2 6 .5
2 6
2 5 .5
2 5
2 4 .5
2 4
2 3 .5
Mea
n

FACTORS THAT INFLUENCE PERCEPTIONS 50
Figure 2
Figure 2. DS and Occupational Ability. This figure shows the differences between how
participants rated occupational ability of individuals with Down syndrome (DS) and without DS.
DS No DS
Occupational Ability
2 8 .5
2 8
2 7 .5
2 7
2 6 .5
2 6
2 5 .5
2 5
2 4 .5
2 4
Mea
n

FACTORS THAT INFLUENCE PERCEPTIONS 51
Figure 3. DS and Distance/Discomfort. This figures displays inconsistencies between participants discomfort levels and their desired distance around those with Down syndrome (DS) and those without DS.
DS No DS
Figure 35 4
5 3
5 2
5 1
5 0
4 9
4 8
4 7
4 6
4 5
Mea
n