
Factors leading to employee resignation within a ...
83
Factors leading to employee resignation within a professional service organisation A Lutchman orcid.org 0000-0001-6538-5878 Mini-dissertation submitted in partial fulfilment of the requirements for the degree Master of Business Administration at the North-West University Supervisor: Prof CJ Botha Graduation Date: May 2019 Student number: 29733529
Transcript of Factors leading to employee resignation within a ...

Factors leading to employee resignation
within a professional service organisation
A Lutchman
orcid.org 0000-0001-6538-5878
Mini-dissertation submitted in partial fulfilment of the
requirements for the degree Master of Business Administration
at the North-West University
Supervisor: Prof CJ Botha
Graduation Date: May 2019
Student number: 29733529

ii
ABSTRACT
Organisations across the world are finding it difficult to cope with the loss of talent, more
especially within professional services organisations. Given the high stature of individuals
employed in professional services organisations, employee resignations (or employee
turnover) as of recent has become a more burning issue, making it extremely difficult to
predict and even harder to circumvent. The impact of employee resignations is a costly
exercise to any organisation, as the loss of intellectual knowledge as well as the financial costs
are extremely high.
This research study therefore set out to firstly analyse the literature to gain a thorough
understanding of the various factors that contribute to an employee’s decision to resign, or
intention to resign from an organisation. Various literature and hypothesis needed to
adequately analyse to formulate a tailored quantitative research questionnaire which could
be utilized to obtain critical data regarding factors leading to employee resignations within
the evaluated professional services organisation. The formulated quantitative research
questionnaire resulted in eight significant constructs that were developed regarding factors
that influence an employee’s intention to resign from a professional services organisation.
An empirical study was thereafter conducted to explain the research methodology as well as
to statistically analyse the data obtained from respondents within the professional services
organisation and the results highlighted the key construct’s influencing the perception for
employee resignations. Further analysis was thereafter computed to determine the
significant correlations and effect sizes experienced within the various demographic
population regarding the identified constructs.
Conclusions based on these statistical results are then discussed and possible
recommendations mentioned by the author in the final chapter of this research study.
Keywords: Employee resignation, organisational leadership, diversity and transformation,
individual determinants, structural determinants, organisational factors, resignation
intention, direct supervisor.

iii
ACKNOWLEDGEMENTS
First and foremost, thank you Lord for giving me the strength and perseverance to complete not only
this mini-dissertation but the entire MBA module.
My sincerest appreciation goes out to:
• To my Wife (Mrs Kareshma Lutchman) – for your unconditional love, support, motivation and
understanding during this demanding period in our lives.
• To my immediate Family and Friends – for all the love, support, and motivation offered.
• To the North-West University (NWU) – for affording me the opportunity to diversify my thinking.
• To my Employer – for affording me the opportunity to pursue this NWU MBA module.
• To my Colleagues – for taking the time to complete the research questionnaire to conduct this
research.
• To my Supervisor – Prof. Christoff Botha – for all the guidance offered.
• To the NWU Statistical Analysis Team – Wilma Breytenbach and Marelize Pretorius for their
assistance and contribution regarding the statistical analysis portion of this research study.
• To all my NWU colleagues, for making this journey a memorable one.

iv
Table of Contents ABSTRACT ................................................................................................................................. ii
ACKNOWLEDGEMENTS ............................................................................................................. iii
LIST OF TABLES ........................................................................................................................ viii
LIST OF FIGURES ........................................................................................................................ ix
CHAPTER 1: NATURE AND SCOPE OF THE STUDY ...................................................................... 1
1.1 INTRODUCTION ....................................................................................................... 1
1.2 BACKGROUND TO THE EVALUATED ORGANISATION ............................................. 2
1.3 PROBLEM STATEMENT ............................................................................................ 2
1.4 RESEARCH OBJECTIVES............................................................................................ 3
1.4.1 Primary research objective ..................................................................................... 3
1.4.2 Secondary research objective ................................................................................. 3
1.5 SCOPE OF THE STUDY .............................................................................................. 3
1.6 RESEARCH METHODOLOGY .................................................................................... 4
1.6.1 Literature study ....................................................................................................... 4
1.6.2 Empirical study ........................................................................................................ 4
1.7 LIMITATIONS OF THE RESEARCH STUDY ................................................................. 4
1.8 LAYOUT OF THE RESEARCH STUDY ......................................................................... 5
CHAPTER 2: LITERATURE STUDY ................................................................................................ 6
2.1 INTRODUCTION ....................................................................................................... 6
2.2 SIGNIFICANCE OF STUDY ......................................................................................... 6
2.3 IMPACT OF EMPLOYEE RESIGNATIONS................................................................... 8
2.4 FACTORS CONTRIBUTING TO EMPLOYEE RESIGNATIONS ...................................... 9
2.4.1 Organisational work climate ................................................................................... 9
2.4.2 Categorisation of employees with respect to age .................................................. 9
2.4.3 Factors pertaining to generation y employees ..................................................... 10
2.4.4 Factors contributing to employee resignations within high performance driven
organisations ......................................................................................................... 11
2.4.5 Factors pertaining to responsible human resources (HR) practices in the
engineering sector ................................................................................................ 11

v
1. Leadership ............................................................................................................. 12
2. Management style ................................................................................................. 12
3. Communication ..................................................................................................... 13
4. Values and culture ................................................................................................. 13
5. Innovation .............................................................................................................. 13
6. Job satisfaction ...................................................................................................... 13
7. Human resources (HR) policies and procedures ................................................... 14
8. Performance management .................................................................................... 14
9. Recognition ............................................................................................................ 14
10. Rewards and remuneration .................................................................................. 14
11. Training and development .................................................................................... 15
12. Diversity and transformation ................................................................................ 15
13. Change management ............................................................................................ 15
2.4.6 Corporate Social Responsibility (CSR) for organisations ....................................... 15
2.4.6 Parental leave for employees ............................................................................... 16
2.4.8 Organisational concerns for exiting Baby Boomer employees ............................. 16
2.4.9 Top 10 reasons good employees quit ................................................................... 18
2.4.10 Individual determinants ........................................................................................ 18
2.4.10.1 General training .................................................................................................... 19
2.4.10.2 Job motivation ...................................................................................................... 19
2.4.10.3 Met expectation .................................................................................................... 19
2.4.10.4 Positive affectivity ................................................................................................. 19
2.4.11 Structural determinants ........................................................................................ 19
2.4.11.1 Social support ........................................................................................................ 20
2.4.11.2 Routineness ........................................................................................................... 20
2.4.11.3 Promotional chances ............................................................................................ 20
2.4.11.4 Professional growth .............................................................................................. 20
2.4.11.5 Pay .................................................................................................................... 20
2.4.11.6 Job stress ............................................................................................................... 21
2.4.11.7 Distributive justice ................................................................................................ 21
2.4.11.8 Autonomy .............................................................................................................. 21
2.4.12 Information injustice with regard to high performing individuals ....................... 21

vi
2.4.13 Diversity and transformation ................................................................................ 22
2.5 CONCLUSION ......................................................................................................... 22
CHAPTER 3: EMPIRICAL STUDY ................................................................................................ 24
3.1 INTRODUCTION ..................................................................................................... 24
3.2 SAMPLE GROUP AND SIZE ..................................................................................... 25
3.2.1 The target population profile ................................................................................ 25
3.2.2 The study population profile ................................................................................. 27
3.3 SURVEY INSTRUMENT ........................................................................................... 29
3.4 EXPLORATORY SURVEY TESTING ........................................................................... 31
3.5 DATA COLLECTION ................................................................................................ 32
3.6 DATA ANALYSIS ..................................................................................................... 38
3.6.1 Coding of the questionnaire ................................................................................. 38
3.6.2 Reliability and validity ........................................................................................... 38
3.6.2.1 Construct validity .................................................................................................. 39
3.6.2.1.1 Kaiser’s measure of sample adequacy .................................................................. 39
3.6.2.1.2 Factor variation ..................................................................................................... 40
3.6.1.2.3 Variation of communalities ................................................................................... 40
3.6.1.2.4 Factor analysis ....................................................................................................... 41
3.6.1.3 Reliability of construct’s ........................................................................................ 41
3.6.1.3.1 The Cronbach alpha coefficient ............................................................................ 41
3.6.1.4 Conclusion in regard to validity and reliability ..................................................... 42
3.6.2 Mean and standard deviation of construct assessment ....................................... 43
3.6.3 Pearson’s correlation (r) ....................................................................................... 44
3.6.4 Cohen’s effect sizes (d) ......................................................................................... 45
3.7 CONCLUSION ......................................................................................................... 49
CHAPTER 4: CONCLUSIONS AND RECOMMENDATIONS .......................................................... 51
4.1 INTRODUCTION ..................................................................................................... 51
4.1 CONCLUSIONS ....................................................................................................... 51
4.1.1 Factors that contribute to employee resignations based on employee
perceptions ........................................................................................................... 51

vii
4.1.2 Factors with linear correlation to “employee-resignation” when compared to
other constructs .................................................................................................... 53
4.1.3 Factors of practical significance to demographic groups, based on employee
perceptions ........................................................................................................... 53
4.2 RECOMMENDATIONS ............................................................................................ 54
4.2.1 Factors that contribute to employee resignations based on employee
perceptions ........................................................................................................... 54
4.2.2 Factors with linear correlation to employee resignation based on employee
perceptions ........................................................................................................... 55
4.2.3 Factors of practical significance to demographic groups, based on employee
perceptions ........................................................................................................... 56
4.3 EVALUATION OF THE RESEARCH STUDY ............................................................... 57
4.3.1 Primary research objective ................................................................................... 57
4.3.2 Secondary research objective ............................................................................... 57
4.4 LIMITATIONS OF THE RESEARCH STUDY ............................................................... 57
4.5 PROPOSAL FOR FUTURE RESEARCH ...................................................................... 58
4.6 OVERALL CONCLUSION ......................................................................................... 58
REFERENCES ............................................................................................................................. 59
APPENDIX A – INFORMED CONSENT FORM (PARTICIPANT) ................................................... 65
APPENDIX B – QUESTIONNAIRE ............................................................................................... 66
APPENDIX C – CONSTRUCT’S AND ASSOCIATED QUESTIONS .................................................. 70
APPENDIX D – CODING OF QUESTIONNAIRE ........................................................................... 72
APPENDIX E – LANGUAGE EDITOR’S CERTIFICATE ................................................................... 74

viii
LIST OF TABLES
Table 1: Construct’s and Associated Questions ...................................................................... 31
Table 2: Exploratory Survey Distribution ................................................................................. 31
Table 3: Demographic Profile D1 – Age ................................................................................... 35
Table 4: Demographic Profile D2 – Gender ............................................................................. 36
Table 5: Demographic Profile D3 - Academic Qualification ..................................................... 36
Table 6: Demographic Profile D4 - Marital Status ................................................................... 36
Table 7: Demographic Profile D5 – Children ............................................................................ 36
Table 8: Demographic Profile D6 - Role Category ................................................................... 37
Table 9: Demographic Profile D7 - Number of Years with the Organisation........................... 37
Table 10: Demographic Profile D8 - Merit Rating .................................................................... 37
Table 11: MSA defined values .................................................................................................. 40
Table 12: Factor Analysis Results ............................................................................................. 41
Table 13: Cronbach’s Alpha Reliability Coefficient .................................................................. 42
Table 14: Construct Mean Values and Standard Deviation ..................................................... 43
Table 15: Pearson’s Correlation Coefficients (r) in term of “Resignation Intention” .............. 44
Table 16: Effect Sizes based on Age ......................................................................................... 46
Table 17: Effect Sizes based on Merit Rating ........................................................................... 47
Table 18: Effect Sizes based on the Number of Years within the Organisation ...................... 48
Table 19: Effect Sizes based on Qualification .......................................................................... 49

ix
LIST OF FIGURES
Figure 1: Overall Representation of the Research Design Process .......................................... 24
Figure 2: Target Population in respect to Gender ................................................................... 26
Figure 3: Target Population in respect to Age ......................................................................... 26
Figure 4: Target Population in respect to Role Category ......................................................... 27
Figure 5: Study Population in respect to Gender .................................................................... 28
Figure 6: Study Population in respect to Age .......................................................................... 28
Figure 7: Study Population in respect to Role Category .......................................................... 28
Figure 8: Gender comparison between the Target and Study Population .............................. 33
Figure 9: Age comparison between the Target and Study Population .................................... 34
Figure 10: Role Category comparison between the Target and Study Population ................. 35

1
CHAPTER 1: NATURE AND SCOPE OF THE STUDY
1.1 INTRODUCTION
Organisations across the world are finding it difficult to cope with the loss of talent, more
especially within professional services organisations over recent years. Previously, the value
of a company was typically measured according to the numbers achieved on their balance
sheet. However, in recent times and more especially within the professional services industry
there is a substantial emphasis placed on the importance of human capital (MacLean, 2013).
Given the high stature of individuals employed in professional services organisations,
employee resignations (or employee turnover) as of recent has become a burning issue,
making it extremely difficult to predict and therefore circumvent. The impact of employee
resignations is a costly exercise to any organisation, as the intellectual knowledge and
financial costs lost regarding direct as well as indirect costs are extremely high (Hacker, 2003;
MacLean, 2013). It is therefore imperative to gain an understanding of how employees decide
whether to quit or stay at their jobs and what factors predict who will leave and who will stay,
in an attempt to try and circumvent the issue (Klotz & Bolino, 2016).
This study intends to analyse the literature therefore to understand the various factors that
contribute to an employee’s decision to resign, or intention to resign from an organisation,
so that these outcomes can be tested within the professional services organisation being
researched. Due to the specialised and unique nature of the professional services
organisation under evaluation, previous hypothesis cannot be directly correlated, instead the
various literature examined in this study will be tailored to suit the said professional services
organisation with input from Senior Human Resources Managers (SHRM) as well as Senior
Managers (SM) within the organisation. A quantitative survey instrument will after that be
formulated, using questionnaires, and implemented specifically within the organisation to
gather pertinent feedback based on the primary and secondary research objectives of this
research study.

2
1.2 BACKGROUND TO THE EVALUATED ORGANISATION
The organisation being evaluated is a professional services organisation comprising three
operating hubs:
• Capital Projects (CP),
• Engineering and Project Services (E&PS), and
• Research and Technology (R&T).
These operating hubs support the Company in their overall strategic purpose of being a
leading integrated global chemical and energy company, proud of their South African
heritage, delivering superior value to their stakeholders.
The organisation currently employs a total of 1385 personnel, with 411 employees belonging
to the CP domain, 484 employees to the E&PS domain and the remaining 490 employees
belong to the R&T domain. The workforce comprises of a mixture of permanent full day
employees, permanent half day employees, non-permanent employees (NPE’s) and
expatriates which fit into one of eight assigned role categories, starting from “operations”
and ending at “group leadership”. All personnel currently employed within the organisation
are within the 20-65-year-old age bracket. 469 employees within the organisation are female,
and the remaining 916 employees are male as of 31 July 20181.
1.3 PROBLEM STATEMENT
The problem under investigation in this study is the current resignation rate experienced
within the organisation. The latest Human Resources (HR)1 statistics for financial year
2017/2018 reveals that there is an annual employee resignation rate of 6.9 percent within
the organisation. A survey conducted by “Direct Hire recruitment” in South Africa in 2016 for
the 5th consecutive year discovered that there is an average staff turnover rate in South Africa
between 5-10 percent (Direct, 2016). Thereby, indicating that the organisation is operating
within the average band in regard to employee resignations, and in an attempt to become a
1 Source is not referenced in order to protect the anonymity of the organization.

3
more recognised professional services organisation, the average is by no means acceptable,
therefore highlighting the current problem which requires attention.
1.4 RESEARCH OBJECTIVES
1.4.1 Primary research objective
Considering the problem statement stated in section 1.3, the main research objective for this
study is to determine the factors that contribute to employee resignations within a
professional services organisation to answer the following question:
• What factors (or construct’s) relating to employee resignations are the most
significant within the said professional services organisation.
1.4.2 Secondary research objective
The secondary objective of this study is to:
• Establish which demographics (e.g. age, gender, qualification) were most influenced
regarding factors that pertain to employee resignations within the said professional
services organisation.
1.5 SCOPE OF THE STUDY
This research study will focus on factors leading to employee resignation within a professional
services organisation and will consist of the following:
• Conducting a literature review to explore, identify, discuss and integrate theoretical
perspectives regarding an employee’s intention to resign (or resignation theory).
• Formulate a tailored questionnaire based on the theoretical findings which will be
distributed within the professional services organisation being evaluated.
• Conducting empirical research implementing a quantitative approach.
• Statistical analysis of empirical data to provide insight based on the research objectives
stated in section 1.4.
• Provide possible recommendations with respect to the findings.

4
1.6 RESEARCH METHODOLOGY
The following research methodology will be implemented for this research study:
1.6.1 Literature study
The literature study will focus on the following aspects:
• The significance of employee resignations.
• The impact of employee resignations.
• The organisational work climate.
• High performing organisations.
• Responsible Human Resources (HR) practices.
• Corporate social responsibility and informational injustice of organisational leaders.
• Individual determinants.
• Structural determinants.
• Diversity and transformation.
1.6.2 Empirical study
An empirical study will be implemented for this research utilising a quantitative approach.
Firstly, a questionnaire will be developed based on the literature study completed in chapter
2 regarding the factors that lead to employee resignations. Secondly, the statistical analysis
of the data will after that be carried out to interpret the results.
1.7 LIMITATIONS OF THE RESEARCH STUDY
The study will address the factors that contribute to employee resignations within the
organisation only and not consider other business units as part of the Company. That implies
that only employees who fall into the CP, E&PS and R&T operating hubs, which are either
permanent – full day employees, permanent – half day employees, expatriates, and non–
permanent employees (NPE) which form part of the graduate development program (GDP),
will be included in the study. Only employees who are employed within the borders of South
Africa, were considered for this study. They represent the majority (98 percent) of the

5
employed personnel. The survey instrument utilised in the study will be a quantitative
questionnaire, which will be anonymous, and cross-sectional by design.
1.8 LAYOUT OF THE RESEARCH STUDY
Chapter 1: Nature and scope of the research study
This chapter explains the relevance of the proposed study regarding the problem statement,
as well as gives a brief description of the organisation being evaluated. The research
objectives, methodology, and limitations are stated.
Chapter 2: Literature Study
This chapter highlights the various literature reviewed regarding factors leading to employee
resignations. It also discusses the significance and impact of employee resignations.
Chapter 3: Empirical Study
In this chapter, the research methodology is discussed, and the obtained data based on the
quantitative survey instrument is analysed and discussed.
Chapter 4: Conclusions and Recommendations
Based on the empirical study conducted in chapter 3, conclusions are drawn and
recommendations are put forth.
6
CHAPTER 2: LITERATURE STUDY
2.1 INTRODUCTION
There are vast and diverse scientific hypothesis regarding factors pertaining to employee
resignations stemming from decades of research (Agho et al., 1993; Zeffane, 1994; Hacker,
2003; Wooldridge, 2006; Charney, 2008; Giles, 2010; Shah et al., 2012; MacLean, 2013; Miles
et al., 2014; Patient et al., 2015; Lam et al., 2016; Park & Kim, 2017; Koh, 2018), can the
phenomenon of employee resignations really be curbed? The reality of the situation which
organisations find themselves in is an ever-evolving paradigm, where to reduce the rate of
employee resignations, organisations are expected to find a means of satisfying employees
various needs, remaining current, and understanding the underlying circumstantial evidence
resulting in the decision for an employee to resign. This study intends to assess previous and
current literature resonating with the topic of employee resignations together with the
targeted insight of senior HR managers within the said professional services organisation,
collaborating the various hypothesis in a tailored manner to effectively arrive at the factors
which could lead to employee resignations within the said professional services organisation.
2.2 SIGNIFICANCE OF STUDY
According to Gupta et al. (2017) employee resignations is a non-linear, unstructured,
complex, and dynamic phenomena in which organisations sacrifice huge amounts of time,
money, and effort to retain high performing individuals to ensure the success of their
business, however, up and till today researchers have not been able to completely decode
the process of employee resignations accurately.
A study conducted by Bhardwaj and Singh (2016) confirmed the following in respect to
attrition rates within an organisation; attrition implies the minimisation or diminishing size or
strength of an organisation with respect to their human capital, by any means other than
directly dismissing an employee. This is a significant aspect in any organisation as the impact
of voluntary turnover or resignation has a huge impact on organisations, given that
employees form the backbone of professional services organisations. In the current regime,

7
organisations that are successful in retaining employees survive sustainably, whereas
organisations that do not, tend to find themselves battling to exist (Bhardwaj & Singh, 2016).
The most important aspect of any professional services organisation is the people (human
capital), and this is a sentiment shared by organisational leadership within the said
professional services organisation. MacLean (2013) concurred to this statement in an article
“Reducing Employee Turnover in the Big Four Public Accounting Firms” (viz, Deloitte and
Touche, Ernest & Young, KPMG, & PricewaterhouseCoopers), where it was stated that “the
value of a company is oftentimes measured according to the numbers on the balance sheet;
a company has a certain number of assets and a certain number of liabilities. However, in the
service industry, there is a substantial emphasis on the importance of human capital. The
business slogan is stating that people are our most important assets’ is becoming a bigger
focus for recruiting purposes and in the organisational structure of businesses. As new
generations of professionals enter the workforce, there seems to be a shift from monetary
motivation to an emphasis on the importance of work-life balance. This work-life balance
takes into consideration the existence of employee benefits, time-off, and the ability to
pursue extraneous interests and hobbies while maintaining a strong relationship with the
firm. The primary concern for any business is determining a way to motivate employees to
establish a future with the firm and therefore reduce employee turnover”.
A study conducted by Wooldridge (2006) stated that “talent has become the world’s most
sought-after commodity”. The statistics at the time in a survey conducted among senior
international HR managers concluded that 75 percent believed that “attracting and retaining”
talent was the number one objective. A similar testament was echoed by Lwazi et al. (2014)
in the 2014 stakeholder report conducted for Deloitte and Touche, where it was stated that
“we understand that our people are everything. Over the past two years, Deloitte Africa has
cemented closer connections with our global office to develop commonly shared metrics. Our
objective is to understand better how our Talent & Transformation can measure progress and
continue building on our commitment to attract, recruit, develop and ultimately retain the
best talent to service clients across Africa”.
The message being portrayed is clear. The most valuable asset in any organisation is its
people. Organisational leadership for the said professional services organisation embraces a

8
similar sentiment in understanding that the human capital make-up of the organisation is key
to their success. However the problem experienced is how to motivate and retain employees,
given the high quality and stature of personnel employed.
It is therefore imperative to gain an understanding of how employees decide whether to quit
or stay at their jobs and what factors predict who will leave and who will stay, in an attempt
to try and circumvent the issue (Klotz & Bolino, 2016). Employees resign for various reasons,
which is understandable and sometimes unavoidable, and the retention of talent is an ever-
evolving paradigm based on the situation organisations find themselves in.
The study of employee resignations has changed slightly over the years, becoming more
structured and defined as time progresses based on the latest research. Later research
introduces not only factors about employee resignations, but also categories such as
structural and individual determinants to which respective factors are form part of.
This study intends to, therefore, analyse the literature to understand the various factors that
contribute to an employee’s decision to resign or intend to resign from an organisation.
2.3 IMPACT OF EMPLOYEE RESIGNATIONS
According to Vignesh et al. (2018), the impact of a well-trained and well-adapted employee
leaving an organisation due to resignation creates a space in the organisation making it
extremely difficult for Human Resources (HR) personnel to try and fill the void created.
According to Hacker (2003), “Direct costs of turnover include recruitment, selection,
induction and training of replacement staff, loss of valuable skills and experience, disruption
of work, and customer relations. But there are indirect costs also, some hidden, which can
include loss of tacit knowledge or intellectual property to competitors”. MacLean (2013)
confirms that employee turnover is extremely costly to any business regarding training costs
and loss of pertinent knowledge and experience.
According to Charney (2008), the US Department of Labour and Statistics stated that the cost
of an employee resigning equates to approximately 33 percent of the employees total
compensation, including both salary and benefits. He goes further to state that the impacts
are not only financial; it also affects employee morale and bad morale has a domino effect

9
which negatively impacts productivity within the organisation confirming that no organisation
wants to incur the cost of an employee’s resigning, be it for financial or non-financial reasons.
2.4 FACTORS CONTRIBUTING TO EMPLOYEE RESIGNATIONS
2.4.1 Organisational work climate
Shanker (2014) stated that organisational work climate is said to be one of the most important
factors contributing to an employee’s decision to quit or stay with an organisation. In today’s
competitive business world, every employer wants to have meticulous, hardworking, loyal
and committed employees who remain in their organisation for extended periods and it is,
therefore, critical to understand what influences employees in choosing whether to stay or
leave an organisation. Shanker (2014) further explained that the organisational climate is said
to be an employee’s perception of the work environment which can motivate the willingness
of employees to stay within the organisation.
Giles (2010) added that some of the dimensions to organisational work climate include
organisational structure, responsibility, standards, commitment, support, reward, warmth,
risk, and conflict. It was also found that organisational work climate was correlated with
organisational effectiveness, performance, commitment, productivity, anxiety, and the
tendency to leave (Rahimic, 2013).
2.4.2 Categorisation of employees with respect to age
Deloitte and Touche (2012) defined this aspect clearly when they explained that employee
resignations are not as clear-cut as previously perceived and the rationale throughout the
organisation is different, i.e. there is a direct distinction with respect to the age of employees
and their intention to quit which are based on the following categories; “Millennial’s (or
Generation Y employees of ages 31 and younger), Generation X (ages between 32 and 47)
and the Baby Boomers (ages 48 to 65)”, this is a crucial measure to take note off,
fundamentally because employees of different ages have different opinions, goals, and
perceptions which needs to be firstly understood in order to be effectively managed.

10
2.4.3 Factors pertaining to generation y employees
A study conducted by Aruna and Anitha (2015) stated that organisations face a daunting
challenge in the retention of Generation Y employees. Their sense of get-now attitude,
immediate gratification culture, and continuous technological connections have all facilitated
the Generation Y to adhere to skyrocketing expectations from their employer. The study
identified the following factors has been crucial to the retention of Generation Y employees:
• Job satisfaction,
• Mentoring,
• Career development,
• Inclusive style of management, and
• Work environment and nature of working style.
A study conducted by Koh (2018) found that the following factors also had a significant impact
on the retention of Generation Y employees:
• Compensation,
• Leadership,
• Training and Development,
• Working Environment,
• Work-Life Balance, and
• Job Satisfaction.
Furthermore, it was found, if generation Y employees feel they have mastered their job, they
quickly move on to other companies (Weyland, 2011), making the situation difficult to predict
or manage, however a study conducted by Osman et al. (2017) revealed that job satisfaction
did affect work loyalty or organisational commitment amongst Generation Y employees, by
75 percent.
Osman et al. (2017) also concluded that compensation significantly impacts Generation Y
employee’s job satisfaction by 64 percent, whereas items such as performance appraisals
have a lower significance to Generation Y employee’s job satisfaction, at 37 percent.

11
2.4.4 Factors contributing to employee resignations within high performance driven
organisations
Deloitte and Touche (2012) revealed the following issues with high performance driven
organisations, i.e. the main reasons employees resigned or planned to resign was due to
factors such as:
• Lack of career progress,
• Dissatisfaction with senior management (leadership) or direct supervisors, and
• Lack of meaningful work,
• Lack of challenge in the current job,
• The prospect of new opportunities on the horizon,
• Improper utilisation of skills and abilities.
These are extremely pertinent factors for the current study as the organisation being
evaluated is a professional services organisation.
2.4.5 Factors pertaining to responsible human resources (HR) practices in the engineering
sector
Coetzee et al (2014) published an article confirming that the knowledge of HR practices will
potentially influence the attraction and retention of engineering staff. A significant amount
of the staff compliment within the said professional services organisation comprises of
engineers across various disciplines. The findings underscore the importance of assessing
employees’ perceptions of HR practices relating to job satisfaction, leadership, training and
development, rewards and remuneration, and HR policies and procedures as these have been
shown to predict higher levels of organisational commitment significantly. The practical
implications for managers and HR practitioners are to take a proactive approach in facilitating
an organisational culture that reflects the 13 core HR practices that are essential to a high-
performing culture, which as confirmed by (Deloitte & Touche, 2009) are:

12
1. Leadership
Leadership is the ability to positively reinforce vigour and direction with clarity, openness and
honesty. Effective leaders must be able to motivate and inspire employees. Detert and
Treviño (2010) stated that leaders who act fairly and treat people ethically and with integrity,
positively influence an employee’s willingness to remain in that organisation. A study
conducted by Lam et al. (2016) proved that ethical leaders have the ability to significantly
influence employees through a motivational state of cognitive engagement. This type of
motivational influence is the result employees tend to be readily available to voice their
opinions regarding organisational issues and less likely to resign from an organisation under
the guidance of ethical leaders. An engaging leadership style is believed to create an
environment where people respect each other, care for the development and wellbeing of
each other and value each other’s contributions according to Alimo-Metcalfe et al. (2008). As
such, the leader is transparent, ethical, and open to the employee contributions. These
leaders believe that their employees are capable of achieving high performance according to
Park & Kim (2017). Miles et al. (2014) identified the following critical behaviours as good
leadership qualities; innovativeness, visionary, guiding, mentoring, objective, pragmatic,
respectful, caring, technically competent, and accountable. These studies therefore confirm
that employees are directly influenced by organisational leadership and their intention to quit
from an organisation.
2. Management style
Management style relates to the ability of the manager or supervisor, as perceived by the
employee, to provide the necessary support to empower employees to carry out their jobs
efficiently. It relates to the accessibility of the manager as well as whether the manager sets
realistic objectives and recognises or acknowledges good work; management style influences
employee commitment which has an effect on the organisation’s objectives (Zeffane, 1994).
An article published by McWilliams (2011) also alluded to the fact that accumulated
dissatisfaction and eventually voluntary resignations of employees in an engineering
company in Australia were due to the fact that specific managers had no real understanding
of the business and words such as “controlling”, “micromanaging”, “unethical”, and “self-
serving” were used to describe those specific individuals.

13
3. Communication
Communication entails the quality and frequency of internal communications within the
organisation, either as an integrated organisation or between the different business units.
Employees expect timeous feedback regarding decisions, especially about decisions that
impact employees directly. A study conducted by (Ghina, 2012) stated that the more
frequently employees are involved in the decision-making process, the more likely and
susceptible their feelings of loyalty become. During times of organisational
change/restructuring according to Patient et al. (2015), the aspect of communication
becomes more significant to employees within the organisation and an important predictor
of employee reactions is based on the perceived quality, timing and sincerity of the message
delivered by organisational leadership regarding the organisational changes.
4. Values and culture
Values and culture refer to an employee’s perception regarding an organisation’s climate and
value system. Employees seek a sense of trust, openness and transparency within the
organisation and expect that personal beliefs be respected. South Africa, for example, has a
rich cultural heritage and organisations that favour this is well sought out by employees.
Values and beliefs explain an organisational climate in respect to aspects which are not visible
but exist within an employee’s behaviour and actions (Moghimi & Subramaniam, 2013).
5. Innovation
Innovation is the ability or inability to continually develop new ideas, products, services or
systems to facilitate growth in any area of business. Pande et al. (2013) confirmed that
positive innovation practices in organisations are likely to retain employees as well as give
organisations a competitive advantage.
6. Job satisfaction
Job satisfaction is the ability to fully utilise skills to complete the task set out effectively. It
entails having clear work objectives and access to the necessary tools and resources to
facilitate this. Shah et al. (2012) stated that employees who have clear work objectives and

14
are armed with the correct tools for the job, effectively complete their tasks which in turn
provides a level of satisfaction that results in longer-term commitment to the organisation.
7. Human resources (HR) policies and procedures
HR policies and procedures imply the extent to which policies and procedures are readily
available to all employees, the better the systems are for the management of HR policies and
procedures, the higher the chance of organisational commitment and therefore smaller
chance of employee resignations or turnover.
8. Performance management
Performance management refers to the perceived consistency and fairness of
implementation experienced by employees. Decremer et al. (2012) confirmed that amongst
highly skilled engineering workers, their psychological commitment is higher when the
organisation is perceived to be fair and consistent regarding performance management.
9. Recognition
Recognition according to Zaitouni et al. (2011) has both monetary and non-monetary value.
Monetary compensation although important is not the only cause for retaining employees.
Instead, non-monetary elements (e.g. positive feedback and recognition) is also very
important in retaining employees.
10. Rewards and remuneration
Rewards and remuneration is the extent to which employees perceive their remuneration to
be fair when compared to similar market-related jobs. Fair remuneration is encouraged and
is seen to increase organisational commitment. Aspects such as incentives and bonuses also
form part of this segment. Zaitouni et al. (2011) confirmed that bonuses, promotions, and
increased salary are all factors that contribute to an employee’s long-term commitment to an
organisation.

15
11. Training and development
Training and development refer to the ability of an employee to grow and develop within an
organisation by enhancing skills to better suit the individual either for their current job or a
future role within an organisation. Organisations that promote career growth and
development opportunities are seen to attract and retain employees. An article published by
Frey et al. (2014) stated that the positive outcome of training and development in
professional services organisations results in perceived organisational support enhances
organisational commitment, which ultimately results in attraction and retention of
professional resources. The article published by Frey et al. (2014) further confirmed that
Generation Y employees tend to value the idea of training and development, similar to that
of employees in other aged categories. The results of this study inferred that the results of
investing in training and development not only assists in attracting and retaining professional
individuals but also enhances their abilities, which is considered a win-win situation.
12. Diversity and transformation
Diversity and transformation are the extent to which diversity management within an
organisation is applied. Particular focus is aimed on equity in respect to age, gender and
ethnicity. Jonsen et al. (2013) stated that organisations practising fair and equitable
treatment have a reputation for retaining talented individuals.
13. Change management
Change management refers to the “management” of the “change management” process in
an organisation. Typically underlining how effective and transparent the process is and is
there sufficient communication, support and involvement from organisational leadership to
support the process. Visagie and Steyn (2011) are of the view that committed employees tend
to go the extra mile when the concept of change management is perceived to be delivered
effectively by organisational leadership.
2.4.6 Corporate Social Responsibility (CSR) for organisations
A challenge faced by most modern-day organisations is the aspect of corporate social
responsibility and the ethical obligation and considerations required to achieve this. A study

16
conducted by Bierema and d'Abundo (2004) revealed that simply concentrating on
productivity and performance-based human resources development (HRD), will not prove
fruitful for organisations in the long run, rather it will diminish the ‘human resources’ in the
process and increase other associated costs such as turnover, stress, and employees quitting
the work for competition. A paradigm shift is therefore required to mitigate organisations’
current thinking in respect to continuous economic and organizational growth attributes and
instead encourage them towards adopting responsible and sustainable HR practices within a
blend of three interconnected areas, i.e. sustainability, corporate social responsibility (CSR),
and business ethics (Ardichvili, 2012). This in the long run will better serve to retain employees
that hold this requirement in high regard in respect to their decisions in resigning or planning
to resign from an organisation. Generation Y employees in the engineering sector tend to hold
this requirement in higher regard as compared to employees of different ages, when deciding
whether to remain or quit an organisation.
2.4.6 Parental leave for employees
An article published by DeCarlo (2018) found that promoting a healthy work-life balance helps
in recruiting and retaining employees within the engineering and architectural sector.
Organisations should look at supporting new parents and employees who face family
hardship by offering forward-looking leave policies. A California study found that more than
95 percent of people that took leave returned happily after, reinforcing the fact that paid
leave for parents (male and female) promotes retention without adversely affecting an
organisation’s bottom line.
According to Borgh et al. (2018), parents who experience negative or neutral attitudes
towards parental leave and parenthood amongst managers and colleagues are less likely to
obtain a high occupational balance, as compared to parents that display highly positive
attitudes towards these factors. High occupational balance also implied that clear handover
structures were in place during parental leave periods.
2.4.8 Organisational concerns for exiting Baby Boomer employees
Even though this is not a specific factor regarding employee resignations, it is still a critical
aspect for organisations to consider. An article published by Bloomberg (2012) stated that 72
17
percent of U.S. employers are concerned regarding the tacit knowledge that baby boomers
will take with them when they retire. Typical actions employers are taking to combat the
problem according to the survey conducted amongst 430 randomly selected human resources
management professionals from the society for human resources management according to
Bloomberg (2012), are as follows:
• Succession planning,
• An increase in training,
• Allowing flexible working arrangements to satisfy older employees,
• Rehiring retired employees on temporary contracts or as consultants, and
• Availing part-time vacancies/posts to accommodate retired employees.
Another interesting fact from the same source revealed that 46 percent of organisations
consider the loss of retiring employee’s skills and knowledge as a concern, whereas 27
percent feel it is not a concern. Subsequent to the study a question directed to the human
resources (HR) professionals was to identify the largest gaps between employee’s aged 50
years and older as compared to employees aged 31 years and less, and the following was
revealed:
• 51 percent of HR managers stated that baby boomers (older employees) have stronger
writing, spelling skills (English), and grammar,
• Similarly (52 percent) stated that older employees exhibit a stronger work ethic, and
• Contrary to popular belief, only 33 percent of respondents regards older employees as
having the upper hand regarding technical abilities such as engineering, computer
literacy, and mechanical knowledge.
The data revealed by Bloomberg (2012) provides insight into addressing aspects such as
knowledge transfer and a loss of critical skills which is a subsequent factor to the present
study.

18
2.4.9 Top 10 reasons good employees quit
According to Charney (2008), a veteran search consultant in the recruitment industry, the
following are considered fundamental reasons for good employees are leaving an
organisation:
• The job was not as expected,
• The mismatch between job and new hire,
• Work/life imbalance,
• Feeling undervalued,
• Too little coaching and feedback,
• Management freezes raises and promotions,
• Management lacks people skills,
• Lack of faith and confidence in organisational leadership,
• Lack of decision-making power, and
• Too few growth opportunities.
Based on the various sources of material analysed, it is becoming evidently clearer to see that
the themes arising from previous research starting to overlap in respect to factors
contributing to an employee’s intention to quit/resign from an organisation.
2.4.10 Individual determinants
Individual determinants are related to the individual per se, and according to a study
conducted by Arekar et al. (2016), individual determinants have a significant impact on
employee turnover within organisations, even though not much research is presented to
combat the problem. Agho et al. (1993) define individual determinants as personality
variables or characteristics that is developed by an individual. Furthermore, it can also be
defined as the intrapersonal and interpersonal nature of employees within an organisation,
considered as aspects determining an employee’s intent to quit or remain with an
organisation. The following have been touched on in respect to individual determinants
according to Arekar et al. (2016):

19
2.4.10.1 General training
General training is regarded as a transfer of knowledge and skills amongst employees.
2.4.10.2 Job motivation
Motivated employees tend to increase the production of the organisation as they themselves
perform better.
2.4.10.3 Met expectation
All individuals or employees begin with some sort of expectation of the organisation.
Expectation will vary from individual to individual, but ultimately the bottom line is, did the
organisation provide what was perceived about the organisation versus what actually
happened.
2.4.10.4 Positive affectivity
Positive affectivity is directly correlated to the feeling of pleasant emotional states.
Employees who are more happy, motivated, and cheerful tend to perform better than their
counterparts.
2.4.11 Structural determinants
Also known as organisational determinants, are factors which are controlled by the
organisation. Gupta et al. (2017) stated that employee turnover based on structural
determinants is the relationship between structural factors of the work environment, also the
pattern of social relations within the work environment. Structural determinants are typically
rooted in internal causes such as the reward system, characteristics of work performed, the
interaction of organisational members, and the promotion system.
According to Gupta et al. (2017:129) the eight determinants of structural determinants
contributing to an employee’s intention to remain or quit an organisation are; social support,
routineness, promotional chances, professional growth, pay, job stress, distributive justice,
and autonomy.

20
2.4.11.1 Social support
Social support is made up of three aspects, support from:
• Supervisors,
• Co-workers, and
• Family.
These three support systems prove to be very important to any employee. When an employee
is deprived of assistance in the workplace on job-related matters, this can then result in the
employee quitting the organisation.
2.4.11.2 Routineness
Jobs which are repetitive in nature become boring for employees with good educational
backgrounds and therefore result in employee’s turnover.
2.4.11.3 Promotional chances
The aspect of promotional chances depends on an employee’s perception of their growth
within that organisation. This is linked to an employee’s vertical mobility regarding
occupational growth.
2.4.11.4 Professional growth
Defined as the chances an employer provides to increase job-related skills and knowledge.
Where or how do employees envisage themselves in a specific period? Are there sufficient
opportunities within the organisation for growth?
2.4.11.5 Pay
The definition of pay is money and/or its equivalent which is exchanged with employees for
a service offered.

21
2.4.11.6 Job stress
Regarded as one of the most critical determinants. The definition of job stress is essentially
the extent to which job requirements cannot be achieved. A key aspect to take cognisance of
is whether the employee has enough knowledge and skills to execute the task put forth by
the organisation, or does the organisation expect more from the individual than their skill set
allows.
2.4.11.7 Distributive justice
Is the perception an individual has towards their organisation? It covers aspects such as
rewards, salary hikes, promotions, and fringe benefits. It is also used as a means of
comparison between employees within an organisation.
2.4.11.8 Autonomy
Also considered one of the more important determinants, significantly influences employee
turnover. Autonomy also plays a role in respect to the employee’s development. Autonomy
has also proven to increase the risk-taking ability of employees.
2.4.12 Information injustice with regard to high performing individuals
As a study conducted by Patient et al. (2015) revealed interesting insight in respect to
employees and the manner in which they perceive the sharing of information by
organisational leadership during times of significant change (i.e. informational justice), more
especially in this regard, in times when organisations are downsizing or retrenching. This is
quite apt, given that the said professional services organisation being evaluated in this study
is currently undergoing a major strategic transition which will result in a significant downsizing
of employees within the organisation. The message shared by Patient et al. (2015) is that
during times of significant change, employees who identify well with their organisation expect
timeous and accurate transfer of information regarding organisational change, and when this
requirement is not met, these individuals lose faith in organisational leadership with respect
to the stewardship of the organisation which therefore results in voluntary turnover of good
employees.

22
2.4.13 Diversity and transformation
South Africa is a country currently 24 years into a constitutional democracy, however, there
are still major gaps in respect to diversity and transformation within the private sector. The
National Development Plan (NDP) is a legislative framework that seeks to achieve an economy
which is inclusive, reduced of inequality of women and alleviates poverty by the year 2030.
However, within the private sector, there are still significant gaps in respect to the
representation of previously disadvantaged groups, more especially in respect to black
African women in management positions (Matotoka & Odeku, 2018). This is a sentiment that
is echoed quite strongly within the population of South Africa, more especially within
professional service organisations and is also a strong determinant of employee resignations,
especially within the younger population of organisational employees.
2.5 CONCLUSION
Based on the literature evaluated, it becomes evident that there is an overlap regarding
factors about employee resignations. This overlap of data approaches to the research carried
out pretentious in that the factors pertaining to employee resignations can be appropriately
clustered into categorised construct’s, forming a basis for the testing of theories. Based on
the evaluated literature, employee resignations can, therefore, be grouped into the following
four constructs:
• Personal expectations – (Individual Determinants),
• Organisational policies/culture – (Structural Determinants),
• Issues regarding direct management (Direct Supervisor), and
• Issues regarding organisational leadership or stewards of the organisation
(Organisational Leadership).
Over and above the overlapping literature resulting in the development of the above four
constructs, the evaluated literature also identified the following three constructs which are
pertinent to the organisation:
• Diversity and transformation,

23
• Decision-making authority, and
• Remuneration.
The last construct which was then proposed by the author was:
• Resignation-intention.
To directly test the question of resignation intention within the organisation. These constructs
will, therefore, form the basis of the design and survey instrument which will be utilised to
gain further input from the target population within the professional services organisation
being researched.

24
CHAPTER 3: EMPIRICAL STUDY
3.1 INTRODUCTION
This chapter details the research process utilised to implement the study: “Factors leading to
employee resignations within a Professional Services Organisation”, as well as discusses the
results obtained. The primary objective of the study was to ascertain the most prominent
factors leading to employee resignations, within the professional services organisation being
evaluated. Secondary objectives include evaluating respondent data to establish unique
similarities or differences amongst the respective demographic groups regarding factors
about employee resignations.
The research topic was formulated due to a current need within the organisation. A literature
review was completed to determine the pertinent factors contributing to employee
resignations. Figure 1 is a representation of the overall research design methodology
implemented in this study.
Figure 1: Overall Representation of the Research Design Process
In determining the factors about employee resignations, literature dating back more than 20
years to current day was evaluated, displaying the amount of research available regarding the
topic being researched. On a positive note, this wide range of evaluated literature benefited
the author to ascertaining the pertinent factors about employee resignations. Based on past
and present data evaluated in the literature review in Chapter 2, a tailored questionnaire was
developed (contained in Appendix B). The questionnaire was based on seven demographic

25
questions (Part 1), and 30 questions about factors resulting in employee resignations (Part 2),
which effectively resulted in a total of 8 segmented constructs’s being formulated. The
questionnaire was then distributed to a targeted population within the organisation and after
that the respondent data, i.e. study population data, was further analysed.
3.2 SAMPLE GROUP AND SIZE
The target population for this research study was intended to acquire a non-random
purposive sample based on the organisational makeup. Even though it is not practically
possible to effectively target and gather responses from all individuals within an organisation,
measures were put in place to obtain an effective subset of the organisational population
which could be targeted to execute the research. The target population, therefore, consisted
of 150 individuals within the organisation, and the effective study population consisted of 66
responses from individuals within the organisation, for which data was analysed.
3.2.1 The target population profile
A non-random purposive sample population was targeted for this study. The target
population are employees within the organisation that the electronic survey was sent too.
This sample was selected to acquire a represented population of individuals within the
organisation in terms of gender, age, and role category. Although no random sampling
methods were applied as no inferential statistics are done, relevant, pertinent strata tried to
be accommodated by the author to constitute an effective study. The target population,
therefore, consisted of 150 employees within the professional services organisation. Figure 2
to 4 below is a representation of the target population with respect to Gender, Age, and Role
Category:

26
Figure 2: Target Population in respect to Gender
Figure 3: Target Population in respect to Age
Male , 113
Female , 37
GENDER Total = 150
31 and Younger , (23)
32 - 47 Years, (90)
48 - 55 Years , (22)
56 - 64 Years ,( 15)
AGE
27
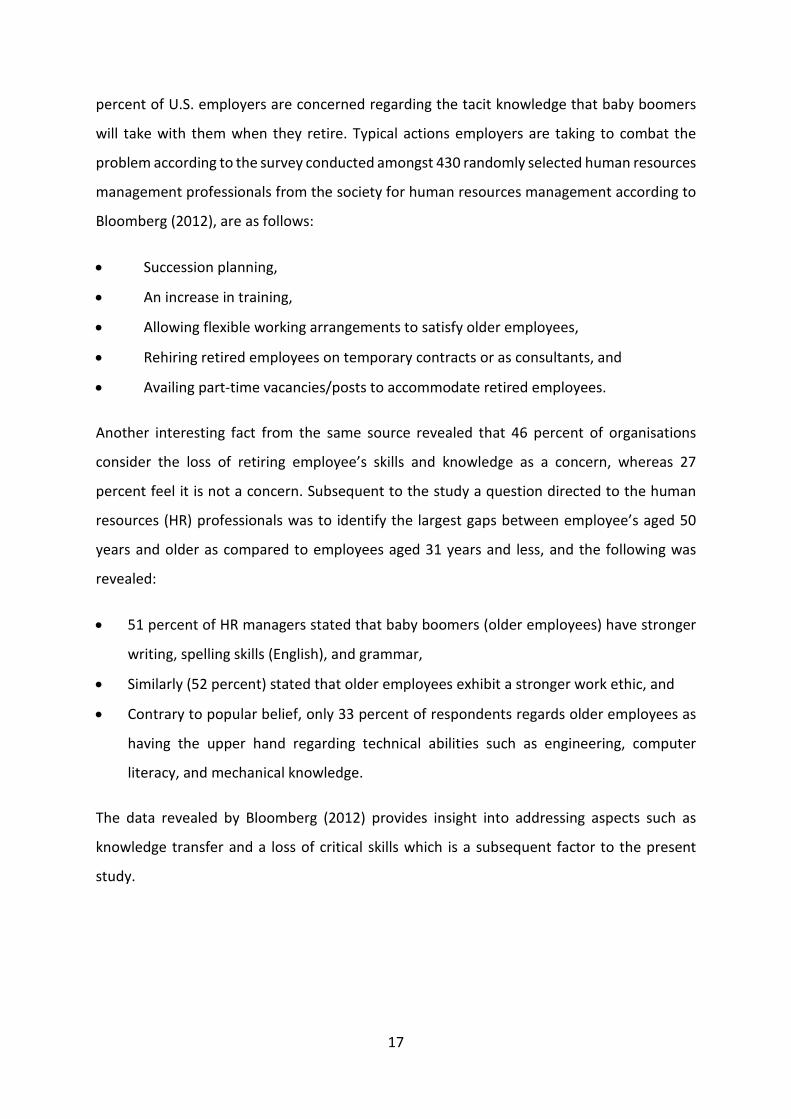
Figure 4: Target Population in respect to Role Category
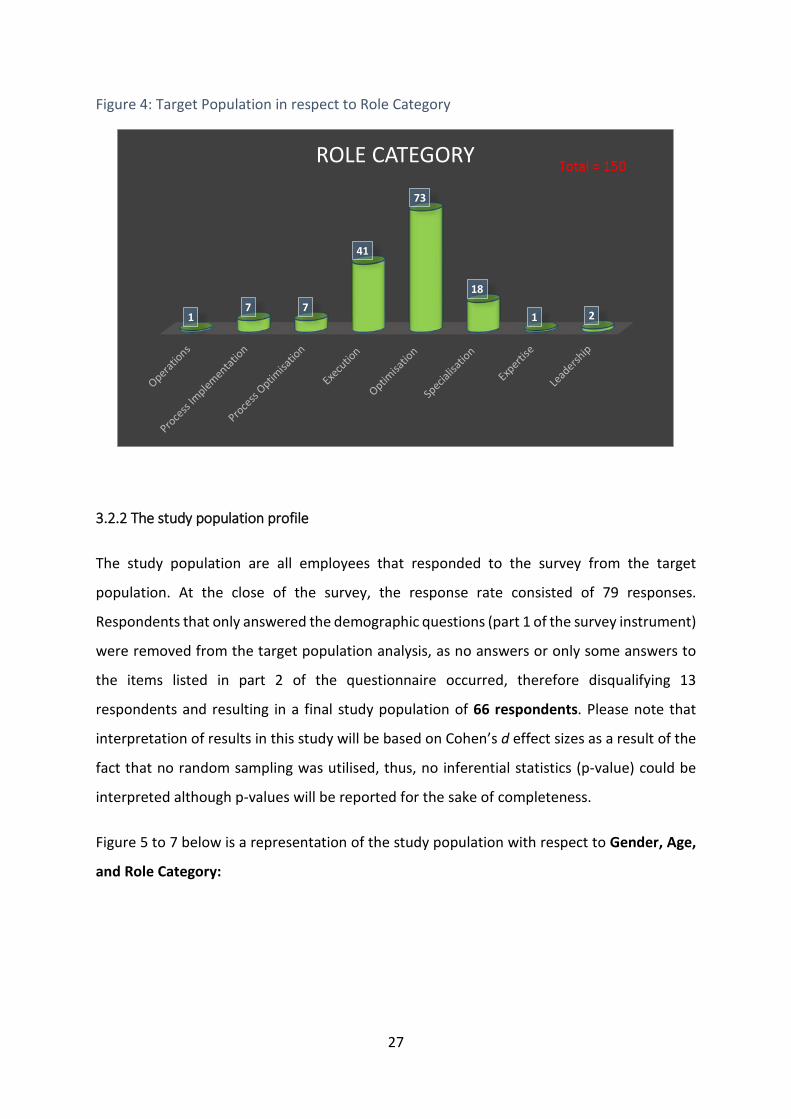
3.2.2 The study population profile
The study population are all employees that responded to the survey from the target
population. At the close of the survey, the response rate consisted of 79 responses.
Respondents that only answered the demographic questions (part 1 of the survey instrument)
were removed from the target population analysis, as no answers or only some answers to
the items listed in part 2 of the questionnaire occurred, therefore disqualifying 13
respondents and resulting in a final study population of 66 respondents. Please note that
interpretation of results in this study will be based on Cohen’s d effect sizes as a result of the
fact that no random sampling was utilised, thus, no inferential statistics (p-value) could be
interpreted although p-values will be reported for the sake of completeness.
Figure 5 to 7 below is a representation of the study population with respect to Gender, Age,
and Role Category:
17 7
41
73
18
1 2
ROLE CATEGORY

28
Figure 5: Study Population in respect to Gender
Figure 6: Study Population in respect to Age
Figure 7: Study Population in respect to Role Category
Male , 50
Female , 16
GENDER Total = 66
31 Years and Younger, (13)
32 - 47 Years, (30)
48 - 55 Years , (12)
56 Years and Above,( 11)
AGE
1
5
22 23
14
1
ROLE CATEGORY
29
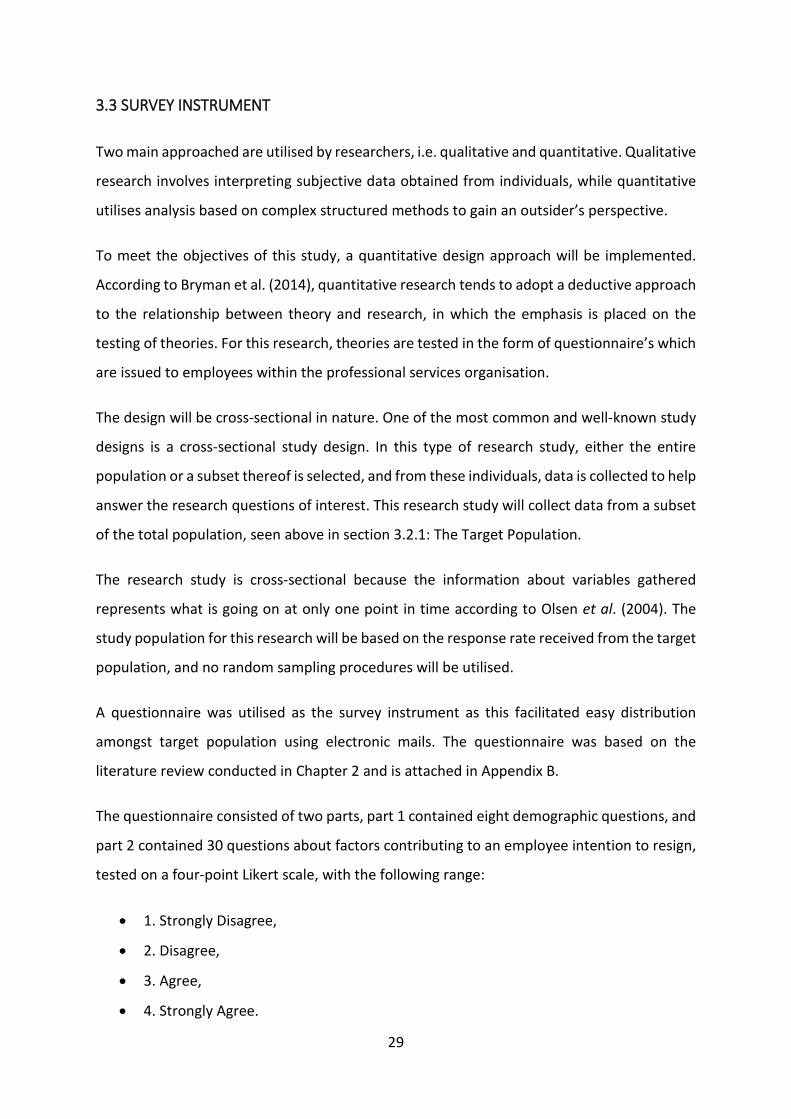
3.3 SURVEY INSTRUMENT
Two main approached are utilised by researchers, i.e. qualitative and quantitative. Qualitative
research involves interpreting subjective data obtained from individuals, while quantitative
utilises analysis based on complex structured methods to gain an outsider’s perspective.
To meet the objectives of this study, a quantitative design approach will be implemented.
According to Bryman et al. (2014), quantitative research tends to adopt a deductive approach
to the relationship between theory and research, in which the emphasis is placed on the
testing of theories. For this research, theories are tested in the form of questionnaire’s which
are issued to employees within the professional services organisation.
The design will be cross-sectional in nature. One of the most common and well-known study
designs is a cross-sectional study design. In this type of research study, either the entire
population or a subset thereof is selected, and from these individuals, data is collected to help
answer the research questions of interest. This research study will collect data from a subset
of the total population, seen above in section 3.2.1: The Target Population.
The research study is cross-sectional because the information about variables gathered
represents what is going on at only one point in time according to Olsen et al. (2004). The
study population for this research will be based on the response rate received from the target
population, and no random sampling procedures will be utilised.
A questionnaire was utilised as the survey instrument as this facilitated easy distribution
amongst target population using electronic mails. The questionnaire was based on the
literature review conducted in Chapter 2 and is attached in Appendix B.
The questionnaire consisted of two parts, part 1 contained eight demographic questions, and
part 2 contained 30 questions about factors contributing to an employee intention to resign,
tested on a four-point Likert scale, with the following range:
• 1. Strongly Disagree,
• 2. Disagree,
• 3. Agree,
• 4. Strongly Agree.

30
Part 1 – Demographic Questions
• 1.1 Age
• 1.2 Gender
• 1.3 Highest Academic Qualification
• 1.4 Marital Status
• 1.5 Do you have children
• 1.6 Role Category
• 1.7 Number of years within the Organisation
• 1.8 Last Merit Rating
Part 2 – Factors Leading to Employee Resignations
• Q1_1 to Q4_5 (total of 30 questions on a four-point Likert scale)
Part 2 of the questionnaire was intentionally designed by the author based on the literature
review conducted in Chapter 2, to evaluate seven pertinent constructs regarding employee
resignations. An additional construct was added by the author, namely Resignation intention,
where the question was directly posed to participants to state whether they have in the past,
or currently feel like resigning from the organisation. According to Welman et al. (2015),
constructs are intentionally created to represent an abstract concept of a diverging collection
of behaviours. Table 1 displays the relevant constructs and their associated questions from
part 2 of the questionnaire.

31
Table 1: Construct’s and Associated Questions
No. Construct
Number of Questions Associated Questions
1 Direct Supervisor 6
Q3_1; Q3_2; Q3_3; Q3_4; Q3_5; Q3_6
2 Individual Determinants 6
Q1_4; Q1_5; Q1_6; Q2_3; Q2_9; Q2_10
3 Organisational Leadership 4 Q4_1; Q4_2; Q4_3; Q4_5
4 Structural Determinants 5 Q1_7; Q2_2; Q2_4; Q2_11; Q2_12
5 Diversity and Transformation 1 Q2_7
6 Decision Making Authority 2 Q2_5; Q2_6
7 Remuneration 1 Q2_1
8 Resignation Intention 2 Q1_1; Q1_2
The following items were omitted from the analysis; Q1_3; Q2_8; and Q4_4, as it did not
comply with content validity. There is, therefore, a total of 27 questions representing the
eight stipulated construct’s which will be utilised for obtaining pertinent employee data.
Please refer to Appendix C for the questions about the eight constructs.
3.4 EXPLORATORY SURVEY TESTING
The questionnaire was pre-tested with 11 individuals within the organisation. These
individuals were requested to test the questionnaire’s intent and to ensure the general
grammar, language, and understanding of the questionnaire was clear. The 11 individuals that
were targeted for exploratory-testing of the questionnaire are as per the following role
categories contained in Table 2 below:
Table 2: Exploratory Survey Distribution
Role Category Number
Optimisation 5
Specialisation 4
Leadership 2
Total 11

32
The exploratory-testing was performed in parallel with all individuals, after which the
questionnaire was updated to incorporate comments before distributing to the target
population.
3.5 DATA COLLECTION
Data collection was done in the form of self-administered questionnaires which were issued
to targeted employees within the organisation via electronic mail. The electronic mail
contained background information regarding the study as well as an “Informed Consent
Form” requesting participation in the research study (see Appendix A). Target population
members were notified that the research guaranteed anonymity as only aggregated data will
be represented for the purposes for this study. Employees were after that requested to
complete the web questionnaire/survey via a link in the email as this method allows the
information to be automatically downloaded into a database for analysis according to Bryman
et al. (2014). Email addresses for employees are required, and this was acquired using the
“Global Organisational Mailbox” for which approval was granted by organisational leadership.
The online survey was administered via “Survey Face”, where an online survey request was
forwarded to the target population via electronic mail requesting them to click on a link, after
completing the online survey, the raw data was automatically transferred into an online
database where the data could be extracted into Microsoft Excel (a Microsoft package tool)
for analysing purposes. The services of the “North-West University: Statistical Consultation
Services” department was after that employed for assistance with respect to the data analysis
aspect of this research study. The survey was issued on the 14th of November 2018 and closed
on the 5th of November 2018.
The following comparisons could be concluded based on the available data regarding the
targeted population and the study population (respondents). Although no random sampling
methods were applied as no inferential statistics are done, relevant, pertinent strata tried to
be accommodated by the author to constitute an effective study.

33
Figures 8, 9, and 10 below display the representation of the study population compared to
the target population, regarding gender, age, and role category.
Figure 8: Gender comparison between the Target and Study Population
From figure 8 above, it is evident that the targeted male population is significantly larger than
the targeted female population. This was purposely done to represent the larger male
population currently within the organisation and to give a true reflection of the current
organisation. Response rates of 45 percent and 43 percent were attained for the male and
female populations, respectively, indicating that the study sample is well represented
regarding gender.
0
20
40
60
80
100
120
Male Female
Target population Study population
GENDER
45% 43%

34
Figure 9: Age comparison between the Target and Study Population
Figure 9 shows that a wide distribution of age categories was addressed in this sample to
effectively represent the current make-up of employees within the organisation. Response
rates of 59, 33, 57, and 73 percent are attained for the 31 and younger, 32 to 47, 48 to 55,
and 56 to 64-year categories, respectively. These response rates indicate that the target
population was effectively represented regarding the study population.
0102030405060708090
31 and Younger 32 - 47 Years 48 - 55 Years 56 - 64 Years
Target population
59%
Study population
57% 73%
AGE
33%

35
Figure 10: Role Category comparison between the Target and Study Population
According to figure 10 above, a well-represented target population regarding role category is
observed. Except for the “Process Implementation” and “Leadership” role category, a
significant representation of all other role categories is observed, confirming that the
intended sample is well represented.
A total of 150 questionnaires were distributed to employees within the organisation, and a
total of 79 were accounted for, however, due to the incompleteness of responses
(respondents only answering part 1 of the questionnaire), 66 responses were utilized for the
purposes for this study.
Tables 3 to 10 reflects the profile of the study population.
Table 3: Demographic Profile D1 – Age
D1 Age Frequency Percent
1 31 and Younger 13 20
2 32 - 47 30 45
3 48 - 55 12 18
4 56 and Older 11 17
Total 66 100
01020304050607080
Target population
100% 0%71%
54%
Study population
78%100% 0%
ROLE CATEGORY
32%

36
Table 4: Demographic Profile D2 – Gender
D2 Gender Frequency Percent
1 Male 50 76
2 Female 16 24
Total 66 100
Table 5: Demographic Profile D3 - Academic Qualification
D3 Academic Qualification Frequency Percent
1 Grade 12 or Lower 0 0
2 Certificate or Diploma 4 6
3 Bachelor's Degree 27 41
4 Post Graduate Degree 34 52
5 Other 1 1
Total 66 100
Table 6: Demographic Profile D4 - Marital Status
D4 Marital Status Frequency Percent
1 Single 5 8
2 Long Term Relationship 5 8
3 Married 53 80
4 Divorced 3 4
5 Widowed 0 0
Total 66 100
Table 7: Demographic Profile D5 – Children
D5 Do you have children? Frequency Percent
1 Yes 51 77
2 No 15 13
Total 66 100

37
Table 8: Demographic Profile D6 - Role Category
D6 Role Category Frequency Percent
1 Operations 1 2
2 Process Implementation 0 0
3 Process Optimisation 5 7
4 Execution 22 33
5 Optimisation 23 35
6 Specialisation 14 21
7 Expertise 1 2
8 Leadership 0 0
Total 66 100
Table 9: Demographic Profile D7 - Number of Years with the Organisation
D7 Number of Years with the Organisation Frequency Percent
1 Less than two years 3 5
2 3 - 5 years 5 8
3 6 - 9 years 14 21
4 More than ten years 44 66
Total 66 100
Table 10: Demographic Profile D8 - Merit Rating
D8 Last Merit Rating Frequency Percent
1 X - Non Performer 0 0
2 D - Developer 4 6
3 F - Full 50 76
4 E - Exceptional 7 11
5 N - Newly Appointed/Promoted 5 7
Total 66 100

38
3.6 DATA ANALYSIS
The questionnaire contained in Appendix B will be utilized in the study. The questionnaire will
comprise of two sections; part 1 which contains a mixture of nominal and ordinal categorical
variables which are closed and fixed type questions, whereas part 2 contains interval or
continuous variables in the form of a four-point Likert scale. The selection of these types of
variables and questions ensures the correct data will be obtained and after that analysed to
provide feedback regarding the primary and secondary research questions.
Consideration must be taken to account for missing data when analysing the results as the
results could be jeopardised if missing data is not properly catered too. The software utilized
to analyse the statistical data is a software program known as SAS -Statistical Analysing
Software (SAS, 2015); the preferred software analytical tool for the North West University
statistical department. The statistical data analysis scope of this study will be outsourced to a
professional statistical consulting company from the North West University; “Statistical
Consultation Services”, ensuring that the data to be analysed is accurate and reliable.
3.6.1 Coding of the questionnaire
The questionnaire needed to be coded using representing the possible answers per question,
by a specific number. This was to ensure that the data received from respondents could be
easily and accurately analysed for this study. Sequential numbering beginning at one was
utilised for both Part 1 and Part 2 of the questionnaire. A detailed description of the
implemented coding can be found in Appendix D.
3.6.2 Reliability and validity
To analyse the data obtained from the questionnaire, testing the questionnaire regarding
reliability and validity is essential.
According to Field et al. (2012), a reliable questionnaire is expected to deliver results that are
both consistent and accurate. Ravid (2011) states that reliability tests the amount of
consistency regarding a questionnaire as well as the degree to which similar results are
obtained when the survey instrument is repeated amongst individuals or the same groups.
There are various methodologies that can be utilised to test the reliability of a survey

39
instrument or questionnaire, and the Cronbach’s alpha coefficient methodology was utilized
in this research study to test for reliability.
According to Ravid (2011), validity refers to testing the survey instrument (questionnaire) to
ensure that the survey instrument actually does measure what it was designed to measure.
Field et al. (2012) state that validity is important if test results are going to be used to infer
other aspects. Construct validity was used to test the validity of the survey instrument applied
in this study. According to Field et al. (2012), content or construct validity measures the
degree of which items (or factors or questions) represent the actual construct being
measured. It is important to note that validity is not a sufficient condition on its own. For the
questionnaire to be valid, it must first be reliable as stated by Field et al. (2012).
According to Suhr (2006), confirmatory factor analysis (CFA) can be utilised to test the
relationship between factors (or items), and the perceived constructs to which they form a
part of, thereby implying that construct validity can, therefore, be empirically analysed by
conducting CFA. CFA was therefore performed in this research study, taking into account the
variation of communalities, the percentage of variance explained, as well as Kaiser’s measure
of sampling adequacy (MSA).
3.6.2.1 Construct validity
3.6.2.1.1 Kaiser’s measure of sample adequacy
According to Field et al. (2012), the measure of sampling adequacy (MSA) is a test developed
by Kaiser, Meyer and Olkin which indicates the inter-correlation between variables. The
guidelines for MSA statistics state that the values vary between o and 1, with the following
defined profiles listed in Table 11.

40
Table 11: MSA defined values
Range Description
0.90 to 1.00 Marvellous
0.80 to 0.89 Meritorious
0.70 to 0.79 Middling
0.60 to 0.69 Mediocre
0.50 to 0.59 Miserable
0.00 to 0.49 Unacceptable
3.6.2.1.2 Factor variation
The eigenvalues of the correlation matrix of the items associated with the eight defined
constructs were calculated using SAS (2015). These eigenvalues represent the amount of
variance which could be explained by that specific linear component. According to Field et al.
(2012), this approach is one the most popular utilised by researchers in determining the
number of factors required to describe the correlations amongst variables. The calculation
computed by SAS (2015) for this research study resulted in a total of 8 factors being retained
by MINEIGEN criterion for each of the constructs.
3.6.1.2.3 Variation of communalities
Communality is the amount of variance present within a variable, which is explained by the
extracted factors or retained components according to Field et al. (2012). Communalities
were therefore calculated utilising SAS (2015), which represent the multiple correlations
between factors and the associated extracted factor. Field et al. (2012) also states that
variables with no specific variance will result in a communality of one, and a variable that
shares none of its variance with another will result in a communality of zero. Therefore higher
communality variables depend strongly on at least one of the retained components and those
with lower communalities imply that they do not share much in common with the extracted
components.

41
3.6.1.2.4 Factor analysis
In this study, a factor analysis was done on all items on part 2 of the questionnaire as a data
reduction method to assure construct validity (SAS, 2015). The results of the factor analysis
complete on part 2 of the questionnaire are reported in Table 12:
Table 12: Factor Analysis Results
N MSA Number of Constructs
Percent of Variance Explained
Communality Variation (Lowest to Highest)
66 0.78 8 71.50 0.54 – 0.80
As can be seen from Table 14, the MSA is 0.78, which falls into the middling category, as well
as being above 0.5 which according to Field et al. (2012) is acceptable. Taking cognisance of
the values obtained for the “Percentage of Variance Explained”; 71.5percent which is greater
than 50 percent, as well as the “Communality Variations” between 0.54 and 0.80, constitute
construct validity for the eight defined constructs as per Table 1 in section 3.3. These
constructs are therefore valid.
3.6.1.3 Reliability of construct’s
3.6.1.3.1 The Cronbach alpha coefficient
According to Tavakoli and Dennick (2011), a common method to the measure the internal
consistency when multiple-items (questions) are utilised to form a construct, is known as the
Cronbach’s Alpha coefficient. Ravid (2011) stated that this type of test is adequately designed
for testing the reliability of survey instruments that implement a Likert scale. Cronbach’s
alpha coefficient splits data in two in all possible ways and after that computes the correlation
coefficient for each of this split, with the resultant average of those splits equating to
Cronbach’s alpha coefficient according to Field et al. (2012).
Numbers between the range of 0 and 1 are stated as the Cronbach’s alpha coefficient,
measuring the inter-relatedness of items within a construct. According to Field et al. (2012),
values for Cronbach’s alpha coefficient of above 0.8 are generally accepted for cognitive tests
(e.g. intelligence tests), and lower than 0.7 is suitable for ability tests.

42
The Statistical Analysis System (SAS, 2015) was utilised to compute the Cronbach alpha
coefficient for the constructs tested in this research study. Two constructs; “diversity and
transformation” and “remuneration” could not be computed as they contained only one item
per construct. The results for all other constructs are displayed in Table 13:
Table 13: Cronbach’s Alpha Reliability Coefficient
No. Construct Number of Items
Cronbach's Alpha
Coefficient
1 Direct Supervisor 6 0.89
2 Individual Determinants 6 0.86
3 Organisational Leadership 4 0.78
4 Structural Determinants 5 0.73
5 Decision Making Authority 2 0.75
6 Resignation Intention 2 0.6
Since perceptions and therefore attitudes are tested in this research study, rather than ability,
all values of 0.6 and above obtained for the Cronbach Alpha coefficient can be utilized
according to Field et al. (2012), resulting in all construct’s being used and further
demonstrating that the construct’s used for this research study have a high degree of internal
consistency and can thus be regarded as reliable.
Based on the above data, the mean response count for the eight constructs represented in
Table 12 above can, therefore, be utilised to conclude the factors leading to employee
resignations. There is, therefore, no requirement to conduct a separate a separate analysis
based on all 30 questions in part 2 of the questionnaire.
3.6.1.4 Conclusion in regard to validity and reliability
Utilising the confirmatory factor analysis by means the data reduction methodology (SAS,
2015), the validity of the questionnaire was found to be acceptable, therefore implying that
the predefined constructs developed by the author were adequate for testing purposes.

43
Furthermore, based on the above data, the reliability of the survey instrument is found to be
acceptable as values obtained for the Cronbach Alpha coefficient are all above 0.6.
3.6.2 Mean and standard deviation of construct assessment
In any given sample, the mean is a measure of central tendency, commonly utilised to indicate
the central or balance point of a given dataset (Levine et al., 2008). It is, therefore, the average
of a particular dataset. To determine the extent of the variation regarding the frequency
distribution of a sample, standard deviation (S) is utilised. Higher standard deviations indicate
that a larger spread around the mean is experienced (Field et al., 2012). Empirical rules for
bell-shaped graphs or distributions state that 95 percent of values in a dataset will lie
approximately two standard deviations away from the mean (Levine et al., 2008).
The following observed data regarding the mean and standard deviations were experienced
for the eight constructs tested in part 2 of the questionnaire, listed in Table 14 below:
Table 14: Construct Mean Values and Standard Deviation
No. Construct Number of
Respondents Mean Value
Standard
Deviation
1 Organisational Leadership 66 3.02 0.59
2 Individual Determinants 66 2.85 0.67
3 Decision Making Authority 66 2.8 0.67
4 Resignation Intention 66 2.74 0.79
5 Diversity and Transformation 66 2.62 1.01
6 Remuneration 66 2.39 0.74
7 Structural Determinants 66 2.35 0.52
8 Direct Supervisor 66 1.83 0.61
Table 14 confirms that the lowest mean values experienced are for the “Direct Supervisor”
construct, while the highest mean values experienced are for the constructs:
• “Organisational Leadership”,
• “Individual Determinants”, and
• “Decision Making Authority”.

44
This, therefore, implies that within the organisation, the biggest concerns regarding employee
resignations are due to “organisational leadership”, “individual determinants”, and “decision-
making authority” and construct of least concern regarding employee resignations within the
organisation is the “direct supervisor”.
3.6.3 Pearson’s correlation (r)
Pearson’s correlation coefficients were calculated to determine if linear relationships existed
between constructs. The “Resignation Intention” construct was measured against all other
constructs to determine if any correlation existed.
According to Cohen (1988), the following guidelines are given for interpreting results
according to Pearson’s correlation coefficients:
• r = 0.1 small effect
• r = 0.3 medium effect (noticeable with the naked eye)
• r ≥ 0.5 large effect (practically significant and therefore of practical importance)
Table 15 below displays the results for the (SAS, 2015) computation of Pearson’s correlation
coefficients:
Table 15: Pearson’s Correlation Coefficients (r) in term of “Resignation Intention”
No. Construct r
1 Individual Determinants 0.47α
2 Decision Making Authority 0.44α
3 Organisational Leadership 0.38α
4 Structural Determinants 0.35α
5 Direct Supervisor 0.29
6 Diversity and Transformation 0.21
7 Remuneration 0.1
α – represents the following calculated r values: 0.3 ≤ r < 0.5

45
Based on the above table the following constructs display correlations greater than r = 0.3
(medium effect) meaning that these four constructs have a linear relationship concerning
“resignation-intention” with medium practical effect, respectively:
• Individual Determinants,
• Decision Making Authority,
• Organisational Leadership, and
• Structural Determinants
This, therefore, implies that if any of these construct’s increase then resignation intention will
also increase with a medium practical effect.
3.6.4 Cohen’s effect sizes (d)
Cohen’s effect sizes (d) were calculated to determine if differences were of any practical
value. Ellis and Steyn (2003) highlight that when testing for practical significance, descriptive
statistics need to be calculated using effect sizes to establish the importance of the
relationship being tested. When comparing two groups, analysing the differences between
those two means is an appropriate method according to Field et al. (2012). Effect sizes are
“standardised” measures, implying that they analyse the differences between means and
therefore do not depend on the relevance of the sample size (Steyn, 2000). Field et al. (2012)
explains that effect sizes are objective measures utilised in determining the standardised
magnitude for specified observed effects.
According to Cohen (1988), the following guidelines regarding Cohen’s d-value are utilized to
interpret the results of effect sizes:
• d = │0.2│ small effect
• d = │0.5│ medium effect (noticeable with the naked eye)
• d ≥ │0.8│ large effect (practically significant and therefore of practical importance)
Only the effect sizes for the following demographic variables (part 1 of the questionnaire)
were calculated for this research study, as these variables were deemed to be of greater
importance:

46
• Age,
• Merit rating,
• Number of years within the organisation, and
• Academic qualifications.
These descriptive statistics were computed using (SAS, 2005), to highlight the importance of
the relationships being tested regarding the identified constructs.
Table 16: Effect Sizes based on Age
Construct Group n Mean Std
p-value* (when
random sampling
was assumed) d-value
Direct Supervisor 1 45 1.78 0.6
0.41 0.2 2 26 1.91 0.65
Individual Determinants 1 45 2.89 0.69
0.44 0.18 2 26 2.77 0.65
Organisational Leadership 1 45 3.04 0.58
0.72 0.09 2 26 2.99 0.62
Structural Determinants 1 45 2.4 0.55
0.3 0.24 2 26 2.26 0.47
Diversity and Transformation 1 45 2.93 0.93
0.0005* 0.91∆ 2 26 2.07 0.93
Decision Making Authority 1 45 2.83 0.71
0.59 0.12 2 26 2.75 0.58
Remuneration 1 45 2.44 0.78
0.44 0.17 2 26 2.31 0.67
Resignation Intention 1 45 2.85 0.81
0.096 0.39 2 26 2.53 0.73
Group 1 = 47 years and below, Group 2 = 48 years and above
n = number of respondents
Std = Standard Deviation
* Statistically significant on a 0.05 level according to T-Test results for independent groups
∆ Practically significant (d ≥ 0.80)

47
As can be seen from Table 16, there were a practically significant (d = 0.91) difference between group
1 and group 2 respondents regarding diversity and transformation within the organisation meaning
that group 1 (mean = 2.93) respondents differ from the perception of group 2 (mean = 2.07)
respondents for the item; insufficient progress has been made regarding diversity and transformation
within the organisation.
Table 17: Effect Sizes based on Merit Rating
Construct Group n Mean Std
p-value (when
random sampling
was assumed) d-value
Direct Supervisor 1 56 1.84 0.65
0.65 0.10 2 14 1.78 0.39
Individual Determinants 1 56 2.9 0.65
0.54 0.18 2 14 2.78 0.63
Organisational Leadership 1 56 3.04 0.58
0.66 0.13 2 14 2.96 0.64
Structural Determinants 1 56 2.38 0.52
0.78 0.07 2 14 2.34 0.39
Diversity and Transformation 1 56 2.66 1.05
0.43 0.22 2 14 2.42 0.93
Decision Making Authority 1 56 2.86 0.57
0.44 0.22 2 14 2.67 0.84
Remuneration 1 56 2.39 0.76
0.87 0.05 2 14 2.35 0.75
Resignation Intention 1 56 2.75 0.76
0.91 0.03 2 14 2.78 0.84
Group 1 = X, D, and N, Group 2 = F, and E. (Where: X = Non-Performer, D = Developer, N = Newly
Appointed, F = Full Performer, and E = Exceptional Performer)
n = number of respondents
Std = Standard Deviation

48
Table 18: Effect Sizes based on the Number of Years within the Organisation
Construct Group n Mean Std
p-value (when
random sampling
was assumed) d-value
Direct Supervisor 1 23 1.8 0.62
0.82 0.06 2 47 1.84 0.62
Individual Determinants 1 23 2.75 0.74
0.33 0.24 2 47 2.92 0.64
Organisational Leadership 1 23 3.03 0.64
0.97 0.01 2 47 3.03 0.57
Structural Determinants 1 23 2.35 0.61
0.95 0.02 2 47 2.35 0.48
Diversity and Transformation 1 23 2.56 1.03
0.72 0.09 2 47 2.65 1.02
Decision Making Authority 1 23 2.8 0.79
0.94 0.02 2 47 2.81 0.6
Remuneration 1 23 2.48 0.73
0.54 0.15 2 47 2.36 0.76
Resignation Intention 1 23 2.69 0.9
0.78 0.07 2 47 2.75 0.75
Group 1 = 9 years and less, Group 2 = 10 years and above
n = number of respondents
Std = Standard Deviation

49
Table 19: Effect Sizes based on Qualification
Construct Group n Mean Std
p-value (when
random sampling
was assumed) d-value
Direct Supervisor 1 35 1.88 0.66
0.46 0.16 2 35 1.77 0.55
Individual Determinants 1 35 2.79 0.71
0.4 0.19 2 35 2.92 0.63
Organisational Leadership 1 35 3.01 0.53
0.76 0.07 2 35 3.05 0.65
Structural Determinants 1 35 2.42 0.58
0.29 0.23 2 35 2.29 0.45
Diversity and Transformation 1 35 2.51 1.01
0.29 0.25 2 35 2.77 1
Decision Making Authority 1 35 2.75 0.73
0.54 0.14 2 35 2.85 0.61
Remuneration 1 35 2.51 0.78
0.2 0.29 2 35 2.28 0.71
Resignation Intention 1 35 2.65 0.8
0.33 0.23 2 35 2.84 0.78
Group 1 = Bachelor’s Degree and lower, Group 2 = post Graduate degree and above
n = number of respondents
Std = Standard Deviation
From Tables 17 to 19 above, it is evident that there were no differences of any practical
significance between the other construct’s regarding merit rating, number of years in the
organisation, as well as qualification, implying that these mentioned demographic variables
do not influence employee resignation within the study population.
3.7 CONCLUSION
Based on the above data, the reliability of the survey instrument is found to be acceptable as
values obtained for the Cronbach Alpha coefficient are all above 0.5.
Furthermore, utilising the confirmatory factor analysis by means the data reduction
methodology (SAS, 2015), the validity of the questionnaire was found to be acceptable,

50
therefore implying that the predefined constructs developed by the author were adequate
for testing purposes.
The mean values obtained infer that “organisational leadership” was the construct with the
highest recorded mean values and “direct supervisor” was the construct with the lowest
recorded mean value.
Pearson’s correlation coefficient found that there is a medium correlation and above (r = 0.3
or more) regarding, Individual Determinants, Decision Making Authority, Organisational
Leadership, and Structural Determinants, when compared against the Resignation Intention
construct.
Effect sizes for various demographic types were evaluated, and only the “Diversity and
Transformation” construct was found to be of practical significance amongst employees
younger than 47 years old, as compared to employees older than 47 years old within the
organisation.

51
CHAPTER 4: CONCLUSIONS AND RECOMMENDATIONS
4.1 INTRODUCTION
This aim of this research study was to investigate the factors leading to employee resignations
within the professional services organisations being evaluated. In chapter 2, a literature study
was conducted to identify the factors about employee resignations as well as to identify the
impact that employee resignations have on an organisation, effectively describing the
problem statement. Chapter 3 then set out to explain the methodology which was
implemented in this study to test the researched factors (and construct’s) within the
professional services organisation being evaluated to gain insight into employee resignations.
This was accomplished using a quantitative survey instrument which was distributed to the
target population within the organisation, and after that statistical analysis was then carried
out, and the results of those findings are discussed in this chapter.
This chapter aims to analyse therefore the findings highlighted in this research study to clarify
the defined primary and secondary objectives listed in chapter 1. Recommendations will also
be put forth and are therefore listed in this chapter to assist the current organisation as well
as future researchers in trying to resolve the current issues with follow up research studies.
4.1 CONCLUSIONS
The empirical study conducted in chapter forms the basis of the results analysed within the
said professional services organisation. The aim of the empirical research was to gain insight
into the perceptions of current employees to understand what constructs contributed to their
intention to resign from the organisation. These constructs together with their correlations
to “resignation intention”, as well the effect size analysis for respective demographic groups
will, therefore, be discussed.
4.1.1 Factors that contribute to employee resignations based on employee perceptions
Based on the data from chapter 3, the construct’s means with the most significant influence
on employee’s intention to resign are listed, ranked from highest to lowest (see section 3.6.2,

52
Table 14), implying that the construct with the highest rating is what employees perceive to
be the most important construct within the organisation
From these results, it is clear that “Organisational Leadership” with a mean value of 3.02 is
found to be the most important construct regarding employee resignations within the
organisation, as perceived by employees. Following closely after is “Individual Determinants”
with a mean value of 2.85 and after that “Decision Making Authority” with a mean value of
2.8. The lowest or least important issue concerning employee resignations resonates with
that of the “direct supervisor”, implying that this construct is adequately managed within the
organisation and is not a perceived issue regarding employee resignations within the
organisation, as compared to the others.
Regarding “Organisational Leadership”; the following four items form part of this construct:
• I feel there is a lack of trust and confidence in organisational leadership about the
stewardship of the organisation.
• I feel that organisational leader act unfairly.
• I feel that there is a lack of transparency and communication during times of significant
organisational change, i.e. informational injustice.
• I feel that organisational leadership promote a sense of openness and fairness and act in
the best interest of the organisation.
Organisational leaders are the actual stewards of the organisation, and results of this nature
are somewhat troubling because to move the organisation in the direction required by
organisational leaders to meet strategic objectives, support is required from employees
within that organisation. There could be various reasons as to why this response is received,
but based on the factors constituting the “organisational leadership” construct, something
needs to be done in these domains to actively correct the current perception of employees
within the organisation.

53
4.1.2 Factors with linear correlation to “employee-resignation” when compared to other
constructs
Based on the data stemming from Pearson’s correlation coefficients (r), the following
constructs:
• Individual Determinants,
• Decision Making Authority,
• Organisational Leadership, and
• Structural Determinants.
All obtain values greater than r = 0.3 (medium effect) for the calculated Pearson’s correlation
coefficient regarding the construct; “resignation intention”. This, therefore, implies that these
constructs have a direct linear correlation to employee resignation with a medium practical
effect and therefore need to be managed or addressed.
4.1.3 Factors of practical significance to demographic groups, based on employee perceptions
Based on the results contained in chapter 3 for Cohen’s effect sizes (d), there is very little
practical significance observed based on the constructs concerning:
• Merit Rating,
• Number of years with the organisation, or
• Academic Qualification.
The one important aspect noticed is in respect to the age of employees, within the
demographic feedback, regarding the “Diversity and transformation” construct.
From Table 15 in section 3.4.4, it is evident that “Diversity and Transformation” construct is
of more practical significance amongst employees that are 47 years and younger, as
compared to employees that 48 years and older. All other results yield that there were no
differences of any practical importance on construct’s regarding demographic variables, such
as “Merit Rating”, “Number of years within the organisation”, and “Academic Qualification”.
Focus within the organisation to limit employee resignations should, therefore, be to actively
work on promoting diversity and transformation, more especially for employees under the
54
age of 47 years old. Being a professional services organisation operating within the borders
of South Africa, this is not only a requirement of current employees but also a legal
requirement to ensure that previously disadvantaged groups are given fair opportunity as
well as being significantly represented on management levels within the organisation.
4.2 RECOMMENDATIONS
4.2.1 Factors that contribute to employee resignations based on employee perceptions
Based on the conclusions above for the highest ranked construct means, the following
recommendations are therefore proposed by the author regarding “Organisation
Leadership”:
• Given that employees feel that organisational leader’s act unfairly and there seems to
be a lack of trust and confidence concerning organisational leaders regarding the
stewardship of the organisation as well a lack of communication during times of
significant change. Organisational leaders should, therefore, display strong leadership
characteristics and tackle the problem head-on. This can be achieved by holding
interactive sessions with employees, one on one sessions will not be feasible, but
classroom activities can be utilised to target groups of employees to address the
concerns within the organisation. This can be achieved by a simple question and
answer platform, affording employees an opportunity to understand why certain
decisions have been taken and also giving organisational leaders a chance to
understand why they are perceived negatively in these regards. For those employees
who are not brave enough to voice their concerns in open platforms, an opportunity
to write down concerns and submit to organisational leadership should be allowed.
This ensures that all individuals within the organisation have a choice to state their
concerns and provide feedback as to why organisational leaders are perceived
negatively. A final list of concerns should, therefore, be created and regular feedback
is given to employees on how actions are resolved, taking into consideration that not
all concerns or issues can be resolved over short periods. The approach should be to
prioritise the concerns and after that address them appropriately. The mere ability to
allow employees the opportunity to talk and voice opinions directly to organisational

55
leaders on such a platform will show that this is a step in the right direction and will
hopefully re-instil some loyalty towards organisational leaders as well as to the
organisation.
• Given that the organisation has the resources to do so, another approach could be to
allow employees to raise concerns or ask questions directly to organisational leaders
via an online platform, this platform should allow for anonymity to be guaranteed as
true concerns or criticism may not be raised if employees feel they will be targeted for
raising valid points or objection.
• Further research, perhaps another mini-dissertation could specifically tackle the topic
of organisational leadership in the workplace, and how countermeasures can be put
in place to address employee concerns or reservations regarding organisational
leaders.
4.2.2 Factors with linear correlation to employee resignation based on employee perceptions
Based on the conclusions above regarding Pearson’s correlation coefficients (r), the following
recommendations are proposed by the author about the correlation of constructs regarding
resignation intention:
• Given the many items about the listed construct’s which have a medium practical
correlation effect on employees regarding employee resignations (i.e. “Individual
Determinants”, “Decision Making Authority”, “Organisational Leadership”, and
“Structural Determinants”), it is difficult to pin down a suitable solution for this issue.
Notice should, however, be taken that these construct directly correlates with an
employee’s intention to resign from an organisation and therefore the author’s
recommendation will be to utilize the findings of this mini-dissertation; “Factors
leading to employee resignation within a professional services organisation”, as a
basis for a new research study to be conducted to delve deeper into the possible
retention mechanisms with regard to the identified constructs.

56
4.2.3 Factors of practical significance to demographic groups, based on employee perceptions
From the conclusions stated regarding Cohen’s d effect sizes, the matter of most practical
significance was that of “Diversity and Transformation”, in that employees younger than 47
years old feel that there is insufficient progress being made within the organisation regarding
this aspect.
The following recommendations are therefore put forth by the author in this regard:
• Based on the National Development Plan (NDP) of South Africa; a legal framework
seeking to give fair an equal opportunity to previously disadvantaged groups,
especially black African women. Organisational leaders should pro-actively begin to
identify promising candidates to ensure positions at management level can be
occupied in the immediate to near future to ensure that the organisation meets
legislative obligations as well as employee concerns.
• Internal broad-based black economic equity (BBBEE) candidates should be given first
preference for these roles, and should there be certain deficiencies, suitable guidance
and training should be offered to these individuals to fast track their development.
• Outsourcing of BBEEE candidates (external to the organisation) for respective roles
should be considered, only if internal candidates cannot be found.
• The efforts to meet legislative requirements regarding BBBEE should also be
frequently communicated to the employees within the organisation, ensuring that the
process is transparent as well as to keep the organisation adequately aligned in
respect to progress made in these areas.
• These proposals will, therefore, assist in preventing employees that hold this
requirement in high regard, from resigning from the organisation.

57
4.3 EVALUATION OF THE RESEARCH STUDY
This research study set out to determine the factors leading to employee resignation within
a professional services organisation to address the primary and secondary research
objectives. As per Chapter 1, section 1.4, these objectives are:
4.3.1 Primary research objective
• What factors (or construct’s) relating to employee resignations are the most
significant within the said professional services organisation.
4.3.2 Secondary research objective
The secondary objective for this study is to:
• Establish which demographics (e.g. age, gender, and qualification) was most
influenced regarding factors about employee resignations within the said professional
services organisation.
Regarding the primary research objective, the construct that has been ranked the highest
amongst the study population is “Organisational Leadership”. Regarding the secondary
research objective, the construct with the biggest influence on a specific demographic group
was that of “Diversity and Transformation”, which was perceived amongst the employees
within the organisation that are 47 years and younger.
Based on the empirical study conducted in chapter 3 of this research study and the
conclusions as part of this chapter (chapter 4), it can be safely concluded that all research
objectives for this research study have been met.
4.4 LIMITATIONS OF THE RESEARCH STUDY
Due to the time and resources allowed for the completion of this mini-dissertation, this
research study was limited to the perceptions of employees within one professional services
organisation.

58
4.5 PROPOSAL FOR FUTURE RESEARCH
The basis of this research study was to review and understand the various literature about
employee resignations within professional services organisations, and in doing so, identifying
through thorough analysis the pertinent factors contributing to employee resignations within
the professional services organisation being evaluated. The proposal for future research
would, therefore, be to utilise the findings of this research to form the basis for further
research to be conducted on the topic of:
• Possible retention strategies for employees within a professional services
organisation.
4.6 OVERALL CONCLUSION
This research study intended to identify the pertinent factors leading to employee
resignations within a professional services organisation. Literature was analysed, and a
tailored questionnaire was developed and distributed to ascertain relevant feedback from the
organisation. Results were analysed, and conclusions were drawn stemming a detailed
analysis as conducted in chapter 3. The research highlights that the most pertinent construct
regarding employee resignations was “Organisational Leadership”. Insight was also drawn
into the relevant demographic groups where a significant difference amongst employees
younger than 47 years old felt that there was insufficient progress been made regarding
diversity and transformation within the organisation.
Possible recommendations were after that put forth by the author to address the findings.
On completion of the research study, it is evident that both the primary and secondary
objectives as set out at the start of the research were adequately addressed.
And lastly, in the interest of future research, initiatives were also stated to circumvent the
issues identified by this research study.

59
REFERENCES
Agho, A.O., Mueller, C.W. & Price, J.L. 1993. Determinants of employee job satisfaction: An
empirical test of a causal model. Human relations, 46(8):1007-1027.
Alimo-Metcalfe, B., Alban-Metcalfe, J., Bradley, M., Mariathasan, J. & Samele, C. 2008. The
impact of engaging leadership on performance, attitudes to work and wellbeing at work: A
longitudinal study. Journal of Health Organization and management, 22(6):586-598.
Ardichvili, A. 2012. Sustainability or limitless expansion: paradigm shift in HRD practice and
teaching. European Journal of Training and Development, 36(9):873-887.
Arekar, K., Jain, R., Deshpande, B. & Sherin, P. 2016. Relationship between individual and
structural determinants on job satisfaction–analysis of employee turnover in the Indian
context. The Journal of Developing Areas, 50(6):387-398.
Aruna, M. & Anitha, J. 2015. Employee retention enablers: Generation Y employees. SCMS
Journal of Indian Management, 12(3):94-97.
Bhardwaj, S. & Singh, A. 2016. Factors affecting employee attrition among engineers and
non-engineers in the manufacturing industry. https://ideas.repec.org/p/vor/issues/2016-09-
07.html Date of access: 10 Nov. 2018.
Bierema, L.L. & d'Abundo, M.L. 2004. HRD with a conscience: Practicing socially responsible
HRD. International Journal of Lifelong Education, 23(5):443-458.
Bloomberg BNA. (2012). Succession planning: most employers worried about boomer exits;
few planning ahead. HR Focus, 89(5):9-14.
Bryman, A., Bell, E., Hirschsohn, P., Dos Santos, A., Du Toit, J., Masenge, A., Van Aardt, I., &
Wagner, C. (2014). Research methodology: Business and management contexts. Cape Town:
Oxford University.
Charney, D. 2008. Top 10 reasons good employees quit. Material Handling Management,
63(10):48-49.

60
Cohen, J. 1988. Statistical power analysis for the behavioural sciences. 2nd ed. Hillsdale, NJ:
Lawrence Erlbaum Associates.
Coetzee, M., Mitonga-Monga, J. & Swart, B. 2014. Human resource practices as predictors
of engineering staff's organisational commitment. SA Journal of Human Resource
Management, 12(1):1-9.
DeCarlo, M. 2018. How parental leave policies can benefit your bottom line. News & Business.
55(1):13.
Decremer, A., Smolders, C., Vanderstraeten, A. & Christiaens, J. (2012). The impact of
institutional pressures on employee performance management systems in higher education
in the low countries. British Journal of Management, 23:88–103.
Deloitte & Touche. 2009. Organizational Culture Survey. Pretoria: Deloitte & Touche.
Deloitte & Touche. 2012. Talent 2020: Surveying the talent paradox from the employee
perspective. Pretoria: Deloitte & Touche.
Detert, J.R. & Treviño, L.K. 2010. Speaking up to higher-ups: How supervisors and skip-level
leaders influence employee voice. Organization Science, 21(1):249-270.
Direct Hire. 2016. Annual South African HR Recruitment Trends Report - 2016. Available:
http://www.mcidirecthire.com/wp-content/uploads/2016/09/Annual-South-African-HR-
Recruitment-Trends-Report-2016.pdf Date of access: 2 October 2017.
Ellis, S.M & Steyn, H.S. 2003. Practical significance (effect sizes) versus or in combination with
statistical significance (p-values). Management Dynamics, 12(4):51-53.
Field, A. Miles, J. & Field, Z. 2012. Discovering statistics using R. London: Sage.
Frey, R.V., Buettgen, M. & Pietsch, S. 2014. Can Training Help Retain Professional Services
Employees? An Empirical Analysis. Academy of Management Proceedings. Briarcliff Manor,
NY: Academy of Management.
61
Ghina, A. 2012. The influence of corporate culture on organisational commitment: Case
study of civil government organisations in Indonesia. International Journal of Basic & Applied
Sciences, 1(2):156-170.
Giles, P. 2010. The impact of adult degree-completion programs on the organizational
climate of Christian colleges and universities. (Thesis – Masters). Walden: Walden University.
Gupta, O. K., Arekar, K., Deshpande, B. & Sherin, P. 2017. A structural equation modelling to
understand the determinants of employee turnover: An empirical study. Model Assisted
Statistics and Application, 12 (2):127-136.
Hacker, C.A. 2003. Turnover: A silent profit killer. Information Systems Management,
20(2):14-18.
Jonsen, K., Tatli, A. & Özbilgin, M.F. & Bell, M.P. 2013. The tragedy of the uncommons:
Reframing workforce diversity. Human Relations, 66(2):271-294.
Klotz, A.C. & Bolino, M.C. 2016. Saying goodbye: The nature, causes, and consequences of
employee resignation styles. Journal of Applied Psychology, 101(10):1386-1392.
Koh, Y.H. 2018. Factors affecting the retention of Generation Y workers in food industry. (thesis – Masters). Barar: Universiti Tunku Abdul Rahman.
Lam, L.W., Loi, R., Chan, K.W. & Liu, Y. 2016. Voice more and stay longer: How ethical leaders
influence employee voice and exit intentions. Business Ethics Quarterly, 26(3):277-300.
Levine, D.M., Stephan, D.F., Krehbiel, T.C. & Berenson, M.L. 2008. Statistics for managers
using Microsoft Excel. Upper Saddle River, NJ: Pearson Prentice Hall.
Lwazi, B., Justine, M., Margot, T., & Allen, S. (2014). Magnet for Top Talent. Deloitte 2014
Stakeholder Report, 1(1):1 - 19.
MacLean, E.L. 2013. Reducing employee turnover in the Big Four public accounting firms.
Claremont: McKenna College.

62
Matotoka, D. & Odeku, K. 2018. Transformative interventions fostering mainstreaming of
black South African women into managerial positions in the private sector. European Review
of Applied Sociology. 11 (16), p36-49.
McWilliams, J. 2011. Unfolding the way valued knowledge workers decide to quit.
International Journal of Employment Studies, 19(1):70-82.
Miles, M., Jenster, N. & Gill, M. 2014. Themes in good leadership: An analysis of personal
stories of inspiration from the Daqing oil field. Proceedings of the 2014 International
Conference on Social Science. Honolulu, HW: Citeseer.
Moghimi, S. & Subramaniam, I.D. 2013. Employees’ creative behavior: The role of
organizational climate in Malaysian SMEs. International Journal of Business and
Management, 8(5):1-19.
Olsen, C. & St. George, D. 2004. Cross-sectional study design and data analysis.
http://www.collegeboard.com/prod_downloads/yes/4297_MODULE_05.pdf Date of access:
4 August 2018.
Osman, N., Purwana, D. & Saptono, A. 2017. Do performance appraisal, compensation and
job satisfaction influence employees’ loyalty of Generation Y? Journal of Business and
Behavioural Entrepreneurship, 1(1):35-49.
Park, J.G. & Kim, J.S. 2017. The effects of empowering leadership on psychological well-being
and job engagement: The mediating role of psychological capital Jong Gyu Park, Jeong Sik Kim,
Seung Won Yoon, Baek-Kyoo Joo.
Patient, D., Sguera, F. & Diehl, M.-R. 2015. How Informational Injustice Leads to Exit
Intentions: Cynicism in Highly Identified Employees. Academy of Management Proceedings.
Briarcliff Manor, NY: Academy of Management.
Rahimic, Z. 2013. Influence of organizational climate on job satisfaction in Bosnia and
Herzegovina companies. International Business Research, 6(3):129-142.
SAS Institute Inc (SAS). 2015. Statistical Analysis System - OnlineDoc® 9.4. Cary, NC: SAS
Institute Inc.

63
Shah, S.M.A., Lagari, M. & Rani, D. 2012. Impact of organizational culture on the employee's
job satisfaction; a study of faculty members of private sector universities of Pakistan. Asian
Journal of Business and Management Sciences, 1(12):92-101.
Shanker, M. 2014. A Study on Organizational Climate in Relation to Employees' Intention to
Stay. Journal of Psychosocial Research, 9(2):389-401.
Steyn, H.S. (Jr). 2000. Practical significance of the difference in means. Journal of Industrial
Psychology, 26(3):1-3.
Steyn, H.S. (Jr). 2002. Practically significant relationships between two variables. South
African Journal of Industrial Psychology, 28(3):10-15.
Suhr, D.D. 2006. Exploratory or confirmatory factor analysis? SAS Institute.
ww2.sas.com/proceedings/sugi31/200-31.pdf Date of access 30 October 2018.
Tavakoli, M. & Dennick, R. 2011. Making sense of Cronbach’s alpha. International Journal of
Medical Education, 2(2011):53-55.
Vignesh, S.G., Sarojini, V. & Vetrivel, S. 2018. Employee attrition and employee retention-
challenges & suggestions. https://www.researchgate.net/publication/322896996_
Employee_Attrition_and_Employee_Retention-Challenges_Suggestions Date of access: 10
Nov. 2018.
Visagie, C. & Steyn, C. 2011. Organisational commitment and responses to planned
organisational change: An exploratory study. Southern African Business Review, 15(3):98-121.
Welman, C., Kruger, f. & Mitchell, B. 2005. Research Methodology. 3rd ed. Cape
Town: Oxford University Press.
Weyland, A. 2011. Engagement and talent management of Gen Y. Industrial and commercial
training, 43(7):439-445.
Wooldridge, A. 2006. The battle for brainpower: A survey of talent. London: Economist
Newspaper.

64
Zaitouni, M., Sawalha, N.N. & Sharif, A. 2011. The impact of human resource management
practices on organizational commitment in the banking sector in Kuwait. International
Journal of Business and Management, 6(6):108-122.
Zeffane, R. 1994. Patterns of organizational commitment and perceived management style:
A comparison of public and private sector employees. Human relations, 47(8):977-1010.

65
APPENDIX A – INFORMED CONSENT FORM (PARTICIPANT)
Dear Participant: You are invited to participate in an academic research study conducted by Ajay Lutchman, an MBA student from the North West University. The purpose of this study is to gather valuable information from the perspective of key stakeholders (employees) within Sasol Group Technology in respect to the topic: “Factors leading to employee resignations within a professional services organisation”. Kindly note the following: This study is imperative to distinguish the core factors leading to employee resignations within the organisation. It is therefore encouraged that all participants answer all questions honestly as results will be combined and portrayed in an aggregated manner, ensuring anonymity. The demographical information will only be used to validate the sample for the research. The researcher will issue the combined results of the study upon request from the participant after completion of the study.
• The survey will take approximately 10 minutes to complete. • All answers will be treated as confidential, as only aggregated results will be shared
for this study. • Participation is completely voluntary. • The survey comprises of two sections, Section A contains demographic questions and
Section B contains statements which influence an employee’s intention to resign on a 4-point Likert scale, where participants must select the most appropriate option.
Please indicate that you have read and understood the information provided and thereby give your consent to participate in the study. Yes No

66
APPENDIX B – QUESTIONNAIRE
Self-Completion Questionnaire:
Part 1: Demographical Information In the following section, you will find a list of personal employee questions. Instructions: Please select one answer per statement and answer all the statements, if you choose “other”, please motivate your response.
1.1 Age o 31 and younger o 32 – 47 o 48 – 55 o 56 – 65 o Older than 65
1.2 Gender o Male o Female
1.3 Highest Academic Qualification o Grade 12 or lower o Certificate or Diploma o Bachelor’s Degree o Post Graduate Degree o Other, please specify …………………………………………………
1.4 Marital Status o Single o Long term relationship o Married o Divorced o Widowed
1.5 Do you have children?
o Yes o No

67
1.6 What role category are you currently in? o Operations o Process Implementation o Process Optimisation o Execution o Optimization o Specialisation o Expertise o Leadership o Other, please specify …………………………………………………
1.7 Number of years in the organisation?
o Less than two years o 3 – 5 Years o 6 – 9 Years o More than ten years
1.8 Last merit rating in the organisation? o X o D o F o E o N
Part 2: Factors leading to employee resignations within a professional services organisation. In the following table, you will find a list of statements contributing to an employee’s intention to resign from a professional services organisation. Keeping these statements in mind, please note that the scale gives you the opportunity to indicate if you:
1. “Strongly Disagree”, 2. “Disagree”, 3. “Agree”, and 4. “Strongly Agree”.
Instructions: Please select one answer per statement and answer all the statements.

68
STATEMENTS
1.
Stro
ngly
Dis
agre
e 2.
Dis
agre
e 3.
Agre
e
4.
Stro
ngly
Agr
ee
1.1 I have considered resigning from my organisation in the past.
1.2 I currently consider resigning from my organisation. 1.3 I feel I have insufficient work-life balance. 1.4 My current job (day to day activities) does not motivate me.
1.5 I feel there is improper utilisation of my skills and abilities in my current job.
1.6 I feel that the organisational culture is not in line with my personal beliefs.
1.7 I feel my co-workers are not courteous towards my personal space.
2.1 I feel I am insufficiently remunerated for my current job.
2.2 I feel there is insufficient opportunity in respect to training and development within the organisation.
2.3 I feel there is insufficient career growth opportunities within the organisation.
2.4 I feel there is insufficient support from my co-workers and teams to perform my job effectively.
2.5 I feel there is a lack of ability to act autonomously within the organisation.
2.6 I feel there is a lack of decision making authority within the organisation.
2.7 I feel there is insufficient progress being made regarding diversity and transformation within the organisation.
2.8 I feel that the individual performance rating (merit) process is unfair within the organisation.
2.9 I feel there is a lack of innovative processes within the organisation.
2.10 I feel there is insufficient trust, openness, and transparency within the organisation.
2.11 I feel there is insufficient recognition given within the organisation.

69
2.12 I feel there is insufficient opportunity in regard to coaching and mentoring within the organisation.
3.1 I feel my direct supervisor is abusive towards me. 3.2 I feel my direct supervisor sets unrealistic goals for me. 3.3 I feel there is a lack of support from my direct supervisor.
3.4 I feel my direct supervisor is unethical. 3.5 I feel my direct supervisor micromanages me. 3.6 I feel my direct supervisor performs their role exceptionally.
4.1 I feel there is a lack of trust and confidence in organisational leadership with regard to the stewardship of the organisation.
4.2 I feel that organisational leaders act unfairly. 4.3 I feel that there is a lack of transparency and communication during times of significant organisational change, i.e. informational injustice.
4.4 I feel that organisational leadership is lacking in respect to their Corporate Social Responsibility (CSR), i.e. helping communities in which they serve.
4.5 I feel that organisational leadership promote a sense of openness and fairness and act in the best interest of the organisation.

70
APPENDIX C – CONSTRUCT’S AND ASSOCIATED QUESTIONS
No. Construct Number of Questions Associated Questions
1 Direct Supervisor
6
Q3.1: I feel my direct supervisor is abusive towards me. Q3.2: I feel my direct supervisor sets unrealistic goals for me. Q3.3: I feel there is a lack of support from my direct supervisor. Q3.4: I feel my direct supervisor is unethical. Q3.5: I feel my direct supervisor micromanages me. Q3.6: I feel my direct supervisor performs their role exceptionally.
2 Individualistic Factors 6
Q1.4: My current job (day to day activities) does not motivate me. Q1.5: I feel there is improper utilisation of my skills and abilities in my current job. Q1.6: I feel that the organisational culture is not in line with my personal beliefs. Q2.3: I feel there are insufficient career growth opportunities within the organisation. Q2.9: I feel there is a lack of innovative processes within the organisation. Q2.10: I feel there is insufficient trust, openness, and transparency within the organisation.
3 Organisational Leadership 4
Q4.1: I feel there is a lack of trust and confidence in organisational leadership with regard to the stewardship of the organisation. Q4.2: I feel that organisational leaders act unfairly. Q4.3: I feel that there is a lack of transparency and communication during times of significant organisational change, i.e. informational injustice. Q4.5: I feel that organisational leadership promote a sense of openness and fairness and act in the best interest of the organisation.
4 Organisational Factors 5
Q1.7: I feel my co-workers are not courteous towards my personal space. Q2.2: I feel there is insufficient opportunity in respect to training and development within the organisation. Q2.4: I feel there is insufficient support from my co-workers and teams to perform my job effectively. Q2.11: I feel there is insufficient recognition given within the organisation. Q2.12: I feel there is insufficient opportunity in regard to coaching and mentoring within the organisation.

71
5
Diversity and Transformation 1
Q2.7: I feel there is insufficient progress being made in regard to diversity and transformation within the organisation.
6 Decision Making Authority 2
Q2.5: I feel there is a lack of ability to act autonomously within the organisation. Q2.6: I feel there is a lack of decision making authority within the organisation.
7 Remuneration 1 Q2.1: I feel I am insufficiently remunerated for my current job.
8 Resignation Intention 2
Q1.1: I have considered resigning from my organisation in the past. Q1.2: I currently consider resigning from my organisation.

72
APPENDIX D – CODING OF QUESTIONNAIRE
PART 1 Coding Description
D1 Age
1 31 and younger 2 32 – 47 3 48 – 55 4 56 – 65 5 Older than 65
D2 Gender 1 Male 2 Female
D3 Highest Academic Qualification
1 Grade 12 or lower 2 Certificate or Diploma 3 Bachelor’s Degree 4 Post Graduate Degree 5 Other
D4 Marital Status
1 Single 2 Long term relationship 3 Married 4 Divorced 5 Widowed
D5 Role category
1 Operations 2 Process Implementation 3 Process Optimisation 4 Execution 5 Optimization 6 Specialisation 7 Expertise 8 Leadership 9 Other
D6 Number of years in the
organisation
1 Less than two years 2 3 – 5 Years 3 6 – 9 Years 4 More than ten years
D7 Last merit rating in the organisation
1 X 2 D 3 F 4 E 5 N

73
PART 2 Description Coding
Q1.1 to 4.5 (30 question in total)
Factors leading to employee resignations within a professional
services organisation.
1 to 4
PART 2 - Implemented on a four-point Likert Scale 1 "Strongly Disagree” 2 “Disagree” 3 “Agree” 4 "Strongly Agree”

74
APPENDIX E – LANGUAGE EDITOR’S CERTIFICATE