Factors Influencing The Variability In Social Capital
138
University of Central Florida University of Central Florida STARS STARS Electronic Theses and Dissertations, 2004-2019 2011 Factors Influencing The Variability In Social Capital Factors Influencing The Variability In Social Capital James R. Downing University of Central Florida Part of the Public Affairs, Public Policy and Public Administration Commons Find similar works at: https://stars.library.ucf.edu/etd University of Central Florida Libraries http://library.ucf.edu This Doctoral Dissertation (Open Access) is brought to you for free and open access by STARS. It has been accepted for inclusion in Electronic Theses and Dissertations, 2004-2019 by an authorized administrator of STARS. For more information, please contact [email protected]. STARS Citation STARS Citation Downing, James R., "Factors Influencing The Variability In Social Capital" (2011). Electronic Theses and Dissertations, 2004-2019. 1843. https://stars.library.ucf.edu/etd/1843
Transcript of Factors Influencing The Variability In Social Capital

University of Central Florida University of Central Florida
STARS STARS
Electronic Theses and Dissertations, 2004-2019
2011
Factors Influencing The Variability In Social Capital Factors Influencing The Variability In Social Capital
James R. Downing University of Central Florida
Part of the Public Affairs, Public Policy and Public Administration Commons
Find similar works at: https://stars.library.ucf.edu/etd
University of Central Florida Libraries http://library.ucf.edu
This Doctoral Dissertation (Open Access) is brought to you for free and open access by STARS. It has been accepted
for inclusion in Electronic Theses and Dissertations, 2004-2019 by an authorized administrator of STARS. For more
information, please contact [email protected].
STARS Citation STARS Citation Downing, James R., "Factors Influencing The Variability In Social Capital" (2011). Electronic Theses and Dissertations, 2004-2019. 1843. https://stars.library.ucf.edu/etd/1843
FACTORS INFLUENCING THE VARIABILITY IN SOCIAL CAPITAL
by
JAMES R. DOWNING
BA University of Maryland, 1969
MA Rutgers University, 1978
A dissertation submitted in partial fulfillment of the requirements
for the degree of Doctor of Philosophy
in the College of Health and Public Affairs
in the Department of Public Affairs
at the University of Central Florida
Orlando, Florida
Major Professor: Thomas T. H. Wan

ii
© 2011 James R. Downing
iii
ABSTRACT
This research provides insights into three aspects of social capital: the factors that
influence its variability; its two-dimensional nature; and the relationship between social capital
and membership in a YMCA. These insights have implications for social capital theory, for
public policy, for organizational management and for individual well-being. Most social capital
research treats the construct as a causal variable and analyzes the implications of different levels
of social capital for certain aspects of individual and community well-being. This treatment
implies that levels of social capital vary. Little research has been done to analyze the factors that
cause social capital variability and therefore the understanding of social capital variability lacks
insight. Before social capital variability can be explored, an intermediate issue must be
addressed. Social capital is usually conceived of as a single-dimension construct. In fact social
capital has two dimensions: the attitudes of social capital and the behaviors of social capital.
Unidimensionality is sufficient when social capital is used exogenously but it is insufficiently
nuanced when used for the purpose of recommending policies to increase it. This research
analyzes the two-dimensional nature of social capital. Finally, a number of social capital
behaviors have been studied but membership in the YMCA is not one of them. This research
examines the relationship, ceteris paribus, between membership in the Central Florida YMCA
and individual social capital.
A survey questionnaire was mailed to 10,000 YMCA members in Central Florida and
21,000 residents who were demographically similar. There were 1,881 completed responses.
The results were analyzed using structural equation modeling and were guided by social capital
theory and the theory of reasoned action.

iv
The results of the study indicate that the two most influential factors of social capital
variability are personal educational attainment and the average educational attainment of the
community. The study also confirms that social capital is a two-dimensional construct and the
two dimensions are iterative. The study results also revealed that members of the Central Florida
YMCA had higher levels of social capital ceteris paribus.
This study is significant in four areas: social capital theory, public policy, management of
social capital-generating organizations and for individuals. At the theoretical level, insight has
been gained into both the causes of social capital variability and the two-dimensional nature of
social capital. Regarding public policy, this research provides clear evidence that education
provides a greater role in building a community than simply creating human capital; it also
creates social capital. Both educational institutions and those organizations that create social
capital should be supported. Furthermore, social capital promulgation through public policy
should target both dimensions of social capital to be most effective. For managers of social
capital-generating organizations social capital can be used as a metric for measuring
organizational effectiveness and community impact. For individuals, there is now an evidence-
based approach for developing a life plan for creating personal social capital. This research is
unique because it simultaneously brings insights into four distinct spheres of social capital.

v
ACKNOWLEDGMENTS
The academic journey that has culminated with this dissertation has been long and
challenging. No such journey can be completed without the support of many people and I am
pleased to acknowledge some of those people who were most helpful to me in completing it.
First, an enormous debt of gratitude is owed to Dr. Thomas T. H. Wan, my dissertation
committee chairman. My appreciation for his wisdom, knowledge, guidance, persistence and
patience cannot be overstated. I consider him my teacher, my inspiration and my friend. A debt
of gratitude is also due to Dr. Robert Ford who recommended this academic program to me and
then further assisted me by serving on my dissertation committee. I also thank the other
members of my committee, Dr. Ning Zhang and Dr. Naim Kapucu. Their knowledge and
insights are greatly appreciated. I am honored to be associated with such distinguished
professors.
The data collection for this research was particularly complex and I extend my
appreciation to Dr. Bill Lazarus and Mr. Jason Routman of Seer Analytics, LLC for their
enormous contribution to this research. Thanks also go to Dr. William Burns for his time, his
knowledge and his insights.
Most importantly I thank my wife, Gail, who stood by me and encouraged me throughout
this journey. The sacrifice in completing this dissertation was shared by her and I am deeply
appreciative of her loving support.

vi
TABLE OF CONTENTS
LIST OF FIGURES ........................................................................................................................ x
LIST OF TABLES ......................................................................................................................... xi
CHAPTER ONE: BACKGROUND, ISSUES, RESEARCH QUESTIONS, AND
IMPORTANCE OF RESEARCH....................................................................................... 1
Background ................................................................................................................................. 1
The Issues.................................................................................................................................... 7
Research Questions ..................................................................................................................... 8
Why Is This Important? .............................................................................................................. 9
Summary of Chapter One ......................................................................................................... 13
CHAPTER TWO: LITERATURE REVIEW AND THEORETICAL MODEL ......................... 16
Introduction ............................................................................................................................... 16
What is Social Capital? ............................................................................................................. 17
Is Social Capital Really Capital and Does it Rise and Fall? ..................................................... 19
How has Social Capital‟s Variability been Studied? ................................................................ 21
The Fishbein-Ajzen Model of Attitude and Behavior .............................................................. 23
Social Capital and Behaviors of Association (Participation) .................................................... 26
Formal Group Involvement................................................................................................... 27
Religious Group Involvement ............................................................................................... 28
Giving and Volunteering....................................................................................................... 29
Electoral and Non-electoral Political Participation............................................................... 30
Attitudes of Social Capital ........................................................................................................ 30
Trust ...................................................................................................................................... 30

vii
Other Attitudes of Social Capital .......................................................................................... 32
Community Social Capital ........................................................................................................ 32
Summary of the Literature Review ........................................................................................... 34
The Theoretical Framework ...................................................................................................... 36
Social Capital as a Multi-Dimensional Construct at the Individual Level ........................... 36
Behaviors of Social Capital .................................................................................................. 39
Attitudes of Social Capital .................................................................................................... 42
Social Capital at the Community Level ................................................................................ 44
CHAPTER THREE: RESEARCH METHODOLOGY ............................................................... 47
Research Questions and Hypotheses ........................................................................................ 47
The Variables of the Research and Sources of Data ................................................................. 48
Characteristics of the Community: Exogenous Variables .................................................... 48
Attitudes and Behaviors of Social Capital: Endogenous and Indicator Variables ................ 48
Demographic Variables ........................................................................................................ 49
Sources of the Data ................................................................................................................... 49
Survey Instrument ................................................................................................................. 49
SEER Analytics/Economic and Social Research Institute .................................................... 51
Power Analysis, Sampling and Sample Size ............................................................................ 55
Data Collection ......................................................................................................................... 56
Human Subjects ........................................................................................................................ 57
Statistical Analysis .................................................................................................................... 58
Criteria for Statistical Analysis ................................................................................................. 61
Multicollinearity ................................................................................................................... 61

viii
Significance........................................................................................................................... 62
Factor Loading ...................................................................................................................... 62
Reliability .............................................................................................................................. 63
Goodness of Fit ..................................................................................................................... 63
Summary of Research Methodology ........................................................................................ 64
CHAPTER FOUR: FINDINGS ................................................................................................... 66
Demographic Analysis .............................................................................................................. 66
The Data ................................................................................................................................ 66
Discussion of Demographic Variables ...................................................................................... 69
Univariate Analysis – Exogenous Variables............................................................................. 70
Univariate Analysis – Endogenous Variables/Indicator Variables ....................................... 73
Correlation Analysis and Correlation Matrix ........................................................................... 75
Confirmatory Factor Analysis ................................................................................................... 79
Attitudinal Dimension of Social Capital ................................................................................... 80
Behavioral Dimension of Social Capital................................................................................... 82
Hypothesis Testing.................................................................................................................... 85
Hypotheses One and Two ..................................................................................................... 85
Hypothesis Three .................................................................................................................. 88
Hypothesis Four .................................................................................................................... 93
Discussion of the Findings ........................................................................................................ 95
CHAPTER FIVE: IMPLICATIONS, LIMITATIONS AND RECOMMENDATIONS FOR
FURTHER RESEARCH .................................................................................................. 97
Implications of This Research .................................................................................................. 97
ix
Implications of the Research Findings for Social Capital Theory ........................................ 97
Implications of the Research Findings for Public Policy...................................................... 97
Managerial Implications of the Research Findings .............................................................. 99
Implications of the Research Findings for the Individual ................................................... 100
Limitations of This Research .............................................................................................. 101
Recommendations for Further Research ................................................................................. 101
Contributions........................................................................................................................... 104
APPENDIX A: UCF IRB LETTERS ......................................................................................... 106
APPENDIX B: SURVEY QUESTIONNAIRE .......................................................................... 109
LIST OF REFERENCES ............................................................................................................ 114

x
LIST OF FIGURES
Figure 1: Pictorial Representation of Single-Dimension Social Capital Model ........................... 37
Figure 2: Pictorial Representation of Two-Dimensional Social Capital Model ........................... 39
Figure 3: Theoretical Model, Factors Influencing Social Capital Variability .............................. 46
Figure 4: Questionnaire Disclaimer .............................................................................................. 58
Figure 5: Latent Construct Model of the Attitudinal Dimension of Social Capital ...................... 59
Figure 6: Latent Construct Model of the Behavioral Dimension of Social Capital ...................... 60
Figure 7: Two-Dimensional Social Capital Model ....................................................................... 60
Figure 8: Factors of Social Capital Variability ............................................................................. 61
Figure 9: Attitudinal Dimension of Social Capital: Initial Model ................................................ 81
Figure 10: Attitudinal Dimension of Social Capital: Revised Model ........................................... 81
Figure 11: Behavioral Dimension of Social Capital: Initial Model .............................................. 83
Figure 12: Behavioral Dimension of Social Capital: Revised Model........................................... 84
Figure 13: Two-Dimensional Social Capital Model: Attitudes Influencing Behaviors ............... 86
Figure 14: Two-Dimensional Social Capital Model: Behaviors Influencing Attitudes ............... 88
Figure 15: Factors That Influence Social Capital Variability ....................................................... 89
Figure 16: Factors That Influence Social Capital Variability: Revised ........................................ 91

xi
LIST OF TABLES
Table 1: Definitions of Social Capital .......................................................................................... 18
Table 2: Theoretical Overview of Social Capital ......................................................................... 45
Table 3: Summary of Exogenous Variables and Data Sources .................................................... 52
Table 4: Summary of Endogenous Variables and Data Sources .................................................. 52
Table 5: Summary of Indicator Variables and Data Sources for Attitudinal Dimension of Social
Capital ............................................................................................................................... 53
Table 6: Summary of Indicator Variables and Data Sources for Behavioral Dimension of Social
Capital ............................................................................................................................... 54
Table 7: Summary of Demographic Variables ............................................................................. 54
Table 8: Group Definitions ........................................................................................................... 66
Table 9: Annual Income by Group ............................................................................................... 67
Table 10: Educational Attainment by Group ................................................................................ 67
Table 11: Marital Status by Group................................................................................................ 68
Table 12: Race by Group .............................................................................................................. 68
Table 13: Indicators of the Attitudinal Dimension of Social Capital ........................................... 74
Table 14: Indicators of the Behavioral Dimension of Social Capital ........................................... 75
Table 15: Correlation Matrix for Attitudinal Dimension of Social Capital .................................. 76
Table 16: Correlation Matrix for Behavioral Dimension of Social Capital .................................. 77
Table 17: Correlation Matrix for Exogenous Variables ............................................................... 79
Table 18: Parameter Estimates for the Initial and Revised Models .............................................. 82
Table 19: Goodness of Fit Statistics for Attitudinal Dimension of Social Capital ....................... 82
Table 20: Parameter Estimates for the Initial and Revised Models .............................................. 84

xii
Table 21: Goodness of Fit Statistics for Behavioral Dimension of Social Capital ....................... 85
Table 22: Goodness of Fit Statistics for Two Dimensions of Social Capital ............................... 87
Table 23: Goodness of Fit Statistics for Factors That Influence Social Capital Variability ......... 90
Table 24: Regression Weights: Factors That Influence Social Capital Variability ...................... 90
Table 25: Goodness of Fit Statistics for Factors of Social Capital Variability, Revised .............. 92
Table 26: Regression Weights: Factors That Influence Social Capital Variability, Revised ....... 92
Table 27: Analysis of Variance between Y Members and Non-Y members: Attitudinal
Dimension of Social Capital ............................................................................................. 94
Table 28: Analysis of Variance between Y Members and Non-Y members: Behavioral
Dimension of Social Capital ............................................................................................. 95

1
CHAPTER ONE: BACKGROUND, ISSUES, RESEARCH QUESTIONS, AND
IMPORTANCE OF RESEARCH
Background
Social theorists have conceptualized social capital as a multilevel latent construct to
explain intangible qualities of the human experience that underlie community well-being and
personal happiness. Bourdieu, (1986), Putnam (1995), Coleman, (1988), Cusack, (1999), and
Halpern, (2005) are among the foundational thinkers in this field. Although consensus on the
definition of social capital has not been fully achieved, one of the more commonly used
definitions is “social connections and the attendant norms and trust” (Putnam, 1995 p. 665). The
theory of social capital characterizes individuals with higher levels of social capital as those who
are more educated, affluent and healthy.
However, social capital is not conceptualized simply as an individual construct. It is a
multilevel construct, and individual social capital resides in a community context. Halpern
(2005) devised a typology of social capital that includes a micro level (the individual), a meso
level (the community) and a macro level (a nation). This multilevel typology, or mapping, of
social capital is important because an analysis of the individual‟s social capital is incomplete
without an understanding of its social context. By its nature social capital has meaning only in a
social setting, since it is the analysis of the interconnections and networks in a community that
bring a full understanding of it.
The various research approaches by social capital theorists validate Halpern‟s typology
and its conceptualization as a multilevel construct. Some researchers focus on the individual
level (e. g., Moir, 2004; Podolny & Baron, 1997; Sampson, 1993), others focus on the
community level (e. g., Evans & Syrett, 2007; Ferguson and Mindell, 2007) and still others on
the national level (e. g., Craig, 1993; Putnam, 1993, 2000; Wuthnow, 1994). Just as the theory

2
propounds that individuals with higher levels of social capital have certain positive
characteristics, it also propounds that communities and nations with greater aggregations of
social capital have less poverty, less crime, higher average educational attainment and greater
collective health.
The theory of social capital makes broad and important claims about individuals and the
communities and nations in which they reside. But it can be extended to, or at least associated
with an even greater human goal. Social capital has direct links with reported life satisfaction,
well-being and happiness. Putnam (2001 p. 13), comparing individuals‟ self-assessments of
happiness, “discovered that happiness increases with both their own and their state‟s measure of
social capital.” Bartolini, Bilancini and Pugno (2009) directly link the decline in social capital
in America with a decline there in happiness. Helliwell (2006 p. C34) found that “measures of
social capital, including especially the corollary measures of specific and general trust, have
substantial effects on (individual) well-being beyond those flowing through economic channels.”
Other research (Lelkes, 2005; Powdthaven, 2007) shows a positive relationship between social
relationships and life satisfaction. The interconnection of social capital, happiness and life
satisfaction is significant. Social capital is a tool to measure the degree to which individuals
achieve happiness and thus is a metric for public policy makers to gauge policies and programs
designed to foster individual and community well-being.
Implicit in the definition of social capital, its use as a tool of social science and its
underlying theory, is the concept social capital varies. That is to say, it has levels and the levels
rise and fall. Most researchers (e. g., Coleman, 1988; Field, 2005; Knack, 2002; Putnam, 2000;
Rosenfeld, Messner, & Baumer, 2001) use social capital as an exogenous or causal variable to
analyze the implications of different levels of social capital for certain aspects of individual and

3
community well-being. On the other hand, if social capital itself rises and falls, something must
cause that variability, consequently, social capital can also be conceived of as an endogenous
variable whose variability is caused or influenced by certain factors.
Because social capital is conceptualized as a multilevel construct that is a personal, a
community and a national asset, its extent can rise and fall at all levels. Individuals obtain more
of it by associating with other people and building trust in them through a variety of social
activities. A loss of social capital results from isolation and/or a loss of trust. A community‟s
social capital, which is the aggregation of individual social capital, rises and falls as communities
prosper or decline. Individual, community and national social capital can vary in two ways:
1. A given individual or community can have different levels of social capital at
different times, and
2. Levels of social capital can and do vary between different individuals and different
communities.
Before social capital variability can be analyzed, an intermediate issue must be addressed.
Not only is social capital most often utilized as an exogenous variable, it is usually conceived of
as a single-dimension construct. That is to say, social capital is viewed as a second-order
construct with several elements, for example trust, social involvement and/or reciprocity as first-
order constructs. In fact, social capital has at least two dimensions. These are the
“psychological predisposition, or an attitude, for associative behaviors” and then “the behaviors
of association” themselves. The definition of social capital cited above, “social connections and
the attendant norms and trust” (Putnam, 1995 p. 665) explicitly identifies two dimensions to the
construct. Unidimensionality is sufficient when social capital is used exogenously, but it is
insufficiently nuanced when used endogenously for the ultimate purpose of recommending

4
policies to increase it. Other than an early study by Brehm and Rahn (1997), very little research
has been done that analyzes social capital as a multidimensional construct. Consequently little is
known about the relationship of the attitudinal dimension with the behavioral dimension of social
capital.
The attitudes of social capital are those psychological predispositions that are associated
with, interact with, and perhaps even cause associative behaviors, the behaviors of social capital.
This research will ultimately describe the exact relationship between the attitudes of social
capital and its associative behaviors but a priori an individual is unlikely to associate with
another unless there is a modicum of preexisting trust and a belief that the association will be
beneficial. Hence, attitudes are likely to influence behaviors. Wright (2000), while not directly
referring to social capital per se, characterizes these attitudes in the context of game theory as the
belief in nonzero-sum outcomes. In other words, whether it is a gene, a human being, or any
organism in between, two individuals will interact if they believe that the association will benefit
both parties. Another theorist, McIntosh (2007), refers to the attitudes of social capital as the
intersubjective system. Because this system operates at the subconscious level, it is
unobservable but he argues that it is nonetheless related to behaviors of association. Wright and
McIntosh operate at a more conceptual level than that of social capital theory, but the attitudes of
social capital also have been explored within the context of social capital theory.
In the social capital literature, Brehm and Rahm (1997) were among the earliest
researchers to discuss the attitudes of social capital. One of their hypotheses, subsequently borne
out, was that “variation in social capital can be explained by citizens‟ psychological involvement
with their communities” (p. 999). Many researchers, for example Putnam (1995), Beckman &
Kawachi ((2000), and Sabatini (2006), see only “trust” as an attitude of social capital. However,

5
Brewer (2003) sees trust, altruism, a sense of equality, tolerance and humanitarianism as all
being attitudinal attributes of social capital. Furthermore, Wan and Lin (2003) cite three beliefs
as integral to social capital: (1) a stated belief that people or public programs are helpful, (2) a
belief that one shares a common interest with the community; and (3) a belief by an individual
that he or she benefits from participation in public activities and/or programs. As with many
other aspects of the theory of social capital consensus has not been achieved about the specific
attitudes of social capital and their relationships to each other or to the behaviors of social
capital. Yet theorists and researchers write and speak about social capital as if it were two
dimensional, even though it has not been explicitly shown to be so.
Behaviors of social capital are those observable actions and interactions that exhibit
association with others. These can be behaviors of cooperation with others and/or altruism
toward others, or simply beneficial casual interactions. Such behaviors are numerous and
diverse. Membership and participation in any of the following very different groups could be
considered a behavior of social capital: in a book club, a service, civic or neighborhood
association, a church, a political group, a PTA or a sewing circle. Such are the “social
connections” that Putnam refers to in his definition cited above (1995, p. 665). Even a solitary
activity like voting indicates a connection to the community and an interest in making it better,
which is an indication of social capital (Kusack, 1999; Knack, 2002). From that partial list of
social capital behaviors it is apparent that they can occur in very formal, structured settings or in
loosely structured, informal ones.
Of the two types of social settings, formal groups are more interesting for our purpose
because their structures and social capital delivery techniques can be analyzed and measured.
Broadly speaking, formal groups can be divided into two types: those that create social capital as

6
a byproduct of people coming together for another stated purpose and those whose mission or
purpose focuses specifically on building social capital. Examples of the former are service clubs
like Rotary, Elks, Kiwanis, etc; book clubs; running clubs; card and bingo clubs; bowling
leagues and so forth. Perhaps the best example of the latter is the YMCA (Y).
The mission of the Y varies somewhat from area to area but the mission statement of the
Central Florida YMCA is representative: “The purpose of this Association is to improve the lives
of all in Central Florida by connecting individuals, families and communities with opportunities
based on Christian values that strengthen Spirit, Mind and Body.” Absent the conceptualization
of social capital, a theoretical framework within which to analyze it, and the statistical and
technological tools to measure it, there would be no way to determine whether or not the Y was
achieving its mission. Anecdotal affirmation abounds, but no rigorous technique is available for
comparing different Y‟s across the country or for longitudinal comparisons of the same
association over time. Consequently no research has been done to examine whether the Y
actually creates social capital.
This section has discussed several areas of background. Social capital is a multilevel,
latent construct conceptualized to explain individual happiness and community well-being.
Definitions vary, but Putnam‟s definition of “social connections and the attendant norms and
trust” (1995 p. 665) is commonly accepted. The corpus of social capital research supports the
theory‟s argument that individuals with greater social capital are generally more educated, more
affluent and healthier. Research also shows that higher levels of social capital are associated
with greater reported happiness, life satisfaction and personal well-being. By its nature social
capital varies, therefore the variation is influenced by identifiable factors. Furthermore, it is a
two-dimensional construct comprising the attitudinal dimension of social capital and the

7
behavioral dimension of social capital. Finally, certain organizations purport to build social
capital, and the Y is one. Acquiring social capital is the process for realizing happiness and life
satisfaction. That is why the construct is significant. A number of issues that have been raised
will now be discussed more fully.
The Issues
The nature of social capital is such that it rises and falls. Because it is a multilevel
construct that exists in a social context it can and does vary at the individual level, the
community level and the national level. It varies over time in given individuals and communities
and between similar individuals and communities at a given time. The causes of this variability
have not been well researched; the effort to identify them is the first issue here.
Examining the causes of social capital variability requires that the construct be treated as
an endogenous variable, a treatment that diverges from most social capital research. Most social
capital research treats social capital as an exogenous variable and traces its effects in individuals
and communities, but ignores the causes of social capital itself. Using social capital
endogenously, and ultimately to make policy recommendations, is based on a reductive
conceptualization. It is clear from its definition that social capital has two dimensions: the
attitudes of social capital and the behaviors of social capital. Other than some early work by
Brehm and Rahn (1997), little research has examined the multidimensionality of social capital.
Hence, testing whether social capital is indeed multidimensional is the second issue addressed
here. If social capital is two dimensional, then what is the relationship between those
dimensions? This is the third issue to be addressed.
Beyond the issues of the nature and relationship of the two dimensions of social capital,
each can be reduced to more fundamental elements. For example, among the attitudes of social
8
capital are trust, altruism, and beliefs that participation in groups is beneficial and that other
people and social institutions are helpful. Among the behaviors of social capital are voting, an
interest in and participation in political affairs, and membership and participation in groups,
whether formal or informal. Formal groups can be divided into groups that build social capital
as a byproduct of association to achieve other goals, and groups that specifically state a mission
or purpose to build social capital. Although the Y is one of the latter, no research has been
conducted to test whether the Y is actually achieving its mission or not. That inquiry is the
fourth issue here. For this research groups and organizations will be considered communities
and group-level social capital, organizational-level social capital and community-level social
capital will be considered synonymous.
Research Questions
Four research questions emerge from the issues discussed above. The first two research
questions are both related to the multidimensionality of social capital. At the individual level,
social capital can be characterized as having two dimensions: attitudes, or psychological
predispositions, that are related to social capital and behaviors related to social capital. Since no
research has been done that examines whether social capital is in fact a two-dimensional
construct, the first research question is: Is social capital a two-dimensional construct?
Second, given the demonstration that social capital is a multi-dimensional construct, there
is a relationship between attitudes and behaviors. However, no research has been done in the
social capital context that shows this relationship. The second research question is: What is the
relationship between the attitudinal dimension of social capital and the behavioral dimension of
social capital?

9
The third research question addresses the variability in social capital. Given that social
capital rises and falls, then there must be factors that influence this variability. The third research
question is: What factors influence the variability in social capital?
The fourth research question concerns a specific behavior of social capital; membership
and participation in the Y. Among the behaviors of social capital that will be studied in this
research is participation in formal groups. Some of these formal groups have a mission or purpose
to increase social capital. The Y is such a group. The fourth research question is: Do Y members
have more social capital, ceteris paribus, than non-Y members?
Why Is This Research Important?
The research questions may appear to be unrelated or even disjointed. However, social
capital is a complex construct that touches on a wide range of the human experience. It is
therefore necessary to recognize that since numerous interconnections comprise the construct, a
holistic approach is appropriate for this research which is concerned with those interconnections.
The research questions reflect the interconnections.
A better understanding of these interconnections will not only enrich the theory of social
capital, but also enable social capital to be used more effectively as a tool of public policy. A
number of gaps in such understanding which have been identified and are discussed above, are
addressed by this research with the aim of advancing our understanding of social capital and its
use as a policy tool.
There are thus four specific reasons why this research is important. First, from a
theoretical perspective it will deepen the understanding of the construct of social capital.
Although expanding the theoretical understanding of the social capital construct is important per
se, greater understanding also manifests itself pragmatically. This research is also important

10
because it will provide a basis for the development of a public policy optimization model to
allocate public resources more effectively for strengthening communities. Once the relationships
of the factors that influence social capital are better understood individuals and communities can
better decide how to invest time and money to create and increase social capital. Third, this
research will provide the basis for a management tool to accurately evaluate the performance of
organizations whose mission it is to generate social capital. Fourth, it will help individuals
understand the various ways to build personal social capital within the framework of a particular
lifestyle, a particular belief system, a particular worldview and established life goals. In
summary, this research is important because it will provide insight into social capital at the
theoretical level, the community level, the organizational level and the individual level. Each of
those will now be discussed further.
At the theoretical level, this research, by using social capital as a multi-dimensional
endogenous variable, brings a new approach to conceptualizing and using it. Although
historically the conceptualization of social capital has incorporated both attitudes and behaviors
into its definition, the research to confirm this multidimensionality or to analyze the relationship
between the dimensions has been sparse. The present analysis will bring that theoretical insight.
Additionally, because this research will isolate the relationships between the factors thought to
influence social capital variability, it will clarify those relationships. Finally, previous research
has clearly established that behaviors of association such as membership in organizations and
civic volunteerism reap benefits for individuals in terms of their social capital. Previous research
has examined such behaviors, but not in the context of organizations whose specific purpose is to
build social capital. Doing so here will contribute to the theoretical understanding of social
capital.
11
This research will identify those activities and those organizations that are most effective
in building social capital. At the community level, policy makers can encourage and support
such activities and organizations. The purpose of public policy is to promote individual
happiness through enhanced community well-being. The relationship between community well-
being and social capital has been discussed above. Specific policies -- the identification of which
is not a primary purpose of this research -- can be informed and partially guided by an
understanding of the factors that influence the variability in social capital. This research will
also analyze the iterative relationship between attitudes and behaviors in the creation of social
capital, an analysis that can enable policy makers to implement policies for building social
capital more effectively.
There is another reason why this research is important at the community level. By
identifying those organizations and those activities that are most effective in building social
capital, this research will provide a beginning point for the ultimate development of a model for
best allocating community resources to enhance social capital and improve community well-
being. Now most public policy is reactive to problems in the community, approaching them in a
“silo” fashion. For example, crime is dealt with by hiring more police officers, judges and court
administrators; poverty by food stamps; poor health by free clinics and Medicaid. Social capital
theory argues that those issues are related and could all be improved simultaneously by applying
resources to organizations and programs that build social capital. The contrast between applying
community resources in a “silo” fashion and applying them in a holistic fashion is a key insight
for improving policies to strengthen community well-being. Once the benefits of higher levels
of social capital can be measured and priced, a model for more effective allocation of resources

12
can be developed in which proactively building social capital addresses community problems
that are related to a shortage of social capital.
A model for community wellness optimization will require a means for evaluating
organizations that purport to build social capital. The third reason that this research is important
is that it begins the process of building an evaluation instrument. At present there is no social
capital-based management tool for organizations whose mission or purpose it is to build social
capital, for example the Y or local service clubs to assess their impact and more effectively
manage their missions. Because this research is cross sectional it will only provide data
comparing different organizations at a single point in time. However, for future longitudinal
research this framework can enable comparisons both between different organizations at a given
point in time and between a specific organization at different times. This is key information for
monitoring management performance. Identifying which organizations in a community
contribute the most to building social capital will be an important element in developing a model
for the best allocation of community resources.
Finally, this research is important because of its implications for personal happiness.
Once those behaviors are identified as the keys to accumulating social capital, an individual can
develop a “life plan” to build his or her individual social capital. Those social capital-building
behaviors and activities that resonate with an individual‟s lifestyle preferences and belief system
can be included in that person‟s plan for maximizing happiness. Aside from financial
considerations, should one buy or rent a home? Should one join a church or a service club? Or
both? Should one volunteer, and if so at what? What are the benefits of one set of activities
versus others that compete for time and resources? In addition, to the extent that attitudes can be
self-influenced, individuals can seek to create the proper mindset for success in terms of social
13
capital. Such an approach to life planning and career building, transcending the workplace
encompasses all aspects of a person‟s life. A successful career or life is often thought to be
based on a combination of human capital, i. e. “what one knows” and social capital, i. e. “who
one knows” (Wilson & Musick, 1998). The theory of social capital and, in part, this research can
be useful organizing the “who one knows” part of career and life planning.
This research is important because it will provide insight and guidance in several areas
and in several ways. Theoretical understanding will be deepened, especially by the use of social
capital as an endogenous variable and by its dissection into two dimensions. This enhanced
understanding can guide practical implementation of policies, programs and plans for
accumulating social capital at the community level, the organizational level and the individual
level.
Summary of Chapter One
Social capital is a multilevel, latent construct conceptualized to explain those intangible
qualities of the human experience that underlie personal happiness and community well-being.
One of the more commonly used definitions is “social connections and the attendant norms and
trust” (Putnam, 1995 p. 665). The theory of social capital holds that individuals with higher
levels of social capital are generally more educated, more affluent and healthier. Higher levels
of social capital are also associated with higher levels of reported happiness.
By its nature, social capital varies. It varies between individuals and in a given individual
over time. It also varies between communities, and in a specific community over time. Because
of its connection with happiness and community well-being, it is important to understand the
factors that cause social capital‟s variability so that public policy and individual life plans can be
formulated that foster its formation and growth.

14
In the body of social capital research, social capital has usually been treated as a single-
dimension, exogenous variable. However, for our research purposes social capital will be treated
as a two-dimensional, endogenous variable. The two dimensions are the attitudes of social
capital and the behaviors of social capital. Attitudes of social capital are the psychological
predispositions related to social capital, and the behaviors of social capital are those observable
behaviors of association.
There are many behaviors of social capital, many of which have been researched. One
behavior that has not been researched is membership and participation in the Y. The Y‟s stated
mission is to connect individuals, families and the community. This study examines the extent to
which that mission is being accomplished in Central Florida. If it is shown that Y membership
and participation are associated with higher levels of social capital, the community should
support a greater role for the Y in community affairs.
Four research questions have been identified. The first two are: is social capital a two-
dimensional construct, and if so, what is the relationship between these dimensions? Third, what
are the factors that influence social capital variability? Fourth, do members of the Y have higher
levels of social capital, ceteris paribus?
This research is important for four principal reasons: 1) From a theoretical perspective it
will deepen the understanding of the construct of social capital; 2) At the community level it can
guide public policy and the development of a model for the optimal allocation of public
resources for fostering personal happiness and well-functioning communities; 3) It will provide
the basis for a management instrument to evaluate organizations whose mission is to generate
social capital; 4) It will give individuals insights about the most appropriate ways to build
personal social capital, given a certain lifestyle, a certain belief system and certain life goals.

15
Thus, this research will provide insight about social capital at the theoretical level, the
community level, the organizational level and the individual level.
The issues have been identified and the research questions formulated. The next step is to
conduct a literature review and present the theoretical model that guided the research.

16
CHAPTER TWO: LITERATURE REVIEW AND THEORETICAL MODEL
Introduction
Conceptualization of the construct of social capital is relatively recent and has achieved
popularity in research literature only in the last 20 years or so. Halpern (2005) notes before 1984
there was virtually no research conducted on social capital per se, and that even up to 1995 there
were fewer than 10,000 articles per year published on social capital research. However, by 2003
such research had exploded with almost 300,000 articles per year published, a rate of growth has
continued. The study of social capital is a young but fertile field. Although proliferation of
research has brought many insights, the newness of the field has meant unresolved debates and
lack of consensus about a number of points concerning social capital. The areas where consensus
remains elusive are pointed out in this literature review and discussed.
The methods for social capital research are evolving. Generally social capital research
uses a combination of at least two of the following three elements:
1. Some behavior or behaviors of association that are either indicators of, or caused by
social capital
2. Some attitude or attitudes that are either indicators of or caused by social capital
3. Some community or individual outcome that is caused by or associated with social
capital
Most of the research to date has been structured to show the relationship between 3 by
using 1 and/or 2 as indicators of social capital. Examples of such research abound and include:
social capital and self-reported health (Kim & Kawachi, 2006; Baron-Epel, Weinstein, Haviv-
Mesika, Garty-Sandalon, & Green, 2008; social capital and health service use (Wan & Lin,
2003); social capital and crime (Sampson, Raudebush, & Earls, 1997; Rosenfeld, et al, 2001);
17
social capital and fear of crime (Ferguson & Mindel 2007); social capital and income (Caspi,
Entner-Wright, Moffit, & Silva, 1998; Podolny & Baron, 1997); and social capital and
educational attainment (Boxman, de Graaf & Flap, 1991; Israel, Beaulieu, & Hartless, 2001).
These studies used social capital as an exogenous variable.
Little research, however, has explored factors influencing social capital variability in
context of the community: in other words, using social capital as an endogenous variable.
Moreover, little research has examined the relationship of 1 and 2 above. The case for such an
approach to social capital research is built through this study‟s review of the literature. Review of
the literature also guided development of the theoretical model that guides this study‟s analysis.
The literature review section is divided into eight subsections. The first section explores
the definitions and conceptualizations of social capital and shows how the conceptualization used
in this research is consistent with that being used in the field. The second section discusses the
current notion of social capital as capital. The third section discusses social capital variability.
The fourth section discusses the Fishbein-Ajzen theory of reasoned action, which is applied in
examining the attitudes and behaviors of social capital. The fifth and sixth sections discuss
behaviors of association and the attitudes of social capital, respectively. The seventh section
discusses the community context of social capital, and the last section summarizes the literature
review and clarifies this research in the context of previous studies. The chapter concludes with
the development of the theoretical model.
What Is Social Capital?
Few concepts in social science have burst onto the scene and been disseminated more
rapidly and widely than has the concept of social capital. Although the broad notion of human
association in communities has a long history, the concept of social capital in sociological usage

18
has its roots in the post-World War II era and began to flower in the 1980‟s with the writings of
Bourdieu (1986), Wacquant (Bourdieu and Wacquant, 1992) and Coleman (1988). Putnam
expanded the concept in the social science community in the 1990‟s (1993, 1995) and then for
the general public with his book Bowling Alone: The Collapse and Revival of American
Community (2000).
Social capital has been defined in various though similar ways. Table 1 displays a
sample of these definitions in chronological order.
Table 1: Definitions of Social Capital
Author Definition
Coleman “A variety of different entities, with two elements in common: they all consist
of some aspect of social structures, and they facilitate certain actions of actors .
. . within that structure” (1988, p. 96)
Bourdieu and
Wacquant
“The sum of the resources, actual and virtual, that accrue to an individual or a
group by virtue of possessing a durable network of more or less institutional
relationships of mutual acquaintance and recognition” (1992, p. 119)
Loury “Naturally occurring social relationships among persons which promote or
assist the acquisition of skills and traits valued in the marketplace” (1992, p.
100)
Putnam “Social connections and the attendant norms and trust” (1995, p. 664-5)
Fukuyama The instantiation of norms that permit people to cooperate in groups (1995)
Woolcock “A broad term encompassing the norms and networks facilitating collective
action for mutual benefit” (1998, p. 155)
Schuller,
Baron, and
Field
“Social networks, the reciprocities that arise from them, and the value of these
for achieving mutual goals” (2000, p. 1)
Beckman and
Kawachi
“Levels of trust and norms of reciprocity” (2000, p. 175)
Paldam “In the language of game theory … the excess propensity to play cooperative
solutions in prisoner‟s dilemma games” (2000, p. 629)
Halpern “Those everyday networks, including many of the social customs and bonds
that define them and keep them together” (2006, p. 2)
Sabatini “The set of trust, institutions, social norms, social networks, and organizations
that shape the interactions of actors within a society” (2006)

19
These definitions make it clear that there are two broad views of social capital,
sometimes resident in the same definition, e. g., Putnam (1995) and Sabatini (2006), that are
summarized by Whitham (2007, p.4): “One is the rational view, which identifies social capital as
a resource for individuals created by the rational actions of individuals. The other is the
embeddedness perspective, which focuses on outcomes of social capital for collectivities and the
creation of social capital by collectivities.” Although in some respects these views are two sides
of the same coin, for this research it is the rational view that is more useful.
There are two reasons that the rational view is more useful here. First, the impetus for
this research is the possibility of using its results to develop a policy tool that could improve the
lives of individuals by increasing social capital. The framework for such policy would have to
assume that individuals are rational and will respond to policy stimuli like tax breaks and social
marketing cues to alter their behaviors in ways that build social capital for their own good.
Second, it is the variability of individual social capital that is of interest, and its variability
implies that individuals have already made rational decisions about behaviors of association that
build social capital. If such decisions are simply random, or worse, irrational, then very little
could be said of them. Therefore, an underlying assumption of this research is that the rational
individual functions within a community and is influenced by factors there.
Is Social Capital Really Capital and Does it Rise and Fall?
Social theorists debate the nature of social capital regardless of its use and context.
Capital is defined as the source of benefit or assistance. Is social capital really capital, and does
it rise and fall? Halpern (2005, p. 29), cogently summarizing the debate concludes “that people
do indeed „invest‟ in their social capital just as theory predicts (Glaeser, Laibson & Sacerdote,
2002).” Putnam (2000) also sees social capital as an asset to be invested in: “just as a

20
screwdriver (physical capital) or a college degree (human capital) can increase productivity . . .
so too social contacts affect the productivity of individuals and groups” (p. 19). Finally, Lin
(2007) writes that “Social capital can also be envisioned as investment by individuals in
interpersonal relationships useful in the market” (p. 27). Evans and Syrett (2007) conclude that
“while there is considerable dissent over the view that there are different types of capital (see
Fine, 2001), the view that human, cultural and social capital are forms of capital which share the
characteristics of being productive resources has much support” (p. 58). So, while it is not
indisputable that social capital is capital, for example, see Arrow and Solow (in Dasgupta &
Serageldin, 2000), the preponderance of theorists view it as an asset like economic capital and
human capital.
Given that social capital is an asset like other forms of capital, it must, by its nature, rise
and fall. The nature of capital is a store of value that is ultimately useful for achieving some end.
Niemen et al. (2007) say that “this . . . investment could generate better job <sic>, better
economy, better health, etc.” (p. 407). In fact, the construct would have little research interest or
practical value if it lacked variability. Munasib (2005) concluded that social capital is
accumulated when one is young and depreciates over one‟s lifetime. The rate of depreciation
varies based primarily on education (being slower for educated individuals) even though
educated individuals typically have higher opportunity costs of social capital investment. Even if
the construct is conceptualized as a lubricant to facilitate transaction costs rather than capital
((Paldam & Svendsen, 2000), its level would still vary, much like the oil in ones car. The title of
Putnam‟s book, Bowling Alone: The Collapse and Revival of American Community (2000)
clearly represents social capital as ebbing and flowing.

21
How has Social Capital‟s Variability been Studied?
Considerable research has been conducted on social capital‟s variability in diverse areas
and disciplines. Three of the most studied areas are healthcare, career advancement/personal
income and crime. Social capital‟s variability has been studied at both the community level and
the individual level, but since the focus of this research is at the individual level, the literature
review will cover examples of each area at the individual level.
In healthcare at the individual level, Baron-Epel, Weinstein, Haviv-Mesika, Garty-
Sandalon and Green (2008) compared social capital and self-rated health for Arabs and Jews
living in two communities in Israel. Their broadest conclusion was that Jews living in Israel had
higher social capital scores and higher levels of self-rated health than did Arabs living in Israel.
The authors attributed these differences to a not unexpected lower level of institutional trust
among the Arabs. Kim and Kawachi (2006) measured social capital variability at both the
community level and the individual level relative to self-rated health. They compared eight
groupings of individual-level social capital indicators with self-rated health and found “as
anticipated, the majority of individual-level social capital measures were inversely associated
with fair/poor health” (p. 823). Wan and Lin (2003) compared social capital, health status and
healthcare use of individuals in three ethnic groups in Kazakhstan. Among other findings, they
found that “social capital is directly linked with health status” (p. 163). According to Putnam
(2000, p. 326) “of all the domains in which I have traced the consequences of social capital, in
none is the importance of social connectedness so well established as in the case of health and
well-being.” All these studies found that high levels of individual social capital result in better
health and well-being.
Research has also linked the variability of individual social capital to career advancement
and personal income. Trust is a fundamental component of social capital, and both trusting and
22
being trustworthy are manifested in networking which is closely related to career advancement
and personal income. Podolny and Baron (1997) related career advancement to the number of
contacts an employee has: the more contacts, the more career advancement. It‟s not only internal
company networking that pays dividends, establishing networks outside an employee‟s company
also is related to career advancement (Boxman, de Graaf & Flap, 1991). Just being acquainted
with a large number of people, however, is not enough to spur career growth; the ability to
garner their trust is also needed (Burrough & Helyar, 1991). For entrepreneurs, research has
shown that a company obtains more attractive financing from its bank if the directors know the
bank‟s managers (Uzzi, 1999). Similarly, founders of technology companies have greater
success in raising venture capital if they have established relationships of trust with venture
capitalists (Shane & Stuart, 2002). It is clear that individuals with more social capital, whether
they are building a career in a large organization or their own organization, will have more
success. To reiterate, this research doesn‟t distinguish between a group, an organization and a
community.
Much of the early work into the relationship between crime and social capital was done
by Sampson and colleagues (Sampson & Laub, 1993; Sampson, Raudebush & Earls, 1997).
Sampson and Laub (1993) studied 1000 young men, some of whom had committed crimes but
had subsequently desisted, some of whom had committed crimes and were leading a life of
crime, and some of whom who had never committed a crime. This landmark study concluded
that informal social control and societal norm internalization are far more influential factors in
keeping young men from committing crime than is the threat of imprisonment or other legal
sanctions. They also found that the youth offenders who subsequently established social ties
were much more likely to desist from crime. D. J. Smith (1995, p. 430 as quoted in Halpern,

23
2005, p. 115), supported those conclusions, finding that “the formation of social bonds may turn
out to be the central explanation for desistance from crime after adolescence.” This body of
research makes it clear that young people who have more social capital are less likely to commit
crimes, and those who have committed crimes but then increased their social capital, either on
their own or through intervention, are less likely to commit additional crimes.
The Fishbein-Ajzen Model of Attitude and Behavior
Social capital is conceptualized in this research as a two-dimensional construct consisting
of interacting attitudes and behaviors. The basis for this conceptualization is twofold. It is based
in part on the grouping of the components of social capital as used by Kim and Kawachi (2006)
in the Social Capital Community Benchmark Survey, and also on the Fishbein-Ajzen (1975,
1980) theory of reasoned action. Kim and Kawachi‟s work was discussed above.
The theory of reasoned action originated in the field of mass communications, especially
persuasive communications, as an attempt to better explain and then to affect consumer behavior.
Fishbein and Ajzen argued that the traditional theories of attitude and behavior have two
fundamental flaws. The first problem is that the psychological predisposition or attitude to
behave has been insufficiently parsed to allow for a thorough explanation of the connection
between attitude and behaviors. According to Bright, Manfredo and Bath, (1993) Fishbein and
Ajzen addressed that problem by “making a clear distinction between beliefs, attitude, subjective
norms, behavioral intention and behavior” (p. 265). The importance of their distinctions for
public policy affecting social capital is that it may be more expedient to try to change the public
attitudes that result in behaviors than to try to address behaviors only. By conceptualizing social
capital as two-dimensional the results of this research will provide guidance in this area.

24
The second problem with traditional behavior models addressed by the theory of
reasoned action is that traditional theories viewed the receiver simply as a passive listener to
messages whereas Fishbein and Ajzen argue that the receiver is a rational interpreter of
messages. They assumed “that individuals process information in a systematic manner rather
than as passive receivers” (Bright et al. 1993, p. 265). The Fishbein-Ajzen theory of reasoned
action assumes that an individual‟s behavior is driven by three interacting components of his or
her attitude: beliefs and knowledge about a certain behavior and its consequences, norms, and
behavioral intention. As discussed in the definitions section, social capital is viewed as a rational
activity that incorporates beliefs, norms and intentions.
To a great extent the theory of social capital remains in the “traditional”
conceptualization: attitudes and behaviors are treated indiscriminately and little research has
been done on the factors that cause social capital to vary. This traditional, one-dimensional
conceptualization is adequate for a causal or exogenous variable, but is inadequate when social
capital is used as an endogenous variable. Viewing social capital in the context of the Fishbein-
Ajzen theory of reasoned action refines the construct so that it can provide guidance for
maintaining and increasing individual social capital, enabling separate examinations of the
attitudes of social capital and the behaviors of social capital. It is the connection between
attitudes and behaviors in social capital that this research seeks to clarify.
The theory of reasoned action has been shown to predict behavior in a wide range of
activities, including behaviors of social capital, albeit with a certain set of caveats. Sheppard,
Hartwick, and Warshaw (1988) state that such a theory “will predict the performance of any
voluntary act, unless intent changes prior to performance or unless the intention measure does
not correspond to the behavioral criterion in terms of action, target, context, time-frame and/or

25
specificity (p. 325, italics theirs). Sheppard et al. (1988) found that the theory of reasoned action
does not predict very well in certain circumstances, for example when the behavior “is not
completely under the subject‟s control” (p. 325) or when the subject is assessed before having all
the necessary information to form an intention. However, for a wide range of voluntary
behaviors for which an actor has sufficient knowledge to act, the theory has proven valid.
Among the behaviors that have been researched using the theory of reasoned action are:
marijuana use among adolescents (Zhao, Sayeed, Hornik, Fishbein, & Ahern, 2006); condom use
and HIV prevention (Rhodes, Stein, Fishbein, Goldstein, & Rotheram-Borus, 2007; Ewald &
Roberts, 1985) and consumer behavior (Brinberg & Durand, 1983; Miniard, Obermiller, & Page,
1982).
Social capital behaviors of association fall within the parameters outlined by Sheppard et
al (1988), the theory of reasoned action framework has been used as the framework for
predicting them. Warshaw and Davis (1984, 1985) used the theory to predict such activities as
going to a campus or dormitory pub, going out with friends, conversing with a stranger and
going to a party. Ajzen, Timken and White (1982) used the theory to predict voting in a
presidential election, and Brinberg (1979) used it to predict church attendance.
A more recent application of the theory of reasoned action to social capital explored the
relationship between the attitudinal factors of trust and reciprocity, and behavior in the Trust and
Dictator Game (Farina, O‟Higgins, & Sbriglia, 2008). These authors found that in this setting
the theory was more useful in explaining behavior after it occurred than in predicting behavior.
It is difficult to ascertain how applicable this study‟s findings are to a less controlled and
contrived setting. The important point is that other researchers are now conceptualizing social
capital, in both a field and laboratory settings, with the same approach as this research.

26
To summarize, the connection between the theory of reasoned action and the theory of
social capital is as follows. The theory of reasoned action was originally developed to explain
consumer behavior in the field of mass communication and consumer attitudes and behaviors.
Subsequent research has shown that social capital attitudes and behaviors are no different than
consumer attitudes and behaviors when analyzed using the theory of reasoned action. The
underlying assumption of this research is therefore that social behavior is no different than
consumer behavior, and hence social marketing can be as effective as consumer marketing in
altering behavior. The theory of reasoned action is appropriate for this research.
Social Capital and Behaviors of Association (Participation)
The necessary condition for social capital is human association, whether it is called social
interaction, civic engagement, formal or informal group involvement, networks or voluntary
association. People need other people to be fulfilled. The opportunities for association are
almost unlimited, ranging from large, formal organizations like governments and churches to
small, informal groups like book clubs and poker clubs.
As discussed above, Kim and Kawachi (2006), using the Social Capital Benchmark
Survey as a guide, has grouped behaviors of association into seven categories: informal social
interaction, formal group involvement, religious group involvement, giving and volunteering,
diversity of friendships, electoral political participation and non-electoral political participation.
This research examines formal group involvement, religious group involvement, volunteering
and donating money, and participation in political affairs. Each of these groups of behaviors is
discussed below.

27
Formal Group Involvement
Studies have examined the relationships between social capital and various kinds of civic,
professional, service and political associations. In the area of industry associations, what Putnam
(2000) would call professional associations, Petrusevich (2005) concluded that the new media
industry association in Vancouver generated social capital in its industry and by extension in the
Vancouver community. Neighborhood associations have also been shown to generate social
capital. Smith (2006) has shown not that neighborhood associations do build social capital, but
that certain association structures and better leadership skills are more effective than certain
other structures and then weak leadership. Regarding political associations, Dolence (2006)
concluded that, in mobilizing people to ward off despotism, political associations are more
effective than social associations, in contrast to Putnam‟s findings (2000). While that finding
isn‟t evidence of social capital generation per se, nevertheless cooperatively achieving goals is
evidence of social capital. Finally, Moir (2004) researched the effects on women business
leaders of belonging to the Rotary Club and concluded that the Rotary is a powerful vehicle to
build and sustain social capital for women. Rotary had traditionally not included women; by
accepting them the organization became a more effective generator of social capital. From just
these few examples it is clear that a number of different kinds of associations build social capital
which supports the overall social capital theory.
Kim and Kawachi subdivide formal group involvement into professional, trade, farm or
business associations, and neighborhood associations. Putnam (2000) argues that the evidence
for the decline in social capital is the decline in membership in civic and professional
associations, thus applying slightly different subdivisions of formal group involvement. He
identifies 41 such organizations (p. 438-439). Although membership in every one has declined,
precipitously in some cases, many still are fertile ground for social capital. Nevertheless, a new

28
model for civic association is clearly needed. As discussed above, the Y is attempting to re-
engineer itself into such an entity.
As it is structured and managed in Central Florida, with an emphasis on networking,
volunteerism, health, families and communities, the Y takes on many of the aspects of Kim and
Kawachi‟s and Putnam‟s formal groups. This is a relatively new role for the Y. Consequently
the entire corpus of research on the YMCA across America has consisted of program evaluation.
The YMCA‟s wide range of programs that includes after-school programs, child and adult fitness
and nutrition programs, character development programs and youth development and leadership
programs. The programs probably benefit participants to a greater or lesser extent; furthermore,
many probably also build their social capital. What is germane to this study, however, is that no
research has been done to show the relationship between Y membership or participation in Y
programs and building social capital. Because the Y brings opportunities for association,
volunteerism and improved health, which are all elements of social capital, it is reasonable to
expect that members of the Y will have greater social capital.
Religious Group Involvement
In America, by far the most prevalent of Kim and Kawachi‟s behaviors of association is
religious group membership in churches, synagogues, mosques or other houses of worship. Such
groups have two roles in society: they provide a means for people to worship, seek understanding
of, commune with, and seek guidance in serving a deity; and they build social capital by
providing opportunities for association. In addition to the opportunities to gather for worship
services, there are opportunities to join with others in service projects, choir practice, Bible,
Torah or Koran study, and so forth. Research has confirmed the role of churches as a factor in
social capital.
29
Putnam (2000) says that “American churches over the centuries have been incredibly
robust social institutions” (p. 65). The DDB Needham Life Style surveys consistently show that
“religious importance” is the most important predictor of people joining clubs and entertaining at
home. The Roper Social and Political Trends survey confirms the importance of religious
affiliation for civic engagement. The European Values Studies, which include the US and
Canada, conclude that religious participation is associated with volunteering at twice the rate of
those who rarely participate in religious activities (Greeley, 1997; Halman & Petterson, 2001).
Two other studies have also confirmed the connection between religious participation and
volunteering (Becker & Edgell, 2001; Lam, 2000). It is clear that religious participation is a
significant contributor both to social capital and to other behaviors of association.
Giving and Volunteering
Donating time and money has been shown to be related to levels of social capital. As
noted above, Kim and Kawachi (2006) identify giving and volunteering as one of the seven
behaviors of social capital, not surprisingly since in many ways that is an extension of
membership in clubs and religious organizations. In other words, people form groups and then
support them with time and money. In fact, Bekkers (2001) found that those who gave the most
time to charitable causes also donated the most money, in contradiction of some expectations
that one donation would compensate for the other.
The connection between social capital and volunteering is well documented. Lofland
(1996) found that volunteers differed from those who didn‟t volunteer by virtue of their
extensive networks. McPherson, Popielarz and Drobnic (1992) found a direct correlation
between the size of a person‟s social network and that person‟s likelihood of joining a volunteer
association. Research has also inquired as to why people with more social contacts volunteer;

30
Pearce (1993) argues that a combination of becoming aware of such opportunities through social
interaction combines with a degree of norm internalization. Laumann (1973) found that people
with more friends conform to group norms, and that one of the norms of people with numerous
friends is volunteerism. Wilson and Musick (1998) concluded that when human capital and
social capital are separated out for people who volunteer, that social capital is the stronger
impetus.
Electoral and Non-electoral Political Participation
Political participation is a factor in social capital variability that comes in several forms.
Since the manifestation of social capital is the mobilization of individuals to achieve common
ends, it is consistent with social capital theory that high social capital is related to political
participation and good governance. Putnam‟s early work (1993), which examined social capital
and government efficacy in Italy, ties social capital or patterns of trust with voting, political
participation and efficient government. Subsequent research that tested the applicability of
Putnam‟s findings have shown them to be duplicated in Germany (Cusack, 1999), the US
(Knack, 2002) and India (Rossel, 2002) among others.
Attitudes of Social Capital
Trust
Kim and Kawachi (2006) denote trust as the fundamental attitudinal or psychological
component of social capital. Every definition of social capital includes trust, either explicitly or
implicitly, i. e. networks and shared norms that can exist only in an environment of trust. When
Putnam (2000) argues that the American community is declining, he is implying that the trust

31
Americans have in each other and in American institutions is declining. Among other things, he
cites the proliferation of lawyers to formalize interactions to demonstrate that decline (p. 145).
Webster‟s dictionary (1984) defines trust as “a firm belief or confidence in the honesty,
integrity, reliability, justice, etc of another person or thing.” Ostrom and Ahn (2003), drawing on
Gambetta (2000), define trust as “a particular level of the subjective probability with which an
agent assesses that another agent or group of agents will perform a particular task” (p. xvi).
Reduced to its component parts, trust is: 1) a psychological disposition or attitude of a belief
holder 2) about another entity that 3) can be either a person or a thing. The “thing” could be an
institution, an organization or government. The intertwined nature of trust, faith and belief is
shown by the fact that there is only one Hebrew word, emuna, for all three concepts. The
connotation, then, of trust has a benign element: to trust someone is to believe in them and to
have faith in them to do right. Thus, the composite definition of trust is:
1. A psychological disposition or attitude of a belief holder
2. About another entity
3. That can be a person, institution, or government
4. That will cooperate or reciprocate with the belief holder to their mutual benefit
The research literature debates the relationship between trust and social capital.
Although a full treatment of trust is inappropriate for this research, the debate can be briefly
summarized: Some theorists believe that trust is the bedrock of social capital. Paldam and
Svendsen (2000) define social capital as “the density of trust existing within a group” (p. 342).
Kawachi and Kim (2006), as noted above, include trust as the only non-behavioral indicator of
social capital. Subramanian, Kim and Kawachi (2002), by isolating trust and reported health
status, found a direct relationship between individuals with high levels of trust and those who

32
reported better health. Reeskens and Hooghe (2008) contend that “generalized trust features as
the most prominent attitudinal element of social capital” (p. 515). On the other hand, some
theorists believe that trust is an outcome of social capital (Woolcock, 2001) viewing social
capital more in behavioral terms as a density of networks. Field (2003, p. 64) argues that “trust
is not a necessary consequence of shared norms and strong networks and that it is best treated as
a consequence rather than an integral component of social capital” (p. 65). Finally, Cote and
Healy (2001) see trust as both a fundamental component of social capital and its consequence.
The theoretical model for this research treats social capital as both a component and consequence
and should shed light on the relationship.
Other Attitudes of Social Capital
Although many theorists argue that trust is a sufficient indicator of social capital from an
attitudinal standpoint, a number of components of the attitude of social capital are related to trust
but distinct from it. Wan and Lin (2003) note three: 1) a stated belief that people or public
programs are helpful; 2) sharing a common interest with the community; and 3) a belief that
participation in public activities or programs is beneficial. Field (2003) also sees a stated
willingness to cooperate with others as yet another indicator of social capital.
Community Social Capital
Halpern (2005), Putnam (2000) and others have argued persuasively that social capital is
a multilevel construct that resides at the individual level, the community level and the national
level. This multilevel characteristic underlies all social capital research, but each researcher
focuses on the levels appropriate to the research questions. This research examines the forces
and interactions of social capital at the individual level within the context of the community.

33
According to Helliwell and Putnam (1995, p. 295), “education is usually the most
important predictor of political and social engagement.” “It is a well-established fact that each
additional year of education increases the propensity of an individual to become involved in
community affairs” (Hall, 2002, p. 35). Coleman (1988), in his study of Catholic schools in
America, was the first to show that community social capital is instrumental in a child‟s
education. He postulated a notion he called “closure,” which he defined as parent-to-parent
connectivity. He found that children‟s education outcomes were related to more closure in the
community. Coleman‟s findings were supported by Bryk, Lee & Holland (1993) and Langbein
& Bess (2002). Teachman, Paasch & Carver (1996, 1997) determined that dropout rates were
lower in Catholic schools than in public schools ceteris paribus. The author‟s give two reasons
for this: greater parent-school connectivity and low residential mobility among families whose
children attend Catholic schools. The relationship between education and neighborhood social
capital was further demonstrated by Ainsworth (2002) and Sun (1998). The research confirms a
strong association between education and community social capital.
Considerable research has focused on community-level social capital, well-being and
self-reported health. A landmark series of studies concluded that higher mortality rates, lower
self-reported health and poorer health are all related to living in areas of income inequality (i. e.
low income) and low social capital (Kawachi, Kennedy, Lochner & Prothrow-Smith, 1997;
Kawachi, Kennedy & Glass, 1999; Subramanian, Kim & Kawachi, 2002). The latter research
team also found that the “community” could be extended to a US state and that community-level
differences in social capital affected individual social capital and well-being (Subramanian,
Kawachi & Kennedy, 2001). Ellaway and Macintyre (2000) found that “an individual‟s level of
health is not associated with whether or not he or she belongs to a local association, but it is
34
associated with aggregate levels of participation” (p. 988). In short, when it comes to health and
wellness, community-level factors play a significant role. It does matter where you live.
Home ownership and income have also been shown to be related to the development of
social capital. DiPasquale and Glaeser (1998) found that home ownership contributed to social
capital in two ways: home owners tended to invest more in social capital, and home ownership
reduced mobility. In other words, duration of residence plays a role in social capital, and home
ownership encourages stability. Income has been shown to be a factor of social capital as well.
In addition to the obvious fact that personal income enables the material comfort, healthcare and
sustenance for well-being, income also enables association and cooperation (Marmot, 2002).
Costa and Kahn (2001), researching the decline of social capital in America, found that the major
source of its decline outside the home is the rise in income inequality. Even in rural Tanzania,
household incomes depend on community social capital to a greater extent than on household
social capital (Narayan and Pritchett, 1997).
It is clear from previous research that social capital at the community level has a
powerful influence on social capital at the individual level, and in some cases being more in
terms of an individual‟s well-being. Exploring and analyzing the relationships between the
factors of community social capital and individual social capital is the aim of this analysis.
Summary of the Literature Review
This literature review has served three purposes. First, it has identified three neglected
areas in the corpus of social capital research: 1) the causes of social capital variability, 2) the
conceptualization of social capital as a two-dimensional construct, and 3) the impact of Y
membership on social capital. Second, the review has placed this research in the context of
previous research. Third, it has provided a guide for the development of a theoretical model to

35
guide the analysis. Because most social capital research has studied the effects of social capital
rather than social capital per se, this research differs structurally from most previous research.
Nevertheless the literature review has shown ample support for both this approach and its
structure.
Social capital is a multilevel, latent construct conceptualized to explain certain intangible
qualities of human social experience. The term “social capital” to describe this construct is an
attempt by modern social theorists to capture several of its characteristics simultaneously. First,
it is an asset, much like economic capital, financial capital, cultural capital and human capital.
Second, as an asset it is beneficial in facilitating group actions that its possessor deems useful or
valuable. Third, social capital is not static; its level can increase or decrease. The contemporary
construct rests on a solid historical and philosophical foundation tracing to ancient Greece but it
has been refined by modern theorists and research techniques to enable its use in social policy.
Because the study of social capital, a complex and somewhat ambiguous construct, is
relatively young, debate about it continues among researchers. This review has elucidated the
contending points of view in the disputed areas and has presented and defended the positions
taken in this research. The review began by exploring the definitions and conceptualizations of
social capital and then showed how the conceptualization used in this research is based on sound,
albeit not fully agreed upon precedent. Current views of social capital as capital were presented.
Then, given the precedent for viewing social capital as capital, research into its variability was
discussed. With the stage set for presenting the nature and structure of this research, the
theoretical model was introduced in the context of previous research. Included in that discussion
was the rationale for using a two-dimensional conceptualization of social capital; both behavioral
and attitudinal dimensions. Finally, the previous research on community-level social capital was

36
discussed, and the factors that comprise it at the community level were introduced. In summary,
while consensus is lacking in many areas of social capital, the literature supports and informs this
study‟s research approach. The theoretical framework to guide this research will now be
presented.
The Theoretical Framework
A theoretical model guides this research. The model is based on the issues raised in
Chapter One, on research questions formulated to address those issues and on the literature
review that puts this research in context. The model has three components: the attitudinal
dimension of social capital and the behavioral dimension of social capital, which are used as
indicators of social capital, and the factors that influence social capital‟s variability. Much of the
research on social capital, including this research, uses structural equation modeling (SEM) as its
analytical tool; all the models in this study will use SEM structure and notation. The model was
constructed step by step. First sub-models of the attitudes and behaviors of social capital were
constructed, and then these were positioned in the overall theoretical model that includes the
influencing factors of social capital.
Social Capital as a Multi-Dimensional Construct at the Individual Level
The most widely used survey instrument of social capital is the Social Capital
Community Benchmark Survey (SCBS) (http://www.ropercenter.uconn.edu/). It has been used
in 40 US states and a number of European countries to generate books and articles showing the
relationship between social capital and a wide range of social phenomena. (For an extensive
though undoubtedly incomplete list see

37
http://www.hks.harvard.edu/saguaro/pdfs/SCBSpapers0108.) The SCBS and the body of work it
has generated use social capital as a monolithic, single-dimension, exogenous variable.
Figure 1 is a pictorial representation of social capital as a single-dimension construct with
Y1, Y2, Y3, Y4, Y5 and Y6 each representing either an attitude of social capital or a behavior of
social capital. For example, attitudes of social capital could be represented by Y1, trust in one‟s
neighbors, Y2, a belief that participating in a neighborhood association benefits oneself and Y3,
a belief that other people are helpful. Examples of behaviors of social capital could be Y4,
belonging to a church, Y5 voting regularly and Y6 belonging to a service club. These are all
behaviors of social capital.
Social Capital
Y1
Y2
Y3
Y4
Y5
Y6
Figure 1: Pictorial Representation of Single-Dimension Social Capital Model
However, when social capital is used as an endogenous variable for the purposes of
understanding the causes of its variability and proposing policies to increase it, its single-

38
dimension conceptualization is inadequate. Informed by the Fishbein-Ajzen theory of reasoned
action (Fishbein & Ajzen 1975, 1980), a two-dimensional conceptualization of social capital is
more appropriate and useful for our purposes. Figure 2 is a pictorial representation of social
capital as a two-dimensional construct, based on the Fishbein-Ajzen theory of reasoned action.
Portrayal of social capital in this fashion begs two questions. First, does this represent
the complete construct of social capital? In other words do the parts of the whole equal the
whole? Second, when social capital is disaggregated do the parts act in the same way as the
whole? As for the first question, assuming that the variables Y1 through Y6 represent the
complete construct then grouping them in two dimensions should not alter that representation.
Regarding the second question, this is a theoretical representation. The analytical model, of
which this is a part, is constructed to minimize any difference in behavior between the one-
dimension and two-dimensional models of social capital. While there is a risk that there still
might be a difference between the two models, that risk is outweighed by the benefits of
disaggregation for the purpose of more careful analysis of the components of social capital. This
research assumes that the two methods of modeling social capital will yield the same results and
appropriate analysis has been done to minimize the risk.
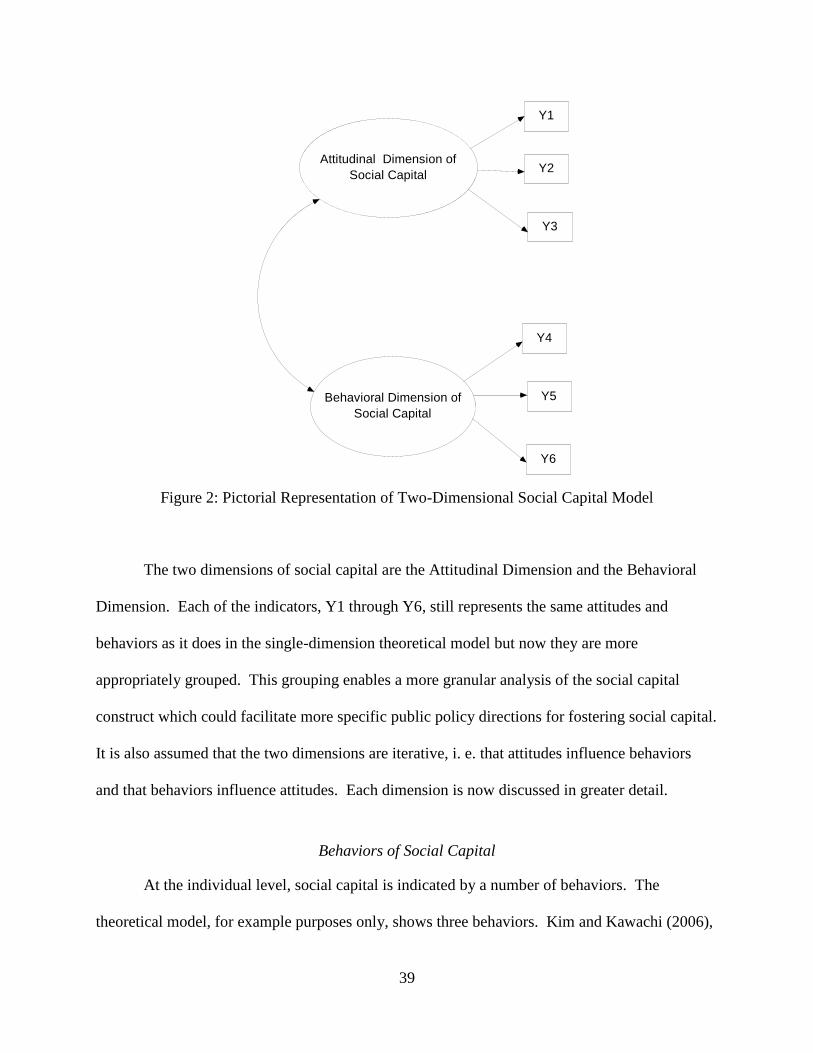
39
Attitudinal Dimension of
Social Capital
Y1
Behavioral Dimension of
Social Capital
Y2
Y3
Y5
Y6
Y4
Figure 2: Pictorial Representation of Two-Dimensional Social Capital Model
The two dimensions of social capital are the Attitudinal Dimension and the Behavioral
Dimension. Each of the indicators, Y1 through Y6, still represents the same attitudes and
behaviors as it does in the single-dimension theoretical model but now they are more
appropriately grouped. This grouping enables a more granular analysis of the social capital
construct which could facilitate more specific public policy directions for fostering social capital.
It is also assumed that the two dimensions are iterative, i. e. that attitudes influence behaviors
and that behaviors influence attitudes. Each dimension is now discussed in greater detail.
Behaviors of Social Capital
At the individual level, social capital is indicated by a number of behaviors. The
theoretical model, for example purposes only, shows three behaviors. Kim and Kawachi (2006),

40
using the Social Capital Benchmark Survey as their guide, provide insights about reducing social
capital to its fundamental elements. They group behaviors of social capital into seven broad
categories:
1. Informal social interactions
2. Formal group involvement
3. Religious group involvement
4. Giving and volunteering
5. Diversity of friendships
6. Electoral political participation
7. Non- electoral participation
Although each of these behavior groups comprises numerous specific behaviors, the
common thread running through all of them is association with other people. That is the
fundamental element of the behaviors that indicate social capital. Examples of specific
behaviors of social capital are “socializing in friends‟ homes,” “membership in professional,
trade or business associations,” “church attendance,” “volunteering and donating money,”
“voting” and “participation in a labor union.” These behaviors can be called personal behaviors
that both indicate and build social capital.
Of all the behaviors that clearly are associational, e. g., church membership, club
membership, etc, one has not been studied: membership and participation in the Y. The Y sees
its role as a catalyst for improving the lives of citizens in its market area. It is one of those
community organizations that, as discussed above exist solely to build social capital. It does so
through physical fitness programs, volunteer opportunities, youth programs and fellowship.

41
The mission of the Y reflects its focus on building social capital. Although the mission
varies somewhat from community to community, the mission of the Central Florida Y is
representative. “The purpose of this Association is to improve the lives of all in Central Florida
by connecting individuals, families and communities with opportunities based on Christian
values that strengthen Spirit, Mind and Body.” The word “connecting” is the operative word for
building social capital. The mission also reflects the multilevel nature of social capital. While
bold and far-reaching, even audacious, the mission has two fundamental problems. The first
problem is the definition of what it means to “improve lives,” and the second problem is how to
measure that. Social capital theory and this research can address both issues.
The influence of Y‟s varies across America but in the relatively small geographic
footprint of Central Florida it is substantial, with twenty five family centers, dozens of after-
school programs and numerous other programs for youth, families and senior citizens. Central
Florida comprises the city of Orlando as the hub and includes Orange, Seminole, Osceola,
Brevard, Lake and Marion Counties. Approximately two million people live there. The density
of the Y presence in Central Florida makes it an ideal place to research the Y‟s impact on social
capital. One could expect the impact on individuals to be about the same in every community
that the Y serves, but its greater density in Central Florida may allow for inferences about social
capital at the community level as well.
To summarize this section: the behaviors of social capital, which are numerous and
diverse, have been grouped into seven categories by Kim and Kawachi (2006). Although
diverse, such behaviors have the common characteristic of organized association with other
people. Although many of these behaviors have been studied, one that has not been is
membership and participation in the Y. Yet this particular behavior meets the criterion of
42
association, and the Y‟s mission is to promote social capital-building behavior. The other
dimension of social capital at the individual level is the attitudes of social capital.
Attitudes of Social Capital
Attitudes are the psychological predispositions that impel individuals to behave in certain
ways. The Fishbein and Ajzen (1975, 1980) theory of reasoned action argues that actions are
always preceded by attitudes. The actions then interact with attitudes and modify them through
learning, which then modifies behavior. This iterative pattern continues.
In the context of social capital the theory of reasoned action would operate as follows.
Wright (2000) argues that people have an innate belief that trusting other people can be
beneficial. This modicum of trust causes people to associate. Social capital theory argues that
more often than not this associative behavior does indeed benefit people, and the benefit affirms
the attitude of trust. This higher level of trust leads to more associative behavior, and thus the
process of building social capital continues. Loss of social capital works in the opposite fashion.
Confirmation of this theoretical description of the relationship between the attitudes of social
capital and the behaviors of social capital is one of the purposes of this research.
Just as the behaviors of social capital were grouped, the attitudes of social capital can also
be grouped. In addition to the seven groups of behaviors of social capital, Kim and Kawachi
(2006) describe an attitude of social capital they call Social Trust, which they subdivide into two
broad types of trust: general interpersonal trust, i. e. trust in people in general, and specific trust,
which is related to specific individuals or to classes of individuals, e. g., trust in fellow church
members, co-workers, etc.
Another dimension of trust, sometimes considered an aspect of general interpersonal trust
but which is not specifically noted by Kim and Kawachi, is institutional trust. Institutional trust
43
is trust in “the system,” i. e. the trust in political or government institutions, the military, the
media, organized religion, the education system and so forth (Cook and Gronke, 2001). Trust,
then, can be conceptualized as having at least three different levels: institutional trust, trust in
people in general and trust in specific people or specific classes of people.
Although trust is the bedrock of social capital, other attitudes also have been theorized to
be related to it. Wan & Lin (2003) have shown that social capital is indicated by a stated belief
that people or public programs are helpful and by a belief that participation in public activities or
programs is beneficial. In addition, Field (2003) sees a stated willingness to cooperate with
others as an attitude of social capital.
The theory of reasoned action informs us that attitudes influence behavior and then, in an
iterative fashion, behaviors influence attitudes. The iterations continue as knowledge and
experience interact to affect attitudes and behaviors. Similarly, the attitudes of social capital
influence behaviors of social capital and conversely these behaviors influence the attitudes of
social capital. Attitudes of social capital are those psychological predispositions that are related
to and probably initially cause the behaviors of social capital. These attitudes are complex and
nuanced, but can be broadly grouped into three interrelated clusters. The first cluster is trust
which is the bedrock of social capital and which can be subdivided into three different but related
concepts. The second cluster is beliefs about the helpfulness of association and participation in
groups. The third cluster is a belief that certain kinds of associative behaviors are beneficial.
Together these clusters comprise the attitudinal dimension of social capital.
In the context of structural equation modeling, behaviors and attitudes of social capital
are the indicators of individual social capital. The level of individual social capital varies, both
over the life of an individual and between individuals. Some of the variation is probably
44
connected to the interplay of attitudes and behavior, but most of the variation, as hypothesized in
this research, is caused by community levels of social capital. Regardless of the relationship of
attitudes and behaviors of social capital, individual social capital is embedded in a community.
That is where we turn next.
Social Capital at the Community Level
Social capital is a multilevel construct that resides at the individual level, the community
level and the national level. Social capital research must always contemplate this multilevel
characteristic though the research will focus only on those levels that address the research
questions and hypotheses. This study examines the forces and interactions of social capital at the
individual level and at the community level.
At the community level, the factors of social capital can be clustered into two groups:
contextual and ecological. Contextual factors establish the background within which social
capital thrives or declines. Examples of contextual factors are the average household income in a
community, the average educational attainment in a community and the rate of home ownership
in a community. Ecological factors are the aggregated individual characteristics of those who
reside in the same ecological community. Duration of residence, self-reported health status and
home ownership are examples of ecological characteristics.
There are several reasons that it is useful to cluster community-level social capital into
two groups. First, the theory of social capital is deepened with a reductionist approach to the
community-level factors. Second, because these are the factors that influence social capital
variability, it is important from a policy standpoint to recognize and understand how they
interact. Social policy is formulated for implementation at the community level and then
cascades to the individual level. This policy must be guided by understanding community-level

45
social capital in the most granular way possible. Finally, from a purely pragmatic standpoint,
data are available from different sources for each cluster. The contextual variables are available
from the US Census Bureau; the ecological variables are available from surveying the residents
of a certain community. This clustering and description of the community-level factors of social
capital completes our discussion of the elements for the theoretical model that guided the
research.
Table 2 is a summary of the components of social capital that have been identified,
defined and categorized. Y1 through Y6 are examples of contextual and ecological factors of
community-level social capital. X1 through X6 are examples of behaviors and attitudes of social
capital at the individual level.
The components of the theoretical model have now been identified, defined and
categorized. Table 2 is a summary of that discussion.
Table 2: Theoretical Overview of Social Capital
Individual Level Social Capital
Attitudes
Y1, Generalized trust
Y2, Stated belief that club membership is beneficial
Y3, Belief that government is helpful
Behaviors
Y4, Club membership
Y5, Church membership
Y6, Political participation
Community Level Social Capital
Contextual
X1, Average community income
X2, Rate of community home ownership
X3, Average community education attainment
Ecological
X4, Duration of residence
X5, Self-reported health
X6, Personal education attainment

46
It is not sufficient, however, simply to identify the components. A theoretical statistical
model must be developed that shows how the components of social capital interact. Figure 3 is
this model. Carrying forward the nomenclature from the previous section, the “Y” variables are
examples of indicators of individual social capital. Y1, Y2 and Y3 are examples of indicators of
the attitudinal dimension of social capital. Y4, Y5 and Y6 are examples of indicators of the
behavioral dimension of social capital. X1, X2 and X3 are examples of community contextual
factors, and X4, X5 and X6 are examples of community ecological factors. This theoretical
model was pruned and further specified with exploratory and confirmatory factor analysis later
in the research.
Attitudinal Dimension of
Social Capital
Behavioral Dimension of
Social Capital
X1
Y1 e111
Y2 e21
Y3 e31
Y4 e411
Y5 e51
Y6 e61
X2
X3
X4
X5
X6
z1
1
z2
1
Figure 3: Theoretical Model, Factors Influencing Social Capital Variability
47
CHAPTER THREE: RESEARCH METHODOLOGY
The purpose of this study is to analyze individual social capital as an endogenous,
multidimensional construct in the context of the community. Using the literature as a guide, four
research questions were developed with four related hypotheses. A theoretical framework has
been developed. This chapter discusses the variables in the study and shows the power analysis,
the sample size estimation process and the data collection technique employed. After describing
the technique for collecting the data, the chapter discusses the survey instrument and concludes
with a discussion of how the variables were analyzed and how the hypotheses were tested.
Research Questions and Hypotheses
There are four research questions:
1. Is social capital a two-dimensional construct?
2. What is the relationship between the attitudinal dimension of social capital and the
behavioral dimension of social capital?
3. What factors influence the variability in social capital?
4. Do members of the Y have more social capital, ceteris paribus, than non-members of
the Y?
The hypotheses are:
H1: Social capital is a two-dimensional construct.
H2: The two dimensions of social capital are iterative and the attitudinal dimension of
social capital more greatly influences the behavioral dimension.
H3: Social capital variability can be explained by six factors: average community
income; rate of community home ownership; average community educational attainment;

48
duration of residence in a community; self-reported health; and personal educational
attainment.
H4: Members of the Y have more social capital, ceteris paribus, than non-members of
the Y.
The Variables of the Research and Sources of Data
The literature review has guided the selection of the variables in this study. There are six
exogenous variables, two endogenous variables, eight indicator variables and four demographic
variables. The data to populate these variables comes from two sources: a survey questionnaire
and census block data from the Economic and Social Research Institute (http//www.esri.com).
This section discusses the variables and the data sources and concludes with a summary table
showing the data sources for each variable.
Characteristics of the Community: Exogenous Variables
The exogenous variables reside in the community and consist of contextual variables and
ecological variables. This research uses six such variables: average household income of the
census block (PI); the rate of home ownership in the census block (HO); average education
attainment of the census block (AEA); the average duration of residence in the census block of
the sample frame (DUR); individual self-rated health (SRH); and personal educational
attainment (PEA).
Attitudes and Behaviors of Social Capital: Endogenous and Indicator Variables
Kim and Kawachi (2006) and Wan and Lin (2003) have been the primary guides for
structuring the measurement instrument. These researchers have shown us that social capital at
the individual level is a combination of a level of trust and other attitudinal components, and the
49
number and intensity of associations. Although Kim and Kawachi (2006) distinguish seven
social capital behaviors, in this study the behavior dimension has four variables. Because the
ultimate purpose of this study‟s models and conclusions is to guide public policy, the informal
behaviors of social capital are not addressed.
Each of the dimensions of social capital has specific indicators. The psychological
predisposition or attitude dimension of social capital has three indicator variables: trust,
including specific personal trust, generalized interpersonal trust and institutional trust; a belief
that participation in associations is personally beneficial; and a belief that people or public
programs are generally helpful. The behavioral indicators of social capital in this research are:
membership in a civic or professional association; membership in a church, synagogue or
mosque; volunteering and monetary donations; and participation in the political process and
organizations. In addition to mere membership in specific organizations, the survey is designed
to gauge intensity of participation, i. e. number of meetings attended in the last month, frequency
of voting, frequency of church attendance and Y participation, etc.
Demographic Variables
There are four demographic variables: marital status, age, race and gender.
Sources of the Data
Survey Instrument
The survey instrument is a questionnaire containing 29 questions, all but five of which
were taken from the Social Capital Benchmark Survey (http://www.ropercenter.uconn.edu/).
This instrument has been used in numerous research studies throughout America and has high
reliability and validity. Three questions that were not taken from the SCBS pertain to

50
membership and participation in the Y. These questions were constructed using the same format
and answer choices as similar questions in the SCBS. The target time for a respondent to
complete the questionnaire is less than 15 minutes.
The questionnaire was pilot-tested on a group of fifteen business and professional people
in Central Florida in order to gain understanding of how respondents answered the questions,
how long it took them on average and which questions might be problematic for a mail survey.
The pilot-tested questionnaire had 31 questions. Three questions were eliminated, on household
income, on employment status and on trusting one‟s co-workers (a question that seemed to
confuse respondents). One question was added: gender of the respondent. The order of the
questions was also rearranged; demographic questions and questions about doctor visits were
placed at the end of the questionnaire.
The structure of the instrument is as follows. There are four questions related to
demographics: age, race, marital status and gender. There are two ecological questions: self-
reported health and personal educational attainment. There are seven questions pertaining to
social capital attitude: three on trust, two on whether the respondent views participation in social
associations as beneficial and two on whether the respondent deems others to be helpful. There
are fifteen questions on behaviors of association: three each on Y participation, church
participation, civic/service/professional group participation, participation in electoral and non-
electoral political affairs and volunteering and donating. Other than the demographics questions,
the response choices are a combination of five scale Likert choices and yes/no. The typical
Likert choices are: 1=Agree strongly 2= Agree, 3= Neither agree nor disagree, 4= Disagree, 5=
Disagree strongly. The survey questionnaire will be the data source for all variables except the
following four: average education attainment of the census block, rate of home ownership in a
51
census block, average duration of residence in a census block and average household income in a
census block.
SEER Analytics/Economic and Social Research Institute
The other source of data is the Economic and Social Research Institute (ESRI). This
company provides geographic information and derives its data from a variety of sources
including the United States Government Bureau of the Census. SEER Analytics, LLC, a Tampa-
based market research firm collected the data from ESRI and formatted it for this research. For
the purposes of this research, the community is defined as a census block group. A census block
group consists of approximately 400 households and roughly corresponds to a nine-digit zip
code. ESRI and Seer Analytics are the sources of the following data at the census block
(community) level: average education attainment in a census block; rate of home ownership in a
census block; average duration of residency at the same address in a census block; and average
household income in a census block. Tables 3, 4, 5, 6, and 7 summarize the variables and the
data sources.

52
Table 3: Summary of Exogenous Variables and Data Sources
Variable Name Attribute Measurement Source of Data
Household Income
Average Education
Attainment
Home Ownership
Duration of
Residence
Self-Reported
Health
Personal Education
Attainment
Exogenous
Exogenous
Exogenous
Exogenous
Exogenous
Exogenous
Ordinal
Ordinal
Ordinal
Ordinal
Ordinal
Ordinal
ESRI
ESRI
ESRI
ESRI
Survey: How would you describe your health
when comparing yourself with others of your
age?
Survey: What is your personal educational
attainment?
Table 4: Summary of Endogenous Variables and Data Sources
Variable Name Attribute Measurement Source of Data
Attitudinal Dimension of
Social Capital
Behavioral Dimension of
Social Capital
Endogenous
Endogenous
Ordinal
Ordinal
Survey, indicated by:
1. General trust
2. Trusts neighbors
3. Benefits from
participation
4. Govt is responsive
5. People are helpful
Survey, indicated by:
1. Club member
2. Church member
3. Votes
4. Interested in politics
5. Volunteers
6. Makes nonchurch
donations
7. Attends club meetings

53
Table 5: Summary of Indicator Variables and Data Sources for Attitudinal Dimension of Social
Capital
Variable Name Attribute Measurement Source of Data
General trust
Trusts neighbors
Benefits from
participation
Govt is responsive
People are helpful
Indicator
Indicator
Indicator
Indicator
Indicator
Ordinal
Ordinal
Ordinal
Ordinal
Ordinal
Survey: Generally speaking, would you say that
most people can be trusted?
Survey: Generally speaking, would you say that
most people in your neighborhood can be
trusted?
Survey: Participating in service, civic and/or
trade organizations is beneficial to me.
Survey: Generally speaking would you say that
government and public programs are helpful to
you?
Survey: Generally speaking, would you say that
people in your community are helpful to you?
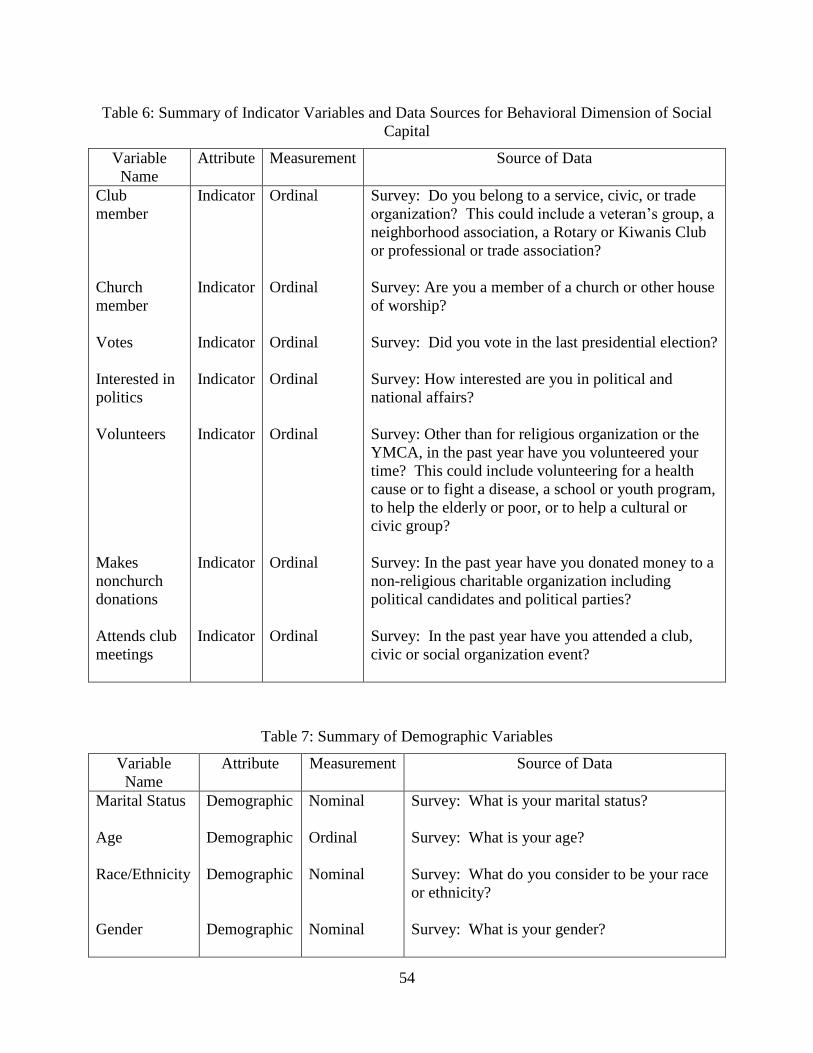
54
Table 6: Summary of Indicator Variables and Data Sources for Behavioral Dimension of Social
Capital
Variable
Name
Attribute Measurement Source of Data
Club
member
Church
member
Votes
Interested in
politics
Volunteers
Makes
nonchurch
donations
Attends club
meetings
Indicator
Indicator
Indicator
Indicator
Indicator
Indicator
Indicator
Ordinal
Ordinal
Ordinal
Ordinal
Ordinal
Ordinal
Ordinal
Survey: Do you belong to a service, civic, or trade
organization? This could include a veteran‟s group, a
neighborhood association, a Rotary or Kiwanis Club
or professional or trade association?
Survey: Are you a member of a church or other house
of worship?
Survey: Did you vote in the last presidential election?
Survey: How interested are you in political and
national affairs?
Survey: Other than for religious organization or the
YMCA, in the past year have you volunteered your
time? This could include volunteering for a health
cause or to fight a disease, a school or youth program,
to help the elderly or poor, or to help a cultural or
civic group?
Survey: In the past year have you donated money to a
non-religious charitable organization including
political candidates and political parties?
Survey: In the past year have you attended a club,
civic or social organization event?
Table 7: Summary of Demographic Variables
Variable
Name
Attribute Measurement Source of Data
Marital Status
Age
Race/Ethnicity
Gender
Demographic
Demographic
Demographic
Demographic
Nominal
Ordinal
Nominal
Nominal
Survey: What is your marital status?
Survey: What is your age?
Survey: What do you consider to be your race
or ethnicity?
Survey: What is your gender?
55
Power Analysis, Sampling and Sample Size
Two key elements in the design of research studies are power and sample size. Power is
the probability of rejecting the null hypothesis when the null hypothesis is false (Aberson, 2010;
Kaplan, 1995; Zhang and Wang, 2009). That is called a Type II error or false negative. As
power increases, the chance of making such an error decreases. However, as power increases the
chance of concluding that an effect occurred when it actually did not also increases. That is a
Type I error. So, given the nature of the research and the ramifications of making a Type I or a
Type II error, a researcher must make a judgment as to the necessary power for a particular
study. The usual probabilities for rejecting the null hypothesis (alpha) range from 1 in 4 (.20) to
1 in a 100 (.01). This probability is called alpha. The alpha for this study is .05. Power analysis
is important because it informs the sample size that is required.
The unit of analysis in this study is the individual citizen of Central Florida. The analysis
technique is structural equation modeling (SEM). Opinions differ as to the minimum sample
size necessary for a structured equation model. Ding, Velicer and Harlow (1995) argued that
between 100 and 150 subjects are the required minimum while Boomsma and Hoogland (2001
argued that 200 is the minimum. Bentler and Chou (1987), however, approach minimum sample
size somewhat differently, taking into account the size and complexity of a particular SEM.
They argued that 5 subjects per parameter estimate of the model will be sufficient. Kline (2005)
has a similar view as Bentler and Chou though stipulating 10 subjects per parameter as a
minimum.
The number of parameters of the most complex model that will be used in this research is
67. Free parameters are 43. The sample frame is six counties in Central Florida, with a
population of approximately 2 million people. The data collection was random and the sample

56
frame large, therefore, following Kline (2005), the minimum sample size for this research is 670.
This provides adequate power to reject the null hypothesis with 95% confidence.
Data Collection
As discussed above, data were collected in two ways: a survey questionnaire mailed to
residents of Central Florida and census block data from ESRI. Each method is described in this
section.
The research questionnaire is a 29-question piece that was mailed to Central Floridians in
the sample frame. The piece was tri-folded so that it could be completed by the recipient and
returned anonymously. Return postage was prepaid. Respondents were asked to complete the
questionnaire, tear off the address panel containing their name and address, refold the form so
that the return address panel was showing and mail it back to the UCF Office of Research and
Commercialization. Each piece was bar coded with the census block of the recipient so that the
ESRI data can be linked to the respondent while retaining anonymity.
Because one of the research questions relates to the role of Y membership in building
social capital it was important to have enough Y members in the sample frame to meet the
sample size requirement. It was also important to ensure a valid comparison between Y
members and non-Y members. This problem was addressed as follows. The Central Florida
YMCA provided a complete list of the names and addresses of all their members who had had
family memberships for at least one year. The one-year stipulation was included so that any
social capital effect wouldn‟t be diluted by members who had only recently become members.
The total number of such members was approximately 10,000. The addresses of these 10,000
members were scanned and the census block of each member was identified. The footprint of
57
the Central Florida YMCA includes the counties in and around Orlando, Florida: Orange,
Seminole, Osceola, Brevard, Lake and Marion.
A complete sample frame now had to be constructed. The minimum sample size was 670
and the expected return rate was unknowable. Each mail campaign is different and this one
lacked any incentive to respond except an appeal to civic pride. Furthermore, since respondents
were anonymous, there was no feasible way to reward or thank them for their response.
Marketing mailings that included incentives usually have had a responses rate of about 2%.
Since this mailing appealed to civic pride and would be clearly marked as a University of Central
Florida-based study, it was hoped that this mailing also could elicit a response rate of at least 2%.
Assuming a response rate of 2% and a required response number of 670, it was concluded that no
less than 30,000 mailers should be sent.
Given a list of slightly more than 10,000 Y members in identified census blocks and a
need for about 30,000 people in the research sample frame, it was decided to mail surveys to all
Y members plus two non-Y members who reside in the same census blocks as the Y members.
In this way a sample frame of 31,000 people was constructed. A response rate of 2% would
yield 620 responses.
Human Subjects
This research involves human subjects and is thus subject to the approval of the
Institutional Review Board. Such approval was sought and granted for both the data collection
technique and the survey questionnaire. All questionnaires contained the following disclaimer:

58
Dear Fellow Citizen,
This survey is being conducted by the University of Central Florida to help determine
certain aspects of social capital in the community. The results of the survey will be used to make
recommendations to enhance the lives of all citizens of Central Florida. You must be at least 18
years of age to participate in this survey and participation is entirely voluntary. Careful
consideration of your answers and your cooperation will be greatly appreciated. You do not
need to answer any question that you do not wish to but you are encouraged to answer all of
them.
Your anonymity is important to the results of this survey and you will not be contacted in
any way as a result of your returning this survey form. You have been chosen randomly for this
survey and there is no risk to you whether you complete the form or not. Please complete the
survey to the best of your ability and mail it to the University with the self-mailer that is part of
this questionnaire.
The supervising professor is Dr. Thomas Wan of the College of Health and Public
Administration at the University of Central Florida. The doctoral candidate conducting the
research is James R. Downing. They can be reached by mail at the above address or by phone at
407-823-0774.
Research at the University of Central Florida involving human participants is carried out
under the oversight of the Institutional Review Board. Questions or concerns about research
participants‟ rights should be directed to the UCF IRB office, University of Central Florida,
Office of Research and Commercialization, 12202 Research Parkway, Suite 501, Orlando, FL
32282-3246, or by campus mail at 32816-0150. The hours of operation are 8:00 am to 5:00 pm,
Monday through Friday except on University of Central Florida official holidays. The telephone
numbers for the IRB office are 407-882-2276 and 407-823-2901.
Thank you very much for your cooperation.
Figure 4: Questionnaire Disclaimer
Statistical Analysis
The statistical analysis for this research was done in three steps: 1) a descriptive analysis
of the variables showed the demographic characteristics of the sample; 2) confirmatory factor
analysis explained “the variation and covariation of the observed variables in terms of a set of
unobserved factors” (Wan [2002, p. 79]; 3) structural equation modeling described and explained
the effect and tested the hypotheses.

59
The descriptive analysis shows the relationship of the sample to the general population
and the extent to which this research is generalizable. The research question related to the effect
of Y membership on social capital which required a focus on members of the YMCA who
resided disproportionately in High Attractive Block Groups. In short, Y members are more
affluent than the general public. Nevertheless, the sample will be compared to both High
Attractive Block Groups and the population in general.
Exploratory factor analysis followed by confirmatory factor analysis was used to validate
the measurement models for the latent constructs. By definition latent constructs cannot be
measured directly, hence the use of confirmatory factor analysis that simultaneously analyzes
multiple observable indicators to measure latent constructs. This analytical tool can also be used
to test hypotheses. In addition to helping to develop and then validate latent construct
measurement models, confirmatory factor analysis, through goodness of fit statistics,
demonstrates how well the models fit the data. Modification indices guide improvements of the
measurement models. This research has two latent construct measurement models, Figures 5 and
6:
Attitudinal Dimension of
Social Capital
Aspects of Trust e1
1
1
Benefits from Association e21
People are Helpful e31
Figure 5: Latent Construct Model of the Attitudinal Dimension of Social Capital

60
Behavioral Dimension of
Social Capital
Club Membership and
Participatione4
1
1
Church Membership e51
Volunteers and Donates e61
Political Participation e71
Figure 6: Latent Construct Model of the Behavioral Dimension of Social Capital
The third step in the analysis is structural equation modeling (SEM). This is the most
appropriate statistical method to analyze the data because it is effective in theory testing as well
as in determining the correlation strength of causal variables (DeShon, 1998; Byrne 2001). SEM
has the statistical capability to simultaneously assess the relationships of the exogenous,
endogenous and indicator variables. The data were analyzed using SPSS 15.0 and AMOS 7.0
statistical software.
Figure 7 is the SEM model that was used to test Hypotheses One and Two.
Attitudinal Dimension of
Social Capital
Aspects of Trust e11
1
Benefits from Association e21
People are Helpful e31
Behavioral Dimension of
Social Capital
Club Membership and
Participatione4
1
Church Member e51
Volunteers and Donates e61
Political Participation e71
z1
1
z2
1
Figure 7: Two-Dimensional Social Capital Model

61
Figure 8 is the structural equation model for analyzing Hypothesis Three, the factors that
influence social capital variability.
Attitudinal Dimension of
Social Capital
Aspects of Trust e11
Benefits from
Partiicpatione2
1
People are Helpful e31
Behavioral Dimension of
Social Capital
Club Member and
Participatione4
1
Church member e51
Vol's and Donates e61
Pol Parfticipation e71
z1
1Household
Income
z2
1
Owns Home
Avg Educ
Attainment
Duration of
Residence
Self Rreported
Health
Personal Educ
Attainment
Figure 8: Factors of Social Capital Variability
The fourth research question, “Do Y members have greater social capita, ceteris
paribus?” was tested using an analysis of variance, ANOVA because it compares two groups
within the sample and ANOVA is the most effective method to isolate the differences between
the two groups on the dimensions of social capital. The two groups that were compared are Y
members and non-Y members.
Criteria for Statistical Analysis
Multicollinearity
Multicollinearity is the extent to which two or more variables in an SEM model are
correlated. Although multicollinearity does not affect the predictive power of the model as a

62
whole, it does affect the conclusions drawn about the individual predictors (Farrar and Glauber,
1967). Correlations between variables that are higher than .70 can indicate multicollinearity
(Bachman and Paternoster, 2004; Meyers, Gamst and Guarino, 2006). The Spearman Rho test
was used to detect multicollinearity. Multicollinearity can be dealt with in one of two ways: 1)
leave the model as is and forego conclusions regarding individual predictors; or, 2) drop one or
more variables; and obtain more data. Only the second option was suitable for this research.
Significance
Statistical significance is a measure of the likelihood that the effect was caused by
chance. The hypothesis that the effect is coincidental or caused by chance is the null hypothesis,
and significance is the likelihood of rejecting the null hypothesis. This measure is called the
critical p-value, usually denoted by the Greek letter alpha. An alpha usually ranges from .80 to
.99 according to the importance of rejecting the null hypothesis, which means that the likelihood
of the finding being true falls between 80% and 99%. This research uses an alpha of .05,
meaning that there is at least a 95% chance that the finding is true.
Factor Loading
According to Kline (2005), factor loadings are “usually interpreted as regression
coefficients that may be in standardized or unstandardized form” (p. 72). When displayed in
table form, factor loadings are the correlation coefficients between the variables (the rows) and
the factors (the columns), which when squared indicate the percentage of variance in an indicator
variable that is explained by a factor. This statistic is Pearson‟s r.
Opinions differ on the Pearson scores necessary to demonstrate that independent
variables are represented by a specific factor. Some argue for a score as high as .7 while others

63
contend that .4 is sufficient. Kline (2005) argues that .5 is acceptable, and it is appropriate for
this research. Any indicator with a factor loading less than .5 was eliminated from the models.
Reliability
The concept of reliability in statistics is the notion that the results will be consistent when
repeated. There are several methods to determine that: this research will use two. The most
common is Cronbach‟s alpha. George and Mallory (2003) and Kline (2005) argue that a
Cronbach‟s alpha of .70 is acceptable. This research used a Cronbach‟s alpha of .70 for
reliability testing. A second method to test reliability is composite reliability index described by
DeShon (1998). Delmas and Toffel (2008) argue that a composite reliability index of greater
than .70 is acceptable.
Goodness of Fit
Goodness-of-fit indicators determine whether the model to be tested fits the data and
should be accepted. Unlike the case for the statistics discussed above, theorists lack consensus
on goodness-of-fit statistics. Therefore selecting the most appropriate statistic for a particular
research project is more complicated. Consideration must be given to the type of data in the
study, the complexity of the model and the sample size. Many goodness-of-fit measures were
considered for this study: Normed Fit Index (NFI); Nonnormed Fit Index (NNFI); Relative Fit
Index (RFI); Incremental Fit Index (IFI); chi-square; chi-square associated p value (p); chi-
square/degree of freedom; Root Mean Square Error of Approximation (RMSEA); Root Mean
Square Error of Approximation associated p value (PCLOSE); Tucker-Lewis Index (TLI);
Comparative Fit Index (CFI); Standardized Root Mean Square Residual (SRMR); Hoelter‟s

64
Critical N (Hoelter Index); Akaike Information Criteria (AIC); Bayesian Information Criteria
(BIC); Goodness of Fit Index (GFI) and Adjusted Goodness of Fit (AGFI).
The goal was not to test the model with every possible index, but to match this study with
the most appropriate goodness-of-fit index. The literature offers numerous recommendations as
to the most appropriate goodness-of-fit measures. Garson (2009) recommends three goodness-of-
fit measures: chi-square, RMSEA and either NFI, RFI, TLI, IFI or CFI. On the other hand, Kline
(2005) recommends chi-square, NFI or CFI, NNFI and SRMR.
For study with its relatively simple model and large sample size, the following goodness-
of-fit indices were appropriately used:
1. Chi-square/Degree of Freedom with a score of less than 4 (Kline, 2005; Wan, 2002).
2. RMSEA with a score of less than .08 (Engel and Worden, 2003; Wan, 2002).
3. PCLOSE with a score greater than .05 (Garson, 2009).
4. Tucker-Lewis Index with a score greater than .90 (Hoe, 2008).
5. Comparative Fit Index with a score greater than .90 (Hu and Bentler, 1999).
6. Goodness of Fit Index with a score greater than .90 (Wan, 2002).
7. Standardized Root Mean Square Residual with a score less than .08 (Hu and Bentler,
1999)
8. Hoelter‟s Critical N with a score greater than 200 (Garson, 2009; Wan, 2002).
Summary of Research Methodology
This chapter has described the research methodology that was employed to analyze the
study‟s data. The variables were described and discussed, a power analysis was conducted, and
the sampling approach and minimum sample size were discussed. The survey instrument was
described and the linkage to the variables shown. Structured equation modeling was justified as

65
the appropriate analytical tool, and the model for this study was presented. Lastly, the methods
of statistical analysis were described.
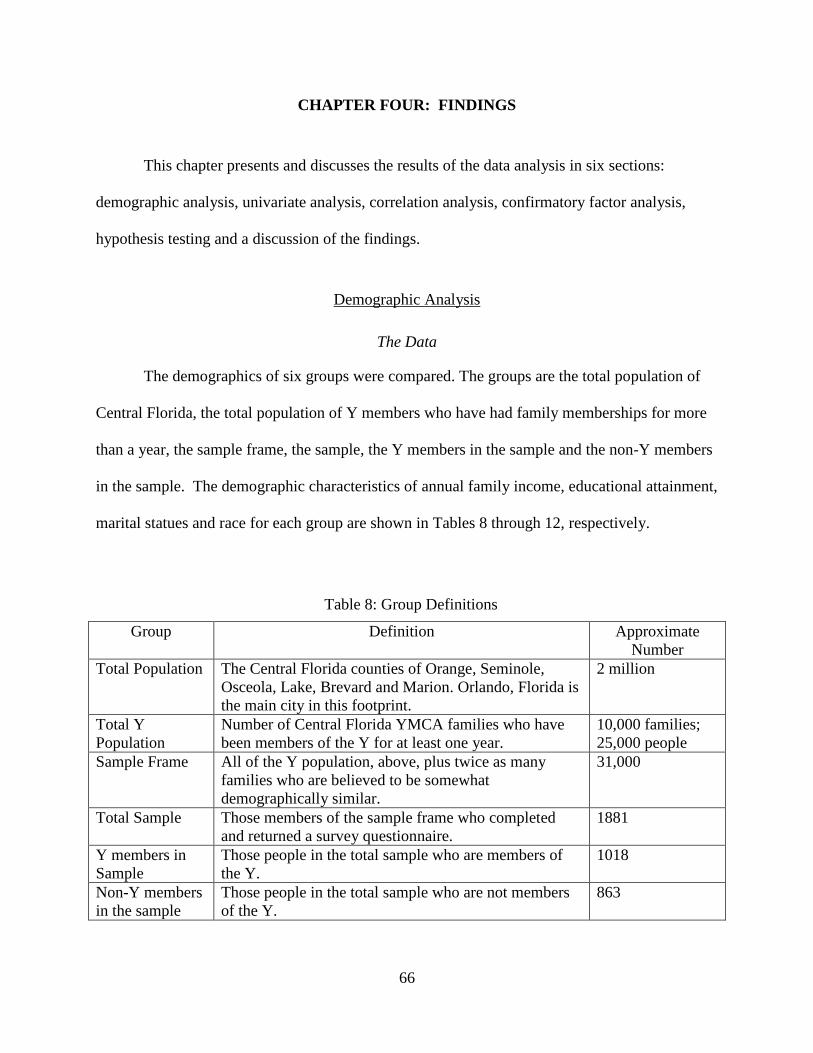
66
CHAPTER FOUR: FINDINGS
This chapter presents and discusses the results of the data analysis in six sections:
demographic analysis, univariate analysis, correlation analysis, confirmatory factor analysis,
hypothesis testing and a discussion of the findings.
Demographic Analysis
The Data
The demographics of six groups were compared. The groups are the total population of
Central Florida, the total population of Y members who have had family memberships for more
than a year, the sample frame, the sample, the Y members in the sample and the non-Y members
in the sample. The demographic characteristics of annual family income, educational attainment,
marital statues and race for each group are shown in Tables 8 through 12, respectively.
Table 8: Group Definitions
Group Definition Approximate
Number
Total Population The Central Florida counties of Orange, Seminole,
Osceola, Lake, Brevard and Marion. Orlando, Florida is
the main city in this footprint.
2 million
Total Y
Population
Number of Central Florida YMCA families who have
been members of the Y for at least one year.
10,000 families;
25,000 people
Sample Frame All of the Y population, above, plus twice as many
families who are believed to be somewhat
demographically similar.
31,000
Total Sample Those members of the sample frame who completed
and returned a survey questionnaire.
1881
Y members in
Sample
Those people in the total sample who are members of
the Y.
1018
Non-Y members
in the sample
Those people in the total sample who are not members
of the Y.
863

67
Table 9: Annual Income by Group
Table 10: Educational Attainment by Group
Group Educational Attainment
Less than HS
graduate
HS
graduate
Some
college
BA/BS
+
MA/MS
+
Total Population 17% 27% 31% 18% 9%
Total Sample 1% 6% 22% 37% 33%
Y members in sample 0 3% 17% 40% 40%
Non-Y members in
sample
2% 10% 28% 35% 25%
Group Annual Family Income (000s)
0-25 25-35 35-50 50-75 75-100 100+
Total Population 7% 15% 35% 29% 10% 4%
Y Member Population 5% 4% 8% 19% 19% 45%
Total Sample 0 2% 8% 27% 27% 36%
Y members in sample 0 0 6% 24% 28% 42%
Non Y members in sample 0 1% 12% 31% 26% 30%

68
Table 11: Marital Status by Group
Group Marital Status
Married
Divorced or separated
Widowed
Never Married
Total Population 56% 12% 11% 21%
Total Sample
88%
7%
2%
3%
Y members in the sample
93%
4%
1%
2%
Non-Y members in the sample
85%
10%
2%
3%
Table 12 compares the groups by race. The survey questionnaire asked respondents to label
themselves as “white,” “African American,” “Hispanic” or “Other.” Although these categories
mix race and ethnicity and ignore mixed race/ethnicity, the classifications are consistent with the
SCBS, census classifications and ESRI classifications. Race has socioeconomic associations in
American society which is why the question was included in the questionnaire. “Hispanic” was
not used as a comparison factor. The percentages in the sample comparisons do not add up to
100% because of the Hispanic choice in the survey questionnaire.
Table 12: Race by Group
Group Race
White Black Other
Total Population 82% 12% 6%
Total Sample 84% 4% 5%
Y members in sample 90% 2% 3%
Non Y members in sample 76% 5% 7%

69
Discussion of Demographic Variables
To summarize the demographic profile of the sample as well as the sample subgroups of
Y members and non-Y members, sample members are wealthier, more educated, more likely to
be white and more likely to be married than the general population. That was to be expected. To
address the research questions on the influence of Y membership on social capital, ceteris
paribus, it was necessary that the sample include both Y members and non-Y members of similar
demographics. Since Y members with family memberships are more affluent, the non-Y sample
frame was selected to mirror that affluence as closely as possible. The mean family income for
the sample, both subgroups within the sample, and the Y population is approximately $94,000.
Although the Y and non-Y average family incomes are the same, among the Y members it is
distributed a little differently: Y member family incomes skew to the higher end of the income
scale. Nevertheless the goal of acquiring a sample of Y and non-Y members that are
demographically similar was achieved. The average family income in the total population is
approximately $55,000, or just a little more than half of the sample family income.
It is also noteworthy that Y members comprise 54% of the sample even though twice as
many non-Y members were in the sample frame. In other words, Y members completed and
mailed back the survey questionnaire at more than twice the rate of non-Y members (10.1%
versus 4.1%). There was nothing in the survey questionnaire or the IRB disclaimer that
accompanied it to indicate that the research had any particular interest in Y membership.
Anecdotally, social capital theory would view this as an indicator of an interest in community
affairs, which would support the hypothesis that Y members have higher levels of social capital.
Although the sample does not reflect the general population, it is likely that the findings
can nevertheless be generalized to it. There is no reason to believe that the factors influencing
social capital or the relationship between the attitudes of social capital and the behaviors of
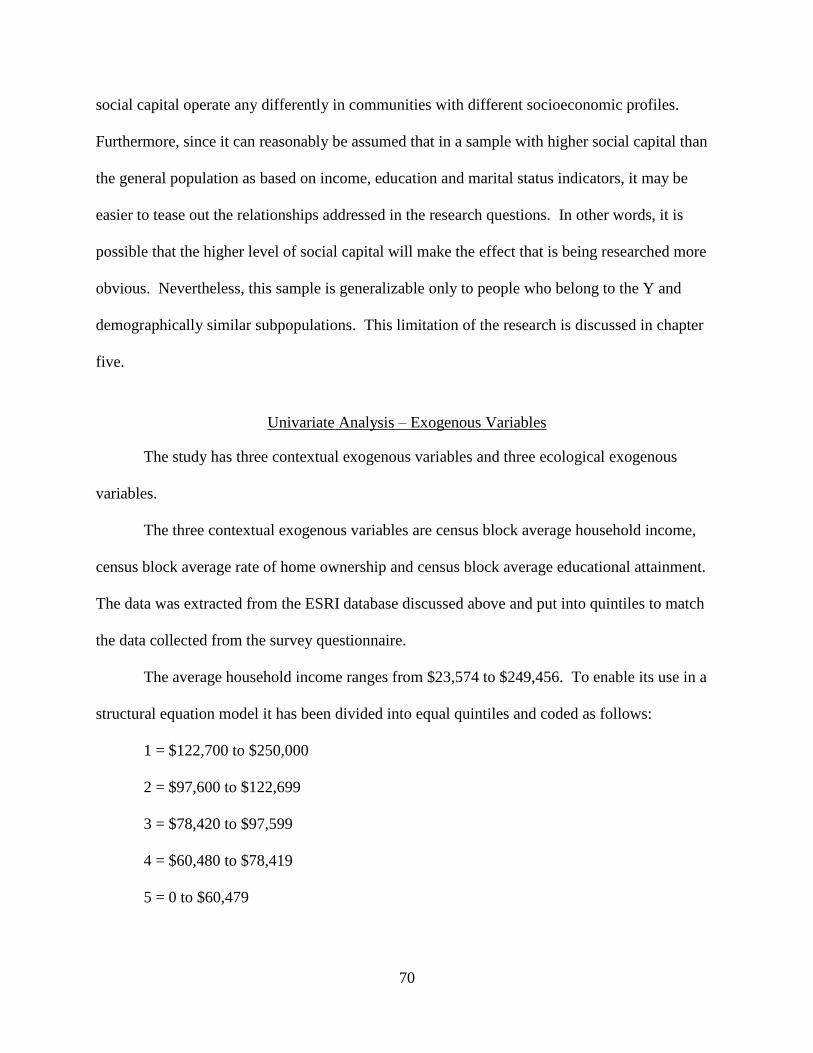
70
social capital operate any differently in communities with different socioeconomic profiles.
Furthermore, since it can reasonably be assumed that in a sample with higher social capital than
the general population as based on income, education and marital status indicators, it may be
easier to tease out the relationships addressed in the research questions. In other words, it is
possible that the higher level of social capital will make the effect that is being researched more
obvious. Nevertheless, this sample is generalizable only to people who belong to the Y and
demographically similar subpopulations. This limitation of the research is discussed in chapter
five.
Univariate Analysis – Exogenous Variables
The study has three contextual exogenous variables and three ecological exogenous
variables.
The three contextual exogenous variables are census block average household income,
census block average rate of home ownership and census block average educational attainment.
The data was extracted from the ESRI database discussed above and put into quintiles to match
the data collected from the survey questionnaire.
The average household income ranges from $23,574 to $249,456. To enable its use in a
structural equation model it has been divided into equal quintiles and coded as follows:
1 = $122,700 to $250,000
2 = $97,600 to $122,699
3 = $78,420 to $97,599
4 = $60,480 to $78,419
5 = 0 to $60,479

71
The average rate of home ownership is the percentage of residents in a census block who
own their homes. The range, 7% to 98%, has been divided into quintiles and coded as follows:
1 = 94.1% to 99%
2 = 89.1% to 94%
3 = 80.1% to 89%
4 = 62.1% to 80%
5 = 0 to 62%
The average educational attainment is the average educational attainment of the residents
over 25 years old in a given census block. The data were calculated to five decimal places for
use later in the statistical analysis. However, for comparative purposes the data has been coded
into the same five categories as for “personal education attainment” in the survey questionnaire.
The range is 1.759 to 4.240, or, somewhat above a bachelor‟s degree to somewhat below a high
school graduate. The average is 2.93233, or, just below a bachelor‟s degree. The distribution is
as follows:
1 Master‟s degree or higher = 0%
2 Bachelor‟s degree = 12.3%
3 Some college = 76.8%
4 HS Graduate = 10.9%
5 Less than HS diploma = 0%
Average education attainment was further transformed into five equal quintiles, which gives it a
normal distribution. The break quintile break points are as follows:
1 Master‟s degree or higher = .00001 to 2.55904
2 Bachelor‟s degree = 2.55905 to 2.78148

72
3 Some college = 2.78149 to 2.99410
4 HS Graduate = 2.99411 to 3.28755
5 Less than HS diploma = 3.28756 to 5.00000
The three ecological exogenous variables are duration of residence, self-reported health
and personal education attainment. Duration of residence is the average number of years that a
resident in a given census block has resided at the present address. The range in this research
sample was 2.9 years to 27.6 years. The data were recoded into quintiles as follows:
1= 12.4 to 20 years
2 = 10.9 to 12.3 years
3 = 9.2 to 10.8 years
4 = 7.6 to 9.1 years
5 = 0 to 7.5 years
Self-reported health data were collected from the questionnaire. In response to the
question “How would you describe your current state of health when comparing yourself with
others of your age?”
1 Excellent 38.3%
2 Good 48.2%
3 Fair 10.5%
4 Poor 2.7%
5 Very Poor .3%
The results for personal education attainment are as follows:
1 Master‟s degree or higher = 33.8%
2 Bachelor‟s degree = 44.0%

73
3 Some college = 22.0%
4 HS Graduate = .1%
5 Less than HS diploma = .2%
Univariate Analysis – Endogenous Variables/Indicator Variables
There are two endogenous variables, the attitudinal dimensional of social capital and the
behavioral dimension of social capital. These endogenous variables are latent constructs that are
indicated by combinations of indicator variables. The specific combination of indicator variables
for each latent construct was determined by exploratory and confirmatory factor analysis. Table
13 displays the responses for the five variables that are for the attitudinal dimension of social
capital:

74
Table 13: Indicators of the Attitudinal Dimension of Social Capital
Indicator # Response %
Generally speaking, would you say that
most people can be trusted? (General
trust)
1 Agree strongly 4.9
2 Agree 60.8
3 Neither agree nor disagree 15.4
4 Disagree 17.0
5 Strongly disagree 1.9
Generally speaking, would you say that
most people in your neighborhood can
be trusted? (Trusts neighbors)
1 Agree strongly 13.2
2 Agree 61.7
3 Neither agree nor disagree 15.9
4 Disagree 7.8
5 Strongly disagree 1.3
Participating in service, civic, and/or
trade organizations is beneficial to me.
(Benefits from participation)
1 Agree strongly 16.8
2 Agree 37.5
3 Neither agree nor disagree 39.7
4 Disagree 4.4
5 Strongly disagree 1.6
Generally speaking, would you say that
government is responsive to the needs
of the people in your community? (Govt
is responsive)
1 Agree strongly 1.4
2 Agree 34.0
3 Neither agree nor disagree 31.0
4 Disagree 27.6
5 Strongly disagree 6.0
Generally speaking, would you say that
most people in your community are
helpful to you? (People are helpful)
1 Agree strongly 6.6
2 Agree 53.5
3 Neither agree nor disagree 31.9
4 Disagree 6.8
5 Strongly disagree 1.2
Table 14 displays the responses for the seven variables that are indicators of the behavioral
dimension of social capital.

75
Table 14: Indicators of the Behavioral Dimension of Social Capital
Indicator # Response %
Do you belong to a service, civic, or trade
association? This could include a veteran‟s group, a
neighborhood association, a Rotary or Kiwanis Club
or professional or trade association. (Club member)
1
Yes 50.4
2 No 49.6
Are you a member of a church or other house of
worship? (Church member)
1 Yes 62.3
2 No 37.7
Did you vote in the last presidential election? 1 Yes 92.2
2 No 7.8
How interested are you in politics and national
affairs? (Interested in politics)
1 Very interested 47.2
2 Somewhat interested 39.1
3 Only slightly interested 10.9
4 Not at all interested 2.8
Other than for a religious organization or the
YMCA, in the past year have you volunteered your
time? This could include volunteering for a health
cause to fight a disease, a school program, to help
the elderly or poor, or to help a cultural or civic
group. (Volunteers)
1 Yes 72.6
2 No 27.4
In the past year have you donated money to a non-
religious organization including political candidates
and political parties? (Makes nonchurch
contributions)
1 Yes 76.9
2 No 23.1
In the past year have you attended a club, civic, or
social organization or event? (Attends club
meetings)
1 Yes 68.4
2 No 31.6
Correlation Analysis and Correlation Matrix
The second step in the analysis is bivariate analysis to identify and better understand the
correlations between variables. Table 15 is the correlation matrix for the attitudinal dimension of
social capital. Table 16 is the correlation matrix for the behavioral dimension of social capital.

76
Table 15: Correlation Matrix for Attitudinal Dimension of Social Capital
General
Trust
Trusts
Neighbors
Govt is
Responsive
People
Are
Helpful
Benefits
From
Participation
General trust Correlation
Coefficient 1
Sig. (2-tailed)
Trusts
neighbors
Correlation
Coefficient .608(**) 1
Sig. (2-tailed) .000
Govt is
responsive
Correlation
Coefficient .278(**) .246(**) 1
Sig. (2-tailed) .000 .000
People are
helpful
Correlation
Coefficient .249(**) .345(**) .248(**) 1
Sig. (2-tailed) .000 .000 .000
Benefits from
participation
Correlation
Coefficient .197(**) .219(**) .177(**) .288(**) 1
Sig. (2-tailed) .000 .000 .000 .000
** Correlation is significant at the 0.01 level (2-tailed).
The Spearman rho statistic is used to test correlations of ordinal data. All correlations
here are positive and significant at the .05 significance level in fact, all are significant at the .01
level although this research requires only a .05 significance level. There is no indication of
multicollinearity, since all correlations are below .85. Not unexpectedly, the highest correlation
is between general trust and trust in one‟s neighbors. The lowest correlation is between the belief
that participation in civic and professional groups is beneficial and the belief that government is
responsive to the needs of the people. That low correlation suggests that people in civic and
professional organizations look to the non-government sector to solve community problems.
Nevertheless the relationship is positive and significant. There is no indication that any variable
should be eliminated from the model.
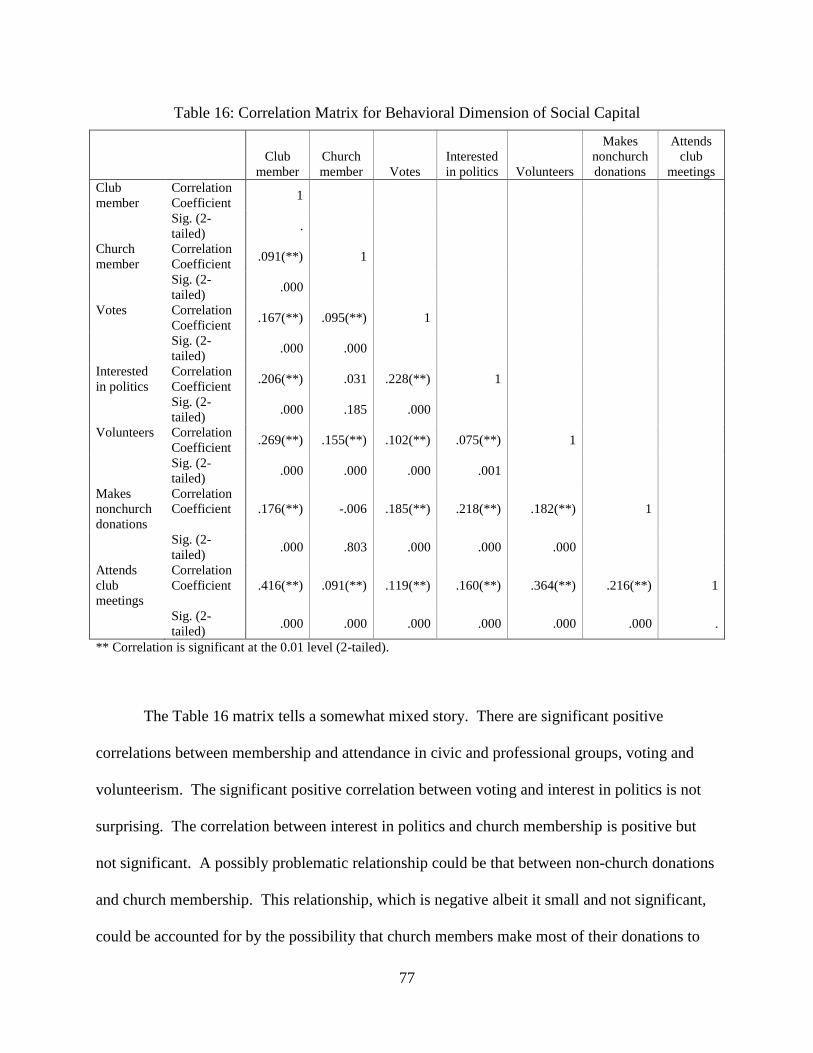
77
Table 16: Correlation Matrix for Behavioral Dimension of Social Capital
Club
member
Church
member Votes
Interested
in politics Volunteers
Makes
nonchurch
donations
Attends
club
meetings
Club
member
Correlation
Coefficient 1
Sig. (2-
tailed) .
Church
member
Correlation
Coefficient .091(**) 1
Sig. (2-
tailed) .000
Votes Correlation
Coefficient .167(**) .095(**) 1
Sig. (2-
tailed) .000 .000
Interested
in politics
Correlation
Coefficient .206(**) .031 .228(**) 1
Sig. (2-
tailed) .000 .185 .000
Volunteers Correlation
Coefficient .269(**) .155(**) .102(**) .075(**) 1
Sig. (2-
tailed) .000 .000 .000 .001
Makes
nonchurch
donations
Correlation
Coefficient .176(**) -.006 .185(**) .218(**) .182(**) 1
Sig. (2-
tailed) .000 .803 .000 .000 .000
Attends
club
meetings
Correlation
Coefficient .416(**) .091(**) .119(**) .160(**) .364(**) .216(**) 1
Sig. (2-
tailed) .000 .000 .000 .000 .000 .000 .
** Correlation is significant at the 0.01 level (2-tailed).
The Table 16 matrix tells a somewhat mixed story. There are significant positive
correlations between membership and attendance in civic and professional groups, voting and
volunteerism. The significant positive correlation between voting and interest in politics is not
surprising. The correlation between interest in politics and church membership is positive but
not significant. A possibly problematic relationship could be that between non-church donations
and church membership. This relationship, which is negative albeit it small and not significant,
could be accounted for by the possibility that church members make most of their donations to

78
their church and may view non-church organizations as somewhat competitive. However,
because both variables are positively and significantly correlated with all other variables in the
model, because the negative correlation is small and because they are both consistent with the
theory, they were retained. There is no problem with multicollinearity, as all coefficients are less
than .80.
Table 17 shows the correlation matrix for the exogenous variables. These variables are
normally distributed by virtue of formatting them into equal quintiles. Therefore Pearson‟s R is
used to determine the correlation relationships between the variables. Perhaps the most
surprising relationship is the negative but not significant correlations between personal education
attainment, and personal income and home ownership. These correlations are also not
significant. The high significant positive correlations between personal income, and home
ownership and self-reported health were expected. Since all coefficients are below .85, there is
minimal risk for multicollinearity.

79
Table 17: Correlation Matrix for Exogenous Variables
Personal
Income
Home
Ownership
Avg Educ
Attainment
Duration of
Residency
Self-
Reported
Health
Personal
Educ
Attainment
Personal
Income
Correlation
Coefficient 1
Sig. (2-
tailed) . .
Home
Ownership
Correlation
Coefficient .603(**) 1
Sig. (2-
tailed) .000 .
Avg Educ
Attainment
Correlation
Coefficient .072(**) .050(*) 1 .
Sig. (2-
tailed) .002 .032 .
Duration of
Residency
Correlation
Coefficient .063(**) .083(**) .019 1
Sig. (2-
tailed) .008 .001 .421 .
Self-
Reported
Health
Correlation
Coefficient .005 .005 .111(**) .027 1
Sig. (2-
tailed) .847 .843 .000 .255 .
Personal
Educ
Attainment
Correlation
Coefficient -.007 -.008 .129(**) .013 .133(**) 1
Sig. (2-
tailed) .763 .727 .000 .578 .000 .
** Correlation is significant at the 0.01 level (2-tailed).
* Correlation is significant at the 0.05 level (2-tailed).
The next step in the analysis is confirmatory factor analysis.
Confirmatory Factor Analysis
Confirmatory factor analysis is the statistical technique used to test the validity of the
measurement models of latent constructs (Byrne, 2010). According to Schumaer and Lomax
(2004) the purpose of confirmatory factor analysis is “to determine which sets of observed
variables share common variance-covariance characteristics that define theoretical constructs or
factors (latent variables)” (p. 168). Given a theoretically defined latent construct, confirmatory

80
factor analysis can show whether the loadings of observed factor indicators conform to the
defined construct (Garson, 2009).
Consistent with Wan‟s (2002) recommended approach, the analysis was conducted in
three phases. First, the appropriateness of the indicators was assessed by use of the critical ratio
of standardized regressions weights of each variable. Significance was tested at the .05 level.
The second step was to assess the overall model fit using goodness-of-fit statistics. The last step
was to improve the model fit through the use of modification indices (Wan, 2002; Schumaer and
Lomax, 2004).
There are two latent constructs in this study: the attitudinal dimension of social capital
and the behavioral dimension of social capital. Using the three-step process outlined above,
measurement models were developed and validated for each construct.
Attitudinal Dimension of Social Capital
Figure 9 shows the latent construct model for the attitudinal dimension of social capital
without correlated measurement errors (initial model). Figure 10 shows the latent construct
model for the attitudinal dimension of social capital with correlated measurement errors (revised
model). Non-normally distributed variables were normalized through transformation into the
square root of each variable. Table 18 shows the parameter estimates for the initial and revised
models and Table 19 shows the goodness-of-fit statistics for the initial and revised models.
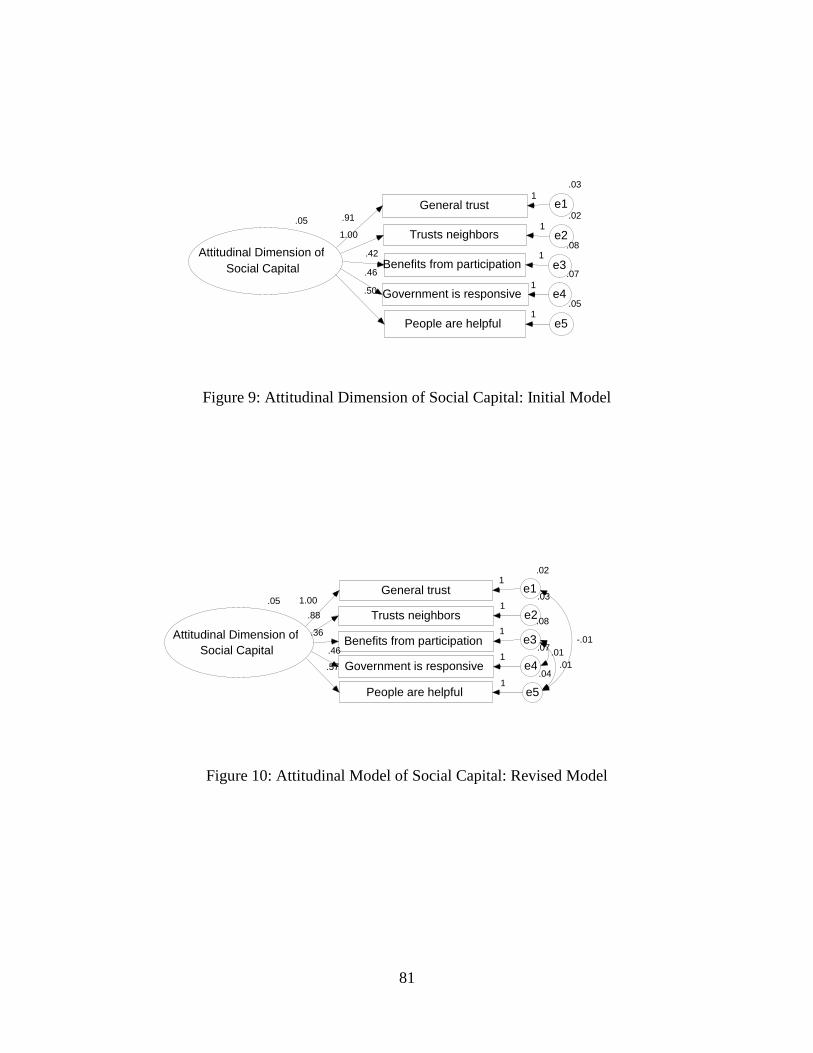
81
Figure 9: Attitudinal Dimension of Social Capital: Initial Model
Figure 10: Attitudinal Model of Social Capital: Revised Model
.05
Attitudinal Dimension of Social Capital
General trust
.02
e1 1.00
1
Trusts neighbors
.03
e2 .88 1
Benefits from participation
.08
e3 .36 1
Government is responsive
.07
e4 .46
1
People are helpful
.04
e5
.57 1
-.01
.01 .01
.05
Attitudinal Dimension of Social Capital
General trust
.03
e1 .91
1
Trusts neighbors
.02
e2 1.00 1
Benefits from participation
.08
e3 .42 1
Government is responsive
.07
e4
.46 1
People are helpful
.05
e5
.50
1
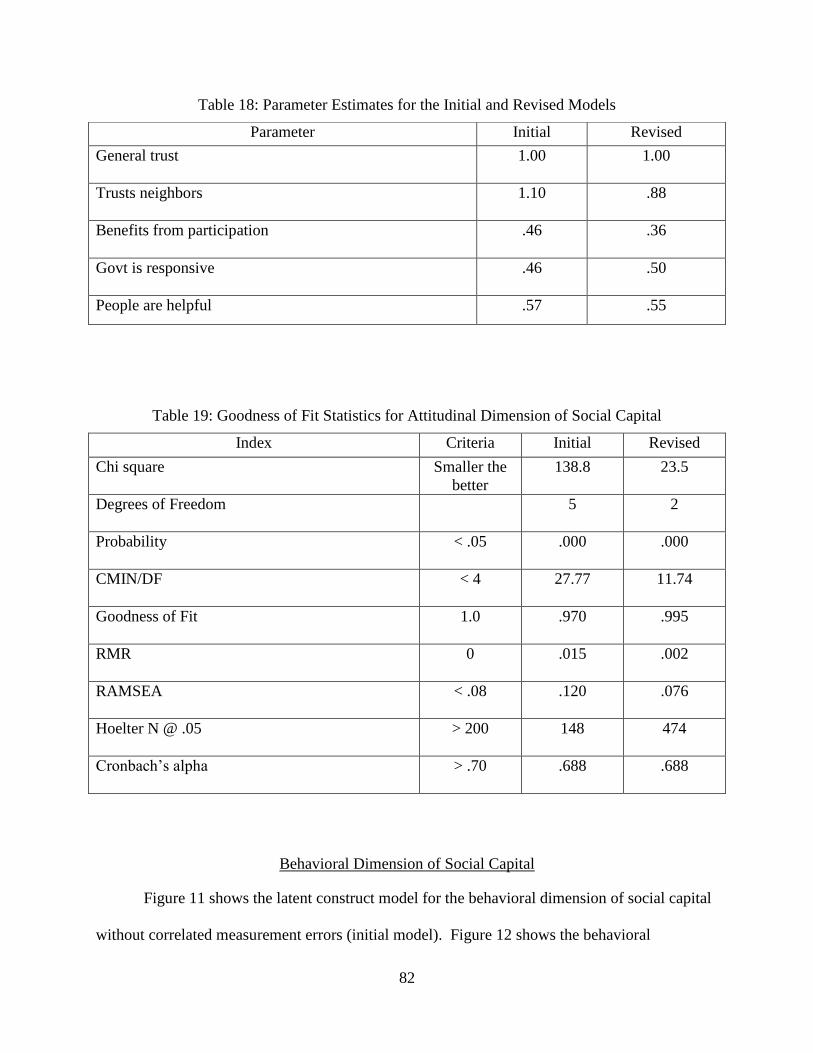
82
Table 18: Parameter Estimates for the Initial and Revised Models
Table 19: Goodness of Fit Statistics for Attitudinal Dimension of Social Capital
Behavioral Dimension of Social Capital
Figure 11 shows the latent construct model for the behavioral dimension of social capital
without correlated measurement errors (initial model). Figure 12 shows the behavioral
Parameter Initial Revised
General trust
1.00
1.00
Trusts neighbors
1.10
.88
Benefits from participation .46
.36
Govt is responsive .46
.50
People are helpful .57 .55
Index Criteria Initial Revised
Chi square Smaller the
better
138.8 23.5
Degrees of Freedom 5 2
Probability < .05 .000 .000
CMIN/DF < 4 27.77 11.74
Goodness of Fit 1.0 .970 .995
RMR 0 .015 .002
RAMSEA < .08 .120 .076
Hoelter N @ .05 > 200 148 474
Cronbach‟s alpha > .70 .688 .688

83
dimension of social capital with correlated measurement errors (revised model). Non-normally
distributed variables were transformed into either the square root of the variable or the log of the
variable, depending on which transformation procedure yielded more normality.
Figure 11: Behavioral Dimension of Social Capital: Initial Model
.09
Behavioral Dimension of Social Capital
Club member
.16
e1
.97
1
Church member
.23
e2 .26
1
Vote
.07
e3 .25 1
Interested in Politics
.83 .53
e4 1
Volunteers
.15
e5
.71
1
Makes nonchurch Donations
.15 e6
.49
1
Attends club meetings .12
e7
1.00
1
l

84
Figure 12: Behavioral Dimension of Social Capital: Revised Model
Table 20: Parameter Estimates for the Initial and Revised Models
Parameter Initial Revised
Club member
.97
.89
Church member
.26
.24
Votes
..24
.24
Interested in politics .83
.62
Volunteers .71 .68
Makes nonchurch donations .49 .46
Attends club meetings 1.00 1.00
.11
Behavioral Dimension of Social Capital
Club member
.17
e1
.87
1
Church member
.23
e2
.24
1
Vote
.06
e3 .25 1
Interested in Politics
.63 .55
e4 1
Volunteers .15
e5
.66 1
Makes nonchurch Donations
.16 e6
.42
1
Attends club Meetings
.11 e7
1.00
1
.03
-.01 .04

85
Table 21: Goodness of Fit Statistics for Behavioral Dimension of Social Capital
With the measurement models are now complete, the next step in the analysis was
hypothesis testing.
Hypothesis Testing
The purpose of this research was to explore several characteristics of the construct of
social capital. Social capital theory supported by a review of the literature led to the formulation
of four related research questions and four concomitant hypotheses. As discussed in Chapter
Three hypotheses one, two and three were tested using structural equation modeling.
Hypotheses One and Two
Hypotheses one and two are related and therefore were tested with the same structural
equation model.
Index Criteria Initial Revised
Chi square Smaller the
better
189.4 65.2
Degrees of Freedom 14 11
Probability < .05 .000 .000
CMIN/DF < 4 13.5 5.9
Goodness of Fit 1.0 .970 .991
RMR 0 .07 .01
RAMSEA < .08 .082 .052
Hoelter N @ .05 > 200 232 561
Cronbach‟s alpha > .70 .592 .592

86
R1: The first research question: Is social capital a two-dimensional construct?
H1: Social capital is a two-dimensional construct.
R2: The second research question: What is the relationship between the attitudinal
dimension of social capital and the behavioral dimension of social capital?
H2: The two dimensions are iterative and the attitudinal dimension more greatly
influences the behavioral dimension.
Figure 13 is the structural equation model developed to test hypotheses one and two.
Behavioral Dimension of
Social Capital
club member
church member
votes
interested in politics
volunteers
Attitudinal Dimension of
Social Capital
general trust
trusts neighbors
benefits from
participation
govt is
responsive
makes nonchurch
donations
attends club
meetings
people are
heplful
,0.02
z2
1
,0.08
e31
,0.07
e41
,0.04
e5
,0.03
e61
,0.04
e71
,0.01
e81
,0.07
e91
,0.03
e111
,0.03
e10
,0.02
e121
1
1
,0.03
e11
,0.03
e21
0
00.01
-0.01
0.01
0.01
0.22
1
0.94
0.42
0.48
0.6
0.87
0.26
0.27
0.59
0.68
0.45
1
Figure 13: Two-Dimensional Social Capital Model: Attitudes Influencing Behaviors
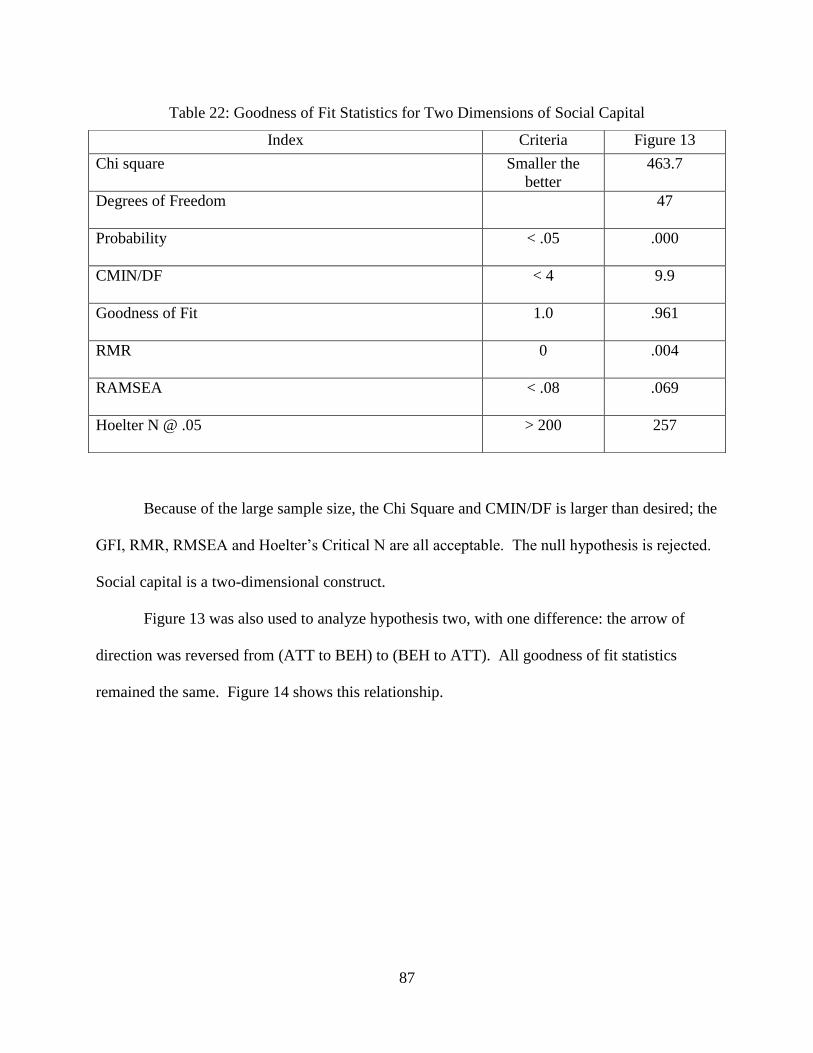
87
Table 22: Goodness of Fit Statistics for Two Dimensions of Social Capital
Because of the large sample size, the Chi Square and CMIN/DF is larger than desired; the
GFI, RMR, RMSEA and Hoelter‟s Critical N are all acceptable. The null hypothesis is rejected.
Social capital is a two-dimensional construct.
Figure 13 was also used to analyze hypothesis two, with one difference: the arrow of
direction was reversed from (ATT to BEH) to (BEH to ATT). All goodness of fit statistics
remained the same. Figure 14 shows this relationship.
Index Criteria Figure 13
Chi square Smaller the
better
463.7
Degrees of Freedom 47
Probability < .05 .000
CMIN/DF < 4 9.9
Goodness of Fit 1.0 .961
RMR 0 .004
RAMSEA < .08 .069
Hoelter N @ .05 > 200 257
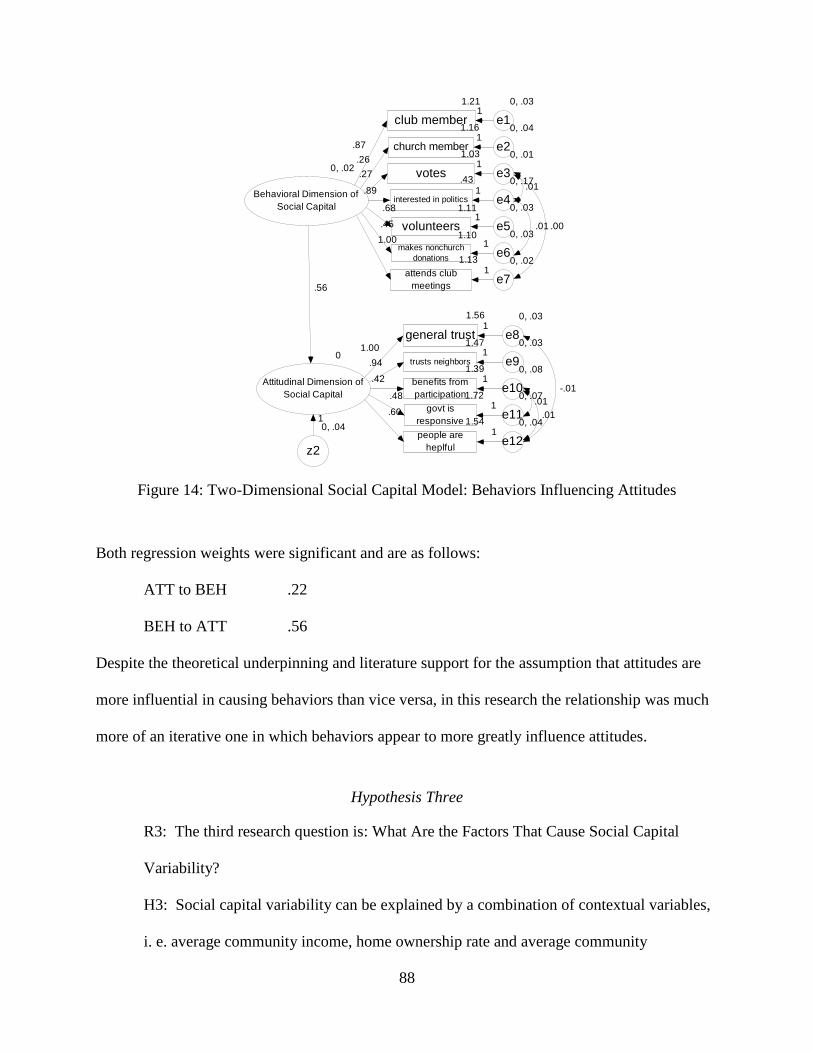
88
0, .02
Behavioral Dimension of
Social Capital
1.21
club member
0, .03
e1
.87
1
1.16
church member
0, .04
e2.26
1
1.03
votes
0, .01
e3.271
.43
interested in politics
0, .17
e4.89 1
1.11
volunteers
0, .03
e5
.681
0
Attitudinal Dimension of
Social Capital
1.56
general trust
0, .03
e81.00
1
1.47
trusts neighbors
0, .03
e9.941
1.39
benefits from
participation
0, .08
e10.42 1
1.72
govt is
responsive
0, .07
e11
.481
1.10
makes nonchurch
donations
0, .03
e6
.45
1
1.13
attends club
meetings
0, .02
e7
1.00
1
1.54
people are
heplful
0, .04
e12
.60
1
-.01
.01
.01
.00
.01
.01
0, .04
z2
1
.56
Figure 14: Two-Dimensional Social Capital Model: Behaviors Influencing Attitudes
Both regression weights were significant and are as follows:
ATT to BEH .22
BEH to ATT .56
Despite the theoretical underpinning and literature support for the assumption that attitudes are
more influential in causing behaviors than vice versa, in this research the relationship was much
more of an iterative one in which behaviors appear to more greatly influence attitudes.
Hypothesis Three
R3: The third research question is: What Are the Factors That Cause Social Capital
Variability?
H3: Social capital variability can be explained by a combination of contextual variables,
i. e. average community income, home ownership rate and average community

89
educational attainment, and ecological variables, i. e. duration of residence in a
community, self-reported health and personal education attainment.
Figure 15, Factors That Influence Social Capital Variability, is the structural equation model
to test Hypothesis Three.
0
Behavioral Dimension of
Social Capital
.90
club member1.06
church member.94
votes.09
interested in politics
.87
volunteers
0
Attitudinal Dimension of
Social Capital
1.10
general trust1.01
trusts neighbors1.18
benefits from
participation1.49
govt is
responsive
.93
makes nonchurch
donations.81
attends club
meetings
1.26
people are
heplful
2.93, .18
Avg Educ
Attainment
3.02, 1.89
Home
Ownership
3.01, 2.02
Personal
Income
1.35, .08
Personal Educ
Attainment
3.06, 2.00
Duration of
Residency
1.78, .58
Self Reported
Health
0, .04
z1
1
0, .01
z2
1
0, .03
e21
0, .03
e1
0, .08
e31
0, .07
e41
0, .04
e51
0, .03
e61
0, .04
e71
0, .01
e81
0, .17
e91
0, .03
e101
0, .03
e111
0, .02
e121
1
-.01
.00
.01
.00
.01
.00
.00
.01
.08
.00
.06
.06
.08
.01
.00
.03
.01
.00
1.00
.99
.45
.50
.61
.94
.29
.28
1.06
.50
1.00
.74
.18
Figure 15: Factors That Influence Social Capital Variability

90
Table 23: Goodness of Fit Statistics for Factors That Influence Social Capital Variability
Table 24: Regression Weights: Factors That Influence Social Capital Variability
Variable Regression
Weight to
Attitudes
Standardized
Regression
Weight to
Attitudes
P Score
On
Attitudes
Regression
Weight to
Behaviors
Standardized
Regression
Weight to
Behaviors
P Score
On
Behaviors
Personal
Income
.003
.019
.437
.002 .018 .517
Home
Ownership
.006 .040 .103 .006 .065 .016
Avg Educ
Attainment
.079 .164 .000 .035 .120 .000
Duration of
Residency
.002 .015 .590 -.002 -.021 .456
Self-Reported
Health
.062 .229 .000 .011 .069 .014
Personal Educ
Attainment
.064 .086 .000 .076 .170 .000
Index Criteria Figure 15
Chi square Smaller the
better
1539
Degrees of Freedom 122
Probability < .05 .000
CMIN/DF < 4 12.61
Comparative Fit Index 1.0 .681
RAMSEA < .08 .079
Hoelter N @ .05 > 200 180

91
As can be seen from Figure 15 and Table 24, only three of the tested factors are
significant: average community education attainment, self-reported health and personal
education attainment. Personal income is barely significant at the .05 level for attitudes and
neither community rate of home ownership nor duration of residence is a significant contributor
to social capital variability.
Figure 16 confirms the three factors that influence social capital variability.
0
Behavioral Dimension of
Social Capital
.92
club member1.07
church member.95
votes.11
interested in politics
.89
volunteers
0
Attitudinal Dimension of
Social Capital
1.13
general trust1.04
trusts neighbors1.19
benefits from
participation1.50
govt is
responsive
.94
makes nonchurch
donations.83
attends club
meetings
1.28
people are
heplful
2.93, .18
Avg Educ
Attainment
1.35, .08
Personal Educ
Attainment
1.78, .58
Self Reported
Health
0, .04
z1
1
0, .01
z2
1
0, .03
e21
0, .03
e1
0, .08
e31
0, .07
e41
0, .04
e51
0, .03
e61
0, .04
e71
0, .01
e81
0, .17
e91
0, .03
e101
0, .03
e111
0, .02
e121
1
-.01
.00
.01
.00
.01
.00
.08
.06
.06
.08
.01
.04
1.00
.99
.45
.50
.61
.93
.28
.27
1.05
.50
1.00
.74
.18
Figure 16: Factors That Influence Social Capital Variability: Revised
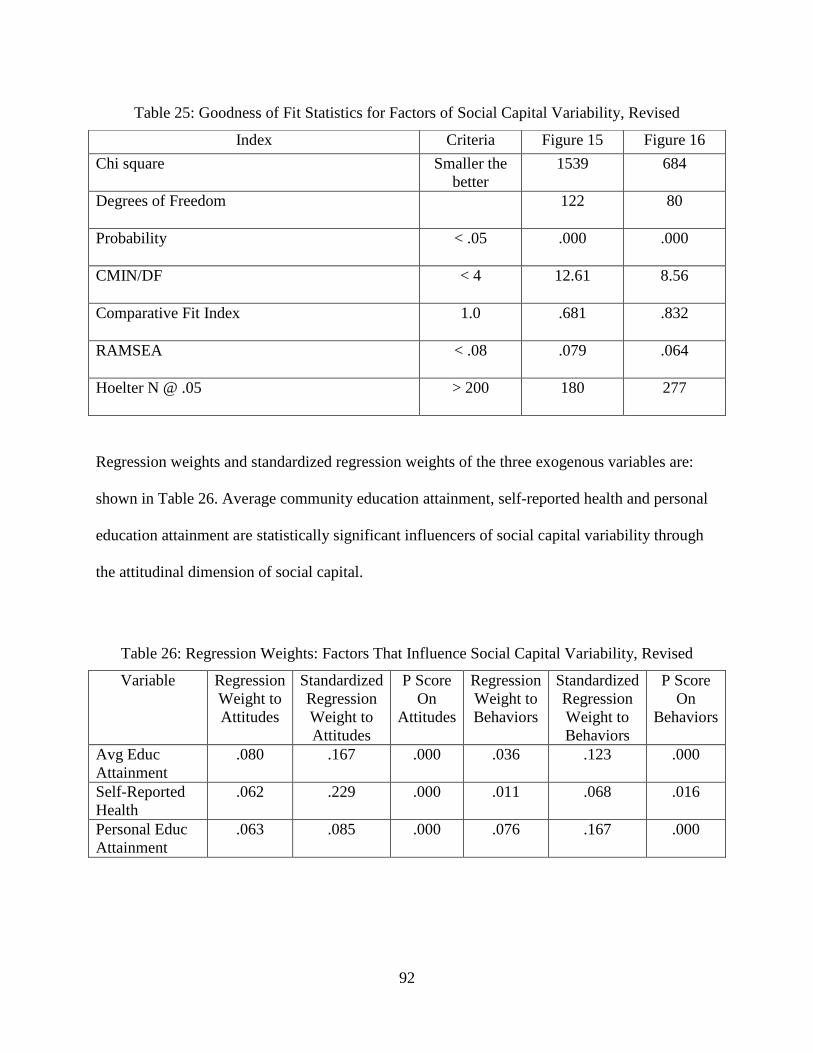
92
Table 25: Goodness of Fit Statistics for Factors of Social Capital Variability, Revised
Regression weights and standardized regression weights of the three exogenous variables are:
shown in Table 26. Average community education attainment, self-reported health and personal
education attainment are statistically significant influencers of social capital variability through
the attitudinal dimension of social capital.
Table 26: Regression Weights: Factors That Influence Social Capital Variability, Revised
Variable Regression
Weight to
Attitudes
Standardized
Regression
Weight to
Attitudes
P Score
On
Attitudes
Regression
Weight to
Behaviors
Standardized
Regression
Weight to
Behaviors
P Score
On
Behaviors
Avg Educ
Attainment
.080 .167 .000 .036 .123 .000
Self-Reported
Health
.062 .229 .000 .011 .068 .016
Personal Educ
Attainment
.063 .085 .000 .076 .167 .000
Index Criteria Figure 15 Figure 16
Chi square Smaller the
better
1539 684
Degrees of Freedom 122 80
Probability < .05 .000 .000
CMIN/DF < 4 12.61 8.56
Comparative Fit Index 1.0 .681 .832
RAMSEA < .08 .079 .064
Hoelter N @ .05 > 200 180 277

93
The conclusion is that only three of the factors that were hypothesized to influence social
capital variability are statistically significant. Furthermore, the variables do not divide on the
basis of ecology and context as theorized, but rather on the basis of education and health.
Hypothesis Four
The fourth research question and hypothesis concerned a specific behavior of social
capital, i. e. membership and participation in the Central Florida YMCA.
R4: The fourth research question: Does the Y contribute to individual social capital?
H4: Members of the Y have more social capital, ceteris paribus, than non-members of
the Y.
Because this hypothesis involves differences between Y members and non-Y members,
structural equation modeling was not the most appropriate method for testing the hypothesis.
The most appropriate way to test this hypothesis was with analysis of variance (ANOVA)
between the two groups on each variable of social capital. Confirmatory factor analysis found
there to be five indicators of the attitudes of social capital and seven indicators of the behaviors
of social capital. The variable “Y member” is tested against all twelve of these variables.
Table 27 shows the comparisons between Y members and non-Y members on the
attitudes of social capital and Table 28 shows the comparisons between Y members and non-Y
members on the behaviors of social capital. These tables show that there is a difference between
Y members and non-Y members but do not show the direction; consequently, a Means Plot was
done for each of the twelve variables. In every case Y members had higher social capital. The
difference is statistically significant at the .01 level for every variable except church
membership, which is significant at the .05 level. This research considers the .05 level to be
acceptable. The null hypothesis can be rejected.
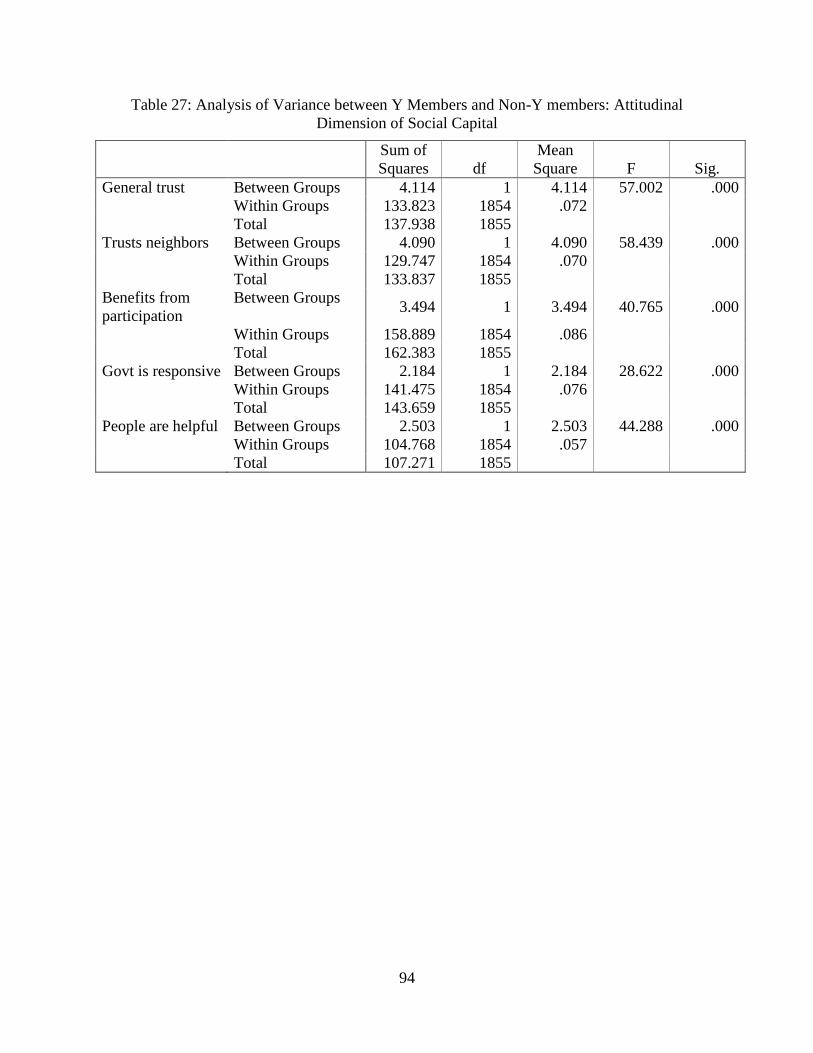
94
Table 27: Analysis of Variance between Y Members and Non-Y members: Attitudinal
Dimension of Social Capital
Sum of
Squares df
Mean
Square F Sig.
General trust Between Groups 4.114 1 4.114 57.002 .000
Within Groups 133.823 1854 .072
Total 137.938 1855
Trusts neighbors Between Groups 4.090 1 4.090 58.439 .000
Within Groups 129.747 1854 .070
Total 133.837 1855
Benefits from
participation
Between Groups 3.494 1 3.494 40.765 .000
Within Groups 158.889 1854 .086
Total 162.383 1855
Govt is responsive Between Groups 2.184 1 2.184 28.622 .000
Within Groups 141.475 1854 .076
Total 143.659 1855
People are helpful Between Groups 2.503 1 2.503 44.288 .000
Within Groups 104.768 1854 .057
Total 107.271 1855

95
Table 28: Analysis of Variance between Y Members and Non-Y members: Behavioral
Dimension of Social Capital
Sum of
Squares df
Mean
Square F Sig.
Club member Between Groups .939 1 .939 22.119 .000
Within Groups 78.667 1854 .042
Total 79.605 1855
Church member Between Groups .158 1 .158 3.929 .048
Within Groups 74.604 1854 .040
Total 74.762 1855
Votes Between Groups .471 1 .471 39.135 .000
Within Groups 22.319 1854 .012
Total 22.790 1855
Interested in
politics
Between Groups 2.831 1 2.831 15.113 .000
Within Groups 347.271 1854 .187
Total 350.101 1855
Volunteers Between Groups .544 1 .544 16.055 .000
Within Groups 62.836 1854 .034
Total 63.381 1855
Makes
nonchurch
donations
Between Groups
1.601 1 1.601 54.070 .000
Within Groups 54.898 1854 .030
Total 56.499 1855
Attends club
meetings
Between Groups 2.052 1 2.052 56.948 .000
Within Groups 66.808 1854 .036
Total 68.861 1855
Discussion of the Findings
This research had four research questions and four accompanying hypotheses. The first
two research questions are confirmed: social capital is a two-dimensional construct comprising
the attitudinal dimension of social capital and the behavioral dimension of social capital.
However, in contrast to the expectation suggested by the theoretical framework and the
literature, this research found that behavior may influence attitudes more than attitudes influence
behavior. Nevertheless the relationship is iterative and there is clear mutual influence.

96
The analysis has shown that while the factors that influence social capital are both
ecological and contextual, it is not those characteristics that most determine their influence. The
factors that most greatly influence social capital variability are education and self-reported
health. One of these, average community educational attainment, is contextual. Self-reported
health and personal educational attainment are ecological.
Regarding the YMCA and social capital, the members of the Central Florida Y have more
social capital, ceteris paribus, than non-Y members. The Y has embedded in its mission
statement the goal of building social capital however the existence of a mission statement does
not necessarily guarantee its fulfillment. This study has shown that the Y is fulfilling its mission.

97
CHAPTER FIVE: IMPLICATIONS, LIMITATIONS AND RECOMMENDATIONS FOR
FURTHER RESEARCH
Chapter Five discusses the implications of this research and its limitations, recommends
further research, and recaps the contributions of the research.
Implications of This Research
Paralleling section 1.4 earlier, the implications of the findings will be discussed in four
different contexts: the theoretical context, the public policy context, the managerial context and
the individual context.
Implications of the Research Findings for Social Capital Theory
The theory of social capital is relatively young and somewhat controversial. This
research has broadened the understanding of social capital theory in several important ways.
First, it confirmed the hypothesis that social capital is not a monolithic construct but rather a
clearly defined two-dimensional construct of which the attitudes and behaviors of social capital
are distinct components. It also confirmed the role of personal education and the educational
environment in generating social capital; this has enriched our understanding of both social
capital and human capital. Like human beings themselves and the human experience, social
capital is a complex. This research has brought insights to its theoretical basis.
Implications of the Research Findings for Public Policy
Policy makers have the mission of organizing public resources, including political will, to
create a community in which citizens can achieve maximum well-being, in which social capital
is essential. Thus, one purpose of public policy makers is to maximize social capital and this
research provides several insights into the most effective ways to do so.

98
This research provides clear evidence that education is the key. Among policy choices to
invest in home ownership programs, stable neighborhood programs, jobs and business creation
programs and/or education, this research argues for giving priority to education programs. A
recommendation to support education may not seem particularly novel, but this research
provides a direct link between not only personal educational attainment, but also between the
average educational level in a community and social capital in the community. This is a direct
link to greater benefit for everyone in a community. This research demonstrates that all citizens,
not just those with children in the school system, benefit from education programs.
This study‟s findings also have implications for public policies to build political will for
social capital programs. Both attitudes and behaviors of social capital must be addressed by
policy makers attempting to foster social capital. Focusing simply on one or the other dimension
will not be as effective as addressing both. Because attitudes and behavior are related and
iterative, a simultaneous message of “Stay in school, it‟s good for you” and “Support education,
it‟s good for all of us” will be more effective than one or the other in isolation.
The third implication for public policy relates to the insight that Y members have higher
social capital than non-Y members. Scarce public resources always require a careful
prioritization of the organizations and programs to support. It is now clear that the Y either: a)
causes social capital, b) provides a gathering place for citizens who already have greater social
capital, or c) both. Policy makers should encourage the construction and expansion of Y
facilities in their communities and support them.
The recognition that social capital is the bedrock of both community wellness and
individual prosperity is an important insight for public policy makers. Developing and
encouraging institutions, organizations and programs that build social capital will build healthier

99
communities in an effective and sustainable way. Targeted programs that address specific
pockets of poverty, poor health and poor education will always be a part of the policy tool kit,
but now a more fundamental approach can address all the ills of society simultaneously. That
approach, as supported by this research, is to focus on the building of social capital.
Managerial Implications of the Research Findings
The essence of management is measurement. A management axiom is that what gets
measured gets accomplished. Broadly speaking, managerial measurement is of two kinds:
efficiency and effectiveness. Efficiency measures the relationships between various institutional,
organizational or programmatic inputs and their related outputs. Because efficiency
measurement operates at the tactical level, in most cases it does not measure whether the outputs
are achieving a strategic mission. It is the measure of effectiveness that reveals whether a
mission is being accomplished. Managers of social service delivery organizations have applied
measures of efficiency and hoped that such measures were indicative of a contribution to
community and individual wellness. This research has now laid the foundation for a
management tool to measure effectiveness: social capital is the metric. If an institution,
organization or program builds social capital, it is building community wellness as well as
individual happiness for those it serves.
The YMCA‟s mission of building social capital has several implications for managers of
Y facilities and programs. Mission achievement can now be assessed for a geographic Y
Association and/or for a specific Family Center within an Association and/or for a program
within a Family Center. Managers can be measured and offered appropriate incentives, and good
managers can be differentiated from weak managers. Program development, messaging, training
and member service delivery can all be tailored toward building social capital and then measured
100
and modified as needed. Perhaps the most important implication for the Y is that more
sophisticated capital development can be used to seek funding for expanding and sustaining Y
services. More research is necessary to conclusively show a causal relationship between the Y
and social capital. Although this research‟s generalizability is limited to members of the Central
Florida Y who hold family memberships, and populations similar to them, nevertheless a strong
and positive relationship between the Y and social capital has been demonstrated. There are
undoubtedly both public and private sources of funds that would entertain an opportunity to
support an organization that is an evidence-based community builder.
Implications of the Research Findings for the Individual
It would be simplistic to suggest that the implications of this research to an individual are
to stay in school and join a Y. The implications for an individual go well beyond that. Direction
is provided to develop an evidence-based life plan for creating personal social capital. The
strongest indicators for behaviors of social capital are membership in a club or association and
regular attendance. Since there are numerous types of such organizations to choose from, one or
more is available to suit anyone‟s personal preferences. Although these preferences change over
the course of one‟s lifetime, there are clubs available to accommodate those changed
preferences. This research did not differentiate between various types of clubs and associations;
the basic implication for an individual is: join a club and get involved.
The second implication is: learn to trust. It will be good for you. If necessary take a
chance on “trusting the system.” Obtaining an education and living in a community that values
education will facilitate trust building, and being involved in a club or organization will
accelerate it. Conscious efforts to build trust will be rewarded. Seek out people‟s help and
101
reciprocate by helping others. These efforts will build social capital, promote community
wellness and enhance personal happiness.
Limitations of This Research
There are two major limitations to this research. First, the sample was taken from a
limited number of census blocks. Selecting from a limited number of census blocks was
intentional because part of the research was to obtain a preliminary sense of Y membership as an
indicator of social capital. Consequently the geographic scope was narrowed to where the most
Y members live. However, the narrow sample decreased the likelihood that the findings
unrelated to Y membership are transferable to other geographic areas. A second limitation is that
the study is cross-sectional. A one-time look at social capital variability is inadequate since
variability connotes time. Longitudinal research will confirm or refute the findings of this
research as well as bringing deeper understanding to the factors influencing variability.
Recommendations for Further Research
This research has laid the foundation for considerable further research. Two of the areas
for future research follow directly from the limitations discussed above. Several other areas
could expand on the findings of this research.
The first recommendation for future research is to expand the sample frame. As has been
noted several times in this paper, the sample frame was deliberately limited to those census
blocks from which Y members congregated. Since Y members are generally more affluent,
more educated and healthier, they are not representative of the general population, as the
demographic analysis of the survey respondents confirmed. For the findings of this research to

102
be generalizable to the entire population, the sample frame should be expanded to all census
blocks or at least a random sampling of all census blocks.
A second recommendation for further research is to conduct longitudinal studies. The
question of social capital variability inherently connotes time: things change over time. A
second aspect of the time dimension is the relationship of Y membership to social capital. A
strong association has been established, but causality has not. Causality has three characteristics:
1) a theoretical basis for believing that one thing may cause another, 2) a demonstrated
association, and 3) precedence in time of the causing agent relative to the effect. This research
established the first two but not the third. Longitudinal research can address both of these issues,
and the framework and structure has been laid for doing so.
A third recommendation for further research is to conduct an analysis in other YMCA
associations across the country and around the world. This research was both cross sectional and
single-site, i. e. the Central Florida YMCA. For the findings herein to be generalized to the
entire YMCA system, further research is necessary at other Y associations in other geographic
areas.
The relationship of Y members living in communities of greater social capital raises an
intriguing question; “Is there a ripple effect of a Y facility in a community to non-Y members
living in that community?” To put the question in terms that an economist would use, “If the Y
causes greater social capital in a community, are non-Y members free riders in the accumulation
of social capital?” Further research could investigate the possibility of such a ripple effect.
A fifth area for further research is further analysis into the relationship between the
characteristics of the geographic community and social capital. This research generated
considerable data at the census block level, and more data is available through ESRI and other
103
databases for deeper investigation into relationships between social capital and community
characteristics. Social capital geo-mapping will yield considerable insight into both the theory of
social capital and policies to foster social capital.
This study analyzed one organization and the behaviors associated with that organization;
the Central Florida YMCA and Y membership. More general behaviors in church membership,
civic and professional association membership and general interest in politics were also
analyzed. However, none of those areas is monolithic. Each type of organization within each
group has a somewhat different mission, a different set of beliefs and a different relationship to
the community. Furthermore, there is a range of behaviors of participation within these entities
that have differing implications for social capital. A sixth recommendation for further research
would be to study specific types of churches, specific types of civic and professional associations
and specific types of political behavior as they relate to social capital.
In other words, the Y is only one aspect of an array of entities related to social capital.
Other specific entities should be studied as well. A better understanding of each specific aspect
of community life as it relates to social capital will bring insight into the causes and effects of
social capital. Just as this research has brought insight to the theoretical, public policy,
managerial and individual levels, further research into other specific areas of community life will
do the same.
Finally, further research is recommended into the two dimensions of social capital, i. e.
the attitudes of social capital and the behaviors of social capital. Accepted beliefs and
psychological theory argue that attitudes and behaviors are iterative, but that attitudes more
strongly influence behavior than vice versa. But, while this research confirmed the iterative
104
nature of the two dimensions, it found that behaviors are a stronger influence than attitudes. This
is puzzling, and further research is recommended on this area.
Contributions
This research has provided meaningful insights into several aspects of social capital.
First, by treating social capital as an endogenous variable it has expanded the discussion of social
capital into a somewhat different direction than that of most social capital research. This
conceptualization positions social capital as an asset that can be identified, fostered and
ultimately measured. Most previous research conceptualized social capital as an endogenous
variable that was the underpinning, or cause, of certain positive aspects of human life.
Positioning social capital as an exogenous variable that itself has causes leads to an investigation
of what those causes are and how to encourage them through public policy and individual
choices. This research grouped possible causes into ecological and contextual causes. This
grouping, though somewhat instructive, is not conclusive. Education is the primary cause of
social capital variability. Personal educational attainment is an ecological factor, and average
community education is a contextual factor. The insight that education is a primary factor in the
rise and fall of social capital has far-reaching implications at all levels of society.
Another important contribution of this research is the dissection of social capital into the
dimensions of attitudes and behaviors. This follows from the question that if social capital
varies, and it is clear that it does, are attitudes or behaviors more responsible? It is clear that
social capital is indeed a two-dimensional construct. This research concluded that behavioral
changes have the greater impact on social capital variation.
This research also contributed to our understanding of one specific possible source of
social capital. The causal link, and its direction, between the YMCA and social capital remains

105
to be confirmed, but the association between the two is clear. At least in Central Florida the Y
seems to be achieving its mission of building strong families and strong communities through
connecting people. Y members are more connected to each other and to their community,
connections that are the basis of social capital.
Finally, in addition to the specific contributions described above, this research has made a
substantial contribution by laying the foundation for creating a proactive, evidence-based,
policy-oriented approach to building stronger communities and happier citizens by sustainable,
measurable increases in social capital.

106
APPENDIX A: UCF IRB LETTERS

107

108

109
APPENDIX B: SURVEY QUESTIONNAIRE

110
1. Generally speaking, would you say that most people can be trusted?
1. Agree strongly
2. Agree
3. Neither agree nor disagree
4. Disagree
5. Strongly disagree
2. Generally speaking, would you say that most people in your neighborhood can be
trusted?
1. Agree strongly
2. Agree
3. Neither agree nor disagree
4. Disagree
5. Disagree strongly
3. Generally speaking, would you say that government is responsive to the needs of the
people in your community?
1. Agree strongly
2. Agree
3. Neither agree nor disagree
4. Disagree
5. Disagree strongly
4. How would you describe your current state of health when comparing yourself with
others of your age?
1. Excellent
2. Good
3. Fair
4. Poor
5. Very poor
5. How interested are you in politics and national affairs?
1. Very interested
2. Somewhat interested
3. Don‟t know
4. Only slightly interested
5. Not at all interested
6. Did you vote in the last presidential election?
1. Yes
2. No
7. Are you a member of a local church or other house of worship?
1. Yes
2. No

111
8. Not including weddings and funerals, how often do you attend religious services?
1. Once a week or more often
2. Almost every week
3. Once or twice a month
4. Less often than twice a year
5. I am not a member of a house of worship
9. In the past twelve months, how often have you participated in activities at your place of
worship other than attending services? This could include teaching Sunday School,
serving on a committee, attending choir practice and so forth.
1. Once a week or more often
2. Almost every week
3. Once or twice a year
4. Never
5. I am not a member of a house of worship
10. Generally speaking, would you say that government and public programs are helpful to
you?
1. Strongly agree
2. Agree
3. Neither agree nor disagree
4. Disagree
5. Strongly disagree
11. Generally speaking, would you say that people in your community are helpful to you?
1. Strongly agree
2. Agree
3. Neither agree nor disagree
4. Disagree
5. Strongly disagree
12. Are you a member of the Central Florida YMCA?
1. Yes
2. No
13. How often do you exercise at the Central Florida YMCA?
1. Every week or more often
2. Once or twice a month
3. A few times a year
4. Never
5. I am not a member of the Central Florida YMCA
14. In the last twelve months, have you participated in, or helped at a YMCA event?
1. Yes
2. No

112
15. Do you belong to a service, civic or trade organization? This could include a veteran‟s
group, a neighborhood association, a Rotary or Kiwanis Club or professional or trade
association.
1. Yes
2. No
16. Participating in service, civic and/or trade organizations is beneficial to me.
1. Strongly agree
2. Agree
3. Neither agree nor disagree
4. Disagree
5. Disagree strongly
17. Generally speaking, would you say that the police in your local community can be
trusted?
1. Agree strongly
2. Agree
3. Neither agree nor disagree
4. Disagree
5. Disagree strongly
18. In the past year have you attended a club, civic or social organization event?
1. Yes
2. No
19. Other than for a religious organization or the YMCA, in the past year have you
volunteered your time? This could include volunteering for a health cause or to fight a
disease, a school or youth program, to help the elderly or poor, or to help a cultural or
civic group.
1. Yes
2. No
20. In the past year have you donated money to a church, synagogue or other religious
organization?
1. Yes
2. No
3. I am not a member of a religious organization
21. In the past year have you donated money to a non-religious charitable organization
including political candidates and political parties?
1. Yes
2. No
22. Participating in charitable organizations is beneficial to me.
1. Strongly agree
2. Agree

113
3. Neither agree nor disagree
4. Disagree
5. Strongly disagree
23. In the past twelve months how many times did you visit a doctor or dentist for treatment?
1. 0
2. 1-2
3. 3-4
4. 5 or more
24. In the past twelve months have you visited a doctor or dentist for preventive medical or
dental purposes?
1. Yes
2. No
25. What is your personal educational attainment?
1. Less than high school diploma
2. High school graduate
3. Some college
4. Bachelor‟s degree
5. Master‟s degree or higher
26. What is your marital status?
1. Married or living with a committed partner
2. Divorced or separated
3. Widowed
4. Never married
27. What is your age?
1. 18-29 years old
2. 30-39 years old
3. 40-49 years old
4. 50-59 years old
5. 60 or more years old
28. What do you consider to be your race or ethnicity?
1. White
2. African American
3. Hispanic
4. Other
29. What is your gender?
1. Male
2. Female

114
LIST OF REFERENCES
Aberson, C. L. (2010). Applied Power Analysis for the Behavioral Sciences. Routledge
Academic Press. New York.
Ainsworth, J. W. (2002). Why does it take a village? The mediation of neighbourhood effects on
educational achievement. Social Forces, 81(1): 117-52.
Ajzen, I., Timko, C. & White, J. B. (1982). Self-Monitoring and the attitude-behavior relation.
Journal of Personality and Social Psychology. 42 (3): 426-435.
Bachman, R. & Paternoster, P. (2004). Statistics for Criminology and Criminal Justive. New
York. McGraw-Hill.
Baron-Epel, O., Weinstein, R., Haviv-Mesika, A., Garty-Sandalon, N., & Green, M. (2008).
Individual-level analysis of social capital and health: A comparison of Arab and Jewish
Israelis. Social Science and Medicine. 66: 900-910.
Bartolini, S., Bilancini, E. & Pugno, M. (2008). Did the Decline in Social Capital Depress
Americans‟ Happiness? www.socialcapitalgateway.org.
Becker, P. & Dhinga, P. H. (2001). Religious involvement and volunteering: Implications for
civil society. Sociology of Religion, 62(3): 315-335.
Bentler, P. M. & Chou, C. P. (1987). Practical issues in structural modeling. Sociological
Methods and Research, 16(1): 87-117.
Bekkers, R. (2001). Giving time and/or money: Trade-off or spill-over? www.fss.uu.nl.
Berkman, L. F. & Kawachi, I. (2000). Social Epidemiology. Oxford: University Press.
Bourdieu, P. (1986). The forms of capital. In Richardson, J. (ed.) Handbook of Theory and
Research for the Sociology of Education. New York: Greenwood Press.
115
Bourdieu, P. & Wacquant, , L. J. D. (1992). An Invitation to Reflexive Sociology. Chicago:
University of Chicago Press.
Boxman, E. A. W., de Graaf, P. M. & Flap, H. D. (1991). The impact of social and human
capital on the income attainment of Dutch managers. Social Networks, 13:S, 51-73.
Brehm, J. & Rahn, W. (1997). Individual-level Evidence for the Causes and Consequences of
Social Capital. American Journal of Political Science. 41:3, July 1997.
Brewer, G. A. (2003). Building Social Capital: Civic Attitudes and Behavior of Public Servants.
Journal of Public Administration Research and Theory. 13:1.
Bright, A. D., Manfredo, M. J. & Bath, A. (1993). Application of the theory of reasoned action to
the National Park Service‟s Controlled Burn Policy. Journal of Leisure Research. 25: 3
263-280.
Brinberg, D. (1979). An examination of the determinants of intention and behavior: A
comparison of two models. Journal of Applied Psychology. 9 (6): 560-575.
Bryk, A. S., Lee, V. E. & Holland, P. B. (1993). Catholic Schools and the Common Good.
Cambridge, MA. Harvard University Press.
Brinberg, D. & Durand, J. (1983). Eating at fast-food restaurants: An analysis of using two
behavioral intention models. Journal of Applied Social Psychology. 13: 459-472.
Burrough, B. & Helyar, J. (1991). Barbarians at the Gate: The Fall of RJR Nabisco. New York:
Harper.
Caspi, A, Entner-Wright, B. R., Moffit, T. E. & Silva, P. A. (1998). Early failure in the labour
market: Childhood and adolescent predictors of unemployment in the transition to
adulthood. American Sociological Review, 63: 424-51.
116
Coleman, J. S. (1988). Social capital in the creation of human capital. American Journal of
Sociology, 94 Supplement: S95-S120.
Cote, S. & Healy, T. (2001). The well-being of nations. The role of human and social capital.
Organisation for Economic Co-operation and Development, Paris.
Cook, T. & Gronke, P (2001). The Dimensions of institutional trust: How distinct is public
confidence in the media. Paper prepared and delivered at the annual meeting of the
Midwest Political Sciences Association, Chicago. Available at
http://www.reed.edu/~gronkep/papers.html.
Costa, D. L. & Kahn, M. E. (2001). Understanding the Decline in Social Capital, 1952-1998.
Working Paper 8295. http://www.nber.org/papers/w8295. National Bureau of Economic
Research. Cambridge, MA.
Craig, Stephen C. (1993). The Malevolent Leaders: Popular Discontent in America. Boulder,
CO. Westview Press.
Cusack, T. R. (1999). Social capital, institutional structures, and democratic performance: a
comparative study of German local governments. European Journal of Political
Research, 35(1): 1-34.
Cuthill, M. (2002). Coolangatta: A Portrait of community well-being. Urban Policy and
Research, 20, 2: 187-203.
Dasgupta, P. & Serageldin, I. (2000). Social Capital: A Multifaceted Perspective. Washington,
DC: World Bank.
Delmas, M. A. & Toffel, M. W. (2008). Organizational responses to environmental demands:
opening the black box. Strategic Management Journal, 29)10): 1027-1055.
117
DeShon, R. P. (1998). A cautionary note on measurement error corrections in structural equation
models. Psychological Methods, 3: 412-423.
Ding, L., Velicer, W. F. & Harlow, L. L. (1995). Effects of estimation methods, number of
indicators per factor and improper solutions on structural equation modeling fit indices.
Structural Equation Modeling: A Multidisciplinary Journal., 2(2): 119-143.
DiPasquale, D. & Glaeser, E. L. (1998). Incentives and Social Capital: Are Homeowners Better
Citizens? Working Paper 6363. http://www.nber.org/papers/w6363. National Bureau of
Economic Research. Cambridge, MA.
Dolence, D. M. (2006). Tocquevillian political associations, social capital, and the centralizing
tendency of democracy in the United States. PhD Dissertatoin, Northern Illinois
University, United States – Illinois. Retrieved May 9, 2008, from Dissertations and
Theses: A& I Database. (Publication AAT 3227645).
Ellaway, A. & Macintyre, S. (2002). Social Capital and Self-Reported Health: Support for a
Contextual Mechanism. American Journal of Public Health. 90 (6): 988.
Engel, R. S. & Worden, R. E. (2003). Police officers‟ attitudes, behavior and supervisory
influences: An analysis of problem solving. Criminology, 41(1): 131-166.
Evans, M. & Syrett, S. (2007). Generating Social Capital? The Social Economy and Local
Economic Development. European Urban and Regional Studies. 14(1): 55-74.
Ewald, B. M. & Roberts, C. S. (1985). Contraceptive behavior in college-age males related to
Fishbein model. Advances in Nursing Science. 7 (3): 63-69.
Falk, I. (2000). Human capital and social capital: What‟s the difference? Adult Learning
Australia. www.ala.asn.au/commentaries.

118
Farina, F., O‟Higgins, N. & Sbriglia, P. (2008). Eliciting motives for trust and reciprocity by
attitudinal and behavioural measures. Discussion Paper IZA DP 3584 for Institute for the
Study of Labor. http://d.repec.org/n?u=RePEc:izadps:dp3584&f=soc.
Farrar, D. E. & Glauber, R. R. (1967). Multicollinearity in regression analysis: The problem
revisited. The Review of Economics and Statistics. 49(1): 92-107.
Ferguson, K. M. & Mindel, C. H. (2007). Modeling fear of crime in Dallas neighborhoods: A
test of social capital. Crime and Delinquency, 53, 2: 322-349.
Field, J. (2003). Social Capital. New York. Routledge.
Field, J. (2005). Social Capital and Lifelong Learning. Bristol, UK. Policy Press.
Fishbein, M. & Ajzen, I (1975). Belief, Attitude, Intention and Behavior: An Introduction to
Theory and Research. New Jersey. Prentice-Hall.
Fishbein, M. & Ajzen, I. (1980). Understanding Attitudes and Predicting Social Behavior. New
Jersey. Prentice-Hall.
Fukuyama, F. (1995). Trust: the Social Virtues and the Creation of Prosperity. Hamish
Hamilton. London.
Gambetta, D. (2000). Can we trust trust? In Gambetta, D. (ed.) Trust:Making and Breaking
Cooperative Relations, Department of Sociology. University of Oxford.
http://www.sociology.ox.ac.uk/papers/gambetta213-237.pdf.
Garson, G. D. (2009). Structured equation modeling. Retreived from
http//www.faculty.chass.nscu.edu/garson/PA765/structure.htm.
Glaeser, E. L., Laibson, D. & Sacerdote, B. (2002). An economic approach to social capital.
Economic Journal, 112(483): F437-F458.

119
Greeley, A. (1997). The other civic America: Religion and social capital. The American Prospect
32: 68-73.
Israel, G. D., Beaulieu, L. J. & Hartless, G. (2001). The influence of family and community
social capital on educational achievement. Rural Sociology, 66:43-68.
Helliwell, J. F. & Putnam, R. D. (1995). Economic Growth and Social Capital in Italy. Eastern
Economic Journal, 21(3): 295-307.
Helliwell, J. F. (2006). Well-Being, Social Capital, and Public Policy: What‟s New? Economic
Journal, 116: C34-C45.
Hall, P. A. (2002). Great Britain: The Role of Government and the Distribution of Social Capital.
In Putnam, R. D. (ed) Democracies in Flux. Oxford. Oxford University Press.
Hoe, S. L. (2008). Issues and procedures in adopting structural equation modeling technique.
Journal of Applied Quantitative Methods, 3(1): 76-83.
Hu, L. & Bentler, P. M. ((1999). Cutoff criteria for fit indexes in covariance structure analysis:
Conventional criteria versus new alternatives. Structural Equatoin Modeling, 6(1): 1-55.
Halpern, D. (2005). Social Capital. Malden, Ma: Polity Press
Kawachi, I, Kennedy, B.P., Lochner, K. & Prothrow-Stith, D. (1997). Social Capital, Income
Inequality, and Mortality. American Journal of Public Health. 87 (9): 1491-1498.
Kawachi, I., Kennedy, B. P. & Glass, R. (1999). Social Capital and Self-Rated Health: A
Contextual Analysis. American Journal of Public Health. 89 (8): 1187-1193.
Kim, D. & Kawachi, I. (2006). A multilevel analysis of key forms of community- and
individual-level social capital as predictors of self-rated health in the United States.
Journal of Urban Health: Bulletin of the New York Academy of Medicine, 83(5) 816-826.

120
Kline, R. B. (2005). Principles and Practice of Structural Equation Modeling. New York, The
Guilford Press.
Knack, S. (2002). Social capital and the quality of government: evidence from the states.
American Journal of Political Science, 46(4): 772-85.
Lam, P. (2000). As the flocks gather: How religion affects voluntary association participation.
American Sociological Association, Conference Paper.
Laumann, E. (1973). Bonds of Pluralism. New York, John Wiley.
Lelkes, O. (2006). Knowing what is good for you. Empirical analysis of personal preferences and
the “objective good”. Journal of Socio-Economics. 35(2): 285-307.
Lofland, J. (1996). Social Movement Organizations. New York, Aldine de Gruyer.
Loury, G. (1992). The economics of discrimination: getting to the core of the problem. Harvard
Journal of African American Public Policy, 1: 91-110.
Marmot, M. (2002). The Influence of Income on Health: Views of an Epidemiologist. Health
Affair, 21(2): 31-46.
McIntosh, Steve. (2007). Integral Consciousness and the Future of Evolution. St. Paul, MN:
Paragon Books.
McPherson, J., Popielarz, P., & Drobnic, S. (1992). Social networks and organizational
dynamics. American Sociological Review. 57: 153-170.
Meyers, L. S., Gamst, G. & Guarino, A. J. (2006). Applied multivariate research: Design and
interpretation. Thousand Oaks, CA. Sage Publications, Inc.
Miniard, P., Obermiller, C. & Page, T. (1982). Predicting behavior with intentions: A
comparison of conditional versus direct measures. Advances in Consumer Research. 9:
461-464.

121
Moir, S. L. (2004). Peeking from behind the curtain: Women leaders and service clubs. Master‟s
Thesis, Royal Roads University, Canada. Retreived May 9, 2008, from Dissertations and
These: A & I database. (Publication AAT MQ90509).
Munasib, Adbul (2005). Lifecycle of social networks: A dynamic analysis of social capital
accumulation. PhD dissertation, The Ohio State University. Retrieved May 2, 2008 from
Dissertations and Theses: A + I database. (Publication AAT 3177179.
Narayan, D &Pritchett, L. (1997). Cents and Sociability: Household Income and Social Capital.
Policy Research Working Paper. Social Development and Development Research Group,
Poverty and Human Resources. The World Bank. Washington, D. C.
Nieminen, T., Martelin, T., Koskinen, S., Simpura, J., Alanen, E., Harkanan, T., & Aromaa, A.
(2008). Measurement and socio-demographic variation of social capital in a large
population survey. Social Indicators Research. 85: 405-423.
Ostrom,E. & Ahn, T. K. eds. (2003). Foundations of Social Capital. Edward Elgar, Publisher.
Northhampton, MA.
Paldam, M. (2000). Social capital: One or many? Definition and measurement. Journal of
Economic Surveys, 14(5): 629-653.
Paldam, M. & Svendsen, G. T. (2000). An essay on social capital: Looking for the fire behind
the smoke. European Journal of Political Economy, 16(2): 339-66.
Pearce, J. (1993). The Organizational Behavior of Unpaid Workers. New York, Routledge.
Petrusevich, M.R. (2005). Social capital generators? A case study of industry associations within
the Vancouver New Media Cluster. Master‟s Thesis, Simon Fraser University, Canada.
Retrieved May 3, 2008 from Dissertations and Theses: A& I database. (Publication AAT
MR03576.

122
Podolny, J. & Baron, J. (1997). Resources and relationships: Social networks and mobility in the
workplace. American Sociological Review, 62: 673-93.
Powdthavee, N. (2007). Putting a Price Tag on Friends, Relatives, and Neighbours: Using
Surveys of Life Satisfaction to Value Social Relationships. Journal of Socio-Economics.
37(4): 1459-1480.
Putnam, R. D. (1993). Making Democracy Work: Civic Traditions in Modern Italy. Princeton, N.
J.: Princeton University Press.
Putnam, R. D. (1995). Tuning in, tuning out: The strange disappearance of social capital in
America. Political Science and Politics, 28: 1-20.
Putnam, R. D. (2000). Bowling Alone: The Collapse and Revival of American Community. New
York: Simon and Schuster.
Putnam, R. D. (2001). Social Capital: Measurement and consequences. In Helliwell, J. F. ed. The
Contribution of Human and Social Capital to Sustained Economic Growth and Well-
Being. Ottawa.
Rhodes, F., Stein, J. A., Fishbein, M., Goldstein, R. B. & Rotheram-Borus, M. J. (2007). Using
theory to understand how interventions work: Project RESPECT, condom use, and the
integrative model. AIDS and Behavior. 11, 3: 393-407.
Rosenfeld, R., Messner, S. F. & Baumer, E. (2001). Social capital and homicide, Social Forces,
80, 1, 283-309.
Rossel, J. (2002). The quality of democratic regimes: Robert Putnam‟s and Patrick Heller‟s
explanation of political performance in Italy and India. Politische Vierteljahresschrift, 43
(2); 302.

123
Sabatini, F. (2006). Social Capital Gateway – Resources for the Study of Social Capital.
http://www.socialcapitalgateway.org
Sampson, R. J. & Laub, J. H. (1993). Crime in the Making: Pathways and Turning Points
Through Life. Cambridge, MA: Harvard University Press.
Sampson, R. J., Raudebush, S. W., & Earls, F. (1997). Neighborhoods and violent crime: A
multilevel study of collective efficacy. Science, 277:918-24.
Schuller, T., Baron, S. & Field, J. (2000). Social capital: A review and critique. In Baron, S.,
Field, J. & Schuller, T. (eds) Social Capital: Critical Perspectives. Oxford: Oxford
University Press.
Schumaer, R. E. & Lomax, R. G. (2004). A Beginners Guide to Structural Equation Modeling.
(2nd
ed.). London. Lawrence Erlbaum Associates Publishers.
Shane, S. & Stuart, T. (1999). Organisational endowments and the performance of university
startups. Management Science, 48(1): 154-70.
Sheppard, B. H., Hartwick, J., & Warshaw, P. R. (1988). The theory of reasoned action: A meta-
analysis of past research with recommendations for modifications for future research.
Journal of Consumer Research, 15: 325-343.
Smith, D. J. (1995). Understanding the Underclass. London: Policy Studies Institute.
Smith, R. S. (2006). Discerning differences in social capital: The significance of interpersonal
network and neighborhood association structure on citizen participation. PhD
dissertation, Indiana University, United States – Indiana. Retrieved May 1, 2008 from
Dissertations and Theses: A & I database. Publication (AAT 3206874).
Social Capital Community Benchmark Survey (http://www.ropercenter.uconn.edu/).
124
Subramanian, S. V., Kawachi, I., & Kennedy, B. P. (2001). Does the state you live in make a
difference? Multilevel analysis of self-rated health in the US. Social Science & Medicine.
53: 9-19.
Subramanian, S. V., Kim, D. J., & Kawachi, I. (2002). Social trust and self-rated health in US
communities: A multilevel analysis. Journal of Urban Health: Bulletin of the New York
Academy of Medicine, 79 (4): S21-S34.
Sun, Y. (1998). The academic success of East-Asian students: an investment model. Social
Science Research, 27(4): 432-56.
Uzzi, B. (1999). Embeddedness in the making of financial capital: How social relations and
networks benefit firms seeking financing. American Sociological Review,64(4): 481-505.
Wan, T. T. H. (2002). Evidence-based health care management: Multivariate modeling
approaches. (1st ed.) Norwell, MA: Kluwer Academic Publishers.
Wan, T. T. H. & Lin, B. Y. J. (2003). Social capital, health status, and health services use among
older women in Almaty, Kazakhstan. Research in the Sociology of Health Care, 21: 163-
180.
Warshaw, P. R. & Davis, F. D. (1984). Self-understanding and the accuracy of behavioral
expectations. Personality and Social Psychology Bulletin. 10 (1): 111-118.
Warshaw, P. R. & Davis, F. D. (1985). Disentangling behavioral intention and behavioral
expectation. Journal of Experimental Social Psychology. 21 (3): 213-228.
Whitham, Monica Marlene. (2007). Living better together: The relationship between social
capital and quality of life in small towns. M. S. Dissertation, Iowa State University,
United States – Iowa. Retrieved February 27, 2008 from ProQuest Digital Dissertations
database. (Publication No. AAT 1443108)
125
Wuthnow, Robert. (1994). God and Mammon in America. New York. Free Press.
World Bank (1999). Poverty Net: Social Capital for Development.
http://www.worldbank.org/poverty/capital/index.html.
World Health Organization W. H. O. (1998). Social determinants of health: The solid facts.
(Regional Office for Europe/Copenhagen.
Woolcock, M. (1998). Social capital and economic development: Towards a theoretical synthesis
and policy framework. Theory and Society, 27: 151-208.
Woolcock, M. (2001). The place of social capital in understanding social and economic
outcomes. ISUMA Canadian Journal of Policy Research 2(1) 11-17.
Wright, Robert. (2000). Nonzero The Logic of Human Destiny. New York: Vintage Books.
Zhang, Z. & Wang, L. (2009). Statistical power analysis for growth curve models using SAS.
Behavior Research Methods. 41(4): 1083.
Zhao, X., Sayeed, S., Hornik, R., Fishbein, M., & Ahern, R. K. (2006). Targeting norm-related
beliefs about marijuana use in an adolescent population. Health Communication. 19 (3):
186-196.