Factors influencing the residence time of catchment waters ...
14
Factors influencing the residence time of catchment waters: A virtual experiment approach Sarah M. Dunn, 1 Jeffrey J. McDonnell, 2,3 and Kellie B. Vache ´ 4 Received 2 August 2006; revised 12 February 2007; accepted 27 February 2007; published 12 June 2007. [1] Estimates of mean residence time (MRT) are increasingly used as simple summary descriptors of the hydrological processes involving storage and mixing of water within catchment systems. Current understanding of the physical controls on MRT remains limited, and various hypotheses have been proposed to explain its variability between catchments. We present a series of virtual experiments to investigate different hypotheses regarding the significance of different hydrological processes and geographical controls in determining the MRT of catchment waters. The experiments were undertaken using a semidistributed conceptual hydrological model, applied to the Maimai experimental catchment in New Zealand. Our results show that in this small steep catchment, with largely impermeable bedrock, the primary control on the stream water mean residence time is storage within the unsaturated zone. The physical location on the hillslope had only a small influence on soil water residence time. Stream water mean residence time was very sensitive to small additional amounts of deep groundwater in the model. Overall, our results suggest that stream water MRT is additive. The component residence times of stream water MRT appear relatable to characteristic properties of the catchment. Through this mechanism there is future potential for extrapolating MRT data from experimental catchments to other areas. Citation: Dunn, S. M., J. J. McDonnell, and K. B. Vache ´ (2007), Factors influencing the residence time of catchment waters: A virtual experiment approach, Water Resour. Res., 43, W06408, doi:10.1029/2006WR005393. 1. Introduction [2] The use of hydrochemical and isotopic tracers to infer hydrological processes has become increasingly common in catchment hydrological studies (for reviews see Kendall and McDonnell [1998] and Divine and McDonnell [2005]). Unlike point-scale hydrometric observations, tracer techni- ques provide a means of obtaining spatially integrated information about catchment mixing that is relevant at all scales [Soulsby et al., 2000]. These data often provide complementary information to traditional flow measures at the catchment outlet for quantifying water flow paths [Bishop et al., 2004] and water sources [Burns, 2002]. One particular catchment measure that is sometimes esti- mated from tracer data is the stream water mean residence time (MRT) [Maloszewski and Zuber, 1993]. MRT, some- times defined as transit time [McGuire and McDonnell, 2006], or contact time in the subsurface [Burns et al., 1998], is the mean of the complete distribution of flow paths comprising the catchment subsurface control volume. The stream water (or catchment) MRT provides a simple de- scriptor of the effects of storage and mixing within the catchment in terms of its temporal response to precipitation inputs. Furthermore, the residence time distribution or system response function provides a concise expression of flow path heterogeneity at the catchment scale. In the context of this paper we use the term ‘‘catchment MRT’’ as the general term for the collection of component resi- dence times, that are described by soil water MRT, ground- water MRT and in-stream MRT. [3] While recent experimental studies have developed new quantitative approaches for computing stream water MRT from tracer data [Kirchner et al., 2000] and evaluated the assumptions associated with its calculation from tradi- tional tracer approaches [McGuire and McDonnell, 2006], few studies have examined how catchment characteristics control MRT. The lack of studies is due partly to the extreme field time demands and analytical costs of com- puting MRT, since many years and many hundreds of samples are required for analysis. As a result, the total number of studies that have reported MRT is small. MRT values for stream waters in small headwater catchments have ranged from a few months [Stewart and McDonnell, 1991] up to almost two years [Burns et al., 1998], but with an estimated MRT of groundwaters in some catchments greater than ten years [Rademacher et al., 2005; Reddy et al., 2006]. For large river basins, many studies report river MRT on the order of a decade [Michel, 1992]. Most studies to date have been designed to compute MRT of catchment soil water, groundwater and stream water at a particular site. [4] While studies are few, some hypotheses have been advanced to explain the catchment controls on MRT of stream waters. DeWalle et al. [1997] and Wolock et al. 1 Macaulay Institute, Aberdeen, UK. 2 Water Resources Section, Delft University of Technology, Delft, Netherlands. 3 On leave from Department of Forest Engineering, Oregon State University, Corvallis, Oregon, USA. 4 Institute for Landscape Ecology and Resources Management, Giessen, Germany. Copyright 2007 by the American Geophysical Union. 0043-1397/07/2006WR005393 W06408 WATER RESOURCES RESEARCH, VOL. 43, W06408, doi:10.1029/2006WR005393, 2007 1 of 14
Transcript of Factors influencing the residence time of catchment waters ...

Factors influencing the residence time of catchment waters:
A virtual experiment approach
Sarah M. Dunn,1 Jeffrey J. McDonnell,2,3 and Kellie B. Vache4
Received 2 August 2006; revised 12 February 2007; accepted 27 February 2007; published 12 June 2007.
[1] Estimates of mean residence time (MRT) are increasingly used as simple summarydescriptors of the hydrological processes involving storage and mixing of water withincatchment systems. Current understanding of the physical controls on MRT remainslimited, and various hypotheses have been proposed to explain its variability betweencatchments. We present a series of virtual experiments to investigate different hypothesesregarding the significance of different hydrological processes and geographical controls indetermining the MRT of catchment waters. The experiments were undertaken using asemidistributed conceptual hydrological model, applied to the Maimai experimentalcatchment in New Zealand. Our results show that in this small steep catchment, withlargely impermeable bedrock, the primary control on the stream water mean residencetime is storage within the unsaturated zone. The physical location on the hillslope had onlya small influence on soil water residence time. Stream water mean residence time was verysensitive to small additional amounts of deep groundwater in the model. Overall, ourresults suggest that stream water MRT is additive. The component residence times ofstream water MRT appear relatable to characteristic properties of the catchment. Throughthis mechanism there is future potential for extrapolating MRT data from experimentalcatchments to other areas.
Citation: Dunn, S. M., J. J. McDonnell, and K. B. Vache (2007), Factors influencing the residence time of catchment waters: Avirtual experiment approach, Water Resour. Res., 43, W06408, doi:10.1029/2006WR005393.
1. Introduction
[2] The use of hydrochemical and isotopic tracers to inferhydrological processes has become increasingly common incatchment hydrological studies (for reviews see Kendalland McDonnell [1998] and Divine and McDonnell [2005]).Unlike point-scale hydrometric observations, tracer techni-ques provide a means of obtaining spatially integratedinformation about catchment mixing that is relevant at allscales [Soulsby et al., 2000]. These data often providecomplementary information to traditional flow measures atthe catchment outlet for quantifying water flow paths[Bishop et al., 2004] and water sources [Burns, 2002].One particular catchment measure that is sometimes esti-mated from tracer data is the stream water mean residencetime (MRT) [Maloszewski and Zuber, 1993]. MRT, some-times defined as transit time [McGuire and McDonnell,2006], or contact time in the subsurface [Burns et al., 1998],is the mean of the complete distribution of flow pathscomprising the catchment subsurface control volume. Thestream water (or catchment) MRT provides a simple de-scriptor of the effects of storage and mixing within the
catchment in terms of its temporal response to precipitationinputs. Furthermore, the residence time distribution orsystem response function provides a concise expression offlow path heterogeneity at the catchment scale. In thecontext of this paper we use the term ‘‘catchment MRT’’as the general term for the collection of component resi-dence times, that are described by soil water MRT, ground-water MRT and in-stream MRT.[3] While recent experimental studies have developed
new quantitative approaches for computing stream waterMRT from tracer data [Kirchner et al., 2000] and evaluatedthe assumptions associated with its calculation from tradi-tional tracer approaches [McGuire and McDonnell, 2006],few studies have examined how catchment characteristicscontrol MRT. The lack of studies is due partly to theextreme field time demands and analytical costs of com-puting MRT, since many years and many hundreds ofsamples are required for analysis. As a result, the totalnumber of studies that have reported MRT is small. MRTvalues for stream waters in small headwater catchmentshave ranged from a few months [Stewart and McDonnell,1991] up to almost two years [Burns et al., 1998], but withan estimated MRT of groundwaters in some catchmentsgreater than ten years [Rademacher et al., 2005; Reddy etal., 2006]. For large river basins, many studies report riverMRT on the order of a decade [Michel, 1992]. Most studiesto date have been designed to compute MRT of catchmentsoil water, groundwater and stream water at a particular site.[4] While studies are few, some hypotheses have been
advanced to explain the catchment controls on MRT ofstream waters. DeWalle et al. [1997] and Wolock et al.
1Macaulay Institute, Aberdeen, UK.2Water Resources Section, Delft University of Technology, Delft,
Netherlands.3On leave from Department of Forest Engineering, Oregon State
University, Corvallis, Oregon, USA.4Institute for Landscape Ecology and Resources Management, Giessen,
Germany.
Copyright 2007 by the American Geophysical Union.0043-1397/07/2006WR005393
W06408
WATER RESOURCES RESEARCH, VOL. 43, W06408, doi:10.1029/2006WR005393, 2007
1 of 14

[1997] have suggested that MRT may be correlated withcatchment size, using the argument that greater groundwaterstorage and mixing occurs in larger catchments because oflonger flow paths for subsurface flow, together with shal-lower gradients in wider valley floors. Other studies havesuggested that topography controls stream MRT. Stewartand McDonnell [1991] and Rodhe et al. [1996] found thatMRT of soil waters increased down a hillslope with in-creasing flow length. This hypothesis was later rejected byAsano et al. [2002] for catchments with permeable bedrockwhere there was no evidence for downslope water ageing.Buttle et al. [2001] also examined the influence of topog-raphy on groundwater residence times by searching for anassociation between the ln (a/tan b) topographic index andresidence time. No strong relationship was found betweenthe values, suggesting that in their catchments, topographywas not the key driver of MRT. However, groundwaterresidence times were found to increase with proximity to thestream [Monteith et al., 2006]. Recently, McGlynn et al.[2004] and McGuire et al. [2005] presented data acrossmultiple nested catchment scales and found a positivecorrelation between catchment MRT and both the flowlength and the flow path gradient derived from a catchmentdigital elevation model (DEM). A further group of studieshave examined the relationship between the catchmentMRT and the distribution of soil types within a catchment[Rodgers et al., 2005; Soulsby et al., 2006]. In particular,Soulsby et al. [2006] identified relationships between thepercentage of freely draining soils and the percentage ofpeaty soils and the catchment MRT. These results indicateda quite different set of controlling processes on the MRT tothose linking MRT to topography.[5] The integrative nature of MRT, capturing the response
of catchments including heterogeneity, suggests that it mayprove to be a useful measurement from the standpoint ofmodel evaluation. Uhlenbrook and Leibundgut [2002] andmore recently Vache and McDonnell [2006] and others havebegun to investigate its use as a catchment model diagnosticand model evaluation tool. The fact that MRT probes analternative axis of catchment response to that revealedthrough the standard catchment hydrograph (namely particletransport as opposed to pressure wave propagation) meansthat it is a useful tool for discriminating catchment storageand mixing processes. In this paper, we argue that exami-nation of the physical controls on MRT is a critical next stepin catchment hydrology and precondition for its continueduse as a model diagnostic. While intercomparison of exist-ing MRT data from catchments around the world wouldbe the best way to start [Jones and Swanson, 2001], thereare unfortunately, insufficient data sets available for interwatershed comparison and analysis of the factors affectingstream MRT. Therefore we have developed a novel meth-odology, based on the virtual experiment approach ofWeilerand McDonnell [2004], to examine how the catchmentMRT disaggregates into different components for eachprocess occurring in the catchment. We define the virtualexperiments as numerical experiments driven by knowledgeof field behavior, and the mathematical model is used as alearning tool for understanding the MRT phenomenon.Thus, from the results of the experiments, we can develophypotheses about how catchment topography, geology andsoil drainage processes influence the catchment MRT.
[6] The main objective of this paper is to investigatedifferent hypotheses regarding the significance of hydrolog-ical processes and geographical controls in determining theMRT of water within a catchment. Specifically we explorehow soil porosity, unsaturated zone processes, flow pathlength and gradient, deep groundwater storage and riparianzone storage each affect computed stream water MRT. Thewell studied Maimai catchment in New Zealand is used asour case study, with a rich history of research providingappropriate field intelligence about hydrological processesand residence times (see McGlynn et al. [2002] for review).
2. Experimental Approach
[7] The basis of the experimental approach for the studywas to use a conceptual hydrological model to run a seriesof simulations designed to test how different physicalfactors could influence the residence time distributions ofwater in a catchment. The structure of the model codeenabled several different formulations of the model to beexecuted, by including and excluding different processesfrom the simulations. In this way it was possible to test thesensitivity of the modeled residence times to particularmodel components. In addition, topographic influencescould be tested through simple manipulation of the under-pinning digital terrain model.
2.1. Model Code
[8] A new model code, STorage REsidence times AndMixing in catchments (STREAM), was developed for theanalysis, based on two previous semidistributed conceptualmodels: DIY [Dunn et al., 1998] and NIRAMS [Dunn etal., 2004]. The STREAM model is coded in VB.net andloosely linked to a GIS via ArcGIS ascii grid input/outputfiles. The catchment is represented in STREAM by a grid ofsquare cells, typically of 10–50 m in size, each of which ischaracterized by a range of properties including elevation,soil type and several topographic descriptors. The topo-graphic descriptors define how the hydrology of each cell islinked with the remainder of the catchment, as well as therouting of flows from the land to the stream.[9] For each grid cell, effective precipitation (rainfall
minus evapotranspiration) is added to a soil store, wherea water balance is calculated at each time step. A fractionof the soil water drains to both a near surface andsubsurface store, at a rate dependent on the soil waterstore. If the soil is fully saturated, direct surface runoffalso occurs. The full set of equations for the soil waterbalance is detailed by Dunn et al. [2004]. The waterbalance equation for the soil store is
SSi;t ¼ SSi;t"1 þ Pi;t " DNSi;t"1 " DGi;t"1 " EXi;t"1 ð1Þ
where SSi,t is the soil storage for cell i at time t (m), Pi,t isthe net precipitation (precipitation minus evapotranspira-tion) (m), DNS is the drainage to the near surface store (m),DG is the drainage to the shallow groundwater (m) and EXis the loss by saturation excess surface runoff (m).[10] Water from both surface runoff (EX) and the near
surface store (DNS) is assumed to flow directly to thestream network, via macropores, rills and small channels,
2 of 14
W06408 DUNN ET AL.: RESIDENCE TIME OF CATCHMENT WATERS W06408

at a rate that is sufficiently rapid to neglect the detailedrouting of the flow down the hillslope.[11] Water from the subsurface store of each grid cell
generates shallow groundwater flow. The flow is routed to asurface stream via a series of hillslope cells, definedaccording to the topographic location of the grid cell. Thesimulation for each individual grid cell can be performedindependently of all other cells in the catchment, as therouting function for each cell is disaggregated from neigh-boring cells. The approach is very similar to that appliedwithin the DIY model [Dunn et al., 1998] except that withinSTREAM the routing equation includes a weighting factorto account for the position of each hillslope routing cell inrelation to the remainder of the catchment. The shallowgroundwater flow is defined by:
QGi;t ¼ KG& GSi;t & SlDi &W & Fi ð2Þ
where QGi,t is the flow for cell i at time t (m3 s"1), KG is theshallow groundwater rate parameter (m s"1), GSi,t is thesubsurface store, SlDi is the slope from cell i to the streamvia its flow path (m/m), W is the dimension of the cell (m)and F is a topographic weighting factor.[12] GS is calculated for each routing cell by
GSi;t ¼ GSt"1 þ QGi"1;t"1 " QGi;t"1
! "
&Dt=W 2 ð3Þ
[13] F is defined for each cell i by
Fi ¼SlDi
SlDi þ SlUi & UAið Þð Þ ð4Þ
[14] The variable F accounts for the influence of topo-graphic location in modifying the dynamics between theflow rate, QG, and the shallow groundwater storage, GS.Greater upslope contributing areas will lead to greaterstorage in the cell. However, the discharge rate dependson the tradeoff between the slope uphill of the cell (SlU),and that downhill of the cell (SlD) as well as the storage. IfSlU is large relative to SlD, then the cell will tend toaccumulate greater storage than if the reverse scenario istrue. Where there is a uniform gradient, the only influencingtopographic factor becomes the upslope contributing area(or number of cells), UA (-). The initial conditions for GSare calculated to account for these dynamics by weightingthe storage by 1/F. This gives greater storage of waterwithin the cells with low values of F.[15] The shallow groundwater flow is routed through the
appropriate number of cells to correspond to its physicallocation in the catchment, relative to the stream network.Thus the transport occurs over a lateral distance equivalentto the flow length from each cell to the stream. The flowcalculated for the final hillslope routing cell in each case isassumed to be the discharge to the stream cell (or ripariancell if a riparian storage is included in the model).[16] An optional additional deep groundwater flow has
been included in the STREAM model to represent a flowpath mechanism that is insensitive to short-term variabilityin soil moisture. This is produced by a steady uniformrecharge from the soil storage to a deep groundwater store.The deep groundwater is then routed down a simplified
hillslope (defined for each cell by the mean slope to thestream, and the flow length to the stream). The deepgroundwater is not routed through intermediate cells inthe same manner as the shallow flows, as it is consideredto be much less variable both spatially and temporally. Thedeep groundwater recharge rate is estimated from thestreamflow hydrograph for the catchment as the lowestmeasured flow rate, assumed to be evenly distributed acrossthe catchment.[17] Finally, in order to investigate the potential influence
of riparian storage on catchment responses, another optionalcomponent has been included in STREAM. This defines anadditional storage, adjacent to the stream, through which allflows can be routed. The riparian store can be assigned avariable width, depending on the size of the streams, andhas a variable depth determined by the soil depth. Flowsfrom the riparian storage are assumed to discharge directlyto the streams.[18] The total catchment streamflow is calculated either
by summation of the flows from each riparian cell to thestream, or else by summation of the routed flows originatingfrom each cell in the catchment (when riparian cells are notmodeled). In-stream routing of flows within the catchmentis not included in the model.[19] A set of equations defining the transport of a
conservative solute tracer are associated with each of theflow equations. The tracer is assumed to be fully mixedwithin each of the stores through which it passes. Anoptional effective porosity term is also included to accountfor the potential influence of immobile water on tracermovement. The inclusion of an effective porosity value(between 0 and 1) means that the transport of the tracer isassociated with only a portion of the total available porosity,which effectively disaggregates its response from the dis-charge response. A mechanism of this type has beenobserved in unsaturated transport for a wide range of soils,although reported proportions of immobile water are quitevariable. Lindgren et al. [2004] and Destouni et al. [1994]calculated typical values of 2:1 for the ratio of immobilewater to mobile water from both experimental and modelingstudies. Buttle and Sami [1990] found somewhat lowervalues, with the immobile water accounting for up to 19%of the total volume. For each modeled flow the associatedflux of tracer, TF (kg), is defined by
TF ¼ TS & Q&Dt & EP
S &W 2ð5Þ
where TS is the mass of tracer stored in the compartment(kg), Q is the water flow for a particular model component(m3 s"1), Dt is the time step (s), EP is the effective porosityfor transport through the compartment (-), S is the depth ofwater stored in the compartment (m) and W is the size of thecompartment (m). This form of equation applies to thefluxes from the soil storage, the shallow subsurface flow,the near surface flow, the deep groundwater storage and theriparian storage, although in many cases the value of EPwill be assumed to be equal to one.[20] There are a total of 14 potential parameters of the
model, depending on which particular components areimplemented. The parameters are summarized in Table 1,together with details of how the parameters are determined.
W06408 DUNN ET AL.: RESIDENCE TIME OF CATCHMENT WATERS
3 of 14
W06408

Some of the parameters are based on experimental data,others are derived from observed hydrological character-istics of the catchment, and some are based solely on themodel calibration. In theory some of the parameters couldtake spatially varying values (e.g., to represent soil vari-ability). However, where calibration is required and fewspatial validation data are available, there is little sense inimplementing this because it would increase the degrees offreedom within the calibration procedure, without anyphysical justification.[21] The model calibration is undertaken in stages. Ini-
tially, where possible, values for the water balance drainageparameters CV and CL are evaluated to give an appropriatesplit between the proportion of surface/near surface andgroundwater flows. Such data may be available from anend-member mixing analysis [Soulsby and Dunn, 2003;Dunn et al., 2006]. Following this, other flow parametersare calibrated using the historic discharge record for thecatchment. As demonstrated by many previous studies [e.g.,Beven and Binley, 1992; Freer et al., 1996] there is an issueregarding equifinality of possible model parameterizations.However, utilization of the catchment MRT can potentiallybe used as a means of constraining the resulting parametervalues [Vache and McDonnell, 2006]. In the context of thisstudy, the absolute parameterization of the model was lessof an issue than the exploration of the influences on theprediction of catchment MRT.
2.2. Study Area
[22] The study area for the modeling experiments was theMaimai (M8) catchment in New Zealand. The Maimaigroup of catchments has been the site of experimental fieldstudies since the 1970s including studies focused on resi-dence time calculation and tracer tests on flow path and flowsource [McDonnell et al., 1991; Stewart and McDonnell,1991]. The M8 catchment was selected for this study largelybecause of its history of research, which means that under-standing of the processes operating in the catchment is welldeveloped and residence time data are available as well asstreamflows. In addition, the physical characteristics andhydrological behavior of the catchment are comparativelysimple and spatially homogeneous.[23] The physical characteristics of the Maimai catch-
ments have been described by Pearce et al. [1986] andMcDonnell [1990]. The M8 catchment covers an area of3.9 ha, and is steep, wet and highly responsive. The mean
slope of the M8 catchment is 34o, with a relatively shorthillslope length of around 30 m. The soils are relativelyshallow (0.2–1.8 m) and consist of podsolized stony yellow-brown earths, overlain by a well-developed thick humichorizon. The catchment is underlain by a firmly compacted,moderately weathered early Pleistocene conglomerate, whichis considered to be largely impermeable [Mosley, 1979].There is a vegetation cover of mixed evergreen forest. Theannual average precipitation is around 2600 mm, of whichapproximately 1550 mm forms stream runoff.[24] The principal flow process in the Maimai M8 catch-
ment is believed to be subsurface hillslope runoff. Duringlow-flow conditions, slow continual downslope drainagesustains streamflows, with water from upslope areas mixingwith and displacing downslope soil water. This mechanismresults in a progressive ageing of water downslope [Stewartand McDonnell, 1991]. During high-flow events the sub-surface flows are supplemented by the development ofhighly transient macropore-driven processes which rapidlydeliver large volumes of previously stored water to first-order stream bank zones [McDonnell, 1990]. The imperme-able nature of the bedrock means that only a small percent-age of the catchment runoff is believed to be sourced fromdeeper groundwater.[25] Measurements of d18O in the stream and rainwater
have been used to estimate a MRT for Maimai of 4 ±1 month [Pearce et al., 1986]. This is considered to be arelatively short residence time when compared to othercatchments, but it is not surprising given the steep andresponsive nature of the area and largely impermeableunderlying bedrock. Results from a different tracer experi-ment, based on deuterium analysis, calculated mean resi-dence times for soil water in a number of locations aroundthe M8 catchment ranging from 13 days for shallow soils onmidslope locations, to 42 days for soil at 400 mm depth onmidslopes and 63 days for soil at 800 mm depth near thestream [Stewart and McDonnell, 1991].[26] These results from previous experimentation provided
a set of baseline understanding and data for the modelingexperiments carried out in this study.
2.3. Virtual Experiments
[27] Prior to execution of the model experiments, abaseline hydrological model of the Maimai catchment wasset up and calibrated to provide a believable representationof the catchment hydrology, based on the historical analysis
Table 1. Parameters of the STREAM Model
Variable Units Description Model Component Identification Methodology
FC m soil field capacity soil water balance based on physical dataSC m soil saturated capacity soil water balance based on physical data8 % soil porosity soil water balance based on physical dataCV s"1 subsurface drainage parameter soil water balance calibration including data on flow path proportionsCL s"1 bypass flow loss parameter soil water balance calibration including data on flow path proportionsEP Uz % effective porosity soil water balance calibration including MRTKS m s"1 near-surface rate parameter near-surface flow routing calibration including high-streamflow responseKG m s"1 shallow groundwater rate parameter groundwater hillslope routing calibration using streamflow responseEP Gw % effective porosity shallow groundwater flow calibration including MRTR m s"1 recharge rate of deep groundwater deep groundwater estimation from stream base flowDGI m initial depth of deep groundwater store deep groundwater estimation in conjunction with dGwK from base flowKDG m s"1 groundwater conductivity deep groundwater estimation in conjunction with dGwsInit from base flowRW m width of riparian zone riparian based on catchment topographyKR m s"1 riparian rate parameter riparian calibration
4 of 14
W06408 DUNN ET AL.: RESIDENCE TIME OF CATCHMENT WATERS W06408
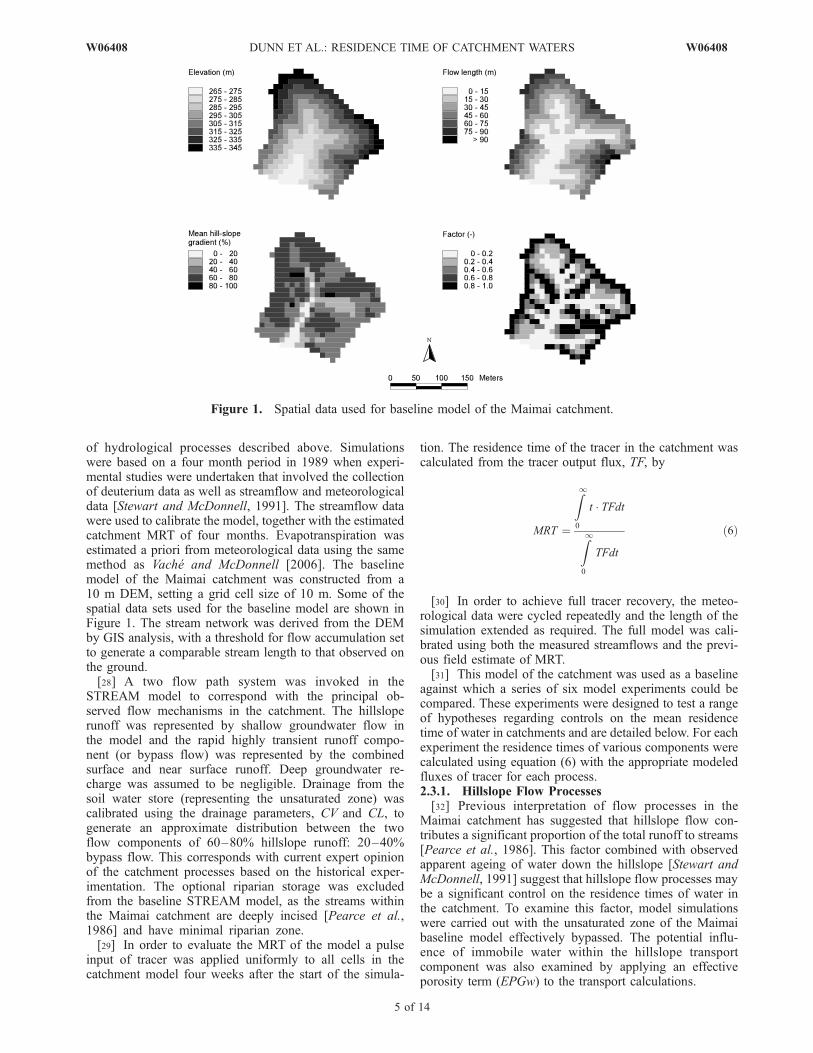
of hydrological processes described above. Simulationswere based on a four month period in 1989 when experi-mental studies were undertaken that involved the collectionof deuterium data as well as streamflow and meteorologicaldata [Stewart and McDonnell, 1991]. The streamflow datawere used to calibrate the model, together with the estimatedcatchment MRT of four months. Evapotranspiration wasestimated a priori from meteorological data using the samemethod as Vache and McDonnell [2006]. The baselinemodel of the Maimai catchment was constructed from a10 m DEM, setting a grid cell size of 10 m. Some of thespatial data sets used for the baseline model are shown inFigure 1. The stream network was derived from the DEMby GIS analysis, with a threshold for flow accumulation setto generate a comparable stream length to that observed onthe ground.[28] A two flow path system was invoked in the
STREAM model to correspond with the principal ob-served flow mechanisms in the catchment. The hillsloperunoff was represented by shallow groundwater flow inthe model and the rapid highly transient runoff compo-nent (or bypass flow) was represented by the combinedsurface and near surface runoff. Deep groundwater re-charge was assumed to be negligible. Drainage from thesoil water store (representing the unsaturated zone) wascalibrated using the drainage parameters, CV and CL, togenerate an approximate distribution between the twoflow components of 60–80% hillslope runoff: 20–40%bypass flow. This corresponds with current expert opinionof the catchment processes based on the historical exper-imentation. The optional riparian storage was excludedfrom the baseline STREAM model, as the streams withinthe Maimai catchment are deeply incised [Pearce et al.,1986] and have minimal riparian zone.[29] In order to evaluate the MRT of the model a pulse
input of tracer was applied uniformly to all cells in thecatchment model four weeks after the start of the simula-
tion. The residence time of the tracer in the catchment wascalculated from the tracer output flux, TF, by
MRT ¼
Z
1
0
t ' TFdt
Z
1
0
TFdt
ð6Þ
[30] In order to achieve full tracer recovery, the meteo-rological data were cycled repeatedly and the length of thesimulation extended as required. The full model was cali-brated using both the measured streamflows and the previ-ous field estimate of MRT.[31] This model of the catchment was used as a baseline
against which a series of six model experiments could becompared. These experiments were designed to test a rangeof hypotheses regarding controls on the mean residencetime of water in catchments and are detailed below. For eachexperiment the residence times of various components werecalculated using equation (6) with the appropriate modeledfluxes of tracer for each process.2.3.1. Hillslope Flow Processes[32] Previous interpretation of flow processes in the
Maimai catchment has suggested that hillslope flow con-tributes a significant proportion of the total runoff to streams[Pearce et al., 1986]. This factor combined with observedapparent ageing of water down the hillslope [Stewart andMcDonnell, 1991] suggest that hillslope flow processes maybe a significant control on the residence times of water inthe catchment. To examine this factor, model simulationswere carried out with the unsaturated zone of the Maimaibaseline model effectively bypassed. The potential influ-ence of immobile water within the hillslope transportcomponent was also examined by applying an effectiveporosity term (EPGw) to the transport calculations.
Figure 1. Spatial data used for baseline model of the Maimai catchment.
W06408 DUNN ET AL.: RESIDENCE TIME OF CATCHMENT WATERS
5 of 14
W06408

2.3.2. Unsaturated Zone Processes[33] Infiltration in the soil profile is largely influenced by
a balance between gravitational and capillary forces. Theoccurrence of more rapid hillslope transport only occursonce soil moisture conditions have reached a critical levelwhere they effectively saturate the soil, or a portion of thesoil. Thus there is the potential for quite long residencetimes of water within the unsaturated zone.[34] The simplistic representation of the unsaturated zone
used in this model provides a means of describing theretention of water within the soil profile, but does notexplicitly track its flow. The incorporation of an effectiveporosity term (EPUz) for the transport of the tracer allowsfor dissociation of the tracer from the movement of water, torepresent the dual porosity system.[35] The relative importance of unsaturated zone processes
compared with hillslope flow processes could be assessedfrom the simulations performed in (2.3.1), compared withthe baseline simulations. In addition, with the representationof the unsaturated zone included again, the sensitivity ofsimulations to the value of the unsaturated zone effectiveporosity was evaluated.2.3.3. Flow Path Gradient[36] The role of catchment topography in determining
residence times was evaluated through two topographiccharacteristics; the flow path gradient and the flow pathlength. The gradient of the hillslope affects the rate ofgroundwater flow routed down the hillslope. If the storagein the shallow groundwater was an important control indetermining the MRT, then it would be expected that thegradient of the slope would have a strong influence on theMRT.[37] The flow path gradient was examined by comparing
model simulations based on the same catchment structure asthat of the Maimai catchment, but effectively flattening outthe gradients, by dividing the digital elevation model byfactors of 4 and 10. This created new models with flow pathgradients of 0.4 and 0.1 times the original values.2.3.4. Flow Path Length[38] The flow path length defines the distance from points
in a catchment to the stream into which the points drain. It isdependent on the density of the stream network, as well asthe shape of the catchment. The distribution of flow pathlengths determines the distances over which hillslope rout-ing takes place, and consequently can be expected to havean influence on the residence times of water. The flow pathlength can be adjusted for the STREAM model by makingdiffering assumptions about the threshold flow accumula-tion at which a point in the catchment is defined as a stream.For the baseline Maimai model, a flow accumulation of12 cells was found to give a comparable definition of thestream network to that observed in practice. To test the roleof flow path length in determining residence times, flowpath lengths were calculated on the basis of thresholdaccumulations of 5, 100 and 390 cells.2.3.5. Deep Groundwater Processes[39] One hypothesis regarding residence time distribu-
tions is that catchment MRTs can be significantly increasedby contributions of a small volume of deep groundwaterwith a very long residence time. The role of this potentialmechanism was studied by invoking the deeper groundwa-ter store within the Maimai catchment model. The store was
assumed to be recharged by a constant flow from theshallower groundwater store. A feasible recharge rate wasestimated from the Maimai streamflow record, by taking thelowest recorded flow and assuming a constant rechargeequivalent to this rate. The lowest recorded flow wasassumed to represent the level of base flow that is sustainedeven when the catchment is under drought conditions, andhence to be representative of a very slowly responding deepsource of water. Discharge to the stream network wasassumed to follow the same flow path as the shallowerflows, but with a much lower hydraulic conductivity,leading to much longer residence times.2.3.6. Riparian Storage[40] Riparian zones have been observed to act as buffers
to pollutant transport [Muscutt et al., 1993; Lowrance et al.,1997] which suggests that they often play an important rolein catchment functioning. It is clear that in some catchmentsthe presence of flat-bottomed, alluvial, riparian zones canstore a significant volume of water, where a high degree ofmixing can occur. Although not believed to be significant inthe Maimai catchment in terms of total storage [McDonnell,1990; McGlynn and McDonnell, 2003], the potential influ-ence of a riparian storage was investigated for its effect onresidence times. All subsurface and groundwater flows fromthe catchment were assumed to discharge into a 10 m wideriparian store where simple mixing takes place prior todischarging into the stream.
3. Results
3.1. Baseline Model
[41] The model representation of the soils in the Maimaicatchment assumed homogeneity in terms of the CV and CLparameters and assumed that the FC and SC parametersvaried simply as a function of the soil depth. These latter twovalues together with 8were based on previous measurementsof soil physical properties in the catchment [Pearce et al.,1986]. The near surface and shallow groundwater rateparameters, KS and KG, were also assumed to be homog-enous across the catchment. For the baseline model therewere therefore four parameters to be calibrated for the flowsimulations, and a further parameter (EPUz) to be calibratedfor simulation of the tracer response. EPGw was assumedequal to 1. A range of criteria was used for the modelevaluation as follows: (1) Nash-Sutcliffe [Nash and Sutcliffe,1970] efficiency of flow predictions, (2) Nash-Sutcliffeefficiency based on log (flow) values, (3) ratio of shallowgroundwater hillslope runoff to near surface bypass flow,and (4) mean residence time of water.[42] Over 3000 simulations, varying each of the four flow
parameters, were carried out and compared, using the firstthree criteria above to select an appropriate parameter set forthe baseline model. A further set of simulations was thenrun to calibrate a value for EPUz using the MRT criteria.After initial tests of the tracer response, all the calibrationsimulations were run for a period of 3 years (with a basicmodel time step of four hours), to ensure that full tracerrecovery was achieved, and that consequently the calculatedMRT values were accurate for the model.[43] In common with model applications by other authors
[e.g., Beven and Binley, 1992; Freer et al., 1996] it wasfound that acceptable simulations of flow (defined here as
6 of 14
W06408 DUNN ET AL.: RESIDENCE TIME OF CATCHMENT WATERS W06408

Nash/Sutcliffe efficiency of flow > 0.8 and of log (flow) >0.8) could be found using a broad range of parameter-izations of the model. These two criteria alone reduced thenumber of acceptable simulations from 3120 to 622 (20%)(Figure 2). The discrimination between these simulations onthe basis of the relative flow proportions (with an acceptableproportion of hillslope runoff defined as lying between 0.6and 0.8) further reduced the number of acceptable simu-lations to 42 (1.3% of the total) (Figure 3). The addition ofthis criterion was therefore important in discriminatingbetween the different parameter sets. The 42 parameter setsthat were deemed as acceptable all had values of CV and CLof 0.0025 s"1 and 0.05 s"1, respectively, but with varyingvalues for KG and KS. One pair of values for KG and KSwas selected for the baseline model from these 42 parametersets.[44] In terms of the tracer response, a similar result to
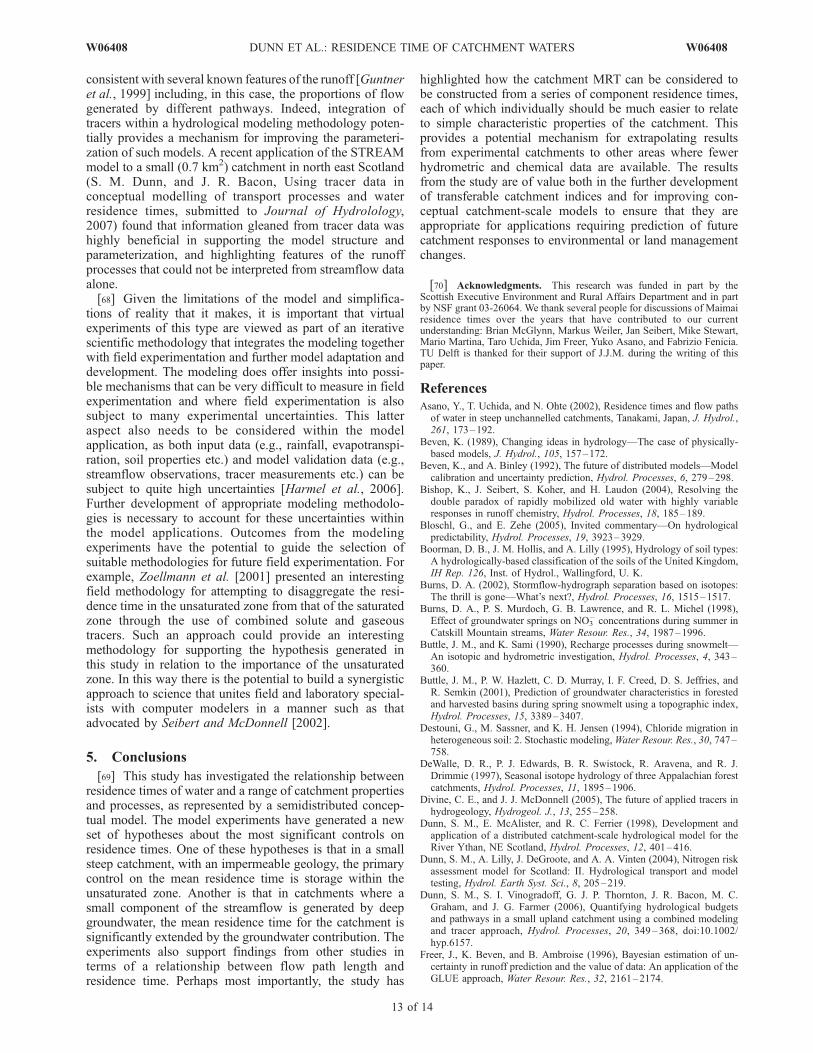
Vache and McDonnell [2006] was found; namely that aneffective porosity value of EPUz = 0.4 was necessary toachieve mean residence times comparable to the fourmonths previously estimated [Pearce et al., 1986]. Thecalibration of this value will be discussed in greater detailin the analysis of the unsaturated zone processes. Theresulting baseline model predictions of streamflow areplotted with the measured stream discharge in Figure 4. InFigure 5 the modeled response in the stream to a pulse inputof tracer is illustrated as a time series plot, and also as acumulative plot showing the recovered percent of appliedtracer through time.
3.2. Hillslope Flow Processes
[45] Hillslope flow processes were examined by exclud-ing the unsaturated zone and near surface runoff from theSTREAM model. All of the effective precipitation was thenrouted directly into the shallow groundwater hillslope runoffcomponent of the model. Applying the same value of KG asfor the baseline model, the MRT of this model simulationwas reduced to only 5 days. Thus the hillslope flow
processes have only a small control over the residence timewithin the baseline model. The hillslope flow model wasalso recalibrated for KG using three of the criteria for modelevaluation (defined above) as objective functions (runoffratio was not relevant as only one flow path was invoked inthis case). The results of this calibration demonstrated thatonly a poor simulation of the streamflow could be achieved,with a highest Nash-Sutcliffe efficiency of 0.4. The MRT ofthis simulation was even further reduced to a typical valueof 2 days, demonstrating its incompatibility with the ob-served tracer behavior within the catchment. This result isalso in line with the findings of Vache and McDonnell[2006].[46] The sensitivity of the catchment MRT to the inclu-
sion of an effective porosity within the hillslope flowcomponent was tested by running a set of simulations usingthe baseline model and with EPGw varying between 1.0 and0.1. These results are shown in Figure 6. With EPGw = 0.1the catchment MRT increased to a maximum value of155 days, representing a residence time of 30 days in thehillslope itself. However, with a value of EPGw = 0.2 thehillslope residence time was only 15 days.
3.3. Unsaturated Zone Processes
[47] The results of the hillslope flow model experimentsdemonstrated the importance of the unsaturated zone rep-resentation within this model in controlling the catchmentMRT. With the residence times for the near surface runoffeven shorter than the hillslope runoff, 95% of the total tracerresidence time in the baseline model was calculated to bewithin the unsaturated zone.[48] The sensitivity of the catchment MRT to EPUz was
also examined by varying its value from 0.1 to 1.0, whilemaintaining other parameters of the baseline model. Theresults of these simulations in terms of the MRT are
Figure 2. Nash-Sutcliffe efficiency of flows and efficiencyof log (flows) for 3120 simulations used to calibratebaseline flow model.
Figure 3. Relationship between three objective criteriaused for calibration of the flow model. Simulations withNash-Sutcliffe efficiency of flows and efficiency of log(flows) ( 0.8 are plotted for a range of values of the ratio ofshallow groundwater flow to near surface flow. Simulationssatisfying the criteria for hillslope runoff proportion areshown as solid diamonds.
W06408 DUNN ET AL.: RESIDENCE TIME OF CATCHMENT WATERS
7 of 14
W06408
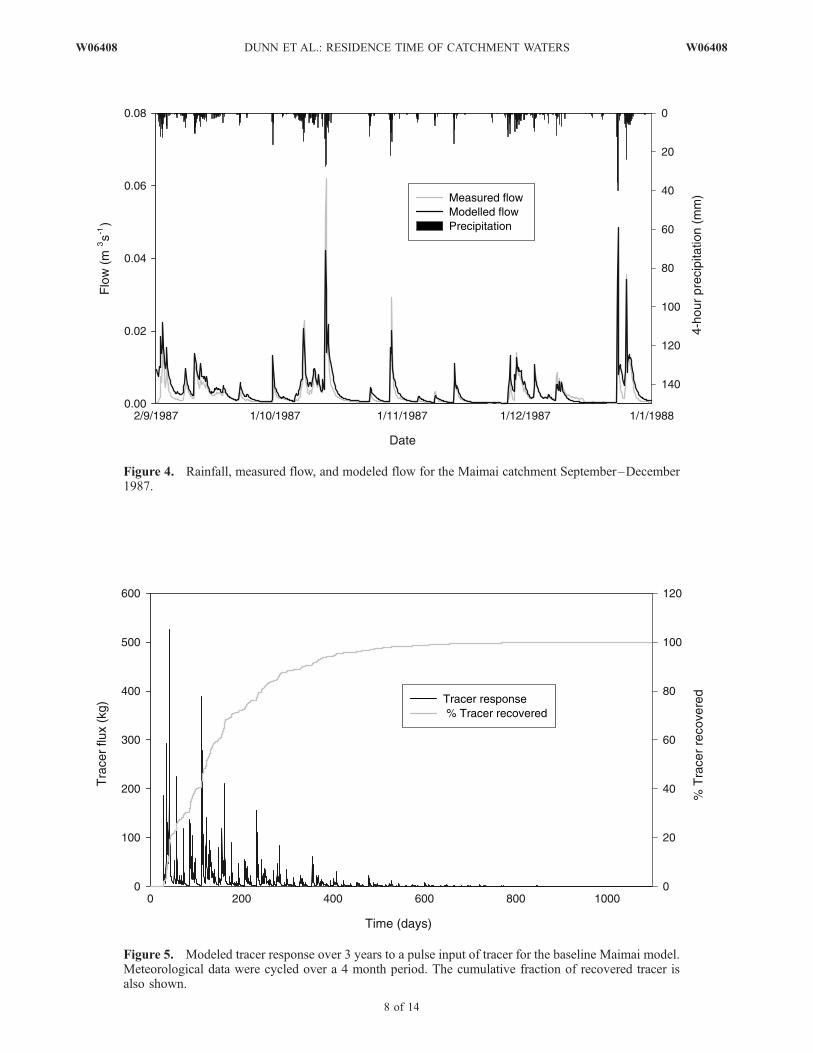
Figure 4. Rainfall, measured flow, and modeled flow for the Maimai catchment September–December1987.
Figure 5. Modeled tracer response over 3 years to a pulse input of tracer for the baseline Maimai model.Meteorological data were cycled over a 4 month period. The cumulative fraction of recovered tracer isalso shown.
8 of 14
W06408 DUNN ET AL.: RESIDENCE TIME OF CATCHMENT WATERS W06408

illustrated in Figure 6. With an effective porosity of 1 theMRT of the simulations was reduced to 51 days. Thisrepresentation would infer that there was no immobile waterin the unsaturated zone and that the tracer was transportedby pure advection with the water flows. The MRT of thesimulations increased in proportion to (1/EPUz), giving anMRT of 516 days with a value of EPUz = 0.1.
3.4. Flow Path Gradient
[49] The mean flow path gradient for the baselinemodel of the Maimai was 0.56. The two experimentalmodels tested by manipulation of the Maimai DEM hadmean gradients of 0.14 and 0.056, respectively. The MRTvalues of simulations performed with these two models,with all other parameters kept identical to the baselinemodel, were increased from 130 days to 133 and 136 days,respectively. Given the results from the model based purelyon hillslope flow routing, with no unsaturated zone, thiswas equivalent to a 60% and 120% increase in theresidence times within the hillslope routing componentof the model.
3.5. Flow Path Length
[50] The catchment mean flow path length was modifiedfrom 34 m to 20 m, 63 m and 149 m for the modelexperiments on the basis of different definitions of thestream network. The last of these models was based ononly one stream cell within the whole of the Maimaicatchment. The MRT values of the simulations were129 days for the 20m average flow path length, 146 daysfor the 63 m average length and 206 days for the 149 maverage length. These data are plotted in Figure 7, which
shows that the MRT is approximately linearly related to theaverage flow length.
3.6. Deep Groundwater Processes
[51] A feasible deep groundwater recharge rate wasestimated from the streamflow hydrograph at 80 mm peryear. Two further parameters control the influence of thedeep groundwater behavior within the model: the initialdepth of the deep groundwater store, DGI, and the ground-water conductivity, KDG. An indicative value for thegroundwater conductivity was estimated at 10"8 m s"1 onthe basis of literature data for similar geological strata. Thisvalue is used purely to give an indication of the potentialsensitivity of the catchment MRT to a small fraction ofslowly transported water. The selected KDG permitted avalue to be calculated for DGI (= 430 mm) to achieve steadystate conditions within the deep groundwater component ofthe model. A simulation using these parameter values wasrun for a total length of 40 years, to ensure full tracerrecovery from the deep groundwater component. The resultsof this simulation gave a catchment MRT of 167 days, anincrease of 37 days over the baseline model. The total flowcontribution from the deep groundwater accounted for only1.6% of the total stream runoff, but the mean residence timeof the deep groundwater itself was 7.4 years. The values ofthe objective functions for this simulation were largelyunaffected by the inclusion of the deep groundwater withthe Nash-Sutcliffe efficiency remaining the same as thebaseline model at 0.81, while the log efficiency valueincreased very slightly from 0.86 to 0.87.[52] Additional simulations were carried out to test the
potential significance of deep groundwater flows in situa-tions with a higher recharge rate or lower groundwater
Figure 6. Sensitivity of modeled catchment MRT to value of effective porosity for the hillslope flowcomponent and the unsaturated zone.
W06408 DUNN ET AL.: RESIDENCE TIME OF CATCHMENT WATERS
9 of 14
W06408

conductivity. A doubling of the recharge rate, to 3.2% of thetotal stream runoff, was calculated to increase the catchmentMRT to 202 days. Alternatively, decreasing the groundwa-ter conductivity by a factor of 10 (with a correspondingincrease in the initial condition for the depth of the ground-water store), resulted in an increase in the catchment MRTto > 293 days. After simulation of a 100 year period, only77% of the tracer leached to the deep groundwater compo-nent had been recovered.
3.7. Riparian Storage
[53] A 10 m wide riparian storage was defined along allstream cells of the baseline Maimai model. For simplicity,the value of the riparian rate parameter (KR) was set to thesame value as that of the shallow groundwater rate param-eter (KG). The total depth available for mixing in theriparian zone was defined by the soil depth. A simulationbased on these definitions caused the calculated MRT of thebaseline model to increase from 130 days to 142 days. TheNash-Sutcliffe efficiency of the flow predictions was unaf-fected by the inclusion of the riparian store.
4. Discussion
4.1. On the Virtual Experiment Approach
[54] While modeling studies have begun to use streamMRTas additional criteria for model evaluation [Uhlenbrook
and Leibundgut, 2002] and as a means to reject modelstructures [Vache and McDonnell, 2006], there are still toofew observational studies conducted to date to inform whatare the fundamental controls on stream water mean resi-dence time. While additional field studies are needed,expense and time preclude a large number of these on theimmediate horizon. In this paper we have used the Weilerand McDonnell [2004, 2006] virtual experiment approachto seek new understanding of the relative importance ofhillslope and catchment runoff processes on derived streamMRT. Our underlying rationale was that, as a catchment-averaged indicator, the MRT can be considered additive—constructed from the accumulation of residence times insequential stages of hydrological transport, as well assequential transport through geographic space. By usingour conceptual understanding of the hydrological processesoperational in the well-studied Maimai M8 catchment, weperformed a set of model experiments using a semidistrib-uted conceptual hydrological model to simulate the trans-port of a conservative solute tracer. The experimentsexplored how different properties of a catchment systemcould influence the overall behavior of the catchment interms of its MRT.[55] Table 2 summarizes the results of the model experi-
ments quoting the range of mean residence times calculatedfor each component of the model. The catchment MRTrepresents the combined effect of these component MRT
Figure 7. Relationship between mean flow path length and modeled catchment MRT.
Table 2. Summary of Model Experiment Results in Terms of Modeled MRT for Each Model Flow Componenta
Property/Parameter Model Component Values TestedModeled Component
MRT, days
GW effective porosity groundwater hillslope routing 1.0–0.1 5–30UZ effective porosity soil water balance 1.0–0.1 46–511Flow path gradient groundwater hillslope routing 0.056–0.56 5–11Flow path length groundwater hillslope routing 20–149 m 4–81Groundwater hydraulic conductivity deep groundwater 10"7–10"8 cm s"1 2700–>13300Riparian width riparian storage 0, 10 m 0, 12
aThe catchment MRT represents the combined effect of these component MRT values.
10 of 14
W06408 DUNN ET AL.: RESIDENCE TIME OF CATCHMENT WATERS W06408

values. The results demonstrate how the different processesrepresented in the model of the Maimai catchment interactin a complex manner to generate the average behavior thatis summarized by the catchment MRT. We used the findingsof the model experiments to consider more broadly howresidence times of water in different catchments may becontrolled by several different key properties of thesystem.[56] Our baseline model of the Maimai catchment was
constructed to reflect current conceptual understanding ofthe most important hydrological processes in that catch-ment. This model indicated that transport in the unsaturatedzone played a very important role in determining the meanresidence times of water. The model representation of theunsaturated zone was quite simplistic, but provided amechanism for explaining the mixing and lags necessaryto explain the behavior in the catchment. The effectiveporosity parameter in the unsaturated zone proved to benecessary to achieve residence times of the correct order ofmagnitude for the catchment. This parameter was purelyconceptual in the manner in which it is implemented withinthe STREAM model, but nevertheless provided a surrogatefor commonly observed physical processes relating tomobile and immobile transport in soils. Under stormflowconditions the model representation generated near surfacerunoff. This flow component is routed rapidly to the streamnetwork and the residence time is therefore not dependenton topographic location. However, the water is still assumedto have mixed within the soil profile, and thus retains theMRT of the unsaturated zone processes. In practice, theoccurrence of processes such as infiltration excess runoffmay lead to a fraction of new water reaching the streamnetwork directly under stormflow conditions.
4.2. Role of Deep Groundwater
[57] From the few observational studies that have beencompleted in steep headwater catchments, bedrock per-meability has been shown to be a first-order control onthe direction of water aging in the subsurface—fromdownslope aging in catchment systems with largely imper-meable underlying bedrock [Stewart and McDonnell, 1991]to vertical aging in the soil profile (and into the bedrock) incatchments with highly permeable bedrock. While ourvirtual experiments within the Maimai catchment retainedthe overall character of largely impermeable bedrock char-acteristic of the site, our virtual experiments show thepotential influence on residence times of a small proportionof deep groundwater mixing with the hillslope runoff. Oursimulations suggest that only a small proportion of the flowneeds to be routed via a long residence time deep ground-water flow path to make a significant difference to thestream water MRT. The potential influence of deep ground-water also highlights the fact that a measure of the catch-ment MRT alone does not adequately characterize thebehavior of a catchment because of the variability in thenature of the residence time distribution. Thus it may benecessary to acquire a range of data, for example to assessthe age of groundwater through the use of alternativehydrochemical and isotopic tracers.[58] Asano et al. [2002] observed a similar phenomenon
in their experimental catchment where mean residence timesof streamflow were found to be significantly longer than
those of adjacent soil water as a result of contributions fromlateral groundwater flow through the bedrock.
4.3. Flow Path Length Versus Hillslope Gradient
[59] Our virtual experiments on the topographic influen-ces on MRT suggested that the flow path length is a moreimportant control on residence times than the hillslopegradient. Both the flow path length and hillslope gradientwithin the Maimai catchment are quite extreme compared tomost areas, with a very short hillslope lengths and steepgradients throughout the catchment. These factors undoubt-edly contribute to the importance of the unsaturated zone indetermining the MRT for the Maimai catchment. Theanalysis of flow path length in particular showed that theMRT could increase quite significantly for a catchmentwhere the hillslopes are longer. This topographic attributetends to vary with scale, usually with longer mean flow pathlengths in mesoscale (10–1000 km2) catchments comparedwith miniscale (1–10 km2) catchments. This is becausechannel initiation is related to topographic slope as well asupstream contributing area [Giannoni et al., 2005].McGuire et al. [2005] found a significant relationshipbetween both median flow path length and median flowpath gradient and MRT. It is notable that the catchments thatthey studied had significantly longer flow path lengths(median 125–290 m) compared with the Maimai catchment(average 34 m). This would account in part for their longerMRT values, although the slope of the relationship calcu-lated from the STREAM model experiments is shallowerthan that found by McGuire et al. [2005]. This latterobservation indicates that in the Maimai model, flow pathlength had a weaker influence on the MRT than thatobserved by McGuire et al. [2005] for the HJA Andrewscatchments, possibly as a result of higher modeled ground-water transport rates.
4.4. Riparian and In-Stream Storage
[60] The simplified representation of riparian storageexamined in this study did not exert a particularly strongcontrol on the MRT of catchment waters. A relatively largeriparian store was defined in the simulations (10 m wide andwith the full depth of soil available) in relation to themeasured riparian dimensions of the first-order streamsreported in this catchment by Mosley [1979]. This suggeststhat the size of the riparian storage that is potentiallyavailable would not be adequate to account for the mixingand lag that is observed in the stream water. McGlynn andMcDonnell [2003] examined the relative contributions ofriparian and hillslope zones to runoff in the Maimai catch-ment for a series of storm events. They showed that watersourced from riparian zones dominated the runoff betweenevents and during the early part of storm events. However,the riparian zones exhibited poor buffering of hillsloperunoff during larger events. This indicated that the volu-metric storage within the riparian zones was small relativeto the hillslope storage, which is consistent with therelatively small influence on MRT calculated by the virtualexperiments. In a much larger catchment it is possible thatthere would be greater influence of the riparian zone, where,for example, there is a wide flat valley with deep alluvialsoils that can store much greater volumes of water. In such asituation hyporheic exchange could also result in lengthenedresidence times with the potential for reverse flows from the
W06408 DUNN ET AL.: RESIDENCE TIME OF CATCHMENT WATERS
11 of 14
W06408

bed of the stream to the unsaturated zone, under certainconditions.[61] The model experiments carried out in this paper did
not involve any in-stream routing of flows or tracer. For theMaimai catchment, the assumption that in-stream residenceis insignificant relative to other processes is probably quitereasonable, given the short length of stream reaches and theimpermeable nature of the underlying bedrock. A recentstudy by Gooseff et al. [2005] investigated the role oftransient storage both within streams and in stream hypo-rheic zones for a 300–400 m reach of first and second-orderstreams. The results from these experiments gave typicalmean residence times of only a few hours for a bedrockstream with no hyporheic zone. However, a reach of streamoverlying an alluvial aquifer was found to have a muchlonger mean residence time of the order of 50 days. Clearlyfor larger catchments with long reaches of streamwhere thereare strong hyporheic interactions, these substream influenceson catchment MRT values could be very important.
4.5. Going Beyond These Virtual Experiments
[62] We recognize that the general applicability of thesefindings (beyond the Maimai test case) will only becomeapparent once further field-based MRT studies have beenundertaken on different catchments and under differentclimatic conditions (e.g., drought, high-flow periods). Nev-ertheless, the key findings from this set of virtual experi-ments provide some indications of catchment characteristiccontrols on MRT.[63] The baseline model for the Maimai catchment de-
fined a single soil type, assumed to be homogenous acrossthe catchment. Although the unsaturated zone processeswere found to be significant, the results did not show howMRT might be affected by the presence of different soils. Arecent study by Soulsby et al. [2006] found a strongrelationship between catchment MRT and soil type. Theyused a classification of soil type based on hydrologicalfunctioning; the Hydrology of Soil Types (HOST) [Boormanet al., 1995] to relate residence times to the distribution ofsoils within a catchment. The success of this approach inexplaining much of the observed variability appears tosupport the findings of the model experiments carried outhere, as the behavior of the unsaturated zone processes interms of storage and effective porosity will be closely linkedto the soil physical properties. Consequently, the soilclassification provides an effective spatial carrier of thesedata.[64] Our results have a number of implications in terms of
developing indices for catchment characterization. First, it isclear that MRT, although it provides an appealing summaryof the temporal behavior of a catchment, is a complex indexthat does not uniquely define the manner in which water isstored within a catchment system. The model experimentsdemonstrated that there are several different mechanismsthat can account for residence times within a catchment,such that two different catchments with similar MRT valuesmay function quite differently. This has been illustrated bydisaggregating the catchment MRT into a series of compo-nent residence times relating to different processes withinthe catchment. Traditional experimental approaches forcalculating catchment MRT, by necessity, make someassumptions about the nature of the residence time distri-
bution. Most commonly the exponential distribution isapplied [e.g., DeWalle et al., 1997; Burns et al., 1998],although more recently Kirchner et al. [2000] argued thatthe gamma distribution is more appropriate. Our analysis ofindividual components of the catchment MRT demonstratesthat the form of the residence time distribution is likely tovary considerably between catchments, depending on thedominant internal runoff processes.[65] Some simple relationships between catchment char-
acteristics and component residence times have been iden-tified through the virtual experiments; for example inrelation to the flow path length and the influence of deepgroundwater. If similar relationships could be developed foreach of the main catchment processes, then together theycould provide a powerful means of defining the expectedresponse of a catchment. Such a capability would be ofvalue to assist with scaling studies and the transfer ofhydrological understanding to ungauged basins, a princi-pal target of the International Association for Hydrolog-ical Sciences Decade of Prediction in Ungauged Basins[Sivapalan et al., 2003].[66] Evaluation of the MRT is likely to be of particular
value in the context of understanding future catchmentresponses to environmental or land management changes[Zoellmann et al., 2001; Murray and Buttle, 2005]. TheMRT defines a very different feature of catchment behaviorto other spatially integrated observational data such asstreamflows and chemical concentrations that are commonlyused for evaluating hydrological and water quality models[Hooper et al., 1988]. Whereas performance capabilities ofhydrological and water quality models have been found tobe adequate for reproducing current day water quality[Krysanova et al., 2005], important questions remain overtheir reliability to predict into the future [Bloschl and Zehe,2005]. This is because of high uncertainties regardingunderstanding of how catchment waters are stored andmixed within the soil-groundwater system. The utilizationof MRT within a modeling context appears to offer consid-erable scope for improvement in this regard.[67] An important issue regarding the value of model
experiments is that the results of the experiments can onlyreflect the capabilities of the model in explaining the flowand transport processes occurring in a catchment. Many ofthe processes represented within the STREAM model are agross simplification of reality. For example, the unsaturatedzone is represented by a simple box in which all water isfully mixed, when we know that in practice infiltration intothe unsaturated zone occurs over time and that in realitythere is likely to be a distribution of residence time thatvaries with depth. However, models of this type have beencommonly used to represent hydrological processes at acatchment scale, and found to be more appropriate in termsof their parameterization needs than more complex physi-cally based models that have large numbers of spatiallyvarying parameters [Beven, 1989]. Although the STREAMmodel has not yet been widely applied, previous models onwhich it was based have been found to be applicable to awide range of catchments within Scotland, and to providean appropriate hydrological foundation for modeling diffusepollution at catchment scales [Dunn et al., 1998, 2004,2006]. The use of a multiobjective criteria approach to modelcalibration helps to ensure that the modeled processes are
12 of 14
W06408 DUNN ET AL.: RESIDENCE TIME OF CATCHMENT WATERS W06408
consistent with several known features of the runoff [Guntneret al., 1999] including, in this case, the proportions of flowgenerated by different pathways. Indeed, integration oftracers within a hydrological modeling methodology poten-tially provides a mechanism for improving the parameteri-zation of such models. A recent application of the STREAMmodel to a small (0.7 km2) catchment in north east Scotland(S. M. Dunn, and J. R. Bacon, Using tracer data inconceptual modelling of transport processes and waterresidence times, submitted to Journal of Hydrolology,2007) found that information gleaned from tracer data washighly beneficial in supporting the model structure andparameterization, and highlighting features of the runoffprocesses that could not be interpreted from streamflow dataalone.[68] Given the limitations of the model and simplifica-
tions of reality that it makes, it is important that virtualexperiments of this type are viewed as part of an iterativescientific methodology that integrates the modeling togetherwith field experimentation and further model adaptation anddevelopment. The modeling does offer insights into possi-ble mechanisms that can be very difficult to measure in fieldexperimentation and where field experimentation is alsosubject to many experimental uncertainties. This latteraspect also needs to be considered within the modelapplication, as both input data (e.g., rainfall, evapotranspi-ration, soil properties etc.) and model validation data (e.g.,streamflow observations, tracer measurements etc.) can besubject to quite high uncertainties [Harmel et al., 2006].Further development of appropriate modeling methodolo-gies is necessary to account for these uncertainties withinthe model applications. Outcomes from the modelingexperiments have the potential to guide the selection ofsuitable methodologies for future field experimentation. Forexample, Zoellmann et al. [2001] presented an interestingfield methodology for attempting to disaggregate the resi-dence time in the unsaturated zone from that of the saturatedzone through the use of combined solute and gaseoustracers. Such an approach could provide an interestingmethodology for supporting the hypothesis generated inthis study in relation to the importance of the unsaturatedzone. In this way there is the potential to build a synergisticapproach to science that unites field and laboratory special-ists with computer modelers in a manner such as thatadvocated by Seibert and McDonnell [2002].
5. Conclusions
[69] This study has investigated the relationship betweenresidence times of water and a range of catchment propertiesand processes, as represented by a semidistributed concep-tual model. The model experiments have generated a newset of hypotheses about the most significant controls onresidence times. One of these hypotheses is that in a smallsteep catchment, with an impermeable geology, the primarycontrol on the mean residence time is storage within theunsaturated zone. Another is that in catchments where asmall component of the streamflow is generated by deepgroundwater, the mean residence time for the catchment issignificantly extended by the groundwater contribution. Theexperiments also support findings from other studies interms of a relationship between flow path length andresidence time. Perhaps most importantly, the study has
highlighted how the catchment MRT can be considered tobe constructed from a series of component residence times,each of which individually should be much easier to relateto simple characteristic properties of the catchment. Thisprovides a potential mechanism for extrapolating resultsfrom experimental catchments to other areas where fewerhydrometric and chemical data are available. The resultsfrom the study are of value both in the further developmentof transferable catchment indices and for improving con-ceptual catchment-scale models to ensure that they areappropriate for applications requiring prediction of futurecatchment responses to environmental or land managementchanges.
[70] Acknowledgments. This research was funded in part by theScottish Executive Environment and Rural Affairs Department and in partby NSF grant 03-26064. We thank several people for discussions of Maimairesidence times over the years that have contributed to our currentunderstanding: Brian McGlynn, Markus Weiler, Jan Seibert, Mike Stewart,Mario Martina, Taro Uchida, Jim Freer, Yuko Asano, and Fabrizio Fenicia.TU Delft is thanked for their support of J.J.M. during the writing of thispaper.
ReferencesAsano, Y., T. Uchida, and N. Ohte (2002), Residence times and flow pathsof water in steep unchannelled catchments, Tanakami, Japan, J. Hydrol.,261, 173–192.
Beven, K. (1989), Changing ideas in hydrology—The case of physically-based models, J. Hydrol., 105, 157–172.
Beven, K., and A. Binley (1992), The future of distributed models—Modelcalibration and uncertainty prediction, Hydrol. Processes, 6, 279–298.
Bishop, K., J. Seibert, S. Koher, and H. Laudon (2004), Resolving thedouble paradox of rapidly mobilized old water with highly variableresponses in runoff chemistry, Hydrol. Processes, 18, 185–189.
Bloschl, G., and E. Zehe (2005), Invited commentary—On hydrologicalpredictability, Hydrol. Processes, 19, 3923–3929.
Boorman, D. B., J. M. Hollis, and A. Lilly (1995), Hydrology of soil types:A hydrologically-based classification of the soils of the United Kingdom,IH Rep. 126, Inst. of Hydrol., Wallingford, U. K.
Burns, D. A. (2002), Stormflow-hydrograph separation based on isotopes:The thrill is gone—What’s next?, Hydrol. Processes, 16, 1515–1517.
Burns, D. A., P. S. Murdoch, G. B. Lawrence, and R. L. Michel (1998),Effect of groundwater springs on NO3
" concentrations during summer inCatskill Mountain streams, Water Resour. Res., 34, 1987–1996.
Buttle, J. M., and K. Sami (1990), Recharge processes during snowmelt—An isotopic and hydrometric investigation, Hydrol. Processes, 4, 343–360.
Buttle, J. M., P. W. Hazlett, C. D. Murray, I. F. Creed, D. S. Jeffries, andR. Semkin (2001), Prediction of groundwater characteristics in forestedand harvested basins during spring snowmelt using a topographic index,Hydrol. Processes, 15, 3389–3407.
Destouni, G., M. Sassner, and K. H. Jensen (1994), Chloride migration inheterogeneous soil: 2. Stochastic modeling,Water Resour. Res., 30, 747–758.
DeWalle, D. R., P. J. Edwards, B. R. Swistock, R. Aravena, and R. J.Drimmie (1997), Seasonal isotope hydrology of three Appalachian forestcatchments, Hydrol. Processes, 11, 1895–1906.
Divine, C. E., and J. J. McDonnell (2005), The future of applied tracers inhydrogeology, Hydrogeol. J., 13, 255–258.
Dunn, S. M., E. McAlister, and R. C. Ferrier (1998), Development andapplication of a distributed catchment-scale hydrological model for theRiver Ythan, NE Scotland, Hydrol. Processes, 12, 401–416.
Dunn, S. M., A. Lilly, J. DeGroote, and A. A. Vinten (2004), Nitrogen riskassessment model for Scotland: II. Hydrological transport and modeltesting, Hydrol. Earth Syst. Sci., 8, 205–219.
Dunn, S. M., S. I. Vinogradoff, G. J. P. Thornton, J. R. Bacon, M. C.Graham, and J. G. Farmer (2006), Quantifying hydrological budgetsand pathways in a small upland catchment using a combined modelingand tracer approach, Hydrol. Processes, 20, 349–368, doi:10.1002/hyp.6157.
Freer, J., K. Beven, and B. Ambroise (1996), Bayesian estimation of un-certainty in runoff prediction and the value of data: An application of theGLUE approach, Water Resour. Res., 32, 2161–2174.
W06408 DUNN ET AL.: RESIDENCE TIME OF CATCHMENT WATERS
13 of 14
W06408
Giannoni, F., G. Roth, and R. Rudari (2005), A procedure for drainagenetwork identification from geomorphology and its application to theprediction of the hydrologic response, Adv. Water Resour., 28, 567–581.
Gooseff, M. N., J. LaNier, R. Haggerty, and K. Kokkeler (2005), Determin-ing in-channel (dead zone) transient storage by comparing solute trans-port in a bedrock channel–alluvial channel sequence, Oregon, WaterResour. Res., 41, W06014, doi:10.1029/2004WR003513.
Guntner, A., S. Uhlenbrook, J. Seibert, and C. Leibundgut (1999), Multi-criterial validation of TOPMODEL in a mountainous catchment, Hydrol.Processes, 13, 1603–1620.
Harmel, R. D., R. J. Cooper, R. M. Slade, R. L. Haney, and J. G. Arnold(2006), Cumulative uncertainty in measured streamflow and water qual-ity data for small watersheds, Trans. ASABE, 49, 689–701.
Hooper, R. P., A. Stone, N. Christophersen, E. de Grosbois, and H. M. Seip(1988), Assessing the Birkenes model of stream acidification using amultisignal calibration methodology, Water Resour. Res., 24, 1308–1316.
Jones, J. A., and F. J. Swanson (2001), Hydrologic inferences from com-parisons among small basin experiments, Hydrol. Processes, 15, 2363–2366.
Kendall, C., and J. J. McDonnell (1998), Isotope Tracers in CatchmentHydrology, 839 pp., Elsevier, New York.
Kirchner, J. W., X. H. Feng, and C. Neal (2000), Fractal stream chemistryand its implications for contaminant transport in catchments, Nature,403, 524–527.
Krysanova, V., F. Hattermann, and F. Wechsung (2005), Development ofthe ecohydrological model SWIM for regional impact studies and vulner-ability assessment, Hydrol. Processes, 19, 763–783.
Lindgren, G. A., G. Destouni, and A. V. Miller (2004), Solute transportthrough the integrated groundwater-stream system of a catchment, WaterResour. Res., 40, W03511, doi:10.1029/2003WR002765.
Lowrance, R., et al. (1997), Water quality functions of riparian forest buf-fers in Chesapeake Bay watersheds, Environ. Manage., 21, 687–712.
Maloszewski, P., and A. Zuber (1993), Principles and practice of calibrationand validation of mathematical-models for the interpretation of environ-mental tracer data in aquifers, Adv. Water Resour., 16, 173–190.
McDonnell, J. J. (1990), A rationale for old water discharge through macro-pores in a steep, humid catchment, Water Resour. Res., 26, 2821–2832.
McDonnell, J. J., M. K. Stewart, and I. F. Owens (1991), Effect of catch-ment-scale subsurface mixing on stream isotopic response, Water Resour.Res., 27, 3065–3073.
McGlynn, B. L., and J. J. McDonnell (2003), Quantifying the relativecontributions of riparian and hillslope zones to catchment runoff, WaterResour. Res., 39(11), 1310, doi:10.1029/2003WR002091.
McGlynn, B. L., J. J. McDonnell, and D. D. Brammer (2002), A review ofthe evolving perceptual model of hillslope flow paths at the Maimaicatchments, New Zealand, J. Hydrol., 257, 1–26.
McGlynn, B. L., J. J. McDonnell, J. Seibert, and C. Kendall (2004), Scaleeffects on headwater catchment runoff timing, flow sources, and ground-water-streamflow relations, Water Resour. Res., 40, W07504,doi:10.1029/2003WR002494.
McGuire, K. J., and J. J. McDonnell (2006), A review and evaluation ofcatchment residence time modeling, J. Hydrol., 330, 543–563.
McGuire, K. J., J. J. McDonnell, M. Weiler, C. Kendall, B. L. McGlynn,J. M. Welker, and J. Seibert (2005), The role of topography on catch-ment-scale water residence time, Water Resour. Res., 41, W05002,doi:10.1029/2004WR003657.
Michel, R. L. (1992), Residence times in river basins as determined byanalysis of long-term tritium records, J. Hydrol., 130, 367–378.
Monteith, S. S., J. M. Buttle, P. W. Hazlett, F. D. Beall, R. G. Semkin, andD. S. Jeffries (2006), Paired-basin comparison of hydrological responsein harvested and undisturbed hardwood forests during snowmelt in centralOntario: Streamflow, I., groundwater and flowpath behaviour, Hydrol.Processes, 20, 1095–1116.
Mosley, M. P. (1979), Streamflow generation in a forested watershed, NewZealand, Water Resour. Res., 15, 795–806.
Murray, C. D., and J. M. Buttle (2005), Infiltration and soil water mixing onforested and harvested slopes during spring snowmelt, Turkey LakesWatershed, central Ontario, J. Hydrol., 306, 1–20.
Muscutt, A. D., G. L. Harris, S. W. Bailey, and D. B. Davies (1993), Bufferzones to improve water-quality—A review of their potential use in UKagriculture, Agric. Ecosyst. Environ., 45, 59–77.
Nash, K. E., and J. V. Sutcliffe (1970), River flow forecasting throughconceptual models: 1. A discussion of principles, J. Hydrol., 10, 282–290.
Pearce, A. J., M. K. Stewart, and M. G. Sklash (1986), Storm runoff gen-eration in humid headwater catchments: 1. Where does the water comefrom?, Water Resour. Res., 22, 1263–1272.
Rademacher, L. K., J. F. Clark, D. W. Clow, and G. B. Hudson (2005), Oldgroundwater influence on stream hydrochemistry and catchment responsetimes in a small Sierra Nevada catchment: Sagehen Creek, California,Water Resour. Res., 41, W02004, doi:10.1029/2003WR002805.
Reddy, M. M., P. Schuster, C. Kendall, and M. B. Reddy (2006), Charac-terization of surface and ground water delta O-18 seasonal variation andits use for estimating groundwater residence times, Hydrol. Processes,20, 1753–1772.
Rodgers, P., C. Soulsby, S. Waldron, and D. Tetzlaff (2005), Using stableisotope tracers to assess hydrological flow paths, residence times andlandscape influences in a nested mesoscale catchment, Hydrol. EarthSyst. Sci., 9, 139–155.
Rodhe, A., L. Nyberg, and K. Bishop (1996), Transit times for water in asmall till catchment from a step shift in the oxygen 18 content of thewater input, Water Resour. Res., 32(12), 3497–3512.
Seibert, J., and J. J. McDonnell (2002), On the dialog between experimen-talist and modeler in catchment hydrology: Use of soft data for multi-criteria model calibration,Water Resour. Res., 38(11), 1241, doi:10.1029/2001WR000978.
Sivapalan, M., et al. (2003), IAHS decade on Predictions in UngaugedBasins (PUB), 2003–2012: Shaping an exciting future for the hydrolo-gical sciences, Hydrol. Sci. J., 48, 857–880.
Soulsby, C., and S. M. Dunn (2003), Towards integrating tracer studies inconceptual rainfall-runoff models: Recent insights from a sub-arcticcatchment in the Cairngorm Mountains, Scotland, Hydrol. Processes,17, 403–416.
Soulsby, C., R. Malcolm, R. Helliwell, R. C. Ferrier, and A. Jenkins(2000), Isotope hydrology of the Allt a’ Mharcaidh catchment, Cairn-gorms, Scotland: Implications for hydrological pathways and residencetimes, Hydrol. Processes, 14, 747–762.
Soulsby, C., D. Tetzlaff, P. Rodgers, S. Dunn, and S. Waldron (2006),Runoff processes, stream water residence times and controlling landscapecharacteristics in a mesoscale catchment: An initial evaluation, J. Hydrol.,325, 197–221, doi:10.1016/j.jhydrol.2005.10.024.
Stewart, M. K., and J. J. McDonnell (1991), Modeling base flow soil waterresidence times from deuterium concentrations, Water Resour. Res., 27,2681–2693.
Uhlenbrook, S., and C. Leibundgut (2002), Process-oriented catchmentmodeling and multiple-response validation, Hydrol. Processes, 16,423–440.
Vache, K. B., and J. J. McDonnell (2006), A process-based rejectionistframework for evaluating catchment runoff model structure, Water Re-sour. Res., 42, W02409, doi:10.1029/2005WR004247.
Weiler, M., and J. McDonnell (2004), Virtual experiments: A new approachfor improving process conceptualization in hillslope hydrology, J. Hy-drol., 285, 3–18.
Weiler, M., and J. R. J. McDonnell (2006), Testing nutrient flushing hy-potheses at the hillslope scale: A virtual experiment approach, J. Hydrol.,319, 339–356.
Wolock, D. M., J. Fan, and G. B. Lawrence (1997), Effects of basin size onlow-flow stream chemistry and subsurface contact time in the NeversinkRiver Watershed, New York, Hydrol. Processes, 11, 1273–1286.
Zoellmann, K., W. Kinzelbach, and C. Fulda (2001), Environmental tracertransport (H-3 and SF6) in the saturated and unsaturated zones and its usein nitrate pollution management, J. Hydrol., 240, 187–205.
""""""""""""""""""""""""""""S. M. Dunn, Macaulay Institute, Craigiebuckler, Aberdeen AB15 8QH,
UK. ([email protected])J. J. McDonnell, Department of Forest Engineering, Oregon State
University, Corvallis, OR 97331-5706, USA.K. B. Vache, Institute for Landscape Ecology and Resources Manage-
ment, Heinrich-Buff-Ring 26, Giessen D-35392, Germany.
14 of 14
W06408 DUNN ET AL.: RESIDENCE TIME OF CATCHMENT WATERS W06408