FACTORS INFLUENCING THE ADOPTION AND USE OF MOBILE ...
142
i | P a g e FACTORS INFLUENCING THE ADOPTION AND USE OF MOBILE APPLICATIONS FOR MICRO-ENTERPRISE OPERATIONS IN SOUTH AFRICA EMMANUEL SLINGER STUDENT NUMBER: 9527924 Thesis submitted in fulfilment of the requirements for the degree of Masters in Information Systems in the Department of Information Systems Faculty of Economic and Management Sciences University of the Western Cape Supervisors: Professor Shaun Pather Dr. Marieta du Plessis December, 2019
Transcript of FACTORS INFLUENCING THE ADOPTION AND USE OF MOBILE ...
i | P a g e
FACTORS INFLUENCING THE ADOPTION AND USE OF MOBILE
APPLICATIONS FOR MICRO-ENTERPRISE OPERATIONS IN SOUTH AFRICA
EMMANUEL SLINGER
STUDENT NUMBER:
9527924
Thesis submitted in fulfilment of the requirements for the degree of
Masters in Information Systems
in the Department of Information Systems
Faculty of Economic and Management Sciences
University of the Western Cape
Supervisors:
Professor Shaun Pather
Dr. Marieta du Plessis
December, 2019

ii | P a g e
Abstract
Title: Factors influencing the adoption and use of mobile applications for micro-enterprise
operations in South Africa.
E Slinger
Masters in Information Systems Thesis, Department of Information Systems, Faculty of
Economic and Management Sciences, University of the Western Cape
The micro-enterprise sector, although associated with mostly informal businesses, shows promise of
potential and transitioning to more formal businesses. With this in mind, the South African
government recognizes that prioritized sectorial development is needed to stimulate growth
particularly in the micro-enterprise sector. Considering that evidence reveals growth and
development in small business practices being closely related to the use of different forms of
Information and Communication Technologies (ICTs), if and when strategically applied. Therefore
recognizing the importance of ICTs the South African government has embarked on various
technology related initiatives to facilitate needed growth and development. Despite this,
entrepreneurs in the micro-enterprise sector demonstrate a low uptake of ICTs for their business
operations, including the use of mobile technologies which are the most common form of ICTs
available to micro- entrepreneurs.
Many previous studies have investigated the adoption and use of mobile technologies in the micro-
enterprise sector, but despite this a low uptake of mobile technologies still exists. For this reason, this
study investigates and empirically determines the factors influencing the adoption and use of mobile
applications for micro-enterprise operations in South Africa, using the Unified Theory of Acceptance
and Use of Technology (UTAUT) model as a lens. The research population comprised a group of
micro-entrepreneurs who all are users of a common mobile application (mentorship-movement
application). The main aim of the investigation was to determine (i) the factors influencing the
adoption and use of mobile applications for micro- enterprise operation, (ii) if the experience gained
and their satisfaction associated with using the mentorship-movement application will influence their
behavioural intention to use other mobile applications for business.
The study was conducted objectively and used hypothesis testing as the means of investigation. Data
was collected through the use of a survey questionnaire. The findings of the study indicate that
ii | P a g e
performance expectancy and effort expectancy positively influences the micro-entrepreneurs
behavioural intention to adopt and use mobile applications for micro-enterprise operations. The
findings also observed that social influence has no impact on the micro- entrepreneurs’ behavioural
intention to adopt and use mobile applications for business. Facilitating conditions and behavioural
intention were found to positively influence the use behaviour of the micro-entrepreneurs when it
comes to adoption and use of mobile applications for business. Moreover, the findings confirmed
that experience and satisfaction in using one mobile application does not influence the behavioural
intention of the micro-entrepreneurs to use other mobile applications for business.
The factors which have been found to bear influence on the adoption and use of mobile
applications amongst micro-entrepreneurs in South Africa have implications for both policy and
practice. In particular, the findings of this study may be used to inform the design of the various
programmatic interventions which seek to improve outcomes of the micro-entrepreneur sector.
This includes interventions by the Department of Small Business Development and that of the
Small Enterprise Development Agency (SEDA).
Key words: micro-enterprise, information and communication technologies, mobile
technologies, micro-entrepreneurs, UTAUT model, mentorship-movement application

iii | P a g e
Declaration and approval
I declare that this thesis entitled ‘Factors influencing the adoption and use of mobile
applications for micro-enterprise operations in South Africa.’ is my own work, that it has
not been submitted before for the award of any degree or examination in any other university,
and that all the sources I have used or quoted have been indicated and acknowledged as
complete references.
This thesis has been submitted for examination after approval by my academic supervisors.
Signed by:
Emmanuel Slinger Date 1 December, 2019
Signed:
Student
Approved by
............................................. ..................................................
Professor Shaun Pather Dr. Marieta du Plessis
Main Supervisor Co-supervisor

iv | P a g e
Acknowledgements
The completion of this study was due to the support of a number of people. First, I
acknowledge the support of my supervisors, Prof. Shaun Pather and Dr. Marieta du
Plessis, who refined my ideas throughout the research process. Their guidance was
invaluable.
I would like to thank the National Mentorship Movement for allowing me access to the
entrepreneurs in their mentoring programme.
Moreover, my wife, Chrystel Slinger, was an encouragement throughout. I cannot
thank her enough. My two sons Jayden-Lee Slinger, and Caleb Slinger for the love that
gives a reason to work hard.
Most importantly, in GOD I Trust. He is my ever-present support.

xii | P a g e
TABLE OF CONTENTS
Chapter 1: Introduction ................................................................................................................................. 1
1.1. Background to the research problem .......................................................................................................... 1
1.2. Statement of the Research Problem ........................................................................................................... 3
1.3. Primary Research Questions ...................................................................................................................... 4
1.4. Research Objectives................................................................................................................................... 4
1.5. Significance of the study ........................................................................................................................... 4
1.6. The scope of the study ............................................................................................................................... 6
1.7. Overview of the research design ................................................................................................................ 6
1.8. Structure of the thesis ................................................................................................................................ 7
Chapter 2: Literature Review ....................................................................................................................... 9
2.1. Introduction ............................................................................................................................................ 9
2.2. Micro Enterprises
2.2.1. Micro Enterprise classification ............................................................................................................. 10
2.2.2. Characteristics of the Micro Enterprise Sector .................................................................................... 11
2.3. The Role of Government in ICT Development ...................................................................................... 15
2.4. Role of ICT in Micro-Enterprise Development ...................................................................................... 16
2.4.1. ICT pervasiveness in the Digital Era ................................................................................................... 17
2.4.2. Role of mobile technology in Micro enterprise business ..................................................................... 18
2.5. Technology Adoption ............................................................................................................................. 20
2.6. Theoretical Considerations ..................................................................................................................... 21
2.6.1. Theory of Reasoned Action (TRA)...................................................................................................... 22
2.6.2. Theory of Planned Behaviour (TPB) ................................................................................................... 23
2.6.3. Diffusion of Innovation (DOI) ............................................................................................................. 24
2.6.4. Technology Acceptance Models (TAM / TAM2 / TAM3) ................................................................. 25
2.6.5. A Unified view of Acceptance and Use of Technology (UTAUT and UTAUT2) .............................. 29
2.7. Selection of a research model ................................................................................................................. 30
2.7.1. Summary of technology adoption models ........................................................................................... 32
2.7.2. Rationale for selecting UTAUT model ................................................................................................ 33
2.8. Chapter Summary ................................................................................................................................... 35
Chapter 3: Applying the UTAUT model ................................................................................................... 36
3.1. Introduction ............................................................................................................................................ 36
3.2. Applying the UTAUT model .................................................................................................................. 36
3.3. Factors that influence adoption (Determinants of UTAUT) ................................................................... 37
3.3.1. Performance Expectancy ..................................................................................................................... 37
3.3.2. Effort Expectancy ................................................................................................................................ 38
3.3.3. Social Influence ................................................................................................................................... 39
3.3.4. Facilitating conditions ......................................................................................................................... 40
3.3.5. Behavioural Intention and use behaviour ............................................................................................ 41
3.4. Experience and Satisfaction (Determinants of Intention) ....................................................................... 42

xii | P a g e
3.4.1. Experience with mobile mentoring application use ............................................................................. 43
3.4.2. Satisfaction with mobile mentoring application use ............................................................................ 43
3.5. Research Hypotheses ...............................................................................................................................44
3.5.1. Part 1: Determinants of behavioural intention and use behaviour (UTAUT) ...................................... 45
3.5.2. Part 2: Experience and Satisfaction as determinants of Behavioural Intention ................................... 46
3.6. Chapter Summary ................................................................................................................................... 47
Chapter 4: Research Methodology and Design ......................................................................................... 48
4.1. Introduction ............................................................................................................................................ 48
4.2. Research approach .................................................................................................................................. 48
4.2.1. Ontology .............................................................................................................................................. 49
4.2.2. Epistemology ....................................................................................................................................... 50
4.2.2.2. Interpretivism ................................................................................................................................... 50
4.2.2.3. Pragmatism philosophy .................................................................................................................... 51
4.2.2.4. Critical theory ................................................................................................................................... 52
4.2.2.5. Post-Positivism ................................................................................................................................. 52
4.2.2.6. Epistemological stance in this study ................................................................................................. 53
4.2.3. Quantitative versus qualitative studies ................................................................................................ 53
4.3. Research Design ..................................................................................................................................... 54
4.3.1. Research Aim ...................................................................................................................................... 54
4.3.2. Non-experimental Correlation Design ................................................................................................. 55
4.3.3. Survey Research .................................................................................................................................. 55
4.3.4. Research Population: National Mentorship Movement ....................................................................... 56
4.3.5. Sample Size ......................................................................................................................................... 57
4.3.6. Sampling Technique ............................................................................................................................ 57
4.4. Data Collection Strategy ......................................................................................................................... 57
4.4.1. Closed-end questionnaire..................................................................................................................... 58
4.4.2. Research Instrument ............................................................................................................................ 59
4.4.3. Questionnaire Design .......................................................................................................................... 59
4.5. Validity and reliability of the research instrument .................................................................................. 61
4.5.1. Validity ................................................................................................................................................ 61
4.5.2. Reliability ............................................................................................................................................ 62
4.6. Data Analysis .......................................................................................................................................... 63
4.7. Ethics ..................................................................................................................................................... 65
4.8. Chapter Summary .................................................................................................................................. 66
Chapter 5 – Data Analysis........................................................................................................................... 67
5.1 Introduction .............................................................................................................................................. 67
5.2. Overview of Research Questionnaire ...................................................................................................... 67
5.3. Response rate .......................................................................................................................................... 68
5.4. Data Screening and Management ........................................................................................................... 68
5.5. Descriptive Statistics .............................................................................................................................. 69
5.5.1. Gender and age .................................................................................................................................... 69
5.5.2. Ethnicity .............................................................................................................................................. 71
5.5.3. Education level .................................................................................................................................... 72

xii | P a g e
5.5.4. Highest educational achievement ........................................................................................................ 72
5.5.5. Experience using mentorship application ............................................................................................ 73
5.5.6. Satisfaction using mentorship application ........................................................................................... 74
5.6. Investigating normality and the Composite Constructs (UTAUT Model) ............................................. 75
5.7. Reliability Analysis ................................................................................................................................ 78
5.8. Validity .................................................................................................................................................. 80
5.8.1. Confirmatory Factor Analysis ............................................................................................................. 80
5.8.2. Assessment criteria of the measurement model ................................................................................... 81
5.8.3. Measurement Model results and outcome ........................................................................................... 82
5.9. Structural Model Assessment and Result ............................................................................................... 84
5.10. Experience and Satisfaction ………………………………………………………………………….. 88
5.10.1. Experience (Hypothesis 6) ................................................................................................................. 88
5.10.2. Satisfaction (Hypothesis 7) ................................................................................................................ 89
5.11. Chapter Summary ................................................................................................................................. 90
Chapter 6: Conclusion ................................................................................................................................. 92
6.1. Introduction ............................................................................................................................................ 92
6.2. Research Summary and Conclusion ....................................................................................................... 92
6.2.1. Research Question One........................................................................................................................ 93
6.2.2. Research Question Two ....................................................................................................................... 97
6.3. Theoretical contributions .......................................................................................................................100
6.4. Practical contributions .......................................................................................................................... 100
6.5. Limitations and Directions for Future Research .................................................................................... 101
6.6. Chapter Summary ................................................................................................................................. 103
REFERENCES ......................................................................................................................................... 104
APPENDICES
Appendix 1: Survey questionnaire
Appendix 2: Ethics clearance

xii | P a g e
LIST OF TABLES
Table 2.1.: Characteristics of micro enterprises… ........................................................................................ 22
Table 2.2.: Summary of Tech Adoption Theories ........................................................................................ 40
Table 4.1.: Summary of questionnaire structure (See appendix A) ............................................................... 60
Table 4.2.: Cronbach alpha reliability results using a Likert scale… ............................................................ 63
Table 5.1.: Age categories of micro-entrepreneurs… ................................................................................... 70
Table 5.2.: Gender of micro-entrepreneurs… ............................................................................................... 71
Table 5.3..: Ethnicity classification… ........................................................................................................... 71
Table 5.4.: Education level of micro-entrepreneurs… .................................................................................. 72
Table 5.5.: Highest educational achievement of micro-entrepreneurs… ...................................................... 73
Table 5.6.: Experience in using mentorship-movement application… ........................................................ 74
Table 5.7.: Frequency of use (mentorship-movement application) ............................................................... 74
Table 5.8.: Satisfaction using mentorship-movement application… ............................................................. 75
Table 5.9.: Range, mean and standard deviation of the dimensions (n = 217).............................................. 76
Table 5.10.: Cronbach Alpha measurement scale… ..................................................................................... 78
Table 5.11.: Cronbach Alpha Reliability Results (n=217) ........................................................................... 79
Table 5.12.: Measure Model Results… ....................................................................................................... 82
Table 5.13.: Model fit based on Chi-square and Df ...................................................................................... 83
Table 5.14.: Structural model fit indices ....................................................................................................... 85
Table 5.15.: Relationships between the variables ........................................................................................ 86
Table 5.16.: Experience in relation to Behavioural Intention… .................................................................. 88
Table 5.17.: Experience vs Behavioural Intention… ................................................................................... 89
Table 5.18.: Satisfaction vs Behavioural Intention… .................................................................................. 89
Table 6.1.: Checklist for Mobile Application Adoption..………………………………...........................101

ix | P a g e
LIST OF FIGURES
Figure 2.1.: The Theory of Reasoned Action (Ajzen & Fishbein 1980) ..................................................... 22
Figure 2.2.: The theory of planned behaviour (Azjen, 1985) ..................................................................... 23
Figure 2.3.: Technology Acceptance Model (Davis, 1989) ........................................................................ 25
Figure 2.4.: Technology Acceptance Model 2 (Venkatesh & Davis, 2000) ............................................... 26
Figure 2.5.: TAM3 (Venkatesh & Bala 2008) ............................................................................................ 27
Figure 2.6.: The UTAUT Model (Venkatesh et al. 2003) ..........................................................................29
Figure 2.7.: The determinants of intention and use behaviour (UTAUT) .................................................. 30
Figure 5.1., Structural model with standardized path coefficients… .......................................................... 87

xvi | P a g e
List of acronyms
ANOVA : Analysis of Variance
DOI : Diffusion of Innovation
GEM : Global Entrepreneurship Monitor
ICT : Information and Communication Technology
ICASA : Independent Communications Authority of South Africa
SEDA : Small Enterprise Development Agency
SEM : Structural Equation Modelling
SMME : Small, Medium and Micro Enterprises
SPSS : Statistical Package for the Social Sciences
TAM : Technology Acceptance Model
TPB : Theory of Planned Behaviour
TRA : Theory of Reasoned Action
UTAUT : Unified Theory of Acceptance and Use of Technology
NDP : National Development Plan
NMM : National Mentorship Movement

Chapter 1: Introduction
1.1. Background to the research problem
Like many developing countries, South Africa faces high unemployment and impoverished
conditions, which is diminishing to an economy focusing on growth and development (Esselaar
et al., 2007; Herrington et al., 2009; Farrington, 2012; SEDA, 2017). Given that various
interventions and initiatives are required to stimulate economic growth, the South African
government through their various support cooperatives prioritised technology interventions
(SEDA 2017, 2018). By developing technology infrastructure, an environment conducive for
small business growth is developed, as evidence indicates that growing economies are those
that are inclined to technological advancements (Ndiege et al., 2012; Liedholm & Mead, 2013;
Nagayya & Rao, 2013; Kyro, 2015). Such interventions aim at strategically addressing the
effects of high unemployed and poverty, as small business creation would result in more
employment and also a vehicle for wealth creation and distribution (Liedholm & Mead, 2013;
Nagayya & Rao, 2013; Kyro, 2015).
The micro-enterprise sector is seen as an important contributor to economic growth, even
though this sector consists of small businesses where the majority are not registered and trade
informally (DTI, 2008; SEDA, 2017; South Africa, 2017, p.8). As a result, many researchers
have implied that the contribution made by the micro-enterprise sector to economic growth is
unclear, and that development in this sector is displaced, as there is no definitive way to
measure the contribution made by the micro-enterprise sector (Okon, 2015; Chimucheka, 2013;
Bhorat & Mayet, 2012; Nxele, 2009; Berry, 2002). However, this is contrary to many other
researchers that have alluded that more focus should be placed on developing the micro
enterprise sector, as the outcome would result in a greater improvement to socio-economic
conditions and also a greater individual participation to the overall growth of the economy (Das
Nair & Dube, 2015; Cichello et al., 2011; Herrington et al., 2009; Chibelushi, 2008).
Despite the opposing views, statistically, most micro-enterprise start-ups have not been as
successful and failed to operate beyond their nascent stages (SEDA 2017, 2018; Seed
Academy, 2018). This in particular, is of great concern to local and national government
agencies that have been mandated to grow and develop small businesses (SEDA 2017; PMG
1 | P a g e

2 | P a g e
2018). Numerous initiatives have been strategically used to address challenges that prohibit
micro-enterprise development, for example, partnerships with private and public business
advisory agencies and mentors. Such initiatives are aimed to develop and support micro-
enterprise growth, and in that way improve the success rate of micro-enterprise start-ups
(Hilson 2003; Beck, Demirguc-Kunt & Levine 2005; Cravo, Gourlay & Becker 2012; South
Africa, 2017:8; PGM 2018). However, supporting all micro-enterprise start-ups in ways that
are more traditional, is considered as counterproductive to progressively develop
entrepreneurial skill-set on a mass scale, as accessibility to support cooperatives and
geographical constraints would influence the pace at which the entrepreneurial skill-set would
be developed (PGM, 2018). With this in mind, and given that mobile (or data driven)
applications are currently viewed as the most pervasive form of technology, mobile
applications are therefore seen as the most practical medium that would enable mass
entrepreneurial development (Hew et al., 2015; Hislop et al., 2015; Islam, 2017). Mobile
devices display high penetration levels and also a common accessory to most, if not all micro-
entrepreneurs (Vatanasakdakul et al., 2019; Deloitte 2017, South Africa, 2017, p.8; SEDA,
2017; PMG, 2018; Owoseni & Twinomurinzi, 2016; Yang et al., 2013).
Recognizing that mobile applications are the most feasible medium to mass entrepreneurial
development, the concept of online mentoring have not yet been fully explored in South Africa
(National Mentorship Movement, 2015). Mentoring is generally accepted as face to face
engagements between a mentor and mentee and therefore presents an opportunity to use
technology as a medium to micro-entrepreneurial development and success (O’Neil & Murphy,
2010). Mentoring applications facilitate engagements that cross any geographical boundaries
and allow the micro-entrepreneurs to make skill based decisions on demand as a result of the
online mentor-mentee relationship (Duff, 2002; Muller & Barsion, 2003; O’Neil & Murphy,
2010 and NMM, 2015). Therefore understanding the impact of using a mentoring application
on the subsequent adoption and use of other mobile applications for business is useful to the
advancement micro-entrepreneurial success through the appropriate use of mobile applications
(Knouse, 2001; Single & Muller, 2001 and O’Neil & Murphy 2010).
Studies conducted by Herrington et al. (2009:171), Ndiege et al. (2012), Nagayya and Rao
(2013), Kyro (2015) and Tambotoh et al. (2015), shows the uptake of more mobile applications
for business, as one of the most feasible approaches to micro-enterprise operational
3 | P a g e
efficiencies. By adopting and using the appropriate mobile applications, micro entrepreneurs
are enabled to support their line of business more effectively (Harker et al., 2002; Donner,
2007; Esselaar, 2007, Herrington et al., 2009; Steyn 2011). Even so, others have argued that
despite the feasibility of mobile applications for business, evidence still indicate that micro
entrepreneurs lag to fully realize the potential associated with adopting and using mobile
applications for business outcomes (Islam, 2017; Hew et al., 2015; Hislop et al., 2015; Steyn,
2011; Matthews, 2007; Celuch, Murphy & Callaway, 2007). Some of the key factors
influencing the adoption and use of mobile applications have been described as being
controlled by user perceptions (Tarute & Gatautis, 2014; Tan, 2013; Bhattacherjee & Sanford,
2006:811). Perceptions pertaining to whether mobile applications are easy to use and its
perceived usefulness have been documented as having a direct influence on the intention to
adopt mobile applications, and the subsequent use of mobile applications for business (Tarute
& Gatautis, 2014; Tan, 2013; Bhattacherjee et al. 2006:811). In understanding this behaviour,
the adoption of various forms of technology has been extensively examined and will remain an
area of investigation as technology is constantly evolving, and evidently at a more progressive
pace then the adopters of technologies (Guritno & Siringoringo 2013; Kim, Li & Kim 2015).
1.2. Statement of the Research Problem
The South African government has commissioned various initiatives to stimulate small
business growth and development, but the failure rate of start-up businesses, especially micro-
enterprises, remain high. In addition, even though the availability of broadband internet and
associated mobile applications has become pervasive, there is still a low uptake in this sector.
Not all micro entrepreneurs regard technology as an enabler to business growth, which is
contrary to various technological initiatives that position technology as a conduit to business
growth. This short coming in the use of mobile technology warrants an investigation
concerning the low uptake of mobile applications for micro-enterprise operations.
1.3. Primary Research Questions
1. What are the factors influencing the adoption of mobile applications for micro-
enterprise operations?
2. Does the use of mobile mentoring applications influence the adoption of mobile
applications for micro-enterprise operations?

4 | P a g e
1.4. Research Objectives
The objectives of this research are:
To evaluate the extant technology adoption models and frameworks in respect of
relevance to the research problem.
To determine the factors influencing the adoption of mobile applications for micro-
enterprise operations.
To determine if the use of a mobile mentoring application influence the adoption of
mobile applications for micro-enterprise operations.
1.5. Significance of the study
At this present time, there is no study that categorizes the adoption of mobile applications for
micro-enterprise operations, according to the micro entrepreneurs’ participation in an online
mentoring programme. The study evaluates micro-entrepreneurs’ perceived experience and
satisfaction in utilizing a mentoring application. Following on this, the study assesses the
relationship between the latter and micro-entrepreneurs’ intention to use other mobile
applications for business outcomes.
The outcomes of the study is therefore of importance to policy makers and business advisory
agencies, as it supports design and strategy formulation aimed at addressing factors influencing
the adoption of ICTs for business. The use of technology in business is viewed as an enabler to
small business growth and development and therefore relevant to micro-enterprise
development.
The findings of this study are therefore of importance to the following groups:
i. Policy makers
The study could inform government policy to recognize mobile mentoring as a conduit to mass
entrepreneurial development, and also to the advancement of mobile application use in small
business operations, especially in the sectors like the micro enterprise sector. The study
indicates how national and local policies are to consider mobile application adoption amongst
micro-entrepreneurs, to ensure that the adoption and use thereof advances micro-businesses
5 | P a g e
practices. This consideration necessitate policy makers to take into account that not all small
businesses are equal, and that social environments and pressures differ and therefore require
policy that considers this.
ii. Private and public business advisory agencies
The findings of the study could potentially inform public and private business advisory
agencies considering mobile applications for mentoring initiatives. Also, that a more focused
design approach is used, bearing in mind the factors influencing the adoption and use of mobile
applications for business. The outcome of the study will inform business advisory agencies to
consider and understand the importance of their service offerings and the extent to which they
could better services, taking into account the challenges that inhibit a sector like the micro-
enterprise sector. This consideration would enable them to align a mobile application adoption
process that would handle sectorial challenges.
iii. Micro-entrepreneurs
The finding of the study could inform micro-entrepreneurial decision making when considering
the implementation of a mandatory mobile application system for business use. Micro-
entrepreneurs will be enabled to formulate an implementation strategy considering the
operational benefits associated with such an implementation, as well as considering the factors
influencing the adoption and use of the mandatory mobile applications amongst employees and
how they could potentially implement a mobile application that is useful and easy to use for
both the employees and business owner alike.
1.6. The scope of the study
This section describes the scope of the study in terms of the geographical consideration, the
target population, as well as the extant literature relevant to this study phenomenon.
Geographically, the study is conducted in South Africa, more specifically, those who operate in
the micro-enterprise sector. Micro-entrepreneurs whom are often categorized as informal
traders with the potential to develop into more formal businesses were considered.

6 | P a g e
Furthermore, those who participate in the National Mentorship Movement’s1 online mentoring
programme were targeted given the objective of this study.
Overall, the knowledge area of interest of this study concerns the adoption of mobile
applications for micro-enterprise operations. This area of interest was influenced by the fact
that mobile technology has become more and more pervasive and critical to small business
success. In addition to that, evidence indicate when mobile technologies are strategically used
in business, they contribute to the overall growth and development of that business. The study
considers this as an important factor that will enable the advancement of micro-enterprise
business practices.
1.7. Overview of the research design
Given the research objectives of this study (see section 1.4.); the theories and models of
technology adoption were reviewed to understand previous knowledge and the application of
those theories and models, and also to determine the relevance on this study. The theories and
models considered for this study included; the theory of reasoned action; the theory of planned
behaviour; the technology adoption models and the unified theory of acceptance and use of
technology.
After careful consideration, the unified theory of acceptance and use of technology (UTAUT)
model was selected as a framework suitable for this study. The UTAUT model offered an array
of variables that supported the investigation of the micro-entrepreneurs intention to use mobile
applications for business, as well as the subsequent use of mobile applications for business. The
variables are performance expectancy, effort expectance, social influence and facilitating
conditions. Furthermore, the micro-entrepreneurs intention to use other mobile applications for
business were investigated as a result of the experience gained in using the mentorship-
movement application, as well as the degree to which they satisfied in using the mentorship-
movement application.
The operationalization of the aforementioned variables, lead to the formation of the hypotheses
used in this study as presented in section 2.7. In general, the starting point for this study was
1 National Mentorship Movement is a platform where entrepreneurs (mentees) are paired with experienced
business advisors, coaches and business owners (mentors) to facilitate growth and development on demand,
allowing inexperienced entrepreneurs to make skill-based decisions
7 | P a g e
the existing theories of technology adoption and those suggested and indicated in the
conceptual framework. The proposed hypotheses were then used to verify the theories in line
with an ontology philosophical view of realism. This view encourages scientific methods and
techniques when undertaking research (Scotland, 2012) and therefore it was essential to adopt a
positivism epistemological view in this study’s research activities. As a result, the
operationalization of this study adhered to a deductive style as indicated under a positivism
philosophical view (Heit & Rotello, 2010; Kura, 2012).
A survey design was used where an online questionnaire was the primary instrument used for
collecting data. The main participants for this study were micro-entrepreneurs using an online
mentorship application of the National Mentorship Movement in South Africa.
1.8. Structure of the thesis
The thesis is arranged into six chapters:
Chapter 1 introduces the background of the study, the research problem, research objectives,
the significance of the study, and also the philosophical underpinning of the study. In summary,
together with the effort invested towards using technologies to promote micro-business; a gap
pertaining to an under-utilization of technologies like mobile applications in micro-enterprises
are still evident. Micro-entrepreneurs are expected to use mobile applications to promote their
operational activities and in doing so, develop and grow into more sustainable businesses.
Given the importance of this subject, it was necessary to determine the factors influencing the
adoption of mobile applications for micro-operations in South Africa.
Chapter 2 expounds on the literature relating to the study phenomenon, of which the first part
of the literature defined the main idea of the study. Following on the main idea, literature
pertaining to studies in the area of mobile technology adoption was reviewed. The chapter
concluded with a summary of the most prominent technology adoption models and the
selection of the best suited for this study, being the UTAUT model.
Chapter 3 focuses on the application of the UTAUT model and reviews other mobile
technology adoption studies who has applied the UTAUT model in their studies. The reviewed
studies recognized the importance of the factors influencing mobile technology adoption which
consequently influenced the creation of a conceptual framework and the formation of

8 | P a g e
hypotheses for testing.
Chapter 4 details the methodology used by way of providing the research design and the
formulated strategy appropriate for this study. The fundamentals of the employed methodology
include the ontology, epistemology and the approach to the study. In addition, an outline
pertaining to the sampling procedure, data collection methods, and techniques for ensuring the
reliability and validity were considered. In short, the study aligned to a realism ontological
view and a positivist epistemological view. An online questionnaire was used to collect data,
which had to be both reliable and valid for the purpose of the study. The subsequent analysis
made use of the Statistical Package for Social Science (SPSS), of which the adopted models
included Pearson Correlation Model, and the Multiple Regression Model.
Chapter 5 describes how the data was analysed and also the analytical models used to interpret
the data. By comparing how the study data to the extent literature reviewed, the position of
hypotheses was determined. The latter part of the chapter indicates how the hypotheses test
results correspond with the research model through regression analysis. The study notably
observes the following: the experience of the micro-entrepreneurs when it comes to the use of
mobile applications for business outcomes, their intention to use mobile applications for
business as well as the use behaviour of mobile applications.
Chapter 6 summarizes the study, depicting key assumptions based on the findings. In addition
to that the limitations of the study are given as well as presenting recommendations for future
studies. Decisively, behavioural intention and facilitating conditions influence the adoption of
mobile applications for micro-enterprise operations. In addition, the limitations of the study
recognize that in reality the sampled group of micro-entrepreneurs might not be representative
of all entrepreneurs in the micro-enterprise sector, but still meaningfully contribute to literature
pertaining to mobile application adoption for business outcomes amongst micro-entrepreneurs
in South Africa.

9 | P a g e
Chapter 2: Literature Review
2.1 Introduction
The adoption and use of technology for business is a common area of study, given the evidence
that the use of technology improves organizational effectiveness when strategically applied
(Kyobe, 2011; Liebenberg, 2015). The extant literature corroborates the enabling advantages
associated with the use of technology and therefore forms the basis of this study.
The micro-enterprise sector (also the subject matter of this study), is noted as a key contributor
to socio-economic growth (Wolcott et al., 2008), a solution to high unemployment (Nagayya &
Rao, 2013), a distributor of wealth (Michailidis et al., 2012) and an eradicator of poverty
(Okon, 2015). Recognizing the potential within this sector, the South African government
through various governmental bodies and agencies has employed several initiatives to promote
growth and development in this sector (South Africa, 2016; Nguyen et al., 2013). Amongst
those initiatives, technology infrastructure development is prioritized, as technology is seen as
being instrumental in sectorial developments in South Africa (Tambotoh et al., 2017), and also
to advance socio-economic growth through micro-enterprise participation in the greater
economy (Tambotoh et al., 2017; Twinomurinzi et al., 2012; Urquhart et al., 2008).
Considering that various technology related interventions have been employed by the South
African government to promote and facilitate the use of technology in small to medium
enterprise sectors, the micro-enterprise sector, in particular, are still seen as reluctant users of
technology (Tambotoh et al., 2017; Cant et al., 2015; Singh, 2010). The behaviour observed in
the micro-enterprise sector is therefore contradictory to compelling evidence that support the
use of technology in small business growth and development (Nguyen et al., 2015; Nagayya &
Rao 2013; Schwartz et al., 2010).
Mobile technology is seen as the most common and accessible form of technology available to
the micro-enterprise sector (Kimh et al., 2016; Michailidis et al., 2012; Kyobe, 2011), and
therefore this chapter undertakes a review of literature to examine the factors influencing the
adoption and use of mobile applications for micro-enterprise operations. This review of
literature will investigate known characteristics of the micro-enterprise sector as a basis to
understand their reluctance to use technology; the observed role of mobile technology to micro
operational advancement; the supporting role of government in enabling the pervasiveness of
technology; and technology adoption models and their relevance to this study.
10 | P a g e
This chapter concludes by identifying a suitable technology adoption model that is further used
as a lens to facilitate the investigation of the factors influencing the adoption and use of mobile
applications for micro-enterprise operations.
2.2 Micro Enterprises
Contextualizing the micro-enterprise sector requires recognition that micro-enterprises form an
important segment of the South African economy, and an outlet to develop socio-economic
growth (Tsoabisi, 2012; Olawale & Garwe, 2010; Berry et al., 2002). Micro enterprises, offer
policy makers and government agencies a way to address inequalities in socio economic
conditions (Tsoabisi, 2012).
Inequalities in present socio economic conditions are often described as the resultant effects of
a previously disadvantaged society (Olawale & Garwe., 2010), where economic opportunities
favored a select group of the South African population (Chimucheka, 2013). Even so, South
Africa still faces high unemployment and the prevalence of an impoverished society, especially
those living in rural areas (Chimucheka, 2013; Malefane, 2013). The South African
government views enterprises like those in the micro-enterprise sector as a strategy to eradicate
the effects of poverty, and thereby create environments or rather support cooperatives that will
facilitate sectorial growth through entrepreneurial development (SEDA, 2017; Liedholm et al.,
2013). This empowerment strategy strengthens individual abilities to enable or sustain them, by
engaging in small business activities and simultaneously address high unemployment (SEDA,
2017; South Africa, 2015; Tsoabisi, 2012). Small businesses in the micro-enterprise sector have
relatively low entry barriers and thus are able to accelerate socio-economic development and
increase the overall participation in a growing South African economy (Tambotoh et al., 2018,
Timm, 2012).
2.2.1 Micro Enterprise classification
Micro enterprises, as described in the National Small Business Act (102 of 1996), are small
businesses that lack formality, meaning that it lack formal business premises, and any formal
business registration, etc. Micro-enterprises generate an annual turnover of less than R150 000
and usually employ five or fewer individuals. For example, micro-enterprises include
businesses like spaza shops, home-based businesses, and minibus taxis. For the purpose of this
study the micro enterprise sector will include the survivalist sector, whom according to the

11 | P a g e
National Small Business Act (102 of 1996) is informal traders, generating income below the
recommended standard of living and beneath the lines of poverty. Survivalists include street
vendors and hawkers and often are seen as part of the micro enterprise sector.
According to Liedholm et al. (2013) the micro enterprise sector displays the potential to
transition from informal to that of more formal businesses. Ismail et al. (2011) and Esselaar et
al. (2007) however argue that informal businesses are often overlooked and excluded from the
so-called government initiatives, as there seem to be more focus placed on developing formal
or more established businesses. The bureaucracy of formalizing micro-enterprise businesses
often discourages aspirant micro-entrepreneurs to transition to more formal businesses and
often left feeling unsupported (Ismail et al., 2011; Esselaar et al., 2007).
However, according to SEDA (2017) the likelihood that micro-enterprises will successfully
transition to more formal businesses will only be realized once micro entrepreneurs fully utilize
support interventions and initiatives made available by the various government agencies.
SEDA (2017) do however state that in some cases, micro entrepreneurs may find it difficult to
access their support initiatives (specifically those in the rural areas), but attribute the lack of
awareness of the start-up support services as one of the main reasons for high start-up failures
amongst micro-entrepreneurs.
2.2.2. Characteristics of the Micro Enterprise Sector
Micro enterprises are often created out of necessity (Liedholm et al., 2013). Entrepreneurs
endeavor to support themselves and their families by selling goods as a means to survive,
instead of succumbing to unemployment. According to Mead (1994), Duncombe and Heeks
(2005) and Heeks (2008), in understanding the characteristics of the micro-enterprise sector,
better suggestions can be made when promoting initiatives to develop this sector.
When reviewing literature various characteristics that are accustomed to the micro-enterprise
sector are mentioned, which include a labour force that is highly unskilled (Stork & Esselaar
2006). Stork and Esselaar (2006) state that a lack of employment opportunities compel
individuals to engage in some form of entrepreneurial activity to either supplement income
(due to unemployment) or earning sub-minimum wages, as a means to sustain their livelihoods.
According to Fernandez et al. (2017), Banda et al. (2015), Bhorat and Mayet (2012), Heels
(2008) and Eckhardt & Shane (2003) the micro-enterprise sector, arguably displays a limited

12 | P a g e
growth and development potential, due to a lack of infrastructure and support. Researches like
Tambotoh et al. (2018), Steenkamp and Bhorat (2016), Das Nair and Dube (2015), Timm
(2012), Cichello et al. (2011) and Herrington and Mass (2007) argue that if support structures
remain inaccessible, high start-up failures are expected to continue amongst micro-
entrepreneurs, especially those in rural areas. Tsoabisi (2012) however argues that when
analysing start-up failures, excessive registration processes and tax conformities required by
government agencies can also be viewed as part of the reasons start-up businesses fail. Tsoabisi
(2012) further argues that excessive registration processes and the like can be viewed as being
contradictory to a mandate that focuses on growing and developing small businesses, like those
in the micro-enterprise sector.
Table 2.1., below illustrates characteristics accustomed to the micro-enterprise sector as stated
in the reviewed literature.
Table 2.1.: Characteristics of micro enterprises
Characteristics Reference
Income activities of micro enterprises often do
not yield huge profit margins;
Liedholm & Mead, 1999; Good & Qureshi, 2009;
Rolfe at al., 2010; Berry et al., 2002; Duncombe
& Heeks, 2005; Herrington et al., 2010
There is no evidence of income as a result of
businesses is separated between. personal and
business income;
Chibelushi, 2008; Chew et al., 2010; Chandy &
Narasimahn, 2011
Businesses in the micro-enterprise sector usually
do not pay any taxes;
Poor infrastructure and lack of adequate business
premises;
Kotelnikov, 2007; Chibelushi, 2008; Good & Qureshi, 2009; Beggs, 2010; Pigato, 2011;
Okello-Obura et al., 2010; Torero et al., 2006
Limited support infrastructures from the
government agencies, especially to those
operating in rural areas;
Jones, 2011; Eze et al., 2018; Wilcott et al.,
2008; Obura et al. 2010; Torero et al. 2006
Micro-enterprises have limited market access and
therefore lack a customer base to foster business
growth;
SEDA, 2017; Arendt, 2008; Ahmedova, 2015;
Eze et al., 2018; Antonelli et al., 2001
Micro-enterprises have limited access to financial
and other resources needed for their operational
development and growth
SEDA, 2017; Arendt, 2008; Kyobe, 2011
Micro-entrepreneurs often start businesses based
on experiences gained in past working activities,
but lack an entrepreneurial skill-set to grow and
develop a business;
Ahmedova, 2015; Rhodes, 2009; Ardjouman,
2014

13 | P a g e
Micro-entrepreneurs lack of the necessary
business education and acumen, which is further
contained due to a lack of access to information
and advice;
Rhodes, 2009; Nagayya & Rao, 2013; Ahmedova, 2015
The level of education amongst the micro-
entrepreneur is usually low and characterized as a
sector that inhibit predominantly uneducated
individuals;
Galloway & Mochrie, 2005; Nagayya & Rao,
2013; Wilcott et al., 2008; Schlemmer & Webb,
2009
The micro-enterprise sector is commonly
characterized as being unaware of the benefits
associated with the use of ICT (ICT as a
strategy) as entrepreneurs lack research and
innovativeness when it comes to the use of ICT
as a result of limited ICT literacy;
Arendt, 2008; Michailidis et al., 2012; Jones,
2011; Yu et al., 2017; Qureshi, 2005; Wolcott et
al., 2008; Gono et al., 2015; Kroze, 2011
When reviewing literature (see Table 2.1.), the discussions surrounding the benefits of
technology adoption, especially in the micro-enterprise sector concerns mostly, poverty
alleviation, better access to education and information, access to governmental support
agencies and financial services (Torero & von Braun, 2006; Urquhart et al., 2008; Ardjouman,
2014; Tambotoh et al., 2015). Urquhart et al. (2008) states that the use of technology becomes
more critical to the micro-enterprise sector, as this seem to be the most impoverished sector.
Advancing the use of technology in the micro-enterprise sector is therefore critical to socio-
economic development, as this sector seems to be faced with numerous challenges that prohibit
the adoption and use of technology for business (Beggs, 2010; Jones, 2011; Eze et al., 2018).
Challenges, amongst others, include access to financial resources; poor infrastructure; lack of
ICT skills; lack of business management skills; and onerous policies and legal requirements
(Torero et al., 2006; Rhodes, 2009; Nagayya & Rao, 2013; Ahmedova, 2015; SEDA, 2017).
The resultant effect is the underutilization of technology, which then lead to micro-
entrepreneurs being unable to fully take advantage of the benefits associated with the adoption
and use of technology (Torero et al., 2006; Arendt, 2008; Michailidis et al., 2012; Jones, 2011;
Yu et al., 2017).
Even though the micro enterprise sector is plagued with varying unfavorable operational
conditions (depicted in Table 2.1), this sector however plays a significant role in socio-
economic growth. Despite the fact that the contribution made by the micro enterprise sector
seems unclear, a consensus exists that the micro-enterprise sector positively contributes to the
overall economy of South Africa (Berry et al., 2002; Duncombe & Heeks, 2005; Herrington et
al., 2010).

14 | P a g e
Given a progressive undertaking of infrastructure implementation, like a wide-scale roll-out of
broadband, the challenge, however, is to encourage a sector like the micro-enterprise to adopt
more ICT tools, especially in the form of mobile technology (Gono et al., 2015; Pigato, 2011).
By adopting mobile technologies, micro-entrepreneurs are enabled to improve the operational
activities of their micro-enterprises and thereby take advantage of the associated and known
benefits of mobile technologies (Pigato, 2011; Okello-Obura et al., 2010; Torero et al., 2006).
Gono et al. (2015) and Kroze (2011) argue that a lack of ICT knowledge and skill, especially in
the micro-enterprise sector prohibit entrepreneurs from strategically using ICTs to promote
their business operations (depicted in Table 2.1). Apart from a lack of ICT knowledge and skill,
micro-entrepreneurs also lack financial resources to commission ICT specialists (external to
their organisations) to implement and support ICTs (Gono et al., 2015; Kroze, 2011). Be that as
it may, the role of ICT cannot be underscored, so much so, that the South African government
has employed various agencies to promote the skill-set of would be entrepreneurs. A thriving
economy therefore demands access to ICT infrastructure that is affordable and accessible with
the necessary support structures (Kroze, 2011; Kyobe, 2011).
Given the presiding characteristics evident in the micro-enterprise sector (as portrayed Table
2.1); this sector still display noticeable growth potential and the ability to meaningfully
contribute to the South African economy (SEDA, 2017; Ahmedova, 2015; Ardjouman, 2014).
According to Qureshi (2005) and Wolcott et al. (2008), entrepreneurs in the micro enterprise
sector have the ability to develop knowledge and an entrepreneurial skill-set if motivated to
take advantage of available support infrastructures. Support infrastructures will empower
micro-entrepreneurs to develop a skill-set that will enable them to generate a sustainable
income and be a more active participant in socio-economic growth activities (Qureshi, 2005;
Wolcott et al., 2008).
2.3. The Role of Government in ICT Development
Given that socio-economic development is essentially the responsibility of the South African
government, the role played by the South African government in sectorial development, is
therefore seen as being critical, albeit revising policy and ICT infrastructure development
which is necessary for small business growth. With this consideration in mind, the benefits
associated with adopting and using ICTs in small businesses should therefore concern

15 | P a g e
government agencies when informing policies and support interventions (Nguyen, 2009).
Technology uses are constantly evolving and thus require a prioritized focus that is essential to
small business transformation (Nguyen et al., 2013). This evolution of technology requires
astute policy and regulatory conformities that will enable and encourage the use and
innovativeness of ICT amongst all sectors of the South African economy.
Considering the progressive development in the technology arena (and the known advantages
with the use of technology), the South African government, as part of their 2030 goal, plan to
diminish the effects of poverty through the use ICT (New Growth Plan, 2010; National
Development Plan, 2013). ICT enablement is seen as a vehicle that can create a digital
inclusive society, which will result an improvement in the quality of life of a previously
disadvantaged group of South Africans (South African Government, 2015). Digital inclusive
societies present individuals and small businesses (like those in the micro-enterprise sector),
with new market opportunities, which require accessible ICT infrastructures and wide-scale
broadband connectivity (Ngassam et al., 2013).
ICT infrastructure and wide-scale broadband is considered important to small business
development, hence the National Integrated ICT Policy White Paper, in which the South
African government addresses key ICT strategies that will facilitate small business growth.
According to the National Integrated ICT Policy White, entrepreneurs in the micro-enterprise
sector will be afforded opportunities to generate wealth and eradicate poverty through the use
of ICT (South Africa, 2016). The White Paper also suggests that as part of government
strategy, the advantages associated with a digital economy should be promoted through
awareness and skill transfer, and also by prioritizing sectorial developments (section 10.6.1.).
In addition, various aspects surrounding the deployment of more affordable and faster
broadband services are addressed as a strategy that that will increase market accessibility and
competitiveness. Businesses like those in the micro-enterprise sector are then able to offer a
diverse range of products that will result a potentially larger client-base (South African
Government, 2015, 2016). Even though the White Paper addresses the importance of ICT as
strategy to socio-economic development, it does not quite describe specific ICT adoption
strategies, even though many previous interventions indicate an under-utilization of ICT for
business. This under-utilization of ICT is specifically noticeable in the micro enterprise sector,
which forms the basis of this study.

16 | P a g e
2.4. Role of ICT in Micro-Enterprise Development
The past few decades have witnessed a progressive digital transformation through the use of
the internet. The way in which individuals access information, communicate and engage with
each other, with service providers and government bodies have demonstrated the pervasiveness
of ICT. Given this pervasiveness, the South African ICT policy required change in order to
develop an environment that will facilitate economic transformation through the use of ICT.
This enabled transformation requires individuals and small businesses alike, to use ICT as a
medium to growth and develop their economic status.
ICT is used to describe an array of technologies which includes telephones (land or mobile),
computers, networks, and the internet which are expected to group, collect, manage and
exchange information (Ritchie & Brindley, 2005). ICT capabilities are used in different ways,
but often aligned to fundamentally support the nature of the business, be it strategic,
operational or even marketing.
Ngek et al. (2013) however argues that low levels of ICT adoption and lack of innovativeness
amongst micro-enterprise businesses should be viewed as a key obstacle to growth and
development. Ngek et al. (2013) further argues that despite the global recognition of the
benefits associated with the use of ICT, most entrepreneurs in the micro-enterprise sector seem
to be unaware of those benefits, and therefore under-utilize ICTs. Some of the benefits include,
but are not limited to, increased productivity, more efficient ways of implementing businesses
practices, and stream lining business processing tasks (Ndiege, Herselman & Flowerday, 2012;
Nguyen, 2009; Berry et al., 2002).
According to Donner (2007), Esselaar (2007), Ismail et al. (2011) and Ardjouman (2014) the
use of ICT in micro-enterprise operations result in improved operational effectiveness when
ICT is strategically aligned to the organisational objectives of the micro-enterprise. ICTs
enable micro-entrepreneurs to reduce their operational expenses; to improve their procurement
capabilities (being able to effectively compare and evaluate supplier products and their price
offerings); to transform the way in which they engage with their clients; and allow them to
extend their client-base quicker (Donner, 2007; Esselaar, 2007; Nyamba & Malongo, 2012;
North et al., 2014).

17 | P a g e
In spite of this, a lag in the use of ICT in micro-enterprise business persists (Tambotoh et al.,
2018; Fernandez et al., 2017; Steenkamp & Bhorat, 2016; Nguyen et al., 2013; Donner &
Escobari, 2010) and therefore needs to be understood, since ICT is pervasive, specifically
mobile technologies (Donner & Escobari, 2010; Liedholm & Mead, 2013; Nagayya & Rao,
2013; Asongu, 2013).
2.4.1. ICT pervasiveness in the Digital Era
In South Africa, the use of mobile phones is one of the quickest and trendiest ways to connect
to the internet in spite of the high costs of mobile data (Michailidis, 2012; Asongu, 2013). The
resultant effect of high mobile data costs is that consumers are forced to use less data intensive
mobile applications, and thereby not fully making use of the associated benefits. Social media
platforms like Facebook and Twitter lay claim on almost 40% of the entire South Africa
population’s mobile data usage and thus demonstrate a high usage penetration (Chair, 2017).
The increased usage of mobile devices (smartphones) expands the reach of mobile technology
and thereby changes consumer behaviour as well as business strategies (Nyamba & Malongo,
2012; North et al., 2014). The high penetration level of mobile devices are above 150% and
subsequently present opportunities to consumers, businesses and service providers to scale
opportunities when using mobile technologies (ICASA, 2019). Given this high penetration and
scalability of mobile technology, shifting to mobile broadband networks continues to rapidly
increase across the world. Wide-scale broadband infrastructure increases network coverage and
connectivity speeds that support more cost-effective data prices as well as more affordable
smart mobile devices (Ardjouman, 2014).
According to ICASA (2019) the total number of mobile broadband connections, that is 3G and
4G connections accounted for about 99.5% of the total connections at year-end 2018. The total
number of smartphone subscriptions recorded as at the end of September 2018 amounted to
46.9 million subscribers in relation to the South African population which was estimated to be
at around 57.7 million as at July 2018 (ICASA, 2019, Stats SA, 2018). Mobile technology is,
therefore, an important consideration for business and presents the micro-enterprise sector with
opportunities for growth and development.
2.4.2. Role of mobile technology in Micro enterprise business
Since most South Africans use their mobile phones to connect to the internet, engage with one
18 | P a g e
another, and also use it as a source of information, organizations are therefore required to
rethink strategy if they want to remain competitive (Ahmedova, 2015; Ollo-Lopez et al., 2012;
Modimogale & Kroeze, 2009). The transformational use of mobile technology is
revolutionizing the way in which organizations promote their businesses; source new clients
and suppliers; improving the customer experience, and enabling various operational process
efficiencies ((Modimogale & Kroeze, 2011; Kohli & Devaraj, 2004).
Esselaar (2007, p.87), Jones (2011) and Okon (2015) state that mobile phones (being the most
popular form of ICT) enable small businesses like those in the micro-enterprise sector to
engage in various trade activities where there is a lack of infrastructure and needed ICT tools to
promote operational efficiencies. Harker and Van Akkeren (2002, p.199) describe mobile
technologies as mechanisms that connect wirelessly to other devices and networks through the
use of mobile data. For example, mobile technologies include laptops; net books; tablets;
personal digital assistants; mobile phones; smart phones and mobile applications (Harker et al.,
2002).
Jagun and Heeks (2007), Nxele (2009) and Boateng (2011) suggest that the use of mobile
technologies can potentially impact the micro enterprise sector in three broad segments, being
on an incremental, transformational and on a productivity level. The incremental use of mobile
technology refers mainly to the reduction of transactional costs as a result of searching and
coordinating the price value of goods or services; the procurement of buyers and suppliers of
goods and services; and also the increased levels of productivity by effectively using mobile
technology (Aker & Mbiti, 2010; Boateng, 2011). Boateng (2011) further argues that micro
entrepreneurs now have the ability to engage more frequently with clients by using mobile
applications. This will improve procurement capabilities, being able to source goods or services
from various suppliers and service providers and compare and select the most affordable prices,
irrespective of location (Boateng, 2011). Mobile technology, therefore, transforms the client-
supplier engagement through the use of emerging and low cost mobile applications like instant
messaging services, for example, WhatsApp and Facebook Messenger (Melchioly & Saebo,
19 | P a g e
2010). Mobile technologies also transforms the way in which micro entrepreneurs introduce
new products and services to new and existing markets, thus broadening their client prospects.
Through the use of mobile technologies, entrepreneurs are thereby enabled to differentiate
themselves from their immediate competitors through mobile advertising on social media
platforms like Facebook and online advertising platforms like Gumtree (Boateng, 2011;
Donovan, 2013). The realized potential of adopting and using mobile technologies for micro-
enterprise operations are therefore immense to the development of the micro enterprise sector,
and thus examining the factors influencing the adoption and use of mobile technologies are
important and relevant to the advancement of the sector.
For example, in a study by Kale (2015), it was observed that an entrepreneur who sells fruit to
clients in a local business district of Lagos, created a WhatsApp group, targeting clients whom
enjoyed eating fruit salad. The WhatsApp group allows clients to pre-order fruit salad that can
either be collected or delivered on a cash only transactional basis. Those clients whom opted to
have the fruit salad delivered gave rise to an opportunity to create additional employment in the
form of a delivery person, thus expanding the value chain. Kale (2015) argues that the use of
WhatsApp in this business reduced the operational costs as WhatsApp in this instance was used
as a marketing platform, a customer ordering platform and a client engagement platform. Kale
(2015) further states that the use of WhatsApp improved a hair stylist’s business, as the hair
stylist was able to send pictures of new hair styles and product offerings to client’s belonging to
a WhatsApp group. This use of WhatsApp displayed a strategic use of a mobile application,
whereby the entrepreneur was able to market, source new clients, improve customer
engagement and retain existing clients (Kale, 2015).
In a study by Owoseni and Twinomurinzi (2016), a small laundry business created a mobile
application that served as a job ordering and delivery platform, where clients can book a
laundry delivery or collection day. The clients were also allowed to make payments via the
mobile application based on the services selected. Owoseni and Twinomurinzi (2016) state
that the use of the mobile application streamlined the laundry business and resulted in an
increase in revenue and the number of employees within a 6 month period.
2.5. Technology Adoption
Studies concerning the adoption of Information Technology share common interests, which
involve the investigation of theories and models essential to predicting and explaining
20 | P a g e
behaviour towards the adoption and use of systems across several domains. These studies aim
to advance use behaviour, investigate prohibiting factors that influence the intention to adopt
and use information systems, as well as the factors that influence usage behaviour (Wu, 2006;
Chuttur, 2009; Kohnke et al., 2014).
The theoretical assumption of this study is that the micro-enterprise sector can grow; create
employment; reduce poverty; and transition to formal business operations, if the necessary
resources and the appropriate use of technology are adopted for operational effectiveness. This
assumption is reinforced by evidence in the extant literature that access to, and the appropriate
use of technology increases productivity and as a result increases the standard of living of those
operating in the micro-enterprise sector (Nyamba & Malongo, 2012; Jones, 2011; Pigato, 2011;
Okello-Obura et al., 2010; Torero et al., 2006; Harris 2004).
In light of the foregoing, the next section reviews prominent theories and models of technology
adoption. This review of literature will provide a basis for the development of a framework and
research model that will investigate the primary research question i.e. the factors influencing
the adoption and use of mobile applications for micro enterprise operations.
2.6. Theoretical Considerations
Given that the use of technology has been globally recognized as an enabler to organisational
growth and development, understanding user acceptance and behaviour to technology, is a key
factor of the implementation success of new technologies. One of the seminal studies that
explored the user acceptance of information systems was undertaken by Davis (Davis, 1985) at
MIT Sloan School of Management. Davis (1985) states that system-use can be explained
through user motivation. The motivation to make use of a system is, however, something that
can be influenced by external variables which include the features of the system as well as its
capabilities (Davis, 1985).
The Technology Acceptance Model (Davis, 1985; Davis et al., 1989) originated from the
Theory of Reasoned Action (Fishbein & Ajzen, 1975) which was a useful way to explain user
intent towards a system and the usage behaviour of such a system. The Technology Acceptance
Model is subsequently the primary model when investigating technology adoption concepts.
However, the theory was criticized for lacking guidelines for organisations when implementing

21 | P a g e
expensive information systems, which gave rise to the extended models such as TAM2 (Davis
1989) and TAM3 (Venkatesh & Bala, 2008).
Prior to the development of TAM3, Venkatesh et al. (2003) developed the UTAUT model,
which combined eight prominent models and theories, to explain behaviour intent and the use
behaviour relating to the adoption of mandatory information systems. The UTAUT model was
later extended to investigate the adoption of technology from a consumer perspective
(Venkatesh, Thong & Xu, 2012).
Even though many contemporary models were developed and tested, the above models remain
an important source when researching technology adoption and use of information systems. In
trying to find suitable model for this study, the following models were considered as they are
commonly recognized in technology adoption studies;
The theory of reasoned action (Azjen & Fishbein, 1980)
The theory of planned behaviour (Schifter & Ajzen, 1985)
Diffusion of innovations theory (Rogers, 2003)
Technology acceptance model (Davis, 1896; Davis, 1989; Venkatesh & Bala, 2008 )
A unified theory of acceptance and use of technology (Venkatesh, Morris & Davis,
2003; Venkatesh, Thong & Xu, 2012)
Even though more contemporary models do exist, it seems that they are rooted in one or some
of the models above (Yu et al., 2017). I considered the uniqueness of the micro-enterprise
sector, and the entrepreneurs that make up this sector in my selection of the most appropriate
model that will guide this undertaking.
Realizing that most technology adoption models are organisationally based, I was cognisant of
the fact that entrepreneurs within the micro-enterprise sector might not be concerned with
trading goods and services with the intent to grow sustainable businesses (discounting profit or
loss), but rather that they are motivated to engage in some sort of entrepreneurial activity as a
means to survive.
This consideration demanded a model that can be both applied to understanding the intention to
adopt mobile applications from an individual perspective, but also be able to apply or make
assumptions to a sector of micro-entrepreneurs.

22 | P a g e
2.6.1. Theory of Reasoned Action (TRA)
Azjen and Fishbein (1980) created the theory of reasoned action to understand human
behaviour (see figure 2.1. below). The theory suggests that human behaviour can be predicted
or influenced by (1) a person’s attitude towards a specific behaviour; (2) and the influence of
others on a specific behaviour – meaning if people important to an individual is of opinion that
he/she should act out certain behaviour (subjective norm), the resultant effect is that he/she
might act out the behaviour (Azjen & Fishbein 1980).
Figure 2.1.: The Theory of Reasoned Action (Ajzen & Fishbein 1980)
Azjen and Fishbein (1980) described the theory of reasoned action as an intention based model
that can be applied to predict and explain behaviour across various areas of study, especially
that of human behaviour. Han (2003) however states that Information Systems researchers have
applied the theory of reasoned of action to study IT-related innovations. Even though
contemporary models of technology acceptance sources a varied assortment of theoretical
viewpoints, considerable literature pertaining to technology acceptance studies begin with the
theory of reasoned action. Kim and Crowston (2011) states that attitude and subjective norm
are important factors of a user’s intention to adopt and use technology.
2.6.2. Theory of Planned Behaviour (TPB)
The subsequent modification to the theory of reasoned action stemmed from Azjen’s theory
that the perceived control an individual has over certain behaviour will determine the outcome
of that behaviour (Azjen, 1991). Similarly to the theory of reasoned action, the theory of

23 | P a g e
planned behaviour discovered important relationships connecting attitude, subjective norms and
perceived behavioural control when explaining the influence on behaviour intent and use
behaviour of technology (Chuttur, 2009). The addition of perceived behavioural control
exposed the importance of an individual’s perception or rather his or her perceived difficulty in
using technology as well as their perceived ability in using technology (see figure 2.2. below).
Figure 2.2.: The theory of planned behaviour (Azjen, 1985)
When looking at the theory of planned behaviour in the context of the micro-enterprise sector,
one could perceive that if the micro-entrepreneurs believe that using mobile applications for
micro-enterprise operation is easy or difficult, it would influence their behaviour or decision to
adopt and use mobile applications for business. Researchers like Wu and Chen (2005), Chau
and Hu (2001), Liao et al. (2007) and Hsu et al. (2006) confirmed that perceived behavioural
control has a direct influence on a user’s intention to adopt and use technology. Even so, the
dynamic nature of the micro-enterprise sector would require a deeper understanding as the
theory of planned behaviour was created to explain human behaviour in social psychology
context and not to explain user technology adoption (Mishra, 2014; Liao et al., 2007; Pavlou &
Ferguson, 2006; Hsu & Chi 2004).

24 | P a g e
2.6.3. Diffusion of Innovation (DOI)
The theory of diffusion and innovation emanated from the published work of Rogers in 1962,
which highlighted the importance of communication channels, the importance of social
influences and the importance of time to market when a new technology/innovation is
introduced or diffused. Rogers (1983, pp.213-232) argues that technology adoption or
acceptance is evidently influenced by;
1. whether an individual perceives that technology will improve earlier ideas/technology
(relative advantage);
2. whether the new technology is compatible to what the user might be accustomed too
(compatibility);
3. whether the new technology is easy to use (complexity);
4. whether the user is able to test the technology first, before actually deciding whether to
use it (trialability);
5. and whether there are any visible results that the new technology improved a task or
function (observability).
The main premise of the DOI is that social structures are important to diffusion of technology
(Rogers, 1995). According to Rogers (1995), all adopters of technology are within social
structures and therefore critical to the diffusion process of a new technology. Rogers (1995)
argues that these structures influence individual perceptions when it comes to decision making,
and as a result responsible for behaviour that is deemed acceptable within these structures. The
outcome is that collective or individual decisions are influenced by opinion leaders when
deciding to adopt or reject a technology (Rogers, 1995; Manueli et al., 2007).
This being said, the micro-enterprise sector, although a collective, entrepreneurs operate in silo
and thus a concept of adopting mobile applications to promote their business activities would
however require a diffusion of commonality amongst the micro-entrepreneurs. The micro-
entrepreneurs might or might not buy into the idea that mobile applications will improve their
micro-enterprise operations, as literature indicate that they regard survival above implementing
or strategically using mobile technology as a tool, hence the noted reluctance to adopt and use
technology for business (Silva, 2011; Michailidis, 2012 ).

25 | P a g e
Lean et al. (2009), Carter and Weerakkody (2008), Manueli et al. (2007), and Beatty et al.
(2001) argues that the DOI theory is useful for the conceptualization of technology adoption
with other models like the technology adoption model that consider the determinants of user
technology adoption.
2.6.4. Technology Acceptance Models (TAM / TAM2 / TAM3)
The TAM (introduced by Davis, 1986) has been recognized as one of the most prominent
models to explain user adoption and acceptance of technology (Lee, Kozar & Larsen, 2003;
Bagozzi, 2007; Koh et al., 2010; Surendran, 2012).
The main premise of TAM is that perceived usefulness and perceived ease of use will influence
the intention to use or reject a new technology (Davis 1989). Perceived usefulness measures
whether the use of a technology will improve a user task or functionality, and the Perceived
ease of use will measure the user experience – how easy or difficult it is to use a technology
(Davis 1989) – see figure 2.3.
Figure 2.3.: Technology Acceptance Model (Davis, 1989)
Davis, Bagozzi and Warshaw (1989), Bagozzi et al. (1992) and Davis (1996) state that TAM
can be viewed as being too random in predicting user intention, as there might be other
constraints that would prohibit a user from using a system/technology. Other researchers like
Hers, McNab and Basoglu (2014), Chuffer (2008), Silva (2007) and Straub and Burley Jones
(2007) argue that TAM lacked a contemporary application to the adoption of technology,
because TAM has a specific design application. This means that the acceptance or rejection of
technology, are more organisationally focused, in oppose to considering acceptance or rejection
of technology from an end-user perspective (Hers et al., 2014; Chuffer, 2008; Silva, 2007;
Straub et al., 2007).

26 | P a g e
TAM lacked the consideration of social influences or pressures when it comes to technology
adoption (especially where there are social implications to the use of technology) and noted as
of great concern amongst researchers like Tarute and Gatautis (2014), Chuttur (2009), and
Bagozzi (2007).
As a result of the observed limitations in the original TAM, Venkatesh and Davis (2000)
extended the model to – TAM2 (see figure 2.4. below). TAM2 incorporated research done by
Venkatesh and Davis (1996) which focused on the determinants of perceived usefulness, which
in the proposal have been overlooked, and enable organisations to create relevant interventions
that would support user acceptance and the use of a new system.
Venkatesh et al. (2000) further argue that the effects of a change in the determinants of
perceived usefulness and use intent need to be considered over time as the user gains more
experience using the new system. TAM2 categorised the determinants of influence according to
social influences and cognitive influences, to better explain and understand the acceptance and
use intention of a newly installed system. Social influences included constructs such as
subjective norm; voluntariness and image, whereas cognitive influences include job relevance;
output quality; result demonstrability and perceived ease of use.
Figure 2.4.: Technology Acceptance Model 2 (Venkatesh & Davis, 2000)
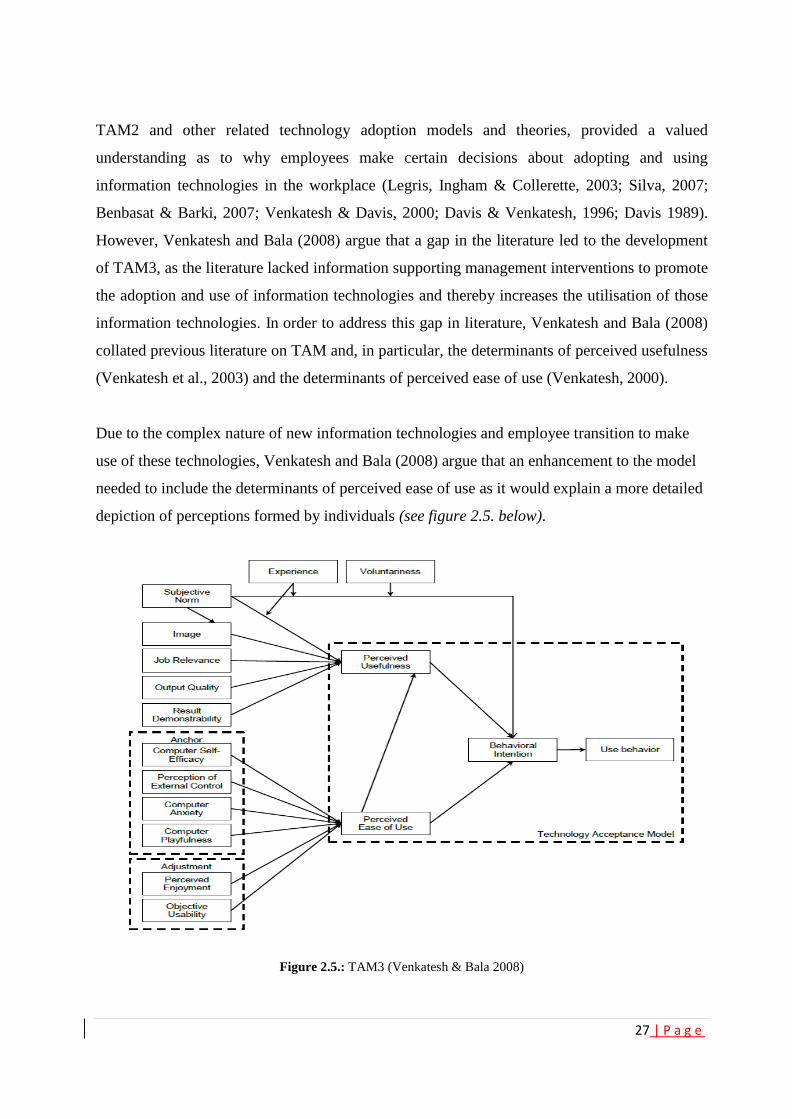
27 | P a g e
TAM2 and other related technology adoption models and theories, provided a valued
understanding as to why employees make certain decisions about adopting and using
information technologies in the workplace (Legris, Ingham & Collerette, 2003; Silva, 2007;
Benbasat & Barki, 2007; Venkatesh & Davis, 2000; Davis & Venkatesh, 1996; Davis 1989).
However, Venkatesh and Bala (2008) argue that a gap in the literature led to the development
of TAM3, as the literature lacked information supporting management interventions to promote
the adoption and use of information technologies and thereby increases the utilisation of those
information technologies. In order to address this gap in literature, Venkatesh and Bala (2008)
collated previous literature on TAM and, in particular, the determinants of perceived usefulness
(Venkatesh et al., 2003) and the determinants of perceived ease of use (Venkatesh, 2000).
Due to the complex nature of new information technologies and employee transition to make
use of these technologies, Venkatesh and Bala (2008) argue that an enhancement to the model
needed to include the determinants of perceived ease of use as it would explain a more detailed
depiction of perceptions formed by individuals (see figure 2.5. below).
Figure 2.5.: TAM3 (Venkatesh & Bala 2008)

28 | P a g e
Venkatesh and Bala (2008) argue that TAM 3 was in no means a replacement to its
predecessors (TAM and TAM2), but to support organisations with advancing employee
adoption of expensive technologies by providing a practical model that can be implemented
through various stages of the implementation of such technologies.
Given the research objectives of this study, the use of TAM as a research model would
however present some limitations, as the main idea of TAM was to solve technology adoption
related issues from an organisational perspective and therefore might be misaligned to the
characteristics dominant in micro-enterprise businesses. The solo-entrepreneurial attributes that
emanate from the micro-enterprise sector requires a model can be applied to both voluntary and
mandatory use of mobile applications for business. However, TAM has been used and applied
to investigate the adoption of modern day technologies like mobile payment services (Chandru,
Srivastava & Theng, 2010); messaging services (Lu, Deny & Wang, 2010); online ticket
purchasing (Mallat, Rossi, Tuunainen & Oorni, 2009); mobile or online shopping (Lu & Su,
2009) and, consumer use of mobile internet services (Shin, Lee, Shin & Lee, 2010).
2.6.5. A Unified view of Acceptance and Use of Technology (UTAUT and UTAUT2)
Venkatesh et al. (2003) developed the UTAUT model by integrating eight different models and
theories. Venkatesh et al. (2003) observed that researchers in IT related studies were challenged
with a selection of models and theories and often selected a preferred model and overlooked the
contribution made by the others. As a result Venkatesh et al. (2003) believed that by combining
the most dominant theories and models (at that time); it would present a more unified approach
to studies concerning technology acceptance. These models and theories included the
technology acceptance model (Davis, 1989), innovation diffusion theory (Rogers 1995), theory
of reasoned action (Fishbein & Ajzen, 1975), theory of planned behaviour (Azjen 1991), the
motivational model (Davis, Bagozzi & Warshaw, 1992), the model of PC utilisation
(Thompson, Higgins & Howell, 1991) and the social cognitive theory (Bandura, 1986).
Through experimentation, Venkatesh et al. (2003) provided evidence that user intention and
usage behaviour can be predicted through four key constructs (drivers). They hypothesized that
these four drivers significantly influenced the user intention to use, and the use behaviour of a
new technology, which are; performance expectancy, effort expectancy, social influence and

29 | P a g e
facilitating conditions (Venkatesh et al., 2003). Venkatesh et al. (2003) argues that if you
characterise user adoption according to the mentioned drivers of behavioural intention and use
behaviour, you are more likely to exercise control over the implementation and acceptance of a
new technology. Venkatesh et al. (2003) further argues that if you moderate the four key
drivers according to age, gender, experience and voluntariness, researchers will be able to
gauge the strength of the relationship between the key drivers and the aforementioned
moderators, thus better explain the intention to use, and the subsequent use behaviour of new
technology. According to the UTAUT model, researchers would be able to measure the degree
to which an individual is influenced to adopt and make use of a technology. Figure 2.6.,
illustrates the UTAUT model as developed by Venkatesh et al. (2003).
Figure 2.6.: The UTAUT Model (Venkatesh et al. 2003)
The UTAUT model was further extended to UTAUT2 by Venkatesh, Thong and Xu (2012).
Venkatesh, Thong and Xu (2012) observed that technology adoption models predominantly
focused on user adoption of mandatory information systems from an organisation perspective
and lacked explaining consumer technology adoption. This gap in the literature lead to the
development of the UTAUT2 model and expresses that understanding the consumer behaviour
is essential when organisations design commercially expensive technologies (Venkatesh et al.
2012).
Arguably, micro-entrepreneurs (also the subject matter) share similar characteristics to that of
the consumers of commercial technologies, and that the UTAUT2 model might be a more
suited model to investigate factors influencing adoption of mobile technologies. However the

30 | P a g e
literature depicts an under-utilization of mobile technologies in the micro-enterprise sector,
such that the study aligns more to the UTAUT model, as the use or rather adoption of mobile
technologies in this sector should support more business outcomes, rather than commercial or
social gratification. Furthermore, the UTAUT model has been validated more across various
domains, then the UTAUT2 model, of which the application and also the justification of this
study’s model will be expounded on in the next section.
2.7. Selection of a research model
Considering the most prominent models used in technology adoption studies, the selection of
an appropriate model for this study, requires a model that facilitate the achievement of the
objectives of this study. As previously discussed, the use of technology is recognised as being
advantageous to organisations as it leads to better business practices, improved operation
efficiencies and cost savings benefits (Wiegel et al., 2014; Azjen, 2011; Chen et al., 2011;
Coombs, 2009; Premkumar et al., 2009). With this in mind, understanding user intention and
behaviour is therefore critical to ensuring high adoption rates and the continued use of
information systems.
Having introspected the objectives of this study, I needed to consider a technology adoption
model that can be applied to a sector in which businesses lack formality and have scant regard
to the strategic application of technology to grow and develop their businesses. The literature
does highlight that entrepreneurs in the micro-enterprise sector do react to the influence of
close friends and family (social influences), when it comes to technology related decisions,
even if they lack the necessary ICT skills and knowledge (Cragg et al., 2006; Eikebrokk &
Olsen, 2007). Table 2.2., illustrates the key elements of the technology adoption models that
were considered for this study, as well as an assessment of the relevance of each to this study.
Table 2.2.: Summary of Tech Adoption Theories
Theory Key Constructs Relevance to this study research
context
Theory of
Reasoned Action
Attitude towards behaviour,
Subjective Norm
LOW: Social psychology theory used
in technology adoption studies,
however limited in explaining the
effects on the adoption or rejection of technology.
Theory of
Planned
Behaviour
Attitude towards behaviour,
Subjective Norm,
Perceived Behavioral Control
LOW: Social psychology theory
created to address a short coming in
the aforementioned theory (Perceived Behavioural Control). Similarly,

31 | P a g e
limited in explaining the effects on the adoption or rejection of technology.
Diffusion of
Innovation
Theory
Relative advantage,
Compatibility,
Complexity,
Trialability,
Observability
MEDIUM: Aims to better explain the
decision process when it comes to
innovation and the rate at which
innovation will be adopted according
adopter characteristics. However, the
theory lacks in explaining how
behaviour can be developed when
deciding whether to adopt or reject
innovation/technology.
Technology
Acceptance
Models
Perceived Usefulness,
Perceived Ease of Use
MEDIUM: Explains usefulness and
the ease of use of a technology, but
lacked explaining how to improve technology adoption.
Unified Theory
of Use of
Technology
(UTAUT)
Performance Expectancy,
Effort Expectancy,
Social Influence;
Facilitating Conditions
HIGH: Essential to explaining
usefulness and ease of use of
technology and also how to advance
technology adoption in an organization
setting. Empirical evidence that
validity of the model was superior to
other technology adoption models and
prominent application to mobile
technology related studies.
UTAUT2 Performance Expectancy,
Effort Expectancy,
Social Influence,
Facilitating Conditions,
Hedonic Motivation,
Price Value, Habit
MEDIUM: Essential to explaining
usefulness and ease of use of
technology and also how to advance
technology adoption, however the
model focus is that of consumer
technology adoption.
2.7.1. Summary of technology adoption models
In considering the relevance of the theory of reasoned action as well as the theory of planned
behaviour, the literature indicated limitations which supported the assessments of relevance to
this study (see Table 2.2).
The theory of reasoned action assumes that behaviour conforms to controlled decisions and that
irrational decision making and routine actions cannot be explained using the theory (Azjen,
1985; Sheppard et al., 1988).
The theory of planned behaviour introduced perceived behavioural control to address
uncontrolled behaviour lacking in the theory of reasoned action. The theory of planned
behaviour was criticized for not being able to explain factors that might predict or influence
behaviour and as a result open to bias (Taylor & Todd, 1995; Eagle & Chaiken, 1993).
32 | P a g e
The Diffusion of Innovation theory, although valuable to the implementation of a new
innovation/technology, lacks evidence of how adopters of an innovation or technology can be
influenced to effectively advance adoption rates (Chen et al., 2002; Karahanna et al., 1999).
The Diffusion of Innovation theory has however been used in conjunction with the technology
acceptance model to conceptualize technology adoption (Lean et al., 2009; Carter &
Weerakkody, 2008; Manueli et al., 2007).
The Technology Acceptance Model is commonly criticized in the literature as being reliant on
the users self-report of use behaviour and therefore lacking a consistent measurement of the
actual usage of a technology (Legris et al., 2003; Venkatesh et al., 2003; Taylor & Todd, 1995).
Venkatesh et al. (2003) argues that the technology acceptance model provides little direction on
how to influence the use behaviour of technology during the design and implementation of a
technology. The initial studies relating to technology acceptance were mostly conducted
amongst students and then generalized to that of a workplace environment (Venkatesh et al.,
2003; Sun & Zang, 2003; Lee et al., 2003). However, TAM2 and TAM3 were specifically
developed to address these shortcomings, but are of medium relevance to this study. The micro
enterprise sector is characterized as demonstrating low levels of technology use for operational
effectiveness, and lacking a strategic view to implementing technology to fit organisational and
user needs (Kotelnikov, 2007; Chibelushi, 2008).
Drawing from the arguments presented in the literature, the UTAUT model presents the best fit
model for this study, as it is more contextually relevant. The UTAUT model presents a more
focused scope to investigate the adoption of mobile applications for micro-enterprise operations
through empirical data collection and analysis from a delineated group of micro- entrepreneurs.
2.7.2. Rationale for selecting UTAUT model
In considering the UTAUT model, the literature depicted a broad application of the UTAUT
model in various studies that affirmed its suitability and fulfilling the objectives of this study.
This section reviews various studies that have employed the UTAUT model and thereby
illustrating the relevance to this study.
Carlson et al. (2006) employed the UTAUT model to explain mass user adoption of mobile
devices and applications, specifically to explain behaviour intent and use behaviour on the
adoption of mobile devices and applications. The outcome of the study shows performance and
effort expectancy and social influence as a significant determinant of behavioural intent.

33 | P a g e
However, facilitating conditions had little influence on the use and intention to use mobile
devices and applications.
Knutsen (2005) utilised the UTAUT model to investigate the relationship among the
performance of new mobile services and user expectation relating to the use of new mobile
services. The study revealed that increased age resulted in lower degrees of expected ease of
using new mobile services, and contrary to increased age having a significant influence toward
the performance expectancy of the use of new mobile services.
Wang and Yang (2005) in their study about online trading extended the UTAUT model by
including personality traits as a construct to the UTAUT model to explore the role of
personality traits as an indirect or intervening construct to the UTAUT model. Their study
hypothesised personality traits as a direct influencer of intention to adopt online trading, and
also as a moderator to the four key constructs of the UTAUT model. For the purpose of their
study, the moderators of the UTAUT model were excluded, except for experience.
Anderson et al. (2006) employed the UTAUT model to understand and explore the key drivers
that influence user acceptance of tablet PCs amongst the business faculty staff at a higher
education institution. Their study revealed and validated the key constructs of the UTAUT
model, asserting performance expectancy as the key driver of tablet PC adoption.
Li and Kishore (2006) utilized the UTAUT model in their study of the acceptance of a
community web log system and observed that performance expectancy and effort expectancy
are similar amongst different groups of individuals within the community. Also social
influences were observed as being dissimilar amongst groups within the community, despite
showing a low or high usage of the web log system amongst the groups.
Marchewka, Liu and Kostiwa (2007) utilized the UTAUT model to explore and explain the
perception amongst student utilizing course management software. Their study revealed that
even though the student stated that they favour the concept of course management software,
their use behaviour demonstrated an underutilization. Further they questioned the reliability of
the items representing the UTAUT model and the relationship between the independent and
dependent variable (behaviour intention) as a result of student being reluctant to use the course
management software.

34 | P a g e
Im, Hong and Kang (2011) investigated if the relationships of the key constructs of the
UTAUT model are in anyway affected by culture. Using data collected from Korea and the
United States of America, they found that the UTAUT model presented them with the best fit
model to compare and examine the use of two technologies (internet banking and mp3 player)
amongst the different cultures.
Cohen, Bancilhon and Jones (2013) employed the UTAUT model and extant literature in
respect of user trust in the use of technology to develop a model that contextualized the
determining factors of the acceptance of e-prescribing technology amongst South African
physicians. Their findings revealed that performance expectancy and facilitating conditions
directly influence the acceptance of e-prescribing technology, whereas effort expectancy
revealed important indirect factors of acceptance.
Attuquayefio and Addo (2014) investigated the degree to which intention to adopt and use
technology for research and learning amongst Ghanaian students and observed that effort
expectancy significantly influenced the behavioural intention to use technology for research
and learning. The literature also indicates that many other researchers have used the UTAUT
model on the premise, that technology should first be used and understood before technology
can be considered as having achieved the desired outcome ( Sia, Lee, Teo, & Wei, 2001; Sia,
Teo, Tan, & Wei, 2004; Sarker, Valacich, & Sarker, 2005; Sarker & Valacich, 2010). For
example, investigating the key drivers that influence internet banking (AbuShanab & Pearson
2007), factors that influence 3G technology acceptance (Chian-Son, 2012), to explain
technology adoption in relation to user perceptions (Martins, Khan & Ale, 2013) and,
educational webcast adoption (Giannakos & Panayiotis, 2011; Maldonado, Khan, Moon &
Rho, 2011).
Given the aforementioned studies, the UTAUT model is seen to be model that has been
validated and applied across various technology related domains to investigate the adoption and
use of technology.
35 | P a g e
2.8. Chapter Summary
This chapter firstly provided an overview of the SMME sector with a particular focus on micro-
enterprises. This was followed by the role that government plays in the development of the
micro-enterprise sector as well as ICT development in South Africa. Given the pervasiveness
of technology, the role of mobile technology in micro-enterprises was reviewed, as mobile
technology is recognized as the most common form of ICT amongst micro- entrepreneurs.
Furthermore, extant literature relating to the most prominent models of technology adoption
were considered, for example, the theory of reasoned action, the theory of planned behaviour,
the technology acceptance models, the theory of innovation diffusion as well as the unified
theory of acceptance and use of technology. In spite of the assortment of available models and
theories, the best possible model for this study was selected, considering the least amount of
limitations, in order to achieve the study objective. Recognizing the observed limitations and
relevance that the theories and models of technology adoption presented, the UTAUT model
was selected to investigate the factors influencing the adoption of mobile business applications
for micro-enterprise operations.
36 | P a g e
Chapter 3: Applying the UTAUT model
3.1. Introduction
Given the models and the theories of technology adoption, the UTAUT model was selected as
the theoretical driver and best fit model for this study. A number of previous studies were
reviewed and affirmed the selection of the UTAUT model, as it suited the investigation of
various studies concerning mobile technology adoption across a number of domains. This study
will follow the original model, the measurements as well as the analyses applied by Venkatesh
et al. (2003), which will be discussed in the subsequent sections.
3.2. Applying the UTAUT model
Given the relevance of the UTAUT model to studies concerning the adoption of mobile
technologies, the UTAUT model is therefore recognised as a suitable lens for the empirical
investigation of the factors influencing the adoption of mobile applications for micro-enterprise
operations. The literature also indicates that the UTAUT model has been extended in various
studies to fit the objectives of that given study. This, however is an important consideration
seeing the objectives of this study need to fulfil two research questions.
Given the two research questions, the research model will consist of two segments;
(1) to investigate the factors influencing the adoption of mobile applications for micro-
enterprise operations and
(2) to explore the influence of experience and satisfaction in using the mentoring
application on intention to use mobile application for business amongst the micro-
entrepreneurs.
The latter part of the research model is to determine whether the use of the mentorship-
movement application, influences the micro-entrepreneurs’ intention to use other mobile
applications for business. This study assumes that the experienced gained as well as the level of
satisfaction in using the National Mentorship Movement application will influence the micro-
entrepreneurs’ intention to use other mobile applications for business. Al-Shafi and
Weerakkody (2010) and De Silva, Ratnadiwakara and Zainudeen (2013), state that the
continued use of technology over time influences the users’ belief and confidence in their
ability to use technology for task oriented deliverables. With this in mind, the experience

37 | P a g e
gained in using the mentorship-movement application over time will influence the micro-
entrepreneur’s intention to use other mobile applications for micro-enterprise operations.
In addition, the satisfaction gained using technology is also noted as a key factor influencing
continued use of technology. Cho et al. (2013), Alfawareh and Jusoh (2014), and Islam (2017)
argue that the level of satisfaction in using a technology becomes the point at which the
continued use of that technology (or other technologies) will be measured against. This study
therefore considers and investigates the degree to which the micro-entrepreneurs are perceived
to be satisfied in using the mentorship-movement application. The perceived level of
satisfaction is therefore considered, as a factor influencing the micro-entrepreneurs’ intention to
make use of other mobile applications for business based on their perceived level of
satisfaction in using the mentorship-movement application.
Section 3.3., expounds on the key determinants of behavioural intention and use behaviour as
prescribed in the UTAUT model, whilst section 3.4., expounds on experience and satisfaction
as proposed determinants of behavioural intention.
3.3. Factors that influence adoption (Determinants of UTAUT)
This section will outline the determinants of behavioural intention and use behaviour as per the
UTAUT model in order to investigate the factors influencing the intention to adopt mobile
applications for micro-enterprise operations, and the subsequent use of the mobile applications
for business.
This section describes the development of the first part of the research model in order to order
to address the following research question:
What are the factors that influence the adoption of mobile applications for micro-enterprise
operations?
3.3.1. Performance Expectancy
Venkatesh et al. (2003, p.447) defines performance expectancy as “the degree to which the user
expects that using a system will help or her attain gains in job performance”.
Venkatesh et al. (2003) combined perceived usefulness, extrinsic motivation, job-fit, relative
advantage, and an outcome expectation which measures similar constructs to form performance
expectancy. Perceived usefulness originated from the technology adoption model (Davis,

38 | P a g e
1989), which was later adapted by Taylor and Todd (1995) in their combined theory of planned
behaviour and technology adoption model. Perceived usefulness, shares a similar definition to
that of performance expectancy, where the use of a system is influenced by an individual’s
perception that his or her job performance will improve using the system (Davis 1989, Taylor
and Todd, 1995). Extrinsic motivation according to Davis et al. (1992) is when an individual is
encourage to perform an activity through either rewards or penalties. Job-fit refers to an
individual’s belief that if he or she accepts a technology, that it will lead to greater gains in his
or her job performance (Thompson et al., 1991). Relative advantage stems from Rogers
diffusion and innovation theory (1995) which states that if an individual is of perception that a
new technology is more advantageous that its predecessor, he or she might be more inclined to
adopt such a technology. Lastly, outcome expectations a concept from Bandura’s social
cognitive theory (1986) states the use of technology is influenced by an individual
expectations, being performance related (improve job performance) and personal related (the
individuals confidence in using a new technology or the sense of accomplishment using a new
technology).
The relationship between performance expectancy and behaviour intention has demonstrated a
dissimilar set of results where some researchers have found performance expectancy to
significantly influence the intention to adopt and use technology (Van der Vaart, Atema, &
Evers, 2016; Arman & Hartati, 2015; BenMessaoud, Kharrazi, & MacDorman, 2011,
Phichitchaisopa & Naenna, 2013), while others have found performance expectancy a lesser
significant determinant of intention (Vanneste, Vermeulen, & Declercq, 2013; Schaper &
Pervan, 2007). Devolder et al. (2012) argue that the constructs of the UTAUT model produces
different weightings and influenced by the sample under study, which consequently limits any
generalization to the greater population.
In the context of this study, performance expectancy will influence the likelihood of the micro-
entrepreneurs to adopt mobile technologies, if they are of belief that the use of mobile
applications would improve their operational capabilities.
3.3.2. Effort Expectancy
Venkatesh et al. (2003, p.450) defines effort expectancy as “the degree of ease associated with
the use of the system”.

39 | P a g e
Venkatesh et al. (2003) combined effort expectancy, perceived ease of use, simplicity and ease
of use to form effort expectancy. Perceived ease of use originated from the technology adoption
model, which refers to an individual’s perception of how easy or difficult it is to use a
technology (Davis, 1989). Complexity however measures the degree of difficulty an individual
perceives the use of a technology will be (Model of Personal Computer Utilization - Thompson
et al., 1991). Lastly, simplicity and ease of use is a key concept from Rogers’ Innovation and
Diffusion theory, similarly to the concept of complexity (Model of Personal Computer
Utilization), it measures the degree of difficulty an individual perceives an innovation to be
(Rogers, 1995).
Subsequent research reveals that many studies have positively hypothesized that effort
expectancy significantly influences the behavioural intention to adopt and use technology
(Arman & Hartati, 2015; Chang, Hwang, Hung, & Li, 2007; Phichitchaisopa & Naenna, 2013).
Chang et al. (2007) and Phichitchaisopa & Naenna (2013) found that effort expectancy has a
significant influence on behaviour intention, while Arman and Hartati (2015) and Bennani and
Oumlil (2013) found effort expectancy to have a lesser influence on behavioural intention.
Arman and Hartati (2015) argue that their sample population had lots of previous experience in
using technology and could possibly be the reason as to why effort expectancy had a lesser
significant influence on behaviour intention.
In the context of this study, the micro-entrepreneurs need to perceive the use of mobile
applications as easy and without any difficulty. Given the effort perceived, the use of such
mobile business might be rejected if the micro entrepreneurs are of perception that the use of
mobile applications are complexed and difficult to use.
3.3.3. Social Influence
Venkatesh et al. (2003, p.451) defines social influence as “the degree to which an individual
perceives that important others believe he or she should use the new system”.
Venkatesh et al. (2003) combined subjective norm, social factors and image to form social
influence. All three constructs expressed the influence of social structures on individual
behavioural intention and the subsequent behaviour in the same way (Venkatesh et al. 2003).
Subjective norm originated from Azjen and Fishbein theory of reasoned action (1977) and
consequently used in Azjen’s theory of planned behaviour (1985), the combined theory of

40 | P a g e
technology acceptance model and theory of planned behaviour of Todd and Taylor (1995).
Venkatesh and Davis (2000) extended the technology acceptance model to form TAM2 as the
concept of social influences (the influence of others who are important to the individual to act
out behaviour) were lacking from the original technology acceptance model. Social factors
originated from Thompson et al. (1991) Model of PC Utilization where an individual accepts a
culture or norm (common to others) when it comes to the use of technology. Image originated
from Rogers theory of Innovation and Diffusion (1995) where an individual is of perception
that the use of a technology or innovation will promote his or her image or social standing.
Studies frequently hypothesized the positive effect of social influence on behavioural intention
to use a technology (Arman & Hartati, 2015; Chang et al., 2007; Phichitchaisopa & Naenna,
2013). Alaiad and Zhou (2014) observed in their study, that social influence was a significant
determinant of behaviour intention, which was contradictory to Chang et al. (2007) whom
observed a marginal influence on behaviour intention. Bennani and Oumlil (2013) and
Phichitchaisopa and Naenna (2013) rejected social influence as a positive predictor of intention
to use technology, as their hypothesis reveal an insignificant effect on intention and argued that
the outcome could have been possibly influenced by the timing of their study. Bennani and
Oumlil (2013) and Phichitchaisopa and Naenna (2013) further argues that the concept of social
influence need to be considered before using it in a study, as individuals who displays high
levels of self-confidence are less than likely to be influenced by social pressures, hence the
consideration when sampling a population.
Social influence, in the context of this study, will therefore investigate the extent to which the
micro entrepreneurs’ decision to adopt and use mobile applications will be influenced by
individuals whom they believe are important to them.
3.3.4. Facilitating conditions
Venkatesh et al. (2003, p.453) defines facilitating conditions as “the degree to which an
individual believes that an organisational and technical infrastructure exist to support the use
of the system”.
Venkatesh et al. (2003) combined perceived behavioural control, facilitating conditions and
compatibility to form facilitating conditions. Perceived behavioural control originates from the
theory of planned behaviour (Azjen, 1995) which refers to an individual’s perceived difficulty
41 | P a g e
in using technology as well as their perceived ability in using technology. Facilitating
conditions originates from the model of personal computer utilization (Thompson et al., 1991)
which refers to availability of support structures that facilitate users in using PCs and thereby
influence their system utilization. Compatibility originates from the innovation and diffusion
theory (Rogers, 1983) which refers to an individual’s perception that the use of a new
technology would be compatible to what he or she is accustomed too.
According to Venkatesh et al. (2003) it is expected from organisations to provide technical
support to assist users in overcoming any difficulty in using a technology and through the
availability of a support structure, it would in turn increase utilization and perceived
satisfaction in using a technology. Many researchers have found that the availability of
facilitating conditions increased the adoption rate of a technology (Shea et al., 2005; Jong &
Wang, 2009; Al-Qeisi, 2009; Lakhal et al., 2013; Kohnke, Cole, & Bush, 2014). However, Al-
Qeisi (2009) and Kohnke, Cole and Bush (2014) argue that facilitating conditions seems to be
lesser significant when strong variable relationships exist between performance expectancy and
effort expectancy in relation to behaviour intention. Moreover, other researchers noted that the
influence of facilitating conditions in relation to use behaviour, reduces as the users gain more
experience in using a system, as they seem to develop other forms of support structures (Islam,
2017; Alfawareh & Jusoh, 2014; Venkatesh, Thong, & Xu, 2012; Aker & Mbiti, 2010).
According to Hew et al. (2015) and Margath and McCormick (2013) facilitating conditions
relating to mobile applications relate to the availability of online support and help features, the
device the individual uses to host the mobile applications, access to internet facilities (both data
driven or Wi-Fi) and also the cost of the mobile application itself. In the context of this study,
the micro-entrepreneurs would consider the availability of the aforementioned attributes of
facilitating condition, when deciding to adopt and use mobile applications for their micro-
operations.
3.3.5. Behavioural Intention and use behaviour
According to Venkatesh et al. (2003) behavioural intention refers to the degree to which an
individual is inclined to make use of technology and that use behaviour represents the value
that the individual will attach to the use of a technology and the subsequent re-use of that
technology. Behavioural intention is a direct determinant of use behaviour and in the context of

42 | P a g e
this study, behavioural intention will influence the likelihood that the micro-entrepreneurs will
use (and re-use) mobile applications for their micro-enterprise operations.
According to Zhou (2011) and Arman and Hartati (2015) use behaviour is essentially
influenced by behaviour intention. Given that the intention to use a technology can change over
time, the actual use of a technology will therefore be depended on how strong an individual’s
intention is to make use of a technology, suggesting that if intention reduces the actual use of a
technology will also reduce and vice versa (Zhou, 2011; Arman & Hartati, 2015). In the
context of this study, the continued use as well as the frequency the micro-entrepreneurs uses
mobile applications will be influenced by their intention to make use of mobile applications to
improve their operational activities as well as having access to the necessary facilitating
conditions.
3.4. Experience and Satisfaction (Determinants of Intention)
The previous section outlined the determinants of behavioural intention and use behaviour as
per the UTAUT model. These determinants will be used to investigate the factors that influence
the intention to adopt mobile applications for micro-enterprise operations, and the subsequent
use of those mobile applications.
This section describes the development of the second part of the research model in order to
order to address the following research question:
Does the use of mobile mentoring applications influence the adoption of mobile applications
for micro-enterprise operations?
Taking into account the objectives of this study, the experience and the perceived level of
satisfaction achieved in using the mentoring application are proposed as determinants of
intention to use mobile business applications. In this study, the micro-entrepreneurs use a
common mobile application of the National Mentorship Movement. The premise of the
mentorship-movement application is to develop an entrepreneurial skill-set amongst micro-
entrepreneurs. The mentorship-movement application provides entrepreneurs with content rich
video tutorials and literature on entrepreneurship. The application is aimed at being a fun and
interactive platform for peer group interactions, where entrepreneurs are paired with a mentor
to fast track the development of their entrepreneurial skill-set and business alike.

43 | P a g e
The underlying assumption of the proposed model is that in using the mentorship-movement
application, the micro-entrepreneurs will develop the experience and confidence to use other
mobile applications for their business activities and development. Also, if the micro-
entrepreneurs are satisfied or perceive some level of satisfaction in using the mentorship-
movement application, they might be inclined to use other mobile applications more
confidently in their businesses. The study therefore proposes experience and satisfaction as
direct determinants of behavioural intention, in addition to the first part of the research
proposal.
3.4.1. Experience with mobile mentoring application use
Experience was originally described as a predictor of user perception of the effort required to
make use of a technology. Venkatesh et al. (2003) describes experience as the degree to which
an individual is influenced or socially pressured to make use of a technology, meaning that if
the user lacks experience that he or she is likely to be influenced by social pressures. Venkatesh
et al. (2003) further argues that the more experience is gained in using technology, the more
insignificant support structures becomes and the influence of social pressures on the intention
to use technology and the subsequent use behaviour.
In the context of this study, the micro-entrepreneurs using the mentorship-movement
application are more likely to continue using mobile applications for business, albeit in another
form. According to Taylor et al. (1995), Xia and Lee (2000), Venkatesh et al. (2003), Seymour,
Makanya and Berrange (2007), Al-Shafi and Weerakkody (2010) and De Silva, Ratnadiwakara
and Zainudeen (2013), the increased use of technology over time has proven to influence the
end- users belief and confidence in their ability to recognise and use technology in improving
task oriented deliverables. This study therefore will test whether the direct-use of the
mentorship- movement application will increase the intention to use other mobile applications
for business amongst the micro-entrepreneurs.
3.4.2. Satisfaction with mobile mentoring application use
The perceived level of satisfaction associated with the use of mobile technologies has been
described as the degree to which the users of mobile technologies are satisfied or dissatisfied
(Dey & Hakkila, 2008; Cho, Chiu, Ho & Lee, 2013). Moliner, Sanchez, Rodriquez and
Callarisa (2007) describe satisfaction as a feeling of contentment, as a result of a product or
service meeting the user’s expectation. Moliner et al. (2007) further state that satisfaction can
44 | P a g e
be both cognitive in nature, as well as emotional in nature; to the degree it pleases or displeases
a person. According to the Expectancy-Disconfirmation theory (Oliver, 1977) the level of
satisfaction that is associated with a product becomes the position to which the outcome of a
use of a product will be measured against. Oliver (1977) argues that if a consumer of a product
is satisfied with the outcome, confirmation happens and satisfaction is then achieved, however,
any outcome that is unsatisfactory will result in disconfirmation. According to Ives et al. (1983)
user (or end-user) satisfaction is the degree to which the user believes that the technology meets
their requirement, as a source of information and how easy they perceive the technology to be.
Cho et al. (2013) states that in the case of mobile applications, user satisfaction can be
characterized by the usefulness, enjoyment, and internet speed, thus anything that the users
associate with the use of a mobile application. Cho et al. (2013), Alfawareh and Jusoh (2014),
and Islam (2017) argue that the degree in which satisfaction was attained will precede the
behaviour of a user’s intention to reuse such an application. Calvo-Porral and Levy-Mangin
(2015) in their study of mobile application satisfaction, they observed that customer satisfaction
increases when the characteristics and functionalities of the mobile application meet the
customer or user expectation. Dovaliene et al. (2015) argue that the service or product received
essentially determines the level of satisfaction in using mobile applications. Hsiao, Chang and
Tang (2016) however argue that satisfaction is a post-purchase experience and that the users
only attach some level of satisfaction once they have had some experience in using the mobile
application.
In the context of this study, the level of satisfaction the micro- entrepreneurs attach to the use
of the mentorship-movement application is assumed to influence their intention to use other
mobile applications for their micro-enterprise operations. The experience gained in using the
mentorship-movement application is also proposed as a determinant of behavioural intention.
The next section will depict the research hypotheses for this study.
3.5. Research Hypotheses
Based on the proposed research model, several hypotheses were developed to (1) investigate
the factors that influence the adoption of mobile applications for micro-enterprise operations
using the construct of the UTAUT model, (2) and to investigate the influence that experience
using a mentoring application and the perceived satisfaction of using a mentoring application
have on using other mobile technologies. According to Bonnett and Wright (2015) hypotheses

45 | P a g e
test the relationship between variables (dependent and independent) and thereby develop our
understanding of the study phenomenon.
3.5.1. Part 1: Determinants of behavioural intention and use behaviour (UTAUT)
Hypothesis 1: Performance expectancy directly influences micro entrepreneurs’ intention to
use mobile applications for micro-enterprise operations.
.
Hypothesis 2: Effort expectancy directly influences micro entrepreneurs’ intentions to use mobile
applications for micro-enterprise operations.
Hypothesis 3: Social influence directly influences micro entrepreneurs’ intentions to use mobile
applications for micro-enterprise operations.
Hypothesis 4: Facilitating conditions influences micro entrepreneurs’ usage behaviour of mobile
applications for micro-enterprise operations.
Hypothesis 5: Behavioural intention directly influences use behaviour in respect of the use of
mobile applications in micro-enterprise operations.
Figure 3.1., below illustrates the first part of the proposed research model to investigate the
factors that influence the adoption of mobile application for micro-enterprise operations.

46 | P a g e
Figure 3.1.: The determinants of intention and use behaviour (UTAUT)
3.5.2. Part 2: Experience and Satisfaction as determinants of Behavioural Intention
In many studies, behavioural intention to use mobile applications was hypothesized to have a
positive and direct influence on mobile application usage behaviour (Venkatesh et al., 2003;
Zhou, 2011; Arman & Hartati, 2015). Arman and Hartati (2015) further argue that most
technology adoption studies have used behavioural intention as a predictor of the subsequent
use behaviour and that the relationship between the two variables is well-established to
measure technology adoption.
The micro-entrepreneurs were all users of a common mobile application and therefore the
experience gained in using the mentorship-movement application as well as the degree of
satisfaction in using the mentorship-movement application was hypothesised to influence the
behavioural intention to use other mobile applications for business.
Hypothesis 6: Experience with using mentoring mobile applications will influence the intention
to use mobile applications for micro-enterprise operations.
Hypothesis 7: Satisfaction of use of a mobile mentoring application will influence the intention
to use mobile applications for micro-enterprise operations.
47 | P a g e
3.6. Chapter Summary
The UTAUT model, being the selected model and lens to investigate the factors influencing the
adoption of mobile applications for micro-enterprise operations in South Africa, this chapter
expounds on the constructs of the UTAUT model as prescribed by Venkatesh et al. (2003). The
constructs of the UTAUT model as detailed in section 3.3., delves into determinants of
behavioural intention and use behaviour. Performance expectancy, effort expectancy and social
influence were presented as direct determinants of behavioural intention, while facilitating
conditions and behavioural intention as direct determinants of use behaviour (Venkatesh et al.,
2003). Many previous studies were reviewed, particularly to outcomes relating to the adoption
and use of mobile applications.
As part of the objectives of the study as mentioned in section 3.2., experience and satisfaction
were proposed as determinants of behavioural intention. The micro-entrepreneurs were all
users of a common mobile application, namely, the mentorship-movement application. The
study therefore examined the influence of the experience gained in using the mentorship-
movement application, as well as the perceived level of satisfaction attained in using the
mentorship-movement application as determinants of behavioural intention (see section 3.4.).
Section 3.5., outlines the hypotheses formulated according to the constructs of the UTAUT
model as well as experience and satisfaction as proposed determinants of behavioural intention.

48 | P a g e
Chapter 4: Research Methodology and Design
4.1. Introduction
In Chapter 2 and 3 the conceptual framework was highlighted, which then formed the basis for
this chapter. In this chapter the research design is discussed, and also the methods in relation to
the implementation strategy to address the research objectives.
The research design describes the study approach, the design selected, the research instrument,
sampling design and the data collection methods. Creswell (2013) describes the research design
as a strategic or systematic approach to manage the research process and therefore outlines the
guiding steps to the collection and analysis of the data, whilst maintaining its reliability and
validity.
4.2. Research approach
Given the theoretical underpinning for this study, the research approach informs the way in
which the data was collected and analyzed (Gray, 2006; Al-Qeisi, 2009; Scotland, 2012).
However, according to Al-Qeisi (2009) and Saunders, Lewis and Thornhill (2011) research
begins with the awareness of the philosophical underpinning of a study, which requires an
understanding of the research paradigms first.
By understanding the research paradigms (or philosophies), the researcher is enabled to frame
the research question within a specific paradigm, which is then fundamental to the type of
answers that will be drawn from it (Al-Qeisi, 2009; Saunders et al., 2011). Scotland (2012)
states that research paradigms are rich in theories and support the researcher to systematically
solve problems, and apply the appropriate use of tools in the research process. Crowther and
Lancaster (2008), Collins (2010) and Collis and Hussey (2014) argue that a paradigm guide the
study design and implementation, by strategically integrating different sections of a study in a
coherent and logical way. Aspects like data collection and analysis are guided by way of a
paradigm so that the data collected from the field are dealt with in a logical manner and free
from ambiguity (Easterby-Smith et al., 2008).
According to Krauss (2005) when examining the philosophy of reality (ontology), we first need
to be aware of the existence of that reality (epistemology) and the processes we used to realize
it (methodology). Krauss (2005) further argues that there are two types of ontologies namely
realism (objectivist ontology) and relativism (subjectivist ontology) which will be discussed in
49 | P a g e
the next section.
4.2.1. Ontology
Ontology according Littlejohn and Foss (2009) is a logical interpretation of what an individual
believes is reality. Ontology tries to find the answers to the existence of a phenomenon within a
subject matter by specifying a view that that is essential to the nature of a reality (Aliyu et al.,
2014). Aliyu et al. (2014) states that considering ontology in information technology studies,
should be of importance to the researcher, as the services and benefits offered through the use
of technology solve real world problems, and therefore are a part of reality. By examining
literature or theories, the ontological views common to realism and relativism is therefore
essential when undertaking technology related studies (Mertens, 2009; Bello et al., 2014).
Ramanathan (2008) and Littlejohn and Foss (2009) state that realism refers to an objective
belief of reality (or something that is real), and the knowledge which is sought after is
verifiable. Seeking knowledge requires the researcher to comprehend the underlying
assumptions of existing knowledge that can either be acquired through experience or by
reviewing literature of a similar or related nature (Saunders et al., 2012). According to
Denscombe (2003) realists view the world independent of their own views and beliefs, and that
various viewers are able to test the external world, with similar outcomes. Realists are required
to be unemotional and disconnected from the study participants and be able to distinct between
cause and emotion (Scotland, 2012). Scotland (2012) further states that the world already exists
with principles and laws and therefore human knowledge contribute to existing knowledge as
oppose to being part of that reality.
Relativism however suggests that there are no definitive truths or legitimacy to knowledge and
that knowledge is of a subjective nature and relative (Wilson, 2010; Scotland, 2012). Individual
perceptions and understanding make up relativity and commonly influenced by the social
exchanges of the participant within the real world (Kura, 2012). Kura (2012) further states that
the connotations made by a participant are authentic, as reality is relative to the perception of
that participant. Fitzgerald and Howcroft (1998), Miller (1999) and Kura (2012) argue that
relativists support a concept of diverse views, due to the existence of diverse customs or
inherent views, and oppose views that consider the pre-existence of ideals and values when
defining reality.

50 | P a g e
Given that relativism advocates a diversified view of reality and that the study outcome would
be influenced by the observer, this study therefore rejects a subjective ontological view to
research. This study follows a logical, scientific approach to research that is objective and
independent of the views or perception that I as the researcher might have. An objective
approach to conducting this study therefore accepts an ontological view based on realism.
4.2.2. Epistemology
Epistemology essentially examines the views encapsulated in a reality, how we came to know
about such a reality, and how do we obtain knowledge about that reality (Crowther &
Lancaster, 2008). Crowther and Lancaster (2008), Littlejohn and Foss (2009) and Wilson
(2010) states that epistemology expounds on the philosophies of knowledge and offers reasons
for our thinking, what we believe as being the truth, how we evaluate facts, and then decide
how to apply knowledge.
According to Wilson (2010) and Saunders et al. (2011) epistemology considers five key views
that is Positivism, Interpretivism, Pragmatism, Critical theory and Post-positivism. When
considering an epistemological view, researchers are cautioned to align the epistemological
view with the ontological view of the study (Wilson, 2010, Saunders et al., 2011). This
section will therefore briefly discuss the five key epistemological considerations and conclude
on the view appropriate for this study.
4.2.2.1. Positivist philosophy
Positivism suggests that an observation of a reality is examined through science, and thereby
allows for an empirical claim that is sensible and also be verifiable through science (Krauss,
2005; Clarke, 2009). Wilson (2010) states that the scientific procedures imply that a logical
process or mathematical formulae was applied to solve a problem. According to Denscombe
(2003) the main premise of positivism is to learn about social patterns and symmetries of a
social reality through the use of science. Al Qeisi (2009) states that positivism values
objectivity and the legitimate existence of knowledge and therefore aligns to a realism
ontological point of view. Realism put emphasis on that whatever knowledge is observed or
gained through research, exists independently of that reality and that the knowledge observed
can be verified (Krauss, 2005). Clarke (2009) and Mkansi and Acheampong (2012) argue that
any interference to a study guided by a positivists view obstructs the validity of that study and
therefore demand researcher impartiality.
51 | P a g e
Kura (2012) argues that positivism supports a variation of concepts, where the strength of the
variable relationships of a study is determined through probability or scientific measures. It is
therefore the responsibility of the researcher to identify and recognize the relationships that
exist amongst variables within a study, in order to ensure a successful research undertaking
(Collins, 2010; Collis & Hussey, 2014). Quantitative research aligns more to a positivism view
as quantitative studies follow a scientific approach to solving a problem. Aliyu et al. (2014)
state that through the formulation of hypotheses a conclusion is derived when the hypotheses
are either accepted or rejected through scientific methods (Aliyu et al., 2014).
4.2.2.2. Interpretivism
Interpretivism however opposes the views of positivists and believes that the researcher is the
key catalyst to measuring the outcome of a study (Aliyu et al., 2014). Collins (2010) and Collis
and Hussey (2014) argue that development of knowledge as in Interpretivism; depend on the
social exchanges that connect individuals and other parts of a study. Ramanathan (2008) states
that the researcher who employs an Interpretivism view cannot be separated from his or her
study as the study outcome is directly linked to the researcher. Walsham (2006) and Scotland
(2012) state that knowledge is intentionally forged through experiences, and for that reason
Interpretivists’ main goal is to develop an understanding of knowledge that seem to exist within
a specific reality. Crowther and Lancaster (2008) argue that this stance taken by Interpretivists
attribute to why Interpretivism is criticised for its low predictive capabilities.
According to Clark (2009) researchers with an Interpretivist view should first recognize and
understand the norms that habituate within an environment, before they can seek to learn from
the experiences and perceptions within the boundaries of such an environment. Harris and
Brown (2010) and Scotland (2012) state that Interpretivists believe that several explanations
might exist for the same reality, and therefore knowledge is a product of social construction,
and subjected to change. Rowlands (2005) states that from an ontological perspective,
Interpretivism yields to a relativism point of view.
4.2.2.3. Pragmatism philosophy
Pragmatism views recognize the existence of various approaches to research and interpreting
those research outcomes (Saunders et al., 2012). Saunders et al. (2012) further argues that the
quest for knowledge cannot be subjected to a single view point as it would result in an

52 | P a g e
incomplete representation of a reality. Crowther and Lancaster (2008) state that Pragmatism
concedes to the existence of multiple realities for the same subject matter; and that those
realities are only realized once the situation or the problem has been investigated. Rowlands
(2005), Williams (2007) and Bolner et al. (2013) argue that a singular viewpoint offer only a
partial view to knowledge or truth and an incomplete solution to a research problem. Kura
(2012), Mkansi and Acheampong (2012) and Aliyu et al. (2014) argue that pragmatists often
adopt a quantitative approach to research, if they need to test a theory and desire outcomes that
can objectively be generalised to the study population. Dalsgaard (2014) states that even
though pragmatists may select a quantitative approach to research, they often adopt a
qualitative approach simultaneously and thereby favour a mixed method approach to research.
Dalsgaard (2014) further argues that the objectives of pragmatists are not to validate the
legitimacy of knowledge, but rather to observe the practical outcomes.
4.2.2.4. Critical theory
According Myers and Klein (2011) the critical theory was developed to address difficult and
complexed occurrences in social and economic constructions. Myers and Klein (2011) and
Bolner et al. (2013) argue that knowledge is socially formed and that the value attached to the
socially constructed knowledge, is commonly influenced by those who are promoting
knowledge. Bolner et al. (2013) further argues that this production of knowledge is a
demonstration of social influence rather than the true reality. Kura (2012) and Myers and Klein
(2011) argue that social structures influences the interpretation of the knowledge being
measured through a series of social conditioning like the influence of the media, institutions
and communities.
Critical theorists employ methods where they engage with participants in conversation, then
thereafter reflecting on the conversations to make deductions relating to a reality (Scotland,
2012). Mkansi and Acheampong (2012) states that knowledge gained through engagement
methods are then commonly subjected to critique and enthusiasm, whereby the social realities
are then examined and reviewed and then subjected to change, if necessary.
4.2.2.5. Post-Positivism
Post-positivism was developed to address the gap between Positivism and Interpretivism
(Scotland, 2012). Post-positivism suggests that a researcher cannot always be disconnected and
act independently from the research, and therefore accepts that the characteristics of a
researcher (background, values and knowledge) can influence what is being observed (Mkansi
53 | P a g e
& Acheampong, 2012; Scotland, 2012). Mkansi and Acheampong (2012) states that Post-
positivism recognizes the existence of biases, but believe that the application of various
methods in undertaking research will in evidently strengthen the study findings. According to
Creswell (2009) states that post-positivism commonly start with a collection of theory, on the
basis to either support or disprove a theory, and then to revise a theory or view based on what
was reviewed, which is then normally followed by further testing of such theory. Mackenzie
and Knipe (2006) state that post-positivism is usually suggested to be a replacement for
positivism, and like positivism, align strongly to quantitative research methods.
4.2.2.6. Epistemological stance in this study
This study aligns with an epistemological view that separate the systematic origins of facts and
the interference of personal views, and therefore value factual inferences above personal views
(Scotland, 2012). On this premise, Interpretivism, Pragmatism, Critical theory and Post-
Positivism were found not to be suitable as an epistemological view for this study. Positivism
recognises an objective stance towards research by hypothesizing existing forms of knowledge
and logically deducts findings generalizable to the study population (Heit & Rotello, 2010;
Kura, 2012). Given that this study follows a deductive approach, the developed hypotheses
were based on existing theories that required a design strategy to test these hypotheses.
A survey questionnaire was used as the primary method for data collection, and thereby
facilitated the collection of quantifiable data, relevant to test the hypotheses (Harris & Brown,
2010). Furthermore, the literature was applied as comparative measure between the observed
findings of the study to observation noted by other researchers. For this reason, Positivism was
selected as the epistemological view for this study.
4.2.3. Quantitative versus qualitative studies
According to Williams (2007) and Yates et al. (2012) the extent to which confidence is
demonstrated in a research process is often directly linked to how valid and reliable the
research process is. Therefore achieving a desired research outcome would then require an
appropriate selection of a research methodology (qualitative or quantitative methodology) that
will support the research objective (Williams, 2007).
Quantitative methodologies usually adopt a Positivism epistemological view (Kura, 2012)
which also aligns with this study. Quantitative research is often described as a type of inquiry
used for deductive studies, when testing hypotheses, gathering descriptive data, and also to

54 | P a g e
explore variable relationships (Creswell, 2013). These relationships amongst variables are
statistically analysed by assigning numeric values to survey data and thereby gaining insights
into the research phenomenon. This type of research is categorized as a positivist approach to
research as it grounded in the belief that science is the solitary basis for real knowledge
(Wagner et al., 2012). The concept of positivism as previously mentioned, implies that any
research is independent of the researchers own beliefs and opinions, and therefore this study is
objective and also reflect a factual reality (Hudson & Ozanne, 1988; Clarke 2009, Wilson,
2010; Kura, 2012; Wagner et al., 2012).
Qualitative methodologies, however adopt an Interpretivist epistemology view (Clarke, 2009;
Kelliher, 2006). Clarke (2009) argues that qualitative studies lack the structural depth as that of
quantitative studies. The objective of qualitative studies is to explore and explain experiences,
values, beliefs and perceptions of a target group and therefore commonly follow an inductive
logic and a subjective interpretation of knowledge (Kumar, 2005; Turner, 2010; Creswell,
2013). Based on the ontological and epistemology view of this study, a quantitative approach is
best suited for this study.
4.3. Research Design
The research design is a systematic approach to understanding and solving the research
problem (Creswell, 2013). According to Plomp (2010), by solving the research problem the
existing knowledge and understanding of a study phenomenon is enriched and more directed
interventions developed to address the research problem. The research design therefore
organises the research model through a framework outlining the acquiring and collection of
data, how it is examined and explained (Cresswell, 2013; Plomp, 2010).
4.3.1. Research Aim
In order to meet the objective of this study, the following research questions were developed,
which essentially links the research design and data collection strategies employed;
1. What are the factors influencing the adoption of mobile applications for micro-enterprise
operations?
55 | P a g e
2. Does the use of mobile mentoring applications influence the adoption of mobile applications for
micro-enterprise operations?
Given the research aim and objective, a non-experimental correlation design was selected as
this type of type design measures the relationship between the independent and dependent
variable(s) as they appear (Lavrakas, 2008). The observed relationship should be one that is
without any inference or control being exercised over the independent variable (Lavrakas,
2008).
4.3.2. Non-experimental Correlation Design
In non-experimental research, the researcher describes a group or investigates the relationships
between former or established groups without any interference from the researcher (Salkind,
2010; Lavrakas, 2008). According to Salkind (2010), Lavrakas (2008) and Cook and Cook
(2008) the researcher simply observe and describe the situation as it occurs, without
manipulating any variables or assigning members of the group at random in an attempt to
control the treatment group. Salkind (2010) argues that without exercising control over the
treatment group, the researcher is therefore unable to infer any causal relationships between the
variables.
According to Cook and Cook (2008), the validity of the design is still of concern, but more
specifically to the measurements employed as opposed to the actual effects that was observed.
Given that the researcher depend on the analysis of data and what is being observed, the
researcher essentially make use of correlations, surveys and also case studies to make
inferences, therefore failing to demonstrate a genuine cause and effect relationship (Salkind,
2010). Non-experimental research is more inclined to show a high degree of external validity
and thus generalizable to a greater population (Lavrakas, 2008). This study makes use of
survey research, which will be discussed in the next section.
4.3.3. Survey Research
As mentioned in the previous section, non-experimental research makes use of surveys to
describe a group or situation where members of the group partake in completing a survey or
questionnaire. In behavioural sciences, surveys are a familiar instrument that consists of a
collection of questions or statements to which participant responses are required (Privitera &
Wallace, 2011). According to Glasow (2005) surveys are often referred to as a questionnaire or
self-report for the reason that surveys purposely include questions which require participant

56 | P a g e
self-report, for example, questions about their activities, behaviour, opinions, etc.
In the context of this study, survey research utilized a questionnaire as the method for
collecting data from the target population. The individual experiences of the micro-
entrepreneurs were examined to determine the existence and influence of common perceptions
and behavioural attributes that played a role in their decision to adopt mobile applications for
micro-operations. Survey research addresses the analytical and predictive significance of the
relational variables that concerns the adoption and use of mobile business applications (Yang &
Land, 2008).
Levy and Lemeshow (1999) and Mertens (2010) describe survey research as a two –step
process, of which the first step is to develop a sampling plan and then to obtain population
estimates from the sample data. The sampling plan will describe the approach to selecting a
representative sample and also the distribution media (Maree & Pietersen, 2007; Babbie &
Mouton, 2010). Salant and Dillman (1994), Levy and Lemeshow (1999) and Mertens (2010)
state that obtaining population estimates must include recognizing the required response rate
and the desired level of survey accuracy.
4.3.4. Research Population: National Mentorship Movement
Sekeran (2003), Singh (2007) and Maree and Pietersen (2007) describe the population as the
total number of individuals that a researcher wants to investigate. Considering a collective of
micro-entrepreneurs to be investigated, the National Mentorship Movement was approached as
they provide an online mentoring programme to micro-entrepreneurs.
The micro-entrepreneurs through the use of the mentorship-movement application are enabled
to develop their entrepreneurial skill-set, and also to advance their business practices through
peer group and mentor engagements. The entrepreneurs are matched with mentors, based on
their user profiles they created and also the development areas they have indicated. Mentors,
being experts in their associated fields of study and industry then connect with the
entrepreneurs through individual or peer group consultations. Consultations are primarily
facilitated using the mentorship-movement application or any other online mediums that would
support ease of communication and interaction.

57 | P a g e
The population for this study is therefore micro entrepreneurs who are registered in the
National Mentorship Movement online mentoring programme. The total number of registered
entrepreneurs are eight hundred and nine (N = 809), as confirmed by the administrator of the
National Mentorship Movement.
4.3.5. Sample Size
Creswell (2013), Kura (2012), Babbie and Mouton (2010) describe a sample as a subset of a
target population. In order to make generalised inferences about the target population, the
sample should be a representative of that target population (Creswell, 2013; Kura, 2012;
Babbie & Mouton, 2010). The population for this study is N = 809 micro-entrepreneurs.
According to the accepted scientific guideline for selecting a sample size (Krejcie & Morgan,
1970):
If the population for this study is N = 809, then the required sample (n) needed = 218.
4.3.6. Sampling Technique
According to Flick (2010) when undertaking a quantitative approach to research, the sampling
technique should either be probability sampling or non-probability sampling. Bhattacherjee
(2012) argues, that if unsuitable sampling techniques are used it will result in wrong and
erroneous assumptions about the target population.
Probability sampling entails a technique where members of the target population have an equal
chance of being selected (Sedgwick, 2013). According to Thomas et al. (2013), probability
sampling is the simplest form of sampling and includes techniques like simple random;
systematic; stratified and cluster sampling.
For this study the entire population of micro-entrepreneurs was sampled with no logical
method, implying that each population member has an equal opportunity of being selected and
responding to the questionnaire. Population sampling therefore suggests that the respondents
are accepted as representative of the target population (Turabian, 2013; Thomas et al., 2013;
Collis & Hussey, 2014).
4.4. Data Collection Strategy
This section informs the data collection method employed for this study, being an online survey
questionnaire. Following on Vyhmeister and Robertson (2014), the questionnaire was

58 | P a g e
reinforced by a review of literature and by examining extant theories relating to the subject
matter. An online survey will be distributed to micro entrepreneurs who all use the same online
mentoring application. The administrator of the mentoring application will upload and
distribute the survey to all participants of the online mentoring programme. The advantages of
population sampling is that the online survey can be distributed to the entire populations with
ease, that is unbiased and representative of all micro-entrepreneurs utilizing the mentoring
application (Thomas et al., 2013; Collis & Hussy, 2014). However, it is important to note that
the respondents could be a poor portrayal of the overall population and might not be
representative of entrepreneurs operating in the micro-enterprise sector.
4.4.1. Closed-end questionnaire
According to Collins (2010) and Crowther and Lancaster (2008) a closed-end questionnaire is
common amongst researchers employing quantitative studies. Participants are presented with
an arrangement of answers that he or she can choose from, and therefore providing the
researcher with information considered necessary to fulfil the study objective (Collins, 2010;
Al-Qeisi, 2009; Crowther & Lancaster, 2008). Al-Qeisi (2009) argues that closed-end
questionnaires are advantageous to supporting the scientific measures of a study as it eases the
analyses of the data collected; comparability is easier and valuable to framing new theories
(Littlejohn & Foss, 2009). Littlejohn and Foss (2009) further states that the collection of large
amounts of data becomes easier, as the questionnaire can be distributed to a multitude of
participants simultaneously, whilst the participants complete the questionnaire independent of
the researcher and other participants.
Wilson (2010) states that closed-end questionnaires can be distributed in a number of ways,
which includes physical distribution, posting outlets, emails, and web and mobile applications.
According to Dörnyei (2007) and Harris and Brown (2010), a questionnaire presents
researchers with an easy way to collect data from a large target population, and therefore also
facilitate the collection and the analysis of the collected data in a shorter period of time. In the
context of this study, the questionnaire was distributed on the National Mentoring Movement
web and mobile application, of which the distribution was administered by the
administrator/coordinator of the National Mentoring Movement.
The questionnaire was segmented to address the key variables of the study and also themed to
align with the research hypothesis. The questionnaire that was distributed to the micro-
59 | P a g e
entrepreneurs using the mentoring application, to warrant a selection a desired sample
population. See Appendix A.
4.4.2. Research Instrument
The research instrument for this study was a survey questionnaire. Questionnaires were an
efficient way to collect data, especially where data of a high quantity was required as it was
inexpensive and easy to administer (Privitera & Wallace, 2011). The questionnaire was
encapsulated with a set of pre-determined questions that allowed the respondents to answer
questions within carefully defined options (Sekeran, 2003; Theron & Grosser, 2010). Micro-
entrepreneurs were requested to express their agreement or disagreement to the questions using
a Likert scale (Bouranta et al., 2009). The items in the questionnaire were then used to evaluate
the research model, of which the key concepts were drawn from the UTAUT model (Venkatesh
et al., 2003).
The instrument for this study was modelled on that of Venkatesh et al. (2003) as it is a
validated instrument and therefore suitable to measure the factors that influence the adoption of
mobile applications for business operations. The measurement instrument as developed by
Venkatesh et al (2003), was also noted and validated in a number of technology adoption
related studies, for example; the cross-cultural validation of universities (Simeonova et al.
2010); acceptance of e-government services (Alshehri et al., 2012); factors affecting the use of
English in e-learning website (Tan, 2013); and the adoption of e-government technologies for
food distribution (Chopra et al., 2016). The items in the instrument were left unchanged apart
from changing the referent to ensure contextual alignment with the subject matter. Therefore
the instrument items were formulated to determine the factors that influence the adoption and
use of mobile applications for micro-enterprise operations.
4.4.3. Questionnaire Design
The UTAUT model guided the development of questionnaire. The questionnaire was structured
and divided into ten sections, of which a five point Likert scale was used to measure the items
relating to the dimensions (Performance Expectancy, Effort Expectancy, Social Influence and
Facilitating Conditions) – sections three to eight of the survey. A five-point Likert scale as
indicated in previous studies, reduces the frustration level of the participants, as well as
increases the response rate and the quality of the responses, opposed to a seven or nine-point
Likert scale (Babakus & Mangold, 1992; Sachdev & Verma, 2004; Dawes, 2008; Bouranta et

60 | P a g e
al., 2009). In this study, five options were used ranging from strongly agree = 1, agree = 2,
undecided = 3, disagree = 4, strongly disagree = 5.
The first section of the instrument explained the aim of the study, procedures and surety that
participation is voluntary, anonymous and confidential. The procedural explanation is
necessary and provided before the start of the questionnaire, to ensure that the choice to
participate by the micro-entrepreneurs is an informed one (Fisher & Anushko, 2008). The
second section measured the self-report of the micro-entrepreneurs experience and satisfaction
in using the National Mentorship Movement mentoring application. Sections three to eight was
themed in accordance to the main concepts or variables of the UTAUT model. Section nine
collected biographical information about the micro-entrepreneurs, and Section ten thanked the
micro-entrepreneurs for participating in the survey.
The wording of some of items of the UTAUT questionnaire (Venkatesh et al., 2003) was
adjusted to better suit this study (see examples in Table 3.1. below). Specifically, references to
technology were changed to mobile applications. Table 3.1., (Sections 2 to 8) measured the key
constructs used by Venkatesh et al. (2003) to predict the use and acceptance of technology.
Venkatesh et al. (2003) indicated that performance expectancy; effort expectancy; social
influence and facilitating conditions statistically explained or rather predicted use behaviour of
the use and acceptance of a technology. Refer to Appendix A for the final questionnaire.
Table 4.1.: Summary of questionnaire structure (See appendix A)
SECTION ITEM DESCRIPTION EXAMPLE
2 Mobile Mentoring
Application Use
Self-Report of experience in
using the mentoring
application and also the
satisfaction of using the
mentoring application.
How long have you been
using the Mentoring
Applications?
Rate your satisfaction
level using the Mentoring
Application
3 - 5 Performance
Expectancy, Effort
Expectancy and
Social Influence.
This section focused on testing the
predictors that were expected to
influence the micro-entrepreneurs
behavioural intention to use mobile
applications for micro-operations.
Use of mobile
applications enables me
to accomplish tasks more
quickly
I find mobile applications
useful in my business
6 Facilitating
Conditions
This section focused on testing the
predictors that were expected to
influence the micro-entrepreneurs’
use behaviour of mobile
Guidance is available to
me to use the mobile
applications effectively in
my business

61 | P a g e
applications.
7 Behaviour Intention This section focuses on the
relationship between the micro-
entrepreneurs’ behaviour intention
and use behaviour of mobile
applications.
I intend to use mobile
applications for business
in the next 12 months
I intend to use mobile
applications more to
promote my business
8 Use Behaviour This section focused on the micro-
entrepreneurs’ actual use behaviour
of mobile applications and the
subsequent use thereof.
I use mobile applications
daily in my business
I use mobile applications
to engage with my clients
Each dimension of the UTAUT model was tested in the survey. The survey was specifically
designed to facilitate that each response from the micro-entrepreneurs will provide enough
information to examine the use behaviour and behaviour intention. The next section will
discuss the reliability and validity considerations of the research instrument.
4.5. Validity and reliability of the research instrument
4.5.1. Validity
Adams et al. (2007) describes validity as the extent to which an instrument measures what it is
supposed to, thus being accurate with each measurement. Kane and O’Reillly-de Bruyn (2001)
states that problems could arise with the validity and the reliability of an instrument if sampling
or network biases exist in the study. This study assumes that the survey outcomes would be
similar if the survey was repeated in a similar environment.
Considering the validity of the survey, this study made use of content validity and face validity,
as well as construct validity as a means to test that the survey validity. Content validity is
critical to ensuring that the data collected is valid and being able to measure the intended target
population (Bolner et al., 2013). According to Yang et al. (2013) the level of content validity is
achieved when the instrument is substantiated by the literature as well as being reviewed by
experts. The literature pertaining to this study was submitted to a process of continuous review
and the survey questionnaire critically reviewed by two experts, one being a Professor and
expert in the Information Technology and the other holding a PhD and expert in the Industrial
Psychology field. Their constructive criticism therefore attributed to the level of content
validity of the survey.
62 | P a g e
Face validity influences the accuracy of the data collected, meaning that through face validity
the respondents are free form any uncertainty interpreting the survey questions (Scotland, 2012;
Al-Qeisi, 2009). Al-Qeisi suggests that a pilot study is necessary to satisfy the validity
obligations. In order to test the face validity of the questionnaire, the survey was distributed
amongst peers and colleagues (some who subsidise their income with part-time trading of
goods and services) in order to establish, that the questions are simplistic, clear and easily
understood. The outcome of this pilot was that participants were able to understand the
questions without any difficulty and therefore a good measure of the level of face validity.
Construct validity, however, tests the degree to which a measure relates to the theory or
hypotheses being examined (Gable, 1993). According to Gable (1993), Netemeyer, Bearden &
Sharma (2003), Al-Qeisi (2009) and Scotland (2012), construct validity assures the researcher
that the research instrument evaluates or measure what is planned or proposed to be measured.
Turocy (2002) and Scotland (2012), state that the method of factor analysis is commonly
associated with construct validity and regarded as one of the analytical tools to assess construct
validity. According to Gable (1993), Turocy (2002) and Scotland (2012), factor analysis
empirically examines the relationships between items and to recognize groups of items that
share satisfactory differences, thereby substantiating their existence as a factor to be assessed
by the research instrument. In this study, the construct validity was assessed by using
confirmatory factor analysis (CFA) which is further discussed in Chapter 5 (see section 5.7.1.).
4.5.2. Reliability
Adams et al. (2007) describes reliability as the extent to which an instrument measures the
same way each time it is under test. Adams et al. (2007) further argues that reliability is about
the consistency of results, each time the research instrument is used. According to Gilem
(2003) and Santos (1999), when a construct is a hypothetical variable being measured, the
Cronbach alpha is used as a guide to measure the reliability of an instrument. A Cronbach alpha
measuring 0.7 and above is viewed as a reliable outcome (Gilem, 2003; Santo, 1999). Sekaran
(2000) however argues that a Cronbach alpha score less than 0.6 is believed to be poor, and that
scores in the range of 0.7 are acceptable, and scores measuring above 0.8 are good. The closer
the reliability coefficient is to 1.0, the more reliable the measure, as this would exceed the
generally accepted and agreed upon lower limit for Cronbach’s alpha of 0.70 (Peter, 1979;
Robinson, Shaver & Wrightsman, 1991). However, the generally accepted score of 0.70 may
decrease to 0.60, only if exploratory research is conducted (Robinson, Shaver & Wrightsman,

63 | P a g e
1991). Table 3.2., below demonstrates the Cronbach alpha score of several studies that used the
constructs of the UTAUT model in their respective research undertaking.
Table 4.2.: Cronbach alpha reliability results using a Likert scale
Cronbach alpha
Researchers Study Performance
Expectancy
Effort
Expectancy
Social
Influence
Facilitating
Conditions
Venkatesh et al.
(2003)
User Acceptance of
Information Technology: Toward a Unified View
0.92 0.92 0.84 0.81
Simeonova, Cross-cultural Validation of 0.87 0.91 0.81 0.79
Bogoyubov, UTAUT: The Case of
Blagov & University VLEs in Jordan,
Kharabsheh Russia and the UK
(2010)
Alshehri, Drew & Analysis of Citizens’ 0.83 0.84 0.77 0.83 AlGhamdi (2012) Acceptance for E-Government
Services: Applying the
UTAUT Model
Tan (2013) Applying the UTAUT to
Understand Factors Affecting
the Use of English E-Learning
Websites in Taiwan
0.83 0.82 0.78 0.87
Chopra & Rajan Modelling Intermediary 0.74 0.81 0.83 0.73
(2016) Satisfaction with
Mandatory Adoption of E-
government Technologies for
Food Distribution
The first phase of the data analysis tested the reliability of questionnaire by determining the
Cronbach’s coefficient alpha (see Chapter 4). This was then followed by describing the data
through the use of descriptive statistics, which include variables like frequencies, mean,
standard deviation, skewness, kurtosis, t-tests, etc. by using SPSS. This reliability analysis will
therefore demonstrate the robustness of the questionnaire in terms of its internal consistency,
which means that if the measure is put under test, it will produce a consistent range of results
each time it is, tested (Pallant, 2005).
4.6. Data Analysis
The data collected for this study was sectioned into two parts, (1) to describe the data
characteristics (descriptive statistics) and (2) to establish the variance in the relationship

65 | P a g e
between the independent and dependent variables (regression analysis) using the Statistical
Package for Social Sciences (SPSS) and MPlus (Muthen & Muthen, 1998-2017), a software
programme developed for the statistical analysis of data.
Descriptive statistics is used to make summaries pertaining only to the sample group, and not to
the entire target population (Mordkoff, 2016). In other words, no deductions and inferences
can be made or generalized to the entire target population as the data would only be limited to
the sample group, which is often a mistake made by some researchers (Best & Khan 2003).
Best and Khan (2003) and Pallant (2005) state that the descriptive analysis of data provides the
researcher with valuable information of the sample group that will be beneficial when
describing the attributes of the sample; testing if the variables are in any violation of the
assumptions essential to the statistical technique used; and to deal with the specifics of the
study objectives. Pallant (2005) further states that descriptive statistics will highlight any
inconsistencies or ambiguities in the collected data and also will show unanticipated patterns
and annotations that must be taken into account when carrying out a formal analysis of the data.
The second phase entailed a Regression analysis of the data collected. Field (2009), states that
regression analysis is useful when trying to establish the variance explained in the outcome
variable. Furthermore, when assessing the relationship between the independent and dependent
variables, a Structural Equation Modelling technique was used to test the constructs of the
UTUAT model. This entailed the testing of the structural model, the formulated hypothesis (see
Chapter 3, section 3.5.1.) and also any unobserved relationships between latent constructs. In
addition the one-way ANOVA technique was used to determine the relationships of the
categorical variables (experience and satisfactions) in relation to behavioural intention as
hypothesised in Chapter 3 (see section 3.5.2.).
Structural Equation Modelling (SEM) embodies a statistical method founded on the latent
variable theory, which is a technique complex in nature, involving a series of related processes,
with similar characteristics of importance (Kline 2005; Hair, et al. 2010; Osborne 2015).
According to Byrne (2001) and Hair et al. (2010), Structural equation modelling offer a base
for hypothesis testing by assessing the path coefficients of important relationships between
observed and unobserved variables. The use of Structural equation modelling in behavioural
sciences and in particularly Information Technology studies is however favorably commended
by researchers like Gefen, Straub & Boudreau (2000), Tabachnick and Fidell (2007), Winter
and Dodou (2012) and Osborne (2015) . Moreover, Bollen (1989) labels Structural equation

66 | P a g e
modelling as a multivariate system that is used to test archetypes that proposes a causal
relationship between variables; that consists of two main parts, i.e. a measurement model as
well as a structural model. Hair et al. (2006, 2010) and Kohnke et al. (2014), state that the
measurement model embodies the theory and indicates how the measured variables relate and
represent latent causes as opposed to the structural model that indicate how the model
constructs relate to each other. Hair et al. (2006, 2010) and Kohnke et al. (2014) further argue
that the structural model differ from the measurement model given that the emphasis shifts
from the relationships amongst the latent and measured variables to the characteristics and
scale of the relationships amongst the constructs.
Furthermore, a one-way ANOVA is a statistical test that evaluates the variation in the group
means of a sample during which only one independent variable is considered (Mackenzie,
2018; Al-Qeisi, 2009; Shapiro, 1965). A one-way ANOVA aims to assess commonly exclusive
ideas about the research data through hypotheses based testing (Mackenzie, 2018). The
independent variables are categorically organized and should contain three or more categorical
groups, in order to determine if there is an observed disparity between them (Mackenzie, 2018;
Al-Qeisi, 2009). Mackenzie (2018) further states that inside each group supposed to be three or
more observations, of which the mean scores of the sample is then evaluated.
4.7. Ethics
According to Brynard and Hanekom (2006, p.6) ethical research entails being honest and
treating all information or data gather from participants as confidential.
Considering that all researchers should adhere to an ethical code of conduct, where researchers
are required to act with honesty, respectfulness and integrity to all stakeholders. This study
understands the importance and the existence of ethical guidelines. The study received ethical
clearance from the UWC HSSREC ethics committee, reference number being HS18/9/5 (see
Appendix B). Accordingly as the researcher, I was compelled to adhere to ethical guidelines as
set out by the University of the Western Cape. The micro-entrepreneurs, who participated in
this study, have done so voluntary and consented to participate at their own will. All
participants were informed about the aim of the study and its significance and that
confidentiality will be ensured at all times (refer to Appendix B for the consent forms).

66 | P a g e
The administrator of the National Mentorship Movement was approached and asked permission
to distribute a survey questionnaire on their mobile platform, purely for research purposes. A
covering letter stating the purpose of the study accompanied the survey, to which the National
Mentorship Movement conditioned that the research findings should be made available to them.
The participants were informed that the data collected will only be used for research purposes
and not for the purpose of the National Mentorship Movement. Participation in the survey was
voluntary and the participants’ identity was not used or revealed, therefore participants will
remain anonymous. The data collected from the online questionnaire was in an ethical and
responsible manner.
Given that the study is an academic study, the research process demanded a study effort free
from plagiarism and subjected to a credibility test through Turnitin. The proper use of
referencing guided the use of other researchers’ statements and arguments that related to the
context and concept of this study.
4.8. Chapter Summary
This chapter demonstrated the research approach adopted for this study, by considering the
ontological and epistemological views prominent to academic research. This consideration was
viewed as the guiding paradigm and the beginning of this research undertaking (Al-Qeisi, 2009,
Saunders et al., 2011). Realism guided the ontological view and Positivism the epistemological
view of this study. Realism and Positivism support the quantitative approach of this study, and
relevant to the use of scientific methods to collect and analyse data (Creswell, 2013). This
quantitative approach to research was then further supported by the choice of a suitable
research instrument to strategically collect data using a survey questionnaire. The survey
questionnaire empirically addressed the research hypotheses of the study as indicated in
Chapter 3 (see section 3.5.) and placates the objectives of the study.
This study employed a random sampling technique to collect sample data from the entire target
population (micro-entrepreneurs using the National Mentoring Movement mentoring
application). The data collected data was then further subjected to reliability and validity tests
and making use of SPSS and MPlus to scientifically examine and scrutinise the data through
descriptive statistics and a regression analysis of the data.

67 | P a g e
Chapter 5 – Data Analysis
5.1 Introduction
This chapter describes the analysis and findings of the survey data collected. Section 54.5.,
presents a descriptive analysis of the demographic attributes of the micro-entrepreneurs who
participated in the survey is presented. Section 5.6., and Section 5.7., describes the reliability
and the validity (respectively) of the UTAUT model in respect of the data collected. Structural
equal modelling was used to test the fit indices of the UTAUT model as discussed in Section
5.8. Furthermore, experience and satisfaction were hypothesized as determinants of behavioural
intention, which was described in Section 5.9. Lastly Section 5.10., conclude with a summary
of the chapter.
5.2. Overview of Research Questionnaire
A survey using the items of the UTAUT model was distributed amongst micro-entrepreneurs
who are all registered users of the mentorship-movement application, administered by the
National Mentorship Movement. As previously described in Chapter 3 the questionnaire
consisted of ten sections, of which the first section introduced and described the purpose of the
study, question types, the ethical considerations and the researcher’s contact information.
Section two required the micro-entrepreneurs to self-report on their use of the mentorship-
movement application, with the aim to gauge their experience in using the application. In
addition to measuring their experience in using the mentorship-movement application, the
micro-entrepreneurs were required to self-report on their perceived level of satisfaction in using
the mentorship-application. Sections three to eight contained statements derived from the
UTAUT model, aimed at measuring the micro-entrepreneurs intention to use mobile
applications for business and their subsequent use behaviour of mobile applications. All the
items of the UTAUT model were measured by using a five point Likert-type scale, which were
arranged as follows: 1 = strongly agree; 2 = agree; 3 = undecided; 4 = disagree; and 5 =
strongly disagree. Section nine collected the demographic information of the micro-
entrepreneurs, with section ten thanking the micro-entrepreneurs for participating in the survey.
The objectives of the survey were to (i) to determine the factors influencing the micro-
entrepreneurs intention to use mobile applications for their micro-enterprise operations; and (ii)
to determine if the use of a mentoring applications influences the micro-entrepreneurs’
68 | P a g e
intention to make use of other mobile applications to advance their micro-enterprise operations.
The questionnaire was distributed to the 809 micro-entrepreneurs who operate across various
geographical regions in South Africa.
5.3. Response rate
Frankfort-Nachmias and Nachimias (1996) describe the response rate as the ratio amid the total
number of questionnaires distributed and the total amount questionnaires that was completed
and returned. Given that the respondents complete the questionnaire voluntarily, Teddlie and
Yu (2007), and Williams (2007) state that researchers should responsibly advise the
respondents of the importance of their participation, just as much as having the freedom to
withdraw from the research process at any given time. Jian et al. (2006) state that since the
questionnaires is completed voluntarily, it leads to a level of difficulty in formulating a pre-
determined or rather an acceptable response rate based on the number of questionnaires
distributed.
A total 809 questionnaires were distributed amongst micro-entrepreneurs using the mentorship-
movement application and also recognized as respondents within the sampling frame. The
questionnaires returned amounted to 221, which is 27% of the total population and therefore an
acceptable response rate (Krejcie & Morgan, 1970). Although Sekeran (2003) and Saunders
(2012) suggest that surveys a response rate of 30% is acceptable, this study however assents
with Krejcie and Morgan (1970).
5.4. Data Screening and Management
Before starting the analyses process, the raw data was first subjected to pre-analysis. According
to Field (2005), researchers should first screen the raw data prior to starting the analysis
process, as this is an important step that will help the researcher to stay clear from incorrect
findings and results. Levy (2006) and Disome et al. (2015) further suggest that data screening
is a critical stage in the analysis process as it allows firstly, the accuracy of the data collected to
be investigated; secondly, to identify and fix outliers; thirdly, to handle missing data values;
and finally, to handle any concerns relating to the response set. Likewise, Hair et al. (2006) and
Meade and Bartholomew (2012) indicated missing data, univariate normality and outliers as the
main areas of concern relating to the UTAUT model, during the data screening process.
One of the most common difficulties when analysing data, especially in social research studies

69 | P a g e
is that of missing data (Kline 2005; Tabachnick & Fidell 2007). Hair et al. (2006), Meade and
Bartholomew (2012) and Disome et al. (2015) further argue that before even attempting to
analyse the collected data, any missing data should be identified and dealt with, such as
incomplete answers or even missing survey sections. For this reason, questionnaires with
missing data (specifically relating to the constructs of the UTAUT model) were excluded from
the data analysis process. Should any missing data be included specifically in respect of
responses to questions in relation to the UTAUT model constructs (variables), the resultant
effect will yield an inaccurate computation of the fit measures like Goodness-of-Fit-Index
(GFI) in Structural Equation Modelling (Arbuckle 2006; Huang, et al. 2011). As previously
stated, 809 questionnaires were distributed amongst micro-entrepreneurs using the mentorship-
movement application over a period of two and a half months. As a result, a total of 221 (27%)
of the questionnaires were returned, of which 4 questionnaires were considered to be unusable
due to missing response items and therefore discarded in accordance to the researcher’s rule.
5.5. Descriptive Statistics
The survey was completed by 221 micro-entrepreneurs, whom all are uses of the mentorship-
movement application. Further to Section 5.4.1., only 217 responses were subjected to analysis.
The subsequent sections will describe the attributes of the micro-entrepreneurs according to
their gender, age, ethnicity, education as well as the highest education level achieved by the
micro-entrepreneurs.
The following sections will provide a general overview of the demographic information of all
the micro-entrepreneurs whom have participated in the survey. The demographic information
will present the gender, age, ethnicity, education and noted achievements of the micro-
entrepreneurs.
5.5.1. Gender and age
Given that the micro-entrepreneurs were required to indicate their age according to four
categories, the age of the micro-entrepreneurs were used to determine whether there were any
noticeable relationship between the age of the micro-entrepreneurs and the use of the
mentorship-movement application. Any noticeable differences would be indicative of a specific
age category being more likely to continue the use of the mentorship-movement application
and more likely to use other mobile applications for the advancement of their micro-enterprise
operations. Even though the age of the micro-entrepreneurs were not under test (hypothesized
as an influencing factor of mobile application adoption), it is still useful and contributive to this

70 | P a g e
study.
The questionnaire provided the micro-entrepreneurs with four age category and grouped them
according to (i) age 20 to 30; (ii) age 31 to 39; (iii) age 40 to 49; and lastly (iv) age 50 and
above. The aforementioned age grouping was intended to give a picture of the micro-
entrepreneurs in accordance too; young to middle aged micro-entrepreneurs; as well as more
senior micro-entrepreneurs. Furthermore, as shown in Table 5.1., most of the sample was under
the age 40. According to SEDA (2017) most small businesses in South Africa are operated by
individuals older than 40. Even though there has been a lot of traction for the age group 25-34
for small business start-ups, SEDA (2017) also state most small business start-up in recent
years are between the age group 25-34. Furthermore, in a study conducted by McCann and
Barlow (2015) it was observed that micro-entrepreneurs between the ages of 20 and 39 were
more tech savvy and seem to find it easier to integrate mobile applications towards achieving
their business objectives, more specifically the use of social media applications to promote
their business practices. This observation is in line with the sampled micro- entrepreneurs of
this study where the majority of the micro-entrepreneurs were under the age of 40 and active
users of the mentorship-movement application.
Table 5.1., Age categories of micro-entrepreneurs
Frequency
Percent
Valid Percent
Cumulative
Percent
Valid 20-30 107 49.3 49.3 49.3
31-39 71 32.7 32.7 82.0
40-49 33 15.2 15.2 97.2
above 50 6 2.8 2.8 100.0
Total 217 100.0 100.0
Table 5.2., illustrates the gender of the micro-entrepreneurs. From the table we can observe that
there is no dominant gender group, but rather a close mix of male and female, of which 110
(50.7%) were male and 107 (49.3%) were female. According to GEM South Africa (2018)
male entrepreneurs are still the dominant group of entrepreneurs in South Africa as there seem
to be more opportunity for male entrepreneurs. However, with the South African government
focus on encouraging more female entrepreneurs, it was observed that the ratio between male
and female entrepreneurs are closing, with a recent reported increase of 6 % increase of female

71 | P a g e
entrepreneurs (GEM South Africa, 218; Seed Academy, 2017). Also, observed by Seed
Academy (2017) the female representation of their sampled entrepreneurs shifted from 31% to
47%, which is indicative of more female entrepreneurship. This observation is also in line with
the sample group of micro-entrepreneurs, represents an almost even mix of male and female
micro-entrepreneurs.
Table 5.2., Gender of micro-entrepreneurs
Frequency
Percent
Valid Percent
Cumulative
Percent
Valid Male 110 50.7 50.7 50.7
Female 107 49.3 49.3 100.0
Total 217 100.0 100.0
5.5.2. Ethnicity
The micro-entrepreneurs were asked to state their ethnical denomination. As per Table 5.3.,
majority of the micro-entrepreneurs who utilized the mentorship application were Black
entrepreneurs (86.7%), followed by 5.1%White entrepreneurs, next 4.1% Indian entrepreneurs,
3.1 % Coloured entrepreneurs and lastly 1% of the entrepreneurs indicated other. The sampled
groups of micro-entrepreneurs are line with the report of SMME Quarterly (2018), that the
majority of small business owners in South Africa were black owned (reported at 74.9%),
followed by white owned businesses (17.3%), Coloured (3.9%) and Indian/Asian business
owners representing about 4% of the small business owner make-up in South Africa.
Table 5.3., Ethnicity classification
Frequency
Percent
Valid Percent
Cumulative
Percent
Valid White 15 6.9 6.9 6.9
Black 182 83.9 83.7 90.8
Coloured 10 4.6 4.6 95.4
Indian 6 2.8 2.8 98.2
Other 4 1.8 1.8 100.0
Total 217 100.0 100.0

72 | P a g e
5.5.3. Education level
The education level is considered a valuable determining factor of the micro-entrepreneurs
consideration of the enablement ability of mobile applications for business. The education level
of the micro-entrepreneurs as shown in Table 5.4., indicates that most of the sampled
entrepreneurs had Tertiary education, which is 81.6% of the sample. This indicates that the
sample of micro-entrepreneurs using the mentorship-movement application is well educated
with only 0.5% of the micro-entrepreneurs who have primary education. Also, what is
significant of the education level of the sampled micro-entrepreneurs are that the micro-
enterprise sector is synonymous with informal business practices and entrepreneurs that lacked
any form of Tertiary education and only operate businesses out of necessity. Even so, it is
encouraging to find a shift in the educational dynamic of micro-entrepreneurs, which could be
indicative that entrepreneurs place a value on education and entrepreneurship. According to
Seed Academy (2017, 2018), their survey of 1200 entrepreneurs, education, skill and networks
were identified as critical success factors to becoming more business savvy and having an
understanding that will enable small business success. It was also indicated that education need
to be more specific and focus on the practicalities of running a small business in South Africa
(Seed Academy, 2018). For this reason TVET colleges are now focused to address the
practicalities of entrepreneurship and the establishment of support cooperatives to develop
small businesses (SMME Quarterly, 2018; Seed Academy, 2018).
Table 5.4., Education level of micro-entrepreneurs
Frequency
Percent
Valid Percent
Cumulative
Percent
Valid Primary 1 .5 .5 .5
Secondary 37 17.1 17.2 17.7
Tertiary 177 81.6 82.3 100.0
Total 215 99.1 100.0
Missing System 2 .9
Total 217 100.0
5.5.4. Highest educational achievement
Further to indicating the education level, the micro-entrepreneurs were asked to expound on
their education level, by stating their highest educational achievement. As shown in Table 5.5.,

73 | P a g e
50.7% of the micro-entrepreneurs had either a diploma (30.0%) or a matric certificate (20.7%).
Of the remaining micro-entrepreneurs, 24.0% achieved a degree; 14.7% achieved an honours
degree, and 9.2% achieved a master’s degree. The data also revealed that about 1.4% of the
micro-entrepreneurs did not matriculate. According to SMME Quarterly (2018), there has been
a noticeable decline in entrepreneurs who have not completed matric, and that more recent
entrepreneurs are in possession of a diploma and have some form of tertiary education. This is
in line with the survey done by Seed Academy (2018) that entrepreneurs identify that education
is a critical success factor. Even though the micro-enterprise sector is synonymous with
unformal and unskilled entrepreneurs (Mahadea, 2012; Farrington, 2012; Herrington et al.,
204; Kyro, 2015), the sample of this study is in line with the recent educational observation
amongst entrepreneurs.
Table 5.5., Highest educational achievement of micro-entrepreneurs
Frequency
Percent
Valid Percent
Cumulative
Percent
Valid Did not matriculate 3 1.4 1.4 1.4
Matric 45 20.7 20.7 22.1
Diploma 65 30.0 30.0 52.1
Degree 52 24.0 24.0 76.0
Honours Degree 32 14.7 14.7 90.8
Masters Degree 20 9.2 9.2 100.0
Total 217 100.0 100.0
5.5.5. Experience using mentorship application
In addition to the demographic information, the micro-entrepreneurs were required to self-
report on their experience in using the mentorship-movement application. Experience as
described in chapter 3 (section 3.4), is proposed as a factor that could potentially influence the
micro-entrepreneurs intention to use other mobile applications to enable micro-enterprise
operations. Table 5.6., below provides an overview of the micro-entrepreneurs experience in
using the mentorship-movement application.

74 | P a g e
Table 5.6., Experience in using mentorship-movement application
Frequency
Percent
Valid Percent
Cumulative
Percent
Valid Less than 6 months 102 47.0 47.0 47.0
Between 6 and 12 months 82 37.8 37.8 84.8
More than a year 33 15.2 15.2 100.0
Total 217 100.0 100.0
In addition, the micro-entrepreneurs were required to indicate how often they make use of the
mentorship-movement application, as a means to observe the use behaviour they display in
adopting and using the mentorship-movement application in their micro-operations. According
to the data collected and illustrated in Table 5.7., majority (73.3%) of the micro-entrepreneurs
utilized the mentorship-movement application on a monthly basis, whilst the remaining 22.8%
of the micro-entrepreneurs indicated a more frequent use of the mentorship-movement
application. Also eleven of the micro-entrepreneurs did not indicate how frequently they have
used the mentorship-movement application, which could be indicative of a reluctance to use the
application.
Table 5.7., Frequency of use (mentorship-movement application)
Frequency
Percent
Valid Percent
Cumulative
Percent
Valid Daily 17 7.8 8.2 8.2
Weekly 30 13.8 14.6 22.8
Monthly 159 73.3 77.2 100.00
Total 206 94.9 100.0
Missing System 11 5.1
Total 217 100.0
5.5.6. Satisfaction using mentorship application
In addition to stating the level of experience, the micro-entrepreneurs were required to rate their
level of satisfaction they perceived the mentorship-movement application of being useful and
easy to use. Satisfaction as described in chapter 3 (section 3.4), was proposed as a factor that
would influence the micro-entrepreneurs intention to use other mobile application for their

75 | P a g e
micro-enterprise operations. Table 5.8.., illustrates the perceived level of satisfaction as
indicated by the micro-entrepreneurs in using the mentorship-movement application. Nearly the
majority of the micro-entrepreneurs (49%) indicated that they were neither satisfied nor
dissatisfied. By not outwardly expressing their satisfaction or dissatisfaction of the mentorship-
movement application, it can be taken that there is still room for development in improving the
overall experience and useful of the mentorship-movement application as perceived by the
micro- entrepreneurs. Of the remaining micro-entrepreneurs, 12% expressed their
dissatisfaction and the remaining 37% expressed their satisfaction in using the mentorship
application.
Table 5.8., Satisfaction using mentorship-movement application
Frequency
Percent
Valid Percent
Cumulative
Percent
Valid Satisfied 80 36.9 37.0 37.0
Neither Satisfied nor
Dissatisfied
105 48.4 48.6 85.6
Dissatisfied 31 14.3 14.4 100.0
Total 216 99.5 100.0
Missing System 1 .5
Total 217 100.0
5.6. Investigating normality and the Composite Constructs (UTAUT Model)
According to Field (2005) and McDonald (2014) the statistical techniques employed to test the
normality vary in sensitivity, which is largely influenced by the size of the data and therefore it
is recommended using the skewness and kurtosis as a means to evaluate normality. Hair et al.
(2006), Saunders et al. (2012) and McDonald (2014) describe normality as the shape of the data
distribution for an individual variable and its correlation to the normal distribution. Hair et al.
(2006) and Saunders et al. (2012) further state that (univariate) normality is an attribute that can
be tested and depicted graphically or statistically. The statistical aspect of univariate normality
can be verified by employing the Pearson’s skewness parameter, whilst the graphical feature
entails a visual check that compares the empirical data values with a distribution similar to the
normal distribution. According to McNeese (2016) and Hair et al. (2017, p. 61), a data
distribution that is fairly symmetrical is indicated by a skewness value that is between -0.5 and
0.5. McNeese (2016) and Hair et al. (2017, p. 61) further states that a moderately skewed data

76 | P a g e
distribution is indicated by a skewness value between -1 and – 0.5 or value that is between 0.5
and 1; a highly skewed data distribution, is however indicated by a skewness value that is less
than -1 or a skewness value that is greater than 1. According to Westfall (2014) the kurtosis
statistic describes the pooled weight of the tails in relation to the rest of the data distribution.
Westfall (2014) states a kurtosis value close to 0 is indicative of a normally distributed data set
and called mesokurtic distributions; a value less than 0 represents a light tailed distribution and
also called a platykurtic distribution; and lastly, a kurtosis value greater than 0 represents a
heavier tailed distribution and also called a leptokurtic distribution.
Considering the skewness of the data distribution (see Table 5.9.) for performance expectancy
(skewness = 1.264), effort expectancy (skewness = 1.281), behavioural intention (skewness =
1.807) and use behaviour (skewness = 1.424) is highly skewed. However, the data distribution
for social influence (skewness = .536) and facilitating conditions (skewness = .544) is
moderately skewed. Considering the kurtosis statistic as shown in Table 5.1., the kurtosis value
for each construct is greater than 0, which represents a heavier tailed data distribution or rather
a leptokurtic distribution.
Table 5.9., Range, mean and standard deviation of the dimensions (n = 217)
N
Range
Statistic
Minimum
Statistic
Maximum
Statistic
Mean
Statistic
Std.
Deviation
Statistic
Skewness
Statistic
Std. Error
Kurtosis
Statistic
Std. Error
Performance
Expectancy
217 4.00 1.00 5.00 1.6882 .68984 1.264 .165 2.596 .329
Effort
Expectancy
217 3.67 1.00 4.67 1.6452 .67170 1.281 .165 2.596 .329
Social Influence
217 4.00 1.00 5.00 2.1582 .78767 .536 .165 .782 .329
Facilitating Conditions
217 4.00 1.00 5.00 2.2750 .84539 .544 .165 .046 .329
Behaviour Intent
217 4.00 1.00 5.00 1.5929 .65475 1.807 .165 6.075 .329
Use Behaviour
217 4.00 1.00 5.00 1.8687 .83474 1.424 .165 2.890 .329
Valid N
(listwise)
217
Furthermore, the dimension scores of the UTAUT were calculated by averaging their related
elements, as displayed in Table 5.9. The mean score of the constructs were averaged; from 1
(strongly agree) to 5 (strongly disagree). Table 5.9., depicts that for Performance Expectancy
and Effort Expectancy the average responses of the micro-entrepreneurs were between the
strongly agree and agree Likert scale anchors; M = 1.6882 (SD = .68984) and M = 1.6452 (SD
= .67170) respectively.

77 | P a g e
However, Social Influence and Facilitating Conditions, the average responses of the micro-
entrepreneurs’ were between agree and undecided; M = 2.1585(SD = .78767) and M = 2.2750
(SD = .84539) respectively). Lastly, Behavioural Intention and Use Behaviour the average
responses of the micro-entrepreneurs’ were between strongly agree and agree; M = 1.5929 (SD
= .65475) and M = 1.8687 (SD = .83474) respectively.
The average responses for performance expectancy and effort expectancy is line with studies
conducted by McCann and Barlow (2015), Hislop et al. (2015), Kemp (2015) and Fischer and
Reuber (2011), that the use of social media applications and fairly easy to use. McCann and
Barlow (2015), Hislop et al. (2015), Kemp (2015) and Fischer and Reuber (2011) further state
that mobile applications like the social media applications enable entrepreneurs to engage with
clients and potential clients in a fairly quick and low-cost manner. Furthermore, the average
responses of strongly agree to agree of behavioural intention and use behaviour, are also
indicative that the sampled micro-entrepreneurs are likely to be tech savvy and familiar with
the use of mobile applications. This validates and aligns with the findings of Vatanasakdakul et
al. (2019) that micro entrepreneurs between the age of 20 and 39 are more familiar with
emerging mobile technologies and more open to integrate these technologies towards achieving
their business objectives.
Moreover, the average response of agree to undecided for social influence and facilitating
conditions could stem from the sample group of micro entrepreneurs being more tech savvy
and also more experimental to emerging technologies (Vatanasakdakul et al., 2019). Also, the
sampled micro-entrepreneurs are highly educated and therefore prone to use web applications
to research or more commonly, “How to” questions on the internet. According to Seed
Academy (2018), younger generation entrepreneurs often use the internet as a problem-solving
mechanism, as oppose to the older generation of entrepreneurs (those over the age of 40), who
rely more on their work and life experiences in their businesses. The average responses of the
micro-entrepreneurs, it therefore in line with current trends and other studies conducted with
the use of mobile application in business (Vatanasakdakul et al., 2019; Seed Academy, 2018;
McCann and Barlow (2015), Hislop et al. (2015), Kemp (2015).

78 | P a g e
5.7. Reliability Analysis
When determining how reliable the measure of research instrument is, the degree to which the
instrument free from any random errors, will determine how consistent and reliable the
measure is (Saunders et al. 2012; McDonald 2014). In this study, four independent variables
(performance expectancy; effort expectancy; social influence; facilitating conditions) and two
dependent variables (behavioural intention; use behaviour) were used in the questionnaire to
measure the constructs of the UTAUT model. The study further proposed two additional
independent variables to measure their influence on the behavioural intention to use other
mobile applications for business outcomes, as a result of the experience gained and perceived
level of satisfaction in using the mentorship-movement application (see section 3.4 in chapter
3). In order to demonstrate, a scale reliability analysis was conducted to evaluate the internal
consistency, in order to validate that the measurement groupings connotes the meaning of the
model constructs consistently and correctly.
According to Sekeran (2003), Al-Qeisi (2009) and Saunders et al. (2012) the internal
consistency reliability is a commonly used type of reliability in the Information Systems
domain. Kline (2005) and Lewis et al. (2013) states that the internal consistency measure of
reliability indicate that responses are consistent across variables within a single measure scale.
This study used Cronbach’s Alpha coefficient (calculated or based on the average inter-item
correlations) to measure the internal consistency. Straub (1989, p.151) argues that the higher
the correlations between the alternate measures or large Cronbach’s Alphas, the more reliable
the measure. Hinton et al. (2004), Al-Qeisi (2009) and Thomas et al. (2013) suggest that the
reliability of a measure can be grouped according to four measurement scales as illustrated in
Table 5.10., below;
Table 5.10., Cronbach Alpha measurement scale
Description Cronbach Alpha
Excellent 0.90 and above
High 0.70 to 0.89
High moderate 0.50 to 0.69
Low 0.49 and below
In a study by Straub et al. (2004) they observed and reported reliability scores above 0.70, of
which they conclude it to be an acceptable score for a confirmatory study. This observation was
supported by Pallant (2005), Al-Qeisi (2009) and Thomas et al. (2013) stating that any
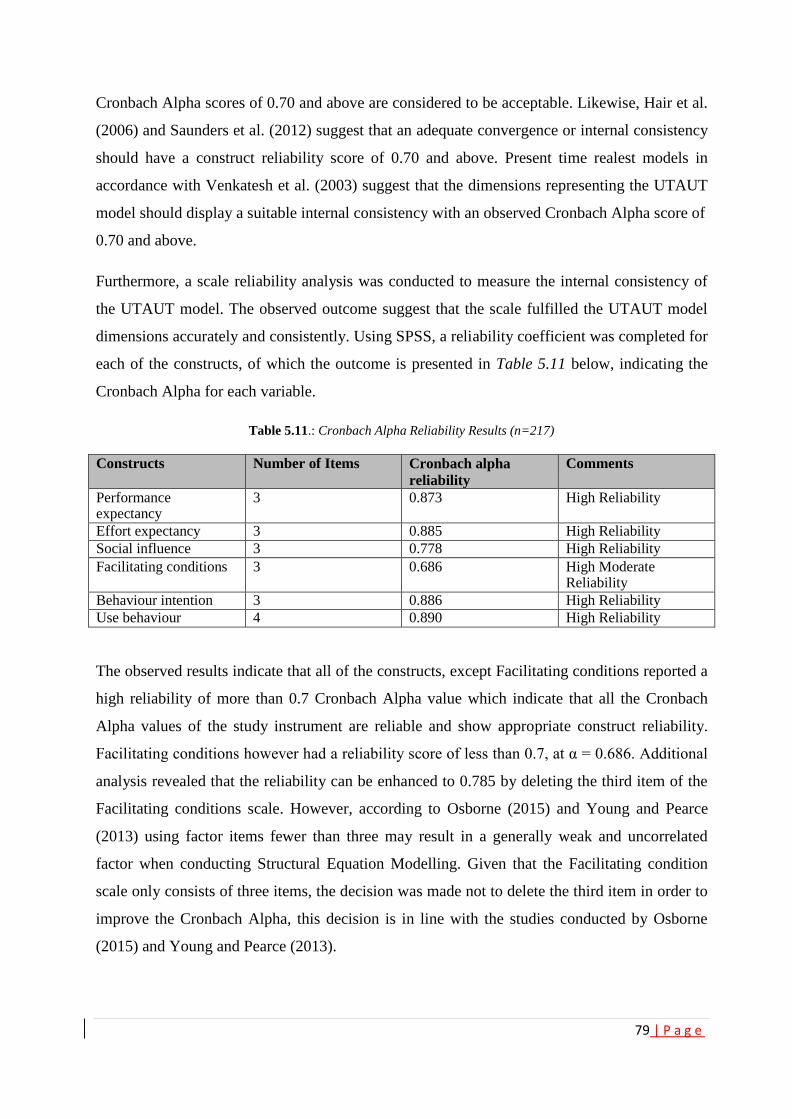
79 | P a g e
Cronbach Alpha scores of 0.70 and above are considered to be acceptable. Likewise, Hair et al.
(2006) and Saunders et al. (2012) suggest that an adequate convergence or internal consistency
should have a construct reliability score of 0.70 and above. Present time realest models in
accordance with Venkatesh et al. (2003) suggest that the dimensions representing the UTAUT
model should display a suitable internal consistency with an observed Cronbach Alpha score of
0.70 and above.
Furthermore, a scale reliability analysis was conducted to measure the internal consistency of
the UTAUT model. The observed outcome suggest that the scale fulfilled the UTAUT model
dimensions accurately and consistently. Using SPSS, a reliability coefficient was completed for
each of the constructs, of which the outcome is presented in Table 5.11 below, indicating the
Cronbach Alpha for each variable.
Table 5.11.: Cronbach Alpha Reliability Results (n=217)
Constructs Number of Items Cronbach alpha
reliability
Comments
Performance expectancy
3 0.873 High Reliability
Effort expectancy 3 0.885 High Reliability
Social influence 3 0.778 High Reliability
Facilitating conditions 3 0.686 High Moderate Reliability
Behaviour intention 3 0.886 High Reliability
Use behaviour 4 0.890 High Reliability
The observed results indicate that all of the constructs, except Facilitating conditions reported a
high reliability of more than 0.7 Cronbach Alpha value which indicate that all the Cronbach
Alpha values of the study instrument are reliable and show appropriate construct reliability.
Facilitating conditions however had a reliability score of less than 0.7, at α = 0.686. Additional
analysis revealed that the reliability can be enhanced to 0.785 by deleting the third item of the
Facilitating conditions scale. However, according to Osborne (2015) and Young and Pearce
(2013) using factor items fewer than three may result in a generally weak and uncorrelated
factor when conducting Structural Equation Modelling. Given that the Facilitating condition
scale only consists of three items, the decision was made not to delete the third item in order to
improve the Cronbach Alpha, this decision is in line with the studies conducted by Osborne
(2015) and Young and Pearce (2013).

80 | P a g e
5.8. Validity
The extent, to which the operational measure correlates with the theoretical concept under
study, is defined as construct validity. According to DeSimone et al. (2015), Lewis, et al.
(2013), Netemeyer et al. (2003), Turocy (2002) and Gable (1993) construct validity gives the
researcher the confidence that the research instrument accurately measures what it is supposed
to measure. Lewis, et al. (2013) and Turocy (2002) states that confirmatory factor analysis is
commonly associated with construct validity and therefore considered as one of the analytical
tools to evaluate construct validity. According to Gable (1993, p.108) confirmatory factor
analysis can be used to “examine empirically the interrelationships among the items and to
identify clusters of items that share sufficient variation to justify their existence as a factor or
construct to be measured by the instrument”. In this study, confirmatory factor analysis (CFA)
was used to examine the convergent and discriminant validity of the measurement scales.
5.8.1. Confirmatory Factor Analysis
According to Byrne (2001), Costello and Osborne (2005) and Field (2009) confirmatory factor
analysis (CFA) is used to test the multidimensionality and the factorial validity of the
theoretical model. Bhattacherjee and Premkumar (2004) and Hair et al. (2009) argue that
confirmatory factor analysis is best suited for studies with pre-validated measurement scales, as
in this study. Byrne (2001) and Field (2009) state, confirmatory factor analysis (CFA) is the
degree to which the hypothesized model matches or passably explains the data under analysis.
Likewise, Barker (2004), Al-Qeisi (2009) and Planning (2014) describe confirmatory factor
analysis as the study of the relationships between a group of observed variables and a group of
continuous latent variables. Furthermore, Weitzner et al (1997) state that confirmatory factor
analysis is used to determine or compare “the goodness of fit” between an already validated
model (that of another researcher) to that of a model or the collected research data of a study
that is currently under test. Chin and Todd (1995), Baglin (2014) and Planning (2014) suggest
that confirmatory factor analysis is method frequently used when analysing latent variables,
and also now a common application when analysing complex Information Systems concepts
(Baglin 2014; Planning 2014; DeSimone et al. 2015).
Primarily, this study aimed to determine the relationships between the dimensions of the
UTAUT model, as well as the overall fit of the hypothesized model, which will be discussed in
the next subsequent sections. Section 5.7.2., provide an overview of the assessment criteria of
the measurement model, whilst section 5.7.3., details the measurement model results and

81 | P a g e
outcome.
5.8.2. Assessment criteria of the measurement model
According to Hair et al (2006), Hosmer, et al. (2013) and Osborne (2015), the measurement
model evaluates the relationship between the latent variables and their observed variables. The
measurement model for this study was evaluated by using the Chi-square (χ2) statistics, degree
of freedom (df), and the significance level (p-value). In addition, Comparative Fit Index (CFI),
the Root Mean Sqaure Error of Approximation (RMSEA), Standardised Root Mean Square
Residual (SRMR), Tucker Lewis Index (TLI), Akaike Information Criteria (AIC), Bayesian
Information Criteria (BIC), and the relative Chi-square (χ2/df) tests were utilized to assess the
measurement model. According to Hair et al. (2006), Hosmer, et al. (2013) and Osborne
(2015), when assessing the model fit, the Chi squared statistics together with the RMSEA, and
an incremental index, like CFI is sufficient when informing whether the measurement model is
of a good fit. Hu and Bentler (1999), Tabachnick Fidell (2007), Al-Qeisi (2009) and Baglin
(2014) state that a model is only considered a good fit when the CFI value is above 0.90.
Brown and Cudeck (1993), Costello and Osborne (2005), Field (2009) and Planning (2014),
however argue that a model with a RMSEA value less than 0.05 is a good fit, and a value less
than 0.08 is considered a reasonable fit, and a model with an RMSEA less than 0.10 is
considered a poor fit. According to Kline (2005) the Root Mean Residual (RMR) and the
Standardised Root Mean Residual (SRMR) are the square root differences concerning the
samples of the covariance matrix and the hypothesized covariance model. Kline (2005) further
argues that the RMR is founded on the measurement scales of a construct, and increases the
difficulty to interpret, if each construct on a questionnaire have varying scale levels. For this
reason, the SMRM solve the issue of varying scales and therefore more meaningful to interpret
(Kline, 2005; Diamantopoulos & Siguaw, 2000). According to Byrne (1998), Diamantopoulos
& Siguaw (2000) and Kline (2005), a SMRM value of 0.05 or less indicates a good fit, a value
of 0.08 indicates a reasonable fit and anything above 0.08 indicates a poor fit. Also the
Akaike Information Criteria (AIC) and the Bayesian Information Criteria (BIC) were used to
evaluate the model fit during which the number of estimated factors were finalized (Konishi et
al. 2008; Vrieze 2012). Konishi et al. (2008) and Vrieze (2012) further argue that in the process
of model selection, the model with the lowest AIC and BIC is chosen as the preferred and
likely authentic model. According to Hu and Bentler (1998), Tabachnick and Fidell (2007), Al-
Qeisi (2009) and Baglin (2014) a small chi-square (χ2 ) value in relation to the degrees of
freedom (values less than 3) is indicative of a good model fit. Moreover, Byrne (2001) and
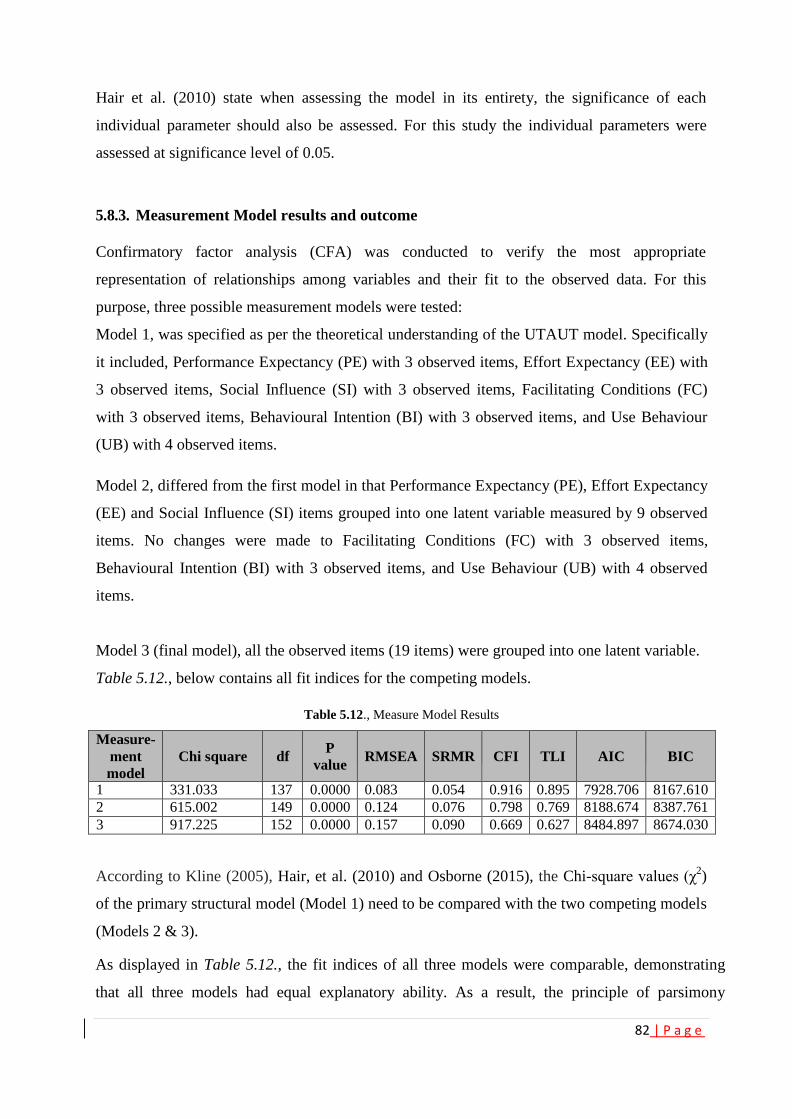
82 | P a g e
Hair et al. (2010) state when assessing the model in its entirety, the significance of each
individual parameter should also be assessed. For this study the individual parameters were
assessed at significance level of 0.05.
5.8.3. Measurement Model results and outcome
Confirmatory factor analysis (CFA) was conducted to verify the most appropriate
representation of relationships among variables and their fit to the observed data. For this
purpose, three possible measurement models were tested:
Model 1, was specified as per the theoretical understanding of the UTAUT model. Specifically
it included, Performance Expectancy (PE) with 3 observed items, Effort Expectancy (EE) with
3 observed items, Social Influence (SI) with 3 observed items, Facilitating Conditions (FC)
with 3 observed items, Behavioural Intention (BI) with 3 observed items, and Use Behaviour
(UB) with 4 observed items.
Model 2, differed from the first model in that Performance Expectancy (PE), Effort Expectancy
(EE) and Social Influence (SI) items grouped into one latent variable measured by 9 observed
items. No changes were made to Facilitating Conditions (FC) with 3 observed items,
Behavioural Intention (BI) with 3 observed items, and Use Behaviour (UB) with 4 observed
items.
Model 3 (final model), all the observed items (19 items) were grouped into one latent variable.
Table 5.12., below contains all fit indices for the competing models.
Table 5.12., Measure Model Results
Measure-
ment
model
Chi square
df P
value
RMSEA
SRMR
CFI
TLI
AIC
BIC
1 331.033 137 0.0000 0.083 0.054 0.916 0.895 7928.706 8167.610
2 615.002 149 0.0000 0.124 0.076 0.798 0.769 8188.674 8387.761
3 917.225 152 0.0000 0.157 0.090 0.669 0.627 8484.897 8674.030
According to Kline (2005), Hair, et al. (2010) and Osborne (2015), the Chi-square values (χ2)
of the primary structural model (Model 1) need to be compared with the two competing models
(Models 2 & 3).
As displayed in Table 5.12., the fit indices of all three models were comparable, demonstrating
that all three models had equal explanatory ability. As a result, the principle of parsimony
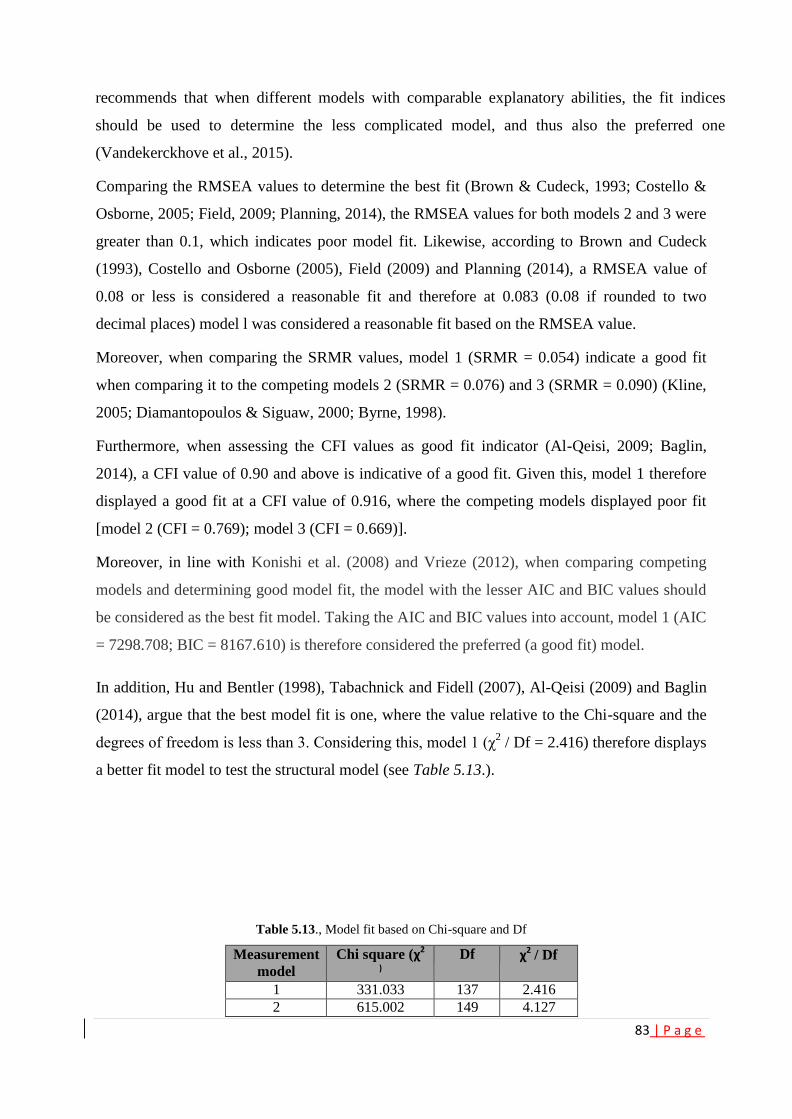
83 | P a g e
recommends that when different models with comparable explanatory abilities, the fit indices
should be used to determine the less complicated model, and thus also the preferred one
(Vandekerckhove et al., 2015).
Comparing the RMSEA values to determine the best fit (Brown & Cudeck, 1993; Costello &
Osborne, 2005; Field, 2009; Planning, 2014), the RMSEA values for both models 2 and 3 were
greater than 0.1, which indicates poor model fit. Likewise, according to Brown and Cudeck
(1993), Costello and Osborne (2005), Field (2009) and Planning (2014), a RMSEA value of
0.08 or less is considered a reasonable fit and therefore at 0.083 (0.08 if rounded to two
decimal places) model l was considered a reasonable fit based on the RMSEA value.
Moreover, when comparing the SRMR values, model 1 (SRMR = 0.054) indicate a good fit
when comparing it to the competing models 2 (SRMR = 0.076) and 3 (SRMR = 0.090) (Kline,
2005; Diamantopoulos & Siguaw, 2000; Byrne, 1998).
Furthermore, when assessing the CFI values as good fit indicator (Al-Qeisi, 2009; Baglin,
2014), a CFI value of 0.90 and above is indicative of a good fit. Given this, model 1 therefore
displayed a good fit at a CFI value of 0.916, where the competing models displayed poor fit
[model 2 (CFI = 0.769); model 3 (CFI = 0.669)].
Moreover, in line with Konishi et al. (2008) and Vrieze (2012), when comparing competing
models and determining good model fit, the model with the lesser AIC and BIC values should
be considered as the best fit model. Taking the AIC and BIC values into account, model 1 (AIC
= 7298.708; BIC = 8167.610) is therefore considered the preferred (a good fit) model.
In addition, Hu and Bentler (1998), Tabachnick and Fidell (2007), Al-Qeisi (2009) and Baglin
(2014), argue that the best model fit is one, where the value relative to the Chi-square and the
degrees of freedom is less than 3. Considering this, model 1 (χ2 / Df = 2.416) therefore displays
a better fit model to test the structural model (see Table 5.13.).
Table 5.13., Model fit based on Chi-square and Df
Measurement
model
Chi square (χ2 )
Df χ2 / Df
1 331.033 137 2.416
2 615.002 149 4.127
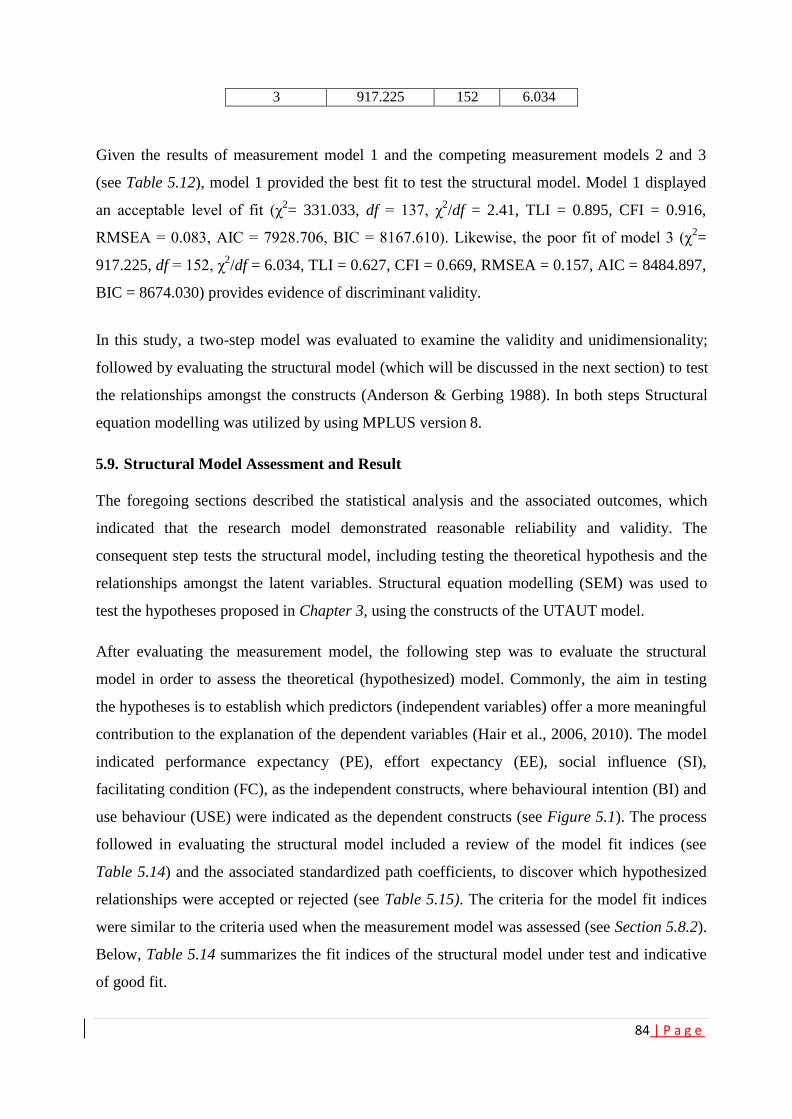
84 | P a g e
3 917.225 152 6.034
Given the results of measurement model 1 and the competing measurement models 2 and 3
(see Table 5.12), model 1 provided the best fit to test the structural model. Model 1 displayed
an acceptable level of fit (χ2= 331.033, df = 137, χ
2/df = 2.41, TLI = 0.895, CFI = 0.916,
RMSEA = 0.083, AIC = 7928.706, BIC = 8167.610). Likewise, the poor fit of model 3 (χ2=
917.225, df = 152, χ2/df = 6.034, TLI = 0.627, CFI = 0.669, RMSEA = 0.157, AIC = 8484.897,
BIC = 8674.030) provides evidence of discriminant validity.
In this study, a two-step model was evaluated to examine the validity and unidimensionality;
followed by evaluating the structural model (which will be discussed in the next section) to test
the relationships amongst the constructs (Anderson & Gerbing 1988). In both steps Structural
equation modelling was utilized by using MPLUS version 8.
5.9. Structural Model Assessment and Result
The foregoing sections described the statistical analysis and the associated outcomes, which
indicated that the research model demonstrated reasonable reliability and validity. The
consequent step tests the structural model, including testing the theoretical hypothesis and the
relationships amongst the latent variables. Structural equation modelling (SEM) was used to
test the hypotheses proposed in Chapter 3, using the constructs of the UTAUT model.
After evaluating the measurement model, the following step was to evaluate the structural
model in order to assess the theoretical (hypothesized) model. Commonly, the aim in testing
the hypotheses is to establish which predictors (independent variables) offer a more meaningful
contribution to the explanation of the dependent variables (Hair et al., 2006, 2010). The model
indicated performance expectancy (PE), effort expectancy (EE), social influence (SI),
facilitating condition (FC), as the independent constructs, where behavioural intention (BI) and
use behaviour (USE) were indicated as the dependent constructs (see Figure 5.1). The process
followed in evaluating the structural model included a review of the model fit indices (see
Table 5.14) and the associated standardized path coefficients, to discover which hypothesized
relationships were accepted or rejected (see Table 5.15). The criteria for the model fit indices
were similar to the criteria used when the measurement model was assessed (see Section 5.8.2).
Below, Table 5.14 summarizes the fit indices of the structural model under test and indicative
of good fit.
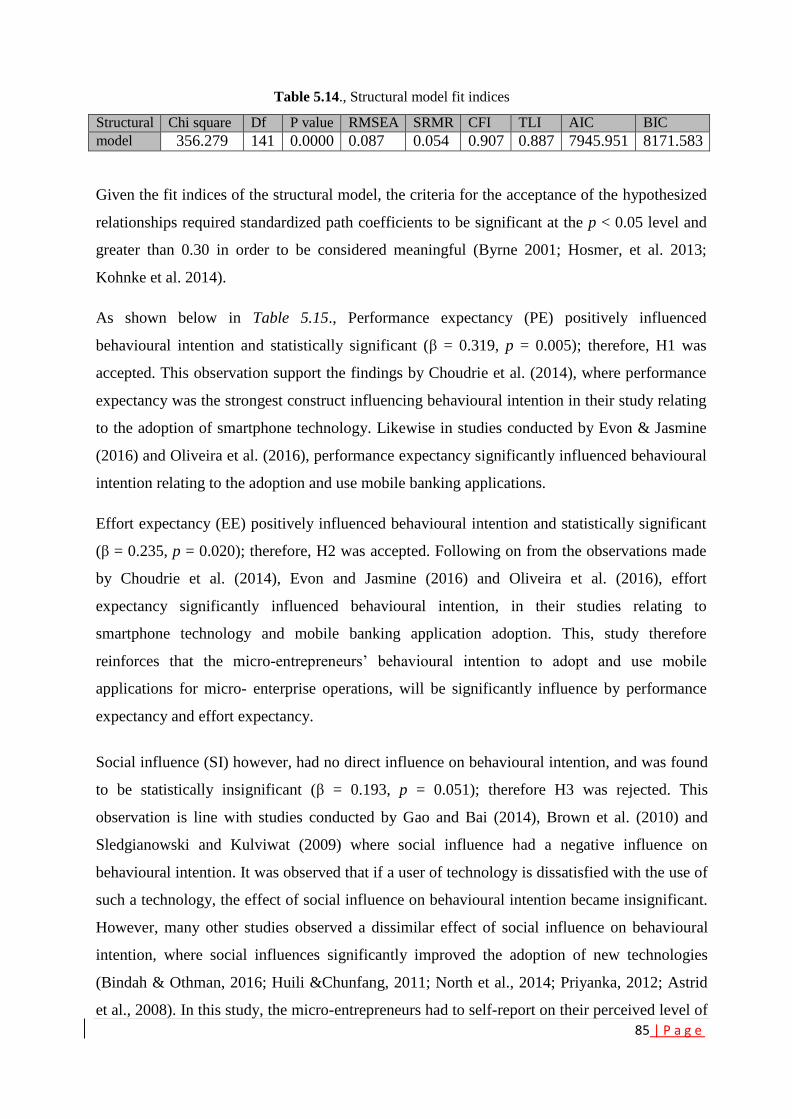
85 | P a g e
Table 5.14., Structural model fit indices
Structural Chi square Df P value RMSEA SRMR CFI TLI AIC BIC
model 356.279 141 0.0000 0.087 0.054 0.907 0.887 7945.951 8171.583
Given the fit indices of the structural model, the criteria for the acceptance of the hypothesized
relationships required standardized path coefficients to be significant at the p < 0.05 level and
greater than 0.30 in order to be considered meaningful (Byrne 2001; Hosmer, et al. 2013;
Kohnke et al. 2014).
As shown below in Table 5.15., Performance expectancy (PE) positively influenced
behavioural intention and statistically significant (β = 0.319, p = 0.005); therefore, H1 was
accepted. This observation support the findings by Choudrie et al. (2014), where performance
expectancy was the strongest construct influencing behavioural intention in their study relating
to the adoption of smartphone technology. Likewise in studies conducted by Evon & Jasmine
(2016) and Oliveira et al. (2016), performance expectancy significantly influenced behavioural
intention relating to the adoption and use mobile banking applications.
Effort expectancy (EE) positively influenced behavioural intention and statistically significant
(β = 0.235, p = 0.020); therefore, H2 was accepted. Following on from the observations made
by Choudrie et al. (2014), Evon and Jasmine (2016) and Oliveira et al. (2016), effort
expectancy significantly influenced behavioural intention, in their studies relating to
smartphone technology and mobile banking application adoption. This, study therefore
reinforces that the micro-entrepreneurs’ behavioural intention to adopt and use mobile
applications for micro- enterprise operations, will be significantly influence by performance
expectancy and effort expectancy.
Social influence (SI) however, had no direct influence on behavioural intention, and was found
to be statistically insignificant (β = 0.193, p = 0.051); therefore H3 was rejected. This
observation is line with studies conducted by Gao and Bai (2014), Brown et al. (2010) and
Sledgianowski and Kulviwat (2009) where social influence had a negative influence on
behavioural intention. It was observed that if a user of technology is dissatisfied with the use of
such a technology, the effect of social influence on behavioural intention became insignificant.
However, many other studies observed a dissimilar effect of social influence on behavioural
intention, where social influences significantly improved the adoption of new technologies
(Bindah & Othman, 2016; Huili &Chunfang, 2011; North et al., 2014; Priyanka, 2012; Astrid
et al., 2008). In this study, the micro-entrepreneurs had to self-report on their perceived level of
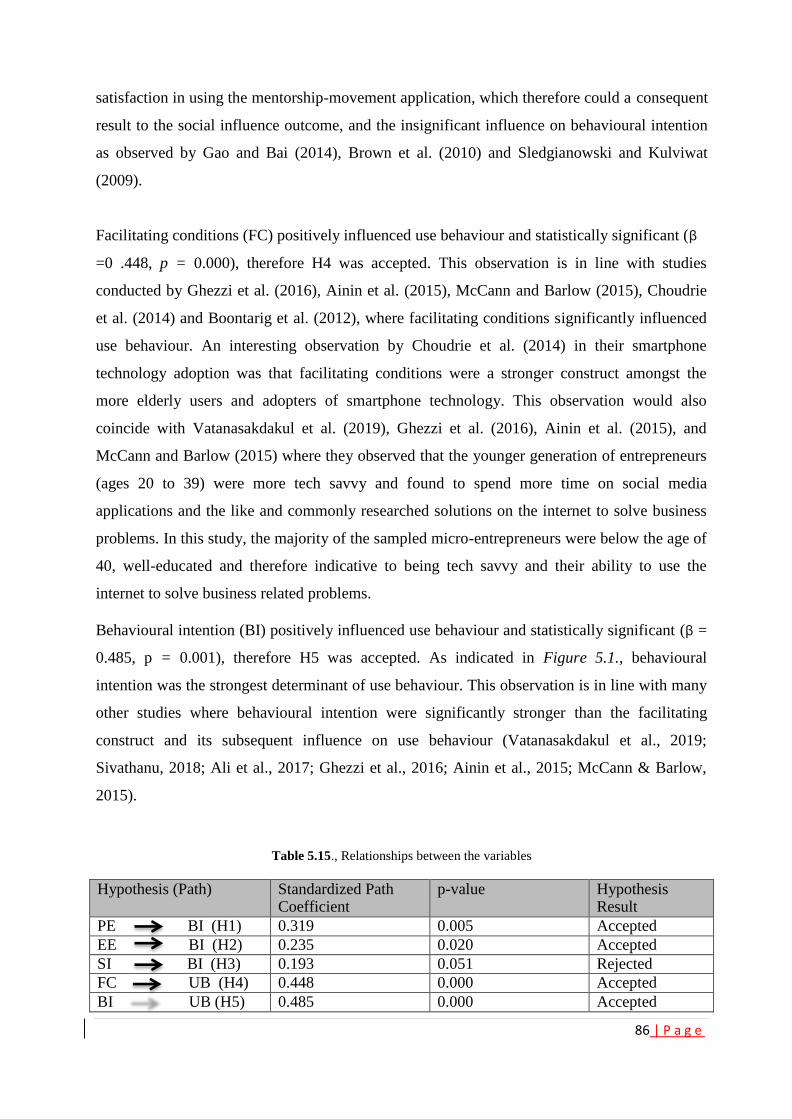
86 | P a g e
satisfaction in using the mentorship-movement application, which therefore could a consequent
result to the social influence outcome, and the insignificant influence on behavioural intention
as observed by Gao and Bai (2014), Brown et al. (2010) and Sledgianowski and Kulviwat
(2009).
Facilitating conditions (FC) positively influenced use behaviour and statistically significant (β
=0 .448, p = 0.000), therefore H4 was accepted. This observation is in line with studies
conducted by Ghezzi et al. (2016), Ainin et al. (2015), McCann and Barlow (2015), Choudrie
et al. (2014) and Boontarig et al. (2012), where facilitating conditions significantly influenced
use behaviour. An interesting observation by Choudrie et al. (2014) in their smartphone
technology adoption was that facilitating conditions were a stronger construct amongst the
more elderly users and adopters of smartphone technology. This observation would also
coincide with Vatanasakdakul et al. (2019), Ghezzi et al. (2016), Ainin et al. (2015), and
McCann and Barlow (2015) where they observed that the younger generation of entrepreneurs
(ages 20 to 39) were more tech savvy and found to spend more time on social media
applications and the like and commonly researched solutions on the internet to solve business
problems. In this study, the majority of the sampled micro-entrepreneurs were below the age of
40, well-educated and therefore indicative to being tech savvy and their ability to use the
internet to solve business related problems.
Behavioural intention (BI) positively influenced use behaviour and statistically significant (β =
0.485, p = 0.001), therefore H5 was accepted. As indicated in Figure 5.1., behavioural
intention was the strongest determinant of use behaviour. This observation is in line with many
other studies where behavioural intention were significantly stronger than the facilitating
construct and its subsequent influence on use behaviour (Vatanasakdakul et al., 2019;
Sivathanu, 2018; Ali et al., 2017; Ghezzi et al., 2016; Ainin et al., 2015; McCann & Barlow,
2015).
Table 5.15., Relationships between the variables
Hypothesis (Path) Standardized Path Coefficient
p-value Hypothesis Result
PE BI (H1) 0.319 0.005 Accepted
EE BI (H2) 0.235 0.020 Accepted
SI BI (H3) 0.193 0.051 Rejected
FC UB (H4) 0.448 0.000 Accepted
BI UB (H5) 0.485 0.000 Accepted
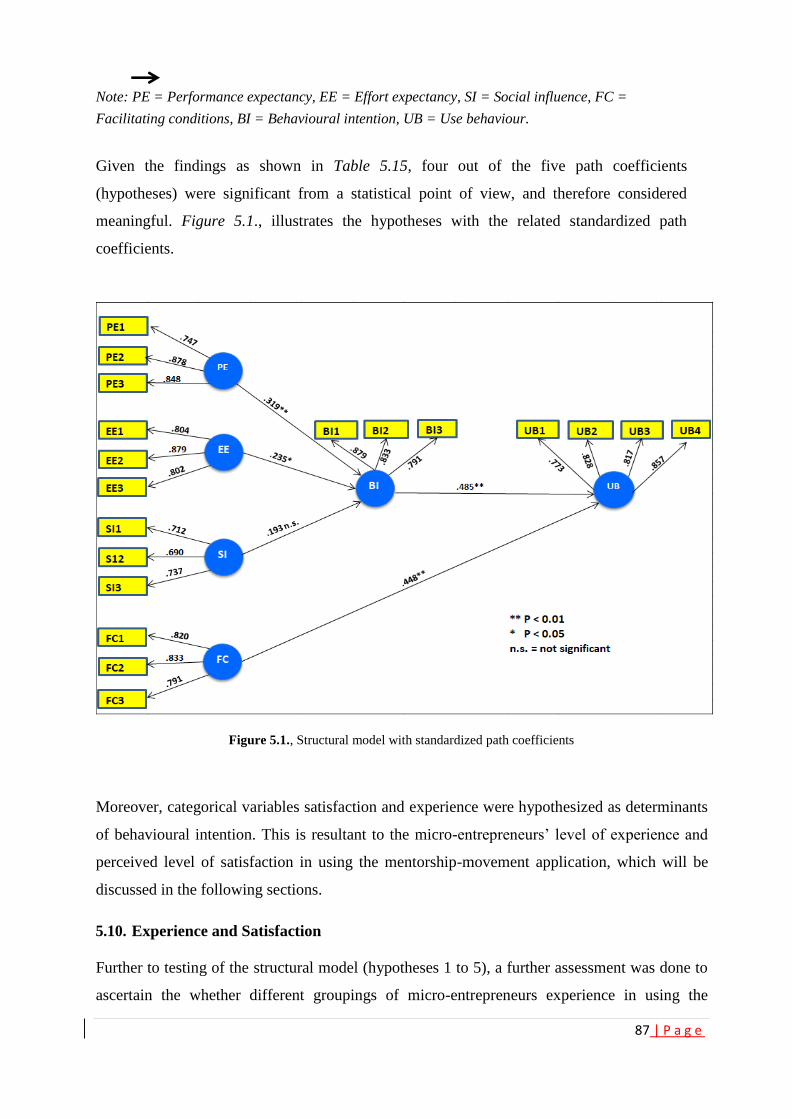
87 | P a g e
Note: PE = Performance expectancy, EE = Effort expectancy, SI = Social influence, FC =
Facilitating conditions, BI = Behavioural intention, UB = Use behaviour.
Given the findings as shown in Table 5.15, four out of the five path coefficients
(hypotheses) were significant from a statistical point of view, and therefore considered
meaningful. Figure 5.1., illustrates the hypotheses with the related standardized path
coefficients.
Figure 5.1., Structural model with standardized path coefficients
Moreover, categorical variables satisfaction and experience were hypothesized as determinants
of behavioural intention. This is resultant to the micro-entrepreneurs’ level of experience and
perceived level of satisfaction in using the mentorship-movement application, which will be
discussed in the following sections.
5.10. Experience and Satisfaction
Further to testing of the structural model (hypotheses 1 to 5), a further assessment was done to
ascertain the whether different groupings of micro-entrepreneurs experience in using the

88 | P a g e
mentorship-movement application as well their perceived level of satisfaction in using the
mentorship-movement application explained any significant differences. Experience and
Satisfaction was hypothesized as possible influencers of behavioural intention. According to
Al-Shafi and Weerakkody (2010) and De Silva, Ratnadiwakara and Zainudeen (2013), the
experience and satisfaction in using one mobile application increases the likelihood or rather
the adoption and use of other mobile applications. This analysis was done using the One-Way
ANOVA (see Tables 5.16 and 5.17).
5.10.1. Experience (Hypothesis 6)
The micro-entrepreneurs were required to self-report their experience level (familiarity) in
using the mentorship-movement application. This hypothesis was formulated and in line with
the study conducted by Cho et al. (2013), De Silva et al. (2013), Alfawareh and Jusoh (2014),
and Islam (2017) that the more familiar the micro-entrepreneurs are in using the mentorship-
application the more likely their behavioural intention would be influence to use and adopt
mobile applications for business outcomes.
When analysing the relationship between the experience in using the mentorship-movement
application and behavioural intention, no significant influence was observed. As shown in
Table 5.16., below, the difference in the mean scores for the different groups is small.
Table 5.16., Experience in relation to Behavioural Intention
Furthermore, the outcome of the results as shown in Table 5.17 implies an insignificant
difference between experience and behavioural intention. The observed p-Value is 0.692,
which is greater than the threshold value of 0.05, meaning that experience gained in using the
mentorship-movement application explains no significant difference in the micro-entrepreneurs
behavioural intention to use other mobile applications for business outcomes. As a result,
hypothesis 6 was rejected.

89 | P a g e
Table 5.17 Experience vs Behavioural Intention
5.10.2. Satisfaction (Hypothesis 7)
In this part of the analysis, the micro-entrepreneurs were required to rate the satisfaction level
they perceive in using the mentorship-movement application. This hypothesis was formulated
and in line with the study conducted by Dovaliene et al. (2015), Hsiao et al. (2016) and Islam
(2017), that the perceived level of satisfaction in using a mobile application, like in this case,
the mentorship-application, the behavioural intention of the micro-entrepreneurs would be
influence to use and adopt other mobile applications for business outcomes based on the
perceived level of satisfaction they attached to using the mentorship-movement application.
When analysing the relationship between the perceived level of satisfaction in using the
mentorship-movement application and behavioural intention, the outcome as shown in Table
5.18., implies that no significant difference is explained between satisfaction and behavioural
intention. The observed P-Value is 0.274, which is greater than the threshold value of 0.05,
means that the perceived degree of satisfaction the micro-entrepreneurs attached to using the
mentorship-movement application has no significant influence on the behavioural intention to
use other mobile applications for business outcomes. As a result, hypothesis 7 was rejected.
Table 5.18., Satisfaction vs Behavioural Intention
While the relationship between satisfaction and behavioural intention tested as insignificant,
other researchers (Astrid et al., 2008; Chauvin et al., 2012; Muzari et al., 2012; Kiseol &
Forney, 2013) have found satisfaction as a direct influencer of behavioural intention and
therefore this finding is in opposition to previous findings.

90 | P a g e
5.11. Chapter Summary
This chapter offered a descriptive data analysis of the survey data, in order to delve into the
attributes of the micro-entrepreneurs who are using the mentorship-movement application.
Furthermore, a summary of the survey research, described the screening process of the
collected data, and also depicting a demographic exploration of the micro-entrepreneurs. In
addition, the demographic exploration indicated that the collected data was also uninhibited
from univariate and multivariate outliers, which lead to the next phase of analysis, which
included Confirmatory Factor Analysis, and Structural Equation Modelling. Moreover, the
demographic information of micro-entrepreneurs was also presented according to gender, age,
education level, and highest educational achievement. Other attributes that was also
incorporated in this section, was the micro-entrepreneurs’ experience in using the mentorship-
movement application as well as their perceived level of satisfaction in using the application.
The experience and satisfaction attributes were included as they were considered factors
influencing the adoption of mobile applications for micro-enterprise operations.
Also, the method and outcomes of the measurement scale analysis, in respect of the evaluation
of the reliability and validity of the UTAUT model, through the use of and Confirmatory Factor
Analysis methods were presented. The reliability showed that the measure items were reliable,
as shown by the high Cronbach’s alpha values for each construct. Thereafter, a Confirmatory
Factor Analysis method was used to reveal discriminant validity by evaluating the
measurement and structural model.
Furthermore, this chapter also presented a summary of the Structural Equation Modeling
(SEM) method, which was used to examine the theoretical model. The two main Structural
Equation Modeling modules were evaluated, which is the measurement model and the
structural model in order to test the UTAUT model. A series of data analysis enabled the
completion of the hypotheses tests and summarizing the hypotheses that were evaluated in the
Structural Equation Modeling analysis. The result of the Structural Equation Modeling analysis
offered a more stronger statistical confirmation that the micro-entrepreneurs’ behavioural
intention (BI) and use behaviour (UB) of mobile application adoption and use for their micro-
enterprise operations were positively influenced by performance expectancy (PE), effort
expectancy (EE), and facilitating conditions (FC). Also, it was discovered that social influence
(SI) did not significantly affect the micro-entrepreneurs’ behavioural intention (BI) and use
behaviour (USE) of mobile application adoption and use for business. Moreover, the outcome

91 | P a g e
of the Structural Equation Modeling analysis has provided reasonable answers to the research
questions. In addition to the structural model, the relationship of the categorical variables,
experience and satisfaction was examined in relation to behavioural intention, by using the
One-Way ANOVA. In this study, both categorical variables were found to have an insignificant
influence on behavioural intention and therefore rejected as influencing factors of mobile
application adoption for micro-enterprise operations.

92 | P a g e
Chapter 6: Conclusion
6.1. Introduction
This final chapter of this study revisits the research question, and objectives. It provides an
assessment of the extent to which they have been responded to. The key findings are
summarized and suggestions are made for future studies, and in respect of how the findings
may be applied to enhance how the adoption and use of ICTs, more specifically mobile
technologies amongst entrepreneurs in the micro-enterprise sector. The pervasiveness of mobile
technologies enables the micro-entrepreneurs to more efficiently integrate ICTs towards their
business objectives. Be that as it may, studies concerning the adoption and use of mobile
technologies confirm reluctance in the use of such technologies to advance business practices
(Tambotoh et al., 2017; Cant et al., 2015; Singh, 2010). This study, through the use of the
UTAUT model investigated the factors influencing the adoption and use of mobile applications
for micro-enterprise operations. As a result, this study contributes to extant literature in
understanding the factors influencing the adoption and use of technology.
The chapter is organized as follows: Section 6.2 offers an overall summation of the research
hypotheses and its notable observations. Section 6.3 offers the theoretical and practical
contributions of the study, which include suggested approaches to increase the adoption of
mobile applications for micro-enterprise operations in South Africa. Section 6.4 considers the
limitations of the study, whilst Section 6.5 suggests study sections that may require further
research. The final section of this chapter will conclude by giving a summary of this chapter.
6.2. Research Summary and Conclusion
This study concerns the factors influencing the adoption and use of mobile applications for micro-
enterprise operations in South Africa. The study was motivated by an observed or rather under-
whelming use of mobile applications for business outcomes amongst micro- entrepreneurs (as
detailed in section 1.3 of chapter 1). The objective of the study was to investigate and determine
the factors influencing mobile application adoption and use for business, to determine how these
factors influence micro-entrepreneurs’ intention to adopt mobile applications for their operational
use, as well as to determine if the use of a common mobile application influences their intention to
use and their subsequent use behaviour of other mobile applications for micro-enterprise
operations.
93 | P a g e
What are the factors influencing the adoption of mobile applications for micro-enterprise
operations?
In order to deal with the objectives of this study, it was essential to firstly review the literature to
identify pertinent variables to formulate a conceptual framework. Although there are numerous
models and frameworks to investigate technology adoption, the UTAUT model was selected as
it presented the study, with the best fit to investigate the factors influencing the adoption of
mobile applications for micro-enterprise operations. The UTAUT model has been applied in
several studies in the area of mobile technology adoption (Sivanthanu, 2018; Ali et al., 2017).
The UTAUT model, consist of four main constructs (performance expectancy, effort
expectancy, social influence and facilitating conditions) that is useful to explain and predict
behavioural intention and use behaviour of users of technology (Venkatesh et al., 2003). These
constructs were used to determine the factors influencing the adoption of mobile applications
for business outcomes, amongst a delineated group of micro-entrepreneurs.
Given the objectives the study, a set of hypotheses were formulated in line with the literature to
investigate and answer the research questions. Through the use of a survey questionnaire, the
constructs of the UTAUT model were empirically tested, analyzed, and then making inferences
that relate to the sampled micro-entrepreneurs. These micro-entrepreneurs are all users of the
mentorship-movement application, which is an online mobile application to support and
develop entrepreneurship in South Africa. The online questionnaire was distributed to 809
micro-entrepreneurs of which 217 fully completed the questionnaire.
6.2.1. Research Question One
The constructs of the UTAUT model concerning the factors influencing the adoption of mobile
applications for micro-enterprise operations are discussed below.
6.2.1.1. Performance Expectancy (PE)
In this study, performance expectancy was used to measure the degree to which the micro-
entrepreneurs believe that mobile applications will improve the effectiveness of the operational
capabilities of the micro-enterprise. Operational capabilities include, but not limited to,
improving customer and supplier engagements, improving the quality of the services they offer,

94 | P a g e
saving them on time as well as money. The research finding validates the hypothesis H1, which
affirms that the micro-entrepreneurs behavioural intention (BI) to use mobile applications for
micro-operations is directly influenced by performance expectancy (PE). The outcome of
performance expectancy (PE) in relation to behavioural intention (BI) was significant and
therefore indicates the micro-entrepreneurs intention to use other mobile applications for
business. This means that if the micro-entrepreneurs believe that the tasks and activities of their
micro-operations will improve, they are far more likely to adopt and use other mobile
applications towards achieving desired business outcomes. The observed outcome that
performance expectancy (PE) positively influence behavioural intention (BI) is in line with
many other previous studies (Van der Vaart, Atema, & Evers 2016, Arman & Hartati 2015;
BenMessaoud et al. 2011; Phichitchaisopa & Naenna 2013; Zhou et al. 2010; Al-Qeisi 2009;
Venkatesh et al., 2012; Venkatesh et al. 2003).
6.2.1.2. Effort Expectancy (EE)
Effort expectancy (EE) was used to measure the degree to which the micro-entrepreneurs
believe that the use of mobile applications are easy learn, easy to use in their micro-operations,
and in general that mobile applications are easy to use. The research finding validates the
hypothesis H2, which affirms that the micro-entrepreneurs behavioural intention (BI) to use
other mobile applications for micro-operations is directly influenced by effort expectancy (EE).
The outcome of effort expectancy (EE) in relation to behavioural intention (BI) was significant
and therefore indicates that the perceived level of difficulty or ease of use of mobile
applications will influence the micro-entrepreneurs intention to adopt and use other mobile
applications for businesses. This could also be further translated that the micro-entrepreneurs
would be more inclined to make use of a less complicated mobile application, one that will
place a lesser demand on their time and ability to accomplish any given task or transaction.
Shareef et al. (2017), Ozturk et al. (2016) and Alalwan et al. (2014), state that users of mobile
applications tend to feel more connected to mobile applications that are convenient and easy to
use, making them more inclined to adopt and use such mobile applications. This observation
was further supported and line with many other previous studies that effort expectancy (EE)
positively influences behavioural intention (BI) (Arman & Hartati 2015; Phichitchaisopa &
Naenna 2013; Venkatesh et al., 2012; Birth & Irvine 2009; Helaiel 2009; Chang et al. 2007;
Venkatesh et al. 2003).
6.2.1.3. Social Influence (SI)
95 | P a g e
Social influence (SI) was used to measure the degree to which others are able to bear influence
on the micro-entrepreneurs decision to adopt and use mobile applications for business
outcomes. The study outcome however revealed that social influence has an insignificant
influence on the behavioural intention of the micro-entrepreneurs decision to adopt and use
other mobile applications for business outcomes. As a result, hypothesis H3 was rejected. What
is interesting is that the preferences and beliefs of society have a tendency to change the views
and opinions of others (Rana et al., 2015; Alsheikh & Bojei, 2014) and expected social
influence to significantly influence the behavioural intention of the micro-entrepreneurs. Such
an observation would then have been in line with many other studies supporting the significant
influence of social influence on behavioural intention (Chin & Lin, 2018; Rana et al., 2015;
Alsheikh & Bojei, 2015; Bennani & Oumlil 2013; Phichitchaisopa & Naenna 2013; Chang et
al. 2007; Venkatesh & Davis, 2000; Venkatesh et al. 2003). Yang et al. (2013) and Hsu and Lu
(2004) argue that the adoption of technology to a great extent depends on social influence, just
as much as on the individual belief. With that in mind, the observed outcome can therefore be
translated that family, peers and society in general have no direct effect on the micro-
entrepreneurs decision to adopt and integrate other mobile applications within their businesses.
Given that the typical setting of businesses within the micro-enterprise sector are informal and
mostly operate within rural areas (Tambotoh et al. 2017; Chimucheka 2013; Malefane 2013;
Tsoabisi 2012), the educational level of the sampled micro-entrepreneurs are uncommon to
what you would expect from other micro-entrepreneurs that are typical to this sector (Liedholm
et al. 2013). Could it be, that the education level and the mere fact that the sampled micro-
entrepreneurs are participants in an online mentoring programme decreases the influence their
immediate society have on their decisions to adopt and use mobile applications for business?
Although, it could be merely circumstantial and just the opinion of the author, such an
assumption requires further investigation.
6.2.1.4. Facilitating Conditions (FC)
Facilitating conditions (FC) was used to measure the degree to which the micro-entrepreneurs
believe that the technical infrastructure, resources and support exist for the implementation of
mobile application in micro-business operations. The study outcome revealed that facilitating
conditions (FC) have a significant and direct influence on the micro-entrepreneurs use
behaviour (UB) of mobile applications for micro-operations. The outcome therefore supports
the hypothesis (H4) that facilitating conditions (FC) directly influences the subsequent use

96 | P a g e
behaviour (UB) of the micro-entrepreneurs to continue using mobile applications for business.
From a South African perspective, facilitating conditions (FC) would include, but are not
limited to, ICT infrastructure, broadband connectivity that is both accessible and affordable, the
availability of technical support services, the cost of mobile data and any other support
initiatives that will enable the micro-entrepreneurs to adopt and use mobile applications for
micro-operations. This outcome is therefore in line with several previous studies, advocating
better facilitating conditions, both from a technological and human aspect, to increase the
adoption and use of mobile applications for micro-operations (Kohnke et al. 2014; Lakhal et al.
2013; Zhou et al. 2010; Jong & Wang 2009; Al-Qeisi 2009; Helaiel, 2009; Hung et al. 2006;
Shea et al. 2005; Venkatesh et al. 2003).
6.2.1.5. Behavioural Intention (BI)
Behavioural intention (BI) was used to measure the likelihood that the micro-entrepreneurs will
make use of other mobile applications for their micro-enterprise operations. The study revealed
that behavioural intention (BI) has a highly significant influence on use behaviour (UB),
meaning that behavioural intention (BI) is more likely to predict the micro-entrepreneurs
intention to use and their subsequent use of mobile application for micro-operations. The
outcome therefore supports the hypothesis (H5) which states, behavioural intention (BI)
directly influences the use behaviour (UB) of the micro-entrepreneurs to use mobile
applications for business. Furthermore, this outcome is in line with several previous studies,
supporting behavioural intention as a direct determinant of use behaviour (Arman & Hartati
2015; Kohnke et al. 2014; Lakhal et al. 2013; Zhou 2011; Jong & Wang 2009; Al-Qeisi 2009;
Helaiel, 2009; Hung et al. 2006; Shea et al. 2005; Venkatesh et al. 2003).From the predictors of
behavioural intention (BI), performance expectancy (PE) and effort expectancy (EE) explained
a bigger proportion of the variance in behavioural intention. Venkatesh et al. (2003) describes
both constructs (performance expectancy and effort expectancy) as the users’ view of how
technology will improve their job performance and the level of difficulty or simplicity in using
such a technology. Social Influence on the other hand considers the views of others in relation
to whether or not a technology should be used or not (Venkatesh et al., 2013). Seeing that the
observation of this study revealed social influence to be an insignificant predictor of
behavioural intention, it can be further translated that the micro-entrepreneurs’ behavioural
intention to adopt and use other mobile applications for business outcomes, are more
influenced by their own experiences or views, oppose to what others believe.

97 | P a g e
Does the use of mobile mentoring applications influence the adoption of mobile applications
for micro-enterprise operations?
6.2.2. Research Question Two
Given that most micro-enterprise start-ups have not been as successful and of great concern to
local and national government agencies, numerous initiatives have been strategically used to
address challenges that prohibit micro-enterprise development (SEDA 2017, 2018; Seed
Academy, 2018). Amongst these initiatives were partnerships with private and public business
advisory agencies and mentors to support and develop entrepreneurs in the micro-enterprise
(SEDA, 2017). This in its own right presented some problems as accessibility and geographical
constraints to these support cooperatives influenced the pace at which the entrepreneurial skill-
set would be developed (PGM, 2018). Given the pervasiveness of mobile technologies, mobile
applications are therefore seen as the most practical medium that would enable mass
entrepreneurial development (Hew et al., 2015; Hislop et al., 2015; Islam, 2017).
Recognizing that mobile applications are the most feasible medium to mass entrepreneurial
development, the concept of online mentoring have not yet been fully explored in South Africa
(National Mentorship Movement, 2015). Mentoring applications facilitate engagements that
cross any geographical boundaries and allow the micro-entrepreneurs to make skill based
decisions on demand as a result of the online mentor-mentee relationship (Duff 2002; Muller &
Barsion 2003; O’Neil & Murphy, 2010 and NMM, 2015). Therefore understanding the impact
of using a mentoring application on the subsequent adoption and use of other mobile
applications for business is useful to the advancement micro-entrepreneurial success through
the appropriate use of mobile applications (Knouse 2001; Single & Muller, 2001 and O’Neil &
Murphy 2010).
For this reason, experience (EXP) and satisfaction (SATISF) was proposed as a determinant of
behavioural intention. The sampled micro-entrepreneurs were users of an online mentoring
application of the National Mentorship Movement and therefore their experience in using the
mentorship-movement application as well as the degree to which they are satisfied in using the
application, was proposed to measure the micro-entrepreneurs behavioural intention to adopt and
98 | P a g e
use other mobile applications for business outcomes, as a result of the experience and satisfaction
in using the mentorship-movement application.
6.2.2.1. Experience (EXP)
Experience was initially described by Venkatesh et al. (2003) as the degree to which an
individual is influenced or socially pressured to make use of a technology, suggesting that if the
user lacks experience in using a technology, that he or she is likely to be influenced by the most
dominant social pressures. Venkatesh et al. (2003) further argues that the more experience is
gained in using technology, the more insignificant support structures becomes and the
influence of social pressures on the intention to use technology and the subsequent use
behaviour. Therefore, experience was used as an indicator of the micro-entrepreneurs
experience level in using mobile applications, through the use of the mentorship-movement
application. The micro-entrepreneurs having to indicate how long they have been using the
mentorship-movement application would therefore be an indication that with time they are
more comfortable using mobile applications. The study outcome however revealed that
different categories of experience (EXP) did not explain significant differences in behavioural
intention (BI) and therefore does not impact the micro-entrepreneurs intention to make use of
mobile applications for business. This finding therefore rejects the hypothesis (H6) which states
that the experience gained in using the mentorship-movement application will directly
influence the micro-entrepreneurs behavioural intention to make use of other mobile
applications in their micro-enterprise operations. Furthermore, this finding is contradictory to
previous studies advocating experience as a determinant of behavioural intention (De Silva et
al. 2013; Al-Shafi &Weerakkody 2010; Seymour et al. 2007; Venkatesh et al. 2003).
As previously mentioned the majority of the micro-entrepreneurs are below the age of 40 and
are more likely to be tech savvy and more familiar with emerging technologies and the use of
mobile applications (Vatanasakdakul et al., 2019). For this reason, the experience gained in
using the mentorship-movement application has an insignificant influence on their behavioural
intention to use other mobile application for business, as majority of the micro-entrepreneurs
could be considered intermediate users of mobile applications, seeing the popularity of mobile
applications like Facebook, WhatsApp, etc.
6.2.2.2. Satisfaction (SATISF)
Satisfaction has been described as the degree to which the users of mobile technologies are

99 | P a g e
satisfied or dissatisfied (Dey & Hakkila 2008; Cho, Chiu, Ho & Lee 2013). Cho et al. (2013)
states that user satisfaction can be described by the usefulness of mobile applications, the
perceived level of enjoyment in using mobile applications, internet speed, and thus anything
that the users associate with the use of mobile applications. Cho et al. (2013), Alfawareh and
Jusoh (2014), and Islam (2017) argue that the degree to which user satisfaction was realized,
the behavioural intention to make use of such a mobile application will be influenced.
Therefore satisfaction (SATISF) was used to measure the degree to which the micro-
entrepreneurs were satisfied in using the mentorship-movement application. It was
hypothesized that Satisfaction (SATISF) will influence micro-entrepreneurs’ behavioural
intention (BI) to make use of other mobile applications for business. The study outcome
revealed that different categories of satisfaction (SATISF) did not explain significant
differences in behavioural intention (BI) and as a result, rejected hypothesis (H7). This
outcome is therefore dissimilar to several previous studies confirming user satisfaction as a
direct determinant of behavioural intention (Islam 2017; Hsiao et al. 2016; Dovaliene et al.
2015; Calvo-Porral and Levy-Mangin 2015; Cho et al. 2013; Dey & Hakkila 2008).
Given that both experience and satisfaction had an insignificant influence on behavioural
intention, one could infer that the mentorship-movement application did not live up to the
micro-entrepreneurs expectation of a mobile application. Social media application use are quite
common amongst the micro-entrepreneurs and the mentorship-movement application might
have been compared to what the micro-entrepreneurs are typically familiar with when it comes
to mobile application use. Having registered and used the mentorship-movement application as
part of this study, my user-experience was that it was too static and lacked the engagement
capability and interaction, like more dynamic social media applications like Facebook or
WhatsApp. Information on how to develop your business from scratch are easily accessible on
the internet and left me feeling that mentorship-movement application should have been more a
resource for on demand business solutions. Interaction with mentors and mentees were limited
and therefore like the other micro-entrepreneurs expected more. For these reasons it is possible
that the hypothesis was rejected, as other micro-entrepreneurs could possibly share the same
sentiments.
6.3. Theoretical contributions
Given the extant literature available on mobile application adoption and use in South Africa,
this is the first study to use the UTAUT model to investigate the factors influencing the

100 | P a g e
adoption and use of mobile applications for micro-enterprise operations. All the constructs of
the UTAUT model showed a satisfactory level of reliability and discriminant validity, which
was confirmed by testing the measurement model against two competing models, which then
formed the basis of the structural model as a result of the satisfactory fit indices. These results
promote the use of the UTAUT model as a good predictor of the intention to adopt and use
mobile applications for micro-enterprise operations. This reinforces other previous studies
using the UTAUT model to investigate mobile application adoption and use (Evon & Jasmine,
2016; Choudrie et al., 2014; Attuquayefio & Addo, 2014; Alshehri, 2013; Cohen et al., 2013).
Furthermore, experience (EXP) and satisfaction (SATISF) were proposed as independent
variables explaining significant differences of the UTAUT construct behavioural intention (BI).
Moreover, the study confirmed that both experience (EXP) and satisfaction (SATISF) did not
explain significant differences on behavioural intention (BI), and therefore rejected these
variables as determinants of behavioural intention. The study, therefore offer insights through
the use of the UTAUT model, to improve mobile application adoption amongst micro-
entrepreneurs in South Africa, by isolating and recognizing the key factors influencing mobile
application adoption and use for business outcomes.
6.4. Practical contributions
The findings of the study are also of value to governmental support cooperatives, mobile
application developers and those who enforce of ICT policy, both private and public. The
empirical investigation of this study is of value to improving mobile-application adoption and
use in the micro-enterprise sector. For example, the individual perception or view when it
comes to adopting mobile applications is a more stronger predictor of their behavioural
intention to adopt and use mobile applications, than the opinions of others (social influences).
Furthermore, the study offers a thorough analysis of the factors influencing mobile application
adoption and use from the view of a delineated group of micro-entrepreneurs who utilize
mobile applications within their micro-operations. As a result, mobile technology adoption and
use within the small, medium and micro-enterprise sector in South Africa can be improved
through the utilization of the UTAUT model.
Moreover, the study offers a deeper insight to the key factors influencing the intention to use
mobile applications as well as the subsequent use behaviour of mobile application for micro-
operations, based on the exploration and examination of the survey research and a delineated

101 | P a g e
group of micro-entrepreneurs. The outcome of the study is useful in that it can inform
governmental initiatives promoting sectorial mobile technology adoption and solve or rather
close the gap of a known reluctance in using technology for grow and develop small, medium
and more specifically micro-enterprise businesses. Based on the study data, the key concepts to
improve the adoption of mobile applications amongst micro-entrepreneurs would include the
following;
Performance Expectancy and Effort Expectancy, as these concepts were observed as direct
determinants of Behavioural Intention. The study further observed that Facilitating conditions
and Behavioural Intention were both direct determinants of Use Behaviour and therefore key
factors to improve the adoption of mobile applications, and the subsequent use thereof. With
that in mind, one can deduct that if mobile applications for micro-enterprise operations enable a
multi-level engagement and everyday use capability, it will increase the adoption and
subsequent use of mobile applications.
Table 6.1., Checklist for Mobile Application Adoption
CHECK-LIST : MOBILE APPLICATION ADOPTION
Adoption factor
Perfo
rm
an
ce
Ex
pecta
ncy Mobile applications must add value, it must be practical and useful
Mobile applications need to enhance the effectiveness of the enterprise
Eff
ort
Ex
pecta
ncy
Mobile applications must be easy to use
Mobile applications must be easy to learn
Mobile applications must be understandable, free from any overcomplicated designs
and features
Fa
cili
tati
ng
Co
nd
itio
ns Enable on-demand help and support
Mobile application use should be cost-effective and data intensive
Use
Beh
avio
ur Applications should be for daily consumption
Enable easy engagement with clients and service providers
Although, the above concepts might seem common and supportive to the literature reviewed, it
still is relevant as indicated by the group of micro-entrepreneurs surveyed. Therefore, when
considering the implementation or rather a mobile application adoption strategy the check list
above could be useful to improve a mobile application adoption strategy for micro-enterprise

102 | P a g e
operations.
6.5. Limitations and Directions for Future Research
Common to many studies, there were several limitations, even though the findings of this study
proved noteworthy in relation to the investigation of, and the rationale for a proposing an
amendment to the UTAUT model to further understand the adoption and use of mobile
applications for micro-enterprise operations. In spite of this, the study was limited by the fact
that this study was a single cross-sectional study; and also limited number by the number of
groups of micro-entrepreneurs participating in the study. Nonetheless, the noted limitations
could however offer direction for future research, as described below.
Firstly, a cross-sectional study was necessary to allow for the amount of time allocated
conducting the study. The literature however indicated that a number of UTAUT studies were
longitudinal studies, which enabled the collection of data at different stages in time to assess
behavioural intention (BI) and use behaviour (UB) at the given time periods in order to observe
any change in behavioural intention and use behaviour (Alaiad & Zhou 2014; Bennani &
Oumlil 2013; Devolder et al. 2012; Alawadhi & Morris 2008; Schaper & Pervan 2004, 2007;
Venkatesh et al. 2003; Venkatesh & Davis 2000). As previously stated, the study was a cross-
sectional study which means the data was collected at a single point in time, as a result
behavioural intention (BI) and use behaviour (UB) of mobile applications for micro-enterprise
operations was only assessed once, thus discarding a change in these variables over time.
However, this approach of a cross-sectional study was in line with other previous studies, also
indicated in the literature like Van der Vaart et al. (2016), Arman and Hartati (2015),
Phichitchaisopa and Naenna (2013) and BenMessaoud et al. (2011).
Furthermore, for the adoption and use of mobile applications for micro-enterprise operations, it
is advisable to investigate the adoption and use mobile applications over various stages in time,
in order to assess the change in the micro-entrepreneurs behavioural intention and use
behaviour of mobile application for their micro-operations (Alaiad & Zhou 2014; Bennani &
Oumlil 2013; Devolder et al. 2012; Venkatesh et al. 2003; Venkatesh & Davis 2000). Therefore
a longitudinal study, as a suggestion for future research offer an even more deeper understanding
of the essential factors of the UTAUT model, over and above the influences on behavioural
intention which will deepen the understanding of the relationship of the behavioural intention and
use behaviour of mobile applications for micro-enterprise operations in South Africa.

103 | P a g e
Secondly, a delineated group of micro-entrepreneurs were used, all whom have registered with
the National Mentorship Movement and therefore might not be representative of entrepreneurs
within the micro-enterprise sector in South Africa. One of the objectives of the study was to
determine, if the experience gained and the perceived level of satisfaction in using mobile
applications (in this case, the mentorship-movement application) will influence the micro-
entrepreneurs behavioural intention to make use of other mobile applications for business
outcomes. The micro-enterprise sector is inhibited with an array of informal businesses and
might not be fully aware of organizations like the National Mentorship Movement. Partnering
with the National Mentorship Movement, presented the study with easier access to a number of
micro-entrepreneurs, therefore discounting valuable input of those who do not have access to
organizations like the National Mentorship movement and other support cooperatives. With
this in mind, conducting the study with a number of target groups of micro-entrepreneurs
would have presented a high degree of difficulty and effort in communicating to various
groups, cost, collecting data and the availability of each participant. In spite of this, partnering
with the National Mentorship Movement proved to be successful, as the desired aims and
objectives of the study were attained. For this reason, it is therefore recommended that future
research to be more inclusive and representative of the micro-enterprise sector, mobile
application developers, support cooperatives and policy makers in order to further delve into
the factors influencing the adoption and use of mobile applications for micro-enterprise
operations. As a final point, only quantitative data was collected, and therefore might overlook
valuable insights from learning the essential factors influencing the adoption of mobile
application for micro-enterprise operations, through the collection of data that is more
qualitative in nature.
Lastly, given the geographical consideration of this study (micro-enterprise sector in South
Africa) and the aforementioned limitations, a number of opportunities are offered for additional
research, by expanding the UTAUT model to include several other concepts that might be of
relevance to the micro-enterprise sector. An interesting finding of this study was the low
significance of social influence on behavioural intention, which was contradictory to some
studies who advocated the significant influence of social influence on behavioural intention.
South Africa is a culture diverse country with a social dynamic influence; however the finding
revealed that the micro-entrepreneurs decision to adopt and use mobile applications for
business is independent of the micro-entrepreneurs relationship with family, mentors and

104 | P a g e
society in general. For that reason, future research could address the insignificant impact of
social influences on the adoption and use of mobile applications and use for micro-enterprise
operations. Also, seeing that South Africa is culture rich, future research could also investigate
and include other concepts in the UTAUT model, for example, the culture richness of the
micro-entrepreneurs and their mobile application use and adoption, the economic status of the
micro-entrepreneurs and the influence on mobile application adoption and use, and also the
general awareness of the micro-entrepreneurs of the benefits associated with the adoption and
use of mobile applications for micro-enterprise operations. As a final point, future research
should be inclusive of both qualitative and quantitative data (broader scope of micro-
entrepreneurs) in order to offer more content insights of the micro-entrepreneurs when it
comes to the adoption and use of mobile applications for business.
6.6. Chapter Summary
The outcome of the study was summarized according to the research questions of this study.
Furthermore, this chapter presented theoretical and practical contributions that might valuable
to other researchers. In addition, the limitations of the study as well as recommendations for
further research were also depicted. Also the study addressed a concept in an environment that
is progressive and constantly evolving, and therefore the findings of this study offer valuable
insight about the adoption and use of mobile applications for micro-enterprise operations in
South Africa and for other developing countries like South Africa.

105 | P a g e
References
AbuShanab, E, Pearson J 2007, ‘Internet banking in Jordan: The unified theory of acceptance and use of
technology (UTAUT) perspective’, Journal of Systems and Information Technology Volume: 9 Issue: 1
2007
Adams, J., Khan, H.T.A, Raeside, R. and White, D. 2007, Research Methods for Graduate Business and
Social Science Students. Sage Publications Inc. New Delhi, India.
Ainin, S., Parveen, F., Moghavvemi, S., Jaafar, N. I., and Mohd Shuib, N. L. 2015. Factors influencing
the use of social media by SMEs and its performance outcomes, Industrial Management & Data
Systems (115:3), pp. 570-588.
Agarwal, R 2000, ‘Individual acceptance of information technologies’. Framing the domains of IT
management: Projecting the future through the past, 2000: p. 85-104.
Ahmedova, S. 2015, Factors for increasing the competitiveness of small and medium-sized enterprises
(SMEs) in Bulgaria. Procedia-Social and Behavioural Sciences, 195, 1104-1112
Ahuja, M., & Thatcher, J 2005, “Moving beyond intentions and toward the theory of trying: Effects of
work environment and gender on post-adoption information technology use”, MIS Quarterly, 29, 427–
459.
Ajzen, I 1985, ‘From intentions to actions: A theory of planned behaviour’. In J. Kuhl & J. Beckmann
(Eds.), Action control: From cognition to behaviour. Berlin, Heidelberg, New York: Springer-Verlag.
(pp. 11-39).
Ajzen, I 1991, ‘The theory of planned behaviour’, Organizational Behaviour and Human Decision
Processes, 50, 179-211.
Alalwan, A., Dwivedi, Y., & Williams, M., 2014. Examining factors affecting customer intention and
adoption of internet banking in Jordan. UK Academy for Information Systems Conference Proceedings.
Alam, S. S., & Noor, M. K. M. 2009, “ICT Adoption in Small and Medium Enterprises: An Empirical
Evidence of Service Sectors in Malaysia”, International Journal of Business and Management, 4(2),
112.
Aliyu, A., Bello, M., Kasim, R., & Martin, D. 2014, Positivist and Non-Positivist Paradigm in Social
Science Research: Conflicting Paradigms or Perfect Partners? Journal of Management and
Sustainability, 4(3), 79–94.
Alfawareh, H. M., and Jusoh, S. 2014, Smartphones usage among university students: najran university
case. International Journal of Academic Research, 6(2), 321-326.
Ali, A., Yogesh K., Dwivedi, R., 2017. Factors Influencing Adoption of Mobile Banking by Jordanian
Bank Customers. International Journal of Information Management: 37 (13), 99-110.
Al-Qeisi, K. 2009, Analysing the Use of UTAUT Model in Explaining an Online Behaviour: Internet
Banking Adoption. Brunel University. Retrieved from http://core.ac.uk/download/pdf/336207.pdf
Alshehri, M., Drew, S., AlGhamdi, R. 2012, ‘Analysis of Citizens’ Acceptance for E-Government
Services: Applying the UTAUT Model’. School of ICT, Griffith University, Brisbane, Australia.
106 | P a g e
Alsheikh, L., & Bojei, J., 2014. Determinants affecting customer’s intention to adopt mobile banking in
Saudi Arabia. International Arab Journal of e-Technology, 3(4), 210–219.
Aker, J. & Mbiti, I. 2010, ‘Mobile phones and economic development in Africa’, The Journal of
Economic Perspectives, 24(3), 207-232.
Anderson, J., Schwager, P., & Kerns, R. 2006, The drivers for acceptance of tablet PCs by faculty in a
college of business. Journal of Information Systems Education, 17(4), 429-440
Antonelli, A., Ravarini, A., & Tagliavini, M. 2001, An evaluation model for electronic commerce
activities within SMEs. Information Technology and Management, 2, 211-230.
Audretsch, D 2014, ‘Small Business and Entrepreneurship: The Emergence of a Scholarly Field’. 20
years of Entrepreneurship Research, pp 49.
Ardjouman, D. 2014, Factors Influencing Small and Medium Enterprises (SMEs) in Adoption and Use
of Technology in Cote d’Ivoire. International Journal of Business and Management, 9(8), 179–190.
Arendt, L. 2008, Barriers to ICT adoption in SMEs: how to bridge the digital divide. Journal of Systems
and Information Technology, 10(2), 93-108.
Asongu, S. 2013, Mobile banking and Mobile Phone Penetration: Which is more? African Governance
and Development Institute. Retrieved from ftp://ftp.repec.org/opt/ReDIF/RePEc/agd/agd-
wpaper/Mobile-and-thepoor.Pdf
Astrid, D., Mitra, A., & David, M., 2008. The role of perceived enjoyment and social norm in the
adoption of technology with network externalities. European Journal of Information Systems, 17(1), 4–
11.
Atif, A. & Richards, D. 2012, Estimating Non-Response Bias in a Web-based Survey of Technology
Acceptance: A Case Study of Unit Guide Information Systems. Greelong, 23rd Australasian Conference
on Information Systems.
Attuquayefio, S. N., & Addo, H. 2014, Using the UTAUT model to analyse students' ICT adoption.
International Journal of Education and Development using Information and Communication
Technology, 10(3), 75.
Babbie, E. and Mouton, J. 2010, The Practice of Social Research. 10th Edition, Republic of South
Africa, Oxford University Press Southern Africa, Cape Town.
Baglin, J., 2014, Improving Your Exploratory Factor Analysis for Ordinal Data: A Demonstration
Using FACTOR. Practical Assessment, Research & Evaluation, 19(5), pp. 1-15.
Bagozzi, R.P. 2007, The legacy of the Technology Acceptance Model and a proposal for a paradigm
shift. Journal of the Association for Information Systems, 8(4):244-254.
Bagozzi, R & Lee, K 2002,’Multiple routes for social influence: The role of compliance, internalization,
and social identity’. Social Psychology Quarterly, 65(3): 226–247.
Bagozzi, R.P., Davis, F.D. & Warshaw, P.R. 1992, Development and test of a theory of technological
learning and usage. Human Relations, 47(7):659-686.
Baker, F. B. 2004, Item response theory: Parameter estimation techniques. New York: Marcel Dekker

107 | P a g e
Baliamoune, Mina N. 2002, “The New Economy and Developing Countries: Assessing the Role of ICT
Diffusion.” August.
Banda, F., Matumba, C. & Mondliwa, P. 2015, Competition, barriers to entry and inclusive growth:
Soweto Gold Case Study. Centre for Competition, Regulation and Economic Development. University
of Johannesburg.
Bandura, A 1986, ‘Social foundations of thought and action: Asocial cognitive theory’. Englewood
Cliffs, NJ: Prentice Hall
Barbosa, S., Gerhardt, M., & Kickul, J 2007, ‘The role of cognitive style and risk preference on
entrepreneurial self-efficacy and entrepreneurial intentions’, Journal of Leadership & Organizational
Studies, 13(4), 86–104.
Barbra-Sanchev, V., Martinez-Ruiz, M.P., & Jimenez-Zarco, A.I. 2007, Drivers, benefits and challenges
of ICT adoption by SMEs: A literature review. Problems and Perspectives in Management, 5(1), 103.
Barki, H., & Hartwick, J 1994, “Measuring user participation, user involvement, and user attitude”, MIS
Quarterly, 18, 59–82.
Baron, R 2006, ‘Opportunity recognition as pattern recognition: How entrepreneurs “connect the dots”
to identify new business opportunities.’ The Academy of Management Perspectives, 20(1), 104-119.
Basgoze, P. 2015, Integration of Technology Readiness into the Technology Acceptancy Model for M-
Shopping. International Journal of Scientific Research and Innovative Technology, 2(3), 26–35.
Beaudry, A., & Pinsonneault, A 2005, “Understanding user responses to information technology: A
coping model of user adaptation”, MIS Quarterly, 29,493–525.
Beck, T., Demirguc-Kunt, A. & Levine, R 2005, ‘SMEs, growth, and poverty: Cross-country evidence’,
Journal of Economic Growth 10(3), 199–229.
Benbasat, I., & Barki, H 2007, “Quo vadis, TAM?”, Journal of the Association for Information Systems,
8, 211–218.
Berry, A., Von Blottnitz, M., Cassim, R., Kesper, A., Rajaratnam, B. & Van Seventer, D.E. 2002, The
Economics of SMMEs in South Africa. Johannesburg. http://www.tips.org.za/files/506.pdf.
Bhattacherjee, A. & Sanford, C 2006, ‘Influence processes for information technology acceptance: an
elaboration likelihood model’, MIS Quarterly, 30(4), pp. 805-825.
Bhattacherjee, A., & Premkumar, G. 2004, Understanding changes in belief and attitude toward
information technology usage: A theoretical model and longitudinal test. MIS Quarterly, 28(2), 229-
254.
Bhattacherjee, A 2001,’Understanding information systems continuance: An expectation-confirmation
model’, MIS Quarterly, 25(3): 351–370.
Bhorat, H. and Mayet, N. 2012, Employment outcomes and returns to earnings in post-apartheid
South Africa. Development Policy Research Unit. Cape Town, University of Cape Town.
Bindah, E., & Othman, M., 2016. A Conceptual Model of Peer Influences towards the Adoption of
Technological Innovations among Adult Consumers. ScinzerJournal of Engineering, 2(1), 6–11.

108 | P a g e
Blunch, N. 2008, Introduction to structural equation modelling using SPSS and AMOS. Sage
Publications.
Boateng, R 2011,’Mobile phones and micro-trading activities–conceptualizing the link’, Journal of
Electronic Commerce in Organizations, 13(5), 48-62.
Bollen, K. A. (1989). Structural equations with latent variables. New York: John Wiley.
Bolner, M., Poirier, G., Welsh, T., & Pace, J. 2013, The Research Process: Books and Beyond (5th Ed.).
Dubuque: Kendall Hunt Publishing.
Bonett, D. G. and Wright, T. A. 2015, Cronbach's alpha reliability: Interval estimation, hypothesis
testing, and sample size planning, Journal of Organizational Behaviour, vol. 36 (1), pp. 3-15.
Boonsiritomachai, W., 2014, Enablers affecting the adoption of Business Intelligence: A study of Thai
small and medium-sized enterprises, Melbourne: College of business: Victoria University.
Boontarig, W., Chutimaskul, V., Chongsuphajaisiddhi, V. and Papasratorn, B.,2012. Factors influencing
the Thai elderly intention to use smartphones for e-Health services. Humanities, Science and
Engineering Research, pp.479-483.
Boudreau, M., & Robey, D 2005, “Enacting integrated information technology: A human agency
perspective”, Organization Science, 16, 3–18.
Bosma, N., and Harding, R 2007,’Global Entrepreneurship Monitor: GEM 2006 Results’, London
Business School, London.
Boyd, N. & Vozikis, G 1994, ’The influence of self-efficacy on the development of entrepreneurial
intentions and actions’, Entrepreneurship Theory and Practice, 18(4), 63–77
Burns, R.B. & Burns, R.A 2008, ‘Business Research Methods and Statistics Using SPSS’, London,
SAGE
Brown, M. W., & Cudeck, S. 1993, Alternative ways of assessing model fit. In K. A. Bollen & J. S.
Long (Eds.). Testing structural equation models (pp. 136-162). Newbury Park, CA: Sage Publications.
Brown, S., Dennis, A., and Venkatesh, V., 2010. Predicting collaboration technology use: Integrating
technology adoption and collaboration research. Journal of Management Information Systems 27 (2), 9–
53.
Brynard, P.A. & Hanekom, S.X 2006, ‘Introduction to research in management –related fields’,
Pretoria: Van Schaik publishers.
Bygrave, W. D., & Hofer, C. W 1991, ‘Theorizing about entrepreneurship’, Entrepreneurship theory
and Practice, 16(2), 13-22.
Byrne, B. M. 2001, Structural equation modelling with AMOS: Basic concepts, applications, and
programming. Mahwah, NJ: Lawrence Erlbaum.
Byrne, B 2006, ‘Structural Equation Modelling with EQS: Basic concepts, applications, and
Programming’, 2nd
Ed., Lawrence Erlbaum Associates, Inc., Mahwah, New Jersey, USA
Calvo-Porral, C., & Levy-Mangin, J.P. 2015, Switching behaviour and customer satisfaction in mobile
services: Analysing virtual and traditional operators. Computers in Human Behaviour, 49, 532-540.
109 | P a g e
Cant, M. C., Wiid, J.A. & Hung, Y. 2015, Internet-Based ICT Usage by SMEs: Are the Benefits Within
Reach of SMEs? Problems and Perspectives in Management Journal, Special Issue: South Africa (2).
Carlsson, C., Carlsson, J., Hyvonen, K., Puhakainen, and Walden, P. 2006, Adoption of Mobile
Devices/Services-Searching for Answers with the UTAUT. Proceedings of the 39th Hawaii
International Conference on System Science-IEEE.
Carter, L., and Weerakkody, V. 2008, E-Government adoption: A cultural comparison. Information
Systems Frontiers, 10, 473-482.
Carter, N.M., Gartner, W.B., Shaver, K.G., & Gatewood, E.J 2003, ‘The career reasons of nascent
entrepreneurs’, Journal of Business Venturing, 18(1), 13–39.
Celuch, K., Murphy G.B. & Callaway, S.K 2007, ‘More bang for your bucks: Small firms and the
importance of information technology capabilities and strategic flexibility’, Journal of High Technology
Management Research, 17, pp. 187-197.
Chair C 2017,” Internet use barriers and user strategies: perspectives from Kenya, Nigeria, South Africa
and Rwanda”. ResearchICTafrica.net
Chandra, S., Srivastava, S. and Theng, Y 2010, ‘Evaluating the role of trust in consumer adoption of
mobile payment systems: An empirical analysis’, Communications of the Association for Information
Systems, 27: 561–588.
Chandy, Rajesh & Narasimhan, Om Prakash, 2011, “ How Micro-Entrepreneurs Could Change the
World (Spring 2011)”. Business Strategy Review, Vol. 22, Issue 1, pp. 52-55, 2011.
Chen, L., Gillenson, M., and Sherrell, D. 2002, Enticing online consumers: an extended technology
acceptance perspective. Information and Management, 39 (8) 705-719.
Chen, J. L. 2011, The effects of education compatibility and technological expectancy on e-learning
acceptance. Computers & Education, 57(2), 1501-1511.
Chen, M. F., & Lin, N. P., 2018. Incorporation of health consciousness into the technology readiness
and acceptance model to predict app download and usage intentions. Internet Research, 28(2), 351-373.
Chibelushi, C. 2008, Learning the hard way? Issues in the adoption of new technology in small
technology oriented firms. Emerald, 50(8), 725 – 736.
Chibelushi, C. & Costello, P 2009, ‘Challenges facing the Midlands ICT-oriented SME’s’,
Journal of Small Business and Enterprise Development, 16(2), pp. 210–239.
Child, D. 1990, The essentials of factor analysis (2nd ed.). London: Cassel Educational
Limited.
Chimucheka, T, 2013,”Overview and performance of the SMME sector in South Africa”,
Mediterranean Journal of Sciences, 4(14), 783.
Chin, W. W., & Todd, P. A. 1995, On the use, usefulness, and ease of use of structural
equation modeling in MIS research: A note of caution. MIS Quarterly, 19(2), 237-246.
Choudrie, J., Pheeraphuttharangkoon, S., Zamani, E., Giaglis, G., 2014. Investing the use
and adoption of smartphones in the U.K.: a silver surfers perspective.
Chuttur, M. 2009, Working papers on Information Systems overview of the Technology

110 | P a g e
Acceptance Model: Origins, developments and future directions. Working Papers on Information
Systems, 9(37):1-23.
Chopra, S. & Rajan, P 2016, ‘Modelling Intermediary Satisfaction with Mandatory Adoption of E-
government Technologies for Food Distribution’, Information Technologies & International
Development. Volume 12, Number 1, Iowa State University, USA.
Chou, C., Chiu, C., Ho, C., & Lee, J 2013, ‘Understanding mobile apps continuance usage behaviour
and habit: An Expectancy-Confirmation Theory’, In PACIS, page 132, 2013.
Cichello, P. L., Almeleh, C., Mncube, L., and Oosthuizen, M. 2011, Perceived Barriers to Entry into Self-Employment in Khayelitsha, South Africa: Crime, Risk and Start-up Capital Dominate
Profit Concerns. CSSR working Paper No. 300.
Clarke, C. 2009, Paths between Positivism and Interpretivism: An Appraisal of Hay’s. Political Studies
Association, 29(1), 28–36.
Coakes, S. J. 2005, SPSS: Analysis without anguish: Version 12.0 for Windows. Milton, Qld: John
Wiley & Sons.
Collins, H. 2010, Creative Research: The Theory and Practice of Research for the Creative Industries.
New York: AVA Publications.
Collis, J., & Hussey, R. 2014, Business Research: A Practical Guide for Undergraduate and
Postgraduate Student (4th Ed.). London: Palgrave Macmillan.
Cook, G. & Cook, L., 2008, Nonexperimental Quantitative Research and Its Role in Guiding
Instruction, Intervention in School and Clinic, Vol 44, no.2
Coulter, M. 2008, ‘Entrepreneurship in Action’, Prentice Hall of India Pvt. Ltd.New Delhi.
Costello, A. B. & Osborne, J. W., 2005, Best Practices in Exploratory Factor Analysis: Four
Recommendations for Getting the Most From Your Analysis. Practical Assessment, Research &
Evaluation, 10(7), pp. 1-9.
Cragg, P., Caldeira, M. & Ward, J. 2006 Information Systems Competences in Small Manufacturing
Firms. Working paper, AFIS, University of Canterbury, NZ.
Cravo, T., Gourlay, A. & Becker, B 2012, ‘SMEs and regional economic growth in Brazil’, Small
Business Economics 38(2), 217–230.
Creswell, J. W. 2013, Research design: Qualitative, quantitative, and mixed methods approaches. Sage
publications.
Crowther, D., & Lancaster, G. 2008, Research Methods: A Concise Introduction to Research in
Management and Business Consultancy. Oxford: Butterworth- Heinemann.
Dai, H. & Palvia, P. C. 2009, Mobile Commerce Adoption in China and the United States: A Cross-
Cultural Study. The DATA BASE for Advances in Information Systems,40(4),43-61.
Dalsgaard, P. 2014, Pragmatism and Design Thinking. International Journal of Design, 8(1), 143–155.

110 | P a g e
Das Nair, R. and Dube, S. 2015, Competition, barriers to entry and inclusive growth: Case study on
Fruit and Veg City. Centre for Competition, Regulation and Economic Development, University of
Johannesburg.
Davis, F. D 1989, “Perceived usefulness, perceived ease of use, and user acceptance of information
technology”, MIS Quarterly, 13, 319–340.
Davis, F. D., Bagozzi, R. P.,& Warshaw, P. R 1989, “User acceptance of computer technology: A
comparison of two theoretical models”, Management Science, 35, 982–1002.
Davis, F., Bagozzi, R. & Warshaw, P. 1992, ‘Extrinsic and intrinsic motivation to use computers in the
workplace’, Journal of Applied Social Psychology, 22, 1111-1132.
Deloitte 2017, ‘A new world of choice for digital consumers’, Digital media trends survey, 12
th edition
De Silva, H., Ratnadiwakara, D., & Zainudeen, A. 2011, ‘Social influence in mobile phone adoption:
Evidence from the bottom of the pyramid in emerging Asia’, Information Technologies & International
Development, 7(3), 1–18.
DeSimone, J. A., Harms, P. D. & DeSimone, A. J., 2015. Best practice recommendations for data
screening. Journal of Organizational Behavior, 36(2), pp. 171-181.
Dey, A. & Hakkila, H 2008, ‘Context-awareness and mobile devices’, User interface design and
evaluation for mobile technology, 1:205-217.
Dörnyei, Z. 2007, Research methods in applied linguistics. New York: Oxford University Press
Donner, J 2007, ‘The use of mobile phones by micro entrepreneurs in Kigali, Rwanda: Changes to
social and business networks’, Information Technologies and International Development, 3(2), 3–19.
Donner, J., and Escobari, M. X 2010, ‘A review of evidence on mobile use by micro and small
enterprises in developing countries’, Journal of International Development, 22(5), 641-658.
Donovan, K.P 2013, ‘The responsibility of mobile money intellectuals?’, Information Technologies &
International Development, 9(1), pp.pp-55
Dovaliene, A., Masiulyte, A., & Piligrimiene, Z, 2015, The Relations between Customer Engagement,
Perceived Value and Satisfaction: The Case of Mobile Applications. Procedia – Social and Behavioural
Sciences.
Duff, C 2000, ‘Online mentoring’, Educational Leadership 58 (2), 49-52.
Duncombe, R. 2006, Using the Livelihood Framework to analyse ICT applications for Poverty
Reduction through Microenterprise. Information Technologies and International Development, 3(3), 81-
100.
Eagle, A. and Chaiken S. 1993, The Psychology of Attitude, New York: Harcourt, Brace, Jovanovich.
Eckhardt, J. T., & Shane, S. A. 2003, ‘Opportunities and entrepreneurship’, Journal of management,
29(3), 333-349.
Eikebrokk, T.R. & Olsen, D.H. 2007, An Empirical Investigation of Competency Factors
Affecting E-business Success in European SMEs. Information & Management, 44, 4,364-383.
111 | P a g e
Ellis, J. & van Belle, J.P 2009, ‘Open Source Software Adoption by South African MSEs:
Barriers and Enablers’, Proceedings of the 2009 Annual Conference of the Southern African
Computer Lecturers' Association, Eastern Cape, South Africa, 29 June – 1 July 2009:41-49
Esselaar, S & Stork C, Ndiwalana, A & Deen-Swarra M 2007, ‘ICT usage and its impact on
profitability of SMEs in 13 African countries’, Information Technologies and International
Development 4 (1):87-100.
Esselaar, S., Gillwald, A., & Stork, C. 2006. South African Telecommunications Sector Performance
Review 2006. LINK Centre public policy research paper, (8), 1-64.
Evon T. & Jasmine L., 2016. Behavioural Intention to Adopt Mobile Banking among the Millennial
Generation, Young Consumers, 17 (1), 18-31.
Eze, S.C., Chinedu-Eze, V.C., & Bello, A.O. 2018, Determinants of dynamic process of emerging ICT
adoption in SMEs–actor network theory perspective. Journal of Science and Technology Policy
Management.
Farrington, S.M., 2012, Entrepreneurial intentions: Demographic perspectives of South African
Business students. South African Journal of Business Management, 43(3), 41-49.
Fernandez, C., Lilenstein, K., Oosthuizen, M. and Villar, L. 2017, Rethinking the Effect of
Informality on Inclusive Growth: Lessons from Colombia and South Africa for their Regions. ELLA
Research Paper Series
Field, A. 2005, Discovering statistics using SPSS (2nd Ed). London: Sage Publications.
Field, A. 2009, Discovering Statistics Using SPSS. (3rd Ed). London: SAGE Publications.
Fishbein, M., & Ajzen, I 1975, ‘Belief, attitude, intention and behaviour: An introduction to theory and
research’, Reading, MA: Addision-Wasely
Fischer, E., and Reuber, A. R. 2011, Social interaction via new social media: (How) can interactions on
Twitter affect effectual thinking and behavior? Journal of Business Venturing, (26:1), pp. 1-18.
Fisher, C & Anushko, A 2008, 'Research ethics in social science', in The sage handbook of social
research methods, SAGE Publications Ltd, London, pp. 95-110.
Florin, J., Karri, R., & Rossiter, N 2007, ‘Fostering entrepreneurial drive in business education: An
attitudinal approach’, Journal of Management Education, 31(1), 17–42.
Frankfort-Nachmias, C., & Nachimias, D., 1996. Research Methods in Social Science (5th ed.).
London: Arnod.
Gable, R. K. (1993). Instrument development in the affective domain: Measuring attitudes and values in
corporate and school settings (2nd ed). Boston, MA: Sage Publications
Galloway, L., & Mochrie, R. (2005). The use of ICT in rural firms: A policy oriented literature review.
INFO, 7(3), 33-46.
Gao, L. and Bai, X., 2014. A unified perspective on the factors influencing consumer acceptance of
internet of things technology. Asia Pacific Journal of Marketing and Logistics 26 (2), 211–231
Garson, G. D. 2006, Quantitative research in public administration: Structural equation
modeling. Available from http://www2.chass.ncsu.edu/garson/pa765/structur.html

112 | P a g e
Gefen, D., Straub, D., & Boudreau, M. 2000, Structural equation modelling techniques and
regression: Guidelines for research practice. Communications of the Association for Information
Systems, 7(7), 1-78.
Ghezzi, A., Gastaldi, L., Lettieri, E., Martini, A., and Corso, M., 2016. A role for startups in unleashing the disruptive power of social media, International Journal of Information Management, pp. 1-8.
Giannakos M. N &, Panayiotis V. 2011, ‘Investigating the effect of duration in educational webcast
adoption’, Procedia Social and Behavioural Sciences, 15 (2011) 160–164, 2011
Gilwald, A. 2010, The poverty of ICT policy. Research and Practice in Africa, 6, 79‐88.
Given, S. & Lisa M. 2008, Convenience Sample. In The SAGE Encyclopaedia of Qualitative Research
Methods. Thousand Oaks, CA: Sage.
Good, T., & Qureshi, S. 2009, Investigating the effects of microenterprise access and use of ICT
through a Capability lens: Implications for Global Development. Proceeding of the Second Annual SIG
GlobeDev Workshop, Phoenix, USA.
Guritno, R. & Siringoringo, H. 2013, ‘Perceived usefulness, ease of use, and attitude towards online
shopping usefulness towards online airlines ticket purchase’, Procedia Social and Behavioural
Sciences, 81, 212–216.
Gray, C. 2006, Absorptive Capacity, Knowledge Management and Innovation in Entrepreneurial Small
Firms. International Journal of Entrepreneurial Behavior & Research, 12(6), 345-360.
Greenlaw, C. & Brown-Welty, S. 2009. A Comparison of Web-Based and Paper-Based Survey
Methods. Evaluation Review. [Online] 33(5): 464–480. Available:
http://erx.sagepub.com/content/33/5/464.abstract.
Hair, J., Black, W., Babin, B., Anderson, R., & Tatham, R. 2006, Multivariate data analysis (6th
Ed.). Upper Saddle River, NJ: Pearson Education, Inc.
Hair, J. J. F., Black, W. C., Babin, B. J. & Anderson, R. E., 2010, Multivariate Data Analysis. 7th Ed.
United States: Pearson.
Hair, J. F., Hult, G. T. M., Ringle, C. M., and Sarstedt, M. 2017, A Primer on Partial Least Squares
Structural Equation Modelling (PLS-SEM). 2nd Ed. Thousand Oaks, CA: Sage
Han, S. 2003, Individual adoption of information systems in organisations: a literature
review of technology acceptance model, TUCS Technical Report 540, TUCS.
Hanna, N. K. 2010, Transforming Government and Building the Information Society: Challenges and
Opportunities for the Developing World. Springer Science & Business Media, New York.
Harker, D & Van Akkeren, J 2002, ‘Exploring the needs of SMEs for mobile data technologies:
the role of qualitative research techniques’, Qualitative Market Research: An International Journal,
Vol. 5 Issue: 3, pp.199-209
Harris, L., & Brown, G. 2010, Mixing interview and questionnaire methods: Practical problems in
aligning data. The Journal of Practical Assessment and Research Evaluation, 15(1), 1–19.
Hatcher, L. 2002, A step-by-step approach to using the SAS system for factor analysis and
structural equation modelling (5th ed.). Cary, NC: SAS Institute.

113 | P a g e
Heeks, R. 2005, Information and Communication Technologies (ICT) Poverty Reduction and
Micro, Small & Medium-scale Enterprises (MSMEs): A framework for understanding ICT
applications for MSMEs in developing countries. IDRC. University of Manchester, UK
Heeks, R. 2008, Researching ICT based Enterprises in Developing countries: Analytical Tools
and Models. IDPM, University of Manchester, UK.
Heeks, R., & Molla, A. 2008, Compendium on Impact Assessment of ICT-for-Development
Projects. IDRC. University of Manchester, UK.
Herrington, M., Kew, J., & Kew, P., 2014, GEM South Africa 2014.
Herrington, M., Kew, J., & Kew, P 2009, ‘Tracking entrepreneurship in South Africa: A GEM perspective’, South African Journal of Economic and Management Sciences, Vol. 14, No.1, pp. 66- 78
Herrington, M. & Mass, G. 2007, Entrepreneurship: Low levels threaten growth. Management Today,
23(2):54-55.
Hew, J., Lee, V., Ooi, K. & Wei, J. 2015, What catalyses mobile apps usage intention: an empirical
analysis. Industrial Management & Data Systems, 115(7), 1269-1291.
Hilson, G. 2003, ‘Canadian SME e-business growth stalled by a lack of IT skills: Report’, Computing
Canada, 23 May, pp. 1.
Hinton, P. R., Brownlow, C., McMurray, I., & Cozens, B. (2004). SPSS explained. East Sussex,
England: Routledge, Inc.
Hislop, D., Axtell, C., Collins, A., Daniels, K., Glovere, J., and Niven, K. 2015. Variability in the use of
mobile ICTs by homeworkers and its consequences for boundary management and social isolation”,
Information and Organization (25), pp. 222–232.
Hoehle, H. and Venkatesh, V. 2015, Mobile application usability: conceptualization and instrument
development, MIS Quarterly, vol. 39 (2), pp.435-472.
Hong, W., Thong, J. Y. L., Chasalow, L. C., & Dhillon, G. 2011, ‘User acceptance of agile information
systems: A model and empirical test’, Journal of Management Information Systems, 28(1), 235-272.
Hosmer, D. W., Lemeshow, S. J. & Rodney, R. X. 2013, Applied Logistic Regression. 3rd ed.
Massachusetts: John Wiley & Sons.
Hsiao, C., Chang, J, & Tang, K. 2016, Exploring the influential factors in continuance usage of mobile
social Apps: Satisfaction, habit and customer value perspectives. Telematics and Informatics, 33(2),
342-355.
Hsu, C. L., & Lu, H. P., 2004. Why do people play on-line games? An extended TAM with social
influences and flow experience. Information & Management, 41(7), 853-868.
Hu, L., & Bentler, P. 1999, Cut-off criteria for fit indexes in covariance structure analysis:
Conventional criteria versus new alternatives. Structural Equation Modelling: A
Multidisciplinary Journal, 6(1), 1-55.
Huang, J. L. et al., 2011, Detecting and Deterring Insufficient Effort Responding to Surveys. Journal of
Business and Psychology, 27(1), pp. 99-114.

114 | P a g e
Huili, Y., & Chunfang, Z., 2011. The Analysis of Influencing Factors and Promotion Strategy for the
Use of Mobile Services. Canadian Social Science, 7(2), 60–63.
Independent Communications Authority of South Africa (ICASA), 2019, The State of the ICT Sector
report in South Africa. Retrieved online at https://www.icasa.org.za/legislation-and-regulations/state- of-ict-sector-in-south-africa-2019-report
Islam, M. M. 2017, “Exploring Influencing Factors towards Intention and Use of Mobile Internet for
Youth Consumers in Bangladesh”. Universal Journal of Management 5(1): pp. 39-47.
Ismail, R., Jeffery, R., & Van Belle, J. P. 2011, Using ICT as a Value Adding Tool in South African
SMEs. Journal of African Research in Business & Technology, 2011, 1-11.
Jagun, A. and Heeks, R 2007, ‘Mobile phones and development: the future in new hands’, Insights/ id21
(Programme) (69).
Jones, P. 2011, ICT impact within the SME sector. Journal of Systems and Technology, 13(2), 1.
Lavrakas, P.J. 2008, Encyclopedia of survey research methods, Sage Publications, Inc., Thousand Oaks,
CA, [Accessed 28 February 2019].
Lean, O. K., Ramayah, T., Fernando, Y., and Zailani, S. 2009, Factors influencing intention to use e-
Government services among citizens in Malaysia. International Journal of Information Management,
29, 458-475.
Lee, Y., Kozar, K.A., & Larsen, K.R.T. 2003, ‘The technology acceptance model: Past, present, and
future’, Communications of the Association for Information Systems, 12, 752–780.
Leedy, P. D. 1997, Practical research: Planning and Design. (6th Ed.) Merrill, Prentice Hall: Upper
Saddle River, NJ, USA.
Legris, P., Ingham, J., and Collerette, P. 2003, Why do people use information technology? A critical
review of the technology acceptance model. Information and Management, 40 (3) 191-204.
Levin KA. Study design III: Cross-sectional studies. Evid Based Dent 2006; 7:24-5.
Levy, Y. 2006, Assessing the value of e-learning systems. Hershey, PA: Information Science
Publishing.
Lewis, E. F., Hardy, M. & Snaith, B. 2013, Estimating the Effect of Nonresponse Bias in a Survey of
Hospital Organizations. Eval Health Prof, 36(3), pp. 330-351.
Li, J., & Kishore, R. 2006, How robust is the UTAUT instrument? A multi-group invariance analysis in the context of acceptance and use of online community weblog systems. Proceedings of the
2006 ACM SIGMS CPR Conference on Computer Personnel Research, Claremont, CA, 183-189
Liao, C., Chen, J. L. & Yen, D. 2007, ‘Theory of planning behaviour (TPB) and customer satisfaction in
the continued use of e-service: An integrated model’, Computers in Human Behaviour,
23(6):2804{2822.
Liebenberg, J. 2015, Determinants of ICT students’ intentions to use e-books. In Proceedings of the ISTE International Conference on Mathematics, Science and Technology education. Mopani Camp
in Kruger National Park, Limpopo, South Africa. Unisa Press.

115 | P a g e
Liedholm, C., & Mead, D. 1999, Small enterprises and economic development: the dynamics of micro
and small enterprises. Routledge.
Liedholm, C. E., and Mead, D. C. 2013, ‘Small enterprises and economic development: the dynamics of
micro and small enterprises’, Routledge. pp.1 -5
Littlejohn, S., & Foss, K. 2009, Encyclopedia of Communication Theory (1 ed.). California: SAGE
Publication.
Liu, Yong, and Hongxiu Li 2011, ‘Exploring the impact of use context on mobile hedonic services
adoption: An empirical study on mobile gaming in china’, Computers in Human Behaviour 27 (2) (3):
890-8.
Lorenzo, J., Aviles, G & Centeno, M. 2010, ‘Revisiting the expectancy/disconfirmation paradigm for
small questionnaires: The cultural/heritage tourism case’, Revista Electronica de Comunicaciones
Trabajos de ASEPUMA, (11):155{177.
Lu, Y., Deng, Z. and Wang, B. 2010, ‘Exploring factors affecting Chinese consumers’ usage of short
message service for personal communication’, Information Systems Journal, 20(2): 183–208.
Lu, H. and Su, P. 2009, Factors affecting purchase intention on mobile shopping web sites. Internet
Research, 19(4): 442–458.
Lu, C. S., Lai, K. H., & Cheng, T. C. E. 2007, Application of structural equation modeling to
evaluate the intention of shippers to use Internet services in liner shipping. European Journal of
Operational Research, 180(2), 845-867.
Lu, J., Yu, C., Liu, C. & Yao, J.E. 2003, ‘Technology acceptance model for wireless Internet’, Internet
research: Electronic networking applications and policy, 13(3), pp. 206–222.
Kale, Y. 2015, Micro, Small and Medium Enterprise National Survey 2013. National Bureau of
Statistics Nigeria.
Kane, E. and O’Reilly-de Brun, M. 2001, Doing your own Research. (2nd Ed.) Marion Boyers: London.
Kapurubandara, M. & Lawson, R 2007, ‘SMEs in developing countries need support to address the
challenges of adopting e-commerce technologies’, Proceedings of the 20th Bled eConference
eMergence: Merging and emerging technologies, processes and institutions, pp. 485 – 498.
Karahanna, E., Straub, D. and Chervany, N. L. 1999, Information technology adoption across time:
Across-sectional comparison of pre-adoption and post adoption beliefs. MIS Quarterly, 23 (2) 183-213.
Kaynak, E., Tatoglu, E. & Kula, V. 2005, ’An analysis of the factors affecting the adoption of electronic
commerce by SMEs: Evidence from an emerging market’, International Marketing Review, 22(6), pp.
623-640.
Kemp, S. 2015. Special reports: Digital, social & mobile in APAC in 2015, Retrieved online;
http://wearesocial.com/sg/special-reports/digital-social-mobile-in-apac-in-2015.
Kim, C., Li, W. & Kim, D.J. 2015, ‘An Empirical Analysis of Factors Influencing M-Shopping
Use’, International Journal of Human-Computer Interaction, 31(12), 974-994.
Kimh, H.W., Kankanhalli, A., & Lee, H.L. 2016, Investigating decision factors in mobile application
purchase: A mixed-methods approach. Information and Management, pp. 727-739. Elsevier B.V.

116 | P a g e
Kiseol, Y., & Forney, J. 2013, The Moderating Role of Consumer Technology in Mobile Shopping
Adoption. Journal of Electronic Commerce Research, 14(4), 334–347.
Kline, R. B. 2005, Principles and practice of structural equation modelling (2nd Ed.). New
York: Guildwood.
Knutsen, L.A. 2005, M-service expectancies and attitudes: Linkages and effects of first impressions.
IEEE Proceedings of the 38th Hawaii International Conference on System Sciences.
Koh, C.E., Prybutok, V.R., Ryan, S.D., & Wu, Y. 2010, ‘A model for mandatory use of software
technologies: An integrative approach by applying multiple levels of abstraction of informing science’,
Informing Science: The International Journal of an Emerging Transdiscipline, 13, 177–203.
Kohli, R., & Devaraj, S. 2004, Realizing the Business Value of Information Technology Investments:
An Organizational Process. MIS Quarterly Executive, 3(1), 53-68.
Kohnke, A., Cole, M., & Bush, R. 2014, Incorporating UTAUT Predictors for Understanding Home
Care Patients’ and Clinician’s Acceptance of Healthcare Telemedicine Equipment. Journal of
Technology Management & Innovation, 9(2), 1–10.
Konishi, Sadanori; Kitagawa, Genshiro 2008, Information criteria and statistical modelling.
Springer. ISBN 978-0-387-71886-6.
Kotelnikov, V. 2007, Small and medium enterprises and ICT, United Nations Development Program‐ Asia Pacific Development Information Program and Asian and Pacific Training Centre for Information
and Communication Technology for Development, Bangkok
Koufteros, X. A. 1999, Testing a model of pull production: A paradigm for manufacturing research
using structural equation modelling. Journal of Operations Management, 17(4), 467-488
Kumar, N. 2013, Barriers and diffusion of e-Commerce in developing countries. AADYAM-A
Journal of Management, 2(2):31-42.
Kura, S. 2012, Qualitative and Quantitative Approaches to the Study of Poverty. The Journal of
Qualitative Report, 17(1), 1–19.
Krauss, S. 2005, Research Paradigms and Meaning Making: A Primer. Qualitative Report, 10(4), 758– 770.
Krejcie, R & Morgan, D. 1970, 'Determining sample size for research activities', Educational and
Psychological Measurement, vol. 30, pp. 607-10.
Kripanon, N. 2007, ‘Examining a Technology Acceptance Model of Internet Usage by Academics
within Thai Business Schools’, Victoria University, Melbourne, Australia.
Krueger, N.F., Reilly, M.D., & Carsrud, A.L. 2000, ‘Competing models of entrepreneurial intentions’,
Journal of Business Venturing, 15, 411–432.
Kyobe, M. 2011, Investigating the key factors influencing ICT adoption in South Africa. Journal of
Systems and Information Technology, 13(3), 255-267.
Kyro, P., 2015, Handbook of entrepreneurship and sustainable development research. United Kingdom:
Edward Elgar Publishing Limited.

117 | P a g e
Mackenzie, N. & Knipe, S. 2006, Research Dilemmas: Paradigms, Methods and Methodology, Issues in
Educational Research v16 n2 p193-205.
Mackenzie, R., 2018, One-Way ANOVA vs Two-Way ANOVA: Differences, Assumptions and Hypotheses. Technology Networks. Retrieved online at
https://www.technologynetworks.com/informatics/articles/one-way-vs-two-way-anova-definition-
differences-assumptions-and-hypotheses-306553
Magrath, V. & McCormick, H. 2013, Marketing design elements of mobile fashion retail apps.
Journal of Fashion Marketing and Management: An International Journal, 17(1), 115-134.
Mahadea, D., 2012, Prospects of entrepreneurship to the challenge of job creation in South Africa.
Journal of Developmental Entrepreneurship, 17(4), 1250020.
Maldonado U. P. T , Khan G. F, Moon J & Rho J. J. 2011, ‘E-learning motivation and educational
portal acceptance in developing countries’, Online Information Review Volume: 35, 2011
Malefane, S.R. 2013,”Small Medium and Micro Enterprise and local economic-base restructuring – a
South African local government perspective”, Journal of Public Administration, 48(4), 671-690.
Mallat, N., Rossi, M., Tuunainen, V.K. & Oorni, A. 2009, ‘The impact of use context on mobile
services acceptance: The case of mobile ticketing’, Information & Management, 46(3): 190–195.
Mann C.J. 2003, Observational research methods. Research design II: Cohort, cross sectional, and case-
control studies. Emerg Med J 2003; 20:54-60.
Manueli K, Latu S & Koh, D. 2007, ‘ICT Adoption Models.’ 20th Annual Conference of the National
Advisory Committee on Computing Qualifications (NACCQ), Nelson, New Zealand.
Marchewka, J. T., Liu, C., & Kostiwa, K. 2007, An application of the UTAUT model for understanding
student perceptions using course management software. Communications of the IIMA, 7(2), 93-104.
Maree, K. & Pietersen, J. 2007, The quantitative research process. (In Maree, K., Ed. First steps in
research. Pretoria: Van Schaik. p. 144-153).
Martins C, Tiago O & Ale P. 2013, ‘Understanding the Internet Banking adoption: A Unified theory of
acceptance and use of technology and perceived Risk application’, International Journal of Information
Management.
Matsunaga, M. 2010, How to Factor-Analyse Your Data Right: Do’s, Don’ts, and How-To’s.
International Journal of Psychological Research, 3(1), pp. 97-110.
McCann, M., and Barlow, A. 2015,. Use and measurement of social media for SMEs, Journal of Small Business and Enterprise Development (22:2), pp. 273-287.
McDonald, J. H. 2014, Handbook of Biological Statistics. 3rd ed. Maryland: Sparky House Publishing.
McNeese, B., 2016, Are the Skewness and Kurtosis Useful Statistics? Retrieved online at
https://www.spcforexcel.com/knowledge/basic-statistics/are-skewness-and-kurtosis-useful-statistics
Mead, D.C. 1994, The contribution of small enterprises to employment growth in Southern and
Eastern Africa. World Development, 22(12), 1881-94
Meade, A. W. & Bartholomew, C. S. 2012, Identifying Careless Responses in Survey Data. American
Psychological Association, 17(3), pp. 437-455.
118 | P a g e
Melchioly, S., and Saebo, O. 2010, ‘ICTs and Development: Nature of Mobile Phones usage for SMEs
Economic Development-An Exploratory Study in Morogoro, Tanzania’, ICT and Development-
Research Voices from Africa. International Federation for Information Processing (IFIP), Technical
Commission, 9(4).
Mertens, D. 2010, Research and evaluation in education and psychology. Integrating diversity with
quantitative, qualitative and mixed methods. 3rd ed. Washington DC: Sage.
Michailidis, A., Nastis, S.A., & Loizou, E. 2012, Mobile communications technology in rural societies
of developing countries. Journal of Rural Development, 31(3), 319-334.
Minas, C., & Inman, D. 1990, Matching finite-element models to modal data. Journal of Vibration and
Acoustics: Transactions of the ASME, 112(1), 84-92.
Mishra, S. 2014, Adoption of M-commerce in India: Applying Theory of Planned Behaviour Model. Journal of Internet Banking and Commerce, 19(1): 1-17.
Mkansi, M., & Acheampong, E. 2012, Research Philosophy Debates and Classifications. Electronic
Journal of Business Research Methods, 10(2), 131–140.
Modimogale, L., & Kroeze, J. H. 2009, Using ICTs to Become a Competitive SME in South Africa.
Modimogale, L., & Kroeze, J. H. 2011, The role of ICT within Small and Medium enterprises in South
Africa. Communications of the IBIMA
Moliner, M., Sanchez, J., Rodriguez, R., & Callarisa, L. 2007, ‘Perceived relationship quality and
post-purchase perceived value: An integrative framework’, European Journal of Marketing,
41(11/12):1392{1422.
Moore, D. S., & McCabe, G. P. 2006, Introduction to the practice of statistics. New York: W. H.
Freeman and Co.
Moran, M., Hawkes, M., & Gayar, O. E. 2010, Tablet personal computer integration in higher
education: Applying the unified theory of acceptance and use technology model to understand
supporting factors. Journal of Educational Computing Research, 42(1), 79-101
Mueller, S.L. & Goic, S. 2003, ‘East-West differences in entrepreneurial self-efficacy: Implications for
entrepreneurship education in transition economies’, International Journal of Entrepreneurship
Education, 1(4), 613–632.
Muller, C. and Barsion, S. 2003, ‘Assessment of a large-scale e-mentoring network for women in
engineering and science: Just how good is MentorNet?’, WEPAN 2003 Conference Proceedings.
Chicago, IL. pp. 1-6.
Muthén, L.K. and Muthén, B.O., 1998-2017. MPlus User’s Guide. Eighth Edition. Los Angeles, CA:
Muthén & Muthén
Nam, D., Kang, D. & Kim, S. 2015, Process of big data analysis adoption: Defining big data as a new
IS innovation and examining factors affecting the process. Hawaii, Hawaii International Conference on
Systems Sciences.

119 | P a g e
Nagayya, D., & Rao, T.P. 2013, Small and medium enterprises in the era of globalization. Journal of
Rural Development, 32(1), 1–17.
National Mentorship Movement 2015, ‘Unleashing South Africa's Human Capital through Mentorship’,
Retrieved online http://www.mentorshipmovement.co.za/
Ndiege, J.R.A., Herselman, M.E. & Flowerday, S. 2012, Information and Communication
Technologies within small and medium enterprises in developing economies. African Journal of
Business Management, 6(10):3576-3582.
Netemeyer, R. G., Bearden, W. O., & Sharma, S. 2003, Scaling procedures: Issues and applications.
Thousand Oaks, CA: Sage Publications.
Ngassam, E.K., Ntawanga, F., and Eloff, J.H.P. 2013, A roadmap for rural area ICT solution
deployment: A case of Kgautswane community in South Africa. The Journal of Information Systems,
5(2), 49‐64.
Ngek, N.B. & Smit, A.V.A. 2013, Will promoting more typical SME start-ups increase job creation in
South Africa? African Journal of Business Management, 7(31):3043–3051.
Nguyen, T.H. 2009, Information Technology adoption in SMEs: An integrated framework.
International Journal of Entrepreneurial Behaviour & Research, 15(2):162-186.
Nguyen, T.H., Newby, M. & Macaulay, M.J. 2013, Information Technology adoption in small
business: Confirmation of a proposed framework. Journal of Small Business Management,
10(1111):1-21.
Nguyen, B., Yu, X., Melewa, T.C., & Chen, J. 2015, Brand innovation and social media:
Knowledge acquisition from social media, market orientation, and the moderating role of social
media strategic capability. Industrial Marketing Management, 51, 11-25.
North, D., Johnston, K., & Ophoff, J. 2014, The use of mobile phones by South African university
students. Issues in Informing Science and Information Technology, 115(1), 115–138.
Nxele, M 2009, ‘Reconnecting Zimbabwe: harnessing mobile telephony for sustainable development
and poverty alleviation’, In Chimhowu, A. (Ed.), Moving Forward in Zimbabwe: Reducing Poverty and
Promoting Growth (pp. 103 -110).
Nyamba, S., & Malongo, M. 2012, Factors Influencing the Use of Mobile Phones in Communicating
Agricultural Information: A Case of Kilolo District, Iringa, Tanzania. International Journal of
Information and Communication Technology Research, 2(7), 558–563.
Okon, U. 2015, ICT for rural community development: Implementing the communicative ecology framework in
the Niger delta region of Nigeria. Information Technology for Development, 21(2), 297-321.
Olawale, F. & Garwe, D. 2010, Obstacles to the growth of new SMEs in South Africa: A principal
component analysis approach. African Journal of Business Management, 4(5):729-738.
Oliver, R 1977, ‘Effect of expectation and disconfirmation on post exposure product evaluations: An
alternative interpretation’, Journal of applied psychology, 62(4):480, 1977.
Oliveira T., Thomas M., Baptista G. & Campos F., 2016. Mobile Payment: Understanding the
Determinants of Customer Adoption and Intention to Recommend the Technology. Computers in
Human Behavior, 61, 404-414.

120 | P a g e
Ollo-López, A., & Aramendía-Muneta, M. E. 2012, ICT Impact on Competitiveness, Innovation and
Environment. Telematics and Informatics, 29(2), 204-210.
O’Neill, G. & Murphy, F. 2010, ‘Assessment guide to taxonomies of learning’, Dublin: UCD teaching
and learning resources.
Orlikowski, W. 2000, “Using technology and constituting structures: A practice lens for studying
technology in organizations”, Organization Science, 11, 404– 428.
Osborne, J. W., 2015, What is Rotating in Exploratory Factor Analysis. Practical Assessment, Research
& Evaluation, 20(2), pp. 1-7.
Ovum 2012, Big changes ahead for mobile content in emerging markets. Available at
http://ovum.com/2012/05/16/bigchanges-ahead-for-mobile-content-in-emerging-markets/.
Owoseni, A. & Twinomurinzi, H. 2016, Mobile App Usage as a Dynamic Capability in Nigerian Start-
ups. IST Africa Conference, Durban, pp. 1–9.
Ozturk, A. B., Bilgihan, A., Nusair, K., & Okumus, F., 2016. What keeps the mobile hotel booking
users loyal? Investigating the roles of self-efficacy, compatibility, perceived ease of use, and perceived
convenience. International Journal of Information Management, 36(6), 1350–1359.
Pallant, J. 2005, SPSS survival manual: A step by step guide to data analysis using SPSS (2nd Ed.).
Crows Nest, NSW: Allen & Unwin
Park, N., Lee. S., & Chung, J.E. 2016, Uses of cell phone texting: AN integration of motivations, usage
patterns, and psychological outcomes. Computers in Human Behavior, 62, 712-719.
Paul, D., & Pascale, D. 2013, Information Technology and Economic Development: An Introduction to
the Research Issues. Research Paper. Los Angeles, CA: Sage.
Pavlou, P.A. & Fygenson, M. 2006,”Understanding and prediction electronic commerce adoption: an
extension of the theory of planned behaviour”, MIS Quarterly, 30(1): 115–143.
Planing, P. 2014, Innovation Acceptance. 1st ed. Stuttgart: Springer Gabler.
PMG: Parliamentary Monitoring Group 2018, Retrieved online https://pmg.org.za/committee-
meeting/26244/
Priyanka, S., 2012. Technology Acceptance Model: A Survey of Literature. International Journal of
Business and Social Research, 2(4), 175–178.
Qureshi, S. 2005, How does information technology effect development? Integrating theory
and practice into a process model. Proceeding of Americas Conference on Information Systems, Omaha,
NE, USA.
Ramanathan, R. 2008, The Role of Organisational Change Management in Offshore Outsourcing of
Information Technology Services. Florida: Universal Publishers.
121 | P a g e
Ramayah, T., & Ignatius, J. 2014, Impact of Perceived usefulness, Perceived ease of use and Perceived
Enjoyment on Intention to shop online. Retrieved from
http://www.ramayah.com/journalarticlespdf/impactpeu.pdf
Rana, N. P., Dwivedi, Y. K., & Williams, M. D., 2015. A meta-analysis of existing research on citizen
adoption of e-government. Information Systems Frontiers, 17(3), 547–563.
Reynolds, P.D. 2005, ‘Understanding business creation: Serendipity and scope in two decades of
business creation studies’, Small Business Economics, 24, 359-364.
Rhodes, J. 2009, A strategic framework for rural micro-enterprise development: The integration of information
communication technology (ICT), e-commerce, marketing, and actor-network theory. Perspectives on
Global Development and Technology, 8(1), 48-69.
Roberts, C.M. 2004, The Dissertation Journey. 1st edition. London: Sage Publications Ltd.
Robinson, J. P., Shaver, P. R., & Wrightsman, L. S. 1991,'Measures of personality and social
psychological attitudes', San Diego, CA: Academic.
Rogers, E. 1995, ‘Diffusion of innovations’, (4th ed.). New York, NY: Free Press.
Rotefoss, B. & Kolvereid, L. 2005, ‘Aspiring, nascent and fledgling entrepreneurs: An investigation of
the business start-up processes, Entrepreneurship & Regional Development, 17, 109–127.
Rowlands, B. 2005, Grounded in Practice: Using Interpretive Research to Build Theory. The Electronic
Journal of Business Research Methodology, 3(1), 81– 92.
Salkind, N.J. 2010, Encyclopedia of research design, SAGE Publications, Inc., Thousand Oaks, CA.
Saunders, M., Lewis, P. & Thornhill, A. 2012, Research methods for business students. 6th ed. Harlow:
Pearson Education Limited.
Sarker, S., & Valacich, J. S. 2010, ‘An alternative to methodological individualism: A non-reductionist
approach to studying technology adoption by groups’, MIS Quarterly, 34(4), 779-808
Sarker, S., Valacich, J. S., & Sarker, S. 2005, ‘Technology adoption by groups: A valence perspective’,
Journal of the Association for Information Systems, 6(2), 37-71.
Schlemmer, F., & Webb, B. 2009, The internet as a complementary resource for MEs: The interaction effect of
strategic assets and the internet. International Journal of E-Business Research, 5(1), 1-24.
Schwarz, A., Kalika, M., Kefi, H., and Schwarz, C. 2010, A dynamic capabilities approach to
understanding the impact of IT‐enabled business processes and IT‐business alignment on the strategic
and operational performance of the firm. Communications of the Association for Information Systems,
26(4), 56‐84.
Scotland, J. 2012, Exploring the Philosophical Underpinnings of Research: Relating Ontology and
Epistemology to the Methodology and Methods of the Scientific, Interpretive, and Critical Research
Paradigms. The Canadian Centre of Science and Education, 5(9), 9–17.
SEDA 2017, ‘Annual Report 2016/17’, Retrieved online
http://www.seda.org.za/Publications/Annual%20Reports/seda%20Annual%20Report%202016-17.pdf
SEDA 2018, SMME Quarterly Update, 1st Quarter 2018, retrieved online,
http://www.seda.org.za/Publications/Publications/SMME%20Quarterly%202018-Q1.pdf
122 | P a g e
Sedgwick, P. 2013,’Convenience Sampling’, Centre for Medical and Healthcare Education, St
George’s, University of London, London, UK.
Sekaran, U. 2003, Research methods for business: A skill-building approach (4th ed.). John
Wiley & Sons, Inc.
Seymour, L., Makanya, W., & Berrangé, S. 2007, ‘End-users’ acceptance of enterprise resource
planning systems: An investigation of antecedents’, Proceedings of the 6th Annual ISOnEworld
Conference (pp. 1–22), Las Vegas.
Shane, S., Locke, E.A., & Collins, C.J. 2003, ‘Entrepreneurial motivation’, Human Resource
Management Review, 13(2), 257–279.
Shapiro, S., 1965, An analysis of Variance Test for Normality. Biometrika, 52(1), 591– 611.
Shareef, M. A., Dwivedi, Y. K., Kumar, V., & Kumar, U., 2017. Content design of advertisement for
consumer exposure: Mobile marketing through short messaging service. International Journal of
Information Management, 37(4), 257–268.
Sheppared, B., Hartwick, J., and Warshaw, P. 1988, The theory of reasoned action: A Meta-analysis of
past research with recommendations for modification and future research. Journal of Consumer
Research, 15(3) 325-343
Shin, Y.M., Lee, S.C., Shin, B. and Lee, H.G. 2010, ‘Examining influencing factors of post-adoption
usage of mobile Internet: Focus on the user perception of supplier-side attributes’, Information Systems
Frontier, 12(5): 595–606.
Sia, C. L., Lee, M. K. O., Teo, H. H., & Wei, K. 2001, ‘Information channels for creating awareness in
IT innovations: An exploratory study of organizational adoption intentions of ValuNet’, Electronic
Markets, 11(3), 206-215.
Sia, C. L., Teo, H. H., Tan, B. C. Y., & Wei, K. K 2004, ‘Effects of environmental uncertainty on
organizational intention to adopt distributed work arrangements’, IEEE Transactions on Engineering
Management, 51(3), 253-267.
Sichel, D. 1997, “The computer revolution: An economic perspective”. Washington, DC: The
Brookings Institution.
Silva, H., Ratnadiwakara, Di., & Zainudeen, A. 2011, Social Influence in Mobile Phone Adoption.
Information Technologies and International Development, 7(3), 1–18.
Simeonova, B., Bogolyubov, P., Blagov, E. & Kharabsheh, R. 2010, ‘Cross-cultural Validation of
UTAUT: The Case of University VLEs in Jordan, Russia and the UK’, The Electronic Journal of
Knowledge Management. Volume 12 Issue 1 (pp25-34).
Singh, S. 2010, The South African information society, 1994–2008: Problems with policy, legislation,
rhetoric and implementation. Journal of Southern African Studies, 36(1), 209‐227.
Singh, K. 2007, Quantitative Social Research Methods, Sage Publications, India.
Sivathanu, B., 2018. Adoption of Digital Payment Systems in the Era of Demonetization in India.
Journal of Science and Technology Policy Management. JSTPM-07-2017-0033
Sledgianowski, D. and Kulviwat, S., 2009. Using social network sites: The effects of playfulness,
critical mass and trust in a hedonic context. Journal of Computer Information Systems 49 (4), 74– 83

123 | P a g e
South Africa. 2017, Draft Information and Communication Technology Small, Medium and Micro
Enterprise Support Strategy. Government Gazette, 307 (40756): 1-45, March 31.
South Africa. National Small Business Amendment Act, 1996. Available at
http://www.saflii.org/za/legis/num_act/nsbaa2003331.pdf
South African Government 2015, The National Development Plan.
South African Government 2016, The National Integrated ICT Policy White Paper
Statistics South Africa (Stats SA), 2018, Mid-year population estimates 2018. Retrieved online at
http://www.statssa.gov.za/?p=11341
Sun, H., and Zhang, P. 2006, The role of moderating factors in user technology acceptance.
International Journal of Human-Computer Studies (IJHCS), 64(2) 53-78.
Surendran, P. 2012, ‘Technology acceptance model: A survey of literature’, International Journal of
Business and Social Research, 2, 175–178
Steenkamp, F. and Bhorat, H. 2016, The role of skills and education in predicting microenterprise
performance. LMIP Report No. 26.
Stevens, J. 2002, Applied multivariate statistics for the social sciences (4th Ed.). Mahwah, NJ:
Lawrence Erlbaum Associates
Steyn, A. 2011, ‘E-Skills for entrepreneurs: A preliminary study’, In ResNes Colloquium, October 2011
East London, SA.
Tabachnick, B. G. & Fidell, L. S. 2007, Using Multivariate Statistics. 5th ed. California: Pearson.
Tambotoh, J., Manuputty, A., & Banunaek, F. 2015, Socioeconomic Factors and Information Adoption
in Rural Areas. Procedia Computer Science, 72(1), 178–185.
Tan, P 2013, ‘Applying the UTAUT to Understand Factors Affecting the Use of English E-Learning
Websites in Taiwan’, Sage Open, October-December 2013, pp. 1 -12.
Tarutė, A. & Gatautis, R. 2014, ICT impact on SMEs performance. Procedia - Social and Behavioural
Sciences, 110:1218-1225.
Tashakorri, A. & Teddlie, C. 2010, Putting the human back in “human research methodology:” the
researcher in mixed methods research. Journal of mixed methods research, 4(4):271-277, Oct.
Taylor, S., & Todd, P. 1995, Understanding Information Technology Usage: a Test of Competing
Models. The Journal of Information Systems Research, 6(2),144–176.
Taylor, S & Todd, P. 1995a, 'Assessing it usage: the role of prior experience', MIS Quarterly, vol. 19,
no. 4, pp. 561-70, viewed 30 August 2004.
Taylor, S., and Todd, P. 1995b, Decomposition and crossover effects in the theory of planned
behaviour: A study of consumer adoption intentions. International Journal of Research in Marketing,
12(2) 137-155.
Teddlie, C., & YU, F., 2007. Mixed Methods Sampling: A Typology With Examples. Journal of Mixed
Methods Research, 1(1), 77–100.

124 | P a g e
The World Bank 2012,” Mobile Usage at the Base of the Pyramid in South Africa”, accessed online
http://www.infodev.org/en/Publication.1193.html.
Seed Academy, 2017, The Real State of Entrepreneurship Survey 2017, Retrieved online
https://www.seedengine.co.za/wp-content/uploads/2018/03/Seed-Academy_Real-State-of-
Entrepreneurship-Survey-Results-2017.pdf
Seed Academy, 2018, The Real State of Entrepreneurship Survey 2018, Retrieved online
https://wdbinvestments.co.za/wp-content/uploads/2018/11/Real-State-of-Entrepreneurship-Survey-
Results-2018.pdf
Thomas, T., Lenandlar, S., & Kemuel, G. 2013, The utility of the UTAUT model in explaining mobile
learning adoption in higher education in Guyana. International Journal of Education and Development
Using Information and Communication Technology, 9(3), 72–87.
Thompson, R., Higgins, C. & Howell, J. 1991, ‘Personal computing: Toward a conceptual model of
utilization’, MIS Quarterly, 15, 124-143.
Timm, S. 2012, “How the state and private sector can partner to boost support to SMEs: Lessons from
Chile & Malaysia”, Pretoria
Torero, M., and von Braun, J. 2006, Information and Communications Technologies for
Development and Poverty Reduction: The Potential of Telecommunications. Baltimore: The Johns
Hopkins University Press.
Tsoabisi, S. 2012, Supporting small medium and micro enterprises in South Africa. Mediterranean
Journal of Social Sciences, 3(12).
Turabian, K. 2013, A Manual for Writers of Research Papers, Theses, and Dissertations, Eighth Edition
(8th ed.). Chicago: Chicago University Press.
Turocy, P. S. (2002). Survey research in athletic training: The scientific method of development
and implementation. Journal of Athletic Training, 37(4S), 174-179.
Twinomurinzi, H., Phahlamohlaka,J., and Byrne, E. 2012, The small group subtlety of using ICT for
participatory governance: A South African experience. Government Information Quarterly, 29(2012),
203‐211.
Underhill Corporate Solutions (UCS) 2011, “Literature review on small and medium enterprises’
access to credit and support in South Africa”, Pretoria. Report prepared for the National Credit
Regulator, Pretoria.
Urquhart, C., Liyanage,S., & Kah, M. 2008, ICT and poverty reduction: A social capital and
knowledge perspective. Journal of Information Technology, 23, 203‐213.
Vandekerckhove, J., Matzke, D., Wagenmakers, E., 2015, Model Comparison and the Principle of
Parsimony. The Oxford Handook of Computational and Mathematical Psychology, Oxford University.
Vatanasakdakul, S., Aoun, C., Putra, Y.H.S., 2019, Connecting the Dots through Social Media: A
Lifeline for Micro Enterprises. Macquarie University.
Venkatesh, V., Thong, J., & Xu, X., 2012, Consumer acceptance and user of information technology:
Extending the unified theory of acceptance and use of technology. MIS Quarterly, 36(1), 157-178.
125 | P a g e
Venkatesh, V., & Zhang, X. 2010, Unified theory of acceptance and use of technology: US vs. China.
Journal of Global Information Technology Management, 13(1), 5-27
Venkatesh, V. 2006, “Where to go from here? Thoughts on future directions for research on individual-
level technology adoption with a focus on decision making”, Decision Sciences, 37, 497–518.
Venkatesh, V., Morris, M.G., Davis, G.B. & Davis, F.D. 2003,’User acceptance of information
technology: toward a unified view’, MIS Quarterly, 27(3), pp. 425-478.
Venkatesh, V. 2000, “ Determinants of perceived ease of use: Integrating perceived behavioural control,
computer anxiety and enjoyment into the technology acceptance model”, Information Systems
Research, 11, 342–365.
Venkatesh, V., & Davis, F 2000,” A theoretical extension of the technology acceptance model: Four
longitudinal field studies”, Management Science, 46, 186–204.
Venter, P., van Rensburg, M. J., & Davis, A. 2012, Drivers of learning management system use in a
South African open and distance learning institution. Australasian Journal of Educational Technology,
28(2).
Vrieze, S. I. 2012, Model selection and psychological theory: A discussion of the differences between
the Akaike Information Criterion (AIC) and the Bayesian Information Criterion (BIC). Psychological
Methods, 17, 228-243.
Vyhmeister, N. & Robertson, T. 2014, Quality Research Papers: For Student of Religion and Theology,
Andrews University, United States of America.
Walker, E. 2011, ‘Intermediate Statistics’, South Orange, New Jersey.
Wang, H. and Yang, H. 2005, The Role of Personality Traits in UTAUT Model under Online Stocking.
Contemporary Management Research, 1(1) 69-82.
Weiner, S.A. 2013, Overview: The role of information policy in resolving global challenges.
Global Policy Research Institute (GPRI) Policy Briefs, 1(1), Article 6.
Weitzner, M. A., Meyers, C. A., Steinbruecker, S., Saleeba, A. K., & Sandifer, S. D. 1997, Developing
a care giver quality-of-life instrument: Preliminary steps. Cancer Practice, 5(1), 25-31
Westfall, P.H., 2014. Kurtosis as Peakedness, 1905 – 2014. R.I.P. The American Statistician, 68, 191–
195
Wilson, J. 2010, Essentials of Business Research: A Guide to Doing Your Research Project. Calfornia:
SAGE Publications.
Winter, J. & Dodou, D. 2012, Factor recovery by principal axis factoring and maximum likelihood
factor analysis as a function of factor pattern and sample size. Journal of Applied Statistics, 39(4), pp.
695-710.
Wolcott, P., Kamal, M., & Qureshi, S. 2008, Meeting the challenges of ICT adoption by
microenterprises. Journal of Enterprise Information Management, 21(6), 616-632.
Wong, P.K., Ho, Y.P., Autio, E. 2005, “Entrepreneurship, Innovation and Economic Growth: Evidence
from GEM data”. Small Bus. Econ. 24(3): 335-350

126 | P a g e
Wu, J. 2006, Factors that influence the adoption of internet banking by South Africans in the Ethekweni
metropolitan region. Master of Technology: Marketing. Durban: Durban Institute of Technology.
Williams, C. (2007). Research Methods. Journal of Business & Economic Research, 5(3), 65–72.
Xia, W. & Lee, A. 2000, ‘The influence of persuasion, training and experience on user perceptions and
acceptance of IT innovation’, Proceeding of the 21st international conference on Information Systems,
Brisbane, Queensland, Australia.
Yang, Y., Zhiling, Z., & Mu, Z. 2013, Predicting Tourists Decisions to Adopt Mobile Travel Booking.
International Journal of U - and E - Service, Science and Technology, 6(6), 9–20.
Yang, A. S. 2009, Exploring Adoption Difficulties in Mobile Banking Services. Canadian Journal of
Administrative Science, 26(2), 136–149.
Yang, Y., & Land, K.C. 2008, ‘Age - period - cohort analysis of repeated cross-section surveys: Fixed
or random effects?’, Sociological Methods & Research, 36, 297–326.
Yang, K., & Forney, J. C., 2013. The moderating role of consumer technology anxiety in mobile
shopping adoption: differential effects of facilitating conditions and social influences. Journal of
Electronic Commerce Research, 14(4), 334.
Yong, A. G. & Pearce, S. 2013, A Beginner's Guide to Factor Analysis: Focus on Exploratory Factor
Analysis. Tutorials in Quantitative Methods for Psychology, 9(2), pp. 79-94.
Yu, T.K., Lin, M.L., & Liao, Y.K. 2017, Understanding factors influencing information communication
technology adoption behaviour: The moderators of information literacy and digital skills. Computers in
Human Behavior.
Yu, C. 2012, ‘Factors Affecting Individuals to Adopt Mobile Banking: Empirical Evidence from the
UTAUT model’, Journal of Electronic Commerce Research, VOL13, NO 2, 2012
Yuksel, A. & Yuksel, F. 1977, ‘Consumer satisfaction theories: A critical review’, 1977.
Zhao, H., Seibert, C., & Hills, C. 2005,’The mediating role of self-efficacy in the development of
entrepreneurial intentions’, Journal of Applied Psychology, 90(2), 1265–1272.
Zhou, T. 2011, ‘Understanding mobile Internet continuance usage from the perspectives of UTAUT and
flow’, Information Development, 27 (3): 207-218

127 | P a g e
SECTION 2
SECTIONS 3 - 8
SECTION 3
Performance Expectancy
Use of mobile applications enables me to accomplish tasks more quickly.
Use of mobile applications enhances the effectiveness of my business.
I find mobile applications useful in my business.
Appendix A (adapted from Venkatesh et al. 2003)
SELF REPORT
How long have you been using the Mentoring
Applications?
a.) Less than 6 months
b.) Between 6 and 12 months
c.) more than a
year
At present, how often do you use the Mentoring
Applications?
a.) once a day d.) several times a day g. other
b.) once a week e.) several times a week
c.) once a month f.) several times a month
Rate your satisfaction level using the Mentoring
Application
a.) Satisfied
b.) Neither Satisfied nor Dissatisfied
c.) Dissatisfied
For the following questions, indicate the extent of your agreement or disagreement you give to each
factor by marking it with an X according to the scale.
Rating Response Mode Description
5 Strongly Agree
4 Agree
3 Undecided
2 Disagree
1 Strongly Disagree
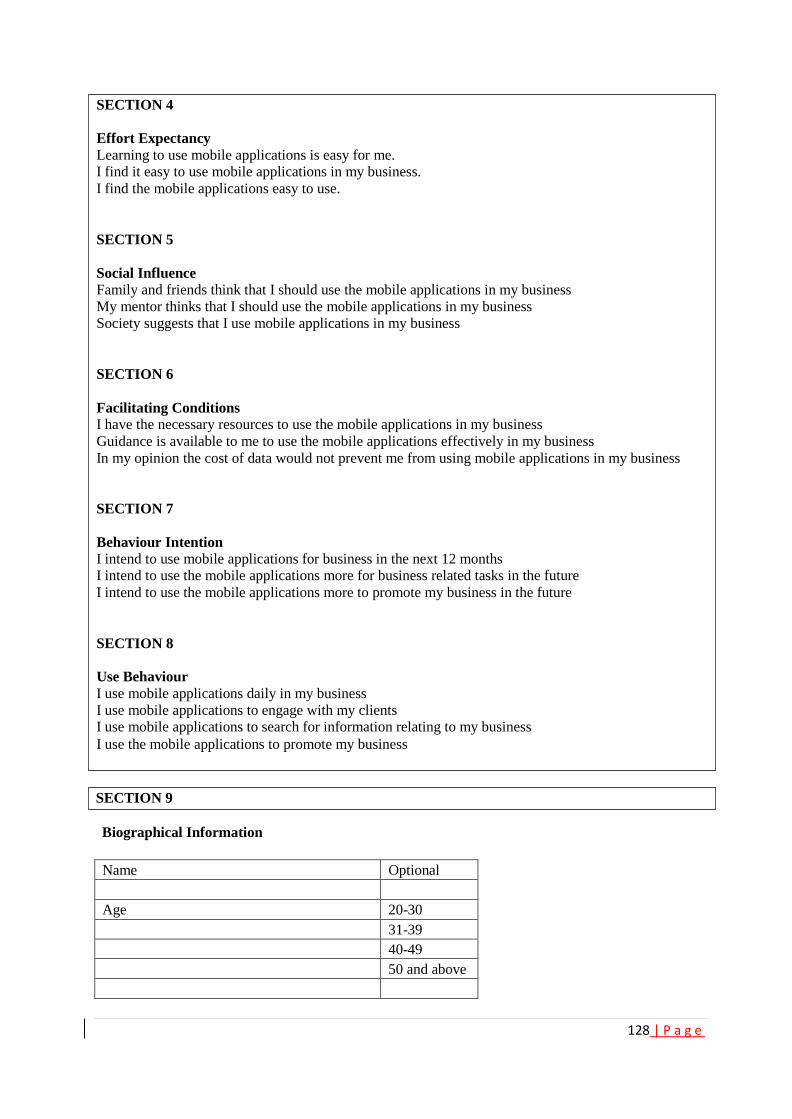
128 | P a g e
SECTION 9
Biographical Information
Name Optional
Age 20-30
31-39
40-49
50 and above
SECTION 4
Effort Expectancy
Learning to use mobile applications is easy for me. I find it easy to use mobile applications in my business.
I find the mobile applications easy to use.
SECTION 5
Social Influence
Family and friends think that I should use the mobile applications in my business
My mentor thinks that I should use the mobile applications in my business
Society suggests that I use mobile applications in my business
SECTION 6
Facilitating Conditions
I have the necessary resources to use the mobile applications in my business
Guidance is available to me to use the mobile applications effectively in my business
In my opinion the cost of data would not prevent me from using mobile applications in my business
SECTION 7
Behaviour Intention
I intend to use mobile applications for business in the next 12 months I intend to use the mobile applications more for business related tasks in the future
I intend to use the mobile applications more to promote my business in the future
SECTION 8
Use Behaviour
I use mobile applications daily in my business
I use mobile applications to engage with my clients I use mobile applications to search for information relating to my business
I use the mobile applications to promote my business
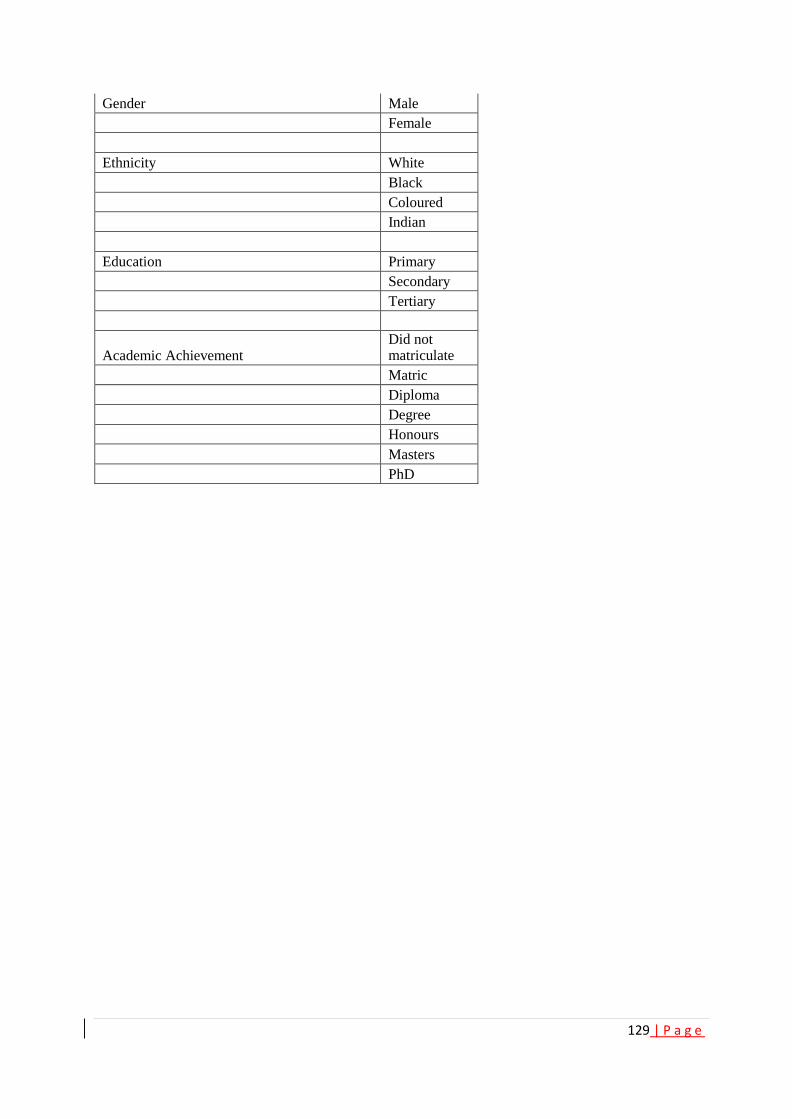
129 | P a g e
Gender Male
Female
Ethnicity White
Black
Coloured
Indian
Education Primary
Secondary
Tertiary
Academic Achievement Did not matriculate
Matric
Diploma
Degree
Honours
Masters
PhD
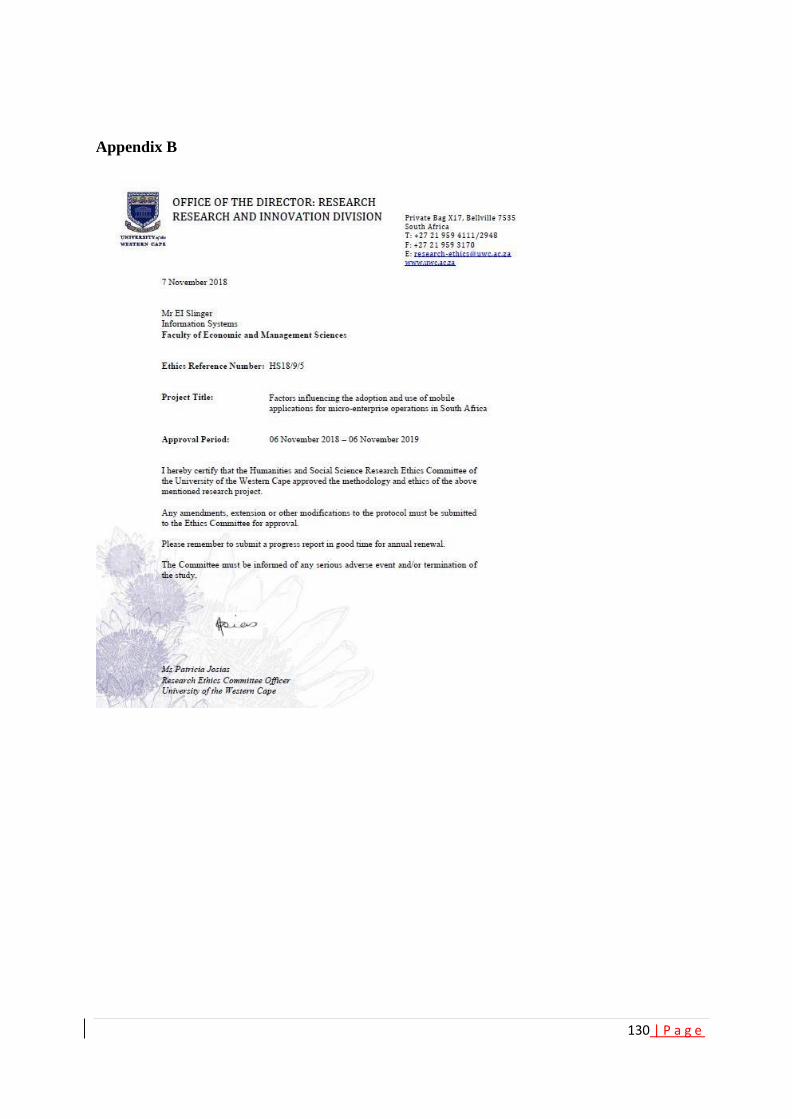
130 | P a g e
Appendix B