Factors influencing service provision by cooperative ...
88
FACTORS INFLUENCING SERVICE PROVISION BY COOPERATIVE SOCIETIES IN KIGUMO DISTRICT, MURANG’A COUNTY, KENYA BY NDUATI STEPHEN NJUGUNA ‘ 0 ^ A RESEARCH PROJECT REPORT SUBMITTED IN PARTIAL FULFILMENT OF THE REQUIREMENTS FOR THE AWARD OF A MASTER OF ARTS DEGREE IN PROJECT PLANNING AND MANAGEMENT OF THE UNIVERSITY OF NAIROBI 2012 A
Transcript of Factors influencing service provision by cooperative ...

FACTORS INFLUENCING SERVICE PROVISION BY
COOPERATIVE SOCIETIES IN KIGUMO DISTRICT,
MURANG’A COUNTY, KENYA
BY
NDUATI STEPHEN NJUGUNA
‘ 0 ^
A RESEARCH PROJECT REPORT SUBMITTED IN PARTIAL
FULFILMENT OF THE REQUIREMENTS FOR THE AWARD OF A
MASTER OF ARTS DEGREE IN PROJECT PLANNING AND
MANAGEMENT OF THE UNIVERSITY OF NAIROBI
2012
A

DECLARATION
This research project report is my original work and has not been presented for any award in any other
university:
Signature .Date. 0 3 - ^ ' •R'fc \
STEPHEN NJUGUNA NDUATI
L50/64996/2010
" tThis research project report has been submitted for examination with my approval as a University
supervisor:
Date..... O fc 0 ± M .% * .
MR. JOHNBOSCO KISIMBII
LECTURER, DEPARTMENT OF EXTRA MURAL STUDIES
UNIVERSITY OF NAIROBI
11

DEDICATION
This work is dedicated to my wife Beatrice for her unconditional love, support and encouragement
throughout the study.
111

ACKNOWLEDGEMENT
I wish to express sincere gratitude to the almighty God for his grace throughout my life and
for the good health that has made the rigorous process of development of this research
proposal bearable. I am greatly indebted to my supervisor Mr Johnbosco Kisimbii of the
University of Nairobi for his invaluable guidance and support in the development of this
research proposal. I also wish to thank Mr. Simon Mwangi whose Information Technology
skills facilitated the production of this document. I wish to thank my classmates for their
moral support'in the entire period we were together in and out of class. To all other persons
who contributed to the development of this research proposal I say a big thank you and may
God bless you all.
< .
IV

TABLE OF CONTENTS
DECLARATION................
DEDICATION.....................
ACKNOWLEDGEMENT..
TABLE OF CONTENTS.,,,
LIST OF TABLES.....................................................4/ , .
LIST OF FIGURES.................. ................... .............
ABBREVIATIONS AND ACRONYMS.................< .
ABSTRACT................................................................
CHAPTER ONE: INTRODUCTION.....................
1.1 Background to the study..............................
1.2 Statement of the problem.............................
1.3 Purpose of the study.....................................
1.4 Objectives of the study................................
1.5 Research questions.......................................
1.6 Significance of the study..............................
1.7 Basic assumptions of the study...................
1.8 Limitations of the study...............................
1.9* Delimitations of the study............................
1.10 Definition of significant terms....................
Page
. ii
iii
iv
.. v
, ix
x
. xi
xii
.. 1
.. 1
. .4
. . 5
..6
..6
..6
..7
..7
..8
.. 8
v

1.11 Organization of the study 9
CHAPTER TWO:LITERATURE REVIEW....................................................................... 10
2.1 Introduction'.................................................................................................................10
2.2 The concept of cooperatives.........................................................................................10
2.3 Evolution of the cooperative movement......................................................................11
2.4 The significance of cooperatives in Kenya’s economy............................................... 14
2.5 Cooperative development policy in Kenya................................................................. 15
2.6 The Kenyan cooperative legislation............................................................................ 15
2.7 Cooperative movement in the coffee subsector..........................................................17
2.7.1 Coffee factories........................................................................................................17< .
2.7.2 Cooperative societies.............................................................................................. 17
2.7.3 District cooperative unions...........................!....................................................... 18
2.7.4 Coffee milling......................................................................................................... 18
2.7.5 Coffee Board of Kenya........................................................................................... 18
2.7.6 Kenya Coffee Cooperatives Exporters Limited (KCCE)......................................19
2.8 Review of related literature......................................................................................... 20
2.8.1 Agricultural Extension, Training and Information Services.................................. 20
2.8.2 Coffee pricing..........................................................................................................21
2.8.3 Access to Credit and Inputs.....................................................................................22
2.8.4 Cooperative governance........................................................................................ 24
2.9 - Theoretical framework.................................................................................................. 26
vi

2.10 Conceptual framework 28
2.11 Summary of Literature.................................................................................................. 30
CHAPTER THREE: RESEARCH METHODOLOGY..................................................... 32
3.1 Introduction.................................................................................................................. 32
3.2 Research Design...........................................................................................................32
3.3 Target population..........................................................................................................32
3.4 Sample size and sampling procedures........................................................................ 33
3.5 Data collection Methods..............................................................................................34
3.6 Validity and reliability of instrument..........................................................................35
3.6.1 Validity of the instrument....................................................................................... 35< .
3.6.2 Reliability of the instruments................................................................................. 36
3.7 Data collection procedures.................................. '....................................................... 36
3.8 Ethical considerations.................................................................................................. 37
3.9 Data analysis techniques..............................................................................................37
3.10 Operational definition of variables..............................................................................37
CHAPTER FOUR:DATA ANALYSIS, PRESENTATION AND INTERPRETATION
......................................................................................................................................................39
4.1. Introduction.................................................................................................................. 39
4.2. Response Rate.............................................................................................................. 39
4.3. Demographic characteristics of respondents...............................................................40
4.4. Governance and agricultural extension by coffee farmers’ cooperative societies....42 * ^
4.5. Coffee price fluctuations among by coffee farmers’ cooperative societies.............. 45
vii

4.6. Access to credit facilities by farmers in Kigumo district coffee cooperatives 50
4.7. Factors influencing service provision by coffee cooperative societies..................... 52
CHAPTER FIVE: SUMMARY OF FINDINGS, DISCUSSIONS, CONCLUSIONS
AND RECOMMENDATIONS................................................................................................ 56
5.1 Introduction...................................................................................................................56
5.2 Summary of findings................................................................................................... 56
5.3 Discussions....................................................................................................................57
5.4 Conclusions...................................................................................................................58
5.5 Recommendations........................................................................................................59
5.6 Suggestions for Further research................................................................................. 61
< .REFERENCES.......................................................................................................................... 62
APPENDICES.............................................................. 66
Appendix 1: Transmittal Letter...................... 66
Appendix 2: Coffee Farmers’ Questionnaire.............................................................................67
Appendix 3: Cooperative Managers Questionnaire................................................................... 71
vm
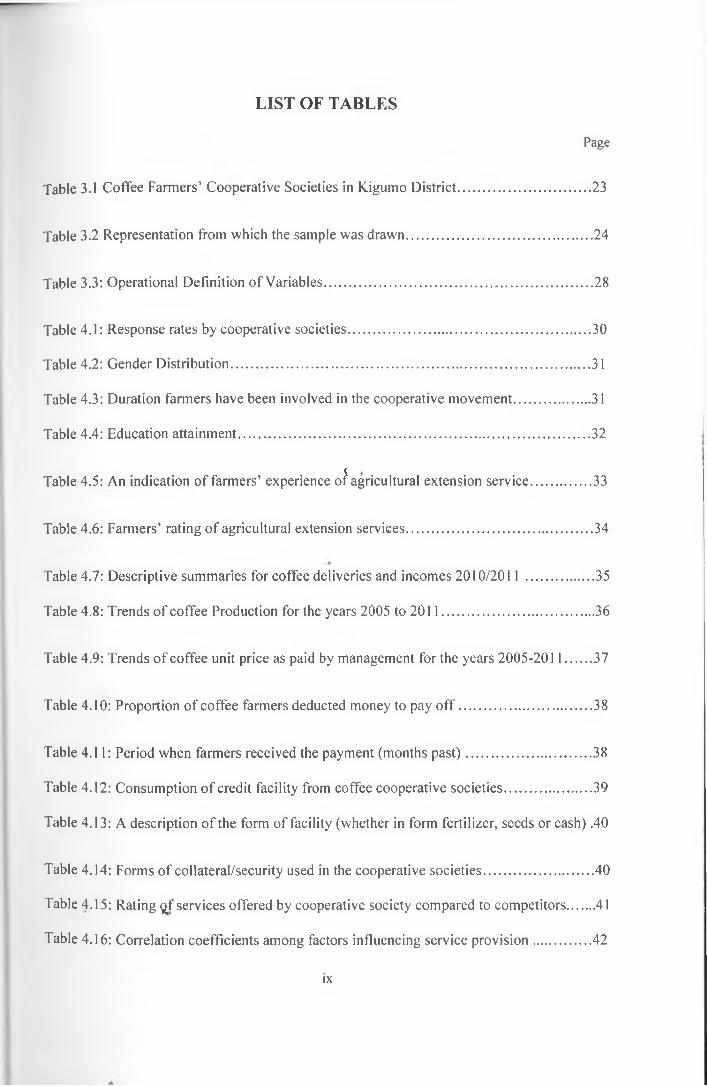
LIST OF TABLES
Page
Table 3.1 Coffee Farmers’ Cooperative Societies in Kigumo District.................................... 23
Table 3.2 Representation from which the sample was drawn...................................................24
Table 3.3: Operational Definition of Variables......................................................................... 28
Table 4.1: Response rates by cooperative societies.................................................................. 30
Table 4.2: Gender Distribution.................................................................................................. 31
Table 4.3: Duration farmers have been involved in the cooperative movement.....................31
Table 4.4: Education attainment................................................................................................ 32
Table 4.5: An indication of farmers’ experience of agricultural extension service.................33
Table 4.6: Farmers’ rating of agricultural extension services...................................................34
Table 4.7: Descriptive summaries for coffee deliveries and incomes 2010/2011 ...................35
Table 4.8: Trends of coffee Production for the years 2005 to 2011..........................................36
Table 4.9: Trends of coffee unit price as paid by management for the years 2005-2011....... 37
Table 4.10: Proportion of coffee farmers deducted money to pay o f f .................................... 38
Table 4.11: Period when farmers received the payment (months past).................................. 38
Table 4.12: Consumption of credit facility from coffee cooperative societies........................39
Table 4.13: A description of the form of facility (whether in form fertilizer, seeds or cash) .40
Table 4.14: Forms of collateral/security used in the cooperative societies.............................. 40
Table 4.15: Rating <̂ f services offered by cooperative society compared to competitors....... 41
Table 4.16: Correlation coefficients among factors influencing service provision................42
IX

LIST OF FIGURES
Page
Figure 1 Conceptual framework 20

ABBREVIATIONS AND ACRONYMS
AGM - Annual General Meeting
ASDS - Agricultural Sector Development Strategy
CBK - Coffee Board of Kenya
CIC - Cooperative Insurance Company
ICA - International Cooperatives Alliance
ICT - Information Communication Technology
KCC - Kenya Cooperative Creameries
KCCE - Kenya Coffee Cooperative Exporters Limited
KMC - Kenya Meat Commission
KPCU - Kenya Planters Cooperative Union
KUSCCO - Kenya Union of savings and Credit Cooperatives
NCPB - National Cereals and Produce Board
PBK - Pyrethrum Board of Kenya
SACCO - Savings and Credit Cooperative Society
SRA - Strategy for Revitalizing Agriculture

ABSTRACT
Marketing cooperatives are important in the provision of credit both in cash, and delivery of various inputs including fertilizers, crop protection chemicals, and pumps for spraying crops and extension services. However, since the era of liberalization in the 1990s, these roles have diminished leading to low levels of satisfaction with cooperatives’ service delivery on the part of coffee farmers. Production quantities are erratic and farm level earnings from coffee are relatively low despite the recent rise in global prices of coffee. The result is disincentive in coffee farming and substitution to other crops. The objectives of the study were to investigate how governance influences service provision by cooperative societies in Kigumo District, to determine the extent to which coffee price fluctuations influence service provision by coffee cooperative societies to their members in Kigumo District and to find out how access to credit facilities influence service provision by cooperative societies to their members in Kigumo District. Literature reveals that, coffee cooperative societies in the region are marred by mismanagement and corrupt practices which impairs service delivery. The target population was all coffee farmers in Kigumo district and the management committee of the selected coffee cooperative societies. The study used descriptive research design and randomized sampling. Primary data was collected by structured questionnaire from 199 coffee farmers and secondary data from management committee were used to provide information on the issues under investigation. The data was coded, entered and analyzed using the Statistical Package for Social Sciences (SPSS). Results indicate the coffee industry in Kigumo district has recorded erratic production fluctuation for the 2005/6 to 2011/12 period. Prices have been on the increase but the variance has differed across the societies. The study found that good governance promotes service delivery and vice versa. Thus indicators of good governance such as level of education of managers, managerial training and experience are fundamental to provision of quality services to coffee cooperatives. It was noted that the coffee industry experiences fluctuations in unit coffee prices. Low coffee prices reduce coffee farmers’ satisfaction with service provision by the cooperative and lead to decline in production. Access to credit facilities is not of significant influence to service provision. However, the direction of relationship is such that higher access to credit increases satisfaction with services provided. The researcher recommends that the government comes up with a criterion of selecting management committees, increases agricultural extension workers and seeks alternative markets to stabilize prices and production. To understand the role played by other stakeholders in coffee sector, further studies can be conducted to investigate the role of microfinance institutions and banks in improving production and hence livelihoods of coffee farmers in Kenya. A comparative study may be useful to document lessons learnt from neighboring countries that have success stories in service provision within coffee cooperatives.
xii

CHAPTER ONE
INTRODUCTION
1.1 Background to the study
The Co-operative Movement brings together over 1 billion people around the world. The
United Nations estimate that the livelihood of nearly 3 billion people is made secure by co
operative enterprise. These enterprises continue to play significant economic and social roles
in their communities. In Kenya every one person in five is a member of a co-operative
society. In addition, 5.9 million and 20 million Kenyans directly and indirectly derive their
livelihood from the Co-operative Movement. (ICA, 2002)< .
According to the Wikipedia, The cooperative movement began in Europe in the 19th century,
primarily in Britain and France, although The Shore Porters Society claims to be one of the
world's first cooperatives, being established irj Aberdeen in 1498. The industrial revolution
and the increasing mechanization of the economy transformed society and threatened the
livelihoods of many workers thus exciting the cooperative spirit in the workers.
(http://en.wikipedia.org/wiki/Historyofthecooperativemovement)
According to Lampe, 2000, the first documented cooperative society was founded in 1769, in
a barely furnished cottage in Fenwick, East Ayrshire. In the decades that followed, several
cooperative societies were formed and today, co-operative communities are widespread all
over the world. Agricultural cooperatives form 46 per cent of all cooperative societies in
Kenya. They have 3 million members out of a total membership of 8 million in the entire
cooperative movement. (Republic of Kenya, 2010)
Cooperative development in Kenya, like in most African countries, has generally traversed
two main eras, namely, the era of state control and that of liberalization. The first era, which
saw the origin and substantial growth of cooperatives under state direction, conditioned these
organizations to emerge as dependent agents and/ or clients of the state and other semi-public
agencies. By serving as instruments for implementing government socio-economic policies,
cooperatives were engulfed into state politics to the extent that the failures of state policies
found expression in the cooperative movement. This partly explains why literature on
cooperatives in this era is awash with more stories of cooperative failure than stories of
cooperative success. Such failures contributed to calls for the liberalization of the cooperative
movement in the early 1990s (Hussi et al, 1993; Porvali, 1993; Lindberg, 1993).
With the argument that state control was stifling the performance of cooperatives and
that their potential contribution to development could only be realized if they operated
according to market principles, cooperative development was pushed into the second era that
was characterized by economic liberalization. { Consistent with the new economic
environment that was sweeping across Africa in the 1990s, Kenya introduced new policy and
legislation in 1997 in order to liberalize cooperatives. The resultant framework sought to
facilitate the development of commercially autonomous, member-based cooperative
organizations, which would be democratically and professionally managed, self-controlled
and self-reliant business enterprises (Wanyama, 2009)
Whereas cooperative development in Kenya during the first era is well documented in the
existing literature, the second era of cooperative development is yet to be adequately
researched and understood. It is over a decade since the introduction of liberalization
measures in Kenya, yet since then very little is known about the unfolding status of the
cooperative movement. The few studies available tend to focus on disparate economic sectors
ot the cooperative movement, rather than providing comprehensive accounts that inform of
the current status and functioning of cooperatives. Studies have focused on savings and credit
2

(Evans, 2002); agriculture (ICA, 2002); and dairy production (Staal et al, 1997; Owango et al,
1998).
Cooperatives and in particular agricultural cooperatives play a major role in production,
primary processing and marketing of agricultural and livestock commodities. The general
objective of the organizations is to promote the economic interests and general welfare
of members in accordance with cooperative values and principles. The performance of
Agricultural cooperatives is critical in economic growth and poverty alleviation in the
country (Hussi 1993)
The justification for cooperatives arises from their potential in maximization of profits,
harnessing various skills with members, enhancing advocacy and bargaining power,
enhancing financial accessibility, boosting social capital, promoting investment,
providing educational opportunities, improving market access and contributing to poverty
reduction (Damianopoulos 2005)
The Strategy for Revitalizing Agriculture (SRA 2004 - 2014) recognizes and stipulates the
crucial roles of cooperative movement or producer organizations in Kenya. It is clear
that Kenya’s agriculture is predominantly small scale accounting for 70% of the total
agricultural output and 70% of marketed agricultural produce. Processing and marketing
is organized through farmers’ organizations, cooperatives and statutory bodies. Through the
SRA, the government recognizes the need for urgently improving management
structures and accountability of cooperatives. The organizations are expected to take
over the roles that were previously undertaken by Statutory Boards and Parastatals.
(Republic of Kenya, 2004)
Kigumo District is one of the districts in Murang'a County within Central Kenya with the
headquarters located at Kigumo Township. It is a high potential agricultural area on the
3

eastern slopes of the Aberdare ranges with good soils and favorable rainfall. Agriculture
dominates the economy of Kigumo district and provides livelihood to over 80% of the
population and employs 75% of the population. Coffee is the main agricultural enterprise and
the major source of income in the district. (Murang'a South district development plan, 2008 -
2012)
The district has four divisions namely Kangari, Kigumo, Muthithi and Gacharage and five
locations namely Kangari, Kigumo, Kinyona, Kahumbu, and Muthithi location. The district
covers a geographical area of approximately 285 km2. The district has four coffee farmers’
cooperative societies namely Muthithi, Kangiri, Marumi, and Thangaini coffee farmers
cooperative societies. In addition there is one transport SACCO namely Kigumo travellers
SACCO limited and one dairy SACCO namely Ahadi dairy SACCO.
1.2 Statement of the problem
Small-scale production dominates the Kenyan coffee sector with over 75 percent of land
under production controlled by smallholder farmers. The large fixed costs involved in the
processing and marketing of coffee, along with the additional hindrance of inadequate
transportation, communication and banking infrastructure poses significant challenges to
smallholder profitability. For this reason, the smallholder coffee sector has traditionally been
organized into cooperatives in order to facilitate regulation and to improve the effectiveness
and efficiency of smallholder coffee production, marketing and the provision of key inputs
such as fertilizers, pesticides, credit and extension services (Mude, 2006).
However, the foregoing is not the case due to the fact that the farmer is not receiving the right
services at the right time including the nonexistence of some of the services expected of the
cooperatives such as extension services, provision of credit and farm inputs.Art
4

According to the Agricultural Sector Development Strategy (ASDS) 2010 - 2020, the main
task of cooperatives is to collect (and process) members’ produce, store, and then
transport it to designated buyers and agents. They also receive payments for the produce
delivered and pass this to the members. In addition, cooperatives are important in the
provision of credit both in cash, and delivery of various inputs including fertilizers, crop
protection chemicals, and pumps for spraying crops and extension services. These roles have
however diminished in this post liberalization period leading to the growth of private coffee
marketing channels which involves middlemen buying coffee from farmers directly and
selling the berries to private millers. The downside of this channel is that coffee farmers are
heavily exploited leading to crop substitution. In Kigumo district (between the years 1990
and 2000), many farmers indeed uprooted coffee plants and replaced them with tissue culture
and indigenous bananas whose marketing couldt allow them exercise better control. If no
corrective measures are put in place, then the future of coffee production is bleak.
This study sought to establish the factors that influence service provision by cooperative
societies to their members by studying selected coffee cooperatives in Kigumo District of
Murang’a County.
1.3 Purpose of the study
The study investigated the factors which influence service provision by cooperative societies
in Kenya with a case study of cooperative societies in Kigumo district.
5

1.4 Objectives of the study
The objectives of this study drawn from the purpose were:
1 To investigate how governance influences service provision by cooperative societies
in Kigumo District.
2. To determine the extent to which coffee price fluctuations influence service provision
by coffee cooperative societies to their members in Kigumo District.
3. To find out how access to credit facilities influence service provision by cooperative
societies to their members in Kigumo District.
1.5 Research questions< .
The research questions were:
1. How does governance influence service provision by cooperatives to their members in
Kigumo District?
2. What is the extent to which coffee price fluctuations influence service provision by
cooperatives in Kigumo District?
3. How do access to credit facilities influence service provision by cooperatives to their
members in Kigumo District?
1.6 Significance of the study
The study is considered beneficial to cooperative development policy makers by providing
information on the'.extent to which factors such as credit access, governance, prices, and
6

availability of extension services affect cooperatives. The government can then intervene
from an informed point of view and enhance better service provision by cooperative societies
to their members.
Bv facilitating informed policy decisions the study can benefit the members of the
cooperative societies who will enjoy the quality goods and services provided by their
cooperatives.
To other scholars, this study is a reference material as far as the factors influencing
cooperatives in provision of services to their members in Kigumo district is concerned.
1.7 Basic assumptions of the study
This study was based on the following assumptions:.
1. The sampled cooperatives and members are representative of the existing situation of
the rest of the cooperatives in Kigumo district.
2. The respondents would give truthful answers in the survey.
1.8 Limitations of the study
Limitations anticipated included time, money, and accessibility of information. The study
was expected to take at least two months given its scope which was the case. The study
requires substantial amount of money for data collection, analysis and presentation. Data
required from the cooperative management are classified, confidential and was hard to get.
Good anticipation however led to a high response rate.
#«•
7

1.9 Delimitations of the study
This study investigated the factors that influence service delivery by cooperative societies to
their members. Cooperatives are distributed countrywide and they share a similar
organizational structure. The researcher did not intend to carry out the research in the entire
republic since it is expensive and duplication of the research process.
Similarly, the researcher acknowledges the fact that there are many other factors that
influence service delivery in cooperative societies. It is the opinion of the researcher that by
focusing on produce market prices, availability of credit services, availability of extension
services, and management skills, the research became more purposeful.
1.10 D efinition o f sign ificant term s
Cooperative society - Cooperatives are user-owned, user controlled and user-benefited< .
organizations. They could be agricultural, non-agricultural, unions or Savings and Credit
Cooperatives (SACCOs). They operate in different sectors of the Economy including
agricultural, handicraft, Jua Kali, transport, housing, development, building and construction,
consumer services, banking and insurance.
Liberalisation - refers to a relaxation or withdrawal of previous government restrictions or
official state intervention, in the cooperative movement
Cooperative extension service - extension education consists of a series of embedded
communicative interventions that are meant among others to induce interventions which
supposedly help to resolve problematic issues in agriculture. The Cooperative Extension
Service is a non-formal educational program designed to help people use research-based
knowledge to improve their lives through the improved ways of farming, pest control,
improved technologies and crop varieties.
Prices - Prices meanj> and includes both the world market prices at the coffee auction and the
producer or farm gate prices.
8

Chapter one covers the background information, statement of the problem, purpose,
objectives, research questions, significance, basic assumptions, and limitations of the study.
Chapter two covers literature review, the cooperative organizational network, significance of
cooperatives, cooperative development policy and legislation and the status of the
cooperative movement in the coffee subsector in Kenya.
Chapter three documents the methodology that was used in gathering data. It covers research
design, target population, sample design, data collection, data analysis, ethical issues and
operationalization of the variables. Chapter four gives a presentation of the findings. Chapter
five presents a summary of the key findings, a comparative discussion and conclusions based
on research objectives and recommendations, policy action and further research< .
I l l Organization of the study
9

CHAPTER TWO
LITERATURE REVIEW
2.1 Introduction
This chapter gives a detailed literature on the evolution of the cooperative movement in
Kenya, the cooperative organizational network in Kenya, significance of cooperatives in
Kenya, cooperative development policy and legislation in Kenya and the status of the
cooperative movement in the coffee subsector. It also looks at the services offered by
cooperative societies.< .
2.2 The concept of cooperatives
Cooperatives are user-owned, user-controlled and user-benefit organizations. They could be
agricultural, non-agricultural, unions or Savings and Credit Cooperatives (SACCOs). They
operate in different sectors of the Economy including agricultural, handicraft, Jua Kali,
transport, housing development, building and construction, consumer services, banking
and insurance. (Gamba and Komo, 2006)
Cooperatives are member-owned businesses; they aggregate the market power of people who
on their own could achieve little or nothing, and in so doing they provide ways out of poverty
and powerlessness. The representative body for cooperatives, the International Cooperative
Alliance (ICA), defines a cooperative as an autonomous association of persons united
voluntarily to meet their common economic, social and cultural needs and aspirations,
through a jointly owned and democratically controlled enterprise.
10

This definition and the ICA set out seven cooperative principles: voluntary and open
membership; democratic member control; member economic participation; autonomy and
independence; education, training and information; cooperation among cooperatives; and
concern for community. The first four of these are core principles without which a
cooperative would lose its identity; guarantee the conditions under which members own,
control and benefit from the business. The education principle is really a commitment to
make membership effective and so is a precondition for democratic control, while
cooperation among cooperatives is a business strategy without which cooperatives remain
economically vulnerable. The last principle, concern for community, is about corporate
responsibility, and it leads into other concerns such as prevention of poverty and protection of
the environment.
< .2.3 Evolution of the cooperative movement
Gamba and Komo (2006) and Wanyama (2009) have traced the evolution of the cooperative
movement in Kenya in three eras namely pre independence era, post - independence but pre -
liberalization era and liberalization era.
2.3.1Pre- in d ep en d en ce Era
Informal producer organizations have been in existence in Kenya even before colonial period.
However, formal organizations particularly cooperatives started as early as 1908 and
membership was limited to white settlers. The first cooperative was established at
Lumbwa - Rift Valley, in present day Kipkelion area.(Wanyama, 2009)
In 1944 colonial officers opened the door for Africans to form and join cooperatives.
The Mau Mau rebellion of early 1950s had a negative effect on the cooperative members
of staff who withdrew to join pro-independence forces. However cooperatives continued 4
to grow. The reason for this growth was application of the Swynnerton plan of 1954
11

on Developing African Agriculture and Improving Land Tenure. By 1958 there were over
400 registered cooperatives. (Gamba and Komo 2006)
2.3.2 Post- in d ep en d en ce but Pre - liberalization Era
The post independence era saw the rapid rise in number of producer organizations and
the consolidation of the ones that already existed. At this time, the government saw
the cooperative movement as a vehicle to the introduction of African socialism, and for
strengthening common ties between the people from different regions of Kenya.
(Karanja, 2002)
Producer cooperatives were also directly linked to government parastatals. No individual
private traders were allowed to compete with cooperatives. Cooperatives were linked to
state run marketing corporations like National Cereals *and Produce Board (NCPB), Cotton
Board of Kenya (CBK), Pyrethrum Board of Kenya (PBK), Coffee Board of Kenya
(C3K), Kenya Meat Commission (KMC), and Kenya Cooperative Creameries (KCC).
Most of the cooperative members’ produce was sold to these corporations and the latter
then linked the cooperatives to the world market. These linkages excluded the participation
of private traders in the marketing of the agricultural produce. (Wanyama, 2009)
The direct intervention by the government in management of cooperatives compromised
the principles of member owned and run organizations. Government involvement
hindered the emergence of member-controlled cooperatives since members relied on
government to safeguard their interests. As a result, equality, equity, solidarity, democratic
principles, self-responsibility, and self- help that are important pillars of successful
producer organizations were thus hindered. This caused the cooperatives to be run as if
they were government owned instead of privately owned member organizations. (Gamba
and Komo 2006)
12

2.3.3 Era o f liberalization , structural adjustm ent and privatization
The advent of economic and political liberalization in early 1990’s heightened the need
for liberating cooperatives from government control. A new policy was consequently
formulated by 1997 to provide for a member based, autonomous and member
controlled movement. The aim was to enable cooperatives make independent decisions
concerning operations of their business and to have a level playing ground like the rest
of the private sector. New legislation was also put in place to implement this policy the
same year. (Karanja, 2002)
The liberalization period brought a wind of change in the structure and the running of the
cooperatives. Having been fully dependent on the government for the control of markets
and funding, it was difficult for them to suddenly start operating on their own. These< .
institutions were not prepared to compete with private firms that brought in high levels of
competition. (Wanyama, 2009)
The Sessional Paper no. 6 of 1997 outlined the government’s role as facilitative in nature i.e.
create an enabling environment for cooperatives to operate. The other role was regulatory
particularly in the formulation of policies and legislation. This meant no direct involvement
in the running of the cooperatives. Liberalization saw the mergers and splits of various
cooperative societies. They split into small uneconomic units. High levels of mismanagement
mainly fueled this, and other factors beyond management’s control, like fluctuating market
prices. Political influences could not be avoided and some individuals in management used
their positions to gain political leverage. (Gamba and Komo 2006)
The Cooperative Societies Amendment Bill of 2004 sought to re-introduce some degree of
government control. As much as the government would not completely leave the cooperative
sector alone without any form of regulation, it explicitly defined a clear point of intervention
13

without prejudicing its own efforts of embracing the principle of a free market economy.
2.4 The significance of cooperatives in Kenya’s economy
Kenya has a long history of cooperative development that has been characterized by strong
growth, thus making a significant contribution to the overall economy. Cooperatives are
recognized by the government to be a major contributor to national development, as
cooperatives are found in almost all sectors of the economy. With the total population of
Kenya at approximately 37.2 million (Republic of Kenya, 2008a), it is estimated that 63 per
cent of Kenya’s population participate directly or indirectly in cooperative-based enterprises
(Ministry of Cooperative Development & Marketing, 2008).
In the agricultural sector, cooperatives handle over 72 per cent of coffee sales, 95 per cent of
cotton sales, 76 per cent of dairy produce sales, and 90 per cent of pyrethrum sales. The< .
greatest contribution of cooperatives to Kenya’s social and economic development is in
the financial sector where financial cooperatives (savings and credit cooperatives, KUSCCO,
Cooperative Bank and CIC) hold substantial savings portfolios. (Wanyama, 2008).
With the cooperative movement playing such a significant role in economic development, the
Government has over the years maintained an institutional framework to develop the
movement. The Ministry of Cooperative Development and Marketing is the current
Government’s official agency for coordinating cooperative development in Kenya. The main
duties of the Ministry include registration and liquidation of all cooperatives register under
the Act, enforcement of the Cooperative Societies Act, formulation of cooperative policy,
supporting development of a conducive environment for cooperative growth, registration of
cooperative audits, carrying out of inquiries, investigations and inspections. (Republic of
Kenya, 1997)
14

2.5 Cooperative development policy in Kenya
Sessional Paper No. 6 of 1997 on “Cooperatives in a Liberalized Economic Environment”
provides the current policy framework for cooperative development in Kenya. The policy
was formulated after the liberalization of the economy, which necessitated the withdrawal of
state control over the cooperative movement. The aim of the policy was to make cooperatives
autonomous, self-reliant, self-controlled and commercially viable institutions. The role of the
government was redefined from one that sought to control cooperative development, to one
that now seeks to regulate and facilitate their autonomy. (Republic of Kenya, 1997a)
The monopoly of cooperatives in the agricultural sector, which had made them the sole
marketers of cash crops in Kenya, was removed. The consequences of this meant that
cooperatives now had to compete with other private enterprises in the marketing of
agricultural produce. * •
In response to the inadequacies of the 1997 policy, the Ministry formulated a revised policy
framework titled “Kenya Cooperative Development Policy 2008”. The main theme of the
new policy is ‘expanding the economic space for sustainable cooperative growth in Kenya'.
Its main focus is on restructuring, strengthening and transforming cooperatives into vibrant
economic entities that can confront the challenges of wealth creation, employment creation
and poverty reduction as private business ventures. (Ministry of Cooperative Development &
Marketing, 2008).
2.6 The Kenyan cooperative legislation
The Cooperative Societies Amendment Act of 2004 is the current basic legislation that guides
the formation and management of cooperatives in Kenya. It has its origins in the Cooperative
Societies Act, Cap. 490 of 1966, which was revised in 1997 into the Cooperative Societies
Act Chapter 12 of 1997. The reforms contained in the revised Act sought to reduce the strict
state supervision of cooperatives, in order to support the liberalization of cooperative
15

enterprise. (Republic of Kenya, 1997b and 2004)
The 1997 Act empowered the members to be responsible for the running of their own
cooperatives, through elected management committees. To the detriment of many primary
cooperatives, the newly acquired freedom was dangerously abused by elected leaders. This
saw many cooperatives report cases of corruption and mismanagement, such as gross
mismanagement by officials; theft of cooperative resources; split of viable cooperatives into
smaller ineffectual units; failure of employers to surrender members’ deposits to
cooperatives (Particularly SACCOs); failure to hold elections; nepotism in hiring and
dismissal of staff; refusal of management committee members to vacate after members voted
for this dismissal; conflict of interest among cooperative officials; endless litigations;
unauthorized cooperative investments; illegal payments to the management committees
(Manyara, 2003). < .
In response to these circumstances, the 1997 Act was amended in 2004. The main content of
the Cooperative Societies (Amendment) Act of 2004 re-enforces state regulation of the
cooperative movement through the office of the Commissioner for Cooperative
Development. The legislation stipulates that the roles to be undertaken by government
include creating the policy and legal framework for development of cooperatives; improving
the growth and development of cooperatives by providing the requisite services for their
organization, registration, operation, advancement and dissolution; developing partnerships
with cooperatives through consultative processes that are focused on policy, legislation and
regulation. The SACCO Societies Act of 2008 provides for the licensing, regulation,
supervision and promotion of savings and credit cooperatives by the SACCO Societies
Regulatory Authority. (Republic of Kenya, 2004b and 2008b)
<«■
16

The coffee subsector in Kenya is organized into coffee factories, farmers’ cooperative
societies, District Cooperative Unions and the Kenya Planters Cooperative Union. The coffee
Board o f Kenya (CBK) is a regulating agency in the coffee subsector (Nyangito 2001)
2.7.2 Coffee factories
Almost all existing coffee factories serving smallholder farmers belong to cooperative
societies. A few private factories have started since coffee processing and milling has been
liberalized, but they are still rare. Nyangito, 2001 notes that factory management is burdened
with nepotism, which has led to mismanagement and run-down facilities—a factor that may
contribute to cooperative break-up. In general, factory payout to farmers is largely
determined by the charges for the services of coffee processing, storage, bulking and
transportation and for overheads. High deductions and lower-quality coffee result in low
producer price, which discourages production.
2.7.3 Cooperative so c ie tie s
Cooperative societies are wholly formed by a group of factories, but in some cases one
factory may make up a society. Main society functions are to keep books, provide credit,
market, repair and maintain factories, and employ factory staff. Most societies are poorly
managed. This has led to a widespread break-up of large societies into smaller ones. The
problem is made worse by huge deductions taken from farmers’ returns to cover expenses
incurred by the many factories a society may own. The payout from society to factory varies
from about 46% to 93% depending on the performance of the cooperative and the services it
offers to factories and individual factory expenses. Over 95% of the expenses for factories are
factory related, but much of these expenses are inflated because of corrupt practices, such as
exaggerated deductions for both factory and the society services. (Kegonde, 2005 and
2 7 Cooperative movement in the coffee subsector
17

Lindberg, 1993)
2 7.4 D istrict coop erative unions
The District Cooperative Unions draw membership from coffee cooperative societies and in
some cases from other farming enterprises such as dairying. District unions help coffee
farmers produce; process and market coffee, but they do not physically handle it. The unions
are allowed by the Cooperative Societies Act to take up to 17.05% of the farmers’ proceeds
to finance their operations. However, recently unions have reduced what they provide farmers
by not involving themselves directly in employing society staff. They have instead diversified
into other functions such as banking. However, the fact that unions are no longer active in
arbitrating society disputes has increased the wrangling. (Mude, 2006)
2.7.5 Coffee m illing 4 •
Coffee milling before the coffee subsector was liberalized was a reserve of the Kenya
Planters Cooperative Union (KPCU). Although more milling companies are now registered,
KPCU dominates as a result of the monopoly it once had. With easy access to coffee factories
through the district unions, KPCU is credited for the services it provides to farmers directly,
such as extension and financing. Recovery of loans to farmers is, however, poor and has
affected KPCU cash flow and financing ability. Milling charges vary from miller to miller
but deductions on the farmers’ proceeds should not exceed 4% of the export price according
to CBK rules. This has restricted the range of services millers can provide. As a result,
conflicts have arisen over unfulfilled promises millers have made to farmers. (Karanja, 2002)
2.7.6 Coffee Board o f Kenya
In addition to regulating and controlling the industry, CBK functions include production
services, monitoring'of processing, marketing, production research and publicity. Despite the
18

policy reforms in coffee processing and milling, CBK remains the regulatory agency in the
coffee industry and controls export marketing at the auction market by appointing coffee
brokers and regulating the activities of the coffee brokers and buyers. The CBK also receives
all the proceeds of exported coffee which it later remits to farmers. The board further
provides extension services to farmers, research and promotion of coffee in export markets. It
charges about 8% of the export price on marketed coffee to cover its expenses and
government levies. Board control over coffee marketing and regulatory functions in the
industry has been a bone of contention with other stakeholders. (Lindberg, 1993)
2.7.7 Kenya Coffee C ooperatives Exporters Limited (KCCE)
The finance bill of 2005, enacted direct sales of coffee in an attempt to revive the coffee
industry. As a result of a benchmarking exercise on the marketing systems in Colombia and< ,
Costa Rica where coffee is marketed directly to international markets through the National
(apex) coffee organizations, the Kenya Coffee Cooperative Exporters Limited (KCCE) was
formed w ith the objective of promoting, organizing and undertaking the marketing of coffee
in the local and export markets in order to maximize returns to the members, thereby promote
their social economic welfare. To achieve the objective, KCCE limited was registered in June
2009 and required to operate under three key pillars namely direct access to international
markets, transparency of market information rendered to farmers, enhanced financial
management for primary cooperative societies (Ministry of Cooperative Development, 2010)
The entrance of KCCE into coffee marketing has broken hitherto strong cartel and increased
the coffee earnings to the farmers. Recently it registered a KCCE milling company called
Kenya Cooperative Coffee Millers Company (KCCM) which has in turn entered into lease
agreement to utilize KPCU Sagana coffee mills for coffee from Mount Kenya region
19

2.8 Review of related literature
This section looks at the literature related to the services offered by cooperative societies
which form the variables of the study namely agricultural extension, training and information
services, marketing, and access to credit facilities and cooperative governance.
2.8.2 Agricultural Extension, Training and Inform ation Services
The extension service plays a key role in disseminating knowledge, technologies and
agricultural information, and in linking farmers with other actors in the economy. The
extension service is one of the critical change agents required in transforming subsistence
farming to a modern and commercial agriculture to promote household food security,
improve income and reduce poverty. (Porvali, 1993)
Several public training institutions offer service^ to the agricultural sector. These include
universities, middle-level colleges and institutes, and farmer and pastoral training centres.
These institutions provide specialized training to clients (farmers and extension personnel)
and act as demonstration centres for improved technologies. The Agricultural Information
Resource Centre and other resource centres, agricultural shows, field days, and open forums
have been important sources of agricultural knowledge, information and technology.
According to the Agricultural Sector Development Strategy 2010 - 2020, inadequate levels
of funding for public training institutions leading to deterioration of infrastructure and
facilities for training and technology demonstration; limited capacity to train in emerging
areas such as indigenous animals and plants husbandry, and organic farming; advanced
biotechnology; the slow pace of commercializing services offered by training institutions;
and failure to respond to market demands for specialized courses. (Republic of Kenya, 2010)
20

Facilities and operations of coffee marketing cooperatives are in many ways similar to those
of other firms. They must employ resources such as management, labor, and capital. They are
subject to market and competitive factors and to all regulations regarding industries in which
they operate, including those that affect handling, packing, processing, marketing and
transporting products. (Chambo et al, 2008)
Pricing may involve differentials or discounts for various grades and hauling charges unless
they are listed separately. These factors plus changes in the value of inventories affect the
gross margins per dollar or unit realized over various time periods. Pricing at prevailing
market levels reduces the likelihood of extreme pricing practices by competitors. It increases
the chances for the cooperative to realize net margins and accumulate operating reserves to
cushion the effects of market price declines or unusual expenses. (Karanja, 2002)
The international coffee market is one of the world's most volatile, exhibiting extreme
sensitivity to fluctuations in the supply from a handful of coffee-producing countries. For
more than a decade, coffee farmers around the world have been struggling to adapt to
exacerbated volatility in supply and prices, precipitated not only by climatic events in the
largest producer countries (notably Brazil), but also by important changes in production
technology, processing techniques and the structure of inter- national markets (Ponte 2002).
Since its introduction as a cash crop in the early 1900s, coffee has traditionally been the
backbone of Kenya's rural highlands economy. Coffee was the nation's top foreign exchange
earner from independence in 1963 until it was surpassed by tourism in 1989. Since then,
national coffee earnings have steadily declined and currently rank fourth after tourism, tea,
and horticulture (Karanja, 2002).
2.8.3 Coffee pricing
21

Over the years, cooperatives have played a key role in marketing coffee, dairy products,
pyrethrum, livestock, fish, handicrafts and honey. Out of 12,000 registered cooperatives, 49
per cent are in agribusiness, with a membership of over 4 million. (Republic of Kenya, 2010)
Marketing of agricultural produce and products within the country is carried out by the
private sector either as formal marketing companies or as brokers. National and regional
markets have great potential to expand with better marketing infrastructure and quality
assurance. The export markets mainly deal with raw commodities and have become stringent
on issues of traceability, safety, sanitary and phytosanitary standards, and maximum residue
limits. (Damianopoulos, 2005)
Nyangito, 2001 notes that factory payout to farmers is largely determined by the charges for
the services of coffee processing, storage, bulking and transportation and for overheads. High< ,
deductions and lower-quality coffee result in low producer price, which discourages
production.
Milling charges vary from miller to miller but deduftions on the farmers’ proceeds should not
exceed 4% of the export price according to CBK rules. This has restricted the range of
services millers can provide. As a result, conflicts have arisen over unfulfilled promises
millers have made to farmers. (Karanja, 2002)
2.8.4 Access to Credit and Inputs
After independence, the Government set up the Agricultural Finance Corporation to provide
long-term credit to individuals and groups to purchase farms and to finance farm
improvement, as well as seasonal credit for production. By providing suppliers with credit,
cooperative societies also supported farmers. These organizations have been mismanaged and
run down and are no longer important sources of finance for agriculture. Indeed, a large
22

number almost collapsed. Today, farmers get credit mainly from cooperatives, NGOs and
community-based lending institutions. (Mude, 2006)
Access to bank credit by farmers is still a major challenge despite the fact that Kenya has a
relatively well-developed banking system. According to Cham bo et al (2008), Risks
associated with agribusiness coupled with complicated land laws and tenure systems that
limit the use of land as collateral make financing agriculture unattractive to the formal
banking industry. In addition, corruption, political interference in the operations particularly
of State-owned banks, and a dysfunctional court system in the past, gave rise to a culture of
defaulting that led to high numbers of non-performing loans. This development forced many
banks to charge their customers, who included farmers, prohibitively high interest rates to
remain afloat. Limited competition in the banking industry despite the large number of banks
also ensures interest rates remain high. The co3t of bank credit and the limited number of
banks in rural areas are some of the factors that make it difficult for farmers to access bank
credit. (Karanja, 2002)
Major inputs in agriculture are seed, fertilizer, pesticides, feed, farm machinery, breeding
animals and building materials. According to Wanyama (2008), the annual fertilizer demand
increased from 329,449 tonnes in 2002/03 to 410,214 tonnes in 2006/07. Production of
certified seed for various crops increased from 12,998 tonnes in 2002 to 34,682 tonnes in
2006, while the volume of imported seed increased from 1217 tonnes to 4773 tonnes over the
same period. The volume of pesticide imports reached 7000 tonnes in 2006/07. The inputs are
distributed through a wide range of stockists and merchants all over the country. Also, some
cooperative societies and commodity boards supply inputs to members. (Hussi et al 1993)
The use of fertilizer is low due to its high price, attributed to the high cost of transportation
and distribution systems. Fertilizer use in Kenya is about a third of the level used in India and
quarter of the level used in Indonesia. In addition to the high cost, adulteration by
23

merchants, which affects the quality of fertilizer, seed and pesticides, has limited the use of
these inputs. Only about 24.3 per cent of farmers use manure to improve soil fertility.
(Wanyama, 2008)
The use of agricultural machinery has generally declined; this has been due to the high costs
arising from taxation and maintenance. Most of the farm equipment, machinery and spare
parts are imported. Further, the increased reduction in farm size through subdivision makes
the use of large machinery and mechanization of farming generally uneconomical. (Lindberg,
1993)
2.8.5 Cooperative governance
Cooperative governance can be viewed in terms of the management committee who are
elected members of the cooperative society and the cooperative manager who is an employee4 «
of the cooperative society and not necessarily a member of the cooperative society.
The Management Committee is the highest elected executive institution in a cooperative
enterprise. Members of the cooperative society are eligible for election into the management
committee which acts on behalf of the members. These factory farmers’ representatives form
the cooperative society management committee which manages the affairs of the society on
behalf of the members. Everything done in the cooperative must be approved by the
management committee. (Koopmans, 2006)
The management committee ensures that decisions taken can in fact be executed. The
management committee must guarantee a close correlation between theory and practice,
between decision and execution. It is always good management policy to view every
decision action in the context of the total activities of the enterprise, present and future. In
this case, the management committee must seek to discover the correlation between
current actions and tbeir future consequences. (Hussi et al, 1993)
24

The cooperative Manager is the chairperson of the management committee, and the only paid
officer in the enterprise. The cooperative manager initiates and presides over the meetings of
the management committee, and prepares the agenda for those meetings. It is this officer who
is most directly involved in the personal problems of members of the cooperative and of
its employees. The manager represents the cooperative in other forums, institutions and
government bodies; and it is this person who is in charge of the operation of the different
departments of the organization as well as for the preparation and execution of the
socioeconomic policy of the cooperative. It is the manager who proposes plans, executes and
evaluates. (Kegonde, 2005)
Most farmers have become more business-minded as their own farm operations grow. They
give more attention to their cooperative’s management. They employ managers with more
training and expect them to improve their knowledge and skills. Also, a growing number of
cooperative managers seek to become more proficient in managing the affairs of their
cooperatives. (Porvali, 1993)
Public concern about food safety, pollution control, health and the environment, monopoly,
standardization procedures and related issues focuses attention on the competence, integrity,
and behavior of cooperative managers. As a result, cooperatives are becoming more aware of
the need to indemnify cooperative managers who are subject to increased legal exposure. The
growing impact of world markets, even on the individual family operation, is changing the
management perspective from the local cooperative level. The local is being viewed less and
less as an independent entity and more and more as part of a system. (Lindberg, 1993)
*«■
25

The theoretical framework consists of theories, principles, generalizations and research
findings which are closely related to the present study. The researchers knowledge of the
problem and his understanding of the theoretical and research issues related to the research
question will be demonstrated.
2.9.1 Frederick Taylor’s Theory of Management
Fredrick Taylor led the development of a theory of management that analysed work flows. Its
main objective was improving economic efficiency especially labour productivity. He
attempted to apply science to the engineering of processes and management.
Taylor believed in standardization of best practice qnd wreathed traditions preserved merely
for its own sake or to protect the social status of particular workers with particular skills sets.
He advocated for transformation of craft production into mass production and knowledge
transfer between workers and from workers into tools, processes and documentation. Taylor
noticed that natural differences in productivity between workers were driven by various
causes including differences in talent, intelligence or motivation. He applied science in
understanding why and how these differences existed and how best practices could be
analyzed, synthesized and then propagated to other workers through standardization of
process steps. He believed that decisions based upon rule of thumb and tradition should be
replaced by practical procedures developed after careful study of an individual at work,
including via time and motion slides which would synthesis the “one best way to do any
given task.
The goal and promise was both an increase in productivity and reduction of effort. Taylor
observed that some vforkers were more talented than others and that even smart ones were
2 9 Theoretical framework
26

often unmotivated. He observed those workers who were forced to perform repetitive tasks
tended to work at the slowest rate that goes unpunished. Taylor observed that, when paid the
same amount, workers tend to do the amount of work that the slowest among them does. This
reflected the idea that workers had vested interest on their own well-being and don’t benefit
from working above the defined rate of work when it will not increase their remuneration. He
proposed that time and motion studies combined with rational analysis and synthesis could
uncover one best method of performing any particular task and that prevailing methods were
seldom equal to these best methods.
Taylor acknowledged that if each employee’s compensation was linked to their output, their
productivity could go up. His compensation plans included piece rates. He rejected the idea
that the trades including manufacturing were black art that couldn’t be analyzed. In his
empirical studies he examined various kind of manual .labour and discovered many concepts.
He decided that labour should include rest breaks so that workers could get time to recover
from mental and physical fatigue. As a result productivity increased.
*«■
27

2.10 Conceptual framework
Figure 1: Conceptual Framework
Independent variables Intervening variables Dependent variable
28

Explanation of the variables
Factors influencing service provision by cooperative societies to their members form the
independent variables. These factors include Management skills, availability of credit
facilities, availability of extension services, and producer prices.
1. Cooperative governance
Nyangito (2001) in his study of the policy and legal framework for coffee subsector notes
that factory management is burdened with nepotism, which has led to mismanagement and
run-down facilities—a factor that has contributed to cooperative break-up. In addition, most
societies are poorly managed. This has led to a widespread break-up of large societies into
smaller ones which are not economically viable and do not enjoy economies of scale.
Governance therefore influences the way a coopefatjve society is managed based on the skills
of the decision makers of the cooperative society.
2. Market Price fluctuations
The current world market coffee prices are on an upward trend partly due to reduced coffee
production as a result of previous low prices. The payout from society to factory varies
depending on the performance of the cooperative and the services it offers to factories and
individual factory expenses. Nyangito (2001) notes that over 95% of the expenses for
factories are factory related, but much of these expenses are inflated because of corrupt
practices, such as exaggerated deductions for both factory and the society services. Producer
prices therefore influence cooperative societies in that the higher the producer prices offered
by the cooperatives the better for their members and vice versa. High deductions and lower-
quality coffee result in low producer price, which discourages production.
29

3. Extension services
Extension education to the members on improved ways of farming, pest control and
improved technologies and crop varieties is very important as it has a direct effect on the
production from the farmers both in terms of quality and quantity. Provision of extension
education or lack of it will therefore influence cooperative societies in provision of services
to their members
4. Credit facilities
Availability of credit facilities to the cooperative societies is important as it enables the
cooperative society invest in most recent technology such as embracing of ICT in
management and investment in more efficient and cost effective machinery. The same credit
facilities trickle down to the members in terms of fanning loans, inputs loans and even loans
on farm implements. Availability of credit facilities will therefore have a direct influence on
the cooperative societies in provision of services to their members.
2.11 Summary of Literature
The literature has outlined the various aspects of cooperatives with regard to the evolution of the
cooperative movement, significance of cooperatives to the Kenyan Economy, and the status
of the cooperative movement in the coffee subsector with special focus on agricultural
extension, training and information services, coffee marketing, accessibility of credit
facilities and cooperative management.
The literature highlights the two side of cooperative governance; the cooperative
management committee and the cooperative manager which complement each other and their
importance in ensuring effective service provision by the cooperative societies to their
members. It stresses tfre importance of credit facilities both in terms of farm inputs and loans
30

to the cooperative society and the cooperative members as this would ensure increased
productivity for the farmers and increased capacity of the cooperative facilities to enable
them handle the increased production.
The current world market coffee prices are on an upward trend partly due to reduced coffee
production as a result of previous low prices. For more than a decade, coffee farmers around
the world have been struggling to adapt to exacerbated volatility in supply and prices due to
changes in production technology, processing techniques and the structure of international
markets. The payout from society to factory varies depending on the performance of the
cooperative and the services it offers to factories and individual factory expenses.

CHAPTER THREE
RESEARCH METHODOLOGY
3.1 Introduction
This chapter documents the methodology that was used in gathering data. It covers research
design, target population, sample design, data collection, data analysis, ethical issues and
operationalization of the variables. The study investigated factors that influence service
provision by cooperative societies to their members.
3.2 Research Design
The study utilized a descriptive research design with a mixed approach of qualitative and< ,
quantitative design. This design enables a comparison of opinions of respondents regarding
service provision by cooperative societies to their members based on other respondent
characteristics. Also it enables extensive use of quantitative methods as was the case in this
research work.
3.3 Target population
The study targeted all coffee farmers and managers in coffee cooperative societies in Kigumo
District. These are Muthithi, Kangiri, Marumi, and Thangaini coffee farmers’ cooperative
societies as depicted in table 3.1
32

Table 3.1 Coffee Farmers’ Cooperative Societies in Kigumo District
s/no Name of
cooperative society
Number of
Member factories
Size of membership
1 Muthithi 3 1671
2 Kangiri 5 3230
3 Marumi 3 1445
4 Thangaini 8 5327
Total 11673
Source: District cooperative Office, Murang’a South
3.4 Sample size and sampling procedures
The sample was two strata namely cooperative management and coffee farmers who are
members of the fore mentioned cooperative societies.
In the cooperative management stratum, the researcher interviewed the chairman, secretary
and treasurer of each of the four coffee cooperative societies management committees
totaling to 12 respondents drawn by purposive sampling. According to Mugenda and
Mugenda, (2003) non probability purposive sampling method is adopted where a group has
the required information with respect to the objectives of the study and offer in depth
information about the study.
In the coffee farmers’ strata, the researcher used a formula adopted from Cochran 1963 to
determine the sample size as 201 at 7% level of significance
33

n = N/ [1 + N (e)2 ]
Where; n - sample size
N - population size
e - level of significance
n= 11.673 + 11,673(0.07)2 = 201
The sample of 201 was then allocated proportionately to each cooperative society according
to the proportionate membership. The respondents were then selected using simple random
sampling technique.
Table 3.2 Representation from which the sample was drawn
s/no Name of
cooperative
Number of
Member factories
__ i__________Size of
membership
Sample
respondents
1 Muthithi 3 1671 29
2 Kangiri 5 3230 56
3 Marumi 3 1445 25
4 Thangaini 8 5327 91
Total 11673 201
3.5 Data collection Methods
The study used primary data, which was collected through questionnaires. The researcher
administered the questionnaires to respondents via personal interviews. The questionnaires
comprised a variety of questions that were structured into different sections with each of the
sections addressing a specific objective. Both open and closed questions were included in the * *»■
data collection tool.
34

The questionnaire for the coffee farmers was structured in four parts. The first part was
intended to capture the demographic information of the respondent while the second, third
and fourth parts were designed to collect data on extension education services, coffee prices
and credit facilities respectively.
The questionnaire for the cooperative managers was structured in six parts. The first part was
intended to capture the demographic information of the respondent while the second, third;
fourth, fifth and sixth parts were designed to collect data on governance, coffee prices, credit
facilities, cooperative policy regulations and extension respectively.
Personal interviews were used to ensure instant responses are obtained. This instrument
would assist the researcher to learn the moods of the respondent and also dig out the relevant
information concerning the study.< .
3.6 Validity and reliability of instrument
This section discusses the validity and reliability of the data collection instruments.
3.6.1 Validity of the instrument
According to Mugenda and Mugenda (2003), validity is a measure of relevance and
correctness. It is the accuracy and meaningfulness of inferences which are based on the
research results. Data collection techniques must yield information that is not only relevant to
the research questions but also correct.
For the purpose of this study, the researcher consulted the supervisor and class colleagues and
also visited the district cooperative officer and the district agricultural and livestock extension
officer before conducting the study to ascertain the validity of the research instruments. The
specialists confirmed that the issues in the questionnaires are actually pertinent to the study
and they are actually the issues that influence service provision by cooperative societies.
" W U LIBRARY*J So* 2 0 1 9 7
’ '“ POP#

3.6.2 Reliability of the instruments
According to Mugenda and Mugenda (2003), reliability is a measure of the degree to which a
research instrument yields consistent results or data after repeated trials. The research
instrument was subjected to pretest reliability tests by initially applying it to a small sample
often (30) respondents from two cooperative societies.
The researcher tested for reliability of the questionnaire using test retest method initially
administering it to a small sample of ten (10) respondents from Thangaini cooperative society
and then re-administering it to the same sample after two weeks. The scores from the two
tests were then correlated giving a Pearson correlation coefficient of 0.87 which indicates
strong positive linear relationship between the two scores and implies high instrument
reliability because the value falls above 0.7. In addition, before the administration, the< .
researcher had an opportunity to check for any ambiguities and unclear questions. The
researcher was able to establish that the questions were well understood by the respondents to
clear ambiguities.
3.7Data collection procedures
Two research instruments were used in the study for data collection: one for management
committee and the other for coffee farmers. The researcher formulated the questionnaires and
administered them to the respondents whereby relevant questions concerning the study were
asked. Face to face interviews were conducted to farmers and managers to capture their
feedback. The researcher sought approval for this study from the University of Nairobi and
the four coffee cooperatives. As soon as permission was granted, the study proceeded in the
following chronology: Recruitment of three research assistants; Conducting briefing for the
assistants on the study objectives, data collection process and study instrument
administration; Pilot’testing; Revision of the data collection instruments after the pilot study;
36

Reproduction of required copies for data collection upon approval by supervisors;
Administration of data collection instruments to respondents; Collection of duly completed
research instruments, assessment of filled in questionnaires through serialization and coding
for analysis; Data analysis and discussion; preparation of conclusions and recommendations.
3.8 Ethical considerations
The researcher relied on ethical issues as identified by Mugenda and Mugenda (2003), while
undertaking this study. Our research followed the three principles of ethics which include
Respect, beneficence and justice. The participants were informed of the purpose of the study
before information is sought from them thus conforming to the principle of voluntary and
informed consent. The researcher sought approval from the University and Cooperative
Society management before fieldwork. Honesty, integrity and confidentiality were highly< .
maintained throughout the study.
3.9 Data analysis techniques
Once all the data was collected from the field,' the variables (questions) were coded into
Statistical Package for Social Sciences (SPSS) ready for data entry. All the responses were
entered into the data template followed by preliminary tests and data cleaning. Analysis was
conducted by descriptive frequencies, measures of central tendency and correlation
techniques.
3.10 O perational defin ition o f variables
The operational definition of the variables have been analyzed as shown in table 3.3
37

Table 3.3: Operational Definition of Variables
Objective Type of Indicators Level of
O l _
Approach
-X* - ■--!-
Research Level of
▲ lTo investigate how governance
influences service provision by
cooperative societies in Kigumo
Independent Level of education of the
managers.
Managerial training
Pynpripnpp nf thp
Nominal Quantitative
&
qualitative
Questionnaire Descriptive
To determine the extent to which
coffee price fluctuations influence
service provision by coffee
Independent Payment price
Price variations
k
Nominal Quantitative
&
Questionnaire Descriptive
To find out how access to credit
facilities influence service
provision by cooperative societies
Independent Availability of credit
services •>
Availability of collateral
Nominal Quantitative
&
Questionnaire Descriptive
To investigate the factors which
influence service provision by
cooperative societies in Kenya
with a case study of cooperative
societies in Kigumo district.
Dependent Satisfaction with
Extension services,
producer prices, and
Credit services provided
Nominal Quantitative
&
qualitative
Questionnaire
Interview
Schedule
Descriptive
38

CHAPTER FOUR
DATA ANALYSIS, PRESENTATION AND INTERPRETATION
4 .1. Introduction
This chapter gives a presentation of the findings collected from four coffee cooperative
societies in Kigumo district. The data was collected by direct interviews upon visitations to
farmers at household level in Kangiri, Muthithi, Marumi and Thangaini cooperative societies.
The chapter starts with descriptive statistics, including demographic characteristics of
respondents, while the rest of the section has comparison of means and a ranking of factors
which influence service provision by cooperative societies in Kenya based.
4.2. Response Rate ' #
A total of 199 coffee farmers responded to this survey from an initial target of 201 sample
respondents which translates to a 99.01% response rate: Twelve members of coffee farmers’
cooperatives management committee also responded to the survey on a complementary
questionnaire.
Table 4.1: Response rates by cooperative societies
Cooperative society Frequency Percentage
Kangiri 60 29
M arum i 21 11
Muthithi 28 14
Thangain i 91 46
Total- 199 100.0
39
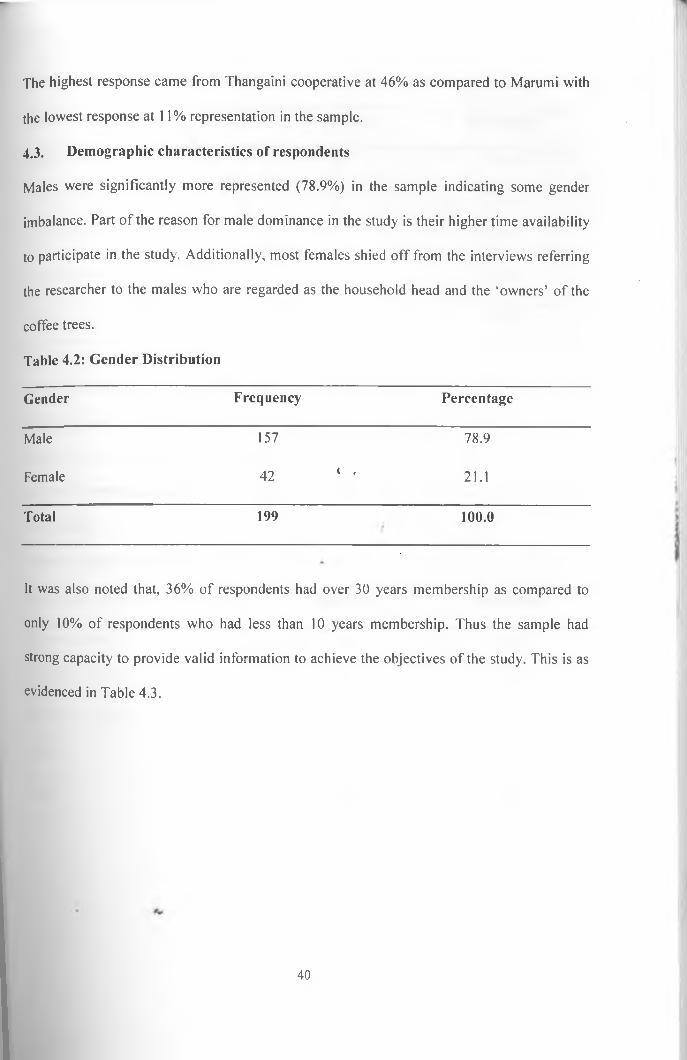
The highest response came from Thangaini cooperative at 46% as compared to Marumi with
the lowest response at 11% representation in the sample.
4 .3 . Demographic characteristics of respondents
Males were significantly more represented (78.9%) in the sample indicating some gender
imbalance. Part of the reason for male dominance in the study is their higher time availability
to participate in the study. Additionally, most females shied off from the interviews referring
the researcher to the males who are regarded as the household head and the ‘owners’ of the
coffee trees.
Table 4.2: Gender Distribution
Gender Frequency Percentage
Male 157 78.9
Female 42 < , 21.1
Total 199 1 00 .0
It was also noted that, 36% of respondents had over 30 years membership as compared to
only 10% of respondents who had less than 10 years membership. Thus the sample had
strong capacity to provide valid information to achieve the objectives of the study. This is as
evidenced in Table 4.3.
40

Table 4.3: Duration farmers have been involved in the cooperative movement
Membership duration Frequency Percentage
Under 10 years 19 9.5
11-20 years 40 20.1
21-30 years 69 34.7
Over 30 years 71 35.7
Total 199 1 00 .0
In terms of education profile, 31% of respondents had attained primary level education, 23%
secondary and 5% bachelor’s degree education level. The indication is that majority of coffee
farmers are not very highly educated. However at least they are at a level of understanding< ,
the social economic issues in the coffee sector and how they affect them and responding
accordingly.
Table 4.4: Education attainment -
Highest level of Education reached Frequency Percentage
Primary Level 58 30.9
Secondary Level 43 22.9
Bachelors Degree 10 5.3
Others 77 41.0
Total 188 1 0 0 .0
41

The first objective aimed at establishing how governance influences service provision by
cooperative societies in Kigumo District. The researcher investigated the extent to which the
level of education of the cooperative managers, length of experience and exposure to
managerial training and hiring process were perceived to influence service provision by
cooperative societies.
The findings reveal that the level of education of the cooperative managers was the most
influential factor (67%) impacting on service provision cooperative societies positively.
Experience in cooperative management was second most influential at 45% whereas
exposure to managerial training came third (38%). However only one out of the four
cooperative managers had post secondary education up to diploma level while the remaining
three were educated up to secondary level. Majority (75%) of the cooperative managers
interviewed were found to have served in the same cooperative society for over ten years (11
- 15 years bracket) rising through the lower ranks to the level of cooperative manager while
the fourth one who is coincidentally the only one with post secondary education (diploma)
had served in the cooperative society for less than five years with his Marumi cooperative
society being rated the best of the four cooperative societies as indicated in section 4.7.
Incidences of coffee thefts were reported in virtually all the four cooperative societies. In
response to a query in part VI on the mechanisms put in place to curb the thefts, the
cooperative managers suggested liaison with National Security organs and insurance plans
for coffee beans delivered to the society. All the three cooperative societies indicated having
society by laws and cooperative society’s rules 2004 which affected the service provision to a
large extent. Two thirds (61%) of the cooperative managers were found unaware of the
cooperative development policy 2008 as they indicated not having the policy document and
4.4. Governance and agricultural extension by coffee farmers’ cooperative societies
42

were also not sure of the extent to which it influences service provision by cooperative
societies.
The findings reveal that 98.2% of farmers had ever received extension services ranging from
utilization of land, proper use of chemicals, pruning and training on farm management
practices. On probing the frequency of extension service provision by cooperatives, it was
found that over half (54.4%) had received extension service within the last one year. Only
3.5% of the coffee farmers in Kigumo district had to wait for extension services for four
years or longer.
Table 4.5: An indication of farmers’ experience of agricultural extension services
< .
Attendance to any extension
education session
Yes No Total
An indication of the date Within the last one year 54.4% 1.8% 56.1%
of the last agricultural Within the last two years 24.6% - 24.6%
extension training session Within the last three years 15.8% - 15.8%
Four years and above 3.5% - 3.5%
Total 98.2% 1.8% 100.0%
The coffee farmers were asked to rate extension services and the related variables were
measured on a five-point Likert scale of 1= strongly disagree to 5= strongly agree. The
researcher enquired the extent to which respondents agreed that their cooperative society
trained them on best land management practices, application of pesticides on crops,
conducted soil testing, educated them on good crop husbandry practices and offered the best
coffee prices in the'market. Other aspects assessed were how promptly farmers were paid for
43

their deliveries and whether marketing coffee through cooperative society was the most
effective of options.
Table 4.6: Farmers’ rating of agricultural extension services
Agricultural extension service provision by
cooperativesN
Mean
on
Likert
scale of
1 to 5
proportion
(%) of
agreement
Cooperative society trains us on best land management17 4.5882 92%
practices
Our cooperative society advices on choice and { •17 4.7647 95%
application of pesticides on our crops
Extension officers from our cooperative society visit17 1.5294 31%
our farms for soil testing.
Agricultural extension officers from our cooperative17 4.7647 95%
society educate us on good crop husbandry practices
Our cooperative societies offer the best coffee prices in20 2.7500 55%
the market.
Our cooperative society pays farmers very promptly for20 1.5000 30%
their deliveries
Marketing coffee through our cooperative society is20 3.3500 67%
more profitable than using other channels
Mean 18 3.3210 67%
44

Findings indicate that overall coffee famers in Kigumo district had a 67% affirmation that
their respective coffee cooperative society provided them with appropriate services. On the
converse, this also implies a 33% level of disagreement with the same. Coffee farmers were
most content with education on good crop husbandry practices by agricultural extension
officers from their respective cooperative society (95% satisfaction). They expressed high
discontent with the statements regarding soil testing and prompt payment services:
“Extension officers from our cooperative society visit our farms for soil testing” at 31%
satisfaction and “Our cooperative society pays farmers very promptly for their deliveries” at
30% satisfaction.
4.5. Coffee price fluctuations among by coffee farmers’ cooperative societies
The second objective aimed to determine the extent to which coffee price fluctuations< .
influence service provision by coffee cooperative societies to their members in Kigumo
District. The researcher presents findings about trends of coffee quantities produced, prices
and income payments as it relates to service provision.
On average the coffee farmers in Kigumo district received an advance of Ksh 60 received per
kilo of coffee delivered in the 2010/11 season. They had delivered an average of 691
kilogrammes (lowest having 20 and highest 10,000 kilogrammes) and earned a bonus per kilo
of Ksh 65.20 (bonus in the societies ranged from Ksh 49 to Ksh 98 a kilo). Finally, the
farmers earned a total income of Ksh 16,078.80 from coffee farming. The farmer with the
lowest income from coffee received Ksh 100 while the one earning the highest received Ksh
81,000. Table 4.7 has more details.
45

Table 4.7: Descriptive summaries for coffee deliveries and incomes 2010/2011
N Minimum Maximum MeanStd.
Deviation
Kilogrammes of coffee delivered in
the last season
192 20 10000 691.01 951.04
Bonus (Ksh) received per kilo of
coffee delivered in the last season
65 49 98 65.20 12.583
Total money (KSH) paid last season
(income from coffee)
34 100 81600 16078.80 17651.90
Data provided by managers reveals that there is a relationship between coffee production and
coffee prices. Periods of high coffee prices are alscf characterized by low production and vice
versa. Aggregate coffee production for Kigumo district was highest in 2005/6 and 2009/10
when it hit over 4 million kilograms. Data from the management committees reveals that
from 2005 to 2011, the highest production ever recorded was 1936091.5 kilogrammes in
Thangaini Farmers Cooperative Society (FCS) while the lowest was 93,936 kilogrammes in
Muthithi Farmers Cooperative Society. Thangaini cooperative led production trends but also
recorded the second most volatile of fluctuations (over 1 million kilogrammes or 260%)
between the peak and trough. Muthithi Farmers Cooperative Society had the most erratic
production ever, from a peak of 0.6 million to a trough of 94 thousand kilogrammes. Overall,
years 2007/8 were marked by slumps in production and for the 2010/11 season, the
production was even lower. According to managers, this period witnessed international price
distortions, marketing problems within the Coffee Board of Kenya and widespread incidence
of coffee theft.
46

Table 4.8: Trends of coffee Production for the years 2005 to 2011
Production Production Production Production Total
Marumi Muthithi Kangiri Thangaini
2005/6 492544 598479 1338893 1936091.5 4366008
2006/7 440245 293904 1112952 1838715.5 3685817
2007/8 457535 809068 900533 1141644.5 3308780
2008/9 331091 295935 1090432 1435699.5 3153158
2009/10 566587 541965 1177831 1766655.5 4053039
2010/11 165419 93936 433314 537302 1229971
max566,587 598,479 1,338,893 1,936,092
min165,419 93,936 433,314 537,302
range401,168 494,543 * * 905,579 1,398,790
variance243% 526% 2Q9% 260%
Trends in coffee unit prices paid have been upward looking with a near exponential growth
between 2007/8 and 2010/11, as in table 4.9. However if the indications of Kangiri FCS
represent the industry, the price may come down in 2012. For the 6 year period, the price
climaxed at 2010/11 with an average of Ksh 72.40 which corresponds well to lowest
production period. Low production in 2010/11 may have created a shortage of the commodity
and thus driven price upwards following the law of demand and supply. The best paying
coffee cooperative society was Marumi (unit price of Ksh 88) while the worst was Thangaini
and Marumi (unit price of Ksh 9 each). Indeed the biggest disparity was always between
Marumi and Thangaini Farmers’ Cooperative Society. As a result of that, Marumi coffee
farmers witnessed the most severe fluctuation with a unit price variance of 377%. Thangaini
coffee farmers experienced the least severe fluctuation of 213% variance in unit price. It is
47

anticipated that, instances of low coffee prices may have dipped farmers satisfaction with
service provision.
Table 4.9: Trends of coffee unit price as paid by management for the years 2005 to 2011
Average Price
Marumi
Average Price
M uthithi
Average Price
Kangiri
Average Price
Thangaini
average
2005/6 20.17 19 20.05 21.04 20.065
2006/7 19.73 14 22.25 19.22 18.8
2007/8 27.73 22 28.45 23.13 25.3275
2008/9 18.37 20.2 25.1 20.9 21.1425
2009/10 44.4 43.2 34.25< , 29.26 37.7775
2010/11 87.6 56.6 85.15 60.1 72.3625
max 88 57 85 60 72
min 18 14 20 19 19
range 69 43 65 41 54
variance 377% 304% 325% 213% 285%
Not all the money earned as direct payments, or bonus got to the farmers. The coffee
cooperative societies in Kigumo district reported that they are characterized by a high
incidence of credit facilities in form of farm inputs and to a little extent cash loans. The study
revealed (Table 4.10) that 65.6% of coffee farmers were not deducted their moneys to pay off
debt as compared to only 34.4% of coffee farmers got deductions to pay off such debts. In a
48

different segment (section 4.6), the coffee farmers were asked to indicate the form of credit
they had taken.
Table 4.10: Proportion of coffee farmers deducted money to pay off debts
Deducted money to
pay debts? Frequency Percentage (%)
Yes 65 34.4
No 124 65.6
Total 189 100 .0
Exactly 12% of farmers were deducted up to Ksh 2,000, 20% were deducted between Ksh< .
2,001 and Ksh 10,000. Only 1% of respondents were deducted in excess of Ksh 10,000 with
the highest paying Ksh 16,000 worth of debts in the last season.
Table 4.11: Period when farmers received the payment (months past)
Months past as of
date of interview Frequency Percent
0 -6 69 34.5
7-12 12 6.0
13 and beyond 4 2.0
Total 2 0 0 1 00 .0
49

When asked when the coffee farmers had received their payment in the months past, 34.5%
reported they had received them in the six months past, when the study was taken, as in
figure 4.10. Only 6% ot the coffee farmers reported they had received their payments seven
months and beyond the time the study was taken. This clearly shows that payment is paid
promptly to the coffee farmers.
4.6. Access to credit facilities by farmers in Kigumo district coffee cooperatives
The third objective was to find out how access to credit facilities influence service provision
by cooperative societies to their members in Kigumo District. Apart from extension services,
prices and incomes, the researcher enquired the extent to which coffee farmers in Kigumo
district access credit facilities form their respective cooperatives.
The study revealed that 78.9% of the coffee farmers had received credit from their
cooperative society as compared to 21.1% whq had not (Table 4.12). One quarter of the
debtors (25%) had taken credit within the last 1 year, 30% took three years before time of
research and only 9% either four years before or earlier.'
Table 4.12: Consumption of credit facility from coffee cooperative societies
When farmers last received credit Frequency Percentage
Last one year 41 25.8
Last two years 18 11.3
Last three years 11 6.9
Four years and above 89 56.0
Total 159 1 00 .0
50

For the greatest proportion of coffee farmers (63%) their type of credit facility consumed was
in form of fertilizer, followed by cash loans for a fifth of the sample respondents, other forms
of credit include pesticides or a combination of cash, pesticides and fertilizer. In general,
farm inputs constitute the largest chunk of loans advanced coffee farmers. One respondent
indicated having received credit in form of maize and it wasn't very clear whether it was part
of government’s social transfer program or it was meant for planting in an arrangement that
the specific cooperative took part in a special distribution program.
Table 4.13: A description of the form of facility (whether in form fertilizer, seeds or
cash)
Form of credit received Frequency Percent (%)
Fertilizer 107 63
Cash < . 36 21
Pesticides 8 5
Cash and fertilizer 9 5
Fertilizer and pesticides 5A
3
Cash and pesticides 3 2
Maize 1 1
Total 167 1 00 .0
The worth of the credit facility that was extended to farmers ranged from Ksh 600 to Ksh
30,000. For more than three quarters of coffee farmers, the credit was less than Ksh 10,000; a
fifth of them had received Ksh 11,000-20,000 worth of credit while a paltry 3% had received
Ksh 21,000-30,000 worth of credit. A high 79% of the coffee farmers acknowledged that the
cooperative societies required collateral before extending the loans, with 21% of them citing
that collateral was not required on the same. The forms of collateral ranged from kilograms of
51

coffee delivered and kilograms of coffee harvested at (66.5%) to guarantors and tallied
number of coffee bushes at the farm land.
Table 4.14: Forms of collateral/security used in the cooperative societies
Form of collateral Frequency Percent (%)
Guarantors 33 16.5
Kilogrammes delivered 96 48
Kilogrammes harvested 37 18.5
Number of coffee trees 1 0.5
Total 2 0 0 1 00 .0
So it emerged that coffee farmers’ cooperatives^ Kigumo district generally use farmers’
deliveries as security to credit facilities more often than other forms of collateral common in
financial institutions (namely guarantors and title deeds). -'
4.7. Factors influencing service provision by coffee cooperative societies
It was imperative to investigate the ratings of the service levels by coffee cooperative
societies from the perspective of members (farmers). Such an inquiry would also provide
indicators of satisfaction. The respondents were therefore requested to rate services offered
by coffee cooperative society compared to others. The researcher used Chi-square which is
considered best for testing hypotheses, in this case, differences in ratings of service provision
using nominal or categorical data1 as indicated in Table 4.15.
1 This test was based ofr a question asking respondents to rate services offered by their cooperative society compared to others on a categorical scale of l=Very Poor to 5=Excellent
52

Table 4.15: Rating of services offered by cooperative society compared to competitors
Name of coffee cooperative society
Marumi Kangiri Thangaini Muthithi
Rate the services Excellent 1.1% 0% 0.5% 0%
offered by your Good 2.6% 9.5% 7.4% 1.6%
cooperative society Average 1.6% 10.5% 18.4% 5.3%
compared to Poor 2.1% 10.5% 14.2% 5.8%
others?(extension Very Poor
services, coffee prices 0% 2.6% 4.7% 1.6%
and credit facilities)
Total 7.4% < . 33.2% 45.3% 14.2%
Chi-Square Tests
Value df
Asymp. Sig.
(2-sidcd)
Pearson Chi-Square 25.194(a) 12 .014
Likelihood Ratio 18.806 12 .093
Linear-by-Linear Association 7.483 1 .006
N of Valid Cases 190
a 8 cells (40.0%) have expected count less than 5. The minimum expected count is .22.
A rating of services offered by cooperative societies indicated that, Marumi and Thangaini
had respectively the best services while Muthithi and Kangiri had the worst services in that
order. This is confirmed by a strong calculated Chi-square statistic of 25.194 (12 degrees of
freedom) significant at 5 percent level. When Chi-square statistic is significant as in this case,
then it implies that the ratings of service provision differ by cooperative society.
53

A Pearson correlation coefficient analysis was conducted between service provision scores
and factors ratings of governance and extension services, coffee prices/incomes and credit
facilities as offered by the four coffee cooperative societies. Service provision scores were
measured by a variable that asked respondents to rate their cooperating society along a five
point Likert scale (relative to competitors). Table 4.16 has results tabulated by correlation
coefficient magnitudes and signs.
Table 4.16: Correlation Coefficients Among Factors Influencing Service Provision
Services provision scores
Satisfaction with governance and extension services
among coffee cooperative societies
Pearson Correlation
Sig. (2-tailed)
0.152
0.043
N< ,
177
Satisfaction with prices offered by coffee
cooperative societies and prompt payment by coffee
cooperative societies
Pearson Correlation
Sig. (2-tailed)
0.350
0.043
N 34
Satisfaction with access to credit from cooperative
societies
Pearson Correlation
Sig. (2-tailed)
0.023
0.754
N 184
C o r r e l a t i o n i s s i g n i f i c a n t a t 0 . 0 5 l e v e l ( 2 - t a i l e d ) .
Out of three factors evaluated, satisfaction with prices paid and prompt payment of delivered
coffee, satisfaction with governance and extension services associate most strongly with • **
service provision score and are statistically significant at 5 percent level. Interpreting this
54

positive correlation, service provision scores associate directly 35% with prices offered and
prompt payment by coffee cooperative societies. Service provision also associates directly
with governance and extension services among coffee cooperative societies (15%
correlation). Even though access to credit was not significant, higher access was seen to
promote service provision scores but only marginally.
55

CHAPTER FIVE
SUMMARY OF FINDINGS, DISCUSSIONS, CONCLUSIONS AND
RECOMMENDATIONS
5.1 Introduction
This chapter presents a summary of the key findings, a comparative discussion and
conclusions based on research objectives. The chapter concludes with recommendations for
management of cooperatives, policy action and further research.
5.2 Summary of findings
This project purposed to investigate and understand the factors which influence service
provision by cooperative societies in Kenya with a case study of four coffee farmers
cooperative societies in Kigumo district. The researcher undertook five week field study of
Kangiri, Muthithi, Marumi and Thangaini coffee cooperative societies. The cooperative
societies had between three and eight coffee factories under it. The research objectives were
to investigate how governance influences service provision by cooperative societies in
Kigumo District; to determine the extent to which coffee price fluctuations influence service
provision by coffee cooperative societies to their members in Kigumo District and to find out
how access to credit facilities influence service provision by cooperative societies to their
members in Kigumo District. A descriptive research design was followed in which of 201
farmers were selected for response to a structured questionnaire using direct interview
technique. Twelve senior managers from the four coffee farmers’ cooperative societies also
provided to the management questionnaire to give information on the administrative side of
the societies. Data analysis was conducted by use of frequencies, and test of relationships
(chi-square statistics and correlation coefficient). Among other findings, results indicate that
satisfaction with jSfices paid and prompt payment of delivered coffee, satisfaction with
56

governance and extension services influence service provision score more strongly than
access to credit facilities. The sections below present a discussion of the findings.
5.3 Discussions
The study revealed that governance, prices and access to credit facilities influence service
provision scores but to different extents. Good governance and higher prices are seen to
facilitate service provision significantly. This is because these issues are strong support
factors by correlation to service provision by coffee cooperatives. However access to credit
facilities is not statistically significant (despite the fact that it also displays a positive
relationship).
On governance and agricultural extension by the societies, majority of respondents indicated
that they had ever received extension services ranging from proper land tenure, proper use of
chemicals, pruning and training on farm management practices. Qualitative variables divulge
that the coffee farmers have a challenge gaining access to credit facilities. Some of the causes
of hampered access to credit can be attributed to corruption, bureaucracy, price brokerage as
alluded to by coffee farmers. Concerning extension services to coffee farms, respondents
acknowledged inadequacy of extension officers leading to unequal proportion of extension
service to number of coffee farmers.
The study divulged that higher product (coffee) prices and prompt payment of farmers for
their deliveries may increase farmer satisfaction with service provided. The correlation
coefficient on prices was positive. However the prices in many of the cooperative societies
were reported as being low which could be attributed to slack in sourcing of competitive
markets. Indeed some respondents cited the momentous differences between producer price
and consumer (supermarket market) price of coffee. In some cases, cooperative society prices
are even lower than ̂ broker” price which leads to low overall incomes (advance payouts and
57

bonuses). This can cause disincentives to investment in coffee farming as evidenced by recent
trends in neighbouring Muranga and Maragua districts. In these regions, farmers totally
abandon coffee farming and opt for substitute crops (most commonly bananas).
Even though this study followed a cross-sectional rather than time series analysis, it partly
relied on data provided by the management of the societies for the years 2005/6 to 2011/12. It
was noted that the coffee industry had experienced fluctuations in production and unit prices.
It is predicted that, periods marked by low coffee prices may have reduced coffee farmers’
satisfaction with service provision by the management and vice versa. However, price is not
the only service provision affecting satisfaction scores in Table 4.15.
Although credit facilities has no statistically important bearing to warrant discussion, it was
noted that cooperative societies rated better-off are also the ones which provided more
available credit facilities and facilitate credit from banks. On the other hand, those rated
worse-off had costly credit facilities. Credit is crucial to coffee farmers since (as revealed
from the amount of income received from coffee) they receive relatively low incomes during
payment seasons hardly financing them through to the next season. Hence the need for
bridging loans. Most of the farmers receive credit in form of farm inputs (fertilizers and
chemicals). This is a form of credit that can be regarded indispensable to such farmers and
they can only suffer production losses in its absence.
5.4 Conclusions
The first objective sought to investigate how governance influences service provision by
cooperative societies in Kigumo District Governance. Results indicate that good governance
promotes service delivery and vice versa. Thus indicators of good governance such as level
of education of managers, managerial training and experience are fundamental to provision of
quality services to coffee cooperatives.
58

It was noted that the coffee industry experiences fluctuations in unit coffee prices. Low
coffee prices can reduce coffee farmers’ satisfaction with service provision by the
management and lead to decline in production. So it is important to find mechanisms to
regulate price accordingly.
Access to credit facilities is not of significant influence to service provision. However, the
direction of relationship is such that higher access to credit increases satisfaction with
services provided. Some of the causes of hampered access to credit were identified as
corruption, bureaucracy and brokerage. So it is crucial for coffee cooperative to institute
ways of increasing access to credit for their members by overcoming the said bottlenecks.
In light of the above discussion, we make the following recommendations for policy,
management and further research.
5.5 Recommendations
1. The Ministry of Cooperative Development should ensure there are basic academic
and experience profiles that management committees must meet before allowing them
to vie for any leadership position in coffee cooperatives. Also instances of coffee theft
need to be stopped. Hence, in tandem with this is to ensure that the recruitment
mechanism adheres to guidelines of integrity and results oriented productivity.
Despite the shortage of personnel for extension work, extension service provision was
key in increasing their coffee yields that translated to better incomes and hence
improved livelihoods from their sale of coffee. Government should increase
manpower by hiring more agricultural extension workers and agronomists. The coffee
cooperative societies should introduce a capacity building program in which farmers
59

are taken through seminars on agricultural and credit products. In turn, the graduates
become trainers of their colleagues on best practices.
2. To guarantee sustained interest in coffee farming, it is important for the government
and stakeholders to seek alternative sources for market that offer better coffee prices.
This can help to oversee challenges of coffee price fluctuations due to reliance on
traditional markets. At the same time the authorities can initiate programs that
promote local demand for coffee. Such ideas have been seen to work in Ethiopia and
Egypt.
3. The government should help coffee cooperatives to look for better markets and
pricing for coffee produced. While it may be difficult to eliminate intermediaries,
putting a mechanism to provide a stronger link between the farmers and the market
could create a win-win situation between farmers and coffee brokers. This can be' t
achieved by setting up of regulation authority/function that can closely work with
intermediaries alongside the Coffee Board of Kenya.
4. The farmers suggested various ways to improve service provision by coffee
cooperative societies. Some proposed that the cooperatives absorb price fluctuations,
enhance transparency and accountability by management while marketing coffee and
allocating bonuses, avail credit and farm inputs (especially pesticides and fertilizers)
to farmers, provide advance payments for coffee delivered. Others recommended that
societies advise farmers on farming procedures. Some of the striking suggestions were
that cooperatives provide loans with negotiable collateral, conduct marketing
research, improve security of coffee factory, and reduce lending rates and
intermediaries (middle men) as well as providing frequent education days.
*«■
60

5.6 Suggestions for Further research
1. This research project has focused the factors influencing service provision by
cooperative societies. However cooperative societies are not the only institutions that
coffee farmers interact with in daily operation. We therefore suggest that further
studies be conducted to investigate the role of microfinance institutions and banks in
improving production and hence livelihoods of coffee farmers in Kenya.
2. It is recommended that a comparative study be conducted between coffee cooperative
societies in Kenya and Ethiopia so as to borrow best practices from Ethiopia. This is
because Ethiopia is one of the top rated coffee producing countries in terms of quality
and quantity.
61

REFERENCES
Chambo, S. A, Mwangi; M. and Oloo, O (2008). A n A n a l y s i s o f t h e S o c i o - E c o n o m i c I m p a c t
o f C o - o p e r a t i v e s i n A f r i c a a n d t h e i r I n s t i t u t i o n a l C o n t e x t . Nairobi, International
Cooperative Alliance and the Canadian Cooperative Association.
Cochran W.G (1963). S a m p l i n g T e c h n i q u e s . John Willey and sons Inc., New York
Damianopoulos, R. A (2005). M a r k e t A d a p t a b i l i t y , I n d u s t r i a l D i v e r g e n c e a n d t h e P o l i t i c s o f
L i b e r a l i s a t i o n i n t h e K e n y a n a n d U g a n d a n C o f f e e I n d u s t r i e s . MA Thesis University
of British Columbia, Retrieved from ProQuest Dissertations & Theses.
Evans, A. C. (2002). T h e U n p a v e d R o a d A h e a d : H I V / A I D S & M i c r o f i n a n c e : A n E x p l o r a t i o n
o f K e n y a C r e d i t U n i o n s ( S A C C O s ) . Research Monograph Series No. 21, Wisconsin,
World Council of Credit Unions. < ,
Gamba, P and Komo I (2006). E v o l u t i o n , G r o w t h , a n d D e c l i n e o f t h e C o o p e r a t i v e S e c t o r .
Working Paper for Centre for Governance and Development, Nairobi Kenya
Hussi, P., Murphy J., Lindberg O. & Brenneman L. (1993). T h e D e v e l o p m e n t o f
C o o p e r a t i v e s a n d O t h e r R u r a l O r g a n i z a t i o n s : T h e R o l e o f t h e W o r l d B a n k .
Washington, D.C., World Bank.
Karanja, A.M (2002). L i b e r a l i s a t i o n a n d S m a l l h o l d e r A g r i c u l t u r a l D e v e l o p m e n t ; A C a s e
S t u d y o f C o f f e e F a r m s I n K e n y a . phD Thesis, Wageningen University, USA. Retrieved
from ProQuest Dissertations & Theses.
Karanja, A.M (2002). C o f f e e P r i c e s a n d R e g u l a t i o n a n d t h e i r I m p a c t o n L i v e l i h o o d s o f R u r a l
C o m m u n i t y i n K e n y a . Tegemeo Institute of Agricultural Policy and Development,
Egerton University - Kenya
International Cooperative Alliance (ICA) (2002) Status of Agricultural Marketing
Cooperatives in Kenya, Nairobi, ICA-ROECSA.
62

Kenya National Bureau of Statistics (2009). E c o n o m i c S u r v e y 2 0 0 9 . Nairobi, Government
Printer.
Kenya National Federation of Cooperatives (KNFC) (2008a). P r o c e e d i n g s R e p o r t o f t h e
N a t i o n a l C o o p e r a t i v e L e a d e r s ’ C o n f e r e n c e ( N o v e m b e r 2 0 0 7 ) . Nairobi, Kenya
National Federation of Cooperatives.
Kenya National Federation of Cooperatives (KNFC) (2008b). R e v i s e d B y - L a w s ( 2 0 0 8 ) f o r t h e
K e n y a N a t i o n a l F e d e r a t i o n o f C o o p e r a t i v e . (Reg. No. CS/1068), Nairobi, Kenya
National Federation of Cooperatives.
Kenya National Federation of Cooperatives (KNFC) Board (2007). O u t l i n e S t r a t e g y P a p e r
f o r K e n y a N a t i o n a l F e d e r a t i o n o f C o o p e r a t i v e s . Nairobi, Kenya National Federation
of Cooperatives.
Kegonde, P (2005). E c o n o m i c G o v e r n a n c e o f C o f f e e S e c t o r ; F o c u s o n C e n t r a l P r o v i n c e .
Centre for Governance and Development, Nairobi Kenya
Kothari C.R (2004). R e s e a r c h M e t h o d o l o g y : M e t h o d s a n d T e c h n i q u e s 2 n d e d i t i o n . New Age
International Publishers
Lindberg O. (1993). K e n y a : R e v i e w o f t h e C o o p e r a t i v e S e c t o r w i t h S p e c i a l E m p h a s i s o n
C o f f e e C o o p e r a t i v e s ' , in Porvali H. (ed.), T h e D e v e l o p m e n t O f C o o p e r a t i v e s a n d
O t h e r R u r a l O r g a n i z a t i o n s , A g r i c u l t u r e a n d R u r a l D e v e l o p m e n t Series, No. 8,
Washington, D.C., World Bank.
Manyara, M. K. (2003). T h e D e v e l o p m e n t o f C o o p e r a t i v e L c r w a n d P o l i c y i n K e n y a . Nairobi,
Oscan Print.
Ministry of Cooperative Development and Marketing (2008). C o o p e r a t i v e D e v e l o p m e n t
P o l i c y , 2 0 0 8 , N a i r o b i . Ministry of Cooperative Development and Marketing.
Mugenda A and Mugenda O, (2003). R e s e a r c h m e t h o d s : Q u a n t i t a t i v e a n d Q u a l i t a t i v e .
iKenyatta University Press, Nairobi
63

Mude, A (2006). W e a k n e s s i n i n s t i t u t i o n a l o r g a n i z a t i o n ; e x p l a i n i n g d i s m a l p e r f o r m a n c e o f
K e n y a n c o f f e e c o o p e r a t i v e s . International Association of Agricultural Economics
Conference, Gold coast Australia
Nyangito, H.O (2001). P o l i c y a n d L e g a l F r a m e w o r k f o r t h e c o f f e e s u b s e c t o r a n d t h e i m p a c t
o f l i b e r a l i z a t i o n i n K e n y a . KIPPRA policy paper no.2
Owango M., Lukuyu B., Staal S. J., Kenyanjui M., Njubi D. & Thorpe W. (1998). D a i r y
C o o p e r a t i v e s a n d P o l i c y R e f o r m i n K e n y a : E f f e c t s o f L i v e s t o c k S e r v i c e a n d M i l k
M a r k e t L i b e r a l i z a t i o n . Food Policy, Vol. 23, No. 2, p. 173-185.
Porvali, H. (ed) (1993). T h e D e v e l o p m e n t o f C o o p e r a t i v e s a n d O t h e r R u r a l O r g a n i z a t i o n s ,
A g r i c u l t u r e a n d R u r a l D e v e l o p m e n t S e r i e s , N o . 8 The World Bank, Washington, D.C.
Republic of Kenya (1997a). Sessional Paper No. 6 of 1997 On C o o p e r a t i v e s i n a L i b e r a l i z e d
E c o n o m i c E n v i r o n m e n t . Nairobi, Government Printer.
Republic of Kenya (1997b). C o o p e r a t i v e S o c i e t i e s A c t , 1 9 9 7 . Nairobi, Government Printer.
Republic of Kenya (2008a). E c o n o m i c S u r v e y 2 0 0 8 . Nairobi, Central Bureau of Statistics,
Ministry of Planning and National Development.
Republic of Kenya (2008b). T h e S A C C O S o c i e t i e s A c t , 2 0 0 8 . Nairobi, Government Printer.
Republic of Kenya (2004a). T h e C o o p e r a t i v e S o c i e t i e s ( A m e n d m e n t ) A c t , 2004. Nairobi,
Government Printer.
Republic of Kenya (2004b). T h e C o o p e r a t i v e S o c i e t i e s R u l e s , 2004. Nairobi, Government
Printer.
Staal S., Delgado C. & Nicholson C. (1997). S m a l l h o l d e r D a i r y i n g u n d e r T r a n s a c t i o n s C o s t
i n E a s t A f r i c a . World Development, Vol. 25, No. 5, p. 779-794.
Swynnerton, R.J.M. (1955). T h e S w y n n e r t o n R e p o r t : A p l a n t o i n t e n s i f y t h e d e v e l o p m e n t o f
A f r i c a n a g r i c u l t u r e i n K e n y a . Nairobi: Government Printer.
64

Wanyama, F. O. (2006). I n t e r f a c i n g t h e S t a t e a n d t h e V o l u n t a r y S e c t o r f o r A f r i c a n
D e v e l o p m e n t : L e s s o n s f r o m K e n y a . Africa Development, Vol. 31, No. 4, p. 73-103.
Wanyama, F. O. (2008). T h e Q u a l i t a t i v e a n d Q u a n t i t a t i v e G r o w t h o f t h e C o o p e r a t i v e
M o v e m e n t i n K e n y a , in P. Develtere, I. Pollet & F. Wanyama (eds.), C o o p e r a t i n g O u t
o f P o v e r t y : T h e R e n a i s s a n c e o f t h e A f r i c a n C o o p e r a t i v e M o v e m e n t , Geneva,
International Labour Office.
Wanyama F.O (2009). S u r v i v i n g L i b e r a l i s a t i o n ; t h e c o o p e r a t i v e m o v e m e n t i n K e n y a . ILO,
Geneva Switzerland, Working paper number 10
65

APPENDICES
Appendix 1: Transmittal Letter
Stephen N Nduati
P. o Box 251-10203,
KIGUMO
Date.............................
TO
RE: LETTER OF TRANSMITTAL OF DATA CQLLECTION
1 am undertaking a research for my Master of Arts degree in project planning and
management of the University of Nairobi. The study is on factors influencing service
provision by cooperative societies to their members.
Please answer the questions in the questionnaire honestly and completely. The information
you give shall be treated with confidentiality and will be used for the purpose of academic
research only.
Thank you.
Yours faithfully
Stephen N Nduati
Cell phone 0721910870
66

U N IV E R S ITY OF NAIROBICOLLEGE OF EDUCATION AND EXTERNAL STUDIES
iSCHOOL OF CONTINUING AND DISTANCE EDUCATION DEPARTMENT OF EXTRA-MURAL STUDIES
NAIROBI EXTRA-MURAL CENTRE
Your Ref:
Our Ref:
Telephone: 318262 Ext. 120
Main CampusGandhi Wing, Ground Floor P.O. Box 30197 N A I R O B I
28th JUNE 2012
REF: UON/CEES/NEMC/12/327
TO WHOM IT MAY CONCERN
RE: St e p h e n ! N IU G U N A N D U A TI -REG.n o . L50/64996/2010
This is to confirm that the above named is a student at the University of Nairobi College of Education and External Studies, School of Continuing and Distance Education, Department of Extra- Mural Studies pursuing Masters in Project Planning and Management.
He is proceeding for research entitled "factors influencing service provision by selected cooperative societies in Kigumo"
appreciated.

Appendix 2: Coffee Farmers’ Questionnaire
Please answer the questions freely. The information you provide will be treated with utmost
confidentiality and will only be used for academic research purposes by the researcher
himself.
Name of cooperative society__________________ Name of factory__________________
Part I; Demographic information
1. What is your gender? [ZD Male □ □ Female
2. How long have you been in the cooperative movement?
□ Under 10 years D l 1 - 20 years □ 21 - 30 years □ Over 30 years
3. What is your highest level of Education?
□ Primary Level □ Secondary Level □ Bachelors Degree
□ Others (specify):........................
Part LI; Extension Education services
4. Have you ever attended any extension education session organized by your cooperative
society?' □ Yes D N o
5. If yes when was the last training session?
□ Within the last one year
□ Within the last two years
□ Within the last three years
□ Four years and above
6. Please indicate the extent to which you AGREE or DISAGREE with each of the
statements by selecting the category that corresponds best to your desired response.
67
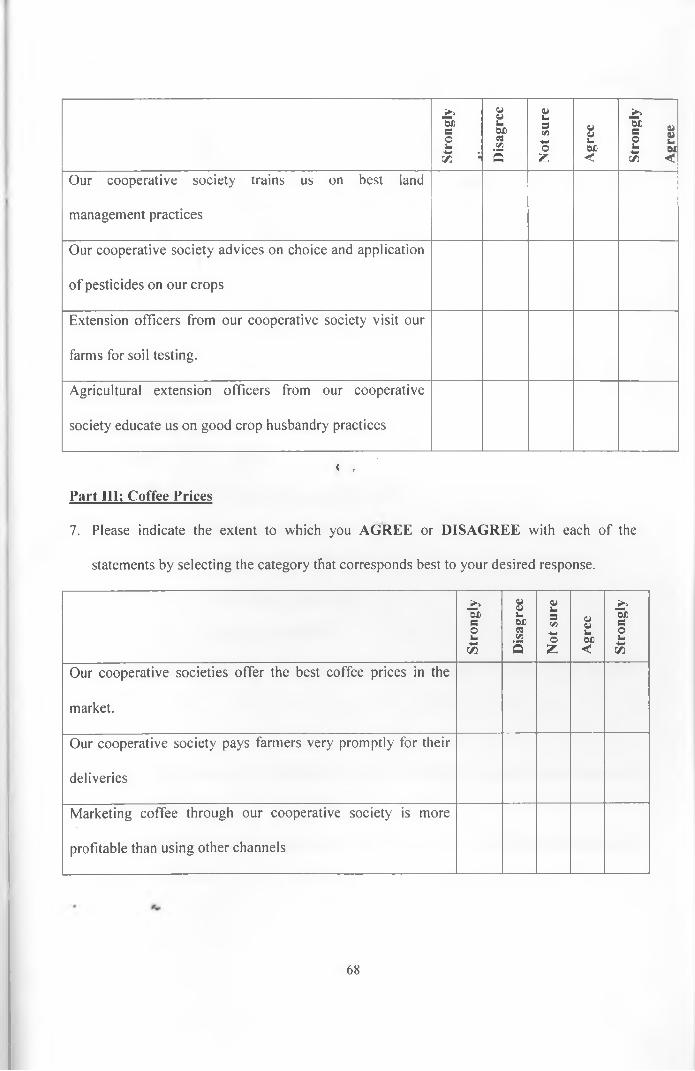
Stro
ngly
-■ *---
-----
--D
isag
ree
Not
sur
e
Agr
ee
Stro
ngly
Agr
ee
Our cooperative society trains us on best land
management practices
Our cooperative society advices on choice and application
of pesticides on our crops
Extension officers from our cooperative society visit our
farms for soil testing.
Agricultural extension officers from our cooperative
society educate us on good crop husbandry practices
< ,
Part III; Coffee Prices
7. Please indicate the extent to which you AGREE or DISAGREE with each of the
statements by selecting the category that corresponds best to your desired response.
Stro
ngly
Dis
agre
e
Not
sur
e
Agr
ee
Stro
ngly
Our cooperative societies offer the best coffee prices in the
market.
Our cooperative society pays farmers very promptly for their
deliveries
Marketing coffee through our cooperative society is more
profitable than using other channels
68

8. How much advance did you receive per kilo of coffee delivered in the last season?
Kshs___
9. How much bonus did you receive per kilo of coffee delivered in the last season? Kshs_
10. How many kilogrammes of coffee did you deliver in total during the last season?
11. How much money were you paid in total during the last season? Kshs________
12. Were you deducted any money to pay off debts? EH Yes EH No
13. If Yes to Q.12, how much? Kshs___________
14. When did you receive the above payment? Month__________year_____________
Part IV; Credit facilities
15. Have you ever received any credit facility from your cooperative society?
□ Yes EH No t
16. If yes indicate when you took the last credit facility?
□ Within the last one year
□ Within the last two'years
□ Within the last three years
□ Four years and above
17. If yes, please describe the facility (whether it was in form fertilizer, seeds or cash)
18. What is the worth of the credit facility that was extended to you by your cooperative
society? Kshs__________
19. Did the cooperative society demand any form of security (collateral) before extending the
loan? EH Yes EH No
69

20. If Yes to Q19, please describe the form of collateral/security
21. In your opinion, how would you rate the services offered by your cooperative society
compared to others?
□ Excellent EH Good EH Average EH Poor EH Very poor
22. Explain your answer above
23. Please suggest ways that your cooperative society can improve service provision
V ”.
Thank you
70
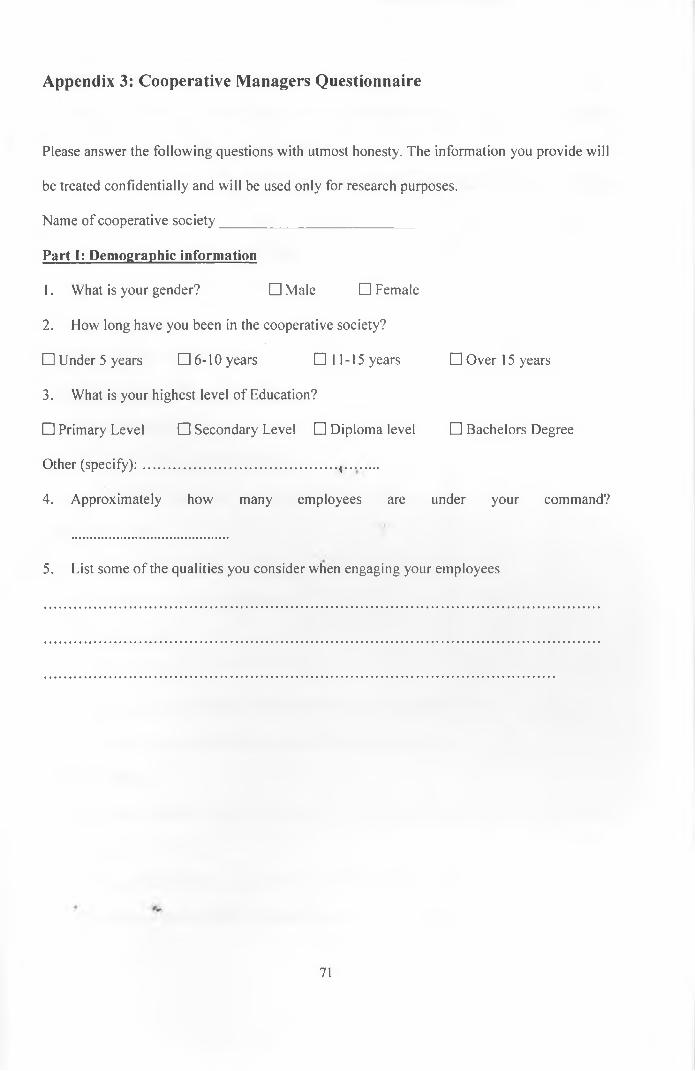
Appendix 3: Cooperative Managers Questionnaire
Please answer the following questions with utmost honesty. The information you provide will
be treated confidentially and will be used only for research purposes.
Name of cooperative society__________________________
Part I: Demographic information
1. What is your gender? □ Male □ Female
2. How long have you been in the cooperative society?
□ Under 5 years □ 6-10 years □ 11-15 years □ Over 15 years
3. What is your highest level of Education?
□ Primary Level □ Secondary Level □ Diploma level □ Bachelors Degree
Other (specify):.................................................... t . . . .....
4. Approximately how many employees are under your command?
5. List some of the qualities you consider when engaging your employees
71

Part II: Governance
6. Please indicate the extent to which you agree with the following statements with regard
to governance in your cooperative society
Strongly
disagree
Disagree Not
sure
Agree Strongly
agree
The level of education of the cooperative
managers influence service provision by
our cooperative society
Length of experience of the cooperative
manager influence service provision by
our cooperative society
Exposure to managerial training
influence service provision by our
cooperative society
< ,
;
Robustness of the employee hiring
process influence service provision by
our cooperative society
7. Have you encountered cases of theft of coffee in your factories? □ Yes □ No
8. If Yes to Q 7, how many bags were stolen in the last season?__________
Part III: Prices
9. How much advance did you pay per kilo of coffee delivered in the last season?
Kshs____
10. How much bonus did you pay per kilo of coffee delivered in the last season? Kshs____
11. When did you" pay the above payment? Month__________year_____________
72

12. What is the highest price you have ever paid to your members per kilo of coffee
delivered? Kshs________ Year:_______
13. What is the lowest price you have ever paid to your members per kilo of coffee
delivered? Kshs________ Year:_______
14. In your opinion, how would you rate your prices relative to other coffee buyers?
□ we buy farmers coffee at a relatively higher price
CD we buy farmers coffee at prices that are generally similar to other buyers
CD we buy farmers coffee at a relatively lower price
Part IV: Credit facilities
15. What amount on average (Kshs) do you allocated fpr loans to your members per year?
16. How much loan (Kshs) did you loan out to farmers in the last financial year?
17. Do you require any collateral (security) before advancing any loan to your members?
□ Yes D N o
18. If yes describe the form of security required?
Part V: Cooperative policy and regulations
19. Do you have policies to guide your operations in the cooperative society?
□ Yes D N o
73

20. If your answer to question 8 is Yes, enumerate the policies you have.
21. To what extent does Cooperative society’s act and rules, 2004 influence service provision by
your cooperative society?
D Not at all □ Limited Extent D Not sure D Certain extent D Large extent
22. To what extent does Cooperative development policy 2008 influence service provision by your
cooperative society?
□ Not at all □ Limited Extent □ Not sure □ Certain extent □ Large extent
Part VI: Extension Services
23. Do you offer extension education services to your members?
Yes No< ,
24. If Yes to Q 22, when was the last training session?
□ Within the last one year
□ Within the last two years
□ Within the last three years
□ Four years and above
25. Kindly explain the extension service you provide to your members
26. What major challenges do you face in the process of providing services to the
cooperative members.......................................................................................................
74

27. How do you address the challenges above? (if any)
What suggestions would you offer to improve service provision to the cooperative
members?
Thank you.< .
V 75