
Factors influencing population change in rural … AliaOfi5333bS '"^ ACKNOWLEDGMENTS rift? c,Z...
106
Transcript of Factors influencing population change in rural … AliaOfi5333bS '"^ ACKNOWLEDGMENTS rift? c,Z...


/FACTORS INFLUENCING POPULATION CHANGE INRURAL SETTLEMENTS OF NORTH CENTRAL KANSAS
by
MARION ELIZABETH MACKAY
M.A.(Hons.) University of Glasgow, 1986
A MASTER'S THESIS
submitted in partial fulfillment of the
requirements for the degree
MASTER OF ARTS
Geography
KANSAS STATE UNIVERSITY,Manhattan, Kansas
1988
Approved by:
Major Professor

Mffi AliaOfi 5333bS'"^ ACKNOWLEDGMENTS
rift?
c, ZI would like to "take "this opportunity to express my
gratitude and thanks to the students and faculty of the
Geography department for their friendship and encouragement
offered to me throughout my graduate studies here at Kansas
State University. In particular I thank Professor Seyler
and Professor Nellis for being on my Thesis committee and
for their helpful comments and assistance. Most of all
however, I am indebted to Professor Steve White for guiding
me through this research project with unending patience and
enthusiasm, and for his words of wisdom to me to "keep on
trucking. . .
!
"
(i)

TABLE OF CONTENTS
PAGEList of Tables (iii)List of Figures (iv)
Chapter One: Introduction 1
Historical Background of Settlement in Kansas 8
Problem Statement 12Plan of Study 14
Chapter Two: Literature Review 16Historical Setting 17Theoretical Developments 17The Urban Influence 19Interdisciplinary Research 20Rural Renaissance ? 26Summary and Conclusions 31
Chapter Three: Methodology 34Population Change 34Historical Overview 38Recent Population Change 40Summary of Selected Variables 54
Chapter Four : Results 57Relationship of Selected Variables with DependentVariable 57Correlation Among Independent Variables 62Multiple Regression Analysis 66Beta Weight Analysis 70Analysis of Residuals 73Summary of Results 76
Chapter Five : Conclusions 78Population Change in General 80The Future of Rural Settlements. . ? 83Critique of the Methodological Procedures 85Further Research 86
Appendix 1 : Summary of Data used in Study 89
Bibliography 91
(ii)

LIST OF TABLES
TABLE PAGE
1 . 1 Classification of Counties 10
3.1 Population Change in North Central Kansas:
1890-1987 by City Size 42
3.2 Summary of Settlement population Data 44
3.3 Function Categories of Retail and Service Provision
in North Central Kansas 50
3 . 4 Point Scores 51
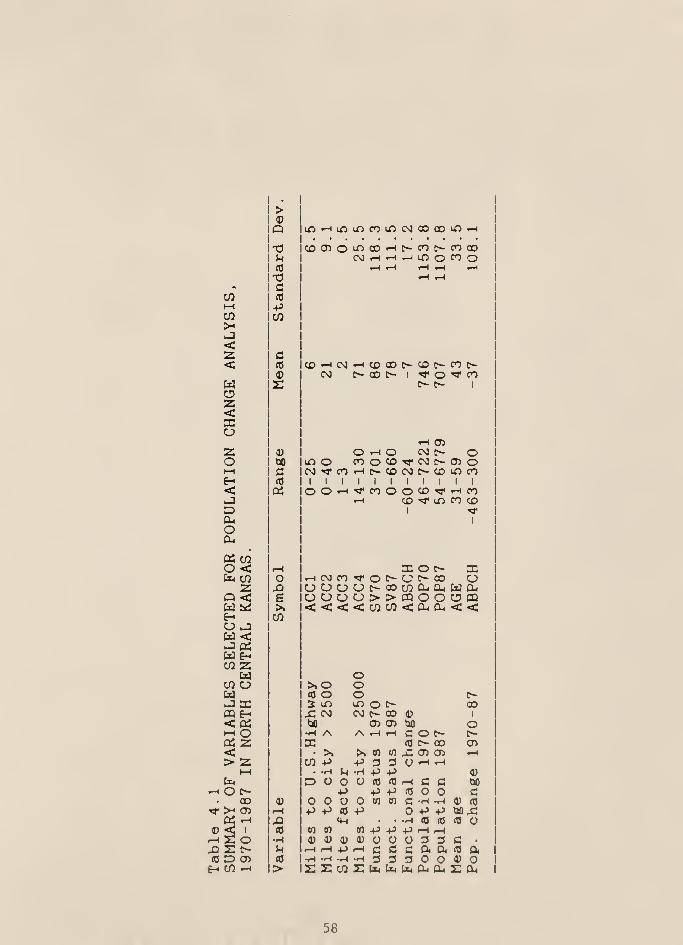
4.1 Summary of Variables Selected for Population Change
Analysis 58
4 . 2 Correlation Matrix of Variables 59
4.3 Summary of Results Of Stepwise Multiple Regression. 68
4 . 4 Variable Beta Weights 72
(iii)

LIST OF FIGURES
FIGURE PAGE
1 . 1 Location of Study Area in Kansas 9
3.1 Settlements in the North Central Kansas Study Area.. 35
3.2 Population of Settlements in North Central Kansas. .
.
36
3.3 Percentage Population Change in Kansas, 1890-1980.. 37
3.4 Average percentage Population Change, 1890-1987 in
Cities Categorized by Size 41
3.5 Population Change 1970-1987 in North Central
Kansas 45
4. 1 Extreme Residuals Mapped 74
(iv)

Chapter One
INTRODUCTION
"The study of small towns has both practical and
theoretical implications for the understanding of
rural population dynamics and general population
change. Central to this understanding is a knowledge
of the factors affecting small town population
change ..."
(Butler & Fuguitt 1970, pp.397)
Decades of centralization have shifted population and
business activities away from villages and small towns,
toward urban centers (Johansen & Fuguitt 1984), leading to
the notion that small rural settlements are becoming
obsolete and anachronistic in the modern urban orientated
society of today. However, while most American people live
in cities, villages and small towns are considerably more
numerous, and do play an important role in the settlement
system. In the relatively short history of settlements in
the United States, particularly in the Midwest, rural
settlements have developed rapidly from their initial
beginnings and associated growth, through stages of

fluctuation, stagnation and decline. This is in contrast
with other regions of the world, where villages have been
the basic unit of settlement throughout history.
One of the results of this ongoing process of
centralization and urbanization has been a general
stagnation and decline of rural areas resulting in an
increasingly subservient demographic position for rural
settlements in the urban hierarchy. The familiar image of
rural small towns today is one of a dead Main street, with
empty stores and dilapidated buildings, where the grain
elevator appears to be one of the few functioning
activities remaining in the place. Urbanization and the
associated growth of automobile ownership has led to a
reduction in the number of services and functions performed
in individual rural places (Hart et al. 1968).
Associated with this general dearth in small towns has
been a transformation of the rural economy and also a
change in the technology and methods of farming in many
areas. There are indeed many processes that affect
population change in rural settlements, as settlements
change in response to changes in the external economy in
which they are entrenched. Rural farm population has
fallen as a result of changed farming practices, such as
mechanization and increasing farm size, while urban
population has grown because of the ongoing trend of

centralization. The function of settlements also change in
association with external developments. The loss of central
place functions has been one of the major results of
population loss in rural areas. However, some places have
gained new functions, such as recreation in association
with their rurality, or residential functions as a result
of commuter activity.
Historically, settlements formed self perpetuating,
independent units, serving and providing for people in and
around the settlements. Villages originally developed and
grew in response to changes in their hinterlands, and the
demands placed on them to provide necessary functions. As
these demands have changed over time, so the role and
function of the settlement has changed. Until about the
mid 1960 's the overwhelming rural settlement response to
external change was demographic and economic decline. Rural
settlements have experienced considerable population loss
and retail and service provision decline throughout much of
the twentieth century. However, since the late 1960 's there
appears to have been a slowing of this trend, and indeed
rural settlements have been declining much less rapidly,
and many places have actually grown during the past couple
of decades (Hart 1986; Bunce 1982). What had been accepted
as conventional wisdom on rural decline has been somewhat
swept away with the occurrence of this more recent rural
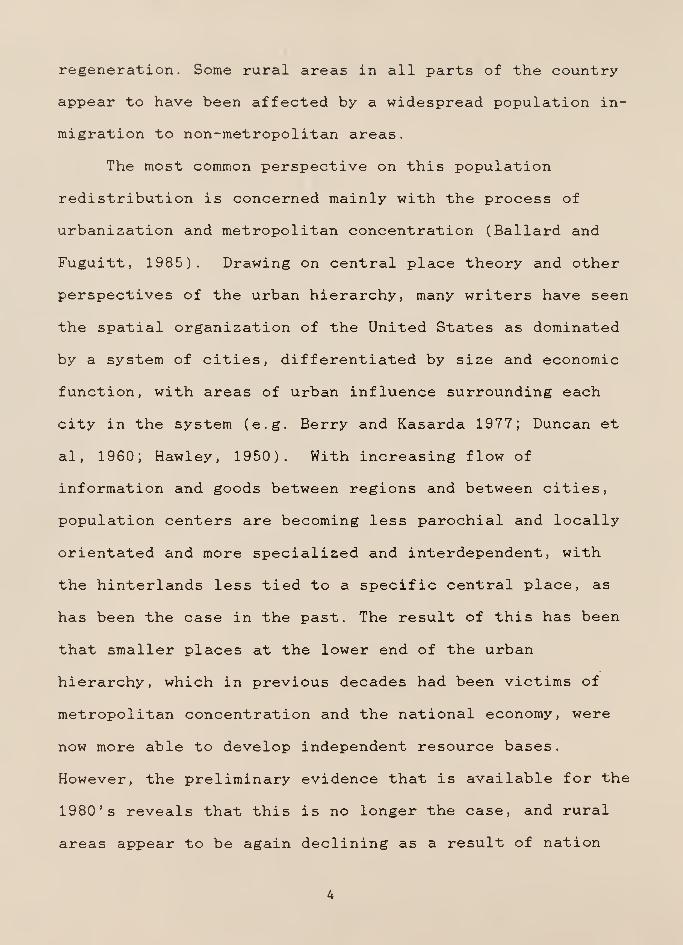
regeneration. Some rural areas in all parts of the country-
appear to have been affected by a widespread population in-
migration to non-metropolitan areas.
The most common perspective on this population
redistribution is concerned mainly with the process of
urbanization and metropolitan concentration (Ballard and
Fuguitt, 1985). Drawing on central place theory and other
perspectives of the urban hierarchy, many writers have seen
the spatial organization of the United States as dominated
by a system of cities, differentiated by size and economic
function, with areas of urban influence surrounding each
city in the system (e.g. Berry and Kasarda 1977; Duncan et
al , 1960; Hawley, 1950). With increasing flow of
information and goods between regions and between cities,
population centers are becoming less parochial and locally
orientated and more specialized and interdependent, with
the hinterlands less tied to a specific central place, as
has been the case in the past. The result of this has been
that smaller places at the lower end of the urban
hierarchy, which in previous decades had been victims of
metropolitan concentration and the national economy, were
now more able to develop independent resource bases.
However, the preliminary evidence that is available for the
1980 ' s reveals that this is no longer the case, and rural
areas appear to be again declining as a result of nation

wide economic trends.
Efforts to incorporate the new demographic trends into
theories have been based upon a view about technological
development, with the 1970 's identified as part of a "post
industrial", "slow growth" epoch, or the "diffuse stage of
urbanization" ( Hawley 1978; Morrill 1979, 1980; Philips
and Brunn 1978). This equilibrium approach (Wardwell 1977,
1980), emphasises the declining metropolitan non-
metropolitan socio-economic differentiation and changing
residential preferences along with transportation and
communication improvements. However, others have
criticized these equilibrium models, pointing to the
disequilibriating effects that occur when individual
decisions are aggregated over space and may consider
underlying changes in the spatial composition of capitalism
as more fundamental (Gordon 1977; Harvey 1973).
As processes, both growth and decline tend to be self
perpetuating, and it is indeed difficult to distinguish
between the symptoms and causes. Symptoms have effects
which generate further symptoms (Bunce 1982, pp.99). For
example, when population declines in a place the result is
a lowered potential market for the business and retail
services of that place. This will eventually lead to the
closure of some establishments and thus further reduce the
functions and services provided in that place. This in turn

will then encourage further population loss, and so the
process goes on. This circularity has been widely
recognized in rural areas, where it has been likened to the
"vicious circle of poverty" , and is seen to be particularly
problematic. The direct results of downward spiral are
decay in physical structures, depopulation and loss of
services and functions. However, this downward spiral of
stagnation and decline is rather selective in the rural
settlements that it affects. Stagnation and decline in
certain elements of the settlement structure, are not
always accompanied by depopulation and general economic
decay. For example, rural services may contract while the
population remains because residents can obtain retail
needs elsewhere, usually in a larger town or city.
Thus far, the term "rural" has been used generously,
and it may be useful to consider briefly what exactly is
meant by "rural" here. Rurality is indeed a concept that,
within a largely positivist framework, various branches of
social science have sought to define and systematize. The
simplest, and most common criterion used to define rurality
are those relating to population size, density, and the
land use of the hinterlands. Settlement are comprised of
entities reflecting a continuum of sizes, from large urban
conurbations to remote rural hamlets, and it is difficult
to determine exact cut off points within this continuum.

Bunce (1982) suggests that the distinctiveness of rural
settlements is based upon the land-use of the regions in
which they are situated, and the absolute size of the
settlement. The size of rural settlements is an inherent
feature which restricts diversification of the economy and
limits the functional role of the settlement. The smallness
of rural settlements, and therefore high dependence on a
few functions, makes them more vulnerable to change in
response to external situations, than is the case for
larger places.
It is important to identify and understand the
processes that are operating to influence settlement
patterns and dynamics, and to attempt to determine the mode
and magnitude of change that is taking place in rural areas
at the present time. Increased awareness of what is
happening in rural areas will enable more informed
decisions to be made concerning rural settlements and
enable more understanding of the population trends that are
occurring in these places. It is to this end that this
thesis will consider the population change in North Central
Kansas, and attempt to explain this change in the light of
several selected variables related to settlement
accessibility, service and retail provision in the
settlements, and the size and age structure of the
incorporated places of the study area.

STUDY REGION.
The study region includes 10 counties in North Central
Kansas, shown in figure 1.1. These counties have been
classified according to the dominant type of economic
activity performed in the county in table 1.1.
The region is one dominated by small rural
settlements, outside the immediate influence of any major
urban area. The largest city in the region is Concordia,
with a population of 6,847 (U.S. Census, 1980), and the
average settlement has a population of 719. There is
evidence that a rural regeneration or population turnaround
occurred during the 1970 's in the region, as also has
occurred throughout much of the country. However, this
trend appears to have reverted back to one of significant
decline since 1980. These population trends coupled with
the overwhelming dominance of small towns in the region
make it an interesting area to study.
HISTORICAL BACKGROUND OF SETTLEMENT IN KANSAS.
The main thrust of settlement in Kansas took place
during the later half of the 19th century as a result of
the Homestead Act of 1862 (Self and White, 1986) and the
Land Development schemes of associated with the growth and
extension of railroads. Indeed, railroads were crucial in
8

uD00
CO
CO
CO
cCO
ctJ
OJ
uCO
T33Ul
CO
CO
uo-J
CO
0J
uCO
-a3
COJ
CO
OJ1-1
a.OJ
u

1 ab 1 e 1 . 1
CLASSIFIED BY DOMINANT ECONOMIC ACTIVITY
wheat- I J vestock
: C D J i I
OsborneSmi thMitchel
I
corn-bel
t
Jewell-
Repub I
i
c
Washi nqtor
! manufacturing
EI Ituorln
;ervi ce
CI DUCi
Note: Farming dep;eriderrt counties are de-fined as those inwhich at least 20 percent o-f the personal income came -from
f a r mi ri g t d r t h e p tvr i o d 19 75 to 1 979 , or i n wh 3. c h 25 p> er c en
t
o-f the labor was emp loved in agriculture according to the1980 census.
Manu-f acturi ng counties are de-fined as those with atLeast 10 percent o-f the labor -force engaged inma ri u -f a c t u r i n g activ 1 1 y .
Service center counties are those which in 1980 had atleast 00 percent of the labor force employed in the service
tor, retail and public administration combined.
[Th si -f i cat ion was devised on the- basis of 1980c en 5u s i nf or mat i on J
'source: Flora and Flora et al . 1986)
10

early settlement, providing the major transport and
communication arteries between the dispersed settlements.
Though the possession of a railroad was essential to early
trade center survival, the location of a town on a rail
line did not necessarily insure its growth. Nevertheless,
the smaller centers which grew most rapidly during this
early phase tended to have rail access, and often were not
located near a major trade center (Kale 1975,
PP. 30).
The Homestead act provided a specific amount of land
for those early settlers who would cultivate it. The size
of these parcels varied from 80 to 160 acres, and this is
what accounts for some of the spatial regularity of
homesteads on the landscape. This provision of land
significantly encouraged rural settlement where it might
not otherwise have evolved. This, coupled with the
relative newness of the settlements in the region, many
being only around 100 years old, may be some of the reasons
why these places are experiencing higher decline than is
typical of other areas in Kansas, and indeed, the United
States as a whole. Population in the state of Kansas is
growing at an annual rate of 5.1 percent between 1970 to
1980, while in North Central Kansas the annual rate of
decline is minus 6.34 percent, (U.S. Census of Population
1980) .
11

As automobiles became more available, and the quality
of roads improved, rural residents found themselves freed
from the dependency on their local center, and were thus
able to travel greater distances in order to gain some of
the services that had previously been available in the
local center. Consequently, towns did not need to be as
closely spaced as before. Mechanization of farming allowed
for larger farm units, which led to the movement of
population from the land. During the Depression of the
1930 's the interrelationships between these processes
heightened, and the Midwest lost population, and many small
trade centers were lost at this time due to population loss
(Kale, 1975). High rates of out migration from the region
as a whole have been widespread even throughout recent
decades, and many small towns and hamlets established near
the turn of the century have completely disappeared from
the landscape.
PROBLEM STATEMENT.
This thesis analyzes the demographic trends that have
occurred in the incorporated places of North Central
Kansas. The population change from 1890 until the present
time will be discussed, initially in a general way in order
to describe the overall trends in the region. Then the
period from 1970 to 1987 will be considered in more detail
12

in an attempt to explain or account for the population
change that has occurred during that time, in the light of
several selected variables. These variables fall into
three general categories - (i) the geographical
accessibility of settlements, (ii) service and retail
provision in the settlements, and (iii) demographic
characteristics of the settlement. It is hypothesized that
these variables will significantly influence, and aid in
the explanation of, population change in North Central
Kansas
.
Four variables are selected to assess accessibility:
(i) distance to nearest place with a population greater
than 2,500, (ii) distance to nearest place with a
population greater than 25,000, (iii) distance to the
nearest U.S. highway, ( iv ) a site index, representing the
quality of road on which the settlement is located.
A service provision index is calculated, by measuring
the change in the businesses and services between 1970 and
1987. This enables consideration of the change of
functions that have occurred in a town.
The demographic variables considered are: (i) the
actual population size in 1970, (ii) the population size in
1987, (iii) the population change from 1970 to 1987, and
(iv) the average age of the population living in that
place.
13

Correlation coefficients are computed to assess the
degree of association between the variables, and most
importantly the degree of association between the
independent variables and the dependent variable population
change in the region 1970 to 1987. Then using a multiple
regression format, the overall explanatory nature of all of
the variables taken together and individually, is assessed.
This will provide some insight into what is influencing
population change in the region.
PLAN OF STUDY.
To summarize, this chapter has set forth the issue of
population change in rural settlements, and has stated the
purpose of the study in its theoretical and historical
context. The proceeding chapter will review some of the
relevant literature on population change and rural
settlements, in order to get a picture of what the present
study seeks to show in relation to previous work of others.
Chapter Three consists of a description and discussion of
the methodology and procedure employed in the study,
explaining the variables used in attempting to understand
the demographic patterns of the region. The results of the
analysis will be considered and discussed in chapter Four,
and chapter Five concludes the study by summarizing the
main points and making some brief comments about possible
14

directions for further research in this field
15

Chapter Two
LITERATURE REVIEW
The study of rural settlements is by no means a new
area of research. Indeed, small towns have been at the
center of academic interest and research for centuries
(Gomme 1890, Fletcher 1895, Evans 1915 etc.). However, in
recent years there has been evidence of an increase in
concern and study of rural settlements and their associated
forms and functions. This chapter is an attempt to review a
diversity of literature on the topic of rural settlements,
and to consider the development of this sub-discipline
within social science research.
Historical studies on rural settlements will be
discussed initially, and then in movement through time, the
development of various aspects of rural studies will be
traced, to include the development of theories to explain
certain patterns of settlement that are visible, and the
many empirically based studies that have attempted to test
these theories. The changing focus of rural studies will be
considered, and also how the literature has responded to
the settlement dynamics that have occurred over time.
Particular emphasis will be given to studies of population
16

change in rural areas.
HISTORICAL SETTING.
Early studies of rural settlements were made probably
because of the dominance of agriculture and the rural
economy at that time, and the rural settlement played an
important role within this system. Historically some
studies have tended to consider the settlement form and
physical morphology. The structure of a village is often
derived from a certain historical function that the village
was first developed to serve, be it agriculture, fishing,
or mining etc. Work by Dion (1934) on the relationship
between the evolving field system and rural settlements in
France, Lefevre's (1926) work on rural Belgium, and Seebohm
(1883) in his studies of rural English communities as a
part of the evolving agrarian system, are works
illustrative of this type of approach. The settlements were
thus seen as being either directly or indirectly,
responsive to the surrounding environment.
THEORETICAL DEVELOPMENTS.
From these works have been attempts to examine rural
settlements in relation to other settlements, and fit them
into a hierarchical structure, determined by size and
function. Studies that have considered the rural settlement
17

in its relation to other places include works by Demangeon
(1927), Hudson (1969), Christaller (1966) and Bylund
(1960). These studies, and many others attempt to analyze
the relative location of place in an empirical and
theoretical manner, to determine if there is a well defined
locational hierarchy of settlements on the landscape.
The work of Walter Christaller and August Losch have
provided a framework for much subsequent research where the
focus is a theoretical approach to the spatial
configuration of rural settlements. A classic study by
Berry and Garrison focuses on this issue of whether places
can be differentiated into classes intuitively identified
as hamlet, village, town, city, metropolis, (Berry and
Garrison, 1958). In this study a hierarchy of settlements
is identified, based on size of service area, size of
place, and economic functions provided by places. To a
large extent, the validity of Central Place theory as
suggested by Christaller in the 1920 's has been supported.
The issue of the spatial setting of settlements
illustrates the regional emphasis of geographic enquiry at
this time. However, while being regional in origin, albeit
with strong economic overtones, much of the subsequent
analysis that was based upon the early studies was
extremely methodological and quantitative in focus. This is
indicative of the particular time period, and its influence
18

on academic enquiry.
In geography, the core of both historical geography
and contemporary study, up to the mid 1950' s, was
unquestionably centered on the rural area, as a region
(Cloke, 1985). This was partly due to the dominance of
agriculture within the economic sector, and partly because
of the regional bias of geographical study. However, with
the demise of regionalism during the 1960 's in favor, first
of systematic study and then of "applied" and "relevant"
study, rural areas and small towns therein, began to be
studied in a more quantitative methodological manner, with
much of the emphasis placed on statistics and the seeking
of theories to explain the trends that were occurring
(Thomas, 1960; Bohrnstedt, 1969; Fuguitt, 1965b; Golledge
and Ruston, 1966).
THE URBAN INFLUENCE.
The relationship of small towns with larger cities or
the open country, and their demographic changes especially,
are topics that have pervaded much of geographic research.
However, different emphases have been placed on these
issues at different periods of time. For example, in the
1930' s, work on small towns seemed to be focused on
functional issues relating to the retail trade and services
which they were providing for their hinterlands (Hoffer,
19

1931, 1935, 1936; Lively, 1931). During the 1960's, one
major focus of study was population change, and the
associated influence of urban areas on the rural
settlements (Hart and Salisbury, 1965; Fuguitt , 1965;
Mattingly, 1963; Zelinsky, 1962, 1963). However, throughout
this time other aspects of the rural settlement were being
considered, though apparently with less intensity. Rural
settlements cannot be viewed in isolation, and must be seen
as part of the continuum of urban places. Rurality, by
nature, is relative and thus it is logical to study it in
relation to the whole settlement system, which is dominated
overwhelmingly by metropolitan areas. The very title of
Bunces' book, "Rural Settlements in an Urban World", (Bunce
1982), is indicative of the focus of research during the
last decade in particular. In this thorough and interesting
study of rural settlement, Bunce tackles the broad issue of
settlements at the lower end of the urban continuum. This
issue has been the focus of many other writings and
research represented in the work of Fielding (1982), Hart
et al. (1968), and Hugo and Smailes (1985).
INTERDISCIPLINARY RESEARCH.
Within the literature on small towns, there are two
major sub-fields of study that can be recognized: 1) The
relationship between economic functions of rural areas and
20

their population dynamics, and the geographic location of
that place, and 2) The social characteristics of the
village as a community. The latter focus has been pursued
predominantly by rural sociologists and political
scientists, while the geographer and economist have
traditionally concentrated on the economic activity and
location of the small town.
The work of Christaller in the 1920s pioneered the
study of trade center functions and the size and
configuration of settlements, representing the birth of
central place theory. This work has proved to be a
fundamental and classic work upon which many other studies
have been built. One of the early geographical studies on
this topic was Trewartha' s study of Wisconsin hamlets in
1943 (Trewartha, 1943). While fairly broad in scope, the
article had several sections dealing with the internal
spatial arrangement of buildings and the types of
commercial activities present in the hamlet. Trewartha
noted that particular types of businesses (gas stations,
general stores, and taverns, i.e. low order tertiary
economic activities) were characteristic of hamlets, and
that as a place increased in size, the number and types of
businesses increased.
In 1953, Brush published a study of small towns in
Wisconsin that was primarily concerned with the spatial
21

distribution of various functional categories (Brush,
1953). He, like Trewartha, noted the retail activity in
centers of various sizes. Based on the number of internal
economic functions he found in trade centers, he postulated
three levels of small places: hamlets, villages and towns.
He also noted that the population size of a place did not
provide an adequate criterion for classifying the economic
activity in small towns, although Brush did find a general
association between population size and number of economic
functions present in a place. Thomas, in a study of Iowa
villages empirically correlated small town population size
with the internal economic activity. He determined the
number of economic functions and functional units and
establishments for 42 settlements and compared this to the
population size of the settlements. He found a positive
relationship to exist between population size and these
variables (Thomas, 1960). Stafford (1963) conducted a
similar investigation of Illinois towns and compared his
findings to those of Thomas, and also to a study done by
Berry and Garrison in 1958. Stafford's results turned out
to be similar to those of earlier studies showing strong
positive relationships between population size and the
numbers of functions and functional units and
establishments
.
Johansen and Fuguitt (1973), analyzing the changing
22

retail patterns in Wisconsin villages, found that although
the demand for certain retail goods and services has
changed over time, the functional role of villages remained
essentially the same, i.e., to provide goods and services
to a surrounding hinterland. They also found that economic
changes were unrelated to changes in population, and in
conclusion stated that other factors such as nearness to
urban centers, had a greater impact on the population
change than did changing commercial activities.
Many studies of rural villages have been directed
towards isolating measurable variables associated with
population change in attempts to predict change. Such
things as settlement size, distance of settlements from a
larger urban center, economic conditions of the surrounding
area, manufacturing activity in the town, and occupational
structure, have been suggested and studied as being related
to village population change.
A study in 1957 by Hassinger, has been the basis upon
which much subsequent work has been done. Hassinger (1957)
reported that small places in proximity to larger cities
exhibited decline and that villages located farther from
urban centers showed mixed growth and decline. Hassinger
however, could only predict approximately 18% of the
population change using size and distance as the
independent variables.
23

Most of the studies cited above have viewed small
towns with the idea that they are all responsive to one set
of influences. In reality, this may not be the case, since
some village populations may be responding to one set of
influences, such as size and distance, while in other
towns, size and distance may be important, but the regional
economy may be the primary influence on its population
dynamics. As early as 1936, Clark and Roberts asserted that
regional economic conditions in eastern and western Kansas
outweighed the purely local factors in their effect on
small town population dynamics, (Clark and Roberts, 1936).
Hart and Salisbury (1965) have also done some interesting
analyses of mid-western villages using size and distance as
explanatory variables. However, they conclude that the
change of population phenomena in small towns is too
complex to accept one, or even several variables as "final"
in an explanation of the trends that are occurring.
These studies of commercial activities view the small
town as a functioning economic unit, rather than a place of
residence. A different approach to the internal structure
of villages has been taken by other researchers, mainly
sociologists, studying the rural settlement as a community,
or residential center. These studies have focused on the
social and demographic aspects of the community in an
attempt to better understand the operations and dynamism of
24

small town populations.
Rural sociologists have long been interested in rural
"communities" , and a considerable amount of work has been
done in this area. The agricultural village was generally
the center of these social areas, and while economic ties
were considered to be important, some writers proposed that
social identification was the primary function performed by
villages (Davies, 1943; Christiansen, 1957). These rural
community studies fostered the idea that social and
demographic characteristics may vary from one small town to
another, leading to research on the difference between
villages (e.g. Smith, 1941; Duncan and Reiss, 1956; Vidich
and Bensman , 1960 ; Barkeley, 1962).
A sociological study done by Mogey (1976) discusses
the demographic changes that have taken place in rural
communities in the recent decades, and note the racial and
ethnic make up of these places, concluding that the more
rural the area, the greater the population loss, and in
general the lower the average income of the residents of
that area. Such conclusions are by no means new, but tend
to reflect a phenomenon that has been detected by many
researchers from a multitude of disciplines.
A number of studies have compared village demographic
characteristics among different sizes of towns and among
growing, stable, and declining village populations. Fuguitt
25

and Field (1972) reported that larger places (population
greater than 750) had a higher percentage of non
agricultural laborers and generally higher socio-economic
status than smaller places. They also found that growing
places had younger populations, higher average incomes, and
a higher percentage of people in manufacturing occupations.
In another study by Fuguitt (1972), he found that there
were more old people living in smaller and declining towns.
RURAL RENAISSANCE ?
The role and function of many small towns changed
significantly during the decades of the 1960 's and 1970' s,
resulting in an economic and demographic rejuvenation of
rural settlements. This was especially so in villages
within commuting distance to a larger urban area. The
theme of counter-urbanisation, is one that has gained much
attention, especially from geographers. There is a definite
trend in the more recent literature to consider this so
called "population turnaround" , a process whereby small
towns, which had in previous decades shown a population
decrease, are now exhibiting a population increase or
revival, especially those small places located relatively
close to an urban area (Johansen and Fuguitt, 1979, 1984;
Browne and Hadwiger, 1982).
This dramatic demographic turnaround inspired many
26

studies on the influence of metropolitan areas on its rural
hinterland, and the associated rural communities thereof.
In relation to this population turnaround, Johansen and
Fuguitt (1984) state that even in settlements with the most
deserted main street one often finds nearly complete
occupancy of houses, albeit with fewer and perhaps older
people in each, than before. Indeed, as Robert and Randolf
(1983) have stated, "...the last vestiges of rural
depopulation seems now to be disappearing" . This statement
was made with regards to the counter-urbanization trends
that were occurring in England at the time, but are also
true of the rural situation in the United States. Several
works by Hart, clearly show how there has indeed been quite
an unusually rapid growth in small towns, his work notably
focusing on the region of the Great Plains in the United
States (Hart and Salisbury 1965; Hart, Salisbury, and
Everett 1968; Hart 1986). There has been a significant
amount of research done on this topic outside of the United
States, notably in Britain about these changing rural
demographic trends (Blacksell and Gilg, 1981; Cloke, 1980,
1985; Lewis, 1979) and in Australia and New Zealand,
(Smailes and Hugo, 1985; Hugo and Smailes, 1985; Le Heron
and Roche, 1985)
.
Increased transportation and automobile ownership has
been most influential in changing the role and functions of
27

villages and small towns. Work done by Schwarzweller
(1979) is indicative of this recently occurring demographic
trend. The more recent work done by Cloke (1985) also
illustrates the increasing trend of rural regeneration, as
the cumulative result of population redistribution trends
today. Much work has been done on small towns and villages
changing function to becoming dormitory settlements, and
how this is often associated with a decline in the retail
and service functions, and increase of residential
functions, especially by British geographers and planners.
Many writers have recognized the change of function of
small rural places, and some scholars have attempted to
make predictions on the new roles and the future of these
places. In a study of small towns in Nebraska, Anderson and
Miller (1953) suggested that while economic functions would
decline, the small town would remain important for
"community" functions. Studies on the continued viability
of the more remote small towns have come to varied
conclusions, some optimistic, and some pessimistic. The
number of optimistic studies are few. Brunner (1936) has
concluded that the number and sizes of villages were
increasing, and would continue to do so in the future.
Smith (1942) has suggested that rural villages would
survive as "community nuclei".
Daniels and Lapping (1987) have proposed a triage
28

approach to this issue of small town survival in the
Midwest. They suggest that the very smallest of
settlements will eventually disappear as a result of
continued population loss. The larger rural settlements are
most likely to survive, and maintain a fairly healthy
existence because of their larger and more diverse resource
base. The settlements in the middle group are those that
require the most aid and planning in order to maintain
buoyancy. These places do have some potential for growth,
but this needs to be developed to enable them to withstand
the negative economic competition that is causing their
decline
.
Many other studies have exhibited pessimistic
conclusions on the revival of the more remote rural
settlements. Stewart (1958) has stated that due to the
reduced economic base of the smaller central places on the
lower end of the Christaller central place hierarchy,
"...eventually the lowest order practically disappears."
This is certainly the situation that is evident in both the
United States and the United Kingdom, where many service
villages and small towns have lost their economic functions
and services, and remain, at best, only as a cluster of
residential units. Other authors who see little future for
the rural village include, Barkely, 1962; Nesmith, 1963;
Clawson, 1966, 1972; Pickersgill, 1961; and others. A
29

number of other observers have suggested that small towns
are declining, and in doing so, are simply becoming
unattractive places to live. Rikkinen summarizes this
point of view as follows:
"Although the small villages have kept a
portion of their primacy functions, their
residential attractiveness has decreased to such
a point that their population is decreasing more
rapidly than their surrounding area.
"
(Rikkenen, 1968 pp. 324-5)
Rural areas in all parts of the world face a somewhat
uncertain future. In developed areas, the traditional
wisdom of depopulation has been swept away as counter
urbanization trends have become apparent. There is
certainly, as yet, no broad consensus as to what post
industrial society has in store for rural areas, either
socio-economically for the communities concerned, or
spatially in terms of their future pattern on the
landscape
.
There is an increasing trend for rural studies to take
a more multi-disciplinary approach than has previously been
the case. Pacione (1984) recognizes rural geography as a
multifaceted areas of study, which interrelates with a host
of other disciplines and sub-disciplines, including
30

economics, sociology, anthropology, politics, and planning.
A further indication of the growth of multi-disciplinary
studies of rural areas is found in the stated aims of the
recent mainstream texts written within specific
disciplines. A revealing example is afforded by Carlson et
al ' s . (1981) text on American rural society which is firmly
sociological in parentage, yet seeks to widen the debate to
include the dynamics of the environmental and economic
setting within the rural context. Johansen and Fuguitt
(1984) provide another example of this inter-disciplinary
approach in their book entitled "The Changing Rural
Village in America". This tackles a broad scope of topics,
including the historical setting, the social
characteristics of the villages and their community
structure, the economic functions performed and associated
with the place, and the associated demographic trends, and
concludes by looking at the future of the American village.
The future of rural settlements is indeed difficult to
determine, and much of it depends on the prevailing
economic and social trends of the time.
SUMMARY AND CONCLUSIONS.
From this brief review of some of the more salient
literature on rural settlements, it is clear that this is
an area of study that has been, and indeed still is, of
31

considerable interest to scholars in several disciplines.
The small town provides an interesting unit of study, and
is particularly interesting at the present time because of
the demographic and social transition that is occurring
within it.
In summary, it is evident from this review that there
are certain factors and conditions that have a potential
influence on population change in rural areas. The major
influences that have been studied can be grouped into three
main areas as follows:
(i) Those studies relating to the rural settlement in its
regional context dealing with the nature of its hinterland
and the regional economy in general, settlement
accessibility and distance from other places;
(ii) Those dealing with the physical and economic structure
of the settlement specifying such things as the function of
the place, its retail and service provision, and its
commercial activity; and,
(iii) Those dealing with the demographic characteristic of
a place, its population size, population change, the age
structure of the population and the community of rural
settlements
.
This then provides a framework for the present study
which considers various factors within these three
categories, and their independent and cummulative influence
32

on population change in North Central Kansas
33

Chapter Three
METHODOLOGY
This chapter provides an explanation of the
methodology and procedure used to analyze population
change. Several variables have been identified as being
influential to population change in rural settlements, and
these will be explained in more detail here. Using
correlation and step-wise multiple regression analysis, the
variables are considered in their relative influence on
each other, and the dependent variable, population change.
POPULATION CHANGE.
The study focuses on incorporated places in North
Central Kansas, a region that consists of ten counties,
with a total population of 70,626 (U.S. Census of
Population 1980). Fifty six settlements, with a total
population of 39,550 are used in the study. These are shown
in figures 3.1 and 3.2. Some cities were omitted due to
the unavailability of necessary data. This region of North
Central Kansas was chosen because it appears to be
experiencing somewhat different demographic trends than
other areas of Kansas. This is shown in figure 3.3 which
34

Figure 3.1
SETTLEMENTS IN THE NORTH CENTRAL KANSAS STUDY AREA.
Kensington* •Athol
WebberBurr Oak *
Esbon Formoso „ „ , . m_ « Court Id."
Mankato Scandl
Narka • Mahaska
Hanover *
• I
Washington |
Republic -Munden
„ , , j , lladdamBellevile _ . •
Cuba
• GaylordJewell
_ RandalliJamestown
. Alton
Natoma
Eit'y" Glen Elder
Scottsville Conco
'Osborne• Beloit
Morrowyile , ,'
Creenleaf
« Linn •
•paln,erBarneS
i
rdia& > Clifton
|
I
Tipton
_llunter
Simpson •
• #„, MiltonvalelClasco •
• Delphos
iBarnard
1
i
Lincoln•L "''"
Bennington•Sylvan Grove Beverly „ , .
•Culver
i Wilson
Ellsworth
I
wo rinKnnapol is I
• Holyrood• Lorra ine j
35

Figure 3 ' 2
POPULATION OF SETTLEMENTS IN NORTH CENTRAL KANSAS, 1987.
•
)• •
I t
J
POPULATION OF SETTLEMENTS
r
less than 500
500 - 1,000
1,001 - 2,500
more tli.nn 2,500
i I i i
S S 10
36

Figure 3.3
Percentage population change in Kansas, 1890-1980.
Growth
4J
00Crs
u
co
111
60(0
uc0)
uu<u
p-
»
T*'
>
Decline
- 2
- 3
- 4
- t
- e
- 7
- e
- o
oo o o
i the State of Kansas
North Central Kansas
( source: U.S. Census of Population, 1890-1980)
37

compares the population change that has occurred in the
State of Kansas as a whole, with the trends that have
occurred in North Central Kansas. 1 - The settlements in
North Central Kansas appear to be declining more rapidly
than other regions. Small towns are also more prevalent in
North Central Kansas than in other places, making the
survival of small towns an important and relevant issue
here
.
There are no major urban centers in the region, and
also because of the high number of small family farms,
the population has fallen rather dramatically (Socolofsky &
Self, 1972). The agricultural systems of the region are
diversified, unlike other regions of the state that tend to
be dominated by a particular type of farming, such as
irrigated cropping in the northwest, or beef production in
the southwest of Kansas
.
HISTORICAL OVERVIEW.
An examination of the population change in settlements
from the late 19th century until the present provides an
overall view of the demographic trends that have occurred
in the region as a whole. The population grew in the later
part of the 19th century and early 20th century, this being
the major period of population growth for the region, when
places were still gaining new settlers, and the state as a
38

whole was growing. Since then, however, the population has
declined fairly rapidly, with the exception of the decade
1970-80, where the rate of decline decreased considerably.
This decade of reduced rates of population decline
coincides with the well documented "population turnaround"
or "rural renaissance" , that has been taking place in many
areas of the Country (Johansen and Fuguitt 1979, 1984).
The trend in North Central Kansas, however, appears to
have reverted back to one of more rapid decline during the
eighties. However, census data for the eighties is not yet
available, and the 1987 data used is from the Directory of
Kansas Public Officials. 2 - These figures are deemed to be
fairly accurate by the state officials and others, as they
are updated annually by local city officials and the same
criteria for making the estimates are used in every place.
Their comparability, therefore, with census data is good,
however, it must be noted that they are not official U.S.
Census figures, and as such must be treated with caution,
making it difficult to make any definite statements about
population trends for the eighties. The data does however,
provide a good estimate of the way population has changed
over the first three quarters of the decade, and it is for
this reason that it is used.
In order to see if the rate of population growth or
decline over time is at all related to settlement size,
39

the settlements were divided up into three size categories,
those less than 500, those with populations between 500 and
1000, and those with populations larger than 1,000. This
information is graphed with percentage population change
per ten years, and is displayed in figure 3.4 and in table
3.1. From these graphs it is evident that there is some
variation in demographic trends according to the size of
the settlement. All sizes of settlements grew in the later
part of the 19th century and the beginning of the 20th
century, and thereafter experienced significant decline.
It is interesting to note that the smallest places have
declined most dramatically, especially during the period
1910-20 and 1940-60. Small towns do, however, show a
considerably reduced rate of decline between 1960 and 1980,
more of a trend reversal than in the larger size categories
of settlements. All sizes of settlements do appear to have
declined at roughly similar rates since 1980. From these
initial considerations therefore, it is evident that the
size of settlement may have a bearing on the rate of growth
or decline of that place.
RECENT POPULATION CHANGE.
In order to consider in more detail what is actually
influencing the more recent population change in the
region, the period 1970 to 1987 is focused on. The
40

Figure 3.4
Average percentage population change, 1890-1987, in cities categorized by size.
Growth
00cn)
.cu
3-Oaoi
00<u
uc01
ou01
c-
Decline
25
Ik
22
20
18
16
14
12
10
-4
-6
-10
-12"
Sct 1 1 ciwiit SI zc
less than 500
•1500 - 1,000
• • • • greater than 1,000
(source: U.S. Census of Population)
• *
• • • '-.
-• ••
• * m
1 o 1 o 1 o 1 o 1 Oo o o —
«
O <N O r"> O -5ON ON o ON —1 ON eg on r-i onCO -« 0> -* ON —
1
ON — ON —
I © I oO m O iO>J ffl */"N ONON —
.
ON —
•
I O I O I r-*
O r- O CO O CO*£> On r** on CO OnON — O* •—
•
ON -^
41

Table 3.1
Population change in North Central Kansas: 1890-1987 by city size.
SIZE OF CITY
TIME less than 500 500- 1 OOO greater than lOOO
1890-1900 13 25 2
1900-1910 319 349 £29
1910-1920 -69 88 10
1920-1930 -69 13 50
1930-1940 -72 23 26
1940-1950 -281 32 22
1950-1960 -381 22 -12
1960-1970 -365 -84 -23
1970-1980 -123 -17 15.
1980-1987 -209 -35 -43
£2
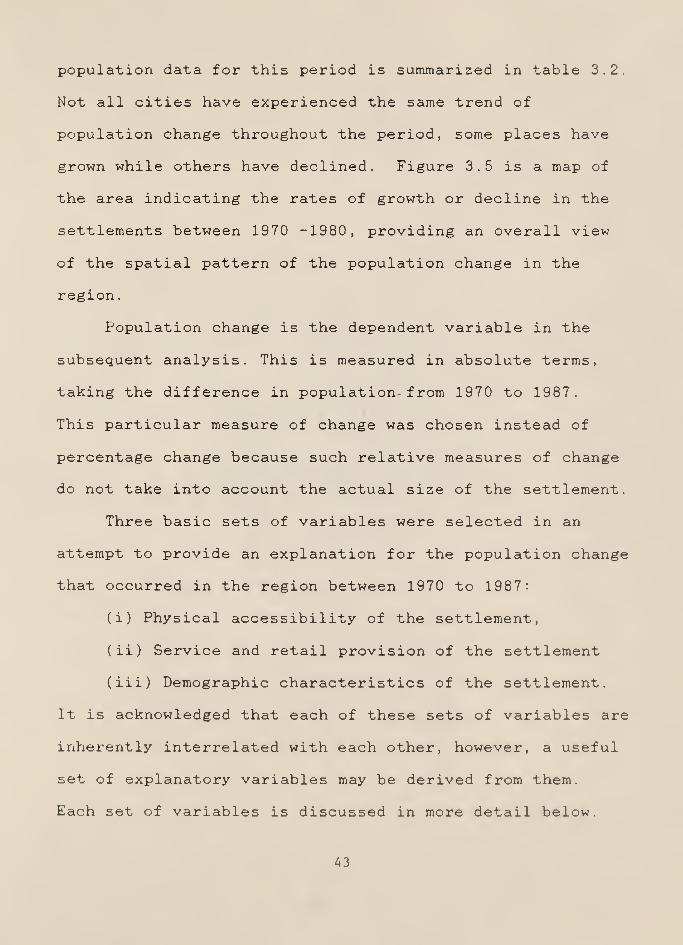
population data for this period is summarised in table 3.2.
Not all cities have experienced the same trend of
population change throughout the period, some places have
grown while others have declined. Figure 3.5 is a map of
the area indicating the rates of growth or decline in the
settlements between 1970 -1980, providing an overall view
of the spatial pattern of the population change in the
region
.
Population change is the dependent variable in the
subsequent analysis. This is measured in absolute terms,
taking the difference in population^ f rom 1970 to 1987.
This particular measure of change was chosen instead of
percentage change because such relative measures of change
do not take into account the actual size of the settlement.
Three basic sets of variables were selected in an
attempt to provide an explanation for the population change
that occurred in the region between 1970 to 1987:
(i) Physical accessibility of the settlement,
(ii) Service and retail provision of the settlement
(iii) Demographic characteristics of the settlement.
It is acknowledged that each of these sets of variables are
inherently interrelated with each other, however, a useful
set of explanatory variables may be derived from them.
Each set of variables is discussed in more detail below.
43

CO•H-P
•H>
Q
T5C«-P
CO r»-
CD 00rH O
c(0
^ en
t~ CD
co >*
Cto
tH cr> 1
CM c-CO c- 1
c-
1
CO1
1
1
CO
1
<* ir>
C fi
•H •H-P +3(U <0
1—1 i—
1
3 304 0.
Pi 0.
O c—r- CO05 en
44

Figure 3.5
POPULATION CHANGE 1970-1987, IN NORTH CENTRAL KANSAS.
Oo
o o ° O o<^QQW
o O o o
O. no
o
o
oo
o
oi
°i
o O I
_.JONO Ol I
o
1
o I
o o o .2 I
I
Lm.
i—i—i i
6 b 10
GROWTH
more tlian 10 X •less Chan 10 Z •
DECLINE
more than 10 X Oless than 10 X o
45

Accessibility: It is assumed that the less accessible a
place is, the more likely it will be declining, due to long
distances that need to be travelled in order to gain even
basic necessities, such as groceries or education. Also, as
accessibility decreases it is less likely that population
will come to that place to purchase its retail goods or
services. On the other hand, if a place is highly
accessible, this may be a benefit as it may be able to
attract passing trade, and thus increase the functional
status of the place, and hence have more ability to
maintain its population. In a study of the impact of
location on population in Kansas, Dotzauer (1980) has
pointed out that accessibility of a place is important in
explaining the population change that occurs in that place.
Four separate measures are used to determine the
importance of accessibility in explaining the population
change in settlements. The first of these measures is
distance to the nearest U.S. Highway, measured in actual
road mileage. Cities that are located on, or near to, a
major highway are more accessible than those places located
far away from a major transport artery. Being accessible to
a major transport artery is thought to be important for
several reasons, (i) reduced travel time to other places
allowing people to commute (ii) high volume of passing
traffic, generating employment in such things as gas
46

stations, eating places, or motel services etc. (iii) good
road access enabling large trucks to bring goods to the
settlement. These are just a few examples of why increased
highway accessibility may reduce population decline, or
encourage growth in the settlement.
A second measure of accessibility is distance,
measured in road miles, to the nearest place with a
population of 2,500 or greater. Cities with a population of
2,500 or above are the smallest places that the U.S. census
recognizes as being "urban". Nearness to such a place may
either have a positive or negative effect on surrounding
smaller places. On the one hand, being close to a city with
a population of 2,500 or above could be beneficial in so
far as goods and services are available within commuting
distance, thus enabling the smaller settlement to remain
viable. On the other hand, being close to such a place
could prove to be negative competition and encourage
population to leave the smaller settlement and migrate to
nearby larger place, where services such as education,
medical, retail and entertainment are more available.
Hassinger (1957) found that bigger and smaller centers
had different effects on village population change. Thus to
compare the effects of different sized settlements on
population change in North Central Kansas, a third
accessibility index was developed, - distance to the
47

nearest urban center of population 25,000 or greater.
Places located close to a large urban area may be more
inclined to grow in population because these villages are
used as commuter settlements, where people can enjoy the
benefits of rural life, and yet at the same time be close
enough to the urban area to enjoy some aspects of urban
life, such as employment, shopping, or business. Thus it is
expected that the closer a place is to a large urban area,
the more likely it will be to grow.
A final accessibility index considered is a site
variable, measured on the quality of the road that
immediately leads to the settlement, a gravel road being
assigned a quality score of 1 , a state highway, or general
paved road a score of 2, and a U.S. highway a score of 3.
The logic behind this variable being that lower the quality
of road, the more inaccessible, and thus more susceptible
to decline.
A summary of the expected results of these
accessibility variables could be, the higher the
accessibility measures, i.e. the more remote the
settlement, the more likely it is to declining.
Service and Retail Provision: The level of service and
retail provision in a place may determine the ability of
that settlement to maintain its population, those places
48

with a high level of service and retail provision will not
only provide more services for its resident population, but
also more employment opportunities.
Information on service and retail provision was
gathered for all the settlements in the study area for 1970
and 1987, and the change over time noted. The data was
gathered using telephone directory listings, and then
categorized into certain types of business and service
activity, based upon those determined by the Kansas
department of Labor and Economic Division. These
functional categories are listed in table 3.3.
Each category of business activity is assigned a point
score determined by the frequency of that activity in 1970,
the most frequent categories being assigned a score of one,
up to the least frequent group of activities being given a
score of five. These point scores were assigned according
to natural breaks or grouping of the data, each group with
a certain point score are more clustered with itself than
with any other group. The specific frequencies and point
scores assigned are summarized in table 3.4.
A service index can thus be calculated for every
settlement for 1970 and 1987, on the basis of the number
and type of services or business activities in that place.
For example, if a city had two gas stations, point score 1,
and one restaurant, point score 2, and a liquor store,
49

enden2:CE
dcr(-2:LUU
crO
oen
ocraLUu>crLUen
a2:a
aHLUCK
LLaenLU•—
1
crDCOLUH-cru
.2:roo
01 1—
-QZ•BOt-LL
lA-pC0j
.CWh-it CO
n -1
IB
4->
in
01
10
-Po
in
ai
S-
oencu
-PrD
UQJ
CJ
>S-
in
XIC13
13
•pQJ
cr
^ oj oj oj oj oj ro ro ro ro <r -a- < -r -r in in
co o a) in co n <rin ui co cr.<r < ojro iij ~-< -n -r-t -rt -^
co uO O OJcor-io-^
r-~ ro o u~3 r- 1^-0in cr* co ro -4- —to
COuO U) O en oj oj U3C0-3-O CTi u0 u0 -4- -* CO in—1 OJ in < ro ro cu OCn coco UD uO kO UJ UO OJ OJ<i-ro HHHrHH ^-i
en*«• Ceu -hP4J13 nj
-1 J QJ
toJZLU
06^*li m0) Ccr -^
Ul S crS- E C0) .—< 3 -r-l
—
(
Urt+) in13 c au 01
QJ •<H t0 CJ
"OOl-P IB
oO Ul Oj C •rH in c0i~ in 1—< «—
1
01 -pi- a cj OJ ai a ^ ih C -n#-i •»« >, a CJ a. to ^j t0+>13 > +> ai ns •*H IB -P •rtjr iBam i-M C r—
1
> Ol ^H CJ 01
eu 01 QJ >-rt at ^ in j. ~ $- i.
5. a uirtTJ 01 Oj Oj CJ OJ CJ•11 4» H en in i. CJ >, ID £ 01
> «-« ej •** C 3'H i Dl M- i-±> s. IB 10 3 •<H jr P>OC 1—
1
_» eu en JD P-P •rn x- in-^ 4« U 0613 in cu in to f-H c oj ui n •rt S- Oj
_i in^v OJ m S. Ul QJ <0 XI 0J^> S-. Dlr-i OJ c 01 3 CJ S- QJ i- C C QJ
C rc »a Z 0\X i*--* CJ-P i. 01 Qj-Prl i.
i. T-i •<-! 4-> IB IB u en s in j. OJ
H 3 >-« w-p c ~v a c oj C 3 5-+>•P+> rc 3 a 13 >-i \ <—
<
•V\r< QJ -P c tn
IB 1—
i
•hU 3 J. f—
«
•»• •—' 13 cn>,iB i- a +>-p 3 O S. Zj U jr+> 10 in i. +> +1 '' it in j.
tn (J C^-P 13 u Oj H i. OJ •ri 01 t. 3:««-•-• ro .—r LTi 4-> • *-< in (j m^ .* ,h Qj XI 3 a\z
in S. c to c in xi 3 3 exo £ S-^ S- c 3 cru ai H £ O 01 01 OXI D_C to u c ii u S.-Henac u-cnucr e ILua3 cq>luxz: Q_l
50

Table 3.4POINT SCORES ASSIGNED ON THE BASIS OF FREQUENCY
AssignedFrequency point score
< 50 5
50-74 475-120 3
121-200 2
> 200 1
51 ,
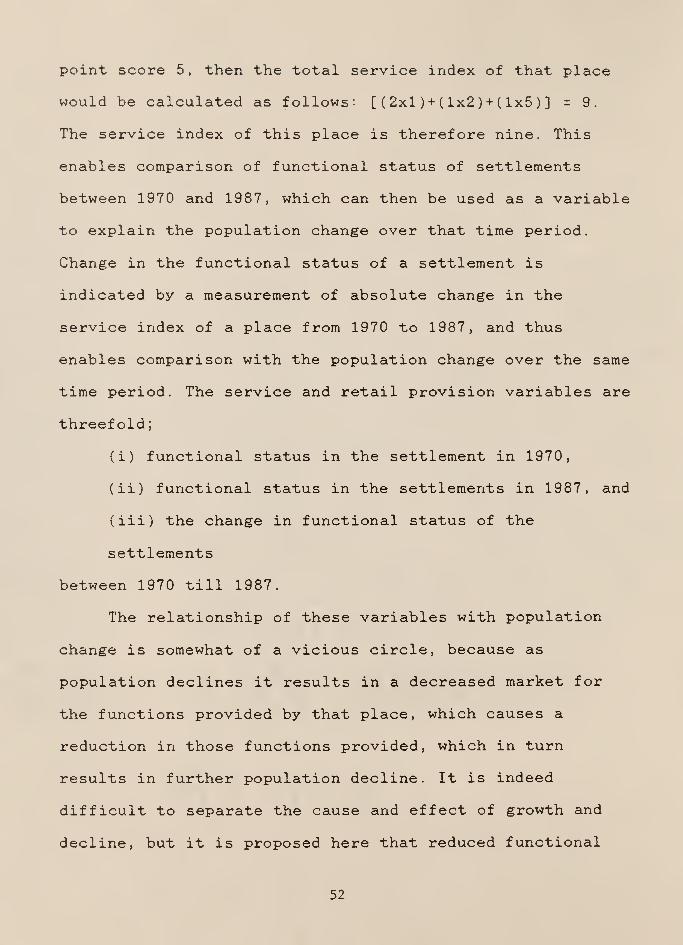
point score 5, then the total service index of that place
would be calculated as follows: [ ( 2x1 ) + ( 1x2 ) + ( 1x5 ) ] = 9.
The service index of this place is therefore nine. This
enables comparison of functional status of settlements
between 1970 and 1987, which can then be used as a variable
to explain the population change over that time period.
Change in the functional status of a settlement is
indicated by a measurement of absolute change in the
service index of a place from 1970 to 1987, and thus
enables comparison with the population change over the same
time period. The service and retail provision variables are
threefold;
(i) functional status in the settlement in 1970,
(ii) functional status in the settlements in 1987, and
(iii) the change in functional status of the
settlements
between 1970 till 1987.
The relationship of these variables with population
change is somewhat of a vicious circle, because as
population declines it results in a decreased market for
the functions provided by that place, which causes a
reduction in those functions provided, which in turn
results in further population decline. It is indeed
difficult to separate the cause and effect of growth and
decline, but it is proposed here that reduced functional
52

status is related to population decline in a settlement.
Demographic VariablesjAs noted earlier, population change
does vary for settlements of different sizes. Looking at
the historical trends of population change in the region,
small settlements do appear to be more volatile than larger
places. Certainly, because of the small resource base that
exists in little towns, they are more vulnerable, or
susceptible to change. A larger place would be assumed to
have a stronger and more diverse economic resource base,
and therefore be less prone to rapid decline. Thus two size
variables are incorporated into the analysis, (i)
population size of settlements in 1970, and (ii) population
size of settlement in 1987.
The actual age composition of the population may also
play a role in influencing the population change of that
place. Previous research has shown that age structure is an
important factor in explaining population change of a
place, (Groop 1970, Johansen and Fuguitt 1984). Again, this
variable has somewhat of a cause and effect influence on
population change. Young people have the highest propensity
to migrate, and thus leaving behind a community that
becomes increasingly older, and hence increasing the rate
of decline in the place. Mean age of settlement population
was selected as the variable to measure these influences.
53
The mean age was calculated from the 1980 census File Tape
summaries by multiplying the number of people in each
category by the middle value of the category, summing and
dividing the results by the total number of population in
that settlement in 1980. The 1980 census information is
used because it is the most recent data available on the
age structure of the settlements. It is assumed that mean
age and population change are negatively related, places
with older populations are assumed to be growing less than
those with a young population.
SUMMARY OF SELECTED VARIABLES.
In an attempt to seek explanation for the population
change that has occurred in North Central Kansas between
1970 and 1987, ten independent variables are selected as
being important in influencing this population change.
These are summarized below.
Accessibility :
(i) Distance, in actual road miles to the nearest U.S.
Highway from each settlement.
(ii) Distance, in actual road miles to the nearest city
with a population of 2,500 or above.
(iii) Distance in actual road miles to the nearest city
with population of 25,000 or above,
(iv) Site factor
54

Functional status
:
(v) Functional status of the settlement in 1970.
(vi) Functional status of the settlement in 1987.
(vii) Change in functional status of settlement from 1970
to 1987.
Demographic
:
(viii) Population size of settlement in 1970.
(ix) Population size of settlement in 1987.
(x) Mean age of the population in the settlement
The degree of correlation between each of these
variables and the dependent variable, population change, is
analyzed. A correlation coefficient matrix is also be
produced to show the interrelationship between the
independent variables. In order to gain an understanding
of each factor's relative influence on the dependent
variable, and to find out how much of the change in the
dependent variable can be explained by the cummulative
effect of all of these independent variables, a stepwise
multiple regression analysis is performed. The form of the
equation, coefficient of determination, Beta weights and
residuals are discussed.
The results of these analysis are noted and discused
in the following chapter.
55

Foot-notes
:
1 . Population change is calculated for every decade from1890, the earliest year that complete census data wasavailable, to the present, with the most recent year'spopulation being calculated as a percentage of the earlieryears population.
2. The Directory of Kansas Public Officials is apublication produced every two years for the League ofKansas Municipalities, by Kansas Government Journal inTopeka, Kansas.
56

Chapter Four
RESULTS.
This chapter is a presentation and discussion of
results derived from the analysis described in the
previous chapter. The degree of correlation between each of
the ten independent variables, and the dependent variable,
population change 1970-1987 is computed, and the degree of
inter-correlation between each of the variables noted. A
summary of the variables is provided in Table 4.1.
RELATIONSHIP OF SELECTED VARIABLES WITH THE DEPENDENT
VARIABLE.
One of the aims of this thesis is to discover what
percentage of the population change between 1970 and 1987
in North Central Kansas can be explained using the
variables listed above. Table 4.2 shows the individual
correlations between population change and each of the
other variables. The first column of table 4.2 is the most
important because it displays the correlation of the
dependent variable, population change, with the other ten
independent variables. None of the selected variables show
a high degree of correlation with the dependent variable.
57

en
aa
a
1ZO
CU 1-1
. r-
QJ LU^ a:
in aK U
LUCDa
xuenaa
CO
en
o>en
uua
wuu(X
cuua
uu
coaoa
oQ.aa
xua
-* <a- co cu*-4 ^H O *-<
o» h n co ow ^ h o oo o
I I
o o
to U> h oM O (VI CU• • t •
CU ?0
df ? ? ° ?
* *
8 8• •
?°
* * * *
• • • I
o o © o
o o o o ~
4c *CU ro CU O CO© « ro o o• • I • •
o o o ** ©
en cn o cu ro•t O1* O f) H
• • • •
o o -« o o
*• *
9*COen
* * *Q UQ CO COro ro in -«
oo
*CU
T © o ??°? ~H O ? o1
ino
•4- in h ffi o ocu — o o
CO 0JO 8
oI
4c
2i*
o o o ©
So ro oro -* o
• • • •
©
* 4c
cu «•• •
o "
CO -Ho ro
?4c
ro
CO"
4c *
?°*
$8?-
4<
© »h o ro*WOh* • • •
* Xro o cu ro
•H o o o oi T i
4c 4c
O CO CO o cuo in in cu -«
??• • • • •
o o ©
4> 4c
cn U3 in -" CO•h ro ro cu oO © Q O O??
4c 4c
h Q Q U> 4cu ro ro © ^
O -i O ©
4c 4c *
©
* 4c 4c 4c
S ro 5 Jn
t * •" o
© © © ©
o o o © o
4c 4c *Ul CO CO CD h<h CO Cn ro *h
I • • • •
o o o © oi T i
4c 4c 4c
•4" CO CO gj O•h cn cn ro »h
• « • 1
© © © o ©I I
g$+ 4c
-?
* *CO CO ffi ©ro o cu '-c
©'©doooodoin ^ cn o eno « ro cu o
x © n xejr^co-HCuro>a-©r-ejaaauuuuMitDiuffloouuuu>>oat3cxaacxczaaenencrcz
ai
IQJ
T>•H«4-
cou
incn
cat
s-
m
•p
in
c
•H4*m
0)
s.
s.
u
ai
in
o
in
ai
-p
QJ
59
> 1
© 1
T3
lOtHlDlocoloc\jcocolo*-i
coaJo^aoHt-cof-nooU MHHr^lfiO^O<C —t
^—1 lH i—1 >—
1
T3 i—1 .—
t
- dCQ 4l-H pCQ CQ>*J<Z C< (0 CDHC\]HCD03t>.(£)NCnt-
a? CM f- CO C^ 1 *tf O ^* COw s c- e>- 1
oz<ado
iH 05z O --< O CM c- o 1
o tlO LO O COOW'tWNOJOHH a CM-TCOT-lt-COCMC^COcncOE"« (0 1 1 1 1 1 1 1 1 1 1 1
< OS oOH^nootoi'^nJ rH CO ^ LO CO COO 1 >* 1
Pl, 1 1
O 1
PL. 1
1
CU CQ 1
o < H OC o c- 33fe CQ O HO0(TifO^UN<D OZ ,fl OOOOC-COCQO-iCUWPLi 1
Q < s oooo>>mooopQW bd >» <<<<CQCQ<PuPl,<<E- CQO JW <J PiW E-00 ZW o
03 CJ >>o ow <0 o o c-J 3D "X LO lO O C- CDPQ E- ^3 CM CO f- CO <D 1
< 05 ttf O) CD tlfl OHI O -HA /\t-I*-ICOC- t-Pi z H <0 f- CO Ol< • >» >» m tn ,c a> en ^> z CQ -P -P 3 3 U *-h *-)
(—1 . -H u -H +J +J ©Cn £>000<0<C^-)GC tlO
r-t O c>- -P -p -p <c o o c00 <D ooooto«nc-H-H0)(0
<r >« OJ r—
t
P .p <C P P" P tJOjS
OS »H Xi Sh • tH (0 io H o< i flj ton in +j +j +j hhhSo -H <D<D<U<DOOU33C •
,£) 2 t- M HH+JH C CC flftlO ft I
(IJD O) <0 -H -H -H -H 3 3 3 4) 1HW^ > z; z: cq 2: u, u> fe pl, a. 2: pl, i
58

However, several of "the variables do show significant
associations with the dependent variable at a 95 percent
level of confidence, specifically POP70 , POP87, ACC2, SV70,
and SV87. Population size in 1970 shows the strongest
relationship with population change, with a (correlation
coefficient -0.46). From this it seems evident that the
absolute growth and decline in a place is somewhat
determined by its size, larger places losing more people
than smaller places, which is what would be expected since
the change is measured in absolute terms.
The significant negative correlations between
population change and the functional status, or service and
retail provision in the settlements are worth noting.
Service provision in 1970 has a correlation coefficient of
-0.41 with population change 1970-1987, and 1987 service
provision is similarly correlated with a coefficient of -
0.39 when compared with population change. This seems to
indicate that places with a high level of service provision
are inclined to be growing less, or indeed declining more
rapidly, than those places with a low level of service
provision. This relationship may be such because the
strong relationship between size of settlement and the
number of services provided has not been controlled.
However, this association between service provision and
population change is significant, as it shows that the two
60

variables are related. Larger places have a higher
functional status and thus have more capacity to lose
service and retail establishments than do smaller places,
with a lower functional status.
The absolute service change 1970-1987 reveals a rather
weak, insignificant, positive correlation with population
change (correlation coefficient 0.20). This is surprising
considering that actual population size, and actual service
provision are so highly correlated. This would seem to
indicate that different processes are causing growth or
decline of services and growth or decline in population.
Settlements that are growing in population are not
necessarily those that are increasing in their service
provision, and vice verse. This is unexpected as it would
be assumed that as a population declines, for instance, so
the level of retail and service provision in that place
would decline.
The only accessibility index that showed a significant
correlation with population change is ACC2 , the distance
from each settlement to the nearest city of 2,500 or more
population, although even this correlation is fairly weak
(correlation coefficient 0.29). However, this does show
that location relative to other places is influential in
determining population change of a settlement. The more
isolated a place is, i.e. the further away it is from a
61

larger place, the more inclined it is to be declining.
Because population change is measured in absolute
terms, the actual size of a place influences the population
change that occurs. It is therefore difficult to isolate
exactly what is causing or influencing the population
"change" more so than the actual size of the settlement,
without using a multi-variate approach.
The variable AGE, the mean age of the settlement
population, surprisingly showed a very low, insignificant
correlation with the dependent variable (correlation
coefficient -0.09). This seems to indicate that there is
very little relationship between the average age of a
population, and the size of that place, its rate of growth
or decline, the services provided in that place, or its
relative isolation or accessibility. This is contradictory
to what was expected, and also disagrees with what has been
found by other studies (e.g. Groop 1976).
CORRELATIONS AMONG INDEPENDENT VARIABLES.
From the correlation matrix shown in table 4.2 it
is evident that other variables, apart from the dependent
variable, reveal some significant associations that are
worth noting, and may aid in the overall explanation of
what is influencing population change in rural areas. The
variables that maintain the strongest associations with the
62

other selected variables is population size. Population
size in 1970 is very highly correlated with the population
size in 1987 (correlation coefficient 0.99), thus
indicating that the size of a place in 1970 is a good
predictor of its relative size in 1987. The relative size
differences among the settlements hardly changed between
1970 and 1987 indicating that there has been little change
in the actual hierarchy of settlements in the region, the
smallest places in 1970, remaining the smallest places in
1987. Thus, the size of a place in 1970 would appear to be
most crucial in determining its size in 1987.
The service provision in a place is also strongly
related to the size of place, both in 1970 and in 1987.
This indicates a rather expected relationship that larger
places have higher service provision than smaller places,
showing that the service provision of a place is a direct
relationship to the population of that place. The fact that
service provision in 1970 is strongly correlated with
service provision in 1987 (correlation coefficient 0.99),
also indicates that there is some consistency in the
hierarchy of service provision in settlements through time
as there is with settlement size. This high correlation
also confirms the comparability of the two service data
sets used for 1970 and 1987, which was initially
questioned.
63

The accessibility of a place also appears to have
a significant relationship with the size of place. The most
highly correlated accessibility index with population size
is that of the site factor (correlation coefficient 0.56
with 1987 population figure). This site factor is
determined by the quality of road that the settlement lies
on, a U.S. or State highway having a score of 3 , a paved
county road a score of 2, and an unpaved or gravel road a
score of 1 . It would appear from the correlation
coefficient that in general, smaller places are located on
poorer quality roads than are larger places. This is what
generally would be expected, as it would be unusual to find
a large place located on a gravel road, for instance.
Indeed, it is interesting that the correlation coefficient
is not any stronger than it is, but this could be because
of the nature of this accessibility data, only having three
categories
.
The variable ACC2, distance to the nearest place of
2,500 or more shows the next strongest association with
population size (correlation coefficient -0.40). This
negative relationship shows that as distance from a place
of 2,500 increases, then settlements population would be
expected to decrease. Residents of isolated places have to
travel further in order to obtain even basic goods and
services, and this may be a factor limiting their growth,
64

and hence a reason why they have remained small.
The variable, ACC1 shows a weak, but significant
association with population size (correlation coefficient -
0.31), indicating an association between the size of the
city and its relative accessibility to Highways. This
reiterates the idea of isolation as being important in
determining the size of a settlement, with smaller places
tending to be located farther from major transportation
arteries
.
The least significant of the accessibility indexes is
ACC4 , distance to nearest place with a population of 25,000
or above. This reveals a insignificant relationship with
the population size of a settlement (correlation
coefficient -0.14), and also with population change
(correlation coefficient -0.05). These findings seem to
contradict what would have been expected, that smaller
declining places are more inclined to be located far from
major urban centers, i.e. in the more isolated places. This
is assuming the a large urban center is a positive
influence on a surrounding smaller settlement, which may in
fact not be the case, as has been discussed earlier in
chapter two. However, since the region as a whole is fairly
isolated from the influence of large cities, this variable
may not prove to be very important in determining
individual differences between the settlements of North
65

Central Kansas
.
From this discussion of the interrelationships, among
the independent variables, it appears that accessibility
may be more important than service status in explaining
population change. The main question at hand, however,
remains what relationship these independent variables have
with the dependent variable, population change, while
controlling for the influence of variable
interrelationships. It is to this end that a multiple
regression analysis is calculated.
MULTIPLE REGRESSION ANALYSIS.
The explanatory power of the independent variables
together, rather than the relationship between the
dependent variable and the independent variables each taken
separately, is expressed in the multiple correlation
coefficient (a measure of the goodness of fit of the least
squares surface to the data) . Using population change as
the dependent variable, and the ten variables, listed in
table 4.1 as independent variables, a stepwise multiple
regression analysis is computed.
66
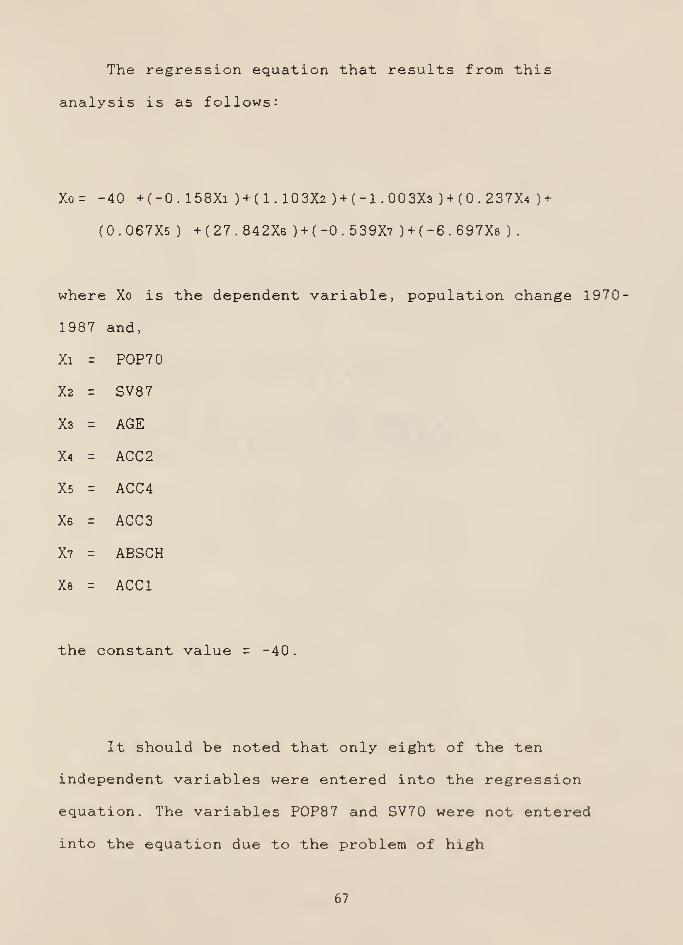
The regression equation that results from this
analysis is as follows:
Xo- -40 +(-0. 158Xi ) + (l. 103X2 ) + (-l. 003X3 ) + (0. 237X4 ) +
(0.067X5 ) +(27.84 2X6 )+( -0.539X7 )+( -6.697X8 )
.
where Xo is the dependent variable, population change 1970
1987 and,
Xi = POP70
X2 = SV87
X3 = AGE
X4 - ACC2
X5 = ACC4
Xs = ACC3
X? = ABSCH
Xe = ACC1
the constant value = -40.
It should be noted that only eight of the ten
independent variables were entered into the regression
equation. The variables POP87 and SV70 were not entered
into the equation due to the problem of high
67

1
us1
43•H5
c (D
l tffl
•H G-P (0
(0 J2r-\
©u cu
•Hp(0
0) r-
iH 3 1
ft ft 1
•H1
+3 ftrHDS
-Pc•H
I'd
h0)
+3 ac© -H
w<D DO
fH (1)
IXI 5h
(0 tao
•H <D
M Sh
«fl
>
ft
PCfl
eg
O (T)
CO <N
O O
OCOCO
I 03
CD O
o o
ooCO
o reC^ C— CM ^ CO O rHfccowoouwoooouumuft.co<<<<<<
i-tCvJCO^lOCOC-OO
68

autocorrelation of these variables. POP87 explains
basically the same as POP70 , and SV70 explains the same as
SV87, and for this reason they are not considered in the
actual regression analysis.
A summary of the results of the regression is shown in
table 4.3. The first row of the table shows the variable
(POP70) that correlates most highly with the dependent
variable, population change. The correlation coefficient
appears in column 3 (0.458) and the coefficient of
determination in column 4 (0.209). The second row of the
table gives the results of adding a second variable to the
regression, with a cummulative effect on the R and R2. The
variable in row 2 (SV87) explains more of the remaining
variation in population change than any of the other
variables. The same procedure is repeated throughout all
the steps, however only a significant change in the
dependent variable resulted from three variables. The other
five variables resulted in such minimal change in the
dependent variable that the changes in the R2 values were
not noted.
The final row of the table indicates that when all of
the independent variables are considered, a correlation
coefficient of 0.600 is obtained, and the coefficient of
determination, the R2 value, equals 0.360. This means that
36 percent of the variation in the dependent variable,
69

population change, can be attributed to variation in the
selected independent variables.
Thus, as predictors of population change in the
settlements of North Central Kansas, the selected variables
used in the regression analysis appear to be weak. Being
able to explain only 36 percent of the variation in the
dependent variable means that there still remains 64
percent of the population change unexplained. However,
population change is a very complex variable, and even to
be able to explain 36 percent of its variation is worth
noting.
BETA WEIGHT ANALYSIS.
A measure of each variables independent direct effect
upon population change can be obtained by controlling for
the effect of the remaining variables, and isolating that
variables relationship with the dependent variable. Beta
coefficients represent the amount of standardized change in
the dependent variable that can be associated with a change
of one standard deviation in one of the independent
variables. The formula for calculating the Beta
co-oef f icients is as follows:
bi . Sx i
Bi =
sy
70

Each regression coefficient (bi ) is standardized by
multiplying it by its standard deviation ( Sx i ) and dividing
by the standard deviation of the dependent variable ( Sy
)
and thus producing comparable Beta weights. This allows one
to compare the relative influence of each of the
independent variables on the dependent variable while
controlling for the effects of all the other independent
variables. Table 4.4 shows the beta weights associated with
each of the independent variables.
From these Beta weights, it is evident that the
variables POP70 (Beta weight -1.642) and SV (Beta weight
-1.111), explain the most variance in the dependent
variable. This confirms the conclusions deduced from the
correlation matrix, that the size of the settlement and its
functional status are associated.
The variable ABSCH also revealed a relatively strong
independent influence on population change, with a Beta
weight of -0.84. This shows that the absolute change in the
service and retail provision of a settlement is important
in explaining the population change of a settlement. This
relationship did not show up in previous analysis when the
effect of the other variables was not controlled for.
71

Table 4.4VARIABLE BETA WEIGHTS
Variable Beta weight
POP70 -1.642SV87 -1.111AGE -0.052ACC2 0.019ACC4 0.001ACC3 0.127ABSCH -0.840ACCl -0.408
72

The variable that is next most effective in explaining
variance in the dependent variable, is ACC1, which is
distance to nearest U.S. Highway from each settlement.
While not as important as the first three variables noted,
this variable does explain considerably more of the
dependent variable than the remainder of the independent
variables. However, the sign of the Beta weight suggests
that less accessibility to large cities supports a greater
opportunity for growth which is contrary to what has been
previously been suggested.
ANALYSIS OF RESIDUALS.
Residuals from the regression equation are assigned to
each observation indicating how closely the dependent
variable was predicted in each case, by the selected
independent variables. The values are standardized scores
with a mean of zero and a standard deviation of one. The
further the residual is from zero, the more under or over
predicted is that particular observation. Mapping of
residuals can provide clues to the unexplained variance in
the dependent variable. Figure 4.1 is a map showing the
settlements used in this study as residual values derived
from the multiple regression analysis discussed above.
The ten observations with the highest or lowest
73

Figure 4.1
Extreme Residuals Mapped.
1
o o._, J
J
_l
top five most overpredicted places
top five most underpredicted places
other settlements
5 5 10
'74
residual values are noted. These are demarcated marked on
figure 4.1. In the north of the study area, Mankato
,
Belleville, and Washington show severe under prediction,
i.e. more growth or less decline than expected. These
three cities all lie on U.S. Highway 36 and this may be
one reason why they are loosing population less rapidly
than the other indicators would tend to show.
On the other hand, Beloit, Glen Elder, and Osborne are
severely over predicted, and these three cities all lie on
U.S. Highway 24. These cities show less population growth,
or more decline, than would be expected given the rest of
the variables. According to the Traffic Flow Map prepared
by the Kansas Department of Transportation, U.S. Highway 24
does have less traffic flow than U.S. Highway 36, and this
may account for some of the difference in influence of the
state highways on the population change in these
settlements. One other thing that does set these over
predicted cities apart is that they are all located close
to Waconda Lake, which draws some tourism and may, for
instance, increase the service provision of these places
above what could normally be supported by the resident
population. However, there does not appear to be any
consistent explanation for the pattern of residuals shown.
Individual city's over or under prediction is probably more
in response to some stochastic variables peculiar to that
75

place and thus not allowing any concrete conclusions to be
drawn from these patterns of residuals.
SUMMARY OF RESULTS.
In summary, the regression analysis provided some
insight into the relative significance of ten selected
independent variables in explaining change in population
between 1970 and 1987 in North Central Kansas. Together,
the selected variables could explain 36 percent of the
variation in the dependent variable, population change 1970
-1987. Thus, the explanatory power of the selected
variables is somewhat lacking, as it leaves almost two
thirds of the variation in the dependent variable
unexplained. However, population change is a very complex,
and interrelated variable, and the 36 percent explanation
that has been achieved is still worth considering and
discussing.
The size of the settlement appears to account for the
most significant proportion of the variation in the
dependent variable. The service provision within a place
proved to be important also, in determining population
change. The absolute change in the service provision of a
settlement also appeared to be associated with the level of
population change in that place, and the accessibility of
settlements proved to be important also in accounting for
76
some of the population change in the region. The more
isolated a place is from a major transportation artery, or
from a larger place of 2,500 or more, then the smaller that
place tended to be. The inter-correlations between the
independent variables revealed some interesting results,
the most significant being the importance of the size of
settlement in its influence on the other variables.
The following chapter will discuss these results in
more detail, and note any conclusions that can be drawn
from this study. Consideration will also be given to the
general issue of the possible future of rural settlements,
and how this present study may aid in the understanding of
rural settlement dynamics in general
.
77
Chapter Five
CONCLUSIONS
This study has examined population change in the rural
settlements of North Central Kansas. Taking an historical
perspective of the region from 1890 until 1987, it was
found that all settlements grew rapidly to their peak in
the late 19th and early 20th Century. Since then,
settlements have tended to decline, with the exception of
the decade 1970 to 1980, when a "rural renaissance" was
evident. However, from the population figures available
for the 1980' s, it appears that this renaissance was short
lived, and the general trend in the region is now again one
of decline.
Factors influencing these population trends in the
region between 1970 to 1987 were examined to isolate and
analyze the influence of selected variables on population
change. Ten independent variables were selected, dealing
with the accessibility of a place, its service and retail
provision, and its population characteristics. The
relative importance of the variables in explaining
population change between 1970 and 1987 was tested using
Pearson product moment correlations and multiple regression
78

analysis
.
The analysis revealed "that the actual size of a
settlement is the most influential variable in determining
its absolute population growth or decline, and closely
related to population size is the functional status of that
place. The accessibility of a place was also found to be
influential in explaining population growth or decline, but
less so than the above mentioned groups of variables.
However, the actual size of a place is obviously inherently
related to the amount of population loss or gain in a place
and thus somewhat confounds this result. After controlling
for size, actual change in service and retail provision,
and the distance to nearest place with a population of
2,500 or greater, appeared to be significant in explaining
the population change that occurred. The average age of a
population appeared to be of no significance in explaining
population change.
It was anticipated that all of the selected variables
would significantly influence population change, and thus
it is interesting that this was not in fact the case, with
only a few of the variables displaying a significant
influence on the dependent variable.
From the multiple regression analysis, the ten
selected independent variables achieved 36 percent
explanation for the population change that occurred in
79

North Central Kansas between 1970 and 1987. This implies
that a further 64 percent of the change in population that
occurred during that time period, remains unexplained.
However, it can be concluded that these ten selected
variables are of some influence in determining population
change, and hence should not to be overlooked.
POPULATION CHANGE IN GENERAL.
The issue of population change is indeed a complex
one. Although settlements are each independent units, they
are also inextricably linked to their surrounding
hinterland and also to the overall system of settlements.
Rural settlements often respond more to local or specific
circumstances than they do to overall generalized
variables, and it is very difficult to pin point individual
local issues and circumstances that may result in
population change in a particular settlement. As Dotzauer
(1980) has noted, a researcher cannot hope to explain all
of the "erratic fluctuations" of population change, such as
those that Hart and Salisbury (1965) mention. Such
fluctuations of populations are responsive to uncontrolable
and immeasurable components of rural settlements that vary
from one place to another.
Rural settlements may also be considered to be
responsive to their rural hinterland and the rural economy
80

in general, and thus the internal dynamics of a place may
be an expression of processes that are at work at large.
For example Brozowski et al . (1973) concluded that regional
influences were the most important indices associated with
population change in small villages, more so than internal
characteristics . This notion was upheld by the present
study, in so far as the relative ranking of size of place
is consistent through time. Undoubtedly, the changing
economic situations and particular environments surrounding
the settlements will cause variables to fluctuate in
importance from place to place. Most small, rural
settlements have a very limited economic base in terms of
size and diversity, and thus will tend to reflect changing
economic conditions more rapidly than larger towns or
cities. Indeed, they are much more vulnerable to change
than are larger places which have a stronger economic base.
The failure of even one business in a small town, may be
the trigger for decline in both services and population of
that place, while, on the other hand, the success of one
particular business or enterprise, may be enough to keep up
the momentum of the place and maintain the towns buoyancy.
Hart (1986) has stated that the survival of rural
settlements depends greatly on achieving small scale
manufacturing activity in the place, relating this to
individual entrepreneurship within that settlement.
81

One issue that has not been mentioned as yet, is that
of ethnicity. Homogeneity of ethnic heritage may be one
element is important in a towns survival or demise.
Community spirit and community activity has been noted by
Johansen and Fuguitt (1984) as being important to rural
life. A strong bond among community members may encourage
and stimulate growth, or at least reduce the rate of
decline in a place, more so than in a settlement where the
residents have no special bonding. This variable was not
tested as part of the analysis as it is very difficult to
quantify, and is perhaps more in the field of the rural
sociologist or psychologist, than the geographer, but
nevertheless is an interesting issue to consider.
Hart and Salisbury (1965) have concluded that the
phenomena of population change in small towns is too
complex to accept one or even several variables as "final"
as an explanation for observed trends of population change,
and this conclusion could definitely be reiterated by this
present study. There are many stochastic elements to
population change that make it impossible to accept any
particular explanation or explanations for its occurrence,
and it must be looked at within its local and regional
context
.
In conclusion, therefore, it can be stated that we
have gained some understanding as to what processes are
82

causing and influencing population change in rural areas
from this study, but it has been underscored that complete
explanation is impossible when dealing with such a variable
as population change. However, the question still begs as
to what is the future of rural settlements ?
THE FUTURE OF RURAL SETTLEMENTS . . . ?
It is clear that rural settlements can no longer be
referred to as the "capitals" of rural America, as Brunner
(1936) and his associates termed them. Johansen and Fuguitt
(1984) believe that rural settlements shall continue to
exist as differentiated units of settlement, autonomous to
a degree, but increasingly integrated with the rest of
society. They are expected to continue in about the same
numbers, and retain a certain degree of functional
differentiation, but are becoming increasingly tied to
trends of other nearby units of settlements.
Thus, in thinking about the future of rural
settlements, the issue must be considered within the
context of possible future societal transitions, which are
very difficult to predict. The village has proven to be a
resilient form of settlement in the United States
throughout time. Their resurgence and growth during the
1970 's indicates that rural settlements still do maintain a
very viable position in the hierarchy of settlements.
83

However, the downturn and return to decline that is
revealed from preliminary evidence of the 1980' s, seems to
paint a more gloomy picture of their potential future. It
is argued, however, that rural settlements are by no means
an obsolete or anachronistic form of settlement at the
present time, or for the near future.
From the present study, it is apparent that the rural
settlement structure, in North Central Kansas at least, is
remaining quite stable, and despite trends of stagnation
and decline, the overall pattern is one of stability. Those
places that were the smallest in 1970 remained the smallest
in 1987, no particular group or order of settlements has
declined at exceptionally rapid rates, as have no
particular group of settlements grown more rapidly than the
rest of the region. This stability is also expressed in
the level of service and retail provision that is present
in the settlements of the region, which has also remained
stable through time.
From this study it may be concluded that rural
settlements are not threatened in the immediate future,
with perhaps only the very smallest places dying out. The
more distant future depends much upon society and the
economy at large, and the transitions that occur there will
be reflected in the role and function of rural settlements
as they respond to these external dynamics.
84

CRITIQUE OF THE METHODOLOGICAL PROCEDURES.
While the methodology used in this study provided
interesting results, there are several areas where possible
improvements could be made. Firstly is the issue of using a
non census year as an end point for the study. While the
data that was used is deemed to be fairly accurate, more
reliable results may have been achieved by using census
years alone. However, due to time framework of the present
study, and the desire to analyze the population trends of
the 1980' s, the non census year population data was used.
Secondly, not all the data used is normally
distributed. This is true particularly for the population
data. Some form of data transformations may have provided
more satisfactory results, and increased the R2 value.
However, the relative importance of each of the independent
variables would remain the same, and thus even without data
transformations the significance of the selected variables
can be considered.
Another problem was the lack of complete information
on the service and retail provision in some of the towns in
the region, and for this reason some places were omitted
from the study making the sample of settlements in the
region less than complete. The study region itself is
rather small with only 56 settlements used in the analysis.
85

Perhaps more meaningful results would have been achieved if
the study region had been larger, perhaps even the whole of
the State used. The conclusions and generalizations that
can be drawn from the present study only really apply to
North Central Kansas, which in many ways is a pretty
homogeneous region.
FURTHER RESEARCH.
Still, very much more work needs to be done on rural
settlements in order to understand their dynamics, and to
enable wise planning decisions and policies to be made. If
smaller rural places are deemed to die, then to attempt to
stimulate growth in such a place would perhaps be a
misallocation of resources. As Daniels and Lapping (1987)
point out, small stagnant and dying towns seeking to
revitalize themselves must struggle against a vicious
circle. They do not have enough people to attract new
retail and service establishments, nor having enough
financial capacity or backing to construct the necessary
infrastructure to attract potential manufacturing activity.
The difficult policy question that therefore arises is
"which towns should be helped, and how ?".
Concentration of effort in a few settlements that
maintain more prospect of survival, may achieve longer
lasting and better results. Key settlements is a policy
86
that has been implemented in rural areas of Britain, with a
fair degree of success, and this may be a possible planning
approach to deal with the problem of rural decline in the
American Mid-West. However, in Britain the density of
settlements is relatively high, and thus rural residents do
not have very long distances to travel in order to obtain
necessary services. In the Midwest though, the density of
rural settlements is much lower, and a regional center or
"key" settlement may be too distant from the smaller places
to adequately serve their needs. However, this growth
center policy may be the only way to maintain the viability
of rural settlements.
It is essential that regional and local planners and
officials know the general population dynamics of rural
areas in order to plan efficiently, for instance whether to
build a bigger school, or close the small local hospital,
etc. There are indeed many policy issues that affect rural
settlements, and this necessitates the need to continue in
a search for explanation and understanding of rural
settlement dynamics.
This study has sought to achieve a deeper
understanding of the factors influencing population change
in a specific rural area, although it is hoped that the
results will provide an insight into the issue of rural
survival in general. Future research, using larger study
87

areas, a wider set of variable, and more powerful
statistical analysis, will prove beneficial to this long
term issue of the survival or demise of settlements in
rural areas for the future.
88

Appendix 1
Summary of Data Used in Study.
CITY P0P70 P0P87 ACC1 ACC2 ACC3 ACC4 SV70 SV87 ABPCH ABSCH AGE
AGENDA 107 101 9.0 18 2 77 18 6 - 6 -12 52
ALTON 214 117 0.0 40 2 118 20 19 -97 - 1 55
ATHOL 108 87 0.0 22 2 126 9 16 -21 7 38
BARNARD 190 168 21.0 23 2 46 38 27 -22 -11 45
BARNES 209 204 7.0 21 2 50 24 27 - 5 3 38
BELLEV. 3063 2600 0.0 3 70 333 309 -463 -24 46
BELOIT 4121 4221 0.0 3 65 407 389 100 -IB 39
BENNINGT. 516 582 4.0 18 3 14 69 89 66 20 37
BEVERLY 193 146 11.0 30 2 30 19 24 -47 5 44
BURR OAK 426 342 6.0 36 2 105 33 20 -84 -13 41
CAUKER C. 726 642 0.0 21 3 86 74 72 -84 -2 36
CLIFTON 718 642 13.0 21 2 61 % 75 -76 -21 43
CLYDE 946 905 15.0 15 3 66 101 89 -41 -12 45
CONCORD. 7221 6779 0.0 3 52 701 660 -442 -41 40
COURTLAND 403 373 1.0 15 2 78 53 46 -30 -7 46
CUBA 290 267 0.0 10 2 89 28 19 -23 -9 45
CULVER 148 137 6.0 17 2 17 10 4 -11 -6 26
DELPHOS 599 554 5.0 25 2 36 68 41 -45 -27 47
DOWNS 1268 1278 0.0 27 3 92 121 131 19 10 44
ELLSWTH. 2080 2380 0.0 28 3 37 298 238 300 -15 42
ESBON 206 190 2.0 40 2 105 34 19 16 -15 42
FORNOSO 180 166 1.0 14 1 84 15 8 -14 -7 45
GAYLORD 211 198 3.0 31 2 115 39 34 -13 -5 42
GLASCO 767 661 0.0 IB 2 50 111 87 -106 24 44
GLENELD. 422 514 0.0 10 2 75 56 47 92 -9 45
6REENLF. 448 410 6.0 25 2 58 86 70 -38 -16 47
HADDAM 289 220 3.0 22 2 83 26 16 -69 -10 45
HANOVER 793 728 4.0 16 2 64 88 98 -65 10 41
HOLYROOD 593 638 0.0 27 2 50 78 69 45 -9 43
HUNTER 150 29 25.0 29 2 66 24 24 -21 51
JAMESTOWN 470 388 12.0 12 2 65 45 35 -82 -10 49
JEWELL 569 598 8.0 16 3 81 41 54 29 -13 44
KANAPOLIS 626 653 3.0 26 2 34 52 50 27 -2 34
KENSINGTN 653 627 0.0 17 3 130 66 38 -26 -28 43
LINCOLN 1582 1417 18.0 31 2 43 194 176 -168 -18 46
LINN 388 469 11.0 22 2 63 49 66 81 17 48
LORRAINE 153 172 18.0 20 2 50 78 IB 19 -60 37
MAHASKA 122 110 14.0 25 2 93 9 8 -12 -1 59
MANKATO 1287 1107 0.0 25 3 91 162 165 -180 3 42
MILTNVL. 718 533 1.0 IB 2 51 75 83 -lPr
8 42
89
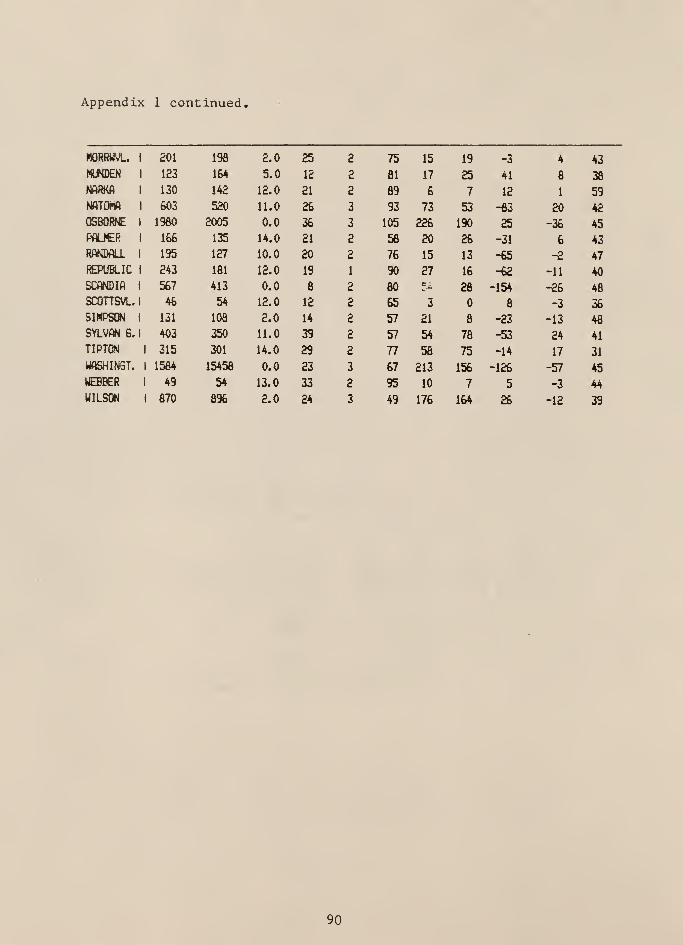
Appendix 1 continued.
MORRWVL. 1 201 198 2.0 25 2 75 15 19 -3 4 43
MUNDEN 1 123 164 5.0 12 2 81 17 25 41 6 38
NARKA 1 130 142 12.0 21 2 89 6 7 12 1 59
NfiTunfl 1 603 520 11.0 26 3 93 73 53 -83 20 42
OSBORNE 1 I960 2005 0.0 36 3 105 226 190 25 -36 45
PAU£R 1 IBS 135 14.0 21 2 58 20 26 -31 6 43
RANDALL 1 195 127 10.0 20 2 76 15 13 -65 -2 47
REPUBLIC 1 243 181 12.0 19 1 90 27 16 -62 -11 40
SCANDIA i 567 413 0.0 8 2 80 ja 28 -154 -26 48
SCGTTSVL
1
46 54 12.0 12 2 65 3 6 -3 36
SIMPSON 1 131 108 2.0 14 2 57 21 8 -23 -13 48
SYLVAN G. 1 403 350 11.0 39 2 57 54 78 -53 24 41
TIPTON 1 315 301 14.0 29 2 77 56 75 -14 17 31
UASHINST. 1 1584 15458 0.0 23 3 67 213 156 -126 -57 45
WEBBER 1 49 54 13.0 33 2 95 10 7 5 -3 44
WILSON 1 870 8% 2.0 24 3 49 176 164 26 -12 39
90

BIBLIOGRAPHY
Anderson, A.H. & Miller, C.J. (1953) Do our small townshave a future ? NEBRASKA AG. EXP. STA. QUARTERLY , 2
pp. 6-7
Ballard, Patricia L. & Fuguitt, Glenn V. (1985) Thechanging small town settlement structure in the UnitedStates, 1900-1980. RURAL SOCIOLOGY, vol. 50 (1) pp. 99-113
Barkley, Paul W. (1962) THE CHANGING ROLE OF SOMECOMMUNITIES I_N SOUTH CENTRAL KANSAS
.
K.S.U. Extensionservice, Bui. MF-93. Manhattan: K.S.U. Extension Service.
Berry, Brian, J.L. & Garrison, William, L. (1958) Thefunctional bases of the central place hierarchy. ECONOMICGEOGRAPHY , vol. 34 pp. 145-54
Berry, Brian J.L. & Kasarda, John D. (1977) CONTEMPORARYURBAN ECOLOGY. New York: Macmillan Publishing Co.
Blacksell & Gilg, A. (1981) THE COUNTRYSIDE: PLANNING ANDCHANGE
.
Published in England.
Bohrnstedt, George W. (1969) Observations on themeasurement of change, pp. 113-34 in SOCIOLOGICALMETHODOLOGY
.
edited by E.F. Brogotta and G.W. Bohrnstedt.San Francisco: Jossey Bas
.
Browne, W.P. & Hadwiger, D.F. (1982) RURAL POLICY PROBLEMS:CHANGING DIMENSIONS. Lexington Books, Mass.
Brozowski , R. , Romsa, G., & Lall, A. (1973) Some factorsinfluencing population change in rural Ontario. SCOTTISHGEOGRAPHICAL MAGAZINE, vol. 49 pp. 131-36
Brunner, Edmund (1936) Do villages grow ? RURAL SOCIOLOGY.vol. 1 pp. 506-509.
Brush, J.E. (1953) The hierarchy of central places in S.W.Wisconsin. GEOGRAPHICAL REVIEW, vol. 43 pp. 380-402.
Bunce, Michael (1982) RURAL SETTLEMENTS IN AN URBAN WORLD
.
Croom Helm Ltd., London.
Butler, J.E. & Fuguitt, Glenn V. (1970) Small townpopulation change and distance from larger towns. RURALSOCIOLOGY, vol. 35 pp. 397-421
91

Bylund, E. (1960) Theoretical considerations regarding thedistribution of settlements in inner North Sweden.GEOGRAFISKA ANNALER (Series BJ. vol. 42-44 pp. 225-31
Carlson, J.E., Lassey, M.L., & Lassey, W.R. (1981) RURALSOCIETY AND ENVIRONMENT IN AMERICA. McGraw-Hill, New York.
Christaller, Walter. (1966) CENTRAL PLACES IN SOUTHERNGERMANY
.
Englewoods Cliffs: Prentice Hall.
Christiansen, J.R. (1957) The behavioral correlates ofmembership in rural neighborhoods. RURAL SOCIOLOGY, vol.12 pp. 12-19
Clawson, Marion. (1966) Factors and forces affecting theoptimum future of rural settlement pattern in the U.S.ECONOMIC GEOGRAPHY
,
vol. 42 pp. 284-97
op. cit. (1972) The future of non-metropolitan America.AMERICAN SCHOLAR, vol. 42 pp. 102-9
Clark, Carroll D. & Roberts, Roy L. (1936) PEOPLE OF KANSASTopeka: Kansas State Planning Board.
Cloke, P.J. (1980) New emphasis for applied ruralgeography. PROGRESS IN HUMAN GEOGRAPHY
,
vol. 4
PP. 181-217
op. cit. (1985) Whither rural studies. JOURNAL OF RURALSTUDIES, vol. 1 pp. 1-10
Daniels, Thomas L. & Lapping, Mark B. (1987) Small towntriage: A rural settlement policy for the AmericanMidwest. JOURNAL OF RURAL STUDIES, vol. 3 pp. 273-80
Davies, V. (1943) Neighborhoods, townships and communitiesin Wright County, Minnesota. RURAL SOCIOLOGY, vol. 22
PP. 235-40
Demangon, A. (1927) La Geographie de 1' habitat RuralANNALES de GEOGRAPHIE REVIEW, vol. 36 pp. 11-20
Dion, R. (1934) ESSAI SUR LA FORMATION DU PAYSAGE RURALFRANCAIS. Tours: Anrault
.
Dotzauer, Peter J. (1980) THE IMPACT OF LOCATION RELATIVETO CITIES ON VILLAGE POPULATION CHANGE IN KANSAS ,
1950-1976
.
Unpublished Masters Thesis, Dept . of Geography,Kansas State University, Manhattan, Kansas.
92

Duncan, Ottis Dudley & Reiss H.J. (1956) SOCIALCHARACTERISTICS OF URBAN AND RURAL COMMUNITIES. New York:Wiley
.
Duncan, Otis D., Scott, William R. , Duncan, B.D.,Winsborough, H. (1960) METROPOLIS AND REGION. Baltimore:The John Hopkins Press.
Evans, Frederick. (1915) TOWN IMPROVEMENT. New York: D.Appleton and Company
Fielding, A.J. (1982) Counterurbanisation in WesternEurope. PROGRESS IN PLANNING vol. 17 pp. 1-52
Fletcher, Henry J. (1895) The doom of the small town.FORUM
.
vol. 19 pp. 214-223
Flora, Jan L., Flora, C.B., Karmin, M.A. & Stramel, A.
(1986) RETAIL SALES BY ESTABLISHMEHTS FROM SALES TAX DATA,FARMING DEPENDENT COUNTIES OF KANSAS, 1979-85. Dept . ofSociology, Kansas State University, Manhattan, Kansas.
Fuguitt, Glenn V. (1965)a. County seat status as a factorin small town growth and decline. SOCIAL FORCES
,
vol. 44pp. 245-51
op. cit. (1965)b. The growth and decline of small towns asa probability process. AMERICAN SOCIOLOGICAL REVIEW, vol.30 pp. 403-411
op. cit. (1972) Some demographic aspects of the small townin the U.S. SOCIOLOGIA RURAL IS, vol. 12 pp. 160-72
Fuguitt, Glenn V. & Field, D.R. (1972) Some populationcharacteristics of villages differentiated by sizelocation and growth. DEMOGRAPHY, vol. 19 pp. 295-302
Golledge, R.G. & Ruston, G. (1966) Some spatialcharacteristics of Iowa's dispersed farm population andthe implications for the grouping of central placefunctions ECONOMIC GEOGRAPHY , vol. 42 pp. 261-72
Gomme, George Laurence (1890) THE VILLAGE COMMUNITY.London: Longmans, Green and Company
93

Gordon, David (1977) Capitalist development and the historyof American cities, pp. 25-63 in W. Tabb & L. Sawers(eds. ) MARXISM AND THE METROPOLIS. New York: OxfordUniversity Press.
Groop, Richard E. (1976) SMALL TOWN POPULATION CHANGE INKANSAS , 1950 TO 1970. Unpublished PhD Thesis, Dept . ofGeography, University of Kansas, Lawrence, Kansas.
Hart, John F. , (1986) Facets of the geography of populationin the Midwest. JOURNAL OF GEOGRAPHY
,
vol 85 no. 5
pp. 201-211
Hart, John F. & Salisbury, Neil E. (1965) Population changein middle western villages: a statistical approach. ANNALSof ASSOC. AMERICAN GEOGRAPHERS
,
vol. 55 pp. 140-60
Hart, John F., Salisbury, Neil E., & Smith, Everett, G.Jr.(1968) The dying village and some notions about Urbangrowth. ECONOMIC GEOGRAPHY
,
vol. 44 pp. 343-49
Harvey, David (1973) SOCIAL JUSTICE AND THE CITY.Balitmore: John Hopkins Press.
Hassinger, Edward (1957) The relationship of retail servicepatterns to trade center population change. RURALSOCIOLOGY, vol. 22 pp. 235-40
Hawley, Amos H. (1950) HUMAN ECOLOGY. New York: RonaldPress
.
op. cit. (1978) Urbanization as a process, pp. 3-26 inHANDBOOK OF CONTEMPORARY URBAN LIFE.
,
edited by DavidStreet. San Francisco: Jossey Bass.
Hoffer, C.R. (1931) Services in rural trade centers. SOCIALFORCES vol. 10 pp. 66-71
op. cit. (1935) CHANGES IN THE RETAIL AND SERVICEFACILITIES OF RURAL TRADE CENTERS IN MICHIGAN. EastLansing: Michigan Agr . Exp. Sta. Bui. 261
op. cit. (1936) The farmers trading facilities. RURALAMERICA vol. 14 pp. 28-29
Hudson, John C. (1969) Location theory for ruralsettlements. ANNALS of ASSOC. AMERICAN GEOGRAPHERS
,
vol.59 pp. 365-81
94

Hugo, G.J. & Smailes, P.J. (1985) Urban-rural migration inAustralia: A process view of the population turnaround.JOURNAL OF RURAL STUDIES, vol. 1 pp. 11-30
Johansen, Harley & Fuguitt, Glenn V. (1973) Changingretail activities in Wisconsin Villages. RURAL SOCIOLOGY,vol. 38 pp. 207-18
op. cit. (1979) Population growth and retail decline:Conflicting effects of urban accessibility in Americanvillages. RURAL SOCIOLOGY, vol. 44 pp. 25-36
op. cit. (1984) THE CHANGING RURAL VILLAGE IN AMERICA:DEMOGRAPHIC AND ECONOMIC TRENDS SINCE 1950. Harper & Row,Inc: Massachusetts.
Kale, Steven (1975) Small town population change in theCentreal Great Plains: An investigation of recent trends.ROCKY MOUNTAIN SOCIAL SCIENCE JOURNAL, vol. 12 pp. 29-43
League of Kansas Municipalities (1987/88) THE DIRECTORY OFKANSAS PUBLIC OFFICIALS. Kansas Govt. Journal, Topeka,Kansas
.
LeFevre, M.A. (1926) LE HABITAT RURAL en BELGIQUE. Liege.
Lewis, G.J. (1979) RURAL COMMUNITIES: A SOCIAL GEOGRAPHY
,
David & Charles, Newton Abbot.
Lively, C.V. (1931) The appearance and disappearance ofminor trade centers in Minnesota. SOCIAL FORCES
,
vol. 10pp. 71-75
Losch, August (1954) THE ECONOMICS OF LOCATION. Translatedby W. Wogland with W.F. Stolper. New Haven: YaleUniversity Press.
Mattingly, Paul F. (1963) Population trends in the hamletsand villages of Illinios; 1940-60. PROFESSIONALGEOGRAPHER, vol. 15 pp. 17-21
Mogey, John (1976) Recent changes in the rural communitiesof the United States. SOCIOLOGIA RURAL IS vol. 16
PP. 139-60
Morrill, Richard L. (1979) Stages in patterns of populationconcentration and dispersion. PROFESSIONAL GEOGRAPHER.vol. 31 pp. 55-65
95

op. cit. (1980) The spread of change in metropolitan andnonmetropolitan growth in the United States, 1940-1976.URBAN GEOGRAPHY
,
vol. 1 (2) pp. 118-29
Nesmith, Dwight (1963) The small rural town. In A.Stefferud (ed) A PLACE TO LIVE. THE YEAR BOOK OFAGRICULTURE. Washington D.C.
Pacione, M. (1984) RURAL GEOGRAPHY
.
Harper & row, London.
Phillips, Phillip D., & Brunn, Stanley D. (1978) Slowgrowth"- a new epoch of American netropolitan evolution.GEOGRAPHICAL REVIEW, vol. 68 pp. 274-92
Pickersgill, T.B. (1961) The vanishing Prairie village.HABITAT, vol. 4 pp. 18-20
Rikkinnen, Kalevi, (1968) Change in village and rural
population with distance from Duluth. ECONOMIC GEOGRAPHY
,
vol. 44 pp. 312-25
Robert, S. & Randolf , W. (1983) Beyond decentralization:The evolution of population distribution in England andWales, 1961-81. GEOFORUM
,
vol. 14 pp. 75-102
Schwarzweller , Harry K. (1979) Migration and the changingrural scene. RURAL SOCIOLOGY, vol. 44 pp. 7-23
Seebohn, Frederic (1883) THE ENGLISH VILLAGE COMMUNITY.London: Longmans, Green & Co.
Self, Huber & White, Stephen E. (1986) One Hundred andTwenty Years of Population Change in Kansas. TRANSACTIONSOF THE KANSAS ACADEMY OF SCIENCE, vol. 89 pp. 10-22
Smailes, P.J. & Hugo, G.J. (1985) A process view of thepopulation turnaround: an Australian case study. JOURNALOF RURAL STUDIES, vol. 1 pp. 31-44
Smith T. Lynn (1941) Some aspects of village demography.SOCIAL FORCES
,
vol. 20 pp. 15-25
op. cit. (1942) The role of the village in American ruralsociety. RURAL SOCIOLOGY, vol. 7 pp. 10-21
Socolofsky, Homer & Self, Huber (1972) HISTORICAL ATLAS OFKANSAS
.
University of Oklahoma Press: Norman, Oklahoma.
96

Stafford, Howard A. (1963) The functional basis of smalltowns. ECONOMIC GEOGRAPHY
,
vol. 39 pp. 165-75
Stewart, C.T. (1958) The size and spacing of cities.GEOGRAPHICAL REVIEW, vol. 48 pp. 222-45
Thomas, E.N. (1960) Some comments on the functional basisof small towns in Iowa. IOWA BUSINESS DIGEST, vol. 31 pp.10-16
Trewartha, Glenn T. (1943) The unincorporated hamlet: Oneelement in the American settlement fabric. ANNALS OF THEASSOCIATION OF GEOGRAPHERS
,
vol. 33 pp. 32-81
Vidich, Arthur J. & Bensman, Joseph (1960) SMALL TOWN INMASS SOCIETY, Garden City: New Jersey, Anchor Books
Wardwell, John M. (1977) Equilibrium and change innon-metropolitan growth. RURAL SOCIOLOGY vol. 42pp. 156-79
op. cit. (1980) Toward a theory of urban rural migration inthe developed world, pp. 71-114 in NEW DIMENSIONS IN RURALURBAN MIGRATION.
,
edited by D.L. Brown & J.M. Wardwell.New York: Academic Press.
Zelinsky, Wilbur (1962) Changes in the geographicalpatterns of rural population in the United States, 1790-1960. GEOGRAPHICAL REVIEW, vol. 52 pp. 492-524
op. cit. (1963) Rural population dynamics as an index tosocial and economic development: A geographical overview.SOCIOLOGICAL QUARTERLY
.
vol. 4 pp. 99-121
97

FACTORS INFLUENCING POPULATION CHANGE INRURAL SETTLEMENTS OF NORTH CENTRAL KANSAS
by
MARION ELIZABETH MACKAY
M.A.(Hons.) University of Glasgow, 1986
AN ABSTRACT OF A THESIS
submitted in partial fulfillment of the
requirements for the degree
MASTER OF ARTS
Geography
KANSAS STATE UNIVERSITY,Manhattan, Kansas
1988

ABSTRACT
This study analyzes population change in 56
incorporated places of North Central Kansas . Population
change is examined from 1890 to 1987 to determine the
general trends within the ten county region. The period
1970 to 1987 is focused on in more detail to identify the
factors responsible for population change. Ten factors are
identified as independent variables: (i) population size in
1970, (ii) population size in 1987, (iii) distance to a
U.S. Highway, (iv) distance to nearest city with a
population of 2,500 or above, (v) distance to nearest city
with population of 25,000 or above, (vi) quality of road
that the settlement lies upon, (vii) service and retail
provision in 1970, (viii) service and retail provision in
1987, (ix) change in service and retail provision, and (x)
the mean age of the settlements population. The dependent
variable in the analysis is absolute population change
between 1970 and 1987. The relative influence of each of
the independent variables on absolute population change is
tested using correlation and step-wise multiple regression
analysis
.
The independent variables explain 36 percent of the
variance in population change. Size of place appeared to be
the most important variable in explaining population
change. The accessibility indices also help explain some

population change, particularly distance to a settlement
with population of 2,500 or above and distance to the
nearest U.S. Highway. A relationship between the change in
service and retail provision between 1970 and 1987 and
population change over the same period also proved
significant based on an analysis of the Beta weights.
However, the population change within the region shows an
overall uniformity from 1970 to 1987, as does the service
and retail provision of the settlements, suggesting that
factors of change at the macro scale may be as important as
those at the micro scale. It is concluded that no one set
of variables can fully explain all the population change
that occurs in a region.