FACTORS INFLUENCING CONSUMER BRAND CHOICE...
125
FACTORS INFLUENCING CONSUMER BRAND CHOICE OF TOP 3 TAXI BOOKING MOBILE APPLICATIONS IN BANGKOK: UBER, GRABTAXI AND EASY TAXI
Transcript of FACTORS INFLUENCING CONSUMER BRAND CHOICE...

FACTORS INFLUENCING CONSUMER BRAND CHOICE OF TOP 3 TAXI BOOKING
MOBILE APPLICATIONS IN BANGKOK: UBER, GRABTAXI AND EASY TAXI
FACTORS INFLUENCING CONSUMER BRAND CHOICE OF TOP 3 TAXI BOOKING
MOBILE APPLICATIONS IN BANGKOK: UBER, GRABTAXI AND EASY TAXI
Watchareebhorn Sakunlertvattana
This Independent Study Manuscript Presented to
The Graduate School of Bangkok University
in Partial Fulfillment
of the Requirements for the Degree
Master of Business Administration
2016

©2016
Watchareebhorn Sakunlertvattana
All Rights Reserved

Sakunlertvattana, W. M.B.A., April 2016, Graduate School, Bangkok University.
Factors Influencing Consumer Brand Choice of Top 3 Taxi Booking Mobile Applications
in Bangkok: Uber, GrabTaxi and Easy Taxi (109 pp.)
Advisor : Sumas Wongsunopparat, Ph.D.
ABSTRACT
Taxis are the popular transportation in Bangkok because travelling by taxi is very
convenient and also time-saving in some scenario compare with other public
transportation. On the other hand, travelling by taxi also found a lot of problem as well.
In recent year, people use more of smart phone and electronic gadget. Smart phone and
mobile application technology is growing up more popular in Thailand. The E-hailing
innovation came to take part in taxi industry and it works very well in Bangkok. But the
question is what are the factors that influence people to make decision on brand choice?
This paper proposes a framework of factors influencing consumer brand choice of top 3
taxi booking mobile applications in Bangkok: Uber, GrabTaxi and Easy Taxi. This
research is conducted to show the relationship between influential factor and consumer
brand choice.
The research analysis is based on qualified 400 questionnaires that were collected
from October, 2015 until January, 2016 by random population who experience this E-
hailing service of Uber, GrabTaxi and Easy Taxi in Bangkok.
According to the objective of this research, the research focuses on the result of
the factors that influence people to make decision on brand choice. The result has been
gathered from the questionnaires done by the people who use service from one of three
taxi apps’ brand. The following is the study of relationship between marketing mix,
mobile apps, brand, consumer behavior and consumer brand choice of top three taxi
booking apps.
Furthermore, business people, firms, developer, and marketing expert can
enhance more effectiveness of consumers need, increase customer base and grow the
business in this industry using marketing strategies to fulfill consumers’ need.
Keywords: Brand choice, Taxi booking, Uber, GrabTaxi, Easy taxi, Mobile
applications, Bangkok
vi
ACKNOWLEDGEMENT
There are many people involved in the process of this independent study and
motivated the author in one way or another as well as make this academic work more
fruitful.
First, I’m grateful to my kind advisor, Dr. Sumas Wongsunopparat, who has
helped, guided and gave comments on this thesis. It will not be possible for me to work
on my own on this academic work and I’m really grateful and thankful for all the
valuable discussions I had.
Thank you for the supports from my family and friends. All of the motivations,
critiques and humors all of you have gave me during this research time are priceless and
I’m so thankful.
Furthermore, I would like to express my gratitude to all of the respondents who
spent their valuable time answering the questionnaire. Without your cooperation, this
research would not be completed.
viii
TABLE OF CONTENTS
Page
ABSTRACT ……………………………………………………………..……… iv
ACKNOWLEDGMENT ……………………………………………………….. vi
LIST OF TABLES …………………………….………………………………... xi
LIST OF FIGURES …………………………….…………………..…….…….. xiii
CHAPTER 1: INTRODUCTION ………………………………………………. 1
1.1 Background …………………………………………………………. 1
1.2 Statement of Problem …………………………………………….…. 2
1.3 Intention and Reason for Study …………………………………..…. 4
1.4 Research Objectives …………………………………………………. 4
1.5 Research Questions ……………………………………………...…… 4
1.6 Scope of Study ………………………………………………………. 5
1.6.1 Scope of Content…………………………………………… 5
1.6.2 Scope of Demographic, Samples and Location……………. 5
1.6.3 Scope of Related Variables. ……………………………….. 6
1.7 Limitations of Research ……………………………………………… 9
1.8 Assumptions …………………………………………………………. 9
1.9 Benefits of Research …………………………………………………. 10
CHAPTER 2: LITERATURE REVIEW …………………………………..……. 11
2.1 Introduction ……………………………………………………..……. 11
viii
TABLE OF CONTENTS (Continued)
Page
CHAPTER 2: LITERATURE REVIEW (Continued)
2.2 Mobile Application …………………………………………………… 11
2.3 Taxi Booking Mobile Application …………………………………… 12
2.3.1 Uber ………………………………………..……………….. 12
2.3.2 GrabTaxi ……………………………………………………. 12
2.3.3 Easy Taxi ……………………………………………………. 13
2.3.4 Top 3 Taxi Booking Mobile Application in Bangkok……… 14
2.4 Brand ………………………………………………………………….. 16
2.4.1 Brand Awareness …………………………………………… 16
2.4.2 Brand Loyalty ………………………………………………. 17
2.5 Consumer Behavior ……………………………….………………….. 19
2.6 Marketing Mix (7Ps) ………………………………………………….. 20
2.7 Rational Model …………………………………………………..……. 20
2.8 Research Framework …………………………………………………. 22
CHAPTER 3: METHODOLOGY ………………………………………………. 26
3.1 Research Strategy ……………………………………………………. 26
3.2 Populations and Samples …………………………………………….. 27
3.3 Variables ……………………………………………………………… 27
3.4 Survey Instruments ……………………………………………..……. 30
3.5 Validity and Reliability Assessment …………………………………. 39

ix
TABLE OF CONTENTS (Continued)
Page
CHAPTER 3: METHODOLOGY (Continued)
3.5.1 Validity ……………………………………………………... 39
3.5.2 Reliability …………………………………………………… 41
3.6 Data Collection ……………………………………………………….. 42
3.7 Statistic for Data analysis …………………………………………….. 43
CHAPTER 4: RESEARCH FINDINGS AND DATA ANALYSIS ……………… 47
4.1 The Analysis of General Information ………………………………… 47
4.2 The Analysis of Marketing Mix(7Ps), Mobile Application, Brand and
Consumer Behavior ………………………………………………..... 63
4.3 The Analysis of Consumer Behavior and Demographic ……………… 68
CHAPTER 5: DISCUSSION AND CONCLUSION …………………………….. 76
5.1 Conclusion ……………………………..……………………………… 80
5.2 Discussion …………………………………………………………….. 81
5.3 Managerial Implications ………………………………………………. 82
5.4 Recommendation for Future Research………………………………… 82
BIBLIOGRAPHY ………………………………………………………………… 84
APPENDICES……………………………………………………………………. 90
Appendix A: Questionnaire ……………………………………………… 90
Appendix B: Content Validity …………………………………………… 101
Appendix C: Factor Analysis: Total Variance Explained …….…………. 108
x
TABLE OF CONTENTS (Continued)
Page
BIODATA………………………………………………………………………… 109
LICENSE AGREEMENT ………………………………………………………... 110
xi
LIST OF TABLES
Page
Table 1.1: Taxi problem reported………………………………………………… 3
Table 2.1: Comparison of 3 taxi calling apps: Easy Taxi, Grabtaxi, Uber………. 14
Table 3.1: Level of Information Measurement and Criteria. …………………….. 31
Table 3.2: Level of Information Measurement and Criteria. …………………….. 32
Table 3.3: Level of Information Measurement and Criteria. …………………….. 33
Table 3.4: Level of Information Measurement and Criteria. …………………….. 36
Table 3.5: Criteria of Reliability ………………………………………………….. 41
Table 3.6: The Result of Cronbach's Alpha Test with 30 Try-out Questionnaires.. 42
Table 4.1: Hypothesis test: Model Fitting Information…………………………… 48
Table 4.2: Hypothesis test: Likelihood Ratio Tests……………………………… 48
Table 4.3: Parameter Estimates (Comparison of Uber over Easy Taxi)………….. 54
Table 4.4: Parameter Estimates (Comparison of GrabTaxi over Easy Taxi)…….... 59
Table 4.5: Factor Analysis: Total Variance Explained……………………………. 64
Table 4.6: Rotated Component Matrixa …………………………………………... 65
Table 4.7: Economic situation influencing consumer brand choice ……………… 68
Table 4.8: Economic situation of respondents ……………………………………. 69
Table 4.9: Frequency of using service……………………………………………... 69
Table 4.10: Influential people of choosing taxi apps……………………………… 70
Table 4.11: Most used social network of respondents……………………………. 70
xii
LIST OF TABLES (Continued)
Page
Table 4.12: Social network influencing consumer brand choice………………….. 71
Table 4.13: Repeat customer………………………………………………………. 71
Table 4.14: Profession of respondents ……………………………………………. 72
Table 4.15: Gender of respondents ……………………………………………….. 73
Table 4.16: Age of respondents …………………………………………………… 73
Table 4.17: Income of respondents ……………………………………………….. 74
Table 4.18: Education of respondents …………………………………………….. 74

xiii
LIST OF FIGURES
Page
Figure 2.1: The Loyalty Pyramid…………………….………….……………………… 18
Figure 2.2: Rational Model………………..……………………..……….…………….. 21
Figure 2.3: Theoretical Framework…………………..…………………..…….………. 22
1
CHAPTER 1
INTRODUCTION
1.1 Background
Nowadays, convenience is one of the most important factors for people who
live in the cities especially people who does not have car or often use public
transportation. Taxi is one of the most convenient transportations in Bangkok, the
capital of Thailand. People choose taxi to make their life more convenient, faster and
easier to reach their destination.
However, they sometimes have problem to catch the taxi. For example,
passenger cannot find any taxi in the area, or being overcharged. Some taxi driver is
rude or gives a bad service, such as, refuse to go by meters, refused to take
passengers, did not know the directions, and lacked of service mind. Department of
land transport identify that there are almost 30,000 number of passengers complain
that taxi refuse passengers (Department of land transport, 2015).When people start to
notice these problems, it leads to the creation of taxi booking mobile application
which aims to see the better changes in the society.
In Bangkok, there are 3 most popular taxi applications: Uber, GrabTaxi and
Easy Taxi. These 3 applications have little differences in details, but they have same
purpose which is to make people life more convenient; however, the popularity and
number of users are different.
The advantages of taxis booking mobile applications is that the driver tends to
get less refuse to take the passengers; moreover, passengers can check driver’s profile
2
and leave feedback for another user after using the service. They can check their lost
items from application, and for the payment method they can pay by credit card and
get rid of the drivers that don’t have changes in some applications. Plus, these taxi
applications offer discount and promotion that normal taxi has never offered to
passengers.
1.2 Statement of Problem
In 2013, there are around 120,000 of taxis in Thailand, and around 80,000
taxis are registered in taxi companies which are more than 40 companies in Bangkok.
There are around 108,500 taxis in Bangkok which is such a large number of taxis, but
passengers still have problem using the service. For example, passenger cannot find
any taxi in the area, or being overcharged. Some taxi driver is rude or gives a bad
service, such as, refuse to go by meters, refused to take passengers, did not know the
directions, and lacked of service mind. (Modernine TV, 2013)
In October 2011-September 2012 and October 2012-September 2013, it was
the most often reported time of problems in using taxis by 20,162 passengers. The
below table is the problems of using taxi in Bangkok in October 2011-September
2012 and October 2012-September 2013.
3
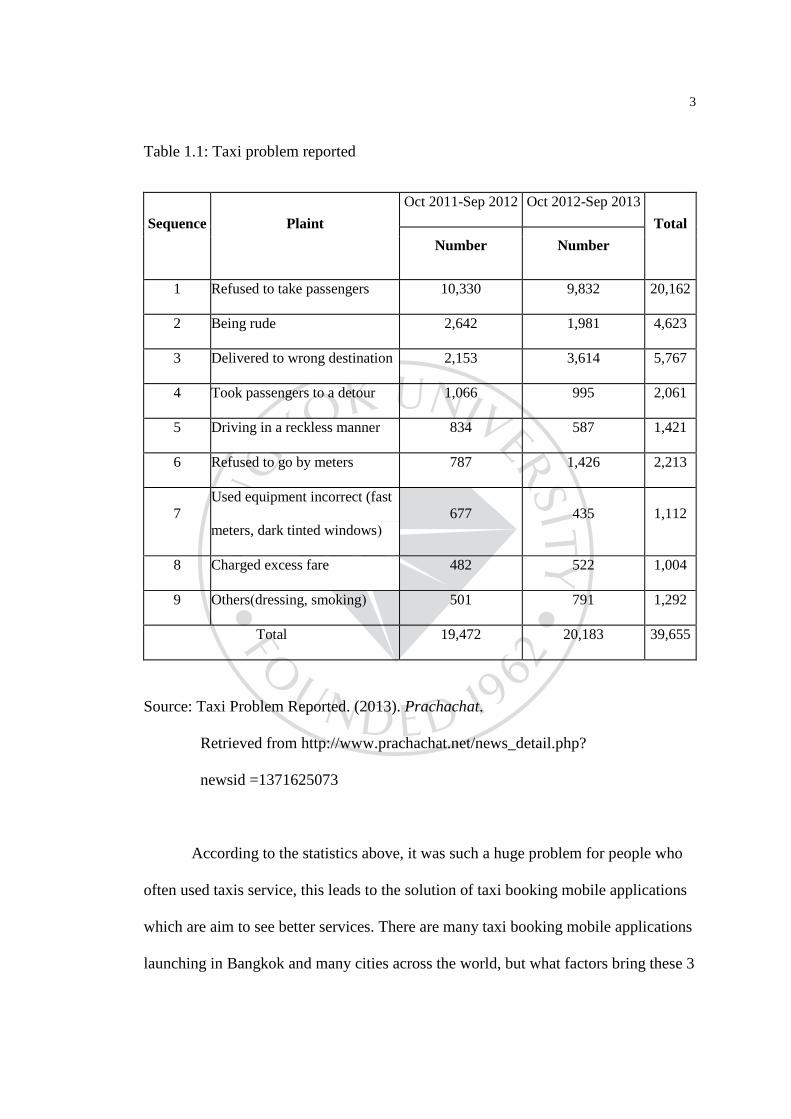
Table 1.1: Taxi problem reported
Sequence Plaint
Oct 2011-Sep 2012 Oct 2012-Sep 2013
Total
Number Number
1 Refused to take passengers 10,330 9,832 20,162
2 Being rude 2,642 1,981 4,623
3 Delivered to wrong destination 2,153 3,614 5,767
4 Took passengers to a detour 1,066 995 2,061
5 Driving in a reckless manner 834 587 1,421
6 Refused to go by meters 787 1,426 2,213
7
Used equipment incorrect (fast
meters, dark tinted windows)
677 435 1,112
8 Charged excess fare 482 522 1,004
9 Others(dressing, smoking) 501 791 1,292
Total 19,472 20,183 39,655
Source: Taxi Problem Reported. (2013). Prachachat.
Retrieved from http://www.prachachat.net/news_detail.php?
newsid =1371625073
According to the statistics above, it was such a huge problem for people who
often used taxis service, this leads to the solution of taxi booking mobile applications
which are aim to see better services. There are many taxi booking mobile applications
launching in Bangkok and many cities across the world, but what factors bring these 3
4
applications to be the top 3 taxi applications are. They might give the solution of
better taxi services or fulfill the customer satisfactions.
1.3 Intention and Reason for Study
In this research, the researcher’s purpose is to study the factors influencing
consumer brand choices of top 3 taxi booking mobile applications in Bangkok: Uber,
GrabTaxi and Easy Taxi. Another reason is that researcher is interested in the idea of
business startup in transportation field and technology of new generation who notices
the weakness of the current system and uses the creative ideas and technologies to
solve the problem.
1.4 Research Objectives
The objective of this research could be separated into 3 major objectives:
1. To study the marketing factors influencing consumer brand choices of top 3
taxi booking mobile applications in Bangkok: Uber, GrabTaxi and Easy Taxi.
2. To study consumer behaviors influencing consumer brand choices of top 3
taxi booking mobile applications in Bangkok: Uber, GrabTaxi and Easy Taxi.
1.5 Research Questions
1. What is the most influential factor in marketing mix toward consumer brand
choices of top 3 taxi booking mobile applications in Bangkok: Uber, Grabtaxi
and Easy Taxi?

5
2. Is social media and influential people related to their purchasing decision of
top 3 taxi booking mobile applications in Bangkok: Uber, GrabTaxi and Easy
Taxi?
3. Is the role or function of application important for brand choice?
1.6 Scope of Study
The questionnaires which concern with the consumer brand choices by focusing
on the possible mode such as marketing mix (7Ps), applications, brand name,
consumer behavior and demographic will be used in this independent study.
The researcher uses questionnaire as an instrument of survey and defined the
scope of study as follow:
1.6.1 Scope of Content
In this study, the researcher examined and identified the relationship of
marketing mix, mobile application, brand, and consumer behaviors toward top
3 taxi booking mobile applications: Uber, GrabTaxi and Easy Taxi in
Bangkok, Thailand. This study is a quantitative research based on the concept
of the factor influencing consumer brand choices as well as related research.
1.6.2 Scope of Demographic, Samples and Location.
The researcher identified population and sample as taxi passengers
located in Bangkok, Thailand. This research will be survey on the people who

6
have used or often used the taxi booking mobile applications: Uber, GrabTaxi
and Easy Taxi within Bangkok.
1.6.3 Scope of Related Variables.
In this study, variables are presented accordingly to the proposed
hypothesis as follow;
Dependent variable
Consumer brand choice of top 3 taxi booking mobile applications in Bangkok
Independent variable
H1 Service
H2 Price
H3 Place
H4 Promotion
H5 Physical evidence
H6 Process
H7 People
H8 Mobile Application
H9 Brand Name
H10 Consumer Behavior
7
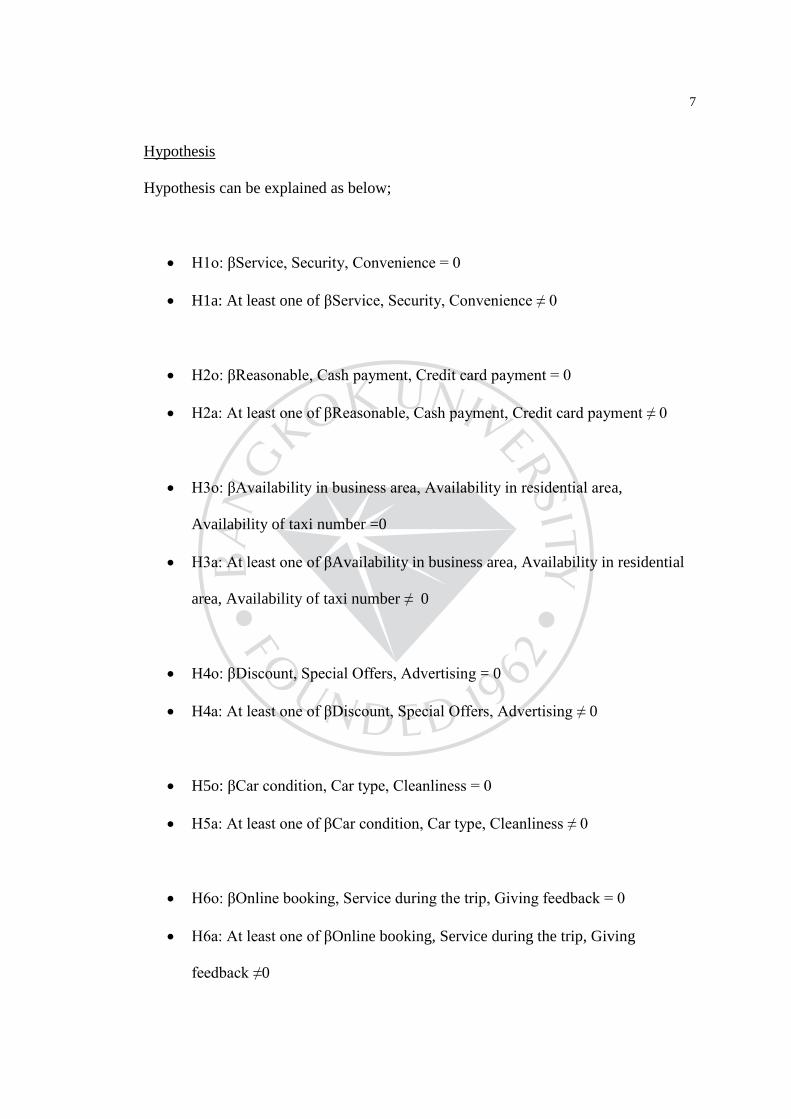
Hypothesis
Hypothesis can be explained as below;
H1o: βService, Security, Convenience = 0
H1a: At least one of βService, Security, Convenience ≠ 0
H2o: βReasonable, Cash payment, Credit card payment = 0
H2a: At least one of βReasonable, Cash payment, Credit card payment ≠ 0
H3o: βAvailability in business area, Availability in residential area,
Availability of taxi number =0
H3a: At least one of βAvailability in business area, Availability in residential
area, Availability of taxi number ≠ 0
H4o: βDiscount, Special Offers, Advertising = 0
H4a: At least one of βDiscount, Special Offers, Advertising ≠ 0
H5o: βCar condition, Car type, Cleanliness = 0
H5a: At least one of βCar condition, Car type, Cleanliness ≠ 0
H6o: βOnline booking, Service during the trip, Giving feedback = 0
H6a: At least one of βOnline booking, Service during the trip, Giving
feedback ≠0
8
H7o: βFriendliness and Politeness, Knowledge and skill, Trust and credibility
= 0
H7a: At least one of βFriendliness and Politeness, Knowledge and skill, Trust
and credibility ≠ 0
H8a: βSimplicity, Clear, user-friendly navigation, Good use of color, Well-
formatted content, Speed/ Fast load time, Professional web/app design = 0
H8o: At least one of βSimplicity, Clear, user-friendly navigation, Good use of
color, Well-formatted content, Speed/ Fast load time, Professional web/app
design ≠ 0
H9o: βBrand Awareness , Brand Loyalty, Brand Reputation = 0
H9a: At least one of βBrand Awareness , Brand Loyalty, Brand Reputation ≠ 0
H10o: βEconomic situation , Lifestyles, Influential people, Social network,
Social trend = 0
H10a: At least one of βEconomic situation , Lifestyles, Influential people,
Social network, Social trend ≠ 0
The research has been conducted between October2015 – January2016 based
in Bangkok, Thailand.
9
1.7 Limitations of Research
To study and research the topic of Factors Influencing Consumer Brand Choice of
Top 3 Taxi Booking Mobile Applications in Bangkok: Uber, GrabTaxi and Easy Taxi,
the researcher has to make a clear focus and limitation on the independent variables
that will positively or negatively influence the dependent variable so as to keep the
study and research within the specific research structure. The study is confined by
focusing on only three brand taxi booking mobile applications which are Uber,
GrabTaxi and Easy Taxi in Bangkok, Thailand.
In Bangkok, most of the people knew taxi booking mobile applications but
there are still not many people using taxi booking mobile applications because people
are get used to call taxi by traditional way which can be the obstacle to find attendant
of the survey. Furthermore, in researching and collecting information, the researcher
finds that 50% of the information that can be used in conducting this study is in Thai
language which is not the researcher’s first language. The researcher translated the
information from Thai to English and tried to maintain the meanings as much as
possible.
1.8 Assumptions
The main factors which are service, price, place, promotion, car condition,
process, driver, mobile application, brand name and consumer behavior could affect
consumer’s brand choice among 3 taxi booking mobile applications Uber, GrabTaxi
and Easy Taxi in Bangkok, Thailand.

10
1.9 Benefits of Research
- To have a better understanding the relationship between main factors
(service, price, place, promotion, car condition, process, driver, mobile
application, brand and consumer behavior) toward consumer brand choice
to choose services among three taxi booking mobile applications in
Bangkok, Thailand.
- To provide the research information to who need to develop more effective
taxi booking mobile applications, to decrease and to solve the problem in
using taxi and public transportation
- To study and analyze the difference of the service among Uber, Grabtaxi
and Easy Taxi.
- The research result could be useful for marketing expert who interested to
understand the behavior of Thai taxi’s consumers.

11
CHAPTER 2
LITERATURE REVIEW
2.1 Introduction
This paper is focusing on factor influencing consumer brand choice. The
researcher starts this chapter by studying on mobile applications and taxi booking
mobile applications which are related to the topic of this research. In taxi booking
mobile applications topic, Uber, GrabTaxi and Easy Taxi will be defined and studied.
After that, brand, consumer behavior and marketing mix (7Ps) will be examined. And
last, conceptual framework will be conducted and make clear overview of this
research.
2.2 Mobile Applications
The American Dialect Society voted “app” (noun, an abbreviated form of
application, a software program for a computer or phone operating system) as the
word of the year for 2010.
The researcher followed the definition defined by Wigmore I. (2013) that a
mobile app is a software application developed specifically for use on small, wireless
computing devices, such as smartphones and tablets, rather than desktop or laptop
computers. These mobile apps are built to make things easier for the users; they have
12
different design and color from their website template. Moreover, they are designed
for user-friendly site navigation and high speed load time.
2.3 Taxi Booking Mobile Applications
2.3.1 Uber
Uber is a taxi E-hailing mobile application established Travis Kalanick, the
Co-founder and Chief Executive Officer and Garrett M. Camp, the Co-founder and
Chairman of Uber since March 2009, which headquartered in San Francisco,
California. The Uber service is now available in 311 cities and 58 countries around
the world. (Travis, 2015) The concept of this app is to submit trip request from the
passenger’s smart phone and send to nearest Uber driver who use his own car. Uber
will track the Uber car to pick passengers up by location from their smart phone.
When the passengers reach their destination, they can rate scores of the driver and the
driver can also do the same. A receipt will be automatically sent to their email.
2.3.2 Grabtaxi
GrabTaxi is one of the most popular taxi booking mobile applications in
Thailand. It is an automated location based smartphone booking and dispatch platform
for the taxi industry, now operates in 6 countries in the South-east Asia which are
Malaysia, Philippines, Thailand, Singapore, Vietnam, and Indonesia. (GrabTaxi, n.d.)
13
GrabTaxi was officially launched to the public on June 2012. As of March 2015, the
number of taxi drivers registered in the network has increased to 75,000 and currently
seven bookings were made every second. Now it reached a total number of 3.8
million mobile application users across Southeast Asia. (GrabTaxi, n.d.) Their
purpose is to promote and introduce cost effectiveness and simplicity of mobile-based
technology to both taxi company side and passenger side. Their principle is “Safety,
Certainty and Speed”.
2.3.3 Easy Taxi
Easy Taxi is a mobile E-hailing application founded in 2011 by four founders:
Tallis Gomes, Daniel Cohen, Vinicius Gracia and Marcio William. The company
official launched the app in April 2012. In the beginning, Rio de Janeiro was a test
market, while its headquarters is in Sao Paulo, Brazil. Within the first year of
operations, the company got more than 5000 drivers and 200,000 downloads.
(Redação, 2013) Now it is available in 30 countries, 420 cities (Easy Taxi, Abdul
Hannan Tago, 2014). As of December 2014, the company reached 17 million users
and more than 400,000 taxi drivers joined with an Easy Taxi network.(Guimarães,
2013)
14
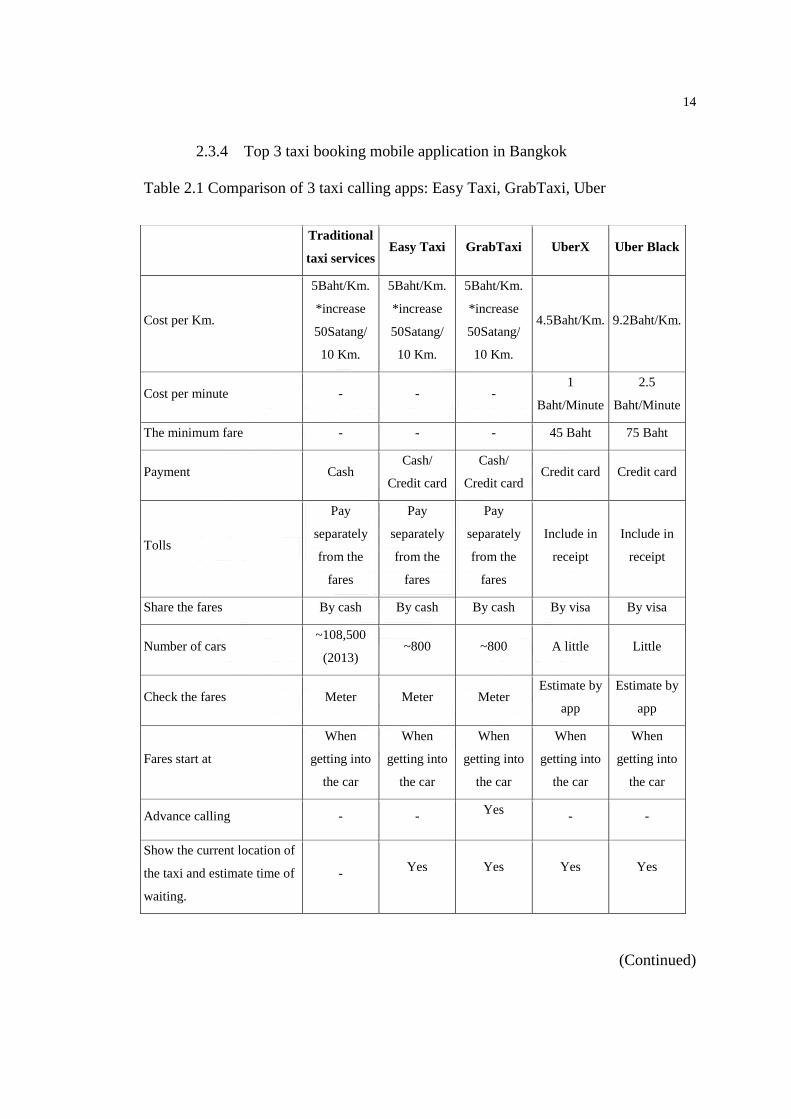
2.3.4 Top 3 taxi booking mobile application in Bangkok
Table 2.1 Comparison of 3 taxi calling apps: Easy Taxi, GrabTaxi, Uber
(Continued)
Traditional
taxi services Easy Taxi GrabTaxi UberX Uber Black
Cost per Km.
5Baht/Km.
*increase
50Satang/
10 Km.
5Baht/Km.
*increase
50Satang/
10 Km.
5Baht/Km.
*increase
50Satang/
10 Km.
4.5Baht/Km. 9.2Baht/Km.
Cost per minute - - - 1
Baht/Minute
2.5
Baht/Minute
The minimum fare - - - 45 Baht 75 Baht
Payment Cash Cash/
Credit card
Cash/
Credit card Credit card Credit card
Tolls
Pay
separately
from the
fares
Pay
separately
from the
fares
Pay
separately
from the
fares
Include in
receipt
Include in
receipt
Share the fares By cash By cash By cash By visa By visa
Number of cars ~108,500
(2013) ~800 ~800 A little Little
Check the fares Meter Meter Meter Estimate by
app
Estimate by
app
Fares start at
When
getting into
the car
When
getting into
the car
When
getting into
the car
When
getting into
the car
When
getting into
the car
Advance calling - - Yes
- -
Show the current location of
the taxi and estimate time of
waiting.
- Yes Yes Yes Yes

15
Table 2.1(Continued): Comparison of 3 taxi calling apps: Easy Taxi, GrabTaxi, Uber
Source: Gimme. (2014). Comparison of 3 taxi calling apps: Easy Taxi, Grabtaxi,
Uber. Retrieved from http://droidsans.com/compare-taxi-caller-apps-
easytaxi-grabtaxi-uber
There are a lot of Taxi booking apps in Bangkok, such as GrabTaxi, Easy
Taxi, Uber, All Thai Taxi and Smart Taxi. (Five Apps, Ramirez, 2015) However,
most of people still get used to traditional taxi service. In this research studies top 3
most often used apps which are GrabTaxi, Easy Taxi, Uber. Table 2.1 is the
comparison of offline
Traditional
taxi services Easy Taxi GrabTaxi UberX Uber Black
Able to share trip
information - - Yes Yes Yes
Feedback - Yes Yes Yes Yes
Android - Google play Google play Google play Google play
iOS - iTunes iTunes iTunes iTunes
Windows Phone - Windows
Phone
Windows
Phone
Windows
Phone
Windows
Phone
Taxi booking fees 20 Baht 20 Baht 25 Baht - -
Fares at 0-1 Km. 35 Baht 35 Baht 35 Baht 25 Baht 45 Baht
Car types Taxi Taxi Taxi
Normal car
with black
coloured
registration
plate
Limousine
with green
coloured
registration
plate
taxi service and top 3 apps, for Uber it was categorized into 2
types: Uber X and Uber Black.
16
2.4 Brand
For customer view, brand is an important part that shows the value of any
products or companies. It is perceptions that represent a company, product or service;
plus, it is the essence or promise of what will be delivered or experienced. Brand also
refers to a name, term, design, logo, symbol or audio jingle. (Brand, n.d.) Brand can
identify the image and uniqueness of the products and differentiate themselves from
competitors. It also contains a level of credibility, quality, and satisfaction.
2.4.1 Brand Awareness
Awareness is the ability to perceive, to feel, or to be conscious of
events, objects, thoughts, emotions, or sensory patterns. (Brand
awareness, n.d.)
Brand awareness refers to the strength of a brand’s presence in the
consumer’s mind. Brand awareness can provide a host of competitive
advantages for the marketer. These include the following (Aaker, 1996):
Brand awareness renders the brand with a sense of familiarity.
Name awareness can be a sign of presence, commitment and
substance.
The salience of a brand will decide if it is recalled at a key time in the
purchasing process.
Brand awareness is an asset that can be inordinately durable and thus
sustainable.

17
Brand awareness can influence consumer loyalty and decision-
making by affecting the establishing and strength of brand image.
2.4.2 Brand Loyalty
Being loyal is when you say no to other brands in the same
product-category even if they are better than the brand you choose.
Loyalty gives an advantage to the firms, as they can handle competition in
lower price and develop the products much better when having loyal
consumers
Brand loyalty is important for several reasons such as reducing the
production cost due to sales volume is high, spending less money on
advertising, using premium price for increasing profit margin and word of
mouth by loyal customers. It is very important to have loyal customers,
company need to point out the advantage of the product over competitor’s
one.
18
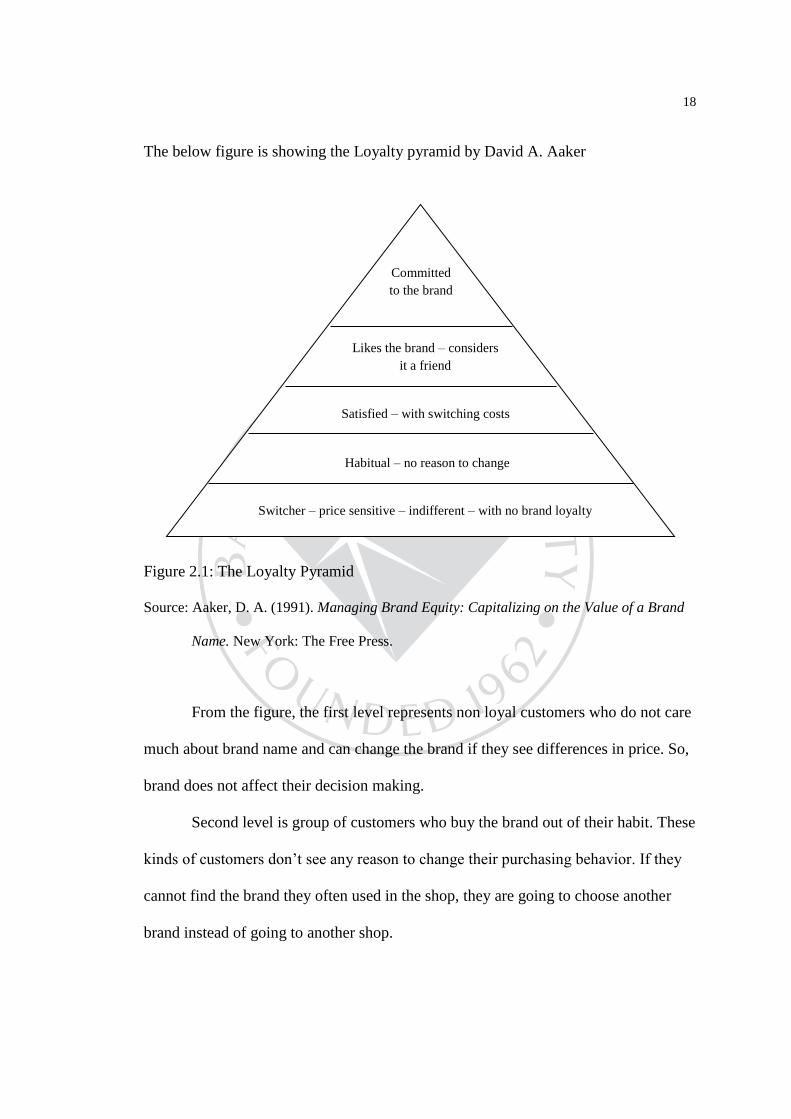
The below figure is showing the Loyalty pyramid by David A. Aaker
Figure 2.1: The Loyalty Pyramid
Source: Aaker, D. A. (1991). Managing Brand Equity: Capitalizing on the Value of a Brand
Name. New York: The Free Press.
From the figure, the first level represents non loyal customers who do not care
much about brand name and can change the brand if they see differences in price. So,
brand does not affect their decision making.
Second level is group of customers who buy the brand out of their habit. These
kinds of customers don’t see any reason to change their purchasing behavior. If they
cannot find the brand they often used in the shop, they are going to choose another
brand instead of going to another shop.
Committed
to the brand
Likes the brand – considers
it a friend
Satisfied – with switching costs
Habitual – no reason to change
Switcher – price sensitive – indifferent – with no brand loyalty
19
Third, it consists of satisfied customers with switching cost.
Forth level is all about emotion, quality and experience, customers are truly
like the brand and logo, they have good perception on the brand or they have a long
term relationship with the brand.
Last, it represents committed customers who proud to use the brand. For them,
brand can express their personality and they also give recommendation to others.
2.5 Consumer Behavior
As defined by Kuester, Sabine (2012), consumer behavior is the study of
individuals, groups, or organizations and the processes they use to select, secure, use,
and dispose of products, services, experiences, or ideas to satisfy needs and the
impacts that these processes have on the consumer and society.
From Lynn R. Kahle, Angeline G. Close’s study (as cited in Asaad Ali Karam),
consumer behavior blends elements from psychology, sociology, social anthropology,
marketing and economics. It helps business people to understand the decision-making
processes of buyers, both individually and in groups such as how emotions affect
purchasing behavior. It studies characteristics of individual consumers such
as demographics and behavioral variables in an attempt to understand customer’s
need. It also assesses influences on the consumer from groups such as family, friends,
sports, reference groups, and society in general.
20
2.6 Marketing Mix (7Ps)
Marketing mix is a marketing strategy tools which often crucial when
determining a product or brand's offer, and is often associated with the four Ps. A
four Ps classification was presented by the marketing expert E. Jerome McCarthy in
1960, which consists of product, price, promotion and place. The "seven Ps" is a
marketing model added to the four Ps mentioned above. It’s including physical
evidence, people, and process. It is used when the relevant product is a service, not a
physical good.
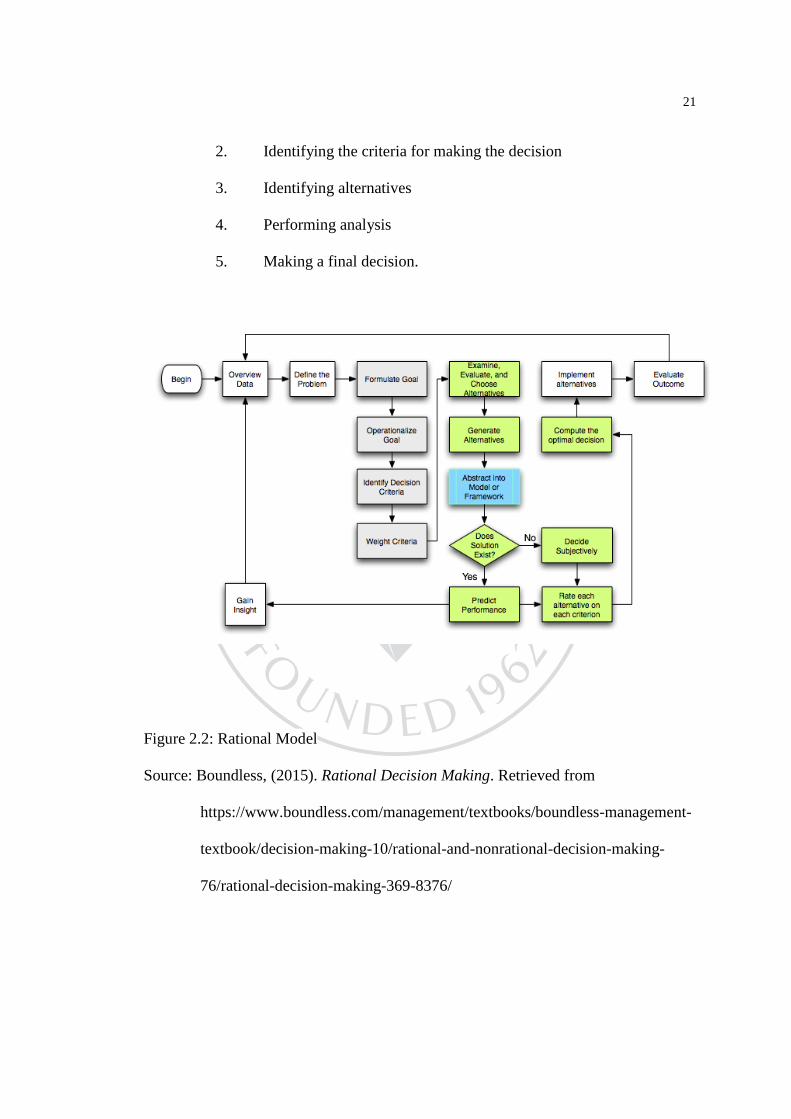
2.7 Rational Model
The rational model is the process of realizing a problem, establishing and
evaluating planning criteria, creating alternatives, implementing alternatives, and
monitoring progress of the alternatives. It is used in designing neighborhoods, cities,
and regions. The rational planning model is central in the development of modern
urban planning and transportation planning. The very similar rational decision-making
model, as it is called in organizational behavior is a process for making logically
sound decisions. (Robbins, Stephen, & Judge, 2007)
This multi-step model aims to be logical and follows the orderly path from
problem identification through solution.
1. Formulating a goal(s)
21
2. Identifying the criteria for making the decision
3. Identifying alternatives
4. Performing analysis
5. Making a final decision.
Figure 2.2: Rational Model
Source: Boundless, (2015). Rational Decision Making. Retrieved from
https://www.boundless.com/management/textbooks/boundless-management-
textbook/decision-making-10/rational-and-nonrational-decision-making-
76/rational-decision-making-369-8376/

22
2.8 Research Framework
Service - Service
- Security
- Convenience
Price - Reasonable
- Pay by cash
- Pay by credit card
Place - Availability in business area
- Availability in residential area
- Availability of taxi number
Promotion - Discount
- Special offers
- Advertising
Physical Evidence - Car condition
- Car type
- Cleanliness
Process - Online booking
- Service during the trip
- Giving feedback
People - Friendliness and Politeness
- Knowledge and skill
- Trust and credibility
- Brand Awareness
- Brand Loyalty
- Brand Reputation
- Economic situation
- Lifestyles
- Influential people
- Social network
- Social trend
- Simplicity
- Clear, user-friendly navigation
- Good use of color
- Well-formatted content
- Speed/ Fast load time
- Professional web/app design
Consumer brand choice of
Top 3 Taxi Booking Mobile
Applications in Bangkok:
Uber, GrabTaxi, Easy Taxi
Marketing Mix (7Ps)
Consumer Behavior
Brand
Mobile Applications
Figure 2.3: Theoretical Framework

23
This research studies the relationship between marketing mix (7Ps), mobile
applications, consumer behavior, brand and demographic toward choices decision of
top 3 taxi booking mobile applications in Bangkok. There are four sets of independent
variable including marketing mix (7Ps), mobile applications, consumer behavior and
brand, and 1 dependent variable which is taxi brand choice. The questionnaire will be
made to be specific and conformity with conceptual framework.
Variable
Dependent variable
Consumer brand choice of top 3 taxi booking mobile applications in Bangkok
Independent variable
H1 Service
H2 Price
H3 Place
H4 Promotion
H5 Physical evidence
H6 Process
H7 People
H8 Mobile Application
H9 Brand Name
H10 Consumer Behavior
24
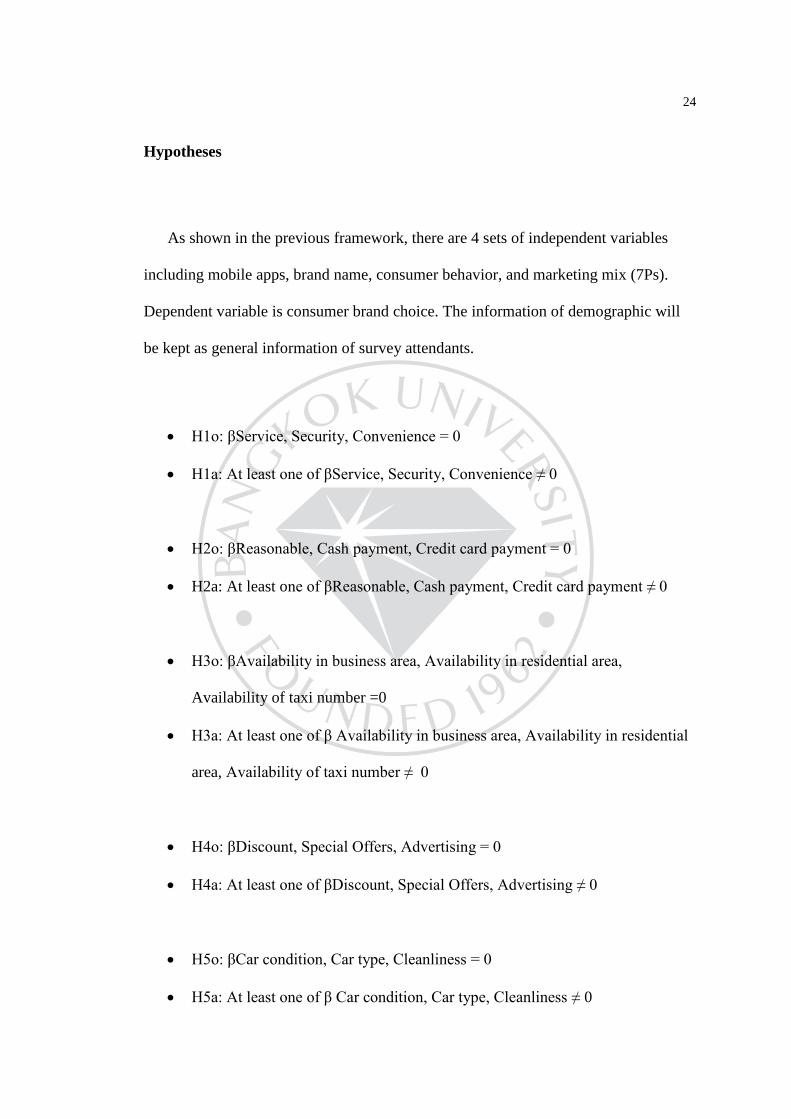
Hypotheses
As shown in the previous framework, there are 4 sets of independent variables
including mobile apps, brand name, consumer behavior, and marketing mix (7Ps).
Dependent variable is consumer brand choice. The information of demographic will
be kept as general information of survey attendants.
H1o: βService, Security, Convenience = 0
H1a: At least one of βService, Security, Convenience ≠ 0
H2o: βReasonable, Cash payment, Credit card payment = 0
H2a: At least one of βReasonable, Cash payment, Credit card payment ≠ 0
H3o: βAvailability in business area, Availability in residential area,
Availability of taxi number =0
H3a: At least one of β Availability in business area, Availability in residential
area, Availability of taxi number ≠ 0
H4o: βDiscount, Special Offers, Advertising = 0
H4a: At least one of βDiscount, Special Offers, Advertising ≠ 0
H5o: βCar condition, Car type, Cleanliness = 0
H5a: At least one of β Car condition, Car type, Cleanliness ≠ 0
25
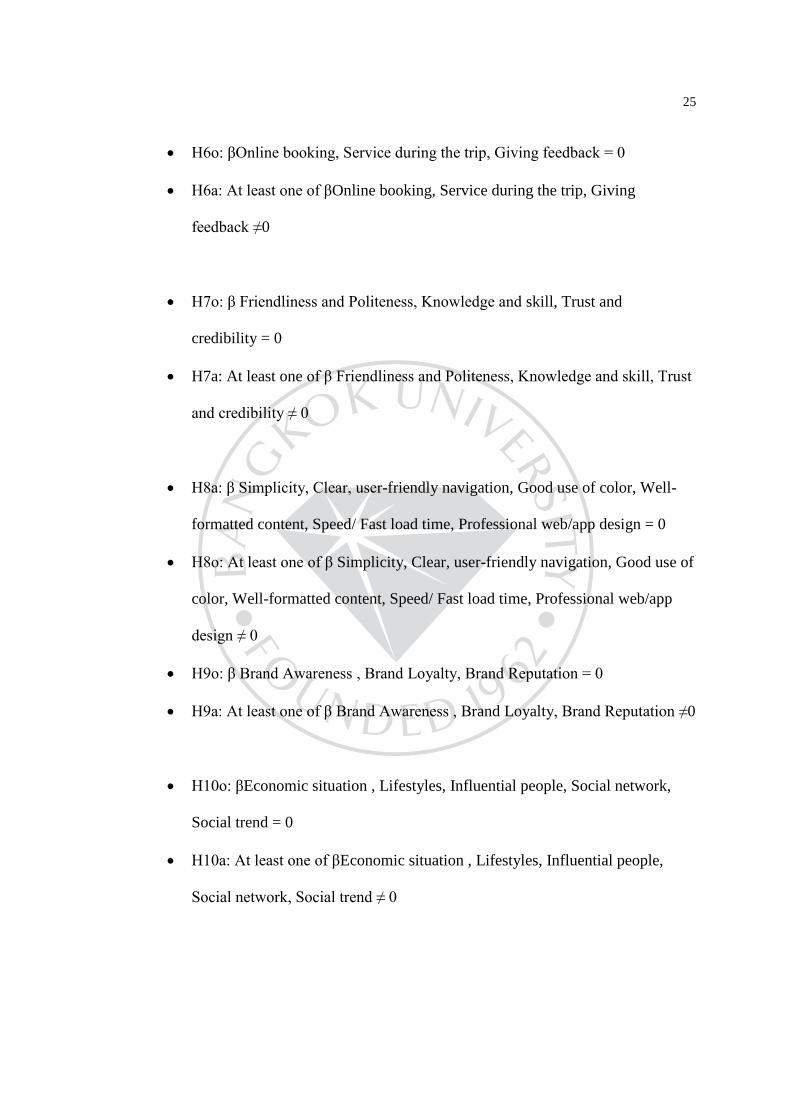
H6o: βOnline booking, Service during the trip, Giving feedback = 0
H6a: At least one of βOnline booking, Service during the trip, Giving
feedback ≠0
H7o: β Friendliness and Politeness, Knowledge and skill, Trust and
credibility = 0
H7a: At least one of β Friendliness and Politeness, Knowledge and skill, Trust
and credibility ≠ 0
H8a: β Simplicity, Clear, user-friendly navigation, Good use of color, Well-
formatted content, Speed/ Fast load time, Professional web/app design = 0
H8o: At least one of β Simplicity, Clear, user-friendly navigation, Good use of
color, Well-formatted content, Speed/ Fast load time, Professional web/app
design ≠ 0
H9o: β Brand Awareness , Brand Loyalty, Brand Reputation = 0
H9a: At least one of β Brand Awareness , Brand Loyalty, Brand Reputation ≠0
H10o: βEconomic situation , Lifestyles, Influential people, Social network,
Social trend = 0
H10a: At least one of βEconomic situation , Lifestyles, Influential people,
Social network, Social trend ≠ 0
26
CHAPTER 3
METHODOLOGY
In this chapter, the researcher explained research strategy and approaches used
in this independent study. The author also provides detail about population and
samples, variables, survey instruments, reliability and validity assessment, data
collection, and statistic for data analysis
3.1 Research Strategy
This research is a quantitative research, the researcher uses questionnaire as a
tool for data collecting process. According to Given, Lisa M. (2008), quantitative
research is the systematic empirical investigation of observable phenomena via
statistical, mathematical or computational techniques in natural sciences and social
sciences. The main purpose of the study is to examine and identify the main factor
influencing consumer brand choices of top 3 taxi booking mobile applications in
Bangkok: Uber, Grabtaxi and Easy Taxi.
27
3.2 Populations and Samples
Populations
Target group of this study is identified as the taxi passengers in Bangkok who have
used these 3 taxi apps: Uber, GrabTaxi, and Easy Taxi.
Samples
A sample from this study is user of Uber, GrabTaxi, and Easy Taxi in Bangkok. The
researcher aims to collect 400 samples of taxi app‟s user in Bangkok.
3.3 Variables and Hypothesis
In this study, the researcher presents variables accordingly to the proposed
variable and hypothesis as follow;
Dependent variable:
Consumer brand choice of top 3 taxi booking mobile applications in Bangkok
Independent variables:
H1. Service
H2. Price
H3. Place
H4. Promotion
H5. Car condition
H6. Physical environment
H7. Driver
28
H8. Mobile Application
H9. Brand Name
H10. Consumer Behavior
Hypothesis:
H1o: βService, Security, Convenience = 0
H1a: At least one of βService, Security, Convenience ≠ 0
H2o: βReasonable, Cash payment, Credit card payment = 0
H2a: At least one of βReasonable, Cash payment, Credit card payment ≠ 0
H3o: βAvailability in business area, Availability in residential area,
Availability of taxi number =0
H3a: At least one of β Availability in business area, Availability in residential
area, Availability of taxi number ≠ 0
H4o: βDiscount, Special Offers, Advertising = 0
H4a: At least one of βDiscount, Special Offers, Advertising ≠ 0
H5o: βCar condition, Car type, Cleanliness = 0
H5a: At least one of β Car condition, Car type, Cleanliness ≠ 0

29
H6o: βOnline booking, Service during the trip, Giving feedback = 0
H6a: At least one of βOnline booking, Service during the trip, Giving
feedback ≠0
H7o: β Friendliness and Politeness, Knowledge and skill, Trust and credibility
= 0
H7a: At least one of β Friendliness and Politeness, Knowledge and skill, Trust
and credibility ≠ 0
H8a: β Simplicity, Clear, user-friendly navigation, Good use of color, Well-
formatted content, Speed/ Fast load time, Professional web/app design = 0
H8o: At least one of βSimplicity, Clear, user-friendly navigation, Good use of
color, Well-formatted content, Speed/ Fast load time, Professional web/app
design ≠ 0
H9o: β Brand Awareness , Brand Loyalty, Brand Reputation = 0
H9a: At least one of β Brand Awareness , Brand Loyalty, Brand Reputation ≠0
H10o: β Economic situation , Lifestyles, Influential people, Social network,
Social trend = 0
H10a: At least one of β Economic situation , Lifestyles, Influential people,
Social network, Social trend ≠ 0

30
3.4 Survey Instruments
The researcher uses questionnaire which designed in line with the objectives
of the study as an instrument to collect data in order to examine and identify the
factors influencing consumer brand choices among 3 taxi booking applications: Uber,
GrabTaxi and Easy Taxi. The questions will be kept short and clear as possible as it
can be.
The questionnaire is divided into 4 parts.
The first part consists of general information.
The second part requires the information of marketing factors influencing
consumer brand choices.
The Third part deals with consumer behavior influencing consumer brand
choices.
The last part is demographic of the respondent which information collected
includes gender, age, career, income level, lifestyle, etc.
In part 1, there are 2 questions. First question requires the attendant to choose
the most used taxi application among Uber, GrabTaxi and Easy Taxi. The second
question requires attendant to rank the level of importance of the factors influencing
brand choices which are taxi service, price, place, promotion, car condition, process,
driver, mobile application, brand name and consumer behavior.

31
Table 3.1 : Level of Information Measurement and Criteria.
Question No. Level of Measurement
Criteria Classification
1 Nominal 1 = Uber
2 = GrabTaxi
3 = Easy Taxi
2 Scale 0 = No effect
1 = Not at all important
2 = Low important
3 = Slightly important
4 = Neutral
5 = Moderately important
6 = Very important
7 = Extremely important
The scale to measure part 1 which is general information has divided into 8
points scale as specified in the table above. For the measurement analysis, the interval
for breaking the range in measuring each variable can be calculated as follow;
Interval class =
Interval class =
32
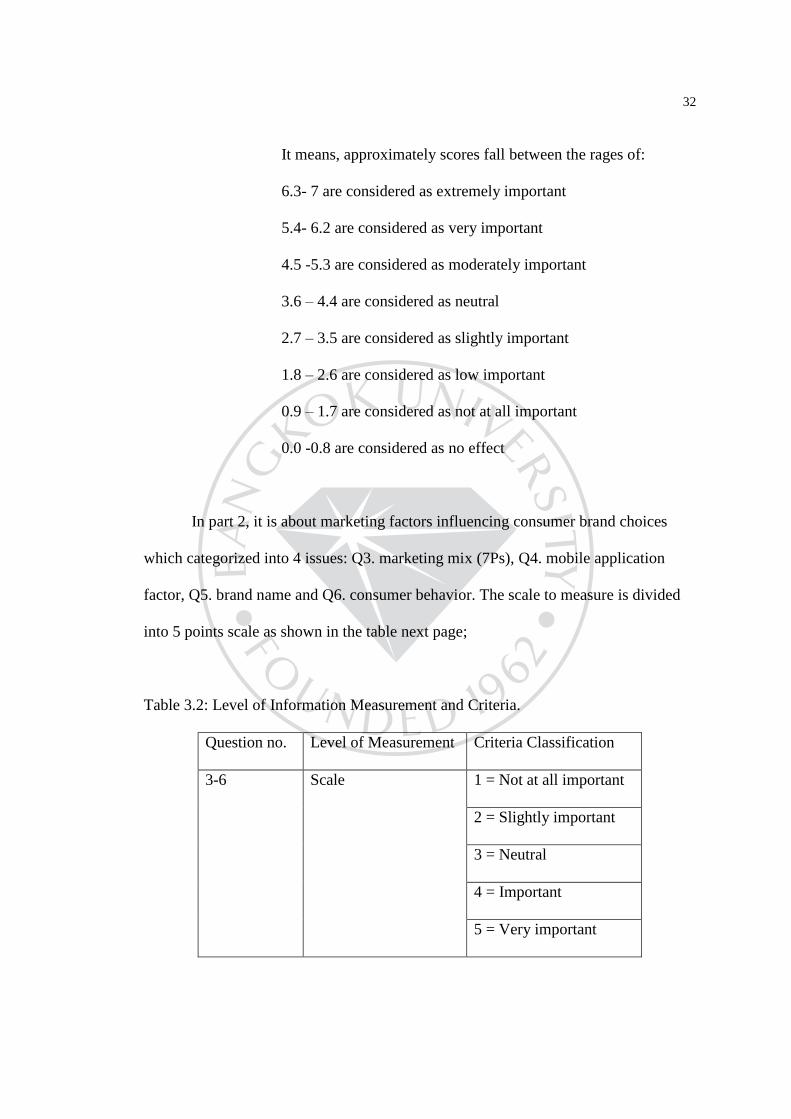
It means, approximately scores fall between the rages of:
6.3- 7 are considered as extremely important
5.4- 6.2 are considered as very important
4.5 -5.3 are considered as moderately important
3.6 – 4.4 are considered as neutral
2.7 – 3.5 are considered as slightly important
1.8 – 2.6 are considered as low important
0.9 – 1.7 are considered as not at all important
0.0 -0.8 are considered as no effect
In part 2, it is about marketing factors influencing consumer brand choices
which categorized into 4 issues: Q3. marketing mix (7Ps), Q4. mobile application
factor, Q5. brand name and Q6. consumer behavior. The scale to measure is divided
into 5 points scale as shown in the table next page;
Table 3.2: Level of Information Measurement and Criteria.
Question no. Level of Measurement Criteria Classification
3-6 Scale 1 = Not at all important
2 = Slightly important
3 = Neutral
4 = Important
5 = Very important

33
For the measurement analysis, the interval of part 2 can be calculated as
follow;
Interval class =
It means, approximately scores fall between the rages of:
4.21 – 5.00 are considered as very important
3.41 – 4.20 are considered as important
2.61 – 3.40 are considered as neutral
1.81 – 2.60 are considered as slightly important
1.00 – 1.80 are considered as not at all important
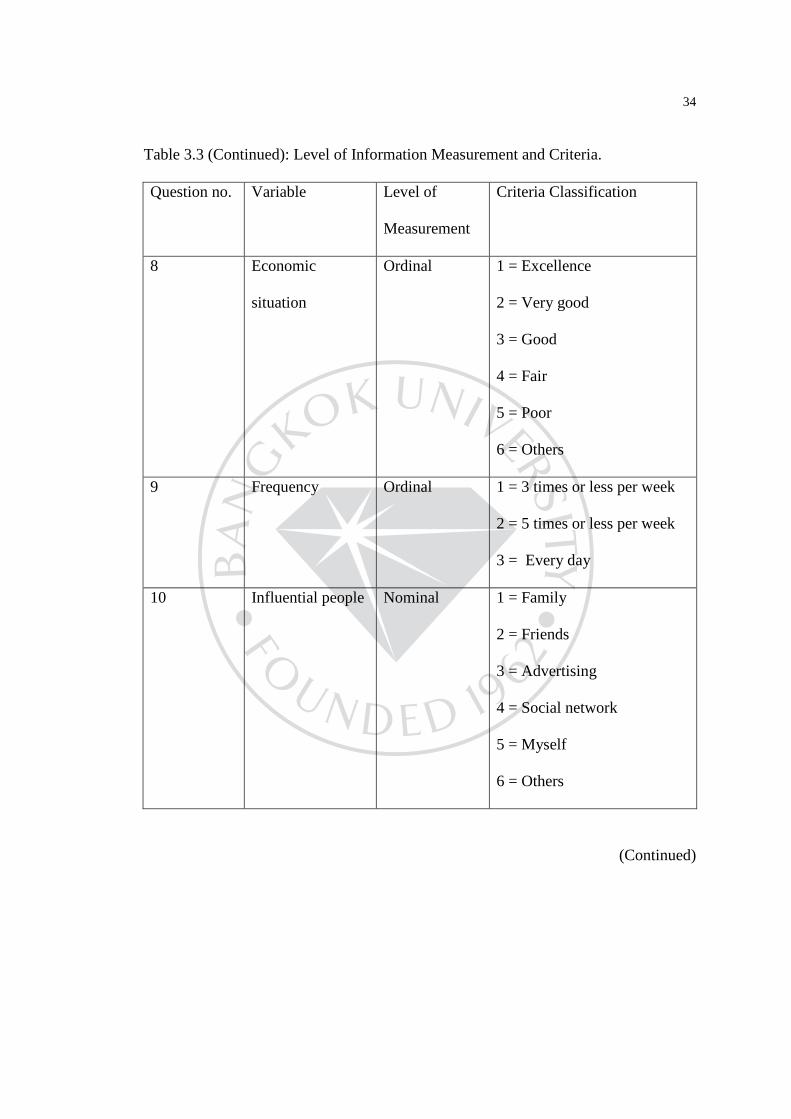
In part 3, attendants are asked to answer the question about consumer behavior
influencing consumer brand choices, such as economic situation, influential people,
social network, etc. There are 8 questions in this part regarding to the variables below;
Table 3.3: Level of Information Measurement and Criteria.
Question no. Variable Level of
Measurement
Criteria
Classification
7 Economic situation
affects decision
Nominal 1 = Yes
2 = No
(Continued)
34
Table 3.3 (Continued): Level of Information Measurement and Criteria.
Question no. Variable Level of
Measurement
Criteria Classification
8 Economic
situation
Ordinal 1 = Excellence
2 = Very good
3 = Good
4 = Fair
5 = Poor
6 = Others
9 Frequency Ordinal 1 = 3 times or less per week
2 = 5 times or less per week
3 = Every day
10 Influential people Nominal 1 = Family
2 = Friends
3 = Advertising
4 = Social network
5 = Myself
6 = Others
(Continued)
35
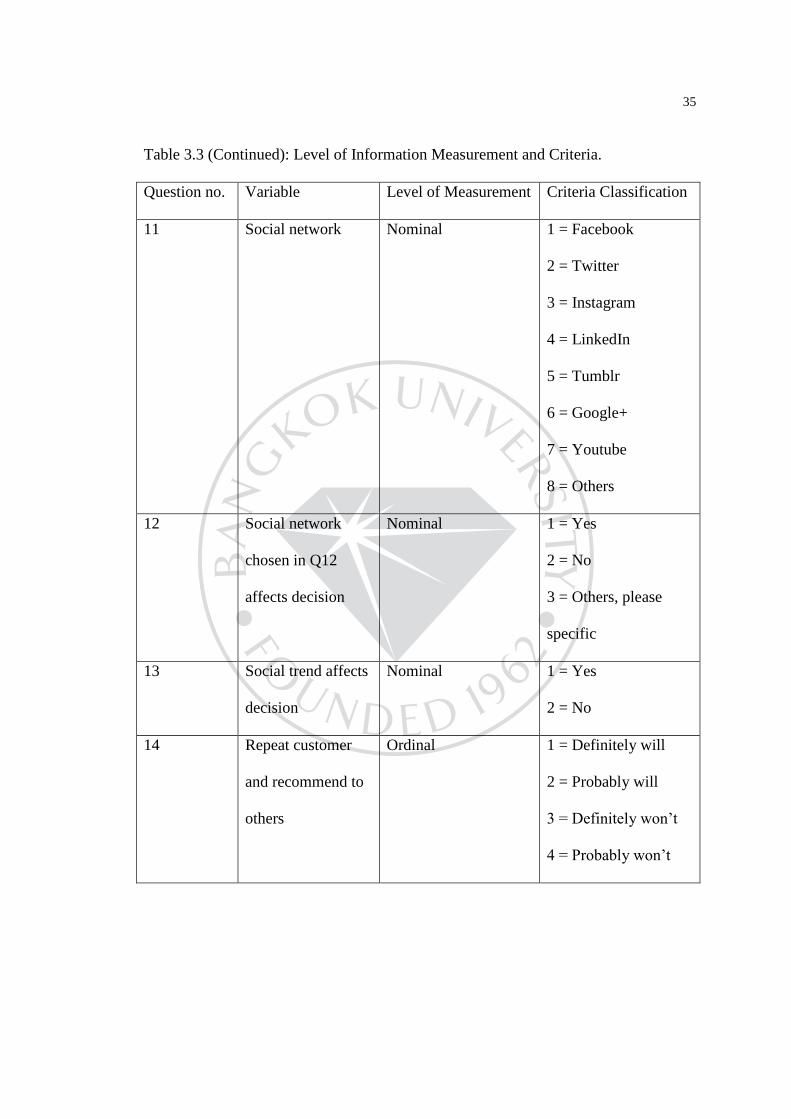
Table 3.3 (Continued): Level of Information Measurement and Criteria.
Question no. Variable Level of Measurement Criteria Classification
11 Social network Nominal 1 = Facebook
2 = Twitter
3 = Instagram
4 = LinkedIn
5 = Tumblr
6 = Google+
7 = Youtube
8 = Others
12 Social network
chosen in Q12
affects decision
Nominal 1 = Yes
2 = No
3 = Others, please
specific
13 Social trend affects
decision
Nominal 1 = Yes
2 = No
14 Repeat customer
and recommend to
others
Ordinal 1 = Definitely will
2 = Probably will
3 = Definitely won‟t
4 = Probably won‟t

36
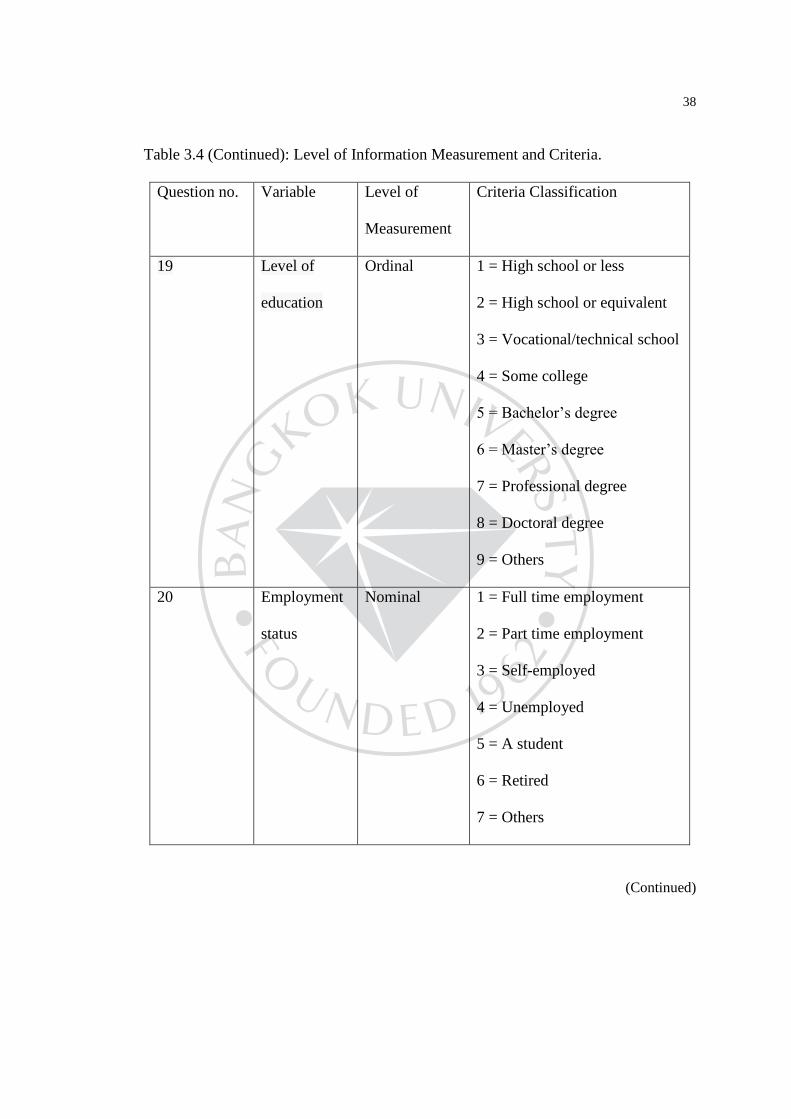
And the last part, the attendants are required to give personal information as
below table.
Table 3.4: Level of Information Measurement and Criteria.
Question no. Variable Level of
Measurement
Criteria Classification
15 Profession Nominal 1 = Accountant
2 = Photographer
3 = Officer
4 = Analyzer
5 = Customer service
6 = Business owner
7 = Teacher
8 = Employee
9 = Engineer
10 = Student
11 = Sales person
12 = Freelancer
13 = Retailer
14 = Others
(Continued)

37
Table 3.4 (Continued): Level of Information Measurement and Criteria.
Question no. Variable Level of
Measurement
Criteria Classification
16 Gender Nominal 1 = Male
2 = Female
17 Age Ordinal 1 = 20 and under
2 = 21-30
3 = 31-40
4 = 41-50
5 = 51-60
6 = 61 and over
18 Race Nominal 1 = White
2 = Asian
3 = Hispanic or Latino
4 = Black
5 = Others
(Continued)
38
Table 3.4 (Continued): Level of Information Measurement and Criteria.
Question no. Variable Level of
Measurement
Criteria Classification
19 Level of
education
Ordinal 1 = High school or less
2 = High school or equivalent
3 = Vocational/technical school
4 = Some college
5 = Bachelor‟s degree
6 = Master‟s degree
7 = Professional degree
8 = Doctoral degree
9 = Others
20 Employment
status
Nominal 1 = Full time employment
2 = Part time employment
3 = Self-employed
4 = Unemployed
5 = A student
6 = Retired
7 = Others
(Continued)
39
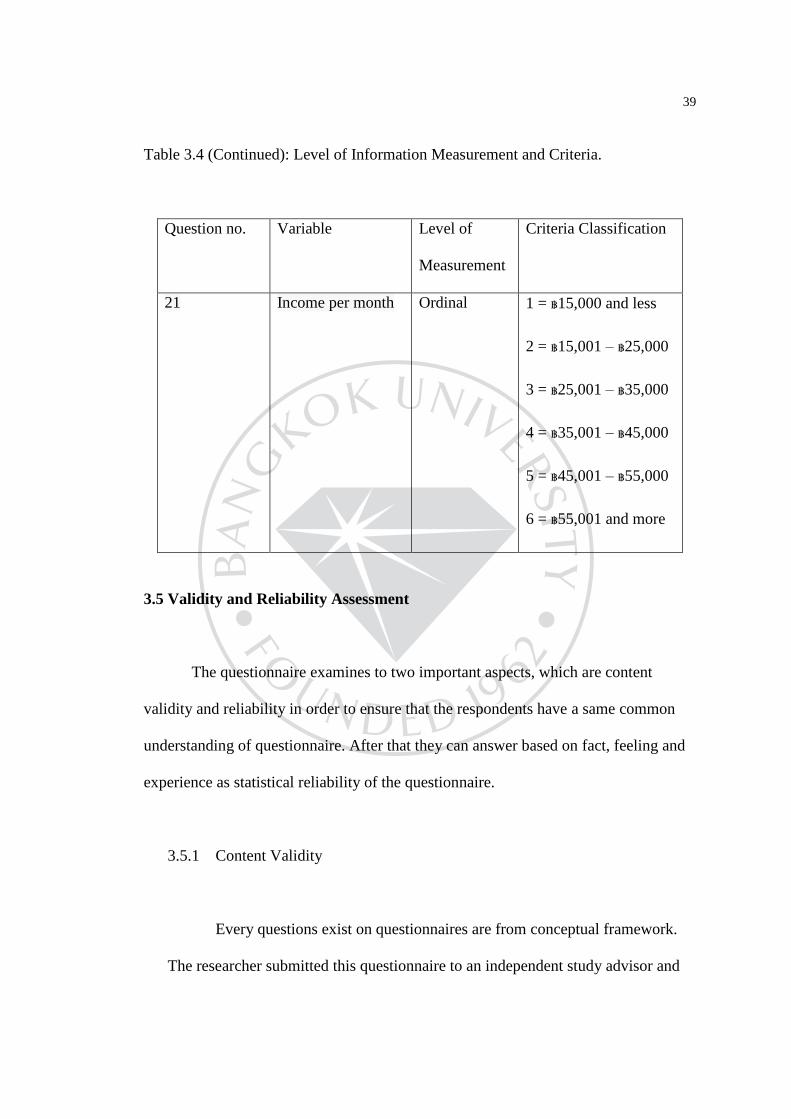
Table 3.4 (Continued): Level of Information Measurement and Criteria.
Question no. Variable Level of
Measurement
Criteria Classification
21 Income per month Ordinal 1 = ฿15,000 and less
2 = ฿15,001 – ฿25,000
3 = ฿25,001 – ฿35,000
4 = ฿35,001 – ฿45,000
5 = ฿45,001 – ฿55,000
6 = ฿55,001 and more
3.5 Validity and Reliability Assessment
The questionnaire examines to two important aspects, which are content
validity and reliability in order to ensure that the respondents have a same common
understanding of questionnaire. After that they can answer based on fact, feeling and
experience as statistical reliability of the questionnaire.
3.5.1 Content Validity
Every questions exist on questionnaires are from conceptual framework.
The researcher submitted this questionnaire to an independent study advisor and
40
three qualified experts who have experience in related field in order to ensure
content validity.
To prove the consistency of questions, the researcher uses Index of Item
Objective Congruence (IOC) method to calculate the consistency between
questions and objective as below:
IOC = consistency between the objective and content or questions and
objective.
ΣR = total assessment points given from all qualified experts.
N = number of qualified experts.
The consistency index value will be accepted at the value of 0.5 or
above.
After receiving assessment result, the questions have been chosen and
adapt to make sure that each question has the consistency index value more than
0.5. The assessment result of this questionnaire has the total consistency index
value equal to 0.978 with one question that has IOC index less than 0.5.
41
3.5.2 Reliability
The researcher launches 30 sets of online questionnaire to attendants as a
pilot test to examine the reliability of the questionnaire. The reliability test is
processed on IBM SPSS Statistics software by using Cronbach‟s alpha coefficient.
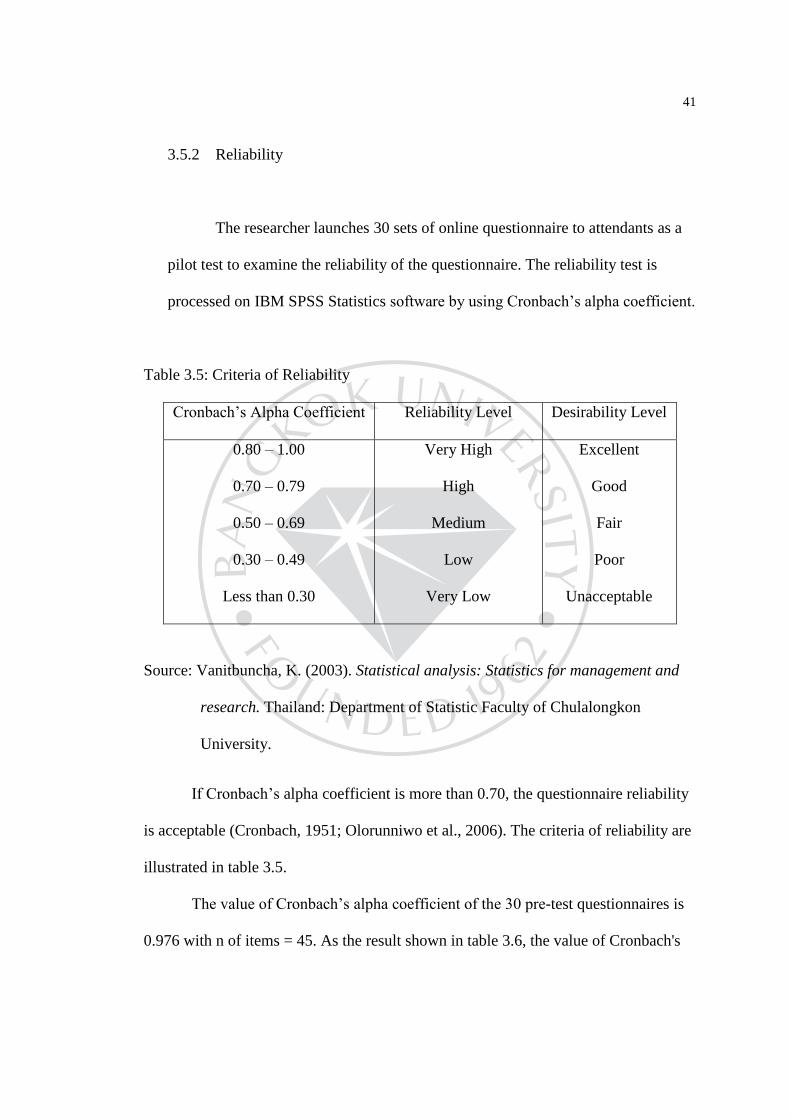
Table 3.5: Criteria of Reliability
Cronbach‟s Alpha Coefficient Reliability Level Desirability Level
0.80 – 1.00
0.70 – 0.79
0.50 – 0.69
0.30 – 0.49
Less than 0.30
Very High
High
Medium
Low
Very Low
Excellent
Good
Fair
Poor
Unacceptable
Source: Vanitbuncha, K. (2003). Statistical analysis: Statistics for management and
research. Thailand: Department of Statistic Faculty of Chulalongkon
University.
If Cronbach‟s alpha coefficient is more than 0.70, the questionnaire reliability
is acceptable (Cronbach, 1951; Olorunniwo et al., 2006). The criteria of reliability are
illustrated in table 3.5.
The value of Cronbach‟s alpha coefficient of the 30 pre-test questionnaires is
0.976 with n of items = 45. As the result shown in table 3.6, the value of Cronbach's
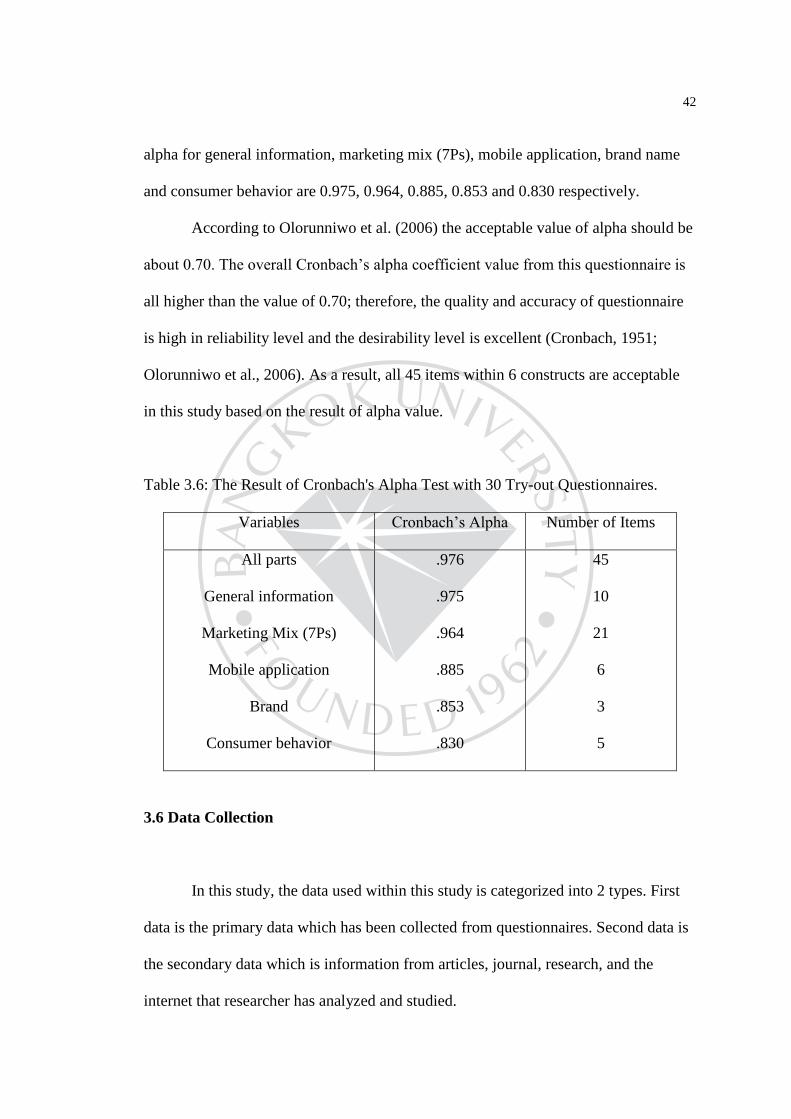
42
alpha for general information, marketing mix (7Ps), mobile application, brand name
and consumer behavior are 0.975, 0.964, 0.885, 0.853 and 0.830 respectively.
According to Olorunniwo et al. (2006) the acceptable value of alpha should be
about 0.70. The overall Cronbach‟s alpha coefficient value from this questionnaire is
all higher than the value of 0.70; therefore, the quality and accuracy of questionnaire
is high in reliability level and the desirability level is excellent (Cronbach, 1951;
Olorunniwo et al., 2006). As a result, all 45 items within 6 constructs are acceptable
in this study based on the result of alpha value.
Table 3.6: The Result of Cronbach's Alpha Test with 30 Try-out Questionnaires.
Variables Cronbach‟s Alpha Number of Items
All parts
General information
Marketing Mix (7Ps)
Mobile application
Brand
Consumer behavior
.976
.975
.964
.885
.853
.830
45
10
21
6
3
5
3.6 Data Collection
In this study, the data used within this study is categorized into 2 types. First
data is the primary data which has been collected from questionnaires. Second data is
the secondary data which is information from articles, journal, research, and the
internet that researcher has analyzed and studied.
43
Data collection has been done during October, 2015 to January, 2016 by
distributing the questionnaires to sample group who use taxi booking mobile
application in Bangkok via social media. The researcher divided the questionnaire
into four parts, which are general information, impact of marketing factors, impact of
consumer behavior and demographic.
3.7 Statistic for Data Analysis
Data analyzing process for this research is processed on a computer program
and presented on a format of table of content along with description on each table. As
for the statistic for data analysis, the researcher use;
1. Multinomial Logistic Regression method to analyze the relationship between
marketing mix, mobile application, brand, consumer behavior and consumer brand
choice
Anass Bayaga (2010) stated that the multinomial or polytomous logistic regression
model is a simple extension of the binomial logistic regression model. It is used when
the dependent variable has more than two nominal or unordered categories.
Why using multinomial logistic regression?
According to Greene (2012), in statistics, multinomial logistic regression is a
classification method that generalizes logistic regression to multiclass problems, i.e.
with more than two possible discrete outcomes. It is a model that is used to predict the
44
probabilities of the different possible outcomes of a categorically distributed
dependent variable, given a set of independent variables (which may be real-valued,
binary-valued, categorical-valued, etc.).
Multinomial logistic regression is applied to this research because the
dependent variable in question is nominal or equivalently categorical, meaning that it
falls into any one of a set of categories which cannot be ordered in any meaningful
way and for which there are more than two categories.
2. Factor analysis method to analyze the relationship between all factors and
consumer brand choice
Factor analysis is the data reduction tool that eliminates redundancy from a set
of correlated variables. It represents correlated variables with a smaller set of
“derived” variables.
Factors are formed that are relatively independent of one another. (Elizabeth,
2006) There are two types of variables:
latent variables: factors
- A variable that is not observable or is not directly measurable.
- A variable that is measured with error or can only be measured with
error.
45
- A latent variable can be used to represent a „true‟ variable which is
measured with error, or a single conceptual variable, or a construct which
is a summarization of a complex concept. (Wall, 2006)
observed variables
The observed variable is the measurement that is directly observed, and
some degree of random measurement error may exist such that the
observed score does not perfectly match the true scores. (Newsom, 2015)
Why using factor analysis?
Factor analysis is a technique that requires a large sample size. It is
based on the correlation matrix of the variables involved, and correlations
usually need a large sample size before they stabilize.
The researcher uses factor analysis method because is a method of data
reduction by seeking underlying unobservable variables (latent variable) that
are reflected in the observed variables (manifest variables). (Institute for
Digital Research and Education, n.d.)The researcher focuses on figuring out
the latent variables that drive brand choice decision which is unobservable.

46
3. Descriptive Statistics Analysis by using crosstabs to see frequency and
percentage to explain consumer behavior and demographic data
Descriptive statistics can be used to summarize the data which is categorical
by using the crosstabs procedures. To summarize the relationship between two
categorical variables, the researcher uses a cross-tabulation (also called a contingency
table). A cross-tabulation (or crosstab for short) is a table that depicts the number of
times each of the possible category combinations occurred in the sample data.
47
CHAPTER 4
RESEARCH FINDINGS AND DATA ANALYSIS
In this chapter, the researcher is presenting complete result and analysis of this
study. The results received from 400 questionnaires (online surveys) which are
conducted by conceptual framework and methodology in the previous chapter. The
results of consumer behavior influencing consumer brand choices of top 3 taxi
booking mobile applications in Bangkok: Uber, GrabTaxi and Easy Taxi will be
separate within three parts:
4.1 The analysis of multinomial logistic regression method to explain the
significant of general information (7 Likert scale)
4.2 The factor analysis of marketing mix (7Ps), mobile application, brand and
consumer behavior. (5 Likert scale)
4.3 The analysis of consumer behavior and demographic (Multiple choice)
4.1 The analysis of multinomial logistic regression method to explain the
significant of general information (7 Likert scale)
In this part, the researcher will apply multinomial logistic regression to
analyze data.
As mentioned in chapter 3, in statistics, multinomial logistic regression is a
classification method that generalizes logistic regression to multiclass problems, i.e.
with more than two possible discrete outcomes. It is a model that is used to predict the
probabilities of the different possible outcomes of a categorically distributed

48
dependent variable, given a set of independent variables (which may be real-valued,
binary-valued, categorical-valued, etc.).
Multinomial logistic regression is applied to this research because the
dependent variable in question is nominal or equivalently categorical, meaning that it
falls into any one of a set of categories which cannot be ordered in any meaningful
way and for which there are more than two categories.
Table 4.1: Hypothesis test: Model Fitting Information
Model
Model Fitting Criteria Likelihood Ratio Tests
-2 Log Likelihood Chi-Square df Sig.
Null 846.796
Final 10.962 835.834 98 .000
Table 4.2: Hypothesis test: Likelihood Ratio Tests
Effect Model Fitting
Criteria
Likelihood Ratio Tests
-2 Log Likelihood
of Reduced Model
Chi-Square df Sig.
product 281.363a 270.402 14 .000
price 247.908a 236.946 14 .000
(Continued)

49
Table 4.2 (Continued) : Hypothesis test: Likelihood Ratio Tests
Effect Model Fitting
Criteria
Likelihood Ratio Tests
-2 Log Likelihood
of Reduced Model
Chi-Square df Sig.
promotion 22.066a 11.105 12 .520
physical evidence 150.213a 139.252 14 .000
process 40.979a 30.017 14 .008
people 317.511 306.549 12 .000
mobile application 300.552 24.166 14 .044
brand 494.917 218.530 14 .000
consumer behavior 364.615 88.229 14 .000
From table 4.2, there are 10 factors analyzed in this part:
Dependent variable
Consumer brand choice of top 3 taxi booking mobile applications in Bangkok
Independent variable
H1 Service
H2 Price
H3 Place
H4 Promotion
50
H5 Physical evidence
H6 Process
H7 People
H8 Mobile Application
H9 Brand Name
H10 Consumer Behavior
The result is that the model significantly fit the data very well (p-value<.05) and
LRT also shows that most variables significantly impact taxi brand choices (p-
value<.05) except promotion and place (availability).
Marketing Mix (7Ps)
According to result, we can reject null hypothesis meaning product or service has
significant on consumer brand choice by the result is statistically significant equal
0.000, price has significant on consumer brand choice by the result is statistically
significant equal 0.000, physical evidence has significant on consumer brand choice
by the result is statistically significant equal 0.000, process has significant on
consumer brand choice by the result is statistically significant equal 0.008, people has
significant on consumer brand choice by the result is statistically significant equal
0.000. Most components have enough evidence to reject with mean score on the
standard test at 0.05 significance level.
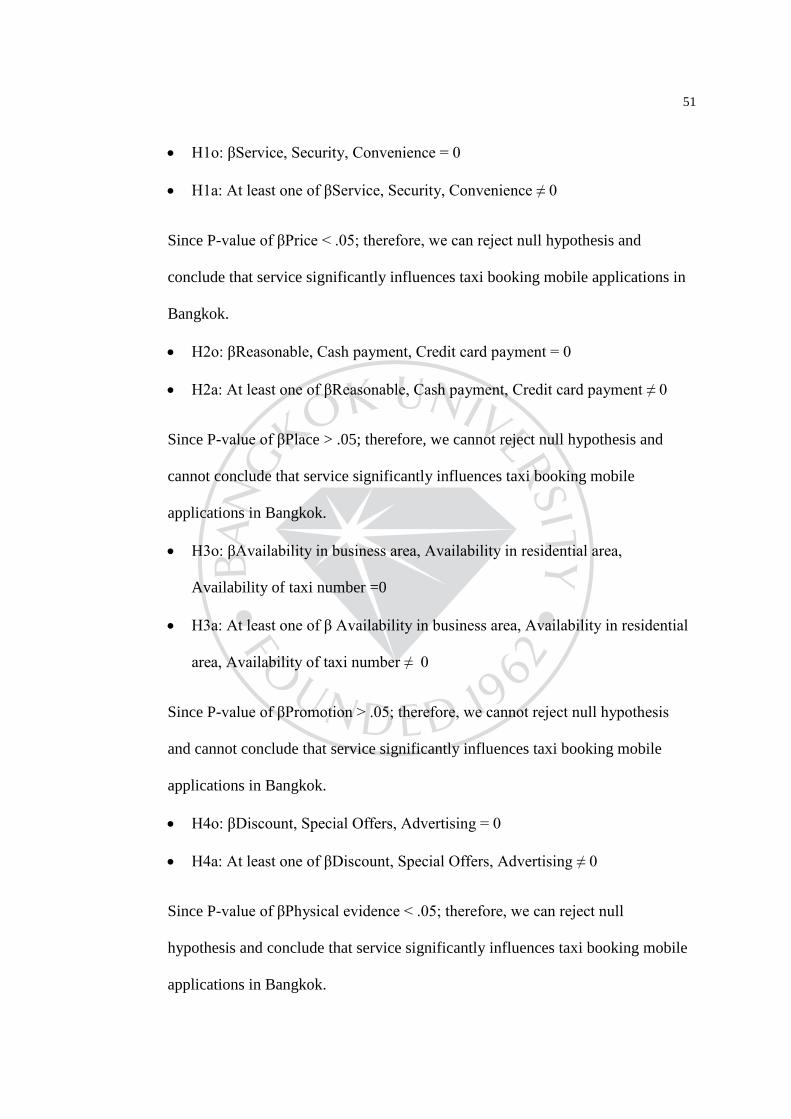
Since P-value of βService < .05; therefore, we can reject null hypothesis and
conclude that service significantly influences taxi booking mobile applications in
Bangkok.
51
H1o: βService, Security, Convenience = 0
H1a: At least one of βService, Security, Convenience ≠ 0
Since P-value of βPrice < .05; therefore, we can reject null hypothesis and
conclude that service significantly influences taxi booking mobile applications in
Bangkok.
H2o: βReasonable, Cash payment, Credit card payment = 0
H2a: At least one of βReasonable, Cash payment, Credit card payment ≠ 0
Since P-value of βPlace > .05; therefore, we cannot reject null hypothesis and
cannot conclude that service significantly influences taxi booking mobile
applications in Bangkok.
H3o: βAvailability in business area, Availability in residential area,
Availability of taxi number =0
H3a: At least one of β Availability in business area, Availability in residential
area, Availability of taxi number ≠ 0
Since P-value of βPromotion > .05; therefore, we cannot reject null hypothesis
and cannot conclude that service significantly influences taxi booking mobile
applications in Bangkok.
H4o: βDiscount, Special Offers, Advertising = 0
H4a: At least one of βDiscount, Special Offers, Advertising ≠ 0
Since P-value of βPhysical evidence < .05; therefore, we can reject null
hypothesis and conclude that service significantly influences taxi booking mobile
applications in Bangkok.
52
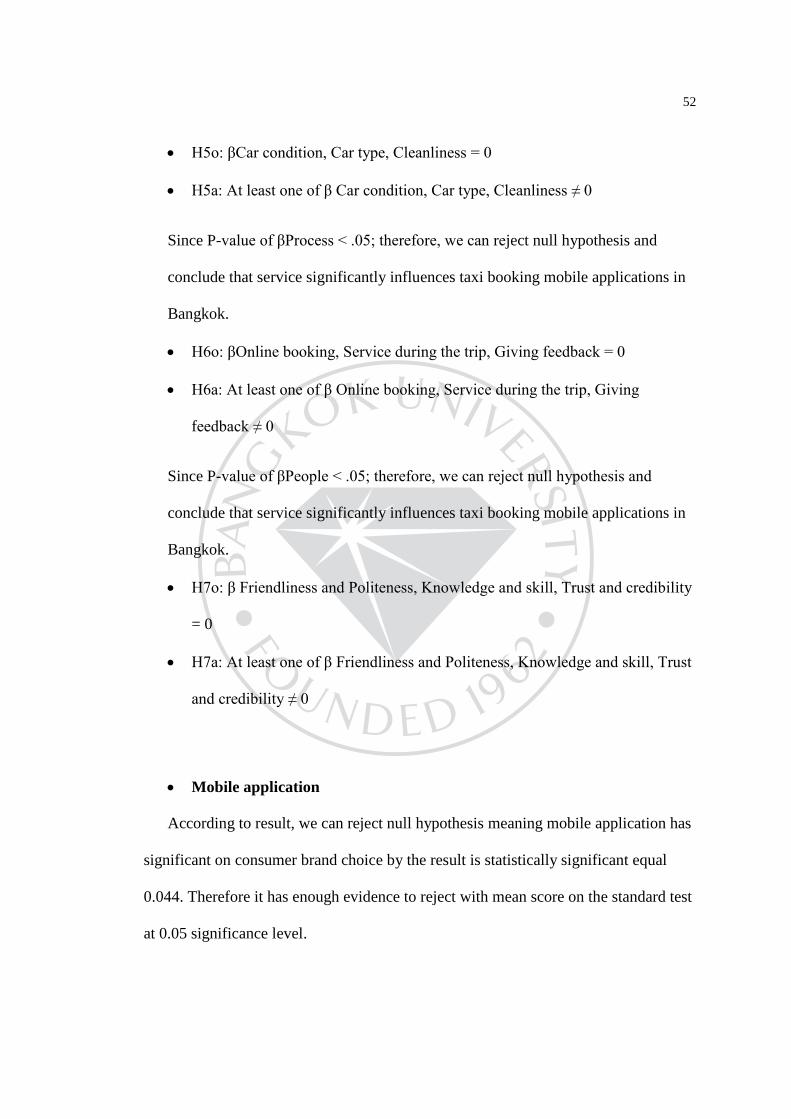
H5o: βCar condition, Car type, Cleanliness = 0
H5a: At least one of β Car condition, Car type, Cleanliness ≠ 0
Since P-value of βProcess < .05; therefore, we can reject null hypothesis and
conclude that service significantly influences taxi booking mobile applications in
Bangkok.
H6o: βOnline booking, Service during the trip, Giving feedback = 0
H6a: At least one of β Online booking, Service during the trip, Giving
feedback ≠ 0
Since P-value of βPeople < .05; therefore, we can reject null hypothesis and
conclude that service significantly influences taxi booking mobile applications in
Bangkok.
H7o: β Friendliness and Politeness, Knowledge and skill, Trust and credibility
= 0
H7a: At least one of β Friendliness and Politeness, Knowledge and skill, Trust
and credibility ≠ 0
Mobile application
According to result, we can reject null hypothesis meaning mobile application has
significant on consumer brand choice by the result is statistically significant equal
0.044. Therefore it has enough evidence to reject with mean score on the standard test
at 0.05 significance level.
53
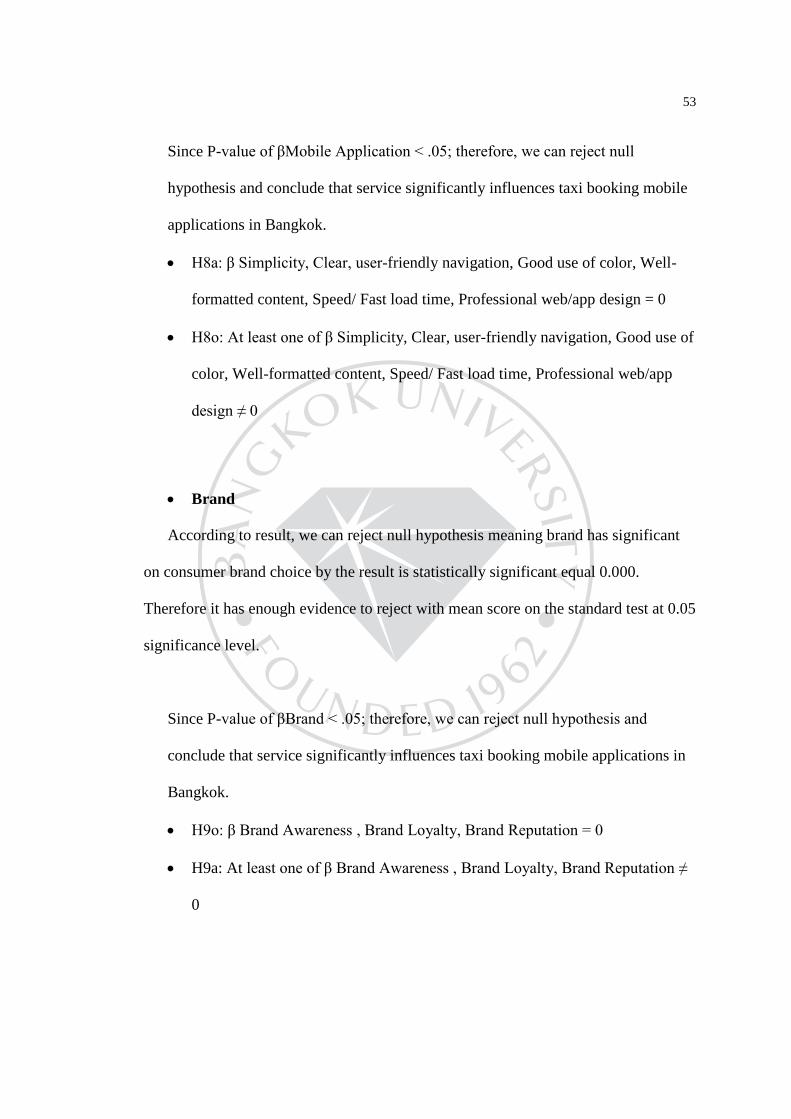
Since P-value of βMobile Application < .05; therefore, we can reject null
hypothesis and conclude that service significantly influences taxi booking mobile
applications in Bangkok.
H8a: β Simplicity, Clear, user-friendly navigation, Good use of color, Well-
formatted content, Speed/ Fast load time, Professional web/app design = 0
H8o: At least one of β Simplicity, Clear, user-friendly navigation, Good use of
color, Well-formatted content, Speed/ Fast load time, Professional web/app
design ≠ 0
Brand
According to result, we can reject null hypothesis meaning brand has significant
on consumer brand choice by the result is statistically significant equal 0.000.
Therefore it has enough evidence to reject with mean score on the standard test at 0.05
significance level.
Since P-value of βBrand < .05; therefore, we can reject null hypothesis and
conclude that service significantly influences taxi booking mobile applications in
Bangkok.
H9o: β Brand Awareness , Brand Loyalty, Brand Reputation = 0
H9a: At least one of β Brand Awareness , Brand Loyalty, Brand Reputation ≠
0

54
Consumer behavior
According to result, we can reject null hypothesis meaning consumer behavior has
significant on consumer brand choice by the result is statistically significant equal
0.000. Therefore it has enough evidence to reject with mean score on the standard test
at 0.05 significance level.
Since P-value of βConsumer Behavior < .05; therefore, we can reject null
hypothesis and conclude that service significantly influences taxi booking mobile
applications in Bangkok.
H10o: β Economic situation , Lifestyles, Influential people, Social network,
Social trend = 0
H10a: At least one of β Economic situation , Lifestyles, Influential people,
Social network, Social trend ≠ 0
Comparison of Uber over Easy Taxi (The reference category is Easy Taxi)
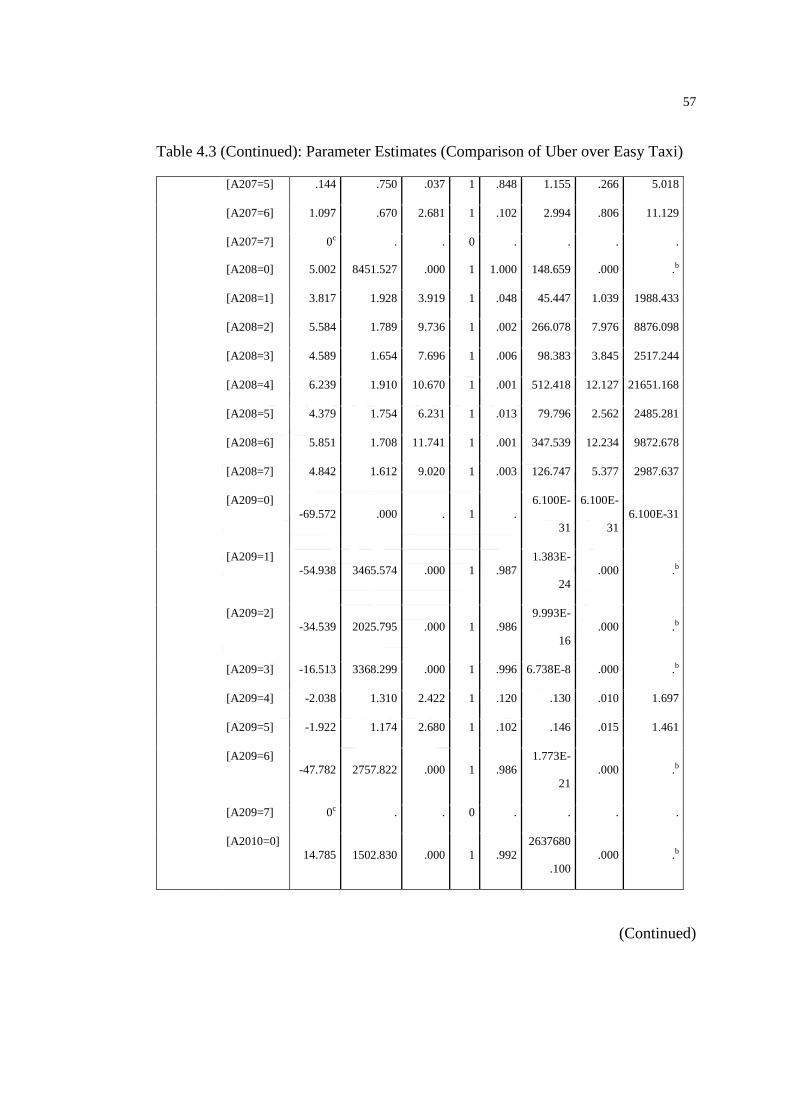
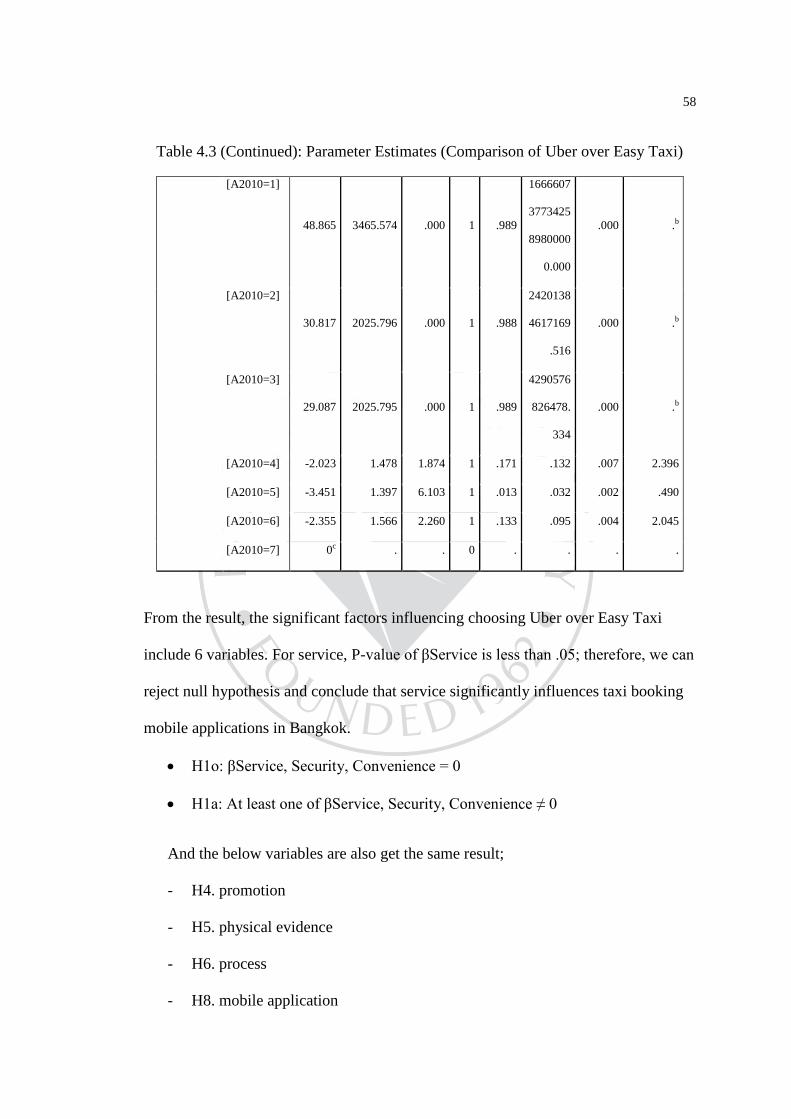
Table 4.3: Parameter Estimates (Comparison of Uber over Easy Taxi)
BRANDa B Std. Error Wald df Sig. Exp(B)
95% Confidence
Interval for Exp(B)
Lower
Bound
Upper
Bound
Uber [A201=0] 4.417 1.377 10.296 1 .001 82.845 5.579 1230.228
[A201=1] 3.281 1.420 5.338 1 .021 26.602 1.645 430.276
[A201=2] 1.996 1.451 1.892 1 .169 7.361 .428 126.506
[A201=3] 3.130 1.314 5.672 1 .017 22.877 1.740 300.729
(Continued)

55
Table 4.3(Continued): Parameter Estimates (Comparison of Uber over Easy Taxi)
[A201=4] .222 1.391 .026 1 .873 1.249 .082 19.086
[A201=5] 2.733 1.314 4.326 1 .038 15.377 1.171 201.975
[A201=6] -1.929 1.596 1.460 1 .227 .145 .006 3.319
[A201=7] 2.515 1.497 2.821 1 .093 12.362 .657 232.475
[A202=0] -.973 9113.474 .000 1 1.000 .378 .000 .b
[A202=1] -3.944 1.459 7.310 1 .007 .019 .001 .338
[A202=2] -4.835 1.505 10.319 1 .001 .008 .000 .152
[A202=3] -3.539 1.427 6.151 1 .013 .029 .002 .476
[A202=4] -.074 1.144 .004 1 .949 .929 .099 8.743
[A202=5] .298 .957 .097 1 .756 1.347 .206 8.795
[A202=6] 1.187 .982 1.460 1 .227 3.277 .478 22.474
[A202=7] 0c . . 0 . . . .
[A203=0] .172 .000 . 1 . 1.188 1.188 1.188
[A203=1] -16.008 2312.594 .000 1 .994 1.116E-7 .000 .b
[A203=2] 3.551 1.648 4.641 1 .031 34.853 1.378 881.782
[A203=3] 2.003 1.611 1.545 1 .214 7.408 .315 174.286
[A203=4] -1.437 1.219 1.389 1 .239 .238 .022 2.593
[A203=5] 1.273 1.081 1.388 1 .239 3.572 .430 29.704
[A203=6] 1.891 1.066 3.147 1 .076 6.629 .820 53.584
[A203=7] 0c . . 0 . . . .
[A204=0] -3.616 .000 . 1 . .027 .027 .027
[A204=1]
16.566 2312.594 .000 1 .994
1564301
1.575
.000 .b
[A204=2] -1.955 1.513 1.671 1 .196 .141 .007 2.744
[A204=3] -3.172 1.409 5.068 1 .024 .042 .003 .663
(Continued)

56
Table 4.3(Continued): Parameter Estimates (Comparison of Uber over Easy Taxi)
[A204=4] -1.807 1.388 1.694 1 .193 .164 .011 2.494
[A204=5] -3.430 1.331 6.641 1 .010 .032 .002 .440
[A204=6] -2.073 1.258 2.718 1 .099 .126 .011 1.479
[A204=7] 0c
-2.049
.
1.553
.
1.741
0
1
.
.187
.
.129
.
.006
.
2.704 [A205=0]
[A205=1] 1.479 1.108 1.780 1 .182 4.387 .500 38.518
[A205=2] -1.183 1.186 .995 1 .319 .306 .030 3.131
[A205=3] -1.686 1.148 2.159 1 .142 .185 .020 1.756
[A205=4] 1.639 .730 5.045 1 .025 5.152 1.232 21.537
[A205=5] 2.319 .877 6.986 1 .008 10.166 1.821 56.758
[A205=6] 1.326 .777 2.912 1 .088 3.767 .821 17.283
[A205=7] 2.427 1.235 3.862 1 .049 11.325 1.006 127.436
[A206=0]
19.004 3611.549 .000 1 .996
1792550
30.553
.000 .b
[A206=1] -1.645 1.790 .844 1 .358 .193 .006 6.449
[A206=2] -.941 1.403 .450 1 .502 .390 .025 6.106
[A206=3] -.956 1.333 .514 1 .473 .385 .028 5.244
[A206=4] -.823 1.027 .642 1 .423 .439 .059 3.289
[A206=5] -1.657 .967 2.938 1 .086 .191 .029 1.268
[A206=6] -2.267 .826 7.531 1 .006 .104 .021 .523
[A206=7] 0c . . 0 . . . .
[A207=0] -16.980 5029.965 .000 1 .997 4.222E-8 .000 .b
[A207=1] -16.325 1347.230 .000 1 .990 8.130E-8 .000 .b
[A207=2] 1.497 1.708 .768 1 .381 4.467 .157 127.111
[A207=3] 2.377 1.581 2.259 1 .133 10.771 .485 239.011
[A207=4] -16.470 1266.734 .000 1 .990 7.034E-8 .000 .b
(Continued)
57
Table 4.3 (Continued): Parameter Estimates (Comparison of Uber over Easy Taxi)
[A207=5] .144 .750 .037 1 .848 1.155 .266 5.018
[A207=6] 1.097 .670 2.681 1 .102 2.994 .806 11.129
[A207=7]
[A208=0]
0c
5.002
.
8451.527
.
.000
0
1
.
1.000
.
148.659
.
.000
.
.b
[A208=1] 3.817 1.928 3.919 1 .048 45.447 1.039 1988.433
[A208=2] 5.584 1.789 9.736 1 .002 266.078 7.976 8876.098
[A208=3] 4.589 1.654 7.696 1 .006 98.383 3.845 2517.244
[A208=4] 6.239 1.910 10.670 1 .001 512.418 12.127 21651.168
[A208=5] 4.379 1.754 6.231 1 .013 79.796 2.562 2485.281
[A208=6] 5.851 1.708 11.741 1 .001 347.539 12.234 9872.678
[A208=7] 4.842 1.612 9.020 1 .003 126.747 5.377 2987.637
[A209=0]
-69.572 .000 . 1 .
6.100E-
31
6.100E-
31
6.100E-31
[A209=1]
-54.938 3465.574 .000 1 .987
1.383E-
24
.000 .b
[A209=2]
-34.539 2025.795 .000 1 .986
9.993E-
16
.000 .b
[A209=3] -16.513 3368.299 .000 1 .996 6.738E-8 .000 .b
[A209=4] -2.038 1.310 2.422 1 .120 .130 .010 1.697
[A209=5] -1.922 1.174 2.680 1 .102 .146 .015 1.461
[A209=6]
-47.782 2757.822 .000 1 .986
1.773E-
21
.000 .b
[A209=7] 0c . . 0 . . . .
[A2010=0]
14.785 1502.830 .000 1 .992
2637680
.100
.000 .b
(Continued)
58
Table 4.3 (Continued): Parameter Estimates (Comparison of Uber over Easy Taxi)
[A2010=1]
48.865 3465.574 .000 1 .989
1666607
3773425
8980000
0.000
.000 .b
[A2010=2]
30.817 2025.796 .000 1 .988
2420138
4617169
.516
.000 .b
[A2010=3]
29.087 2025.795 .000 1 .989
4290576
826478.
334
.000 .b
[A2010=4] -2.023 1.478 1.874 1 .171 .132 .007 2.396
[A2010=5] -3.451 1.397 6.103 1 .013 .032 .002 .490
[A2010=6] -2.355 1.566 2.260 1 .133 .095 .004 2.045
[A2010=7] 0c . . 0 . . . .
From the result, the significant factors influencing choosing Uber over Easy Taxi
include 6 variables. For service, P-value of βService is less than .05; therefore, we can
reject null hypothesis and conclude that service significantly influences taxi booking
mobile applications in Bangkok.
H1o: βService, Security, Convenience = 0
H1a: At least one of βService, Security, Convenience ≠ 0
And the below variables are also get the same result;
- H4. promotion
- H5. physical evidence
- H6. process
- H8. mobile application
59
- H10. consumer behavior
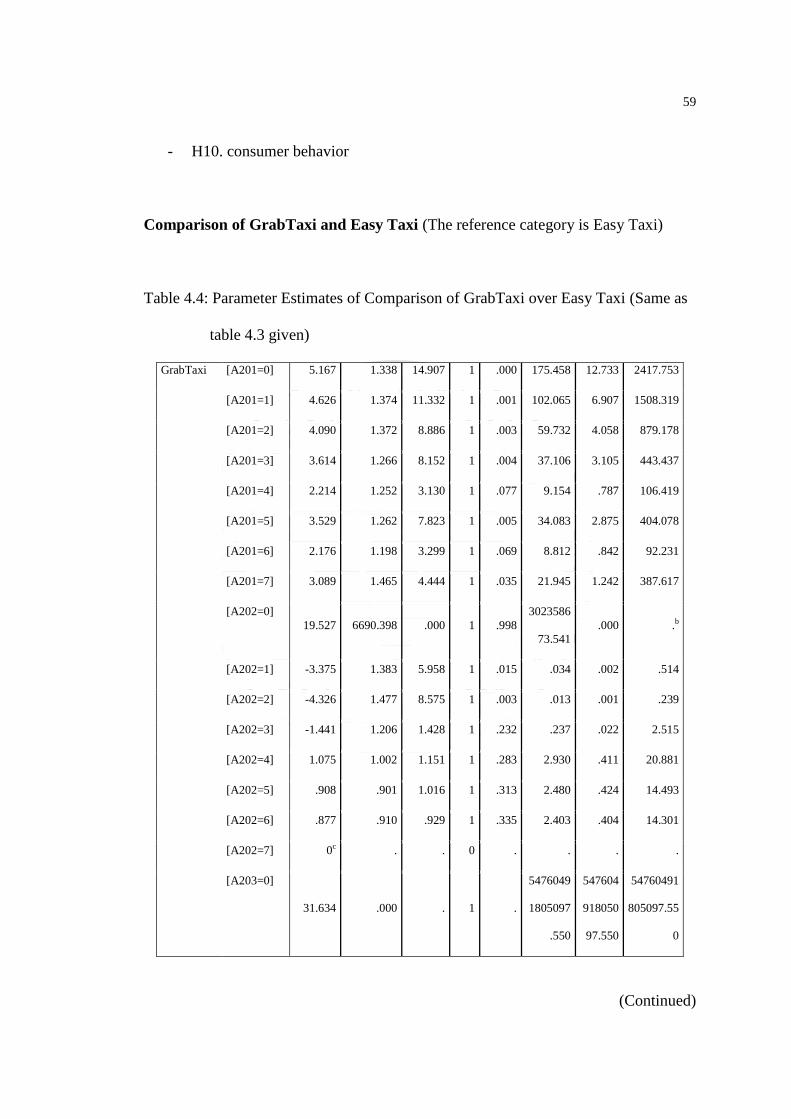
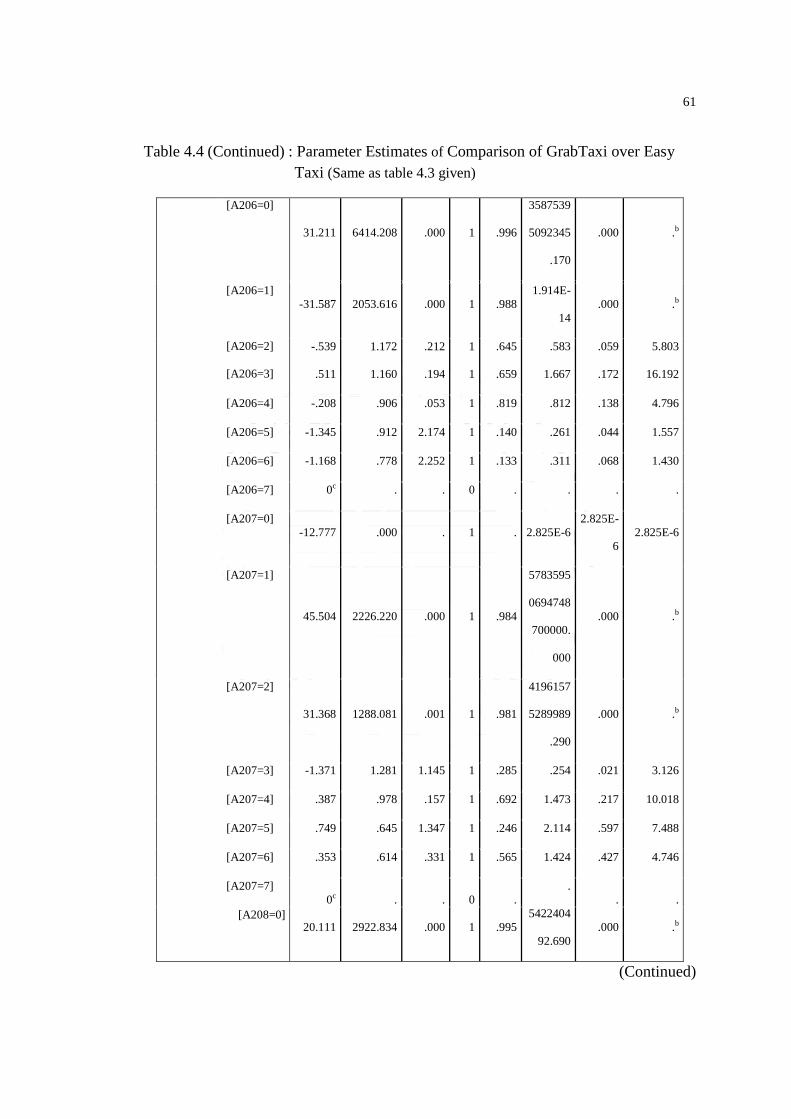
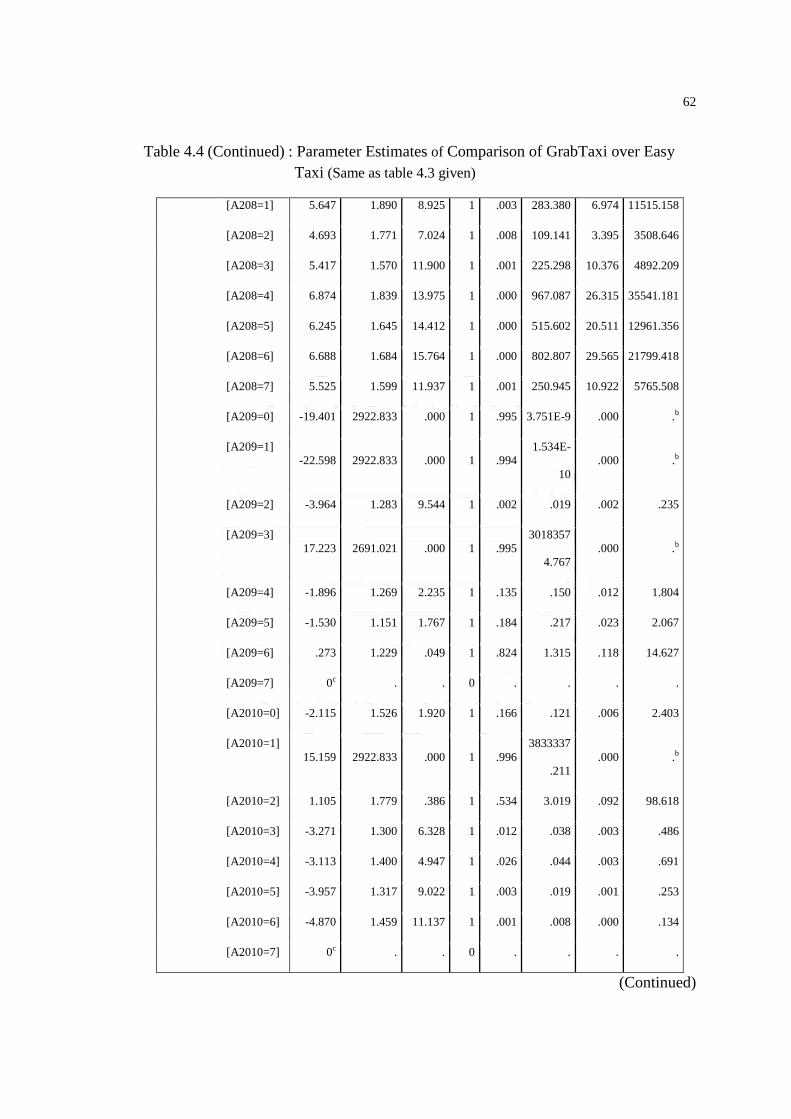
Comparison of GrabTaxi and Easy Taxi (The reference category is Easy Taxi)
Table 4.4: Parameter Estimates of Comparison of GrabTaxi over Easy Taxi (Same as
table 4.3 given)
GrabTaxi [A201=0] 5.167 1.338 14.907 1 .000 175.458 12.733 2417.753
[A201=1] 4.626 1.374 11.332 1 .001 102.065 6.907 1508.319
[A201=2] 4.090 1.372 8.886 1 .003 59.732 4.058 879.178
[A201=3] 3.614 1.266 8.152 1 .004 37.106 3.105 443.437
[A201=4] 2.214 1.252 3.130 1 .077 9.154 .787 106.419
[A201=5] 3.529 1.262 7.823 1 .005 34.083 2.875 404.078
[A201=6] 2.176 1.198 3.299 1 .069 8.812 .842 92.231
[A201=7] 3.089 1.465 4.444 1 .035 21.945 1.242 387.617
[A202=0]
19.527 6690.398 .000 1 .998
3023586
73.541
.000 .b
[A202=1] -3.375 1.383 5.958 1 .015 .034 .002 .514
[A202=2] -4.326 1.477 8.575 1 .003 .013 .001 .239
[A202=3] -1.441 1.206 1.428 1 .232 .237 .022 2.515
[A202=4] 1.075 1.002 1.151 1 .283 2.930 .411 20.881
[A202=5] .908 .901 1.016 1 .313 2.480 .424 14.493
[A202=6] .877 .910 .929 1 .335 2.403 .404 14.301
[A202=7] 0c . . 0 . . . .
[A203=0]
31.634 .000 . 1 .
5476049
1805097
.550
547604
918050
97.550
54760491
805097.55
0
(Continued)

60
Table 4.4 (Continued) : Parameter Estimates of Comparison of GrabTaxi over Easy
Taxi (Same as table 4.3 given)
[A203=1]
16.234 2576.785 .000 1 .995
1122792
3.418
.000 .b
[A203=2]
[A203=3]
-.420
1.098
1.482
1.411
.080
.606
1
1
.777
.436
.657
2.999
.036
.189
11.988
47.629
[A203=4] -.654 1.034 .400 1 .527 .520 .069 3.943
[A203=5] 1.027 .989 1.077 1 .299 2.792 .402 19.413
[A203=6] 1.895 .991 3.661 1 .056 6.656 .955 46.394
[A203=7] 0c . . 0 . . . .
[A204=0]
-37.177 8991.284 .000 1 .997
7.147E-
17
.000 .b
[A204=1] -17.978 2576.785 .000 1 .994 1.557E-8 .000 .b
[A204=2] -3.994 1.479 7.288 1 .007 .018 .001 .335
[A204=3] -2.304 1.274 3.270 1 .071 .100 .008 1.213
[A204=4] -2.596 1.222 4.511 1 .034 .075 .007 .818
[A204=5] -5.016 1.261 15.820 1 .000 .007 .001 .079
[A204=6] -2.241 1.191 3.539 1 .060 .106 .010 1.098
[A204=7]
[A205=0]
0c
.791
.
1.002
.
.624
0
1
.
.430
.
2.206
.
.310
.
15.706
[A205=1] -14.610 864.336 .000 1 .987 4.518E-7 .000 .b
[A205=2]
-32.308 1288.081 .001 1 .980
9.309E-
15
.000 .b
[A205=3] 1.399 .821 2.903 1 .088 4.050 .810 20.237
[A205=4] 1.517 .696 4.757 1 .029 4.560 1.166 17.825
[A205=5] 2.391 .842 8.063 1 .005 10.921 2.097 56.874
[A205=6] 1.094 .738 2.200 1 .138 2.987 .704 12.681
[A205=7] 4.436 1.145 14.999 1 .000 84.399 8.942 796.564
(Continued)
61
Table 4.4 (Continued) : Parameter Estimates of Comparison of GrabTaxi over Easy
Taxi (Same as table 4.3 given)
[A206=0]
31.211 6414.208 .000 1 .996
3587539
5092345
.170
.000 .b
[A206=1]
-31.587 2053.616 .000 1 .988
1.914E-
14
.000 .b
[A206=2]
[A206=3]
-.539
.511
1.172
1.160
.212
.194
1
1
.645
.659
.583
1.667
.059
.172
5.803
16.192
[A206=4] -.208 .906 .053 1 .819 .812 .138 4.796
[A206=5] -1.345 .912 2.174 1 .140 .261 .044 1.557
[A206=6] -1.168 .778 2.252 1 .133 .311 .068 1.430
[A206=7] 0c . . 0 . . . .
[A207=0]
-12.777 .000 . 1 . 2.825E-6
2.825E-
6
2.825E-6
[A207=1]
45.504 2226.220 .000 1 .984
5783595
0694748
700000.
000
.000 .b
[A207=2]
31.368 1288.081 .001 1 .981
4196157
5289989
.290
.000 .b
[A207=3] -1.371 1.281 1.145 1 .285 .254 .021 3.126
[A207=4] .387 .978 .157 1 .692 1.473 .217 10.018
[A207=5] .749 .645 1.347 1 .246 2.114 .597 7.488
[A207=6] .353 .614 .331 1 .565 1.424 .427 4.746
[A207=7]
0c
20.111
.
2922.834
.
.000
0
1
.
.995
.
5422404
92.690
.
.000
.
.b [A208=0]
(Continued)
62
Table 4.4 (Continued) : Parameter Estimates of Comparison of GrabTaxi over Easy
Taxi (Same as table 4.3 given)
[A208=1] 5.647 1.890 8.925 1 .003 283.380 6.974 11515.158
[A208=2] 4.693 1.771 7.024 1 .008 109.141 3.395 3508.646
[A208=3] 5.417 1.570 11.900 1 .001 225.298 10.376 4892.209
[A208=4] 6.874 1.839 13.975 1 .000 967.087 26.315 35541.181
[A208=5] 6.245 1.645 14.412 1 .000 515.602 20.511 12961.356
[A208=6] 6.688 1.684 15.764 1 .000 802.807 29.565 21799.418
[A208=7] 5.525 1.599 11.937 1 .001 250.945 10.922 5765.508
[A209=0] -19.401 2922.833 .000 1 .995 3.751E-9 .000 .b
[A209=1]
-22.598 2922.833 .000 1 .994
1.534E-
10
.000 .b
[A209=2] -3.964 1.283 9.544 1 .002 .019 .002 .235
[A209=3]
17.223 2691.021 .000 1 .995
3018357
4.767
.000 .b
[A209=4] -1.896 1.269 2.235 1 .135 .150 .012 1.804
[A209=5] -1.530 1.151 1.767 1 .184 .217 .023 2.067
[A209=6] .273 1.229 .049 1 .824 1.315 .118 14.627
[A209=7] 0c . . 0 . . . .
[A2010=0] -2.115 1.526 1.920 1 .166 .121 .006 2.403
[A2010=1]
15.159 2922.833 .000 1 .996
3833337
.211
.000 .b
[A2010=2] 1.105 1.779 .386 1 .534 3.019 .092 98.618
[A2010=3] -3.271 1.300 6.328 1 .012 .038 .003 .486
[A2010=4] -3.113 1.400 4.947 1 .026 .044 .003 .691
[A2010=5] -3.957 1.317 9.022 1 .003 .019 .001 .253
[A2010=6] -4.870 1.459 11.137 1 .001 .008 .000 .134
[A2010=7] 0c . . 0 . . . .
(Continued)

63
Significant factors influencing choosing GrabTaxi over Easy Taxi include 5
variables. For service, P-value of βService is also less than .05; therefore, we can
reject null hypothesis and conclude that service significantly influences taxi booking
mobile applications in Bangkok.
H1o: βService, Security, Convenience = 0
H1a: At least one of βService, Security, Convenience ≠ 0
And the below variables are also get the same result;
- H4. promotion
- H5. physical evidence
- H8. mobile application
- H10. consumer behavior
4.2 The factor analysis of marketing mix (7Ps), mobile application, brand and
consumer behavior. (5 Likert scale)
As stated in chapter 2, the researcher uses factor analysis method because is a
method of data reduction by seeking underlying unobservable variables (latent
variable) that are reflected in the observed variables (manifest variables). In machine
learning and statistics, factor analysis is the process of reducing the number of random
variables under consideration, and can be divided into feature selection and feature
extraction. The researcher focuses on figuring out the latent variables that drive brand
choice decision which is unobservable.

64
Varimax, which was developed by Kaiser (1958), is indubitably the most
popular rotation method by far. In statistics, a varimax rotation is used to simplify the
expression of a particular sub-space in terms of just a few major items each. The
actual coordinate system is unchanged; it is the orthogonal basis that is being rotated
to align with those coordinates. The sub-space found with principal component
analysis or factor analysis is expressed as a dense basis with many non-zero weights
which makes it hard to interpret. (Kaiser, 1958) For varimax a simple solution means
that each factor has a small number of large loadings and a large number of zero (or
small) loadings. This simplifies the interpretation because, after a varimax rotation,
each original variable tends to be associated with one (or a small number) of factors,
and each factor represents only a small number of variables. In addition, the factors
can often be interpreted from the opposition of few variables with positive loadings to
few variables with negative loadings. (Herv´e Abdi, 2003)
In this part, there are 35 factors analyzed so the researcher chooses factor
analysis: variemax method.
Table 4.5: Factor Analysis: Total Variance Explained
Component
Initial Eigenvalues
Extraction Sums of Squared
Loadings
Rotation Sums of Squared
Loadings
Total
% of
Variance
Cumulative
% Total
% of
Variance
Cumulative
% Total
% of
Variance
Cumulative
%
1 18.997 54.277 54.277 18.997 54.277 54.277 8.689 24.826 24.826
2 2.419 6.912 61.189 2.419 6.912 61.189 4.840 13.830 38.656
3 1.910 5.458 66.647 1.910 5.458 66.647 3.981 11.374 50.030
4 1.614 4.610 71.257 1.614 4.610 71.257 3.532 10.092 60.122
5 1.283 3.665 74.922 1.283 3.665 74.922 3.481 9.946 70.068
6 1.002 2.863 77.785 1.002 2.863 77.785 2.701 7.717 77.785

65
From factor analysis, the researcher can finalize six factors that affect to
consumer brand choice of taxi booking mobile application with percent of variance
more than 77.79% from all factors that shown in this questionnaire.
From table 4.3: Total Variance Explained, the analysis shows six components
The research has found that from 35 factors include the first components could
explain 54.28% of variance before rotation. The second components could explain
6.91% of variance. The third, fourth, fifth and sixth components could explain 5.46%,
4.61%, 3.67%, and 2.87% of variance respectively. These six variables already have
explained more than 75% from all 36 variables.
After the rotation is showing, the variables include the first components has
variance value equal to 24.83%. The second, third, fourth, fifth and sixth components
explained by 13.83%, 11.38%, 10.1%, 9.95% and 7.2% of variance value
respectively. Total variables are 77.79% from 36 factors on this questionnaire.
Table 4.6: Rotated Component Matrixa
Component
1 2 3 4 5 6
SERVICE QUALITY .592 .404 .120 .049 .447 .036
SECURITY .695 .373 .069 .243 .327 -.038
CONVENIENCE .672 .406 .172 .171 .086 .092
REASONABLE PRICE .607 .125 .389 .185 .346 .209
CASH PAYMENT .490 .322 .361 .180 .016 .346
CREDIT PAYMENT .711 .292 .224 .060 .188 .292
AVAILABILITY IN BUSINESS AREA .643 .276 .064 .247 .339 .196
(continued)

66
Table 4.6 (Continued): Rotated Component Matrixa
Component
1 2 3 4 5 6
AVAILABILITY IN RESIDENTIAL AREA .768 .431 .127 .126 .206 .018
AVAILABILITY OF NUMBER OF TAXI
DISCOUNT
.462
.279
.647
.437
.201
.592
.168
.275
-.064
.022
.170
.196
SPECIAL OFFERS .137 .222 .849 .208 .090 .079
ADVERTISING .242 .096 .848 .006 .285 .143
CAR CONDITION .776 .034 .294 .326 .212 .049
CAR TYPES .415 -.183 .469 .458 .157 .243
CLEANLINESS .634 .365 .161 .288 .112 .259
ONLINE BOOKING .705 .006 .258 .295 .084 .376
SERVICE DURING TRIP .557 .640 .125 .155 .190 .060
GIVING FEEDBACK .511 .664 .155 .050 .146 .136
FRIENDLINESS AND POLITENESS .607 .265 .221 .262 .080 .357
KNOWLEDGE AND SKILL
CLEAR NAVIGATION
.575
.214
.390
.625
.064
.200
.091
.337
.087
.501
.354
.102
GOOD USE OF COLOR .189 .173 .241 .272 .272 .799
WELL-FORMATTED CONTENT .312 .286 .125 .782 .220 .209
FAST LOAD TIME .239 .552 -.024 .392 .154 .399
PROFESSIONAL APP DESIGN .252 .233 .112 .700 .129 .188
BRAND AWARENESS .181 .122 .259 .045 .729 .266
BRAND LOYALTY
BRAND REPUTATION
ECONOMIC SITUATION
.309
.246
.242
.040
.262
.096
.239
.168
.848
.320
.201
.006
.635
.755
.285
.248
.086
.143
LIFESTYLES .776 .034 .294 .326 .212 .049
INFLUENTIAL PEOPLE .214 .625 .200 .337 .501 .102
SOCIAL NETWORK .189 .173 .241 .272 .272 .799
SOCIAL TREND .312 .286 .125 .782 .220 .209

67
For the result after rotation, the researcher can separate all components into
six different groups by rotated component matrix as follow,
Component 1: Marketing and Lifestyles (54.28%)
Marketing and lifestyles components are service quality or process (.59),
security (.70), convenience (.67), reasonable price (.61), cash payment (.49), credit
payment (.71), availability in business area (.64), availability in residential area (.77),
car condition (.78), cleanliness (.63), online booking (.71), friendliness and politeness
(.61), knowledge and skill (.58), trust and credibility (.77) and lifestyle (.78).
Component 2: Marketing and Technology (6.91%)
Marketing and technology components are availability of number of taxi (.65),
service during trip (.64), giving feedback (.66), simply features (.61), clean navigation
(.63), fast load time (.55) and influential people (.63).
Component 3: Marketing and Economic Situation (5.46%)
Marketing and economic situation components are discount (.59), special
offers (.85), advertising (.85), car types (.47), and economic situation (.85).
Component 4: Technology and Social media (4.61%)
Technology and social media components are well-formatted content (.78),
professional app design (.70), and social trend (.78).
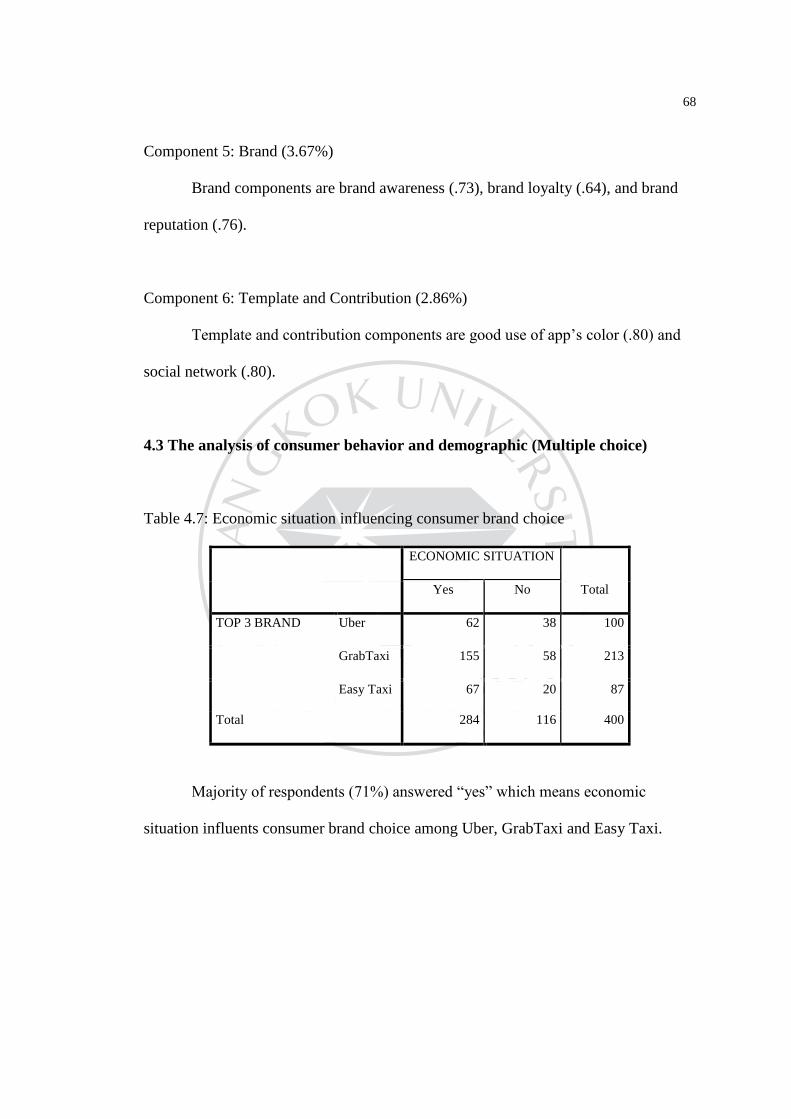
68
Component 5: Brand (3.67%)
Brand components are brand awareness (.73), brand loyalty (.64), and brand
reputation (.76).
Component 6: Template and Contribution (2.86%)
Template and contribution components are good use of app’s color (.80) and
social network (.80).
4.3 The analysis of consumer behavior and demographic (Multiple choice)
Table 4.7: Economic situation influencing consumer brand choice
ECONOMIC SITUATION
Total Yes No
TOP 3 BRAND Uber 62 38 100
GrabTaxi 155 58 213
Easy Taxi 67 20 87
Total 284 116 400
Majority of respondents (71%) answered “yes” which means economic
situation influents consumer brand choice among Uber, GrabTaxi and Easy Taxi.

69
Table 4.8: Economic situation of respondents
ECONOMIC SITUATION OF USER
Total Others Excellence Very good Good Fair Poor
TOP 3
BRAND
Uber 0 12 4 55 25 4 100
GrabTaxi 1 16 45 87 61 3 213
Easy Taxi 0 0 8 32 47 0 87
Total 1 28 57 174 133 7 400
Most of respondents (43.5%) described their economic situation as “good”,
33.25% of respondents described as “fair” and 14.25% described as “very good”.
Table 4.9: Frequency of using service
FREQUENCY
Total
3 times or less
per week
5 times or less
per week Every day
TOP 3 BRAND Uber 80 16 4 100
GrabTaxi 181 16 16 213
Easy Taxi 76 4 7 87
Total 337 36 27 400
337 respondents (84.25%) use the taxi service via taxi booking mobile app 3
times or less per week. 36 respondents (9%) use 5 times or less per week and 27
respondents (6.75%) use every day.

70
Table 4.10: Influential people of choosing taxi apps
INFLUENTIAL PEOPLE
Total Family Friends Advertising
Social
network Myself
TOP 3
BRAND
Uber 8 25 4 21 42 100
GrabTaxi 33 64 17 22 77 213
Easy Taxi 10 27 0 8 42 87
Total 51 116 21 51 161 400
161 respondents (40.25%) decided to use taxi booking mobile app by
themselves. For 116 respondents (29%), friends can influent them to use taxi booking
mobile app. Family, social network and advertising is 12.75%, 12.75%, and 5.25%
respectively.
Table 4.11: Most used social network of respondents
MOST USED SOCIAL NETWORK
Total Facebook Twitter Instagram LinkedIn Tumblr Google+ Youtube
TOP 3
BRAND
Uber 78 1 4 4 0 4 9 100
GrabTaxi 185 4 4 8 4 4 4 213
Easy Taxi 84 0 0 0 0 3 0 87
Total 347 5 8 12 4 11 13 400
Facebook is the most used social network , used by 347 (86.75%) out of 400
respondents. 3.25% of respondents (13 people) use Youtube and 3% of respondents
(12 people) use LinkedIn.

71
Table 4.12: Social network influencing consumer brand choice
SOCIAL NETWORK
Total Yes No Others
TOP 3 BRAND Uber 67 33 0 100
GrabTaxi 156 52 5 213
Easy Taxi 66 21 0 87
Total 289 106 5 400
289 respondents (72.25%) answered “yes” which means their most used social
network can affect their consumer brand choice among Uber, GrabTaxi and Easy
Taxi. On the other hand, 106 respondents (26.5%) said that their most used social
network does not affect their consumer brand choice. 5 respondents (1.25%) said
others social network affect their consumer brand choice.
Table 4.13: Repeat customer
REPEAT CUSTOMER
Total
Definitely
will
Probably
will
Definitely
won’t
Probably
won’t
TOP 3
BRAND
Uber 41 51 4 4 100
GrabTaxi 100 101 4 8 213
Easy Taxi 21 62 4 0 87
Total 162 214 12 12 400
Most of respondents (214 people or 53.5%) probably will use taxi app next
time and recommend to other people. 162 respondents (40.5%) definitely will use taxi
app next time and recommend to other people. Only 24 respondents (6%) said
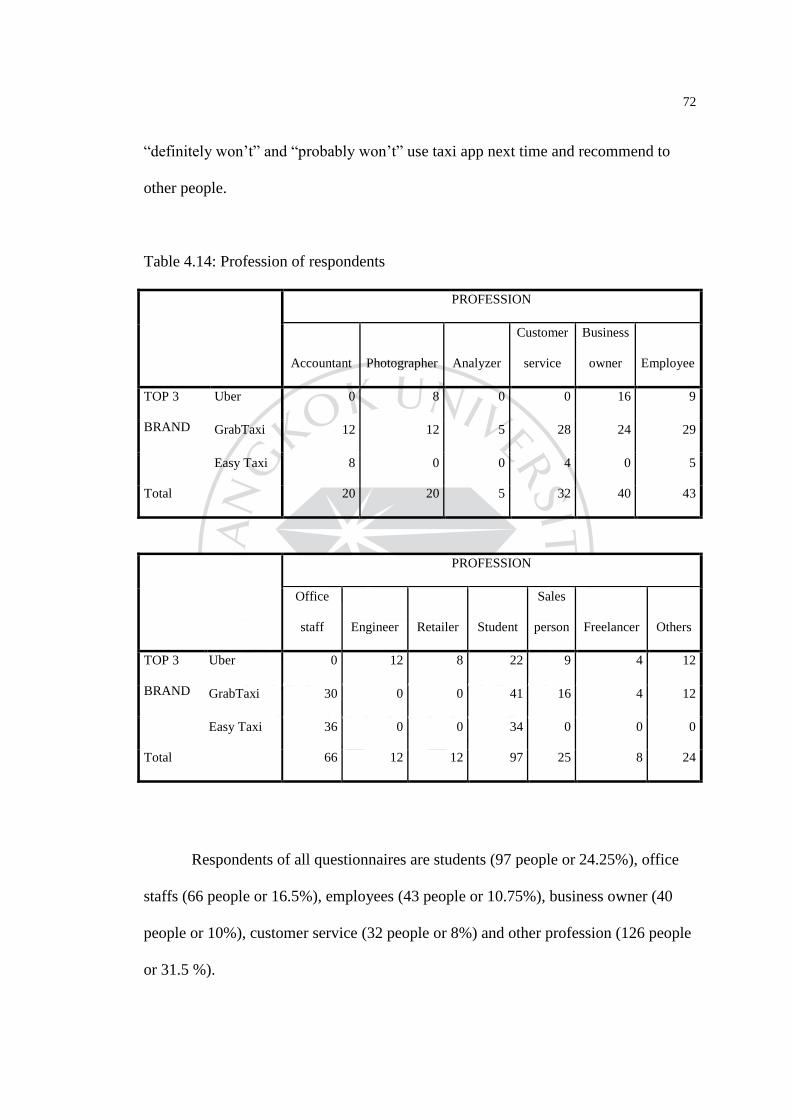
72
“definitely won’t” and “probably won’t” use taxi app next time and recommend to
other people.
Table 4.14: Profession of respondents
PROFESSION
Accountant Photographer Analyzer
Customer
service
Business
owner Employee
TOP 3
BRAND
Uber 0 8 0 0 16 9
GrabTaxi 12 12 5 28 24 29
Easy Taxi 8 0 0 4 0 5
Total 20 20 5 32 40 43
PROFESSION
Office
staff Engineer Retailer Student
Sales
person Freelancer Others
TOP 3
BRAND
Uber 0 12 8 22 9 4 12
GrabTaxi 30 0 0 41 16 4 12
Easy Taxi 36 0 0 34 0 0 0
Total 66 12 12 97 25 8 24
Respondents of all questionnaires are students (97 people or 24.25%), office
staffs (66 people or 16.5%), employees (43 people or 10.75%), business owner (40
people or 10%), customer service (32 people or 8%) and other profession (126 people
or 31.5 %).
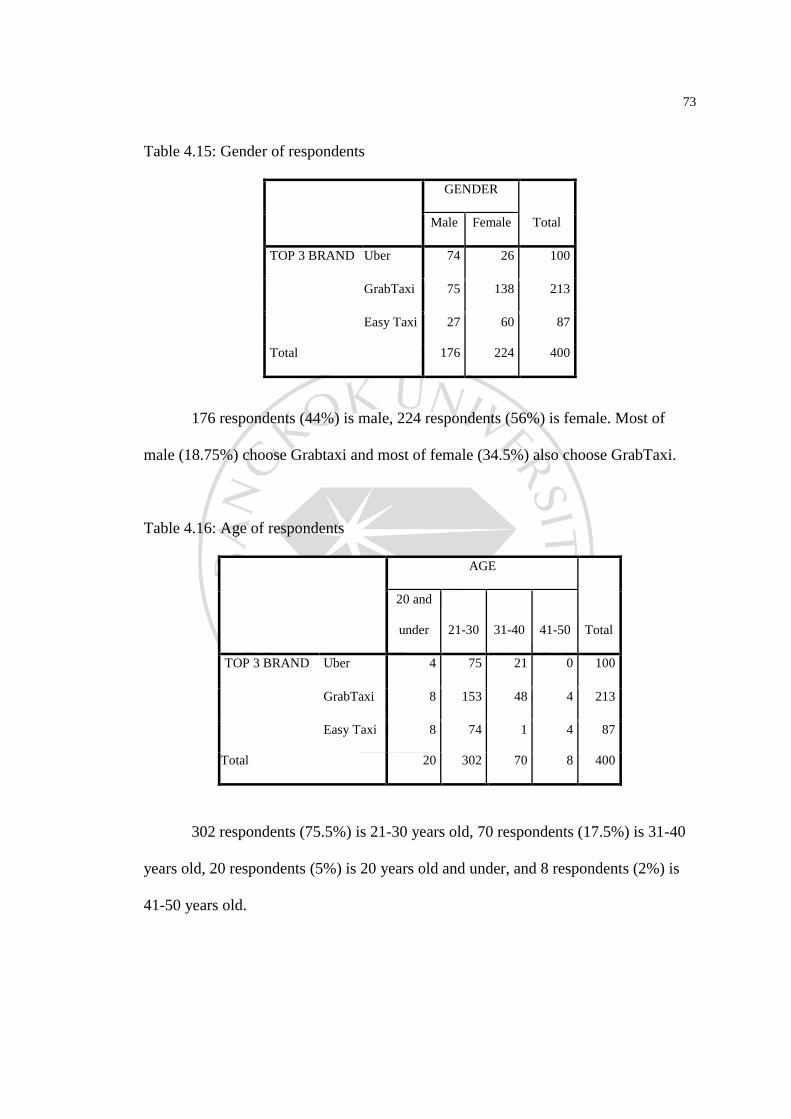
73
Table 4.15: Gender of respondents
GENDER
Total Male Female
TOP 3 BRAND Uber 74 26 100
GrabTaxi 75 138 213
Easy Taxi 27 60 87
Total 176 224 400
176 respondents (44%) is male, 224 respondents (56%) is female. Most of
male (18.75%) choose Grabtaxi and most of female (34.5%) also choose GrabTaxi.
Table 4.16: Age of respondents
AGE
Total
20 and
under 21-30 31-40 41-50
TOP 3 BRAND Uber 4 75 21 0 100
GrabTaxi 8 153 48 4 213
Easy Taxi 8 74 1 4 87
Total 20 302 70 8 400
302 respondents (75.5%) is 21-30 years old, 70 respondents (17.5%) is 31-40
years old, 20 respondents (5%) is 20 years old and under, and 8 respondents (2%) is
41-50 years old.
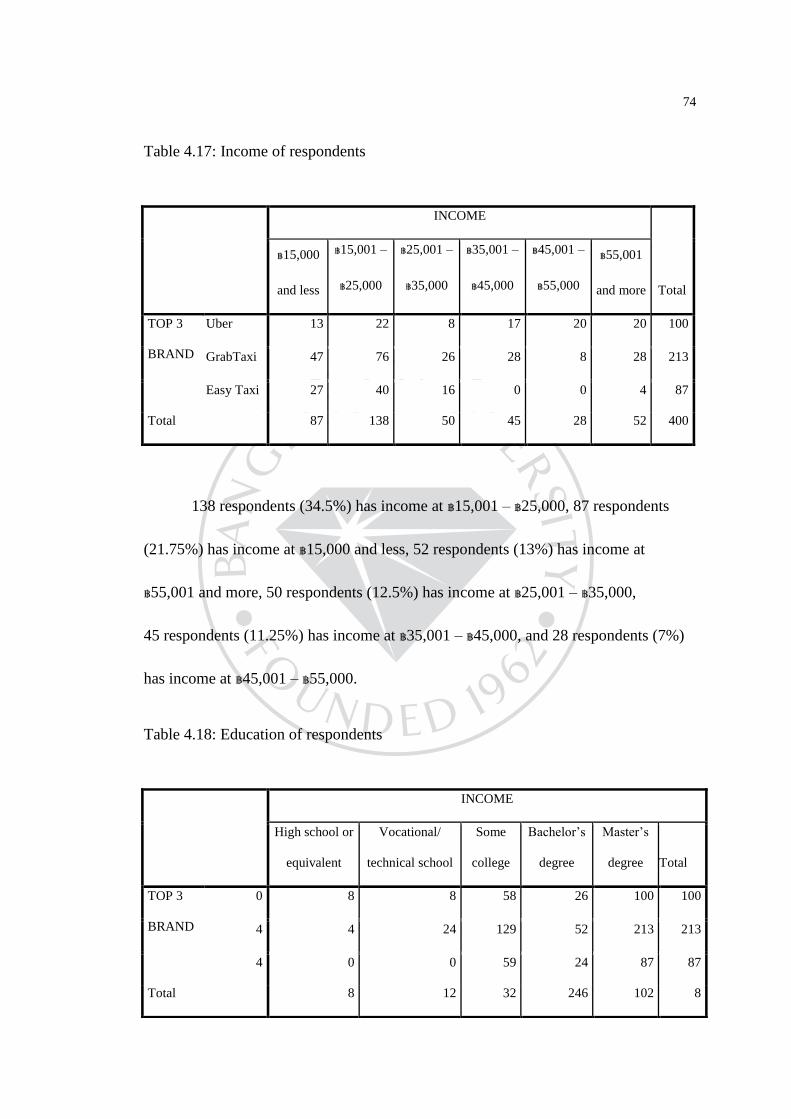
74
Table 4.17: Income of respondents
138 respondents (34.5%) has income at ฿15,001 – ฿25,000, 87 respondents
(21.75%) has income at ฿15,000 and less, 52 respondents (13%) has income at
฿55,001 and more, 50 respondents (12.5%) has income at ฿25,001 – ฿35,000,
45 respondents (11.25%) has income at ฿35,001 – ฿45,000, and 28 respondents (7%)
has income at ฿45,001 – ฿55,000.
Table 4.18: Education of respondents
INCOME
Total
฿15,000
and less
฿15,001 –
฿25,000
฿25,001 –
฿35,000
฿35,001 –
฿45,000
฿45,001 –
฿55,000
฿55,001
and more
TOP 3
BRAND
Uber 13 22 8 17 20 20 100
GrabTaxi 47 76 26 28 8 28 213
Easy Taxi 27 40 16 0 0 4 87
Total 87 138 50 45 28 52 400
INCOME
High school or
equivalent
Vocational/
technical school
Some
college
Bachelor’s
degree
Master’s
degree Total
TOP 3
BRAND
0 8 8 58 26 100 100
4 4 24 129 52 213 213
4 0 0 59 24 87 87
Total 8 12 32 246 102 8

75
246 respondents (61.5%) got bachelor’s degree, 102 respondents (25.5%) got
master’s degree, 32 respondents (8%) studied in some college, 12 respondents (3%)
studied in vocational/technical school, and 8 respondents (2%) studied in high school
or equivalent.

76
CHAPTER 5
DISCUSSION AND CONCLUSION
In this chapter, the researcher summarizes the overall important aspect of this
research along with discussion related to the results from this research and opinions
for future related research. The researcher’s main purpose is to study the factors
influencing consumer brand choices of top 3 taxi booking mobile applications in
Bangkok: Uber, Grabtaxi and Easy Taxi. The research has been conducted between
October 2015 – January 2016 based in Bangkok, Thailand and it is conducted for
beneficial purposes to business owners, investors, marketing experts related to Thai
taxi’s consumers and taxi booking mobile application or other app.
The result of this study can improve marketing factors, mobile application,
brand and consumer behavior on consumer brand choice section to create and raise
more advantages over competitors, and to be a guideline for planning and adapting
marketing strategy in order to comply with shifting customer’s demands and improve
special marketing channel such as social media. There are three research questions of
this study as following,
What is the most influencing factor in marketing mix toward consumer brand
choices of top 3 taxi booking mobile applications in Bangkok: Uber, Grabtaxi
and Easy Taxi?
Is social media and influential people related to purchasing decision of top 3
taxi booking mobile applications in Bangkok: Uber, Grabtaxi and Easy Taxi?
Is the role or function of application important for brand choice?

77
In this study, the researcher created theoretical foundation of the conceptual
framework to analyzed and explored which led to the following hypotheses,
Since P-value of βService < .05; therefore, we can reject null hypothesis and
conclude that service significantly influences taxi booking mobile applications in
Bangkok.
H1o: βService, Security, Convenience = 0
H1a: At least one of βService, Security, Convenience ≠ 0
Since P-value of βPrice < .05; therefore, we can reject null hypothesis and
conclude that service significantly influences taxi booking mobile applications in
Bangkok.
H2o: βReasonable, Cash payment, Credit card payment = 0
H2a: At least one of βReasonable, Cash payment, Credit card payment ≠ 0
Since P-value of βPlace > .05; therefore, we cannot reject null hypothesis and
cannot conclude that service significantly influences taxi booking mobile
applications in Bangkok.
H3o: βAvailability in business area, Availability in residential area,
Availability of taxi number =0
H3a: At least one of β Availability in business area, Availability in residential
area, Availability of taxi number ≠ 0
Since P-value of βPromotion > .05; therefore, we cannot reject null hypothesis
and cannot conclude that service significantly influences taxi booking mobile
applications in Bangkok.

78
H4o: βDiscount, Special Offers, Advertising = 0
H4a: At least one of βDiscount, Special Offers, Advertising ≠ 0
Since P-value of βPhysical evidence < .05; therefore, we can reject null
hypothesis and conclude that service significantly influences taxi booking mobile
applications in Bangkok.
H5o: βCar condition, Car type, Cleanliness = 0
H5a: At least one of β Car condition, Car type, Cleanliness ≠ 0
Since P-value of βProcess < .05; therefore, we can reject null hypothesis and
conclude that service significantly influences taxi booking mobile applications in
Bangkok.
H6o: βOnline booking, Service during the trip, Giving feedback = 0
H6a: At least one of β Online booking, Service during the trip, Giving
feedback ≠ 0
Since P-value of βPeople < .05; therefore, we can reject null hypothesis and
conclude that service significantly influences taxi booking mobile applications in
Bangkok.
H7o: β Friendliness and Politeness, Knowledge and skill, Trust and credibility
= 0
H7a: At least one of β Friendliness and Politeness, Knowledge and skill, Trust
and credibility ≠ 0

79
Since P-value of βMobile Application < .05; therefore, we can reject null
hypothesis and conclude that service significantly influences taxi booking mobile
applications in Bangkok.
H8a: β Simplicity, Clear, user-friendly navigation, Good use of color, Well-
formatted content, Speed/ Fast load time, Professional web/app design = 0
H8o: At least one of β Simplicity, Clear, user-friendly navigation, Good use of
color, Well-formatted content, Speed/ Fast load time, Professional web/app
design ≠ 0
Since P-value of βBrand < .05; therefore, we can reject null hypothesis and
conclude that service significantly influences taxi booking mobile applications in
Bangkok.
H9o: β Brand Awareness , Brand Loyalty, Brand Reputation = 0
H9a: At least one of βBrand Awareness , Brand Loyalty, Brand Reputation ≠ 0
Since P-value of βConsumer Behavior < .05; therefore, we can reject null
hypothesis and conclude that service significantly influences taxi booking mobile
applications in Bangkok.
H10o: β Economic situation , Lifestyles, Influential people, Social network,
Social trend = 0
H10a: At least one of β Economic situation , Lifestyles, Influential people,
Social network, Social trend ≠ 0

80
This independent study is a quantitative research, which distributes
questionnaires via online channel to random sample group as tool of data collection
process. Population of the research is taxi app’s users who have experienced on online
taxi booking service: Uber, GrabTaxi, and Easy Taxi within Bangkok area.
The total number of sample group is 400 respondents: 213 GrabTaxi app’s
users, 100 Uber app’s users and 87 Easy Taxi app’s user. The questionnaire has an
instrument to collect data in order to examine and identify the factors influencing
consumer brand choices among 3 taxi booking applications: Uber, GrabTaxi and Easy
Taxi. This questionnaire consists of four parts. The first part consists of general
information. The second part requires the information of marketing factors
influencing consumer brand choices. The Third part deals with consumer behavior
influencing consumer brand choices. The last part is demographic of the respondent
which information collected includes gender, age, career, income level, lifestyle, etc.
5.1 Conclusion
As the most used taxi booking mobile application, 213 of respondents
(53.25%) choose GrabTaxi, 100 of respondents (25%) choose Uber, 87 of respondents
(21.75) choose Easy Taxi. 176 respondents (44%) is male, 224 respondents (56%) is
female. Most of male (18.75%) choose Grabtaxi and most of female (34.5%) also
choose GrabTaxi. Most respondents (75.5%) is around 21-30 years old.
As comparing between Uber and Easy Taxi, Uber has significant in brand
choice more than Easy Taxi in the aspect shown below:
Product or service (.001 < .05),

81
Promotion (.010 < .05)
Physical evidence (.008 < .05)
Process (.006 < .05)
Mobile Application (.001 < .05)
Consumer Behavior (.013 < .05)
As comparing between GrabTaxi and Easy Taxi, GrabTaxi has significant in
brand choice more than Easy Taxi in the aspect shown below:
Product or service (.000 < .05)
Promotion (.000 < .05)
Physical evidence (.000 < .05)
Mobile Application (.000 < .05)
Consumer Behavior (.001 < .05)
5.2 Discussion
In this research, the researcher studies about the factors that influence
consumer brand choice of top three taxis booking mobile application in Bangkok,
Thailand. In recent year, technology and smart phone play more important role in
Thai society.
According to the taxi app market in Hong Kong, it has potential in app-dominated
service. However, the taxi market is still in the middle of a traditional one to an app-
dominated one, there will be only several taxi apps can survive. (Jacky W. Y. Chan,
Vicky L. N. Chang, William K. Lau, Lawrence K. T. Law, & Corrine J. Lei., 2015)
82
The researcher found that it’s quite similar to taxi market in Bangkok, most of people
still use a traditional one. Anyways, the mobile application is very popular and
become trend in Thai lifestyle.
Technology has changed Thai society in many ways and younger society has less
patience that 5 minutes of waiting is considering late. Taxi booking application or taxi
E-hailing is growing which provide more convenience for people who live in
Bangkok by making taxi hailing more efficient. Taxi booking application can create
value while solving the mismatch between demand and supply, directly booking taxi
to people in need.
5.3 Managerial Implications
In business aspect, business owners, investors, entrepreneur can use the results
from this study to see and understand that the main factors influencing consumer
brand choice of top 3 taxi booking mobile applications in Bangkok: Uber, Grabtaxi
and Easy Taxi. Process, security, convenience, reasonable price, cash payment, credit
payment, availability in business area, availability in residential area, car condition,
cleanliness, online booking, driver’s friendliness and politeness, driver’s knowledge
and skill, driver’s trust and credibility and lifestyle are the main components that help
contributing both users to fulfill their needs before choosing service and business
owner to make more benefits on taxi booking mobile application.
5.4 Recommendation for Future Research
The results of this study can use as a recommendation for standards,
guidelines and development for taxi booking mobile application or related field in the

83
future. This paper was limited in Bangkok only, so the future research can have a
comparative study with other city then more demographic factors could be added for
the other future studies.
Furthermore, an understanding about the tech and marketing can help the
firms or company to make a good strategy for their business.

84
BIBLIOGRAPHY
Aaker, D. A. (1996). Measuring brand equity across products and markets. California
Management Review, 38(3), 102-20.
Aaker, D. A. (1991). Managing Brand Equity: Capitalizing on the Value of a Brand
Name. New York: The Free Press.
Abdul, H. T. (2014). Easy Taxi comes to the Kingdom, making trips hassle-free. Arab
news. Retrieved from http://www.arabnews. com/news/518831
Anass, B. (2010). Multinomial logistic regression: usage and application in risk analysis.
Journal of applied quantitative methods, 5, 289.
App. (n.d.). Retrieved from http://www.americandialect.org/app-voted-2010-word-of-the-
year-by-the-american-dialect-society-updated
Asaad, A. K. (2015). An analysis study of improving brand awareness and its impact on
consumer behavior via media in North Cyprus (A case study of fast food
restaurants). International Journal of Business and Social Science, 6, 72.
Boundless. (2015). Rational Decision Making. Retrieved from
https://www.boundless.com/management/textbooks/boundless-management-
textbook/decision-making-10/rational-and-nonrational-decision-making-
76/rational-decision-making-369-8376/
85
Brand. (n.d.). Retrieved from http://www.commonlanguage.wikispaces.net/Brand#
cite_note-1
Brand. (n.d.). Retrieved from http://www.businessdictionary. com/definition/
brand.html#ixzz3tt6MZlUP
Bornmark, H., Goransson, A., & Svensson, C. (2005). A study to indicate the importance
of brand awareness in brand choice. Retrieved from http://www.diva-
portal.org/smash/get/ diva2:229947/FULLTEXT01.pdf. Kristianstad University,
Department of Business studies. (2005).
Brand awareness. (n.d.). Retrieved from http://www.business dictionary.com/definition
/brand-awareness.html
Brand definition. (n.d.). Retrieved from http://www.persuasive brands.com/Topics_Brand
_Definition.aspx
Compuware. Mobile apps: What consumers really need and want? (n.d.) Apps. Retrieved
from https://info.dynatrace.com/rs/compuware/images/ Mobile_App_
Survey_Report.pdf
Conduct and interpret a multinomial logistic regression. (n.d.). Retrieved from
http://www.statisticssolutions.com/mlr/
Elizabeth, G. (2006). Statistics in Psychosocial Research: Factor Analysis I. Retrieved
from http://ocw.jhsph.edu/courses/statisticspsychosocial research/pdfs/
lecture8.pdf
86
Factor analysis. (n.d.). Retrieved from http://www.ats.ucla.edu/stat/spss/output/
factor1.htm
Gimme. (2014, October 20). Comparison of 3 taxi calling apps: Easy Taxi, Grabtaxi,
Uber. Retrieved December 8, 2015, from http://droidsans.com/compare-taxi-
caller-apps-easytaxi-grabtaxi-uber
GrabTaxi. (n.d.). Retrieved from http://www.grabtaxi.com/ bangkok-thailand/
Guimarães, S. P. (2014). 13 figures showing the success of Easy Taxi in 2014. Retrieved
from http://exame.abril.com.br/ tecnologia/noticias/13-numeros-que-mostram-o-
sucesso-do-easy-taxi-em-2014#1
Haigh, R. (2014). Ferrari – The world's most powerful brand. Retrieved from
http://brandfinance.com/news/press_releases/ferrari--the-worlds-most-powerful-
brand/
Henry, F. K. (1958). The varimax criterion for analytic rotation in factor analysis.
Urbana, IL: Springer-Verlag.
Herv´e Abdi. (2003). Factor Rotations in Factor Analyses. Retrieved from
https://www.utdallas.edu/~herve/Abdi-rotations-pretty.pdf
Jacky, W. Y. C. Vicky, L. N. C. William, K. L., Lawrence, K. T. L., & Corrine, J. L.
(2015). Taxi app market analysis in Hong Kong [Electronic version]. Journal of
Economics, Business and Management, 4, 239.
87
Jason, T. N. (2015). Latent Variables. Retrieved from http://www.upa.pdx.edu/
IOA/newsom/semclass/ho_latent.pdf
Kuester, S. (2012). MKT 301: Strategic Marketing & Marketing in Specific Industry
Contexts. Mannheim: University of Mannheim.
McCarthy, J. E. (1964). Basic Marketing. A Managerial Approach. Homewood, IL:
Irwin.
Melanie, M. W. (2006). Latent Variable Modeling. Retrieved from http://www.columbia.
edu/~mmw2177/ LVcourse/slides1handout.pdf
Moisescu, O. I. (2008) A conceptual analysis of brand loyalty as core dimension of brand
equity. Retrieved from https://mpra.ub.uni-muenchen.de
/7504/1/MPRA_paper_7504.pdf
Taxi Problem Reported. (2013). Prachachat. Retrieved from
http://www.prachachat.net/news_detail.php?newsid =1371625073
Redação, D. (2013). Easy Taxi Reaches 5000 Registered Taxi Drivers. Retrieved from
http://www.mobiletime.com. br/05/02/2013/ easy-taxi-alcanca-5-mil-taxistas-
cadastrados/324259/news.aspx
Robbins, S. P., & Timothy, A. J. (2007) Organization behavior. NJ: Pearson Prentice
Hall.

88
The Rational decision making model: steps and purpose in organizations. (n.d.).
Retrieved from http://study.com/academy/lesson/the-rational-decision-making-
model-steps-and-purpose-in-organizations.html
Travis. (2015). Five Years and 311 Cities Later. Uber News Room. Retrieved from
https://newsroom.uber.com/five-years-and-311-cities-later/
Types of taxi service in Thailand. (2013). MCOT. Retrieved from
http://www.mcot.net/site/content?id=51027f59150 ba0ef22000086#. VjXJ7V_
vPGh
Uber. (n.d.). Retrieved from https://en.wikipedia.org/wiki/Uber_ (company)
Vanitbuncha, K. (2003). Statistical analysis: Statistics for management and research
Thailand. Bangkok: Chulalongkon University.
What is brand loyalty in marketing? Definition & examples. (n.d.). Retrieved from
http://study.com/academy/lesson/what-is-brand-loyalty-in-marketing-definition-
examples-quiz.html
Wigmore, I. (2013). Mobile App. Retrieved from http://whatis.techtarget.com/
definition/mobile-app

89
APPENDIX

90
Appendix A: Questionnaire
The Survey on Study of Factors Influencing Consumer Brand Choice of Top 3 Taxi
Booking Mobile Applications in Bangkok: Uber, Grabtaxi and Easy Taxi
As part of my MBA Independent Study course in Bangkok University, The
researcher is conducting a survey that investigate “Factors Influencing Consumer
Brand Choice of Top 3 Taxi Booking Mobile Applications in Bangkok: Uber,
Grabtaxi and Eaxi Taxi”. The researcher will appreciate if the attendant completes the
following question. Any information obtained in connection with this study that can
be identified with you will remain confidential.
แบบสอบถามหวขอ Study of Factors Influencing Consumer Brand Choice of Top 3
Taxi Booking Mobile Applications in Bangkok: Uber, Grabtaxi and Easy Taxi นเปนสวน
หนงของรายวชา Independent Study คณะบรหารธรกจ ปรญญาโท มหาวทยาลยกรงเทพ ผวจยตองขอขอบพระคณผตอบ
แบบสอบถามและยนยนวาขอมลทงหมดจะถกน ามาใชในการศกษารายวชานเทานน ไมมการเผยแพรขอมลสวนตวใดๆแก
สาธารณะ
This survey is divided into 4 parts: แบบสอบถามชดนถกแบงออกเปน 4 สวน ไดแก
1. General information แบบสอบถามขอมลทวไป
2. Marketing factors influencing consumer brand choices
ปจจยทางการตลาดทสงผลตอการตดสนใจเลอกแบรนด

91
3. Consumer behavior influencing consumer brand choices
พฤตกรรมการบรโภคทมผลตอการตดสนใจเลอกแบรนด
4. Demographic ขอมลของผตอบแบบสอบถาม
Part 1: General information แบบสอบถามขอมลทวไป
Q1. What is your most used taxi booking mobile app?
แอพพลเคชนแทกซทใชบอยทสดของคณคออะไร
o Uber อเบอร o Grabtaxi แกรบแทกซ o Easy Taxi อซแทกซ
Q2. Ranking the below factors influencing consumer brand choice of the mobile
applications chosen in Q1
โปรดใหคะแนนปจจยทสงผลตอการเลอกใชบรการแทกซแอพททานเลอกตามค าถามท 1
Not any effective Extremely important
ไมมผล ส าคญอยางยง
Please select the number that
correspond with your opinion 0 1 2 3 4 5 6 7
2.1 Taxi Service บรการแทกซ
2.2 Price ราคา
2.3 Availability ความพรอมในการใหบรการ
2.4 Promotion การสงเสรมการใหบรการ
2.5 Car condition สภาพรถทใหบรการ
2.6 Service Quality คณภาพของบรการ

92
Please select the number that
correspond with your opinion 0 1 2 3 4 5 6 7
2.7 Driver คนขบ
2.8 Mobile Application
แอพพลเคชนบนมอถอ
2.9 Brand Name แบรนด
2.10 Consumer Behavior
พฤตกรรมการบรโภค
Part 2: Marketing factor influencing consumer brand choices
ปจจยทางการตลาดทสงผลตอการตดสนใจเลอกแบรนด
Q3. Marketing Mix (7Ps) สวนผสมทางการตลาด
Not at all important Very important
ไมส าคญ ส าคญมาก
Please select the number that correspond
with your opinion 1 2 3 4 5
Product/Service สนคา/บรการ
3.1 Service บรการ
3.2 Security ความปลอดภย
3.3 Convenience ความสะดวก
Price ราคา
3.4 Reasonable สมเหตสมผล
3.5 Pay by cash การจายดวยเงนสด
3.6 Pay by credit card การจายดวยบตรเครดต

93
Please select the number that correspond
with your opinion 1 2 3 4 5
Place สถานท
3.7 Availability in business area
ความพรอมใหบรการในยานธรกจ
3.8 Availability in residential area
ความพรอมใหบรการในยานทอยอาศย
3.9 Availability of number of taxi
จ านวนแทกซทพรอมใหบรการ
3.7 Availability in business area
ความพรอมใหบรการในยานธรกจ
3.8 Availability in residential area
ความพรอมใหบรการในยานทอยอาศย
3.9 Availability of number of taxi
จ านวนแทกซทพรอมใหบรการ
3.12 Advertising การโฆษณา
Physical Environment สภาพแวดลอมทางกายภาพ
3.13 Car condition สภาพรถ
3.14 Car types ประเภทรถ
3.15 Cleanliness ความสะอาด
Process ขนตอน
3.16 Online booking การจองออนไลน
3.17 Service during the trip การบรการขณะเดนทาง
3.18 Giving feedback การใหค าตชมหลงใชบรการ

94
Please select the number that correspond
with your opinion 1 2 3 4 5
Driver คนขบ
3.19 Friendliness and politeness ความเปนมตรและความสภาพ
3.20 Knowledge and skill ความรความสามารถของผขบ
3.21 Trust and credibility ความไววางใจและความนาเชอถอ
Q4. Mobile application factors ปจจยทางแอพพลเคชนในมอถอ
Not at all important Very important
ไมส าคญ ส าคญมาก
Please select the number that correspond
with your opinion 1 2 3 4 5
4.1 Simplicity of Mobile application features
ความเรยบงายของหนาตาแอพพลเคชน
4.2 Clear, user-friendly navigation
ความชดเจน งายตอการใชงาน
4.3 Good use of color การใชสทด
4.4 Well-formatted content การใชเนอหาทด
4.5 Speed/ Fast load time ความเรวในการดาวนโหลด
4.6 Professional app design
การออกแบบเแอพอยางมออาชพ
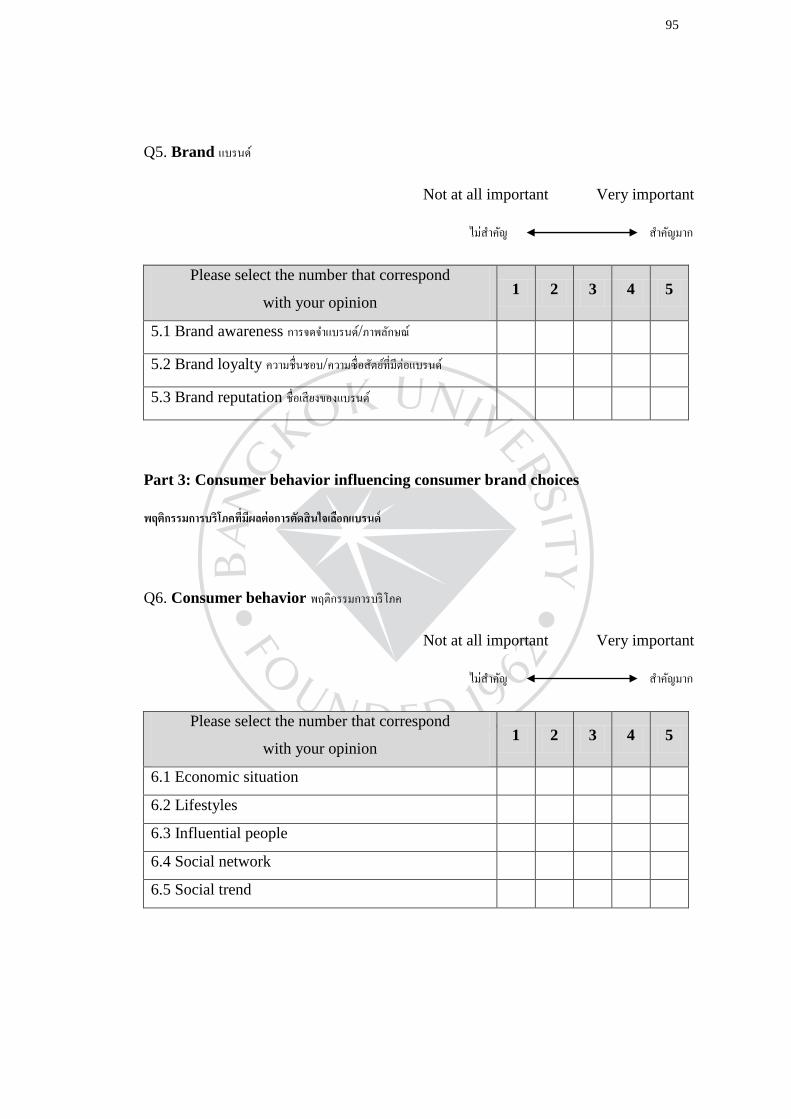
95
Q5. Brand แบรนด
Not at all important Very important
ไมส าคญ ส าคญมาก
Please select the number that correspond
with your opinion 1 2 3 4 5
5.1 Brand awareness การจดจ าแบรนด/ภาพลกษณ
5.2 Brand loyalty ความชนชอบ/ความซอสตยทมตอแบรนด
5.3 Brand reputation ชอเสยงของแบรนด
Part 3: Consumer behavior influencing consumer brand choices
พฤตกรรมการบรโภคทมผลตอการตดสนใจเลอกแบรนด
Q6. Consumer behavior พฤตกรรมการบรโภค
Not at all important Very important
ไมส าคญ ส าคญมาก
Please select the number that correspond
with your opinion 1 2 3 4 5
6.1 Economic situation
6.2 Lifestyles
6.3 Influential people
6.4 Social network
6.5 Social trend
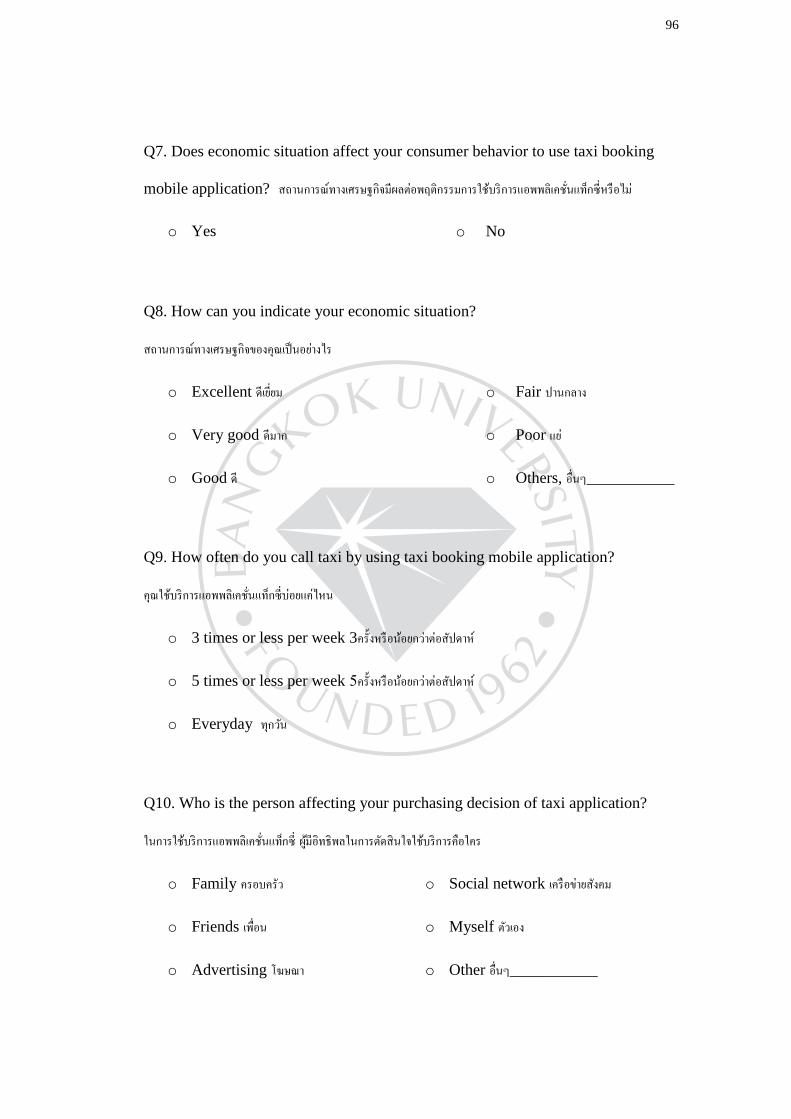
96
Q7. Does economic situation affect your consumer behavior to use taxi booking
mobile application? สถานการณทางเศรษฐกจมผลตอพฤตกรรมการใชบรการแอพพลเคชนแทกซหรอไม
o Yes o No
Q8. How can you indicate your economic situation?
สถานการณทางเศรษฐกจของคณเปนอยางไร
o Excellent ดเยยม
o Very good ดมาก
o Good ด
o Fair ปานกลาง
o Poor แย
o Others, อนๆ___________
Q9. How often do you call taxi by using taxi booking mobile application?
คณใชบรการแอพพลเคชนแทกซบอยแคไหน
o 3 times or less per week 3ครงหรอนอยกวาตอสปดาห
o 5 times or less per week 5ครงหรอนอยกวาตอสปดาห
o Everyday ทกวน
Q10. Who is the person affecting your purchasing decision of taxi application?
ในการใชบรการแอพพลเคชนแทกซ ผมอทธพลในการตดสนใจใชบรการคอใคร
o Family ครอบครว
o Friends เพอน
o Advertising โฆษณา
o Social network เครอขายสงคม
o Myself ตวเอง
o Other อนๆ___________
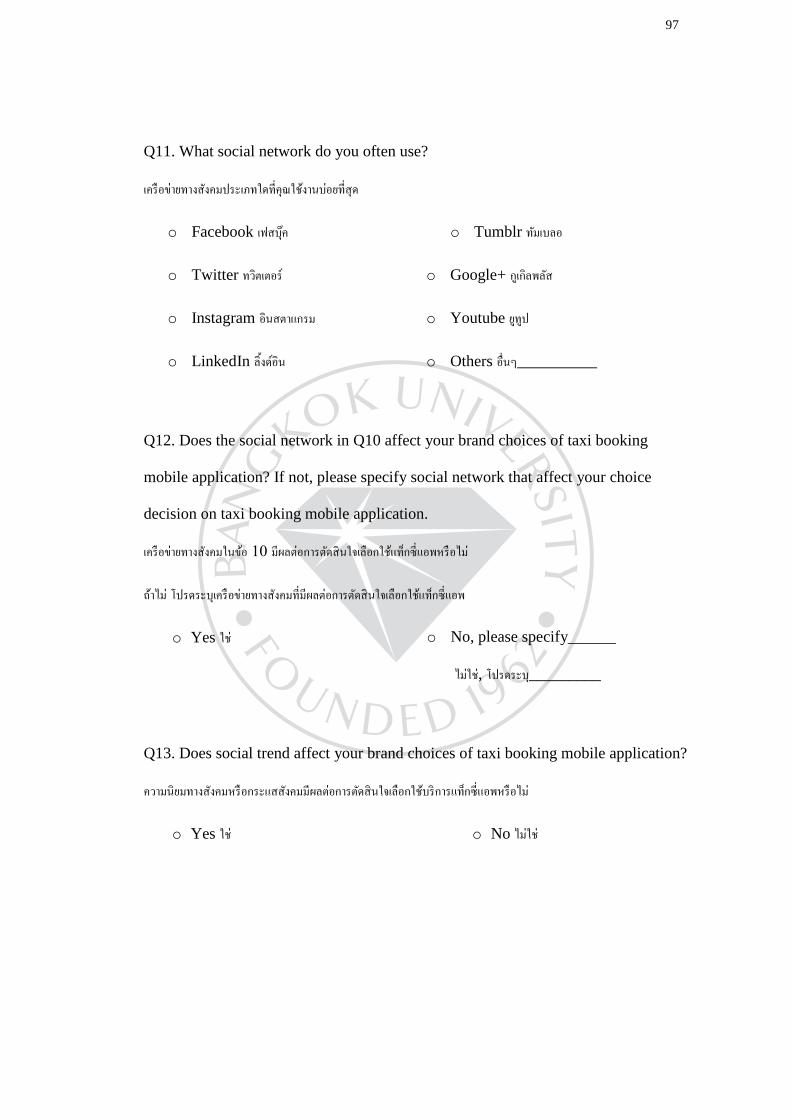
97
Q11. What social network do you often use?
เครอขายทางสงคมประเภทใดทคณใชงานบอยทสด
o Facebook เฟสบค
o Twitter ทวตเตอร
o Instagram อนสตาแกรม
o LinkedIn ลงดอน
o Tumblr ทมเบลอ
o Google+ กเกลพลส
o Youtube ยทป
o Others อนๆ__________
Q12. Does the social network in Q10 affect your brand choices of taxi booking
mobile application? If not, please specify social network that affect your choice
decision on taxi booking mobile application.
เครอขายทางสงคมในขอ 10 มผลตอการตดสนใจเลอกใชแทกซแอพหรอไม
ถาไม โปรดระบเครอขายทางสงคมทมผลตอการตดสนใจเลอกใชแทกซแอพ
o Yes ใช
o No, please specify______
ไมใช, โปรดระบ_________
Q13. Does social trend affect your brand choices of taxi booking mobile application?
ความนยมทางสงคมหรอกระแสสงคมมผลตอการตดสนใจเลอกใชบรการแทกซแอพหรอไม
o Yes ใช o No ไมใช

98
Q14. Will you use taxi booking mobile application again and happily recommend
them to others? คณจะใชบรการแอพพลเคชนแทกซอก และแนะน าใหคนอนใชหรอไม
o Definitely will ใชแนนอนแนะน าตอ
o Definitely won’t ไมใชแนนอนและไมแนะน าตอ
o Probably will อาจจะใชและอาจจะแนะน าตอ
o Probably won’t อาจจะไมใชและอาจจะไมแนะน าตอ
Part 4: Demographic ขอมลทวไปของผตอบแบบสอบถาม
Q15. Job title/Profession อาชพ_________________________________
Q16. Gender เพศ
o Male ชาย
o Female หญง
Q17. Age อาย
o 20 and under 20ปหรอต ากวา
o 21-30
o 31-40
o 41-50
o 51-60
o 61 and over 61ปหรอมากกวา

99
Q18. Race/Ethnicity ชาตพนธ
o White
o Asian เอเชย
o Hispanic or Latino
o Black
o Others____________
Q19. The highest level of education ระดบการศกษาสงสด
o High school or less โรงเรยนมธยมหรอต ากวา
o High school or equivalent โรงเรยนมธยมหรอเทยบเทา
o Vocational/technical school สายอาชพ / อาชวะ
o Some college วทยาลย
o Bachelor’s degree ปรญญาตร
o Master’s degree ปรญญาโท
o Professional degree การศกษาวชาเฉพาะทาง
o Doctoral degree ปรญญาเอก
o Others อนๆ_______________
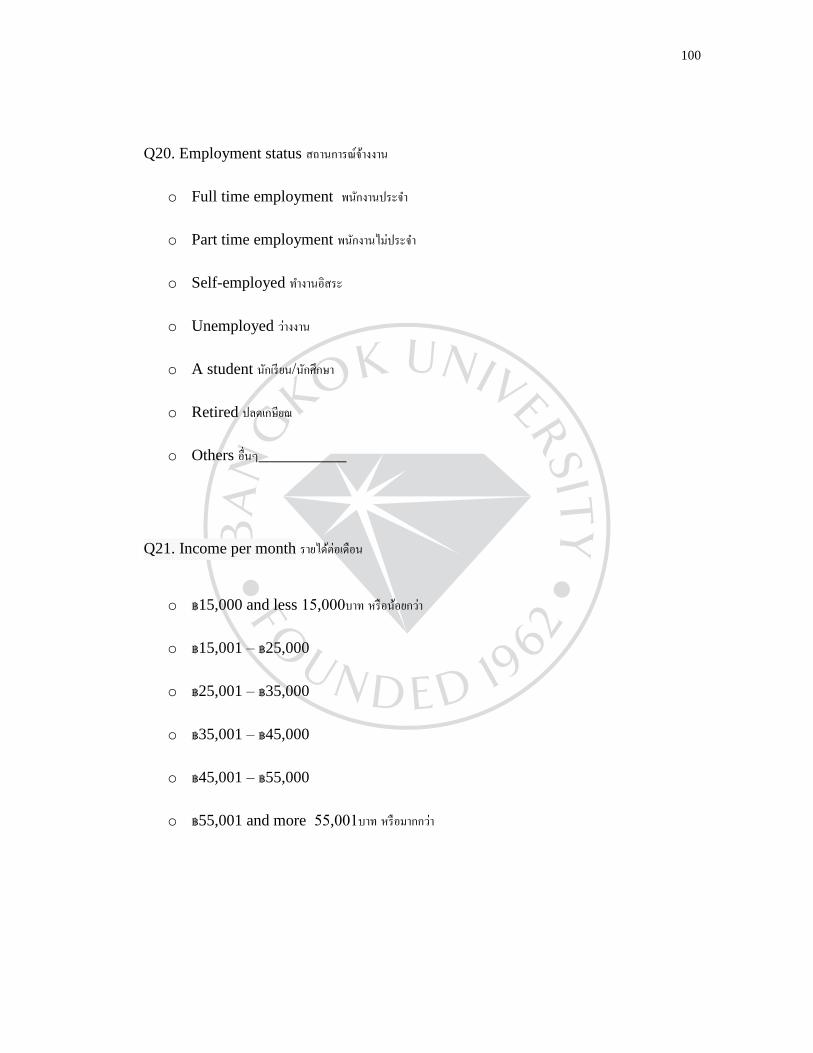
100
Q20. Employment status สถานการณจางงาน
o Full time employment พนกงานประจ า
o Part time employment พนกงานไมประจ า
o Self-employed ท างานอสระ
o Unemployed วางงาน
o A student นกเรยน/นกศกษา
o Retired ปลดเกษยณ
o Others อนๆ___________
Q21. Income per month รายไดตอเดอน
o ฿15,000 and less 15,000บาท หรอนอยกวา
o ฿15,001 – ฿25,000
o ฿25,001 – ฿35,000
o ฿35,001 – ฿45,000
o ฿45,001 – ฿55,000
o ฿55,001 and more 55,001บาท หรอมากกวา

101
Appendix B: Content Validity
Index of Item Objective Congruence (IOC) is the consistency between the objective
and content or questions and objective which can be calculate from the formula
below. Σ
Where: IOC = Consistency between the objective and content or questions
and objective.
Σ = Total assessment points given from all qualified experts.
N = Number of qualified experts.
There are 3 levels of assessment point as follow:
+1 means the question is certainly consistent with the objective of the
questionnaire.
0 means the question is unsure to be consistent with the objective of the
questionnaire.
-1 means the question is inconsistent with the objective of the questionnaire.
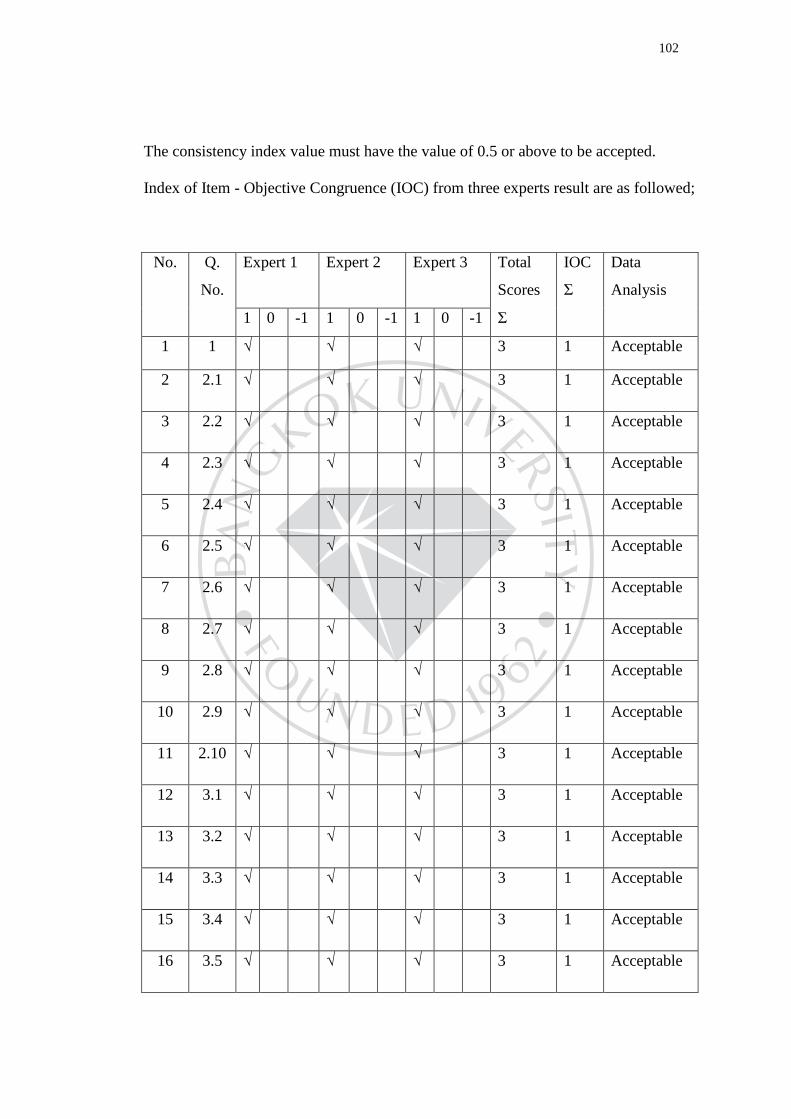
102
The consistency index value must have the value of 0.5 or above to be accepted.
Index of Item - Objective Congruence (IOC) from three experts result are as followed;
No. Q.
No.
Expert 1 Expert 2 Expert 3 Total
Scores
IOC
Σ
Data
Analysis
1 0 -1 1 0 -1 1 0 -1 Σ
1 1 √ √ √ 3 1 Acceptable
2 2.1 √ √ √ 3 1 Acceptable
3 2.2 √ √ √ 3 1 Acceptable
4 2.3 √ √ √ 3 1 Acceptable
5 2.4 √ √ √ 3 1 Acceptable
6 2.5 √ √ √ 3 1 Acceptable
7 2.6 √ √ √ 3 1 Acceptable
8 2.7 √ √ √ 3 1 Acceptable
9 2.8 √ √ √ 3 1 Acceptable
10 2.9 √ √ √ 3 1 Acceptable
11 2.10 √ √ √ 3 1 Acceptable
12 3.1 √ √ √ 3 1 Acceptable
13 3.2 √ √ √ 3 1 Acceptable
14 3.3 √ √ √ 3 1 Acceptable
15 3.4 √ √ √ 3 1 Acceptable
16 3.5 √ √ √ 3 1 Acceptable

103
No. Q.
No.
Expert 1 Expert 2 Expert 3 Total
Scores
IOC
Σ
Data
Analysis
1 0 -1 1 0 -1 1 0 -1 Σ
17 3.6 √ √ √ 3 1 Acceptable
18 3.7 √ √ √ 3 1 Acceptable
19 3.8 √ √ √ 3 1 Acceptable
20 3.9 √ √ √ 3 1 Acceptable
21 3.10 √ √ √ 3 1 Acceptable
22 3.11 √ √ √ 3 1 Acceptable
23 3.12 √ √ √ 3 1 Acceptable
24 3.13 √ √ √ 3 1 Acceptable
25 3.14 √ √ √ 3 1 Acceptable
26 3.15 √ √ √ 3 1 Acceptable
27 3.16 √ √ √ 3 1 Acceptable
28 3.17 √ √ √ 3 1 Acceptable
29 3.18 √ √ √ 3 1 Acceptable
30 3.19 √ √ √ 3 1 Acceptable
31 3.20 √ √ √ 3 1 Acceptable
32 3.21 √ √ √ 3 1 Acceptable
33 4.1 √ √ √ 3 1 Acceptable
34 4.2 √ √ √ 3 1 Acceptable
35 4.3 √ √ √ 3 1 Acceptable

104
No. Q.
No.
Expert 1 Expert 2 Expert 3 Total
Scores
IOC
Σ
Data
Analysis
1 0 -1 1 0 -1 1 0 -1 Σ
36 4.4 √ √ √ 3 1 Acceptable
37 4.5 √ √ √ 3 1 Acceptable
38 4.6 √ √ √ 3 1 Acceptable
39 5.1 √ √ √ 3 1 Acceptable
40 5.2 √ √ √ 3 1 Acceptable
41 5.3 √ √ √ 3 1 Acceptable
42 6.1 √ √ √ 3 1 Acceptable
43 6.2 √ √ √ 3 1 Acceptable
44 6.3 √ √ √ 3 1 Acceptable
45 6.4 √ √ √ 3 1 Acceptable
46 6.5 √ √ √ 3 1 Acceptable
47 7 √ √ √ 3 1 Acceptable
48 8 √ √ √ 3 1 Acceptable
49 9 √ √ √ 3 1 Acceptable
50 10 √ √ √ 3 1 Acceptable
51 11 √ √ √ 2 0.67 Acceptable
52 12 √ √ √ 3 1 Acceptable
53 13 √ √ √ 3 1 Acceptable
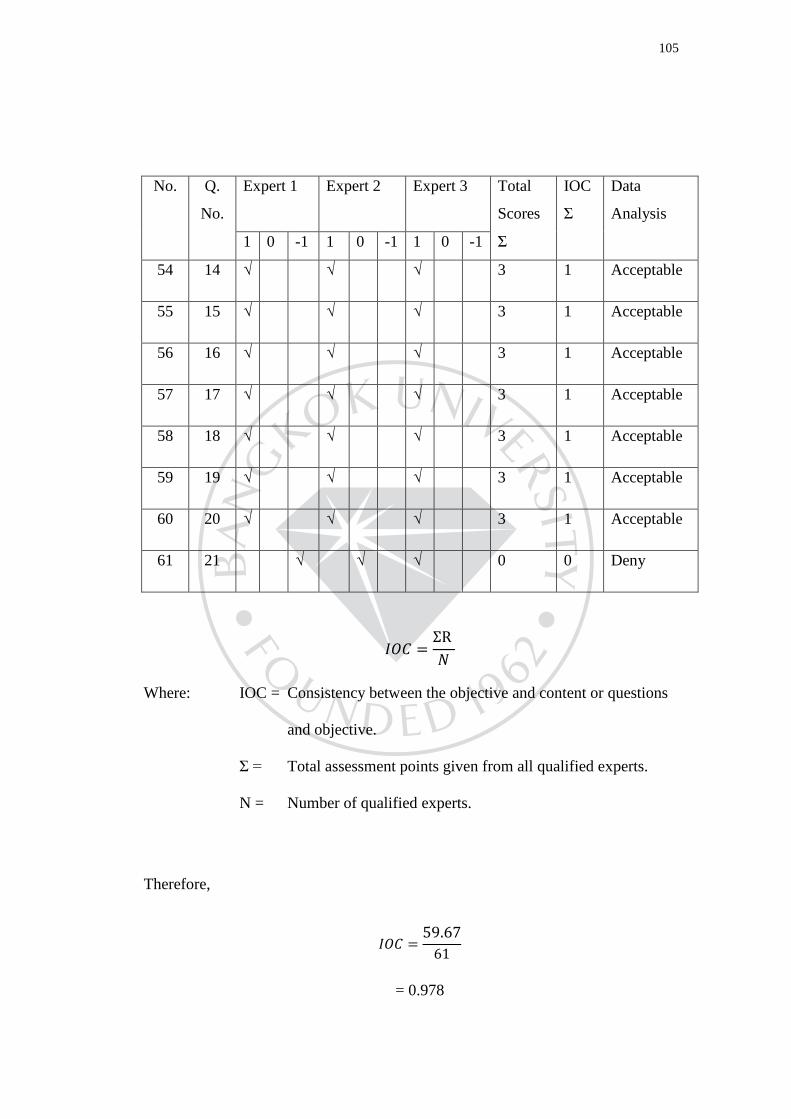
105
No. Q.
No.
Expert 1 Expert 2 Expert 3 Total
Scores
IOC
Σ
Data
Analysis
1 0 -1 1 0 -1 1 0 -1 Σ
54 14 √ √ √ 3 1 Acceptable
55 15 √ √ √ 3 1 Acceptable
56 16 √ √ √ 3 1 Acceptable
57 17 √ √ √ 3 1 Acceptable
58 18 √ √ √ 3 1 Acceptable
59 19 √ √ √ 3 1 Acceptable
60 20 √ √ √ 3 1 Acceptable
61 21 √ √ √ 0 0 Deny
Where: IOC = Consistency between the objective and content or questions
and objective.
Σ = Total assessment points given from all qualified experts.
N = Number of qualified experts.
Therefore,
= 0.978

106
The assessment result of questions on this questionnaire has value index of item
objective congruence (IOC) equal to 0.978 with one question that has IOC index less
than 0.5.
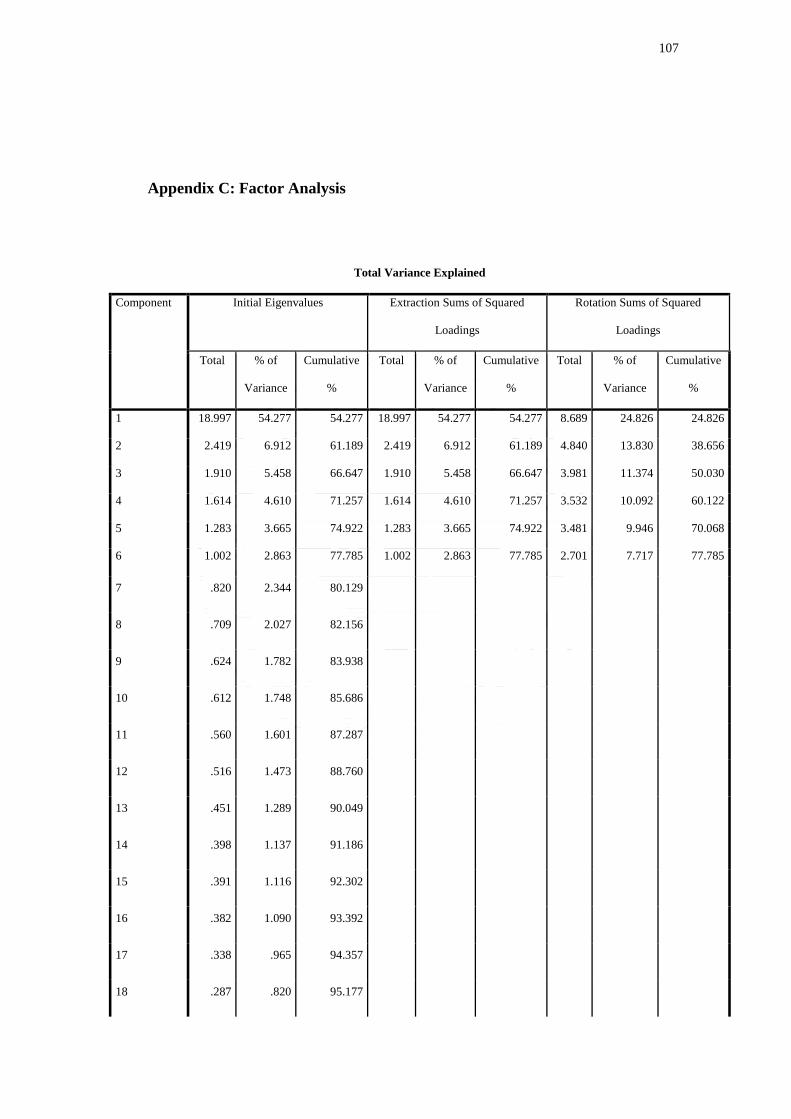
107
Appendix C: Factor Analysis
Total Variance Explained
Component Initial Eigenvalues Extraction Sums of Squared
Loadings
Rotation Sums of Squared
Loadings
Total % of
Variance
Cumulative
%
Total % of
Variance
Cumulative
%
Total % of
Variance
Cumulative
%
1 18.997 54.277 54.277 18.997 54.277 54.277 8.689 24.826 24.826
2 2.419 6.912 61.189 2.419 6.912 61.189 4.840 13.830 38.656
3 1.910 5.458 66.647 1.910 5.458 66.647 3.981 11.374 50.030
4 1.614 4.610 71.257 1.614 4.610 71.257 3.532 10.092 60.122
5 1.283 3.665 74.922 1.283 3.665 74.922 3.481 9.946 70.068
6 1.002 2.863 77.785 1.002 2.863 77.785 2.701 7.717 77.785
7 .820 2.344 80.129
8 .709 2.027 82.156
9 .624 1.782 83.938
10 .612 1.748 85.686
11 .560 1.601 87.287
12 .516 1.473 88.760
13 .451 1.289 90.049
14 .398 1.137 91.186
15 .391 1.116 92.302
16 .382 1.090 93.392
17 .338 .965 94.357
18 .287 .820 95.177
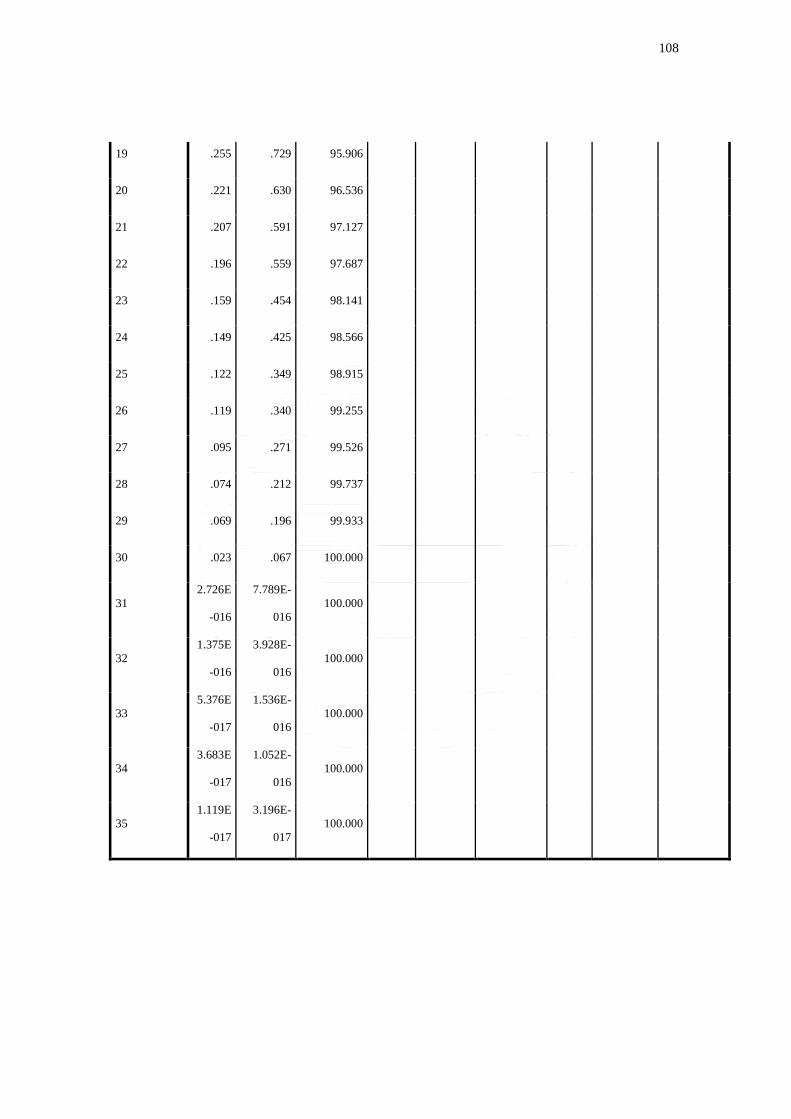
108
19 .255 .729 95.906
20 .221 .630 96.536
21 .207 .591 97.127
22 .196 .559 97.687
23 .159 .454 98.141
24 .149 .425 98.566
25 .122 .349 98.915
26 .119 .340 99.255
27 .095 .271 99.526
28 .074 .212 99.737
29 .069 .196 99.933
30 .023 .067 100.000
31
2.726E
-016
7.789E-
016
100.000
32
1.375E
-016
3.928E-
016
100.000
33
5.376E
-017
1.536E-
016
100.000
34
3.683E
-017
1.052E-
016
100.000
35
1.119E
-017
3.196E-
017
100.000
109
BIODATA
Name: Watchareebhorn Sakunlertvattana
Date of Birth: October 19, 1991
Address: 120 M.4 Khaomaikaew, Kabinburi, Prachinburi, 25110
Thailand.
Email: [email protected]
Contact number: +66944832363
Educational Background: Bachelor of Arts (Humanities and Tourism)
First Class Honors
Major: English
Minor: Business Administration