Infiltrating Basal cell carcinoma Infiltrating Basal cell carcinoma

135
Cent Eur J Public Health 2019; 27 (2): 135–140
SUMMARYObjective: Basal metabolic rate (BMR) is the main part of the total body energy expenditure. The value of BMR is individual and depends on a
lot of factors. The goal of the research was to discover the influence of anthropometric parameters, age and gender, on changes of the BMR values.Methods: A total of 177 individuals of Czech Caucasian origin from South Moravia (BMI 27.3 ± 7.88 kg/m2) aged 18−55 (117 women, 60 men)
were included in the study. Selected anthropometric characteristics were measured using a stadiometer (SECA 213) and bioelectrical impedance analysis (Inbody 230). BMR was measured by indirect calorimetry (Cortex Metalyzer 3B). The measured values were statistically evaluated by the regression analysis and least square method (LSM).
Results: From the following results that the factors that influence the BMR value statistically significantly (p < 0.05) are: age, gender, body mass index, total body water, and percent of body fat.
Conclusion: Body fat and age have both an indirect impact on the basal metabolic rate of the Czech population in working age. However, BMI and the total body water were discovered to have a direct influence on the BMR.
Key words: basal metabolic rate, indirect calorimetry, bioelectrical impedance, BMI, anthropometry, total body water, percent of body fat
Address for correspondence: J. Olejníčková, Department of Public Health, Faculty of Medicine, Masaryk University, Kamenice 5, 625 00 Brno, Czech Republic. E-mail: [email protected]
https://doi.org/10.21101/cejph.a5103
FACTORS INFLUENCING BASAL METABOLISM OF CZECHS OF WORKING AGE FROM SOUTH MORAVIAJana Olejníčková, Martin Forejt, Erika Čermáková, Lucie HudcováDepartment of Public Health, Faculty of Medicine, Masaryk University, Brno, Czech Republic
INTRODUCTION
In the last two decades, there is a marked increase worldwide in the number of overweight people and people with obesity (more than one billion adults) (1–4). This trend is alarming because ex-cessive body weight and obesity are connected to a dozen health problems (such as cardiovascular disease, diabetes type II, gall bladder disease, some types of cancer, and early death) (5–7). Global changes in eating habits and lifestyles lead to excessive energy intake and decreased physical activity (1, 8).
A measurement of BMR and body composition is important for the prevention of obesity. It can help to solve many connected social problems (9).
The food intake energy is transformed from the chemical form into other forms of energy that are further used by the human organism. It is mainly the transformation into mechanical energy for the contraction of muscles, thermal energy for the corporal heat regulation, and electrical energy for the brain and nerve activity (10). Energy intake and output should be in balance. When the energy intake is higher than needed, the unused energy is transformed into body fat.
Total daily energy expenditure (TDEE) consists of three parts: basal metabolic rate (BMR), diet induced thermogenesis (DIT), and energy expenditure during a physical activity (11). The main part of TDEE in regular individuals consists of BMR. BMR constitutes 60–70% of TDEE and includes the energy spent by providing the maintenance of the organism’s vital functions. The
energy spent by physical activities represents 15–30% of TDEE and changes according to the individual’s physical activity level (12). A determinant of DIT is the energy content of the food. DIT values for separate nutrients are 0 to 3% for fat, 5 to 10% for carbohydrate, 20 to 30% for protein, and 10 to 30% for alcohol. In healthy subjects with a mixed diet, DIT represents about 10% of TDEE (13).
In the 1985 FAO/WHO/UNU report on human energy and protein requirements, it was proposed to use the amount of energy expenditure rather than food intake to calculate the overall energy requirements. Additionally, it was proposed that TDEE can be expressed as multiples of BMR, defined as physical activity level (PAL) (14, 15). This approach to estimate energy requirements necessitates the accurate estimation of BMR in populations of different ethnicities, body types/weight, and those living under various environmental conditions.
Indirect calorimetry, which is based on the measurement of oxygen consumption and carbon dioxide production, is the pre-ferred method to accurately assess BMR.
Generally, BMR depends on body composition expressed by fat-free mass (FFM) and fat mass (FM), and on gender, age, physical activity, and nutritional status. The main determinant of BMR is FFM (6), whereas FM is significant only in obese subjects (16). Gender is also a significant determinant of BMR, with males having a greater BMR than females after adjusting the figures of different body compositions (16, 17). In addition, BMR markedly decreases with advancing age in sedentary populations (18) at a

136
rate of ~1–2% per decade after the age of 20 years. Such a decline in energy expenditure (EE) probably contributes to an impaired ability to regulate energy balance with age. Several studies have addressed the issue whether EE decreases with age and whether females have lower EE than males (18–20).
MATERIALS AND METHODS
SubjectsA total of 177 individuals (117 women, 60 men) of Czech
Caucasian origin from South Moravia (BMI 27.3 ± 7.88 kg/m2), aged 18–55 years were included in the study. The range of meas-ured BMI values in subjects is shown in Fig. 1. Study participants were recruited in a mass media campaign (all from South Moravia in the Czech Republic). Subjects who had overt metabolic and/or endocrine diseases (e.g., diabetes, hypothyroidism, hyperten-sion, amenorrhea) and those taking any drugs known to influence energy metabolism were excluded from the study. The PAL of the participants were in the ranges between 1.40 and 1.69 for sedentary and light activity lifestyles (21).
The study was conducted according to guidelines set out in the Declaration of Helsinki. All procedures involving human subjects were approved by the Committee for Ethics of Medical Experi-ments on Human Subjects at the Faculty of Medicine of Masaryk University, Brno, Czech Republic. Written informed consent was obtained from all subjects and has been duly archived.
Anthropometric CharacteristicsAll anthropometric measurements were carried out by a trained
(qualified) specialist in the morning (between 7 to 9 a.m.). Par-ticipants were measured after an overnight fasting and in thermo neutral conditions (in a room heated to 22–25 °C). Subjects were not allowed to eat, drink or smoke between the tests. Exercise was not allowed during the 12-hour fasting period.
Firstly their height was measured by using a portable stadi-ometer SECA 213 (Medizinische Waagen und Messsysteme, Hamburg, Germany) measuring to an accuracy of 0.1 cm.
Body composition was assessed by 8-pole bioelectrical imped-ance analysis using the InBody 230 (Biospace, Seoul, Korea). Participants were measured in tight underwear or swimwear without shoes, socks, glasses, watches, rings or other jewellery. The Inbody 230 uses eight tactile electrodes: two are in contact with the palm and thumb of each hand and two with the anterior and posterior aspects of the sole of each foot. Subjects stand with their soles in contact with the foot electrodes and grab the hand electrodes. The following parameters were used for the research: gender (G), age (Y), height (H), weight (W), body mass index (BMI), intracellular water value (ICW), total amount of body water (TBW), amount of proteins (P), amount of minerals (M), amount of body fat (BF), percent of body fat (%BF), obesity (O), physical condition index (C), and amount of skeletal muscles (SM).
BMR was measured by using an open-circuit indirect calori- meter Cortex Metalyzer 3B (CORTEX Biophysik Gmbh, Ger-many). The gas analyzers were calibrated before each test by using a reference gas mixture (15.0% O2 and 5.0% CO2). The subjects
had to be at rest while being awake and in a supine position (22). A 30-minute measurement protocol was followed with the first 5 minutes of data automatically discarded (23).
All devices were precisely calibrated before each measuring session.
Statistical AnalysisAll discovered and measured values were statistically evalu-
ated by computer software Gretl (Allin Cottrell, South Caroline). The regression analysis and least square method (LSM) were used in the evaluation. Test of multicollinearity, test of normal distribution and Mann-Whitney test were used to determinate the correctness of models. The statistical significance of the pa-rameters was inquired by a 5% level of significance (α = 0.05). The dependent variables were represented by selected values of BMR and the following were independent variables: gender, age, height, weight, body mass index, intracellular water mass, total body water mass, protein mass, bone mineral content, body fat mass, percent of body fat, obesity degree, fitness score, and skeletal muscle mass.
RESULTS
A basic description of the data was performed using common statistical methods. Average values and standard deviation were used to describe the data set (Table 1). The mean age was 30 years, which corresponds to the average working age. The mean height was 170.7 cm and mean weight was 81.4 kg in the sample. The mean BMI was 27.3 kg.m−2 (37% of participants had BMI less than 25.0 kg.m−2 and 63% had BMI greater than 25.0 kg.m−2). The mean BMR was 1887.5 kcal/day. All subjects had low level of physical activity (PAL < 1.49).
By mapping the measured BMR results onto Fig. 2 we discov-ered that the biggest concentration of points is spread between the values of 1,700–2,200 units of BMR.
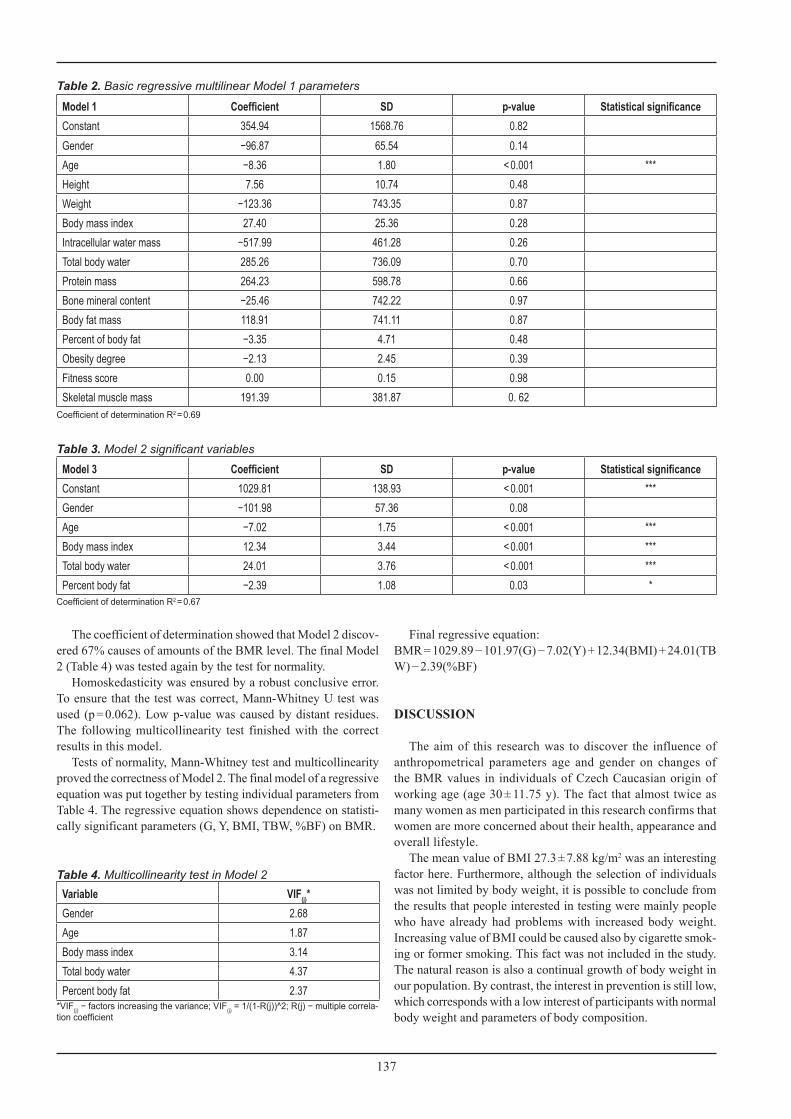
After using LSM, the below values of parameters of the basic regressive multilinear Model 1 were obtained (Table 2).
When a 5% level of p-values was used, the majority of vari-ables seemed as statistically insignificant (except for age). One by one, particular parameters were eliminated and according to the level of p-value, a subsequent model, using LSM, was put together. All of the insignificant parameters were eliminated us-ing this method.
Gained Model 2 (Table 3) contained the following significant variables: gender, age, body mass index, total body water, and percent of body fat (complied with the 5% level of significance).
Mean SDAge (years) 30.0 11.75Height (cm) 170.7 8.55Weight (kg) 81.4 27.22BMI (kg.m−2) 27.3 7.88BMR (kcal/d) 1887.5 391.60
Table 1. Distribution of participants based on general charac-teristics (N = 177, women 117, men 60)
137
The coefficient of determination showed that Model 2 discov-ered 67% causes of amounts of the BMR level. The final Model 2 (Table 4) was tested again by the test for normality.
Homoskedasticity was ensured by a robust conclusive error. To ensure that the test was correct, Mann-Whitney U test was used (p = 0.062). Low p-value was caused by distant residues. The following multicollinearity test finished with the correct results in this model.
Tests of normality, Mann-Whitney test and multicollinearity proved the correctness of Model 2. The final model of a regressive equation was put together by testing individual parameters from Table 4. The regressive equation shows dependence on statisti-cally significant parameters (G, Y, BMI, TBW, %BF) on BMR.
Final regressive equation:BMR = 1029.89 − 101.97(G) − 7.02(Y) + 12.34(BMI) + 24.01(TBW) − 2.39(%BF)
DISCUSSION
The aim of this research was to discover the influence of anthropometrical parameters age and gender on changes of the BMR values in individuals of Czech Caucasian origin of working age (age 30 ± 11.75 y). The fact that almost twice as many women as men participated in this research confirms that women are more concerned about their health, appearance and overall lifestyle.
The mean value of BMI 27.3 ± 7.88 kg/m2 was an interesting factor here. Furthermore, although the selection of individuals was not limited by body weight, it is possible to conclude from the results that people interested in testing were mainly people who have already had problems with increased body weight. Increasing value of BMI could be caused also by cigarette smok-ing or former smoking. This fact was not included in the study. The natural reason is also a continual growth of body weight in our population. By contrast, the interest in prevention is still low, which corresponds with a low interest of participants with normal body weight and parameters of body composition.
Model 1 Coefficient SD p-value Statistical significanceConstant 354.94 1568.76 0.82Gender −96.87 65.54 0.14Age −8.36 1.80 < 0.001 ***Height 7.56 10.74 0.48Weight −123.36 743.35 0.87Body mass index 27.40 25.36 0.28Intracellular water mass −517.99 461.28 0.26Total body water 285.26 736.09 0.70Protein mass 264.23 598.78 0.66Bone mineral content −25.46 742.22 0.97Body fat mass 118.91 741.11 0.87Percent of body fat −3.35 4.71 0.48Obesity degree −2.13 2.45 0.39Fitness score 0.00 0.15 0.98Skeletal muscle mass 191.39 381.87 0. 62
Table 2. Basic regressive multilinear Model 1 parameters
Coefficient of determination R2 = 0.69
Model 3 Coefficient SD p-value Statistical significanceConstant 1029.81 138.93 < 0.001 ***Gender −101.98 57.36 0.08Age −7.02 1.75 < 0.001 ***Body mass index 12.34 3.44 < 0.001 ***Total body water 24.01 3.76 < 0.001 ***Percent body fat −2.39 1.08 0.03 *
Coefficient of determination R2 = 0.67
Table 3. Model 2 significant variables
Variable VIF(j)*Gender 2.68Age 1.87Body mass index 3.14Total body water 4.37Percent body fat 2.37
*VIF(j) − factors increasing the variance; VIF(j) = 1/(1-R(j))^2; R(j) − multiple correla-tion coefficient
Table 4. Multicollinearity test in Model 2

138
The aim of this study was to find out which parameters of body composition and in which proportion they influence the final value of BMR. By using successive analysis, we have proved that there is a statistically significant influence of the following parameters on the resulting BMR: gender, age, BMI, TBW, and %BF.
In case of differences between genders, lower BMR values in women were proved. The results showed that if a woman and a man had identical anthropometric parameters and age, the woman should have BMR lower by 101.97 kcal/d than the men. The results have been proved by Roubenoff et al. (24) in their study dealing with the influence of gender and age on BMR. They found out that women have lower values of BMR than men (5,316 ± 818 kJ/d women and 6,487 ± 570 kJ/d men). Other stud-ies that were dealing with the changes of BMR in dependence on gender showed the same results (18, 20).
Lots of previous studies found a relation between age and BMR. These have also proved that with increasing age, there is a decrease in BMR values (11, 25, 26). This research has ob-tained the very same result. The increase of age by one year has
Fig. 1. Range of measured BMI values in subjects (117 women, 60 men).
Fig. 2. Range of measured BMR values in subjects (117 women, 60 men).
caused the decrease of BMR by 7.02 kcal/d. The organism needs the biggest amount of energy at time of growth and the overall development. With increasing age, there is a loss of active body mass and decreasing energy demands.
Another important parameter of this research influencing BMR value was the total amount of body water in the participants. We found out that an increase in the amount of body water by 1 litre increased BMR by 24.01 kcal/d. The influence of body water on BMR was studied also by Jin Park et al. (9) on 717 women. The results demonstrated that other body components, such as intracellular and extracellular water, significantly correlated with the changing values of resulting BMR. Fat free mass consists of about 73% of water, therefore, it contains the major part of total body water. The more muscles the body contains, the higher the BMR (27, 28). Further studies dealing with this topic should be carried out, utilizing a wider spectrum of the population.
Lazzer et al. (19) were dealing with the influence of an-thropometric parameters (waistline, BMI, fat mass) on BMR values. They also found a positive relation between the above

139
body parameters and their influence on the resulting BMR. Our research has also confirmed the direct influence of BMI on the resulting BMR value. If the BMI value of the tested individuals was increased by 1 kg.m−2, then the resulting BMR would also be increased by 12.34 kcal/d.
Previous studies have shown that the main factors influencing the final value of the basal metabolism are muscle mass and fat mass (16–18, 29, 30). However, there are other studies that did not prove the same relations (31, 32). We concluded in our research, that the values of %BF had a statistically significant influence on the resulting values of BMR. We have also observed an indirect dependence, where the value of BMR has dropped by 2.39 kcal/d by increasing the %BF value by 1%. The increased body weight of the tested individuals was due to the higher amount of fat in the body, but not that of the muscle mass. Since the body fat is an inactive mass, it increases the total body weight but decreases the value of BMR.
CONCLUSION
The research has proved the indirect influence of age and %BF on the total value of BMR. Age and %BF decrease the BMR value. The increase in age by only one year has caused the BMR value to decrease by 7.02 kcal/d. The increase in %BF by 1 kilogram has decreased the BMR value by 2.39 kcal/d.
The BMI and TBW values have been proved to have a direct influence on the changes of BMR values. By an increase of 1 kg.m−2 in the BMI value, the resulting BMR was increased by 12.34 kcal/d. By an increase of TBW by 1 litre the BMR was also increased by 24.01 kcal/d.
We can therefore conclude that the statistically significant pa-rameters observed in our research with an influence on the BMR values are the following: gender, age, BMI, TBW, and %BF. We have proved that both BMI and TBW had a direct influence on the increase of the BMR values. The indirect influence, in terms of decreasing BMR, has been proved as being the age and %BF. The BMR values may also be influenced by gender and may de-crease (in females) or increase (in males), when measured within the normal range of body fat mass.
The above results may contribute to a better understanding and widening of the existing findings in the area of body composi-tion and basal metabolism. The acquired information may help with reducing the obesity rate within the population and with the improvement of public health. However, it is necessary to conduct further research and improve the overall knowledge of the population in terms of health and prevention.
Conflict of InterestsNone declared
REFERENCES
1. World Health Organization. Obesity and overweight [Internet]. Geneva: WHO [cited 2016 Nov 22]. Available from: http://www.who.int/media-centre/factsheets/fs311/en/.
2. Mialich MS, Martinez EZ, Jordao Junior AA. Application of body mass index adjusted for fat mass (BMIfat) obtained by bioelectrical impedance in adults. Nutr Hosp. 2014 Aug;30(2):417-24.
3. Karelis AD, St-Pierre DH, Conus F, Rabasa-Lhoret R, Poehlman ET. Metabolic and body composition factors in subgroups of obesity: what do we know? J Clin Endocrinol Metab. 2004 Jun;89(6):2569-75.
4. Jakab Z, Tsouros AD. Health 2020 - achieving health and development in today’s Europe. Cent Eur J Public Health. 2014 Jun;22(2):133-8.
5. Malik VS, Schulze MB, Hu FB. Intake of sugar-sweetened beverages and weight gain: a systematic review. Am J Clin Nutr. 2006 Aug;84(2):274-88.
6. Shields M, Tjepkema M. Trends in adult obesity. Health Rep. 2006 Aug;17(3):53-9.
7. Garrow JS. Obesity and related diseases. Edinburgh: Churchill Living-stone; 1988.
8. Nikpartow N, Danyliw AD, Whiting SJ, Lim H, Vatanparast H. Fruit drink consumption is associated with overweight and obesity in Canadian women. Can J Public Health. 2012 May-Jun;103(3):178-82.
9. Park J, Park JH, So WY. Relationship between bioelectrical impedance-derived estimates of basal metabolic rate and body composition param-eters in female Korean college students. S Afr J Res Sport Phys Educ Recreat. 2015 Jan;37(1):87-98.
10. Matarese LE. Indirect calorimetry: technical aspects. J Am Diet Assoc. 1997 Oct;97(10 Suppl 2):S154-60.
11. Loureiro LL, Fonseca S Jr, Castro NG, Dos Passos RB, Porto CP, Pierucci AP. Basal metabolic rate of adolescent modern pentathlon athletes: agree-ment between indirect calorimetry and predictive equations and the cor-relation with body parameters. PLoS One. 2015 Nov 16;10(11):e0142859. doi: 10.1371/journal.pone.0142859.
12. Schneider P, Meyer F. Are basal metabolic rate prediction equations ap-propriate for overweight and obese adolescents? Rev Bras Med Esporte. 2005 May/Jun;11(3):185e-8e.
13. Westerterp KR. Diet induced thermogenesis. Nutr Metab (Lond). 2004 Aug 18;1(1):5. doi: 10.1186/1743-7075-1-5.
14. Camps SG, Wang NX, Tan WS, Henry CJ. Estimation of basal metabolic rate in Chinese: are the current prediction equations applicable? Nutr J. 2016 Aug 31;15(1):79. doi: 10.1186/s12937-016-0197-2.
15. Livesey G. Energy and protein requirements the 1985 report of the 1981 Joint FAO/WHO/UNU Expert Consultation. Nutr Bull. 1987 Sep;12(3):138-49.
16. Johnstone AM, Murison SD, Duncan JS, Rance KA, Speakman JR. Fac-tors influencing variation in basal metabolic rate include fat-free mass, fat mass, age, and circulating thyroxine but not sex, circulating leptin, or triiodothyronine. Am J Clin Nutr. 2005 Nov;82(5):941-8.
17. Weinsier RL, Schutz Y, Bracco D. Reexamination of the relationship of resting metabolic rate to fat-free mass and to the metabolically ac-tive components of fat-free mass in humans. Am J Clin Nutr. 1992 Apr 1;55(4):790-4.
18. Fukagawa NK, Bandini LG, Young JB. Effect of age on body composition and resting metabolic rate. Am J Physiol. 1990 Aug;259(2 Pt 1):E233-8.
19. Lazzer S, Bedogni G, Lafortuna CL, Marazzi N, Busti C, Galli R, et al. Relationship between basal metabolic rate, gender, age, and body composition in 8,780 white obese subjects. Obesity (Silver Spring). 2010;18(1):71-8.
20. Vaughan L, Zurlo F, Ravussin E. Aging and energy expenditure. Am J Clin Nutr. 1991 Apr;53(4):821-5.
21. Human energy requirements. Food Agric Organ Food Nutr Tech Rep Ser. 2004(1):1-96.
22. Henry CJ. Basal metabolic rate studies in humans: measurement and de-velopment of new equations. Public Health Nutr. 2005 Oct;8(7A):1133-52.
23. Frankenfield DC, Rowe WA, Smith JS, Cooney RN. Validation of several established equations for resting metabolic rate in obese and nonobese people. J Am Diet Assoc. 2003 Sep;103(9):1152-9.
24. Roubenoff R, Hughes VA, Dallal GE, Nelson ME, Morganti C, Kehayias JJ, et al. The effect of gender and body composition method on the ap-parent decline in lean mass-adjusted resting metabolic rate with age. J Gerontol A Biol Sci Med Sci. 2000 Dec;55(12):M757-60.
25. Gallagher D, Allen A, Wang Z, Heymsfield SB, Krasnow N. Smaller organ tissue mass in the elderly fails to explain lower resting metabolic rate. Ann N Y Acad Sci. 2000 May;904(1):449-55.
26. Wang Z, Heshka S, Heymsfield SB, Shen W, Gallagher D. A cellular-level approach to predicting resting energy expenditure across the adult years. Am J Clin Nutr. 2005 Apr;81(4):799-806.
27. Gába A, Zając-Gawlak I, Přidalová M, Pośpiech D. Analysis of differences in selected body composition parameters measured by InBody 720 and Tanita BC-418. Med Sport Bohemica Slovaca. 2011;20(2):88-96. (In Czech.)
28. Ulijaszek SJ, Johnston FE, Preece MA. The Cambridge encyclopedia of human growth and development. Cambridge: Cambridge University Press; 1998.

140
29. Cunningham JJ. Body composition as a determinant of energy expendi-ture: a synthetic review and a proposed general prediction equation. Am J Clin Nutr. 1991;54(6):963-9.
30. Nelson KM, Weinsier RL, Long CL, Schutz Y. Prediction of resting en-ergy expenditure from fat-free mass and fat mass. Am J Clin Nutr. 1992 Nov;56(5):848-56.
31. Svendsen OL, Hassager C, Christiansen C. Impact of regional and total body composition and hormones on resting energy expenditure in over-weight postmenopausal women. Metabolism. 1993 Dec;42(12):1588-91.
32. Bogardus C, Lillioja S, Ravussin E, Abbott W, Zawadzki JK, Young A, et al. Familial dependence of the resting metabolic rate. N Engl J Med. 1986 Jul 10;315(2):96-100.
Received March 12, 2017Accepted in revised form April 17, 2019