Factors Driving Public Bike Share Demand: The Case of Bike Share Toronto Wafic El-Assi Undergraduate...
36
-
Upload
hubert-stokes -
Category
Documents
-
view
217 -
download
5
Transcript of Factors Driving Public Bike Share Demand: The Case of Bike Share Toronto Wafic El-Assi Undergraduate...


Factors Driving Public Bike Share Demand: The Case of Bike Share Toronto
Wafic El-AssiUndergraduate Research Fellow
Supervisor:Prof. Khandker Nurul Habib
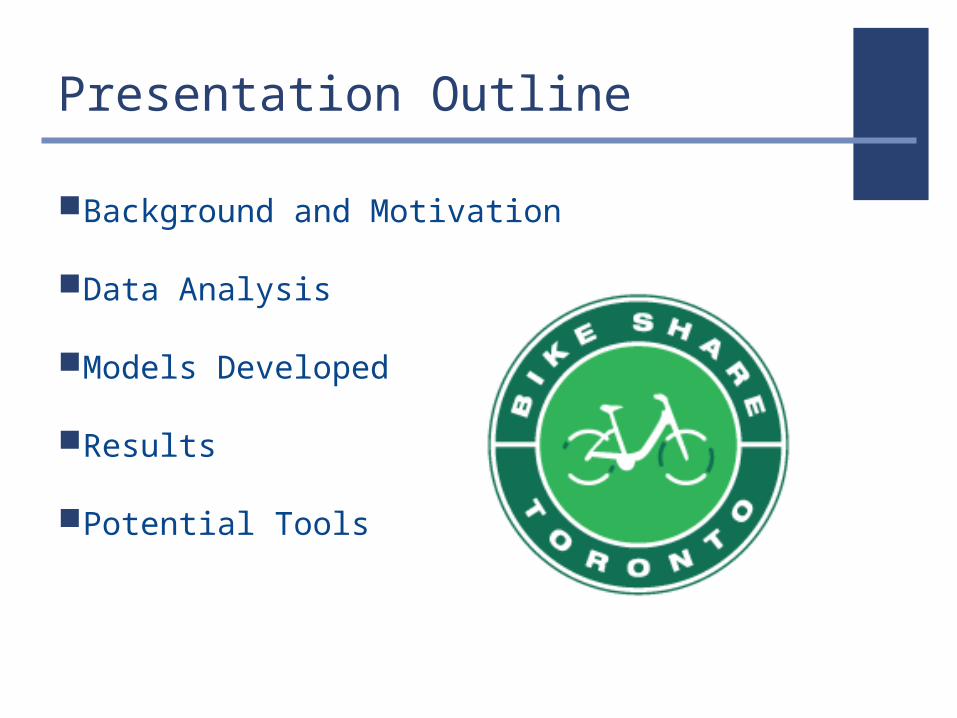
Presentation Outline
Background and Motivation
Data Analysis
Models Developed
Results
Potential Tools

Four Generations:1. “White Bikes” implemented in Amsterdam in 1965
2. “Coin Deposit System” introduced in the mid 1990s to reduce theft incidents
3. “IT based Systems” added transaction kiosks to solve the problem of anonymous users
4. “Demand-Responsive Multimodal systems” improved on docking stations, bicycle redistribution, and integration with other transport modes
History of Public Bike Share Systems

Worldwide Bike Sharing Programs
Over 300 bike sharing programs
(Shaheen et al. ,2010)
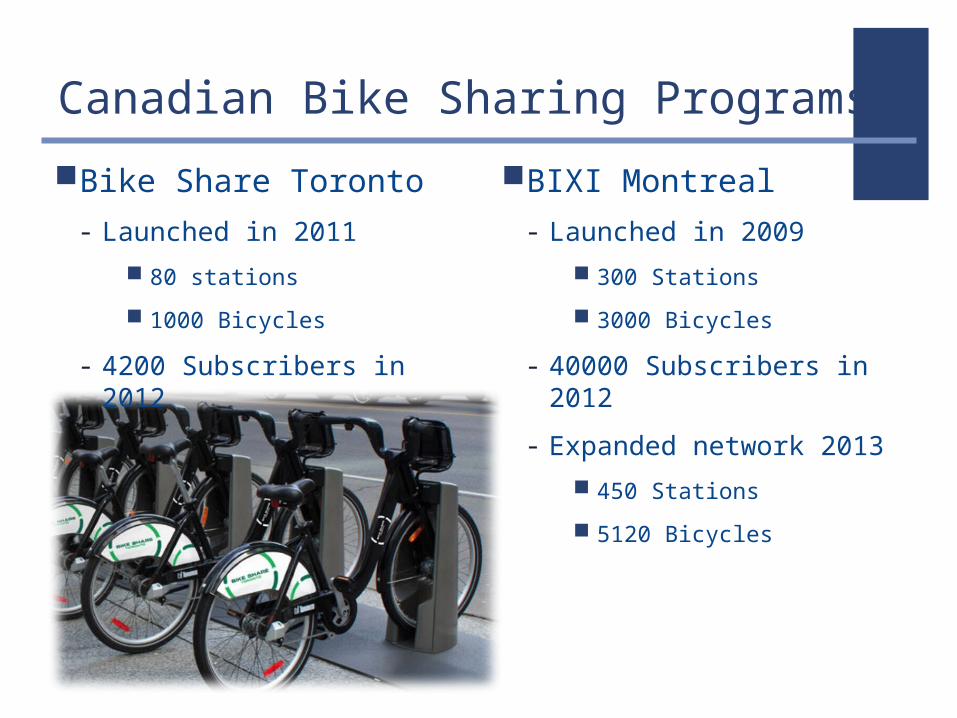
Canadian Bike Sharing Programs
Bike Share Toronto
- Launched in 2011
80 stations
1000 Bicycles
- 4200 Subscribers in 2012
BIXI Montreal
- Launched in 2009
300 Stations
3000 Bicycles
- 40000 Subscribers in 2012
- Expanded network 2013
450 Stations
5120 Bicycles

Canada’s Biking Mode Share
The proportion of commuters via bicycle in Toronto is 1.2%
This represents a 30% increase over previous census years
Commuting via bicycle most common in Downtown area
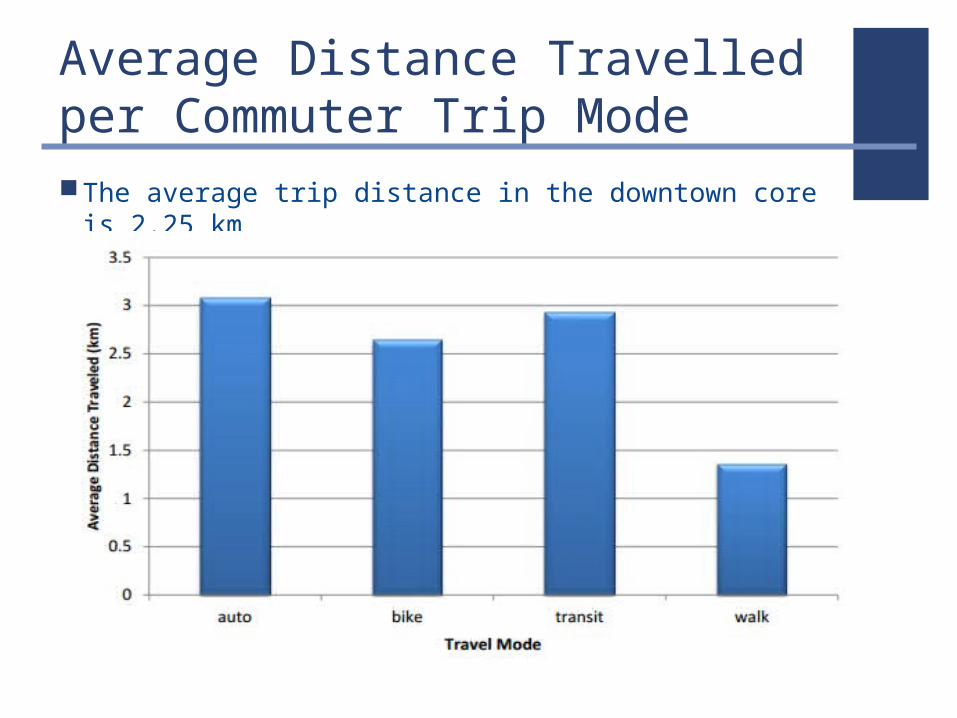
Average Distance Travelled per Commuter Trip ModeThe average trip distance in the downtown core is 2.25
km

Who Uses Bike Share Toronto?
User Attributes Results
Age Group 25 - 54 80%
Bike Ownership 64%
Male 67%
University Degree 79%
Full Time Worker 76%
Income > $80000/yr 52%

How is Toronto Using Bike Share?
Home-Work Commute
2 To 5 Times Per Week 40%
Utilitarian Trip Purposes
1 To 4 Times Per Month 39%
Leisure Trip Purposes
1 To 4 Times Per Month 36%

Factors Affecting Bike Share Ridership: User Perspective
Location of Stations
Very/Extremely Important 92%
Number of Stations
Very/Extremely Important 86%
Availability of Bikes/Docks
Very/Extremely Important 85%
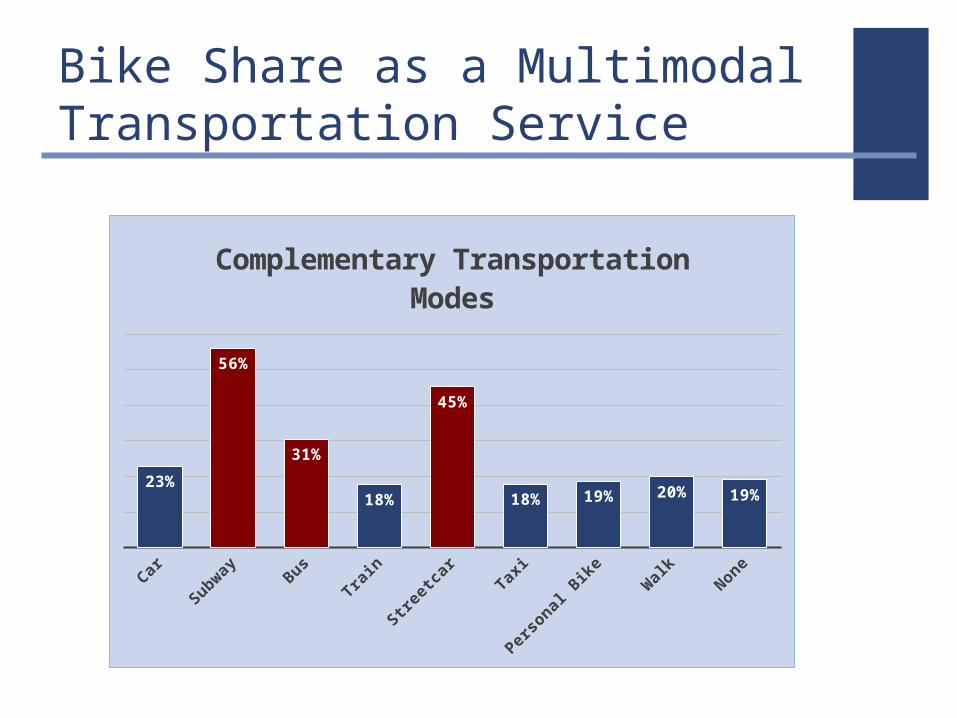
Bike Share as a Multimodal Transportation Service
Car
Subway Bus
Trai
n
Stree
tcar
Taxi
Perso
nal B
ike
Wal
k
None
23%
56%
31%
18%
45%
18% 19% 20% 19%
Complementary Transportation Modes

Available Resources
Bike Share Data Individuals’ detailed trip information:
day of trip start time end time trip duration
Station Location coordinates
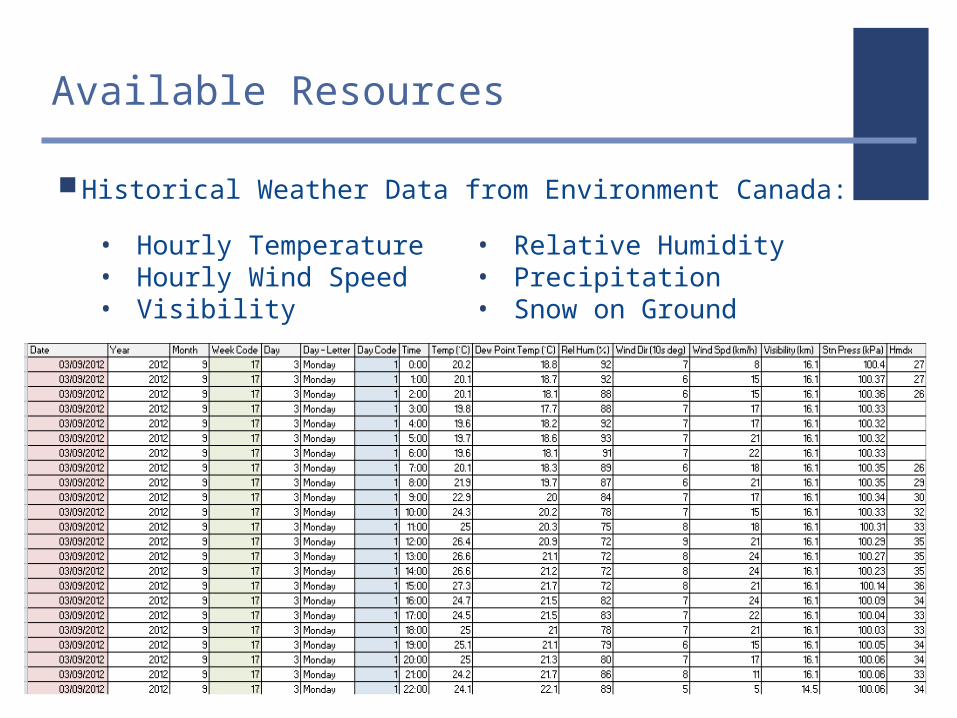
Available Resources
Historical Weather Data from Environment Canada:
• Relative Humidity • Precipitation• Snow on Ground
• Hourly Temperature• Hourly Wind Speed• Visibility
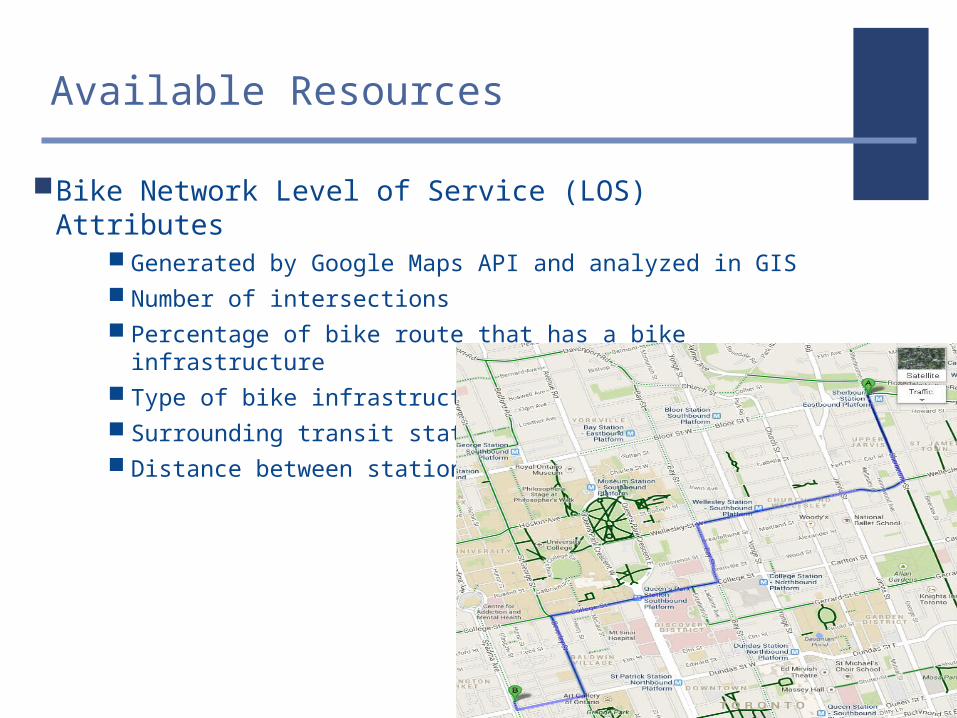
Available Resources
Bike Network Level of Service (LOS) Attributes Generated by Google Maps API and analyzed in GIS Number of intersections Percentage of bike route that has a bike infrastructure Type of bike infrastructure Surrounding transit stations Distance between stations

Available Resources
2011 Transportation Tomorrow Survey (TTS) Data
• Detailed trip Information by all travel modes within the study area
• Zonal employment and population
2013 Bike Share Customer Feedback Survey

Peak Morn-ing24%
Midday21%
Peak Af-ternoon
36%
Evening16%
Overnight3%
Year Round Trip Distribution by Time Period
Year Round

Overnight3%
Peak Morning
28%
Midday18%
Peak Afternoon35%
Evening15%
Overnight5% Peak
Morning9%
Midday29%Peak Afternoon
38%
Evening20%
Trip Distribution by Time Period
Year Round - Registered Year Round - Casual

Trip Distribution by Time Period
January August
Overnight3%
Peak Morning21%
Midday22%
Peak Afternoon36%
Evening17%
Overnight3%
Peak Morning29%
Midday19%
Peak Afternoon36%
Evening14%
August February

Trip Distribution by Time Period
Overnight3%
Peak Morning
21%
Midday22%
Peak Afternoon36%
Evening17%
Overnight4%
Peak Morning
16%
Midday25%Peak Afternoon
36%
Evening19%
August - Registered August - Casual

Trip Distribution by Time Period
Overnight3% Peak
Morning29%
Midday19%
Peak Afternoon36%
Evening13%
Overnight4% Peak
Morning24%
Midday23%
Peak Afternoon33%
Evening17%
February - Registered February - Casual

Registered Day Registered End
60.46%
39.54%
Year Round - Registered
Casual Day Casual End
50.56% 49.44%
Year Round - Casual
Weekend vs Weekday Trip Distribution

Registered Day Registered End
55.00%
45.00%
Registered - August
Casual Day Casual End
46.38%
53.62%
Casual - August
Weekend vs Weekday Trip Distribution

Weekend vs Weekday Trip Distribution
End Registered Day Registered
29.42%
70.58%
Registered - February
End Casual Day Casual
38.86%
61.14%
Casual - Feb-ruary
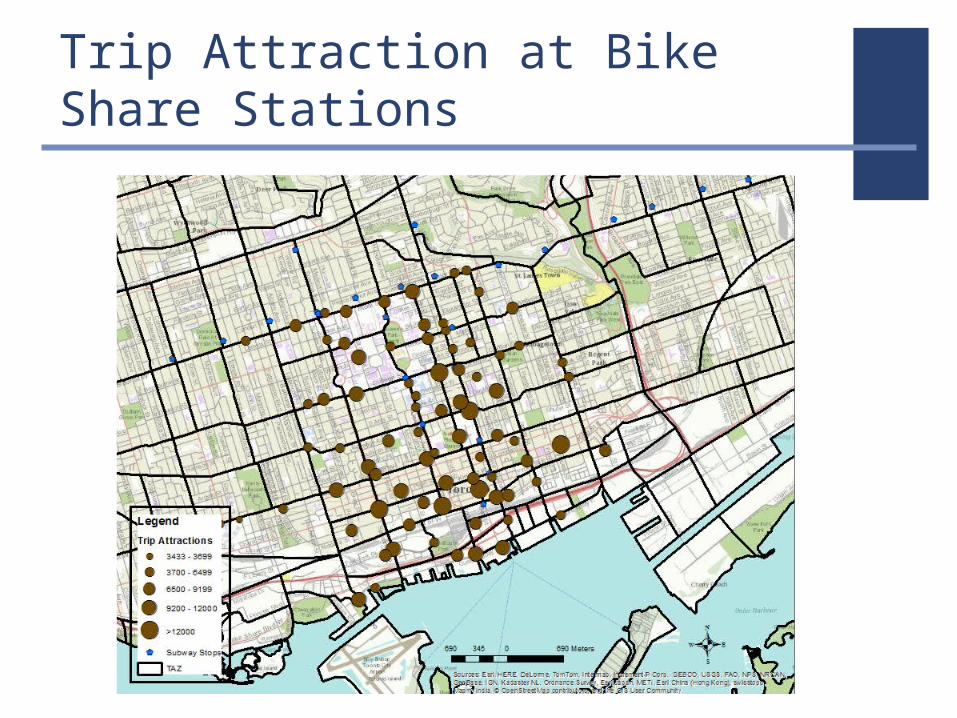
Trip Attraction at Bike Share Stations
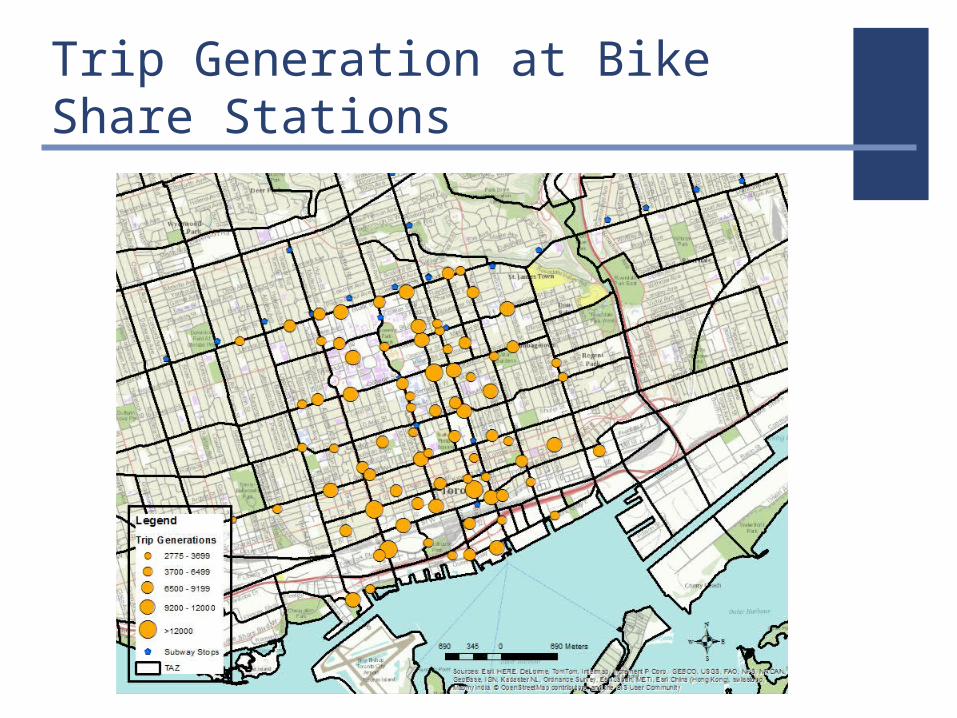
Trip Generation at Bike Share Stations

Most/Least Active Routes
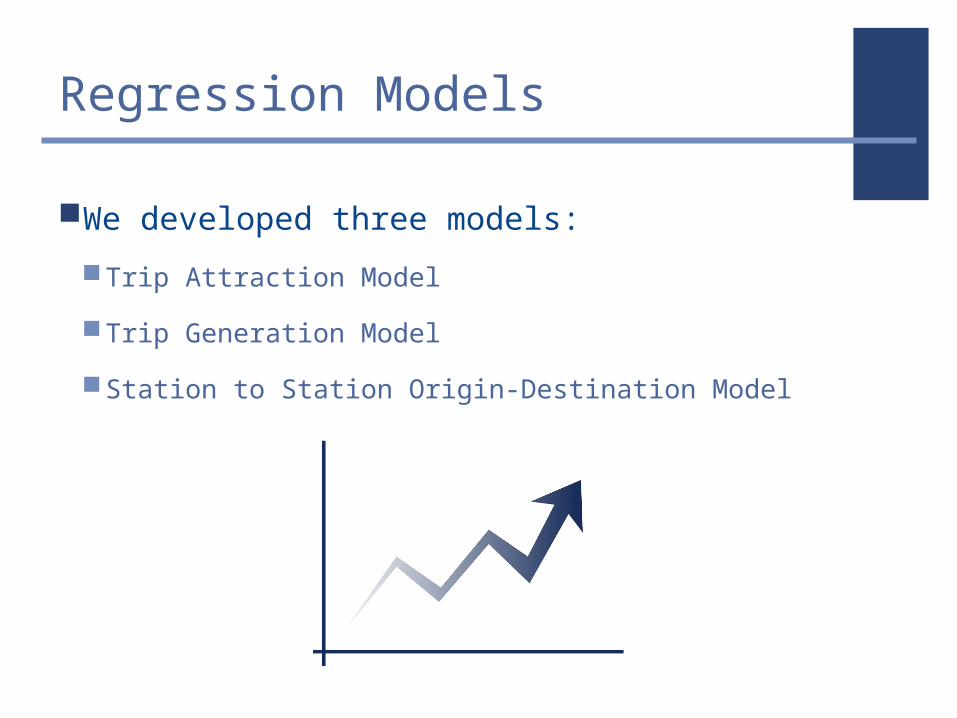
Regression Models
We developed three models:
Trip Attraction Model
Trip Generation Model
Station to Station Origin-Destination Model

Variables Definition Unit Aggregation Level
Socio-Demogr
aphic
Male Male to female ratio % Zonal
Empden Average employment density Pers/kM2 Zonal
popden Average population density Pers/kM2 Zonal
Weather
Temp Perceived Temperature oC Daily
Snow Amount of snow on ground cm Daily
Hum Relative humidity % Daily
Precip Amount of precipitation mm Daily
Variables Included in Attraction/Generation Model
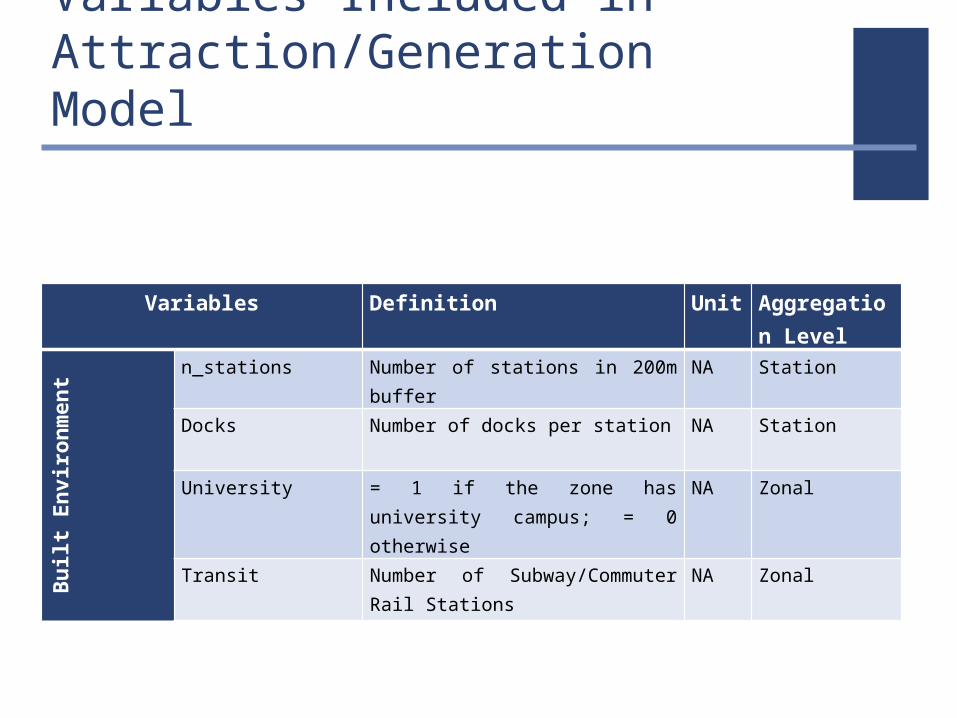
Variables Definition Unit Aggregation Level
Built Environment
n_stations Number of stations in 200m buffer
NA Station
Docks Number of docks per station NA Station
University = 1 if the zone has university campus; = 0 otherwise
NA Zonal
Transit Number of Subway/Commuter Rail Stations
NA Zonal
Variables Included in Attraction/Generation Model
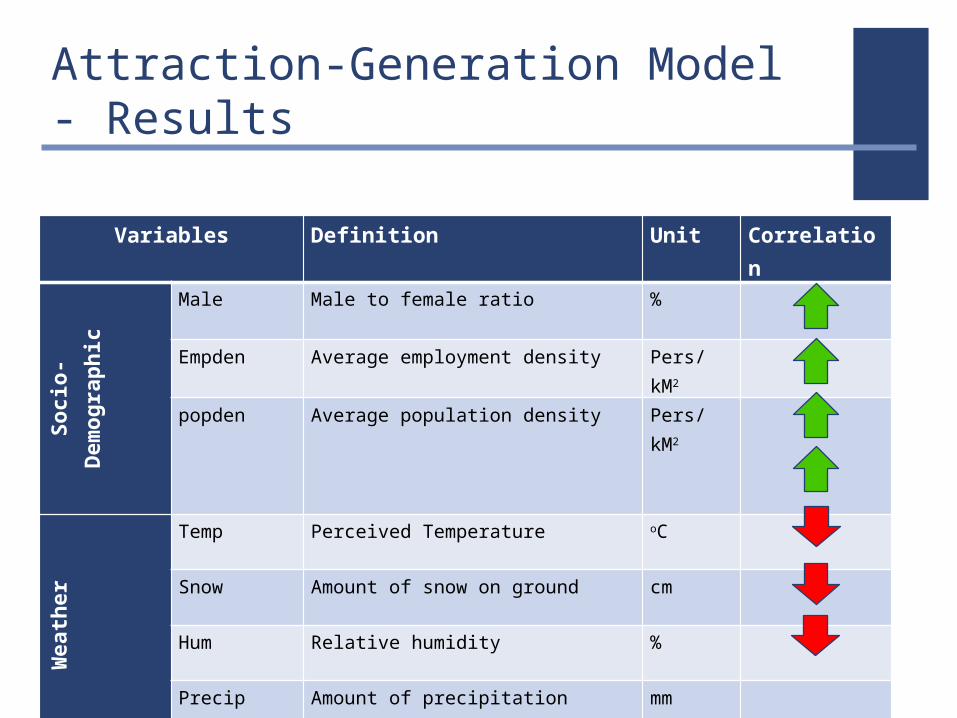
Variables Definition Unit Correlation
Socio-Demogr
aphic
Male Male to female ratio %
Empden Average employment density Pers/kM2
popden Average population density Pers/kM2
Weather
Temp Perceived Temperature oC
Snow Amount of snow on ground cm
Hum Relative humidity %
Precip Amount of precipitation mm
Attraction-Generation Model - Results

Variables Definition Unit Correlation
Built Environment
n_stations Number of stations in 200m buffer
NA
Docks Number of docks per station > 18
NA
University = 1 if the zone has university campus; = 0 otherwise
NA
Transit Number of Subway/Commuter Rail Stations
NA
Attraction-Generation Model - Results
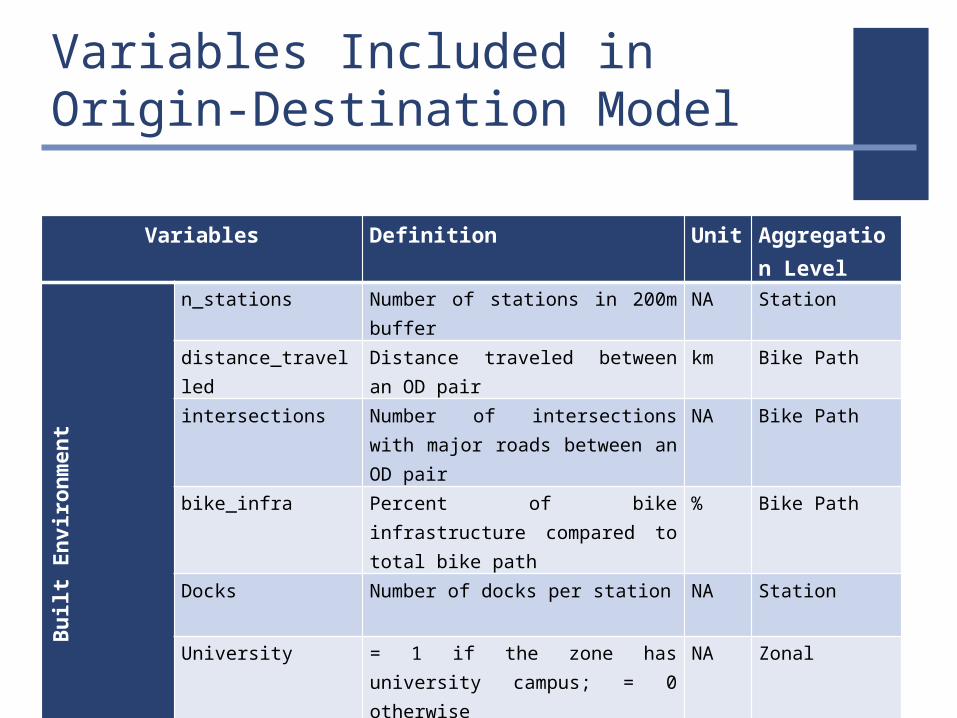
Variables Definition Unit Aggregation Level
Built Environment
n_stations Number of stations in 200m buffer
NA Station
distance_travelled Distance traveled between an OD pair
km Bike Path
intersections Number of intersections with major roads between an OD pair
NA Bike Path
bike_infra Percent of bike infrastructure compared to total bike path
% Bike Path
Docks Number of docks per station NA Station
University = 1 if the zone has university campus; = 0 otherwise
NA Zonal
Transit Number of Subway/Commuter Rail Stations
NA Zonal
Variables Included in Origin-Destination Model
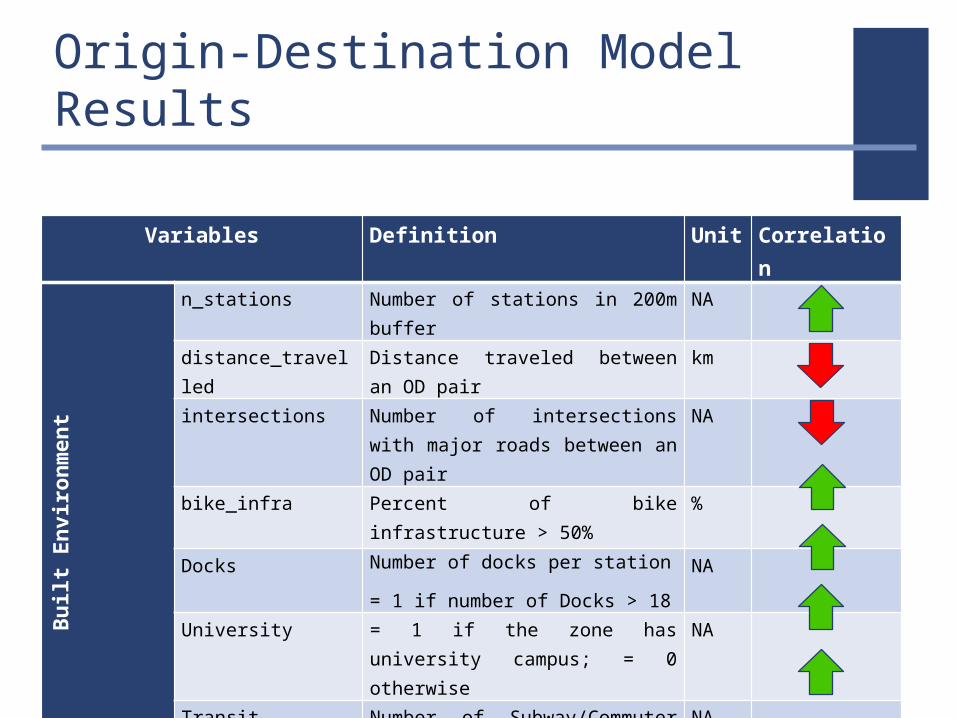
Variables Definition Unit Correlation
Built Environment
n_stations Number of stations in 200m buffer
NA
distance_travelled Distance traveled between an OD pair
km
intersections Number of intersections with major roads between an OD pair
NA
bike_infra Percent of bike infrastructure > 50%
%
Docks Number of docks per station
= 1 if number of Docks > 18
NA
University = 1 if the zone has university campus; = 0 otherwise
NA
Transit Number of Subway/Commuter Rail Stations
NA
Origin-Destination Model Results

Why is This Important?
Develop a policy tool capable of forecasting bike share demand at the station level
Utilize models and ArcMap GIS to establish future station locations
Develop policy recommendations for bike lane infrastructure expansion in Toronto