Factors Affecting the Industrial Relations Climate in ...
31
Factors Affecting the Industrial Relations Climate in Australian Enterprises* Elizabeth Webster and Joanne Loundes Melbourne Institute of Applied Economic and Social Research The University of Melbourne Melbourne Institute Working Paper No. 7/02 ISSN 1328-4991 ISBN 0 7340 1530 5 May 2002 *This paper is the result of work being undertaken as part of a collaborative research program entitled The Impact of Enterprise and Workplace Focused Industrial Relations on Employee Attitudes and Enterprise Performance. The project is supported by the Australian Research Council, the Business Council of Australia and the Committee for the Economic Development of Australia. The views expressed in this paper represent those of the authors and not necessarily the views of the collaborative partners. The authors would particularly like to thank other members of the survey team, Mark Wooden, Danny Samson, Peter Dawkins, Tim Fry and Pat Foley for the design of the survey and Anita Aherne for her excellent efforts in ensuring the surveys were completed. We would also like to thank Tim Fry and Mark Wooden for comments. Melbourne Institute of Applied Economic and Social Research The University of Melbourne Victoria 3010 Australia Telephone (03) 8344 3701 Fax (03) 8344 5630 Email [email protected] WWW Address http://www.melbourneinstitute.com
Transcript of Factors Affecting the Industrial Relations Climate in ...

Factors Affecting the Industrial Relations Climate in Australian Enterprises*
Elizabeth Webster and Joanne Loundes Melbourne Institute of Applied Economic and Social Research
The University of Melbourne
Melbourne Institute Working Paper No. 7/02
ISSN 1328-4991 ISBN 0 7340 1530 5
May 2002
*This paper is the result of work being undertaken as part of a collaborative research program entitled The Impact of Enterprise and Workplace Focused Industrial Relations on Employee Attitudes and Enterprise Performance. The project is supported by the Australian Research Council, the Business Council of Australia and the Committee for the Economic Development of Australia. The views expressed in this paper represent those of the authors and not necessarily the views of the collaborative partners. The authors would particularly like to thank other members of the survey team, Mark Wooden, Danny Samson, Peter Dawkins, Tim Fry and Pat Foley for the design of the survey and Anita Aherne for her excellent efforts in ensuring the surveys were completed. We would also like to thank Tim Fry and Mark Wooden for comments.
Melbourne Institute of Applied Economic and Social Research The University of Melbourne
Victoria 3010 Australia Telephone (03) 8344 3701
Fax (03) 8344 5630 Email [email protected]
WWW Address http://www.melbourneinstitute.com
Abstract
This paper uses new Australian enterprise level data to investigate factors that are associated
with cooperative industrial relations climates within major Australian enterprises. Climate is
commonly measured along a uni-dimensional scale ranging from adversarial to cooperative
and there is a view in the literature —albeit not a consensus— that more cooperative climates
are more productive. Our results find that organisations which have well-developed and
bilateral channels of communication between managers and employees and those companies
that use systematic and analytical methods for making major decisions tend to have the most
cooperative climate of relations between management, employees and unions.

1
1. Introduction
This paper uses new Australian enterprise level data to investigate factors that are associated
with cooperative industrial relations climates within major Australian enterprises. Poor
industrial relations outcomes can be disconcerting for potential investors, and may adversely
affect other performance outcomes such as productivity, through, for example, interrupting
the production process or increasing non-wage labour costs. Conversely, cooperative climates
may realistically be expected to increased work effort (or intensity), the acceptance of more
efficient work practices and process innovations, and greater investment in human capital,
which can in turn lead to better productivity outcomes (Wooden et al., 2002). The empirical
evidence suggests that more cooperative climates are more productive (Cooke, 1990; Deery
et al, 1999; Ichniowski, 1986; Juravich et al, 1993; Voos, 1987), although there is not a
consensus on this issue (Goddard, 1994; McLeod, 1990). How these measures relate to
subsequent measures of firm performance is not addressed but a matter for a further study.
This paper examines factors that are associated with management-union and management-
employee climate using data from a survey that was undertaken between October 2001 and
February 2002. The next section of this paper considers the theory and evidence from the
literature of the determinants of the industrial relations climate. This section also discusses
the main variables that will be tested in the empirical work. Section 3 describes the survey,
and Section 4 derives factors from the survey data to be used in the estimation procedure.
Section 5 presents the estimates of the determinants of the two climate variables. Section 6
then divides organisations into eight major types according to the key variable that the
preceding section has identified as the defining characteristics of organisations. Each type of
organisation is then considered according to their attitudes towards the industrial relations
reform which has been unfolding in Australia since the late 1980s. A short conclusion is
provided in Section 7.
2. Structural factors affecting climate
The climate and culture of a workplace are atmospheric attributes that can be said to apply
across the whole enterprise. As such, climate represents the established and customary
patterns of behaviour, ways of doing things, expectations and modus operandi. Many
versions of climate have been defined in the literature (Cooke, 1990; Katz, 1983 1985;
Dastmalchian et al, 1991; Deery et al, 1999; Fernie and Metcalf, 1995; Loundes, 2001;
Wagar, 1997), but two measures of climate which are used in this study include first, how

2
well managers relate and cooperate with unions and second, how well managers relate and
cooperate with employees more broadly. Key facets of these climates include the sharing of
common goals, reciprocity of respect, degree of consultation and the existence of trust.
Climates tend to be stable and slowly evolving in general, but they can also suddenly change
as a result of large and significant changes to, for example, senior staff and company
organisation.
Aside from the overarching presumption of a connection between climate and enterprise
productivity, there does not appear to be a tightly defined or accepted micro level theoretical
framework in the literature explaining intra-organisational climates. Few variables are truly
exogenous and most identifiable factors can be argued to depend on many and various
variables under the broad assortment of potential hypotheses. Attitudes, for example, which
are affected by past outcomes, influence subsequent processes and outcomes. Longitudinal
data modelling can permit more explicit lines of causation to be defined when unambiguous a
priori reasoning is absent. However, these databases are scarce in the industrial relations field
and they are not an option for this study.
There are several ways to measure relationships between management and workers and
considerable debate over what proportions of cooperation versus adversarial conflict are
optimal for both company performance and worker outcomes (Wagar, 1997). Too much
cooperation may mean domination by one party and a suboptimal outcome for the enterprise,
however too much conflict can result in pyrrhic victories. It is not the intention of this study
to assess the optimal combinations of conflict and cooperation for either party. Instead a
linear measure of climate is taken and the analysis seeks to establish the structural factors
which determine how far along the scale from conflict to cooperation particular enterprises
lie.
How one should model the determinants of climate is not straightforward. In the absence of
decided deductive propositions, the literature commonly derives its hypothesis inductively
from past empirical studies. Using this principle, Dastmalchian et al, (1991) have argued that
the industrial relations climate is affected by four structural factors relating to the
organisation: the organisational context and environment, the organizational structure, human
resources policies and the industrial relations context. The organisational context and
environment include attributes such as the size of the organisation and thus the complexity
and access to financial resources, the age and maturity of the organisation, the types of
technology used, ownership, dependence on parent company, dependence on the external

3
labour market and recent history of organisational change. The justification for most of these
variables is derived from significant relationships found in other studies.
The organisational structure includes items such as the level of centralisation and
formalisation of decision-making and the formality of relations between managers and
workers. Dastmalchian et al, (1991) claim that more formalised, centralised and bureaucratic
organisations are more frustrating for both parties and this adversely affects the climate of
relations. Human resources policies include the extent of internal labour market machinery,
such as training, but also practices to promote flexibility in the workplace. More supportive
internal labour market features and greater workplace flexibility are thought to be more
conducive towards better industrial relations climates. Finally, the industrial relations context
includes union density, recent bargaining history, the bargaining structure and the level of
union involvement. Dastmalchian et al, (1991) note that these items are not expected to be
completely unaffected by past levels of industrial relations climate within the organisations
and possible endogeneity must be considered. This study attempts to replicate the basic
method of Dastmalchian et al, (1991) but has used five types of determining structural
factors.
2.1. Organisational environment
The first group of variables incorporates the organizational environment. This includes
employee size to reflect the sophistication and scope of managerial and personnel resources;
whether foreign owned and the proportion of the enterprise workforce based in Australia (and
thus focus given by top management to their Australian operations); the degree of dynamic
competition in the product market arising from unpredictable consumers and fast changing
market needs; the degree of difficulty managers have finding suitable skilled staff; the level
of turnover among skilled staff and; the use of contractors and casual staff. Sheppeck and
Militello (2000) point out that higher volatility leads to higher transaction costs for the firm in
the marketplace. In order to limit the impact of these transaction costs, it is expected that a
higher level of competition in the product and labour markets will put pressure on companies
to put more resources into improving the industrial climate at the workplace (Blandy and
Baker, 1987; Wooden et al., 2002). Low turnover of skilled staff may indicate a tight labour
market but may also be a result of a contented workforce. Extensive use of non-permanent
labour could lower the cohesion felt among the permanent staff and thus reduce morale and
the climate of relations. Alternatively, use of non-permanent labour could increase job
4
security for the ‘core’ workers and thereby improve cooperation and climate. Which of these
holds in practice is a matter for the data to decide.
2.2. Intra-organisational processes
Secondly, intra-organisational processes, especially those that affect the interaction between
managers and workers, should also affect the climate measure used in this study. This
includes the use and existence of communication and grievance procedures, the extent of
recent organisational change, level of organisational and personnel flexibility and degree of
organisational integration. The active involvement of employees in determining how
production at the workplace is undertaken (that is, employee involvement) has also been
advanced as a method of influencing workplace performance (Cooke, 1990; Fernie and
Metcalf, 1995). A priori, it is uncertain how such involvement affects industrial relations
outcomes. If greater employee involvement leads to shirking, or if employees are unwilling to
participate, the impact is likely to be negative. On the other hand, if employees know best
how to undertake certain tasks, or if they get greater job satisfaction from being involved,
there could be a positive association. Previous analysis indicates support for the notion that
employee involvement will improve relations between management and employees (Cooke,
1990; Juravich et al., 1993). It is expected that organisations that put more resources into
better methods of bilateral communication between managers and workers will have better
industrial relations climates. Similarly, recent injections of resources into organisational
and/or managerial change could have a beneficial impact on climate if indeed they were
successful. Flexibility in the organisation’s strategic plans and degree of integration within
the firm could potentially improve the climate to the extent it reduces frustrating red tape and
unwieldy procedures. Carried to an extreme however, they could undermine the sense of
stability and comfort employees feel within their work environment.
2.3. Management style
Thirdly, management style is hypothesised to be a dominant influence on the climate of
relations among workers and managers in the organisation. In this study, the group of factors
includes senior managers’ preference for cost cutting, their competitive stance toward rivals
and their decision making style within the organisation. More aggressive managers in the
product market arena may be equally aggressive in their negotiation with their employees or
unions. Managers’ decision-making styles with respect to the internal operation of the

5
organisation may also reflect how they deal with employees and unions (Sheppeck and
Militello, 2000).
2.4. Human resource management
Fourthly, the human resources approach includes measures that reflect the importance of
HRM (Human Resource Management) to senior managers in the organisation, the extent of
training and multi-skilling, the sophistication of selection and promotion procedures and the
use of pecuniary rewards and incentives for employees. Generally, it is expected that
extensive and well-developed HRM practices are conducive toward a more harmonious
climate as workers get more personalised service and respect (Cooke, 1990, 1992; Fernie et
al., 1994; Kruse, 1992; Milgrom and Roberts, 1992). However, the use of individual based
rewards could have a detrimental effect on relations if it breeds resentment among workers by
promoting competitive—rather than cooperative—behaviour.
2.5. Industrial relations
Finally, a series of variables to reflect industrial relations structures have also been included.
Of interest here is the extent to which industrial relations reform—including the introduction
of enterprise bargaining—might influence organisational climate. Wooden et al., (2002,
p. 33) point out that ‘the case for enterprise-based bargaining systems hinges in large part on
its potential to enhance the productive capacity of business. …[However], virtually nothing is
known about the mechanisms through which such effects are transmitted’. Analysis is often
complicated by the observation that agreements vary between workplaces, in that some may
reflect industry, rather than enterprise, bargaining, or may simply involve rolling over the
standard award arrangements (Wooden et al., 2002). In order to capture some of this
complexity, the analysis includes the proportion of workers employed under union-negotiated
collective agreements, how relevant these agreements are for the enterprise, the uniqueness of
the collective agreements, the proportion of workers employed under individual contracts and
the suitability of these contracts for the enterprise. Also included were variables that
measured the extent to which organisations had embraced the reform agenda, and whether
respondents thought it had been successful for their organisation.
It is expected that the greater the number of workers employed under union collective
agreements rather than individual contracts, the more emphasis managers will place on
improving their relations with unions. Finally, a more tailored collective agreement and/or

6
individual contract may reflect a good climate of negotiations and mutual respect but may
also cause a greater feeling of cooperation and trust.
Union density and the number unions that the organisation actively negotiates with are also
included. Union density may influence how much effort management places on good
relations with both unions and their employees but a poor climate may also affect union
membership. The exit/voice literature regarding the influence of unions on climate, pioneered
by Freeman and Medoff, suggests that unions may have a positive influence on climate in
their role as mediator for employee concerns (Freeman, 1980; Freeman and Medoff, 1984).
Alternatively, high union density may be a barrier to good management–employee relations if
unions adopt a more adversarial role in their dealings with management on their members’
behalf.
While the industrial relations environment should affect the climate of relations within
organisations, the industrial relations options firms and workers have chosen to take are also
influenced by the climate of relations within their particular organisation, as well as the
particular management style that is characteristic of the organisation. Accordingly, the
direction of cause and effect for these variables is perhaps the least clear of all our variables.
3. The Melbourne Institute Business Survey
The top 1000 enterprises (as measured by total revenue) were chosen from the IBISWorld
enterprise database to participate in the study. Based on initial calls, 813 surveys were mailed
out, with 281 useable surveys returned to the Melbourne Institute, representing a response
rate of 28 per cent, which is consistent with surveys of this type. Descriptive statistics for the
organisations are given in Table 1, which presents the major industry categories, location and
employment size of the organisations in our survey. More than a quarter of organisations
were located in manufacturing, with the next highest proportion represented by finance and
insurance, wholesale trade, electricity, gas and water supply, and property and businesses
services. Importantly however, the distribution of responses across characteristics does not
differ markedly from the initial selected population, implying that the responses should not be
biased towards a particular group. The main exceptions are: slight over-representation of
electricity, gas and water suppliers, transport and storage and education, with a corresponding
under-representation of organisations from wholesale trade and finance and insurance; an
over-representation of respondents from Queensland and South Australia, with a

7
corresponding under-representation in NSW; and an over-representation of respondents from
the larger firms, as measured by the number of employees.
Table 1: Organisation characteristics, Australia 2001
Respondent percentage
Top 1000 percentage
Major industry group Agriculture, Forestry & Fishing 0.4 0.8
Mining 2.8 4.5 Manufacturing 26.2 25.2
Electricity, Gas & Water Supply 8.2 4.8 Construction 2.5 2.9
Wholesale Trade 9.2 15.6 Retail Trade 6.0 6.4
Accommodation, Cafes & Restaurants 0.7 0.2 Transport & Storage 5.3 3.8
Communication Services 0.4 1.3 Finance & Insurance 11.0 15
Property & Business Services 8.2 8.1 Government Administration & Defence 0.7 0.4
Education 5.7 2.6 Health & Community Services 3.9 4.0
Cultural & Recreational Services 2.5 3.1 Personal & Other Services 2.5 1.3
Missing 3.9 - Total 100.0 100.0
Location ACT 0.7 1.2 NSW 43.6 49.9
NT 0.0 0.1 QLD 11.4 7.8
SA 7.8 5.3 TAS 0.4 0.9 VIC 27.3 28.0 WA 5.0 6.8
Missing 3.9 - Total 100.0 100.0
Employment size Under 200 11.4 16.4
200 to under 500 14.9 17.6 500 to under 1000 18.1 19.6
1000 to under 5000 39.4 34.7 Over 5000 16.3 11.7
Total 100.0 100.0 Source: Melbourne Institute Business Survey 2001

8
The survey was aimed at senior management, and as such, it is expected that responses
regarding the industrial relations climate will be biased toward the management perspective.
A subsequent development of the survey will incorporate employee views. The questions
covered management style, industrial relations structure, human resources, innovation, the
market environment and organisational performance. To these data accounting and financial
information from the IBISWorld database (www.ibisworld.com.au) has been added.
Questions either called for a categorical response, usually for grouped percentages, or used a
seven-point Likert scale with the anchors 1=strongly disagree and 7=strongly agree.
Perceptual measures permit comparisons across very different organisations and industries
and are easy to collect because they place fewer burdens on respondents than administrative
or factual entries. However, they contain a subjective element and thus an undefined error
and it would be unwise to over interpret the findings.
4. The factors and variables
Factor analysis is used to construct both the dependent and explanatory variables, wherever
the factored variables are measuring an underlying latent construct, such as an aggressive
approach to marketing, or the ability to communicate well throughout the organisation.1
Factor scores are used to construct the variables, although an alternative would be to
construct an additive scale. The use of an additive scale was investigated, and made little
quantitative difference to the results. It was therefore decided to continue using factor scores.
It is important to keep in mind that although it is possible to make inferences on the sign and
significance of the reported coefficients in the regression analysis of Section 5, it is not
possible to talk about the size of the coefficient.
The dependent variables—the management-union and management-employee climate—were
constructed using factor analysis from a series of perceptual responses from the senior
manager about how well management and unions on the one hand and, management and
employees more generally on the other, cooperated. These questions were derived from
Dastmalchian et al (1991), and are a subset of their longer scale. These results and the
associated factor loadings are presented in Table 2 and Table 3. Senior managers that argued
that unions and management had good relations, had respect for one another’s goals,
1 A promax rotated estimation was used, as it was more flexible and did not force the factors to be orthogonal to
each other, as compared to varimax rotation.
9
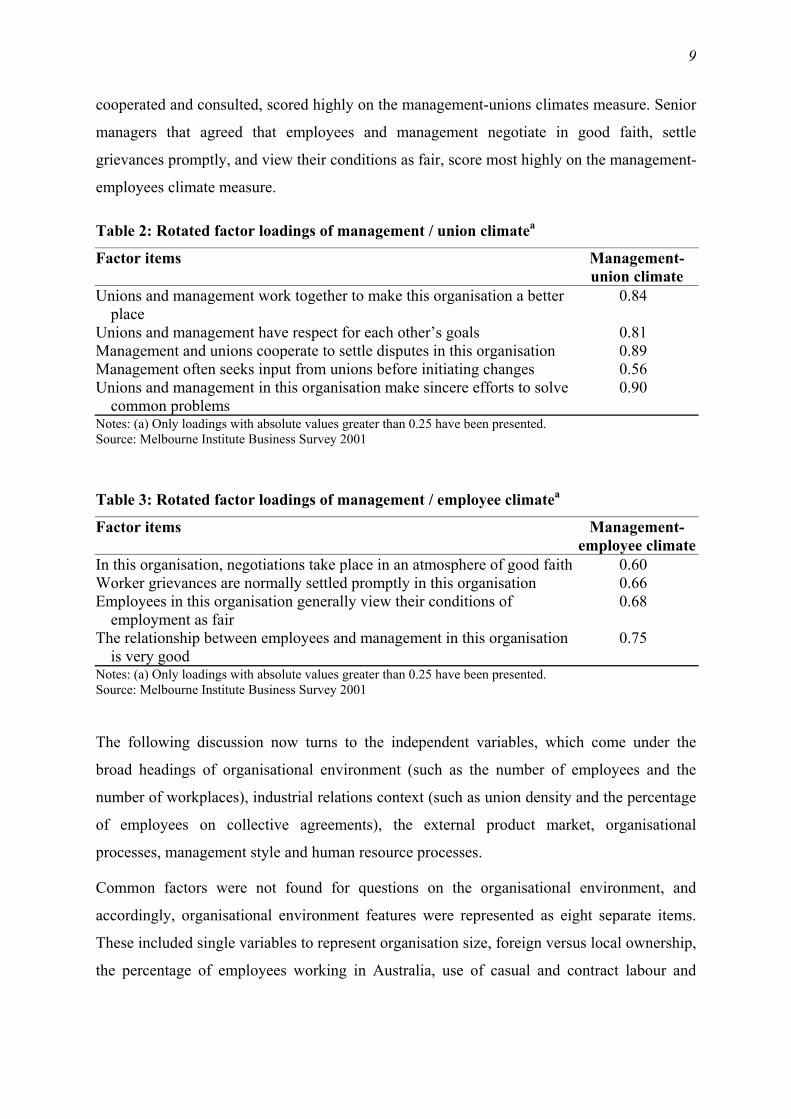
cooperated and consulted, scored highly on the management-unions climates measure. Senior
managers that agreed that employees and management negotiate in good faith, settle
grievances promptly, and view their conditions as fair, score most highly on the management-
employees climate measure.
Table 2: Rotated factor loadings of management / union climatea
Factor items Management-union climate
Unions and management work together to make this organisation a better place
0.84
Unions and management have respect for each other’s goals 0.81 Management and unions cooperate to settle disputes in this organisation 0.89 Management often seeks input from unions before initiating changes 0.56 Unions and management in this organisation make sincere efforts to solve
common problems 0.90
Notes: (a) Only loadings with absolute values greater than 0.25 have been presented. Source: Melbourne Institute Business Survey 2001
Table 3: Rotated factor loadings of management / employee climatea
Factor items Management-employee climate
In this organisation, negotiations take place in an atmosphere of good faith 0.60 Worker grievances are normally settled promptly in this organisation 0.66 Employees in this organisation generally view their conditions of
employment as fair 0.68
The relationship between employees and management in this organisation is very good
0.75
Notes: (a) Only loadings with absolute values greater than 0.25 have been presented. Source: Melbourne Institute Business Survey 2001
The following discussion now turns to the independent variables, which come under the
broad headings of organisational environment (such as the number of employees and the
number of workplaces), industrial relations context (such as union density and the percentage
of employees on collective agreements), the external product market, organisational
processes, management style and human resource processes.
Common factors were not found for questions on the organisational environment, and
accordingly, organisational environment features were represented as eight separate items.
These included single variables to represent organisation size, foreign versus local ownership,
the percentage of employees working in Australia, use of casual and contract labour and
10
Likert scale responses to questions about the organisation’s difficulties finding suitable
labour and turnover of skilled staff.
Common factors were not found for the industrial relations context as a whole, and as such,
fourteen separate variables were derived to represent the industrial relations context. The first
two were union density (which was grouped into seven bands), and the number of separate
unions management commonly negotiate with. Both could indicate the frequency and
importance of unions for the organisation. The next three were whether there existed any
collective agreements and/or individual contracts at the organisation, and whether the
collective agreement was unique to the organisation. The percentage of employees on
collective agreements, non-union agreements, and individual contracts (either Australian
Workplace Agreements—AWAs—or individual common law contracts) were defined as
three separate variables. Two variables were included that measured the respondent’s view on
whether their organisation had embraced the reform agenda, and whether they thought the
reform agenda had been successful for their organisation. Two factors were derived from how
well managers believed their collective agreements or individual contracts fitted their specific
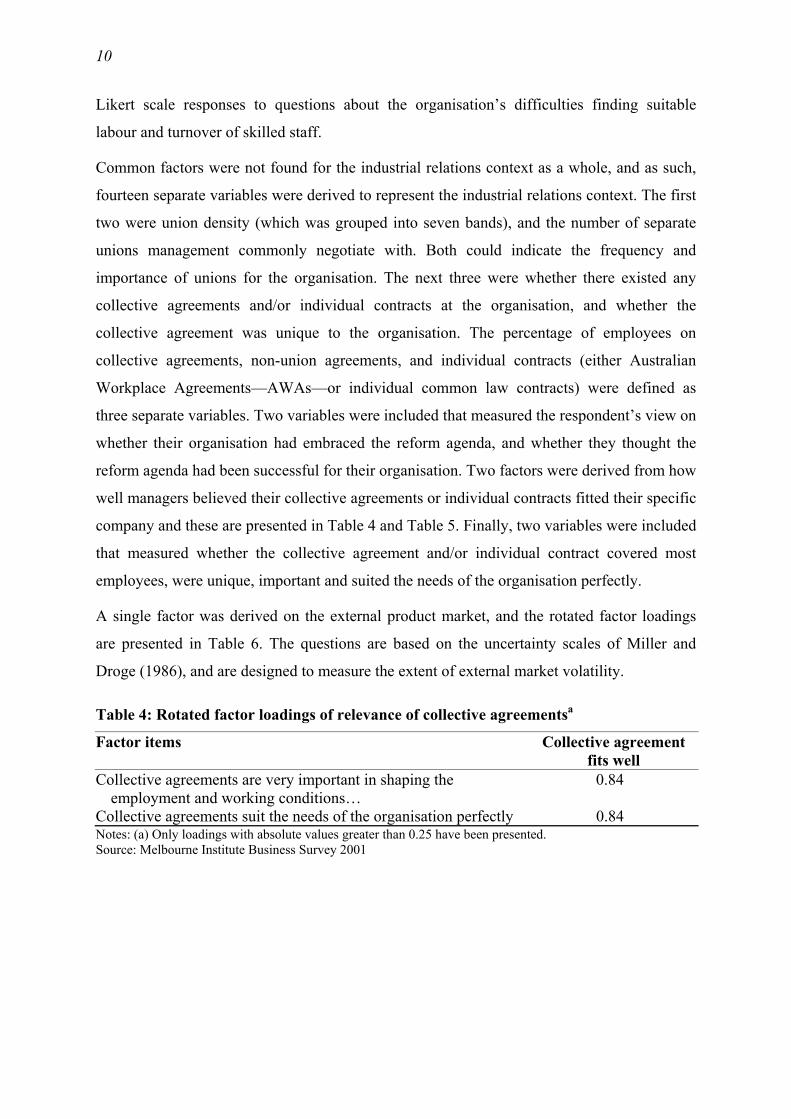
company and these are presented in Table 4 and Table 5. Finally, two variables were included
that measured whether the collective agreement and/or individual contract covered most
employees, were unique, important and suited the needs of the organisation perfectly.
A single factor was derived on the external product market, and the rotated factor loadings
are presented in Table 6. The questions are based on the uncertainty scales of Miller and
Droge (1986), and are designed to measure the extent of external market volatility.
Table 4: Rotated factor loadings of relevance of collective agreementsa
Factor items Collective agreement fits well
Collective agreements are very important in shaping the employment and working conditions…
0.84
Collective agreements suit the needs of the organisation perfectly 0.84 Notes: (a) Only loadings with absolute values greater than 0.25 have been presented. Source: Melbourne Institute Business Survey 2001

11
Table 5: Rotated factor loadings of relevance of individual contractsa
Factor items Individual contracts fit well
Individual agreements are very important in shaping the employment conditions
0.92
Individual agreements suit this organisation perfectly 0.92 Notes: (a) Only loadings with absolute values greater than 0.25 have been presented. Source: Melbourne Institute Business Survey 2001
Table 6: Rotated factor loadings of external market volatilitya
Factor items External market volatile
The organisation changes its marketing practices extremely frequently - The rate of obsolescence is very high 0.65 Actions of competitors are unpredictable 0.28 Consumer demand is unpredictable 0.47 The production/service technology often changes in a major way 0.68 Notes: (a) Only loadings with absolute values greater than 0.25 have been presented Source: Melbourne Institute Business Survey 2001
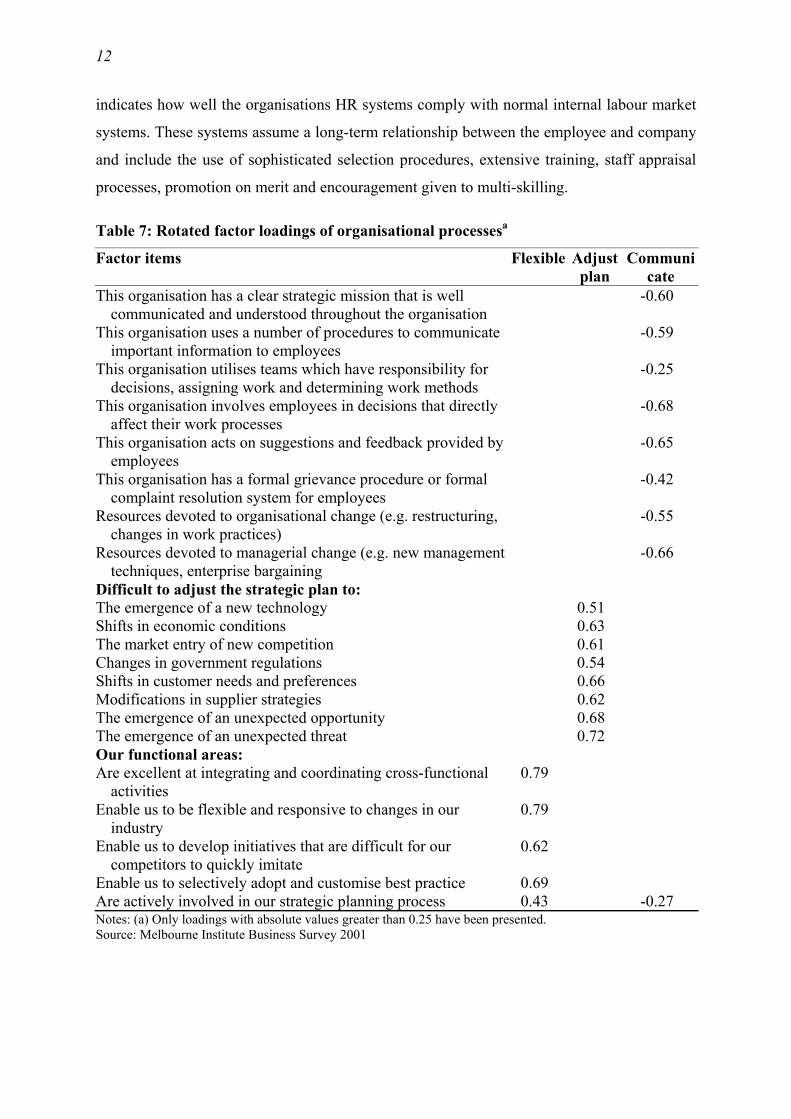
Table 7 presents the results of the rotated factor loadings for intra-organisational processes.
Three factors were found. The first factor, ‘flexible’, reflects how flexible, integrated and
responsive the organisations functional areas are. The second factor, ‘adjust plan’ reflects
how quickly organisations can adjust their strategic plan to market contingencies. The third
factor, ‘communicate’, captures organisations that have clear strategic missions that are
understood throughout the enterprise, uses several procedures to communicate with staff,
involve employees directly in decisions and act on suggestions of employees.
Table 8 presents the results of the rotated factor loadings for management-style, which
yielded three factors. The first factor, ‘bold’, reflected managers’ attitudes towards initiating
change through new products, R&D, and favour high-risk projects. The second, ‘intuitive’,
indicates managerial reliance upon intuitive information rather than formal and extensive
quantitative analysis for making decisions. The third factor, ‘cheap’, reflects how much
emphasis managers place on improving efficiency, and reducing prices and costs compared to
the production of state-of-the-art products.
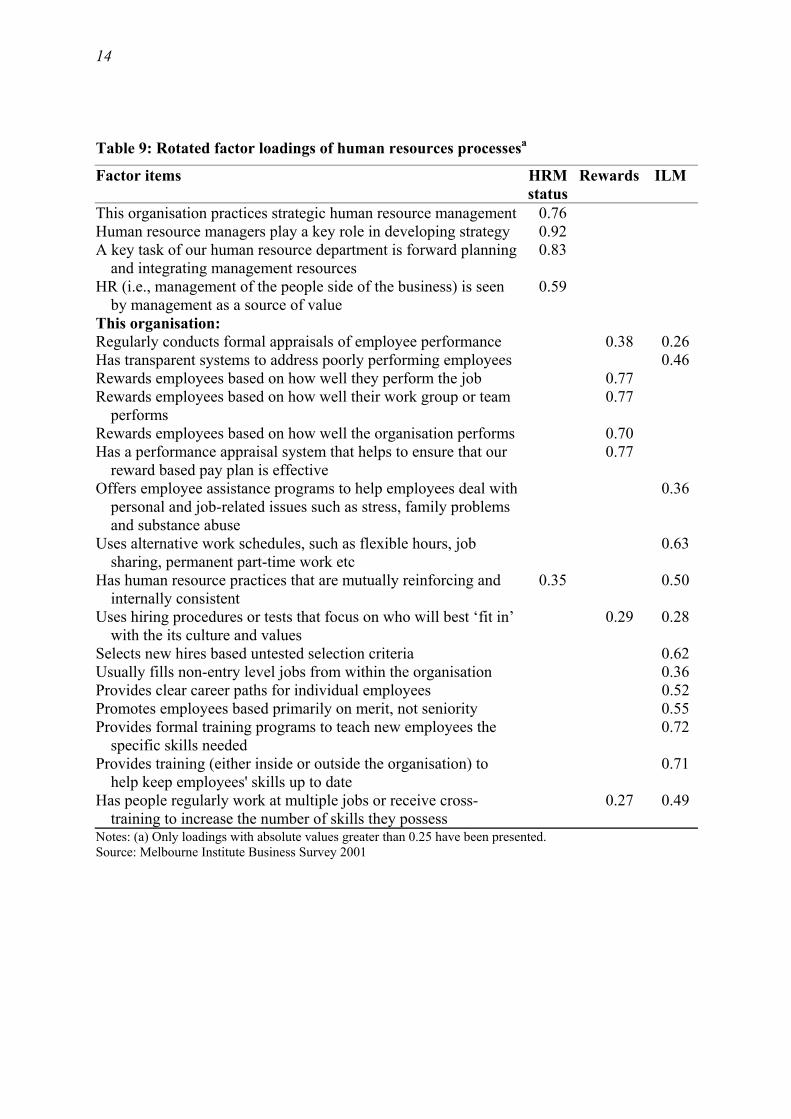
Three factors were found for the human resource process followed by the company, as shown
in Table 9. The first factor, ‘HRM status’, indicates the status of human resources
management within the company. The second factor, ‘rewards’ indicates the use of extensive
pecuniary rewards based on individual or group performance. The third factor, ‘ILM’
12
indicates how well the organisations HR systems comply with normal internal labour market
systems. These systems assume a long-term relationship between the employee and company
and include the use of sophisticated selection procedures, extensive training, staff appraisal
processes, promotion on merit and encouragement given to multi-skilling.
Table 7: Rotated factor loadings of organisational processesa
Factor items Flexible Adjust plan
Communicate
This organisation has a clear strategic mission that is well communicated and understood throughout the organisation
-0.60
This organisation uses a number of procedures to communicate important information to employees
-0.59
This organisation utilises teams which have responsibility for decisions, assigning work and determining work methods
-0.25
This organisation involves employees in decisions that directly affect their work processes
-0.68
This organisation acts on suggestions and feedback provided by employees
-0.65
This organisation has a formal grievance procedure or formal complaint resolution system for employees
-0.42
Resources devoted to organisational change (e.g. restructuring, changes in work practices)
-0.55
Resources devoted to managerial change (e.g. new management techniques, enterprise bargaining
-0.66
Difficult to adjust the strategic plan to: The emergence of a new technology 0.51 Shifts in economic conditions 0.63 The market entry of new competition 0.61 Changes in government regulations 0.54 Shifts in customer needs and preferences 0.66 Modifications in supplier strategies 0.62 The emergence of an unexpected opportunity 0.68 The emergence of an unexpected threat 0.72 Our functional areas: Are excellent at integrating and coordinating cross-functional
activities 0.79
Enable us to be flexible and responsive to changes in our industry
0.79
Enable us to develop initiatives that are difficult for our competitors to quickly imitate
0.62
Enable us to selectively adopt and customise best practice 0.69 Are actively involved in our strategic planning process 0.43 -0.27 Notes: (a) Only loadings with absolute values greater than 0.25 have been presented. Source: Melbourne Institute Business Survey 2001

13
Table 8: Rotated factor loadings of management stylea
Factor items Bold Intuitive CheapTop managers favour a strong emphasis on R&D, technological
leadership and innovation 0.58
Top managers favour high-risk projects with the chances of very high rates of return
0.66
Top managers favour a bold, aggressive posture... 0.79 My organisation typically initiates actions to which other
competitors then respond. 0.67
My organisation is very often the first organisation to introduce new products/services, operating technologies
0.72
My organisation typically adopts a very competitive, 'undo-the competitor' posture
0.58
Increases operating efficiencies 0.53 Develops new process innovations that reduce costs 0.40 Focuses on increasing productivity 0.51 Tailors and shapes products/services to fit customers’ needs 0.27 0.28 Develops customer loyalty 0.31 Has the flexibility to quickly respond to customer needs 0.35 0.35 Produces a continuous stream of state of the art products/services 0.66 Is first to market with new products/services 0.79 Responds to early market signals concerning areas of opportunity 0.62 Develops products/services which are considered the best in the
industry 0.54
Produces products/service sat a cost level lower than that of our competitors
0.68
Prices below competitors 0.25 0.53 Produces products/services for lower priced market segments 0.50 Our major operating and strategic decisions nearly always result
from extensive quantitative analysis of data -0.65
Our major operating and strategic decisions are nearly always detailed in formal written reports
-0.59
We rely principally on experienced-based intuition rather than quantitative analysis
0.76
Our major operating and strategic decisions are much more affected by experience…than systematic evaluation…
0.68
Our major operating and strategic decisions rely on ‘rules of thumb’…
0.59
Notes: (a) Only loadings with absolute values greater than 0.25 have been presented. Source: Melbourne Institute Business Survey 2001
14
Table 9: Rotated factor loadings of human resources processesa
Factor items HRM status
Rewards ILM
This organisation practices strategic human resource management 0.76 Human resource managers play a key role in developing strategy 0.92 A key task of our human resource department is forward planning
and integrating management resources 0.83
HR (i.e., management of the people side of the business) is seen by management as a source of value
0.59
This organisation: Regularly conducts formal appraisals of employee performance 0.38 0.26 Has transparent systems to address poorly performing employees 0.46 Rewards employees based on how well they perform the job 0.77 Rewards employees based on how well their work group or team
performs 0.77
Rewards employees based on how well the organisation performs 0.70 Has a performance appraisal system that helps to ensure that our
reward based pay plan is effective 0.77
Offers employee assistance programs to help employees deal with personal and job-related issues such as stress, family problems and substance abuse
0.36
Uses alternative work schedules, such as flexible hours, job sharing, permanent part-time work etc
0.63
Has human resource practices that are mutually reinforcing and internally consistent
0.35 0.50
Uses hiring procedures or tests that focus on who will best ‘fit in’ with the its culture and values
0.29 0.28
Selects new hires based untested selection criteria 0.62 Usually fills non-entry level jobs from within the organisation 0.36 Provides clear career paths for individual employees 0.52 Promotes employees based primarily on merit, not seniority 0.55 Provides formal training programs to teach new employees the
specific skills needed 0.72
Provides training (either inside or outside the organisation) to help keep employees' skills up to date
0.71
Has people regularly work at multiple jobs or receive cross-training to increase the number of skills they possess
0.27 0.49
Notes: (a) Only loadings with absolute values greater than 0.25 have been presented. Source: Melbourne Institute Business Survey 2001
15
5. The regression analysis
The discussion below details the regression analysis (OLS) that was undertaken to examine
the determinants of both management-union and management-employee climates. A range of
variables were considered, including the organisational environment (such as the number of
employees and the number of workplaces), organisational processes (flexible, adjust plan and
communicate), management style (bold, intuitive, cheap), human resource processes (human
resource management status, rewards, well developed internal labour market structures) and
the industrial relations context (such as union density and the percentage of employees on
collective agreements).
5.1. Management-union climate
With respect to the management-union climate, Table 10 shows that three of the
organisational environment variables were significant. Size, as measured by the number of
employees, was not significantly related to the management-union climate. Foreign owned
companies (about one third of the sample) had a poorer management-union climate than
locally owned organisations, although organisations with a larger percentage of their
workforce located in Australia also had poorer climates.
There was some indication that the reliance upon a degree of non-standard workers had some
influence on the climate of relations. Senior managers from organisations that were more
reliant on casuals, contractors, outworkers and agency workers tended to report better
management-union relations, but the relevant coefficients had a low level of significance.
Of the three intra-organisational factors discussed above, ‘communicate’, ‘adjust plan’ and
‘flexible’, only communicate was shown to be related to the management–union climate. The
better understood the mission of the organisation, the more communication channels, the
greater is employee involvement in related decisions, the better is the management-union
climate. Better integration and flexibility of functional areas and an enhanced ability to adjust
the strategic plan did not appear to be related to climate.

16
Table 10: Regression analysis of the determinants of management / union climate Variables Coefficient t-statistic Coefficient t-statistic Constant 0.020 0.02 0.388 1.34 Organisational environment Log of employees 0.018 0.24 Foreign owned -0.348 -1.61 -0.437 -2.35***Proportion of organisation's total worldwide workforce based
in Australian -0.006 -2.37*** -0.007 -2.94***Number of separate workplaces this organisation has in
Australian 0.000 0.64 External market volatile -0.093 -0.88 Finding suitable people is proving very difficult 0.027 0.50 Low skilled staff turnover compared with others in this
industry 0.036 0.65 Approximate percentage of Australian employees who are
casual employees 0.150 1.29 0.146 1.51 Approximate percentage of Australian labour hour
requirements filled by contractors, outworkers and agency employees 0.145 1.29 0.155 1.55
Organisational processes Flexible 0.003 0.03 Adjust plan -0.055 -0.6 Communicate -0.329 -2.21** -0.351 -3.47***Management style Bold -0.243 -2.07** -0.256 -2.81***Intuitive -0.250 -2.48** -0.242 -3.08***Cheap -0.118 -1.10 Human resource processes Human resource management status -0.038 -0.32 Rewards -0.154 -1.43 -0.130 -1.48 Well developed internal labour market structures 0.159 1.22 Industrial relations context Union density 0.054 0.66 Number of unions -0.016 -0.78 Non-union agreements as a proportion of all collective agreements (employees) -0.116 -1.79* -0.115 -2.17** Embraced the reform agenda -0.452 -2.25** -0.326 -2.25** Reform agenda has been successful for organisation 0.220 1.10 Organisation has collective agreements 0.141 0.23 Majority of employees on collective agreements -0.150 -0.73 Collective agreements are unique -0.022 -0.12 Collective agreement fits well 0.306 1.42 0.283 2.55*** Majority on collective, are unique, important and suit the organisation perfectly -0.123 -0.41 Organisation has individual contracts -0.081 -0.14 Majority of employees on individual contracts -0.056 -0.08 Individual contracts fit well 0.027 0.11 Majority on individual, are important and suit the organisation perfectly 0.047 0.07 Adjusted R2 0.1301 0.2105 F-statistic 1.73*** 4.80*** Ramsey RESET test 0.30 0.22 Cook-Weisberg test 0.10 0.88 Notes: *, **, and *** represents significant at the 10%, 5% and 1% levels respectively in a two-tailed test.
17
Management style had a significant and strong relationship with climate. Organisations where
the senior managers had described their style as ‘bold’ (favouring high risk, innovation and
aggressive postures), and ‘intuitive’ (making decisions based on experience and hunch rather
than analysis and formal evaluations) had the poorest relations with union. On the other hand
management who had more cautious wait and see postures, and who put more emphasis on
formal analysis and systematic evaluations, reported better relations. Managerial emphasis on
cost reduction was not significant.
Of the three human resource variables, only the factor that reflected the use of incentive
payments was significant at the 20 per cent level. Organisations that had more group or
individual bonus payment schemes had poorer climates than those that did not. Extensive use
of other human resource and internal labour market structures did not appear to have any
effect on climate.
Finally, three of the industrial relations context factors were significant. Where the collective
agreement suited the needs of the organisation well, management and unions appeared to get
along better. It is likely that management and unions have less to argue about if the
agreement appears to be working properly. In contrast, those organisations that indicated they
had embraced the reform agenda had a significantly poorer management-union climate. This
may in part reflect the observation that those who embraced reform are significantly more
likely (at the 1 per cent level) to report that they should be able to negotiate collectively with
employees without having to involve trade unions. In line with this result, a higher proportion
of collective agreement employees working under non-union agreements are associated with
a poorer management-union climate.
In sum, the organisations with the best management-union climate were Australian owned,
but with considerable overseas operations, used above average levels of outsourced labour
inputs, had a more cautious, systematic style of management, put greater emphasis on
effective communication channels for workers, did not offer extensive pecuniary reward
systems, but had union negotiated collective agreements that suited the needs of the
organisation. About half of the explained variation in the management-union climate measure
can be accounted for by the ‘communicate’, ‘bold’ and ‘intuitive’ variables.
5.2. Management-employee climate
Table 11 presents the results for the determination of management-employee relations. The
same set of possible explanatory factors as used in the analysis of management-union

18
relations were considered. Unlike the management-union climate results however, there was
some evidence of heteroskedasticity. Therefore, the estimates presented here use robust
standard errors. These results indicate that similar to the union situation, the size of the
organisation had no bearing on the climate of relations between management and employees.
Unlike the management-union climate estimation, neither foreign or local ownership nor the
proportion of the organisation’s workforce based in Australian was significant. Several other
market environment variables did appear to have a significant effect on the management-
employee climate however. Organisations with lower skilled staff turnover than their intra-
industry rivals had a better management-employee climate, however this factor may possibly
be an outcome of the good climate rather than a determinant.
With respect to the three factors that sought to represent intra-organisational processes, it was
found that—unlike the management-union climate regression—none had a significant
relationship with climate. Only one management style factor was significantly related to
management-employee climate. Organisations that relied most upon intuitive decision-
making rules for their major decisions had worse relations between workers and
management. On the other hand, ‘bold’ organisations, which adopted aggressive high-risk
postures and the emphasis on cost cutting, were not significant.
With respect to the human resource functions, companies that had well developed internal
labour market structures with respect to selection and promotion processes, the provision of
training and career paths, counselling and performance appraisals, had significantly better
relations between management and employees. The status given to human resource
management and the use of pecuniary reward systems through the organisation had no
significant effect on management-employee relations.

19
Table 11: Regression analysis of the determinants of management / employee climate
Variables Coefficient t-statistic Coefficient t-statistic Constant 0.938 1.12 -0.434 -1.10 Organisational environment Log of employees -0.042 -0.69 Foreign owned -0.151 -0.84 Proportion of organisation's total worldwide workforce based
in Australian -0.004 -1.55 Number of separate workplaces this organisation has in
Australian 0.001 1.76* 0.000 1.53 External market volatile -0.096 -1.18 Finding suitable people is proving very difficult 0.015 0.28 Low skilled staff turnover compared with others in this
industry 0.095 1.67* 0.110 2.17** Approximate percentage of Australian employees who are
casual employees 0.099 1.08 Approximate percentage of Australian labour hour
requirements filled by contractors, outworkers and agency employees -0.120 -1.60
Organisational processes Flexible 0.007 0.08 Adjust plan -0.025 -0.30 Communicate -0.173 -1.29 Management style Bold -0.033 -0.40 Intuitive -0.208 -2.38*** -0.178 -2.38***Cheap -0.045 -0.51 Human resource processes Human resource management status 0.007 0.07 Rewards 0.053 0.62 Well developed internal labour market structures 0.122 1.05 0.237 3.14*** Industrial relations context Union density -0.212 -3.18*** -0.226 -5.40***Number of unions -0.004 -0.34 Non-union agreements as a proportion of all collective agreements (employees) -0.030 -0.66 Embraced the reform agenda -0.203 -1.27 Reform agenda has been successful for organisation 0.271 1.64 0.225 1.97** Organisation has collective agreements -0.447 -0.94 Majority of employees on collective agreements -0.036 -0.21 Collective agreements are unique -0.022 -0.14 Collective agreement fits well 0.186 0.87 Majority on collective, are unique, important and suit the organisation perfectly -0.048 -0.23 Organisation has individual contracts 0.488 1.05 0.758 2.08** Majority of employees on individual contracts -1.147 -1.18 Individual contracts fit well -0.254 -1.38 -0.364 -2.07** Majority on individual, are important and suit the organisation perfectly 1.191 1.24 R2 0.4008 0.3235 F-Statistic 3.20*** 10.52*** Ramsey RESET test 1.74 0.20 Cook-Weisberg test 11.61*** 12.16*** Notes: *, **, and *** represents significant at the 10%, 5% and 1% levels respectively in a two-tailed test.

20
Union density was significantly related to climate. The higher the union density the poorer
the climate as reported by senior management, a result that is in line with that found in
Loundes (2000) using the 1995 Australian Workplace and Industrial Relations Survey.
Again, like staff turnover, it is not clear which direction causation runs. Having the individual
contracts that suit the needs of the organisation does not promote a positive management-
employee climate, possibly because of the tension that might arise from the negotiation of
these contracts—that is, it might suit the needs of the organisation, but it doesn’t necessarily
suit the needs of employees. In contrast, simply having individual contracts at the
organisation is positively related to management-employee climate. Encouragingly, those
who reported that the reform agenda had been successful for their organisation (that is, the
benefits to the organisation from reform had exceeded the costs) had a better management-
employee climate.
In sum, organisations with the best climate of relations between management and employees
had a low turnover of skilled staff, well-developed internal labour market structures, and
relied more on systematic analysis for decision-making. Organisations with the lowest union
density also had the best climate, although this may be an outcome of the good relations
rather than a determinant.
6. Typology analysis
The preceding section showed that intra-organisational process and management styles
regarding competition and their strategic decisions are the dominant independent factors
explaining the climate of relations between managers and unions on the one hand and
managers and employees on the other. Accordingly, these factors have been used to construct
a typology based on whether the organisations are above or below the norm for our sample.
In all, it was possible to classify 232 organisations according to whether they were good or
poor communicators, had a bold high-risk attitude toward competitors or were more cautious
and low-risk, and whether their dominant decision style was based on a systematic analysis of
data or was more driven by intuition and rules of thumb.
6.1. Management-union climate
Table 12 presents the average management-union climate measure for 232 organisations
categorised according to this eight-way typology. These are ranked, from lowest to highest,

21
according to the mean climate measures for each type. Good communicators, who have a
more cautious ‘wait and see’ attitude towards competition and rely upon systematic
quantitative analysis for their strategic decision had the best climates within our sample. On
the other hand, poor communicators, who also adopted a cautious approach to competitors
but relied more on intuitive rules of thumb for their decision-making had the poorest
climates. An analysis of variance (ANOVA) test confirmed that these means were
significantly different from each other, and further regression analysis confirmed that the
ranking was correct.
Table 12: Typology of organisations according to intra-organisation processes and management style (ranked, low to high, by management-union climate)
Type of organisation Management-union climate measure
Percentage of organisations
1. Poor communicator, Cautious, Intuitive -0.42 17.5 2. Good communicator, Bold, Intuitive -0.20 16.2 3. Good communicator, Cautious, Intuitive 0.03 5.3 4. Poor communicator, Bold, Intuitive 0.07 13.6 5. Poor communicator, Cautious, Systematic 0.08 10.1 6. Good communicator, Bold, Systematic 0.16 21.1 7. Poor communicator, Bold, Systematic 0.18 10.1 8. Good communicator, Cautious, Systematic 0.72 6.1 ANOVA F-test 3.1*** Note: *** denotes significant at the 1 per cent level.
Having developed a typology based on the management-union climate, we now want to
validate this typology by determining whether it is a useful method of discriminating between
firms in terms of their attitude towards industrial relations reform. Organisations were asked
several questions about the industrial relations reform agenda, which was originally
spearheaded by the Federal Labor Government in the late 1980s, but supported by the ACTU,
and subsequently continued, albeit to a more controversial level, by the Coalition
Government.
Managers were first asked how successful they believed this reform process had been for
Australia as a whole. The average responses were then cross-classified against the typology,
the results of which are presented in Table 13. An ANOVA test indicated that responses to
this question were not significantly different from each other, that is, regardless of the type of
organisation, each had similar views on the success of the reform agenda for Australia as a
whole.
The second question put to managers was how complete they thought the reform agenda was.
The ANOVA results indicated these means were significantly different from each other, and

22
that organisations in the lowest four categories (the intuitive organisations) were less likely to
believe that the reform agenda was complete compared to those in the highest category (good
communicator, cautious, systematic).
The third question asked about the extent to which their organisation had embraced this
reform agenda. In this instance, the ANOVA (and subsequent regression) results indicated
that firms who were poor communicators, cautious about competition and relied on intuitive
decision making (the lowest ranked category in the typology) were significantly less likely to
report that their organisation had embraced the reform agenda compared to those in the
highest category. Organisations in the six middle categories had responses that were not
significantly different from the highest category.
Finally, respondents were asked about whether they thought the reform agenda had been
successful for their organisation. Organisations that were significantly less likely to report
success compared to the top category were in categories one, two, four and five. Additionally,
the results suggested that the initial ranking based on management-union climate did not hold
for this question, that is, moving from the top category to the bottom, there was not a
monotonic decline in the average response.
Table 13: Typology of organisations according to views of IR reform since the late 1980s (ranked, low to high, by management-union climate)
Type of organization
How successful do you think the reform agenda since the late
1980s has been for Australia as
a whole?
How complete do you think the reform agenda
is?
To what extent has your
organisation embraced this
reform agenda?
How successful do you think this reform agenda has been for
your organisation?
1. Poor communicator, Cautious, Intuitive 4.26 3.38 4.13 4.32 2. Good communicator, Bold, Intuitive 4.38 3.71 4.56 4.33 3. Good communicator, Cautious, Intuitive 4.00 3.57 4.79 4.07 4. Poor communicator, Bold, Intuitive 4.43 3.89 4.53 4.52 5. Poor communicator, Cautious,
Systematic 4.32 3.88 4.44 4.20 6. Good communicator, Bold, Systematic 4.86 4.02 4.98 4.74 7. Poor communicator, Bold, Systematic 4.48 4.15 4.58 4.46 8. Good communicator, Cautious,
Systematic 4.75 4.50 5.19 5.06 Total 4.47 3.84 4.61 4.47 ANOVA F-test 1.4 2.8*** 1.5 1.4 Note: *** denotes significant at the 1 per cent level.

23
6.2. Management-employee climate
A similar typology was constructed using the main determinants of the management-
employee climate. In the previous section it was shown that the three main variables
‘explaining’ this climate were internal labour market (ILM) structures, reliance on intuitive
versus systematic decision making procedures and union density. The role of union density in
the management-employee climate is not entirely unambiguous. Either a high union density
acts as a barrier to good relations or is an outcome of poor relations. Without longitudinal
data it is not possible to disentangle cause from effect. The mode of decision-making
processes, which appeared to be a dominant influence for the management-union climate,
was sub-ordinate for management-employee relations. Table 14 shows that the types of firms
that had the best climate had good ILM structures with low union density and systematic
decision making procedures. The worse type of firm had poor internal labour market
structures with high union density and intuitive decision making processes. Again, an
ANOVA test confirmed that these means were significantly different from each other, and
regression analysis confirmed that the ranking was correct.
Table 14: Typology of organisations according to intra-organisation processes, management style and union density (ranked, low to high, by management-employee climate)
Type of organization
Management-employee climate measure
Percentage of organisations
1. Poor ILM, high union density, intuitive -0.59 15.1 2. Poor ILM, high union density, systematic -0.42 13.2 3. Good ILM, high union density, intuitive -0.32 9.9 4. Poor ILM, low union density, intuitive -0.02 14.7 5. Good ILM, high union density, systematic 0.17 16.9 6. Poor ILM, low union density, systematic 0.19 5.1 7. Good ILM, low union density, intuitive 0.57 15.1 8. Good ILM, low union density, systematic 0.68 9.9 ANOVA F-test 12.8*** Note: *** denotes significant at the 1 per cent level.
As in the previous section, the categories were cross-classified against the questions
regarding the industrial relations reform agenda, the results of which are shown in Table 15.
In contrast to the management-union climate typology, respondents classified by these
categories had significantly different opinions on how successful they thought the reform
agenda had been for Australia as a whole. Organisations with the best management-employee
climate—those with good ILM structures, low union density and systematic decision making
methods—were also those which felt the reform process had been good for Australia, had the

24
highest response in regards to whether the reform agenda was complete, had embraced the
reform agenda, and thought it had been successful for their organisation. In contrast, those
who had the poorest view on these reforms were not necessarily the same across the
questions. Those with the poorest management-employee climate—organisations with poor
ILM structures, high union density and intuitive decision making methods—had the least
favourable view regarding whether the reform agenda was complete. Those with poor ILM
structures, low union density and systematic decision making methods were significantly less
likely to report that their organisation had embraced the reform agenda or that it had been
successful for their organisation. Those that felt the reform agenda had been the least
successful for Australia had good ILM structures with high union density and an intuitive
decision making process.
There was mixed evidence on the usefulness of the management-employee climate typology
as a method of distinguishing between firms. For the most part, the organisations in each of
the categories had significantly different responses to the organisations with the best
management-employee climates. However, the initial ranking based on the management-
employee climate did not hold for any of the reform questions, that is, moving from the top
category to the bottom, there was not a monotonic decline in the average response.
Table 15: Typology of organisations according to views of IR reform since the late 1980s (ranked, low to high, by management-employee climate)
Type of organisation
How successful do you think the reform
agenda since the late 1980s has been for
Australia as a whole?
How complete do you think the reform agenda is?
To what extent has your
organisation embraced this
reform agenda?
How successful do you think this reform agenda has
been for your organisation?
1. Poor ILM, high union density, intuitive 4.15 3.34 4.05 4.20 2. Poor ILM, high union density, systematic 4.33 4.00 4.67 4.25 3. Good ILM, high union density, intuitive 4.07 3.45 4.72 4.24 4. Poor ILM, low union density, intuitive 4.21 3.78 4.33 4.23 5. Good ILM, high union density, systematic 4.74 4.09 4.98 4.70 6. Poor ILM, low union density, systematic 4.57 3.64 3.62 4.00 7. Good ILM, low union density, intuitive 4.78 3.98 4.73 4.73 8. Good ILM, low union density, systematic 4.96 4.39 5.29 5.21 Total 4.47 3.84 4.61 4.47 ANOVA F-test 2.4*** 3.5** 3.0*** 3.1*** Note: ** and *** denotes significant at the 5 per cent and 1 per cent level respectively.
25
7. Conclusion
A recurring theme from the analysis of this data has been that organisations which have well-
developed and bilateral channels of communication between managers and employees and
those companies that use systematic and analytical methods for making major decisions tend
to have the most cooperative climate of relations between management, employees and
unions. Good communicators have a clear strategic mission that is well understood and
communicated throughout the organisation. They use a number of procedures to
communicate important information to employees and actively involve affected employees in
work allocation and method decisions. They act on suggestions from employees and have
formal grievance or complaint systems. Finally, the good communicator devotes an above
average level of resources to organisational and managerial reform. Systematic decision
makers make extensive use of quantitative data analysis and nearly always use formal written
reports for their major operations and strategic decisions. Systematic evaluation is more
commonly used than rules of thumb developed though experience and intuition.
It appeared that how industrial relations change had occurred was more important to climate
than the extent of the changes. Those who reported that they had embraced reform also
reported significantly poorer management-union climate. Organisations that had workers on
agreements that had been negotiated without a trade union had a poorer management-union
climate, as did those that reported that the individual contracts suited the needs of the
organisation. Some good news for industrial relations reform was found for those who
reported that the reform agenda had been successful for their organisation, as they had better
management-employee climates. As long as the majority of employees on individual
contracts were on contracts that were important in shaping the employment and working
conditions of those covered, and suited the needs of the organisation, the management-
employee climate was good. Organisations that reported that collective agreements suited the
needs of the organisation well also had better management-union relations.
Union density was significantly related to the manager-employee climate but not the
manager-union climate while management style with respect to competitors was related to the
latter but not the former. It is possible that poor employee relations encouraged greater union
membership, however it may also be the case that the presence of unions and shop stewards
at workplaces is a hindrance to good relations. Aggressive, bold, high risk management teams
do not appear to be conducive to good relations between management and unions, although it
does not appear to make any difference to relations between managers and their workers.

26
These conclusions are subject to the caveats about what manager-based measures of climate
actually mean. A more cooperative climate from the managers perspective may, from the
union’s perspective, be one of manager domination and worker cowardice. Too little conflict
can be suboptimal because it subverts constructive criticism. Nonetheless, these results
suggest that organisations that seriously want to improve the cooperative stance of the
climate of relations between management and unions or employees should enhance their
channels of bilateral communication and base their major decisions more on quantitative
analysis.

27
References
Blandy, R. and Baker, M. (1987) Industry Assistance Reform and the Labour Market: The
New Zealand Evidence, National Institute of Labour Studies, Adelaide and CEDA,
Melbourne.
Cooke, W. N. (1990) ‘Factors Influencing the Effect of Joint Union-Management Programs
on Employee-Supervisor Relations’, Industrial and Labor Relations Review, 43(5), July,
pp. 587-603
Cooke, W. N. (1992) ‘Product quality improvement through employee participation: the
effects of unionisation and joint union-management administration’, Industrial and Labor
Relations Review, 46, pp. 119-134
Dastmalchian, A., Blyton, P. and Adamson, R. (1991) The climate of workplace relations,
Routledge, London and New York
Deery, S., Erwin, P. and Iverson, R. (1999) ‘Industrial relations climate, attendance behaviour
and the role of trade unions’, British Journal of Industrial Relations, 37, pp. 533-558
Fernie, S., Metcalf, D. and Woodland, S. (1994) ‘What Has Human Resource Management
Achieved in the Workplace?’ Employment Policy Institute, Economic Report, 8(3), May.
Fernie, S. and Metcalf, D. (1995) ‘Participation, Contingent Pay, Representation and
Workplace Performance: Evidence from Great Britain’, British Journal of Industrial
Relations, 33, pp. 379-415
Freeman, R. (1980) ‘The Exit-Voice Tradeoff in the Labor Market: Unionism, Job Tenure,
Quits, and Separations’, The Quarterly Journal of Economics, 94(4), June, pp. 643-73.
Freeman, R. and Medoff, J. (1984) What do unions do? New York, Basic Books.
Goddard, J. (1994) Industrial Relations: The Economy and Society, MacGraw-Hill Ryerson,
Toronto
Ichniowski, C. (1986) ‘The effects of grievance activity on productivity’, Industrial and
Labor Relations Review, 40, pp. 847-866

28
Juravich, T., Harris, H. and Brooks, A. (1993) ‘Mutual gains? Labor and management
evaluate their employee involvement programs’, Journal of Labor Research, 14, pp. 165-
185
Katz, H. C., Kochan, T. A., and Gobeille, K. R. (1983) ‘Industrial Relations Performance,
Economic Performance, and QWL Programs: An Interplant Analysis’, Industrial and
Labor Relations Review, 37(1), October, pp. 3-17.
Katz, H. C. and Sabel, C. F. (1985) ‘Industrial Relations & Industrial Adjustment in the Car
Industry’, Industrial Relations, 24(3), Fall, pp. 295-315.
Kruse, D. (1992) “Profit sharing and productivity: microeconomic evidence from the United
States”, The Economic Journal, 102, January, pp. 24-36.
Milgrom, P. and Roberts, J. (1992) Economics, Organization and Management, Prentice
Hall, NJ.
Miller, D. and Droge, C. (1986) ‘Psychological and Traditional Determinants of Structure’,
Administrative Science Quarterly, 31, pp. 539-560.
Loundes, J. (2001) ‘Management and industrial relation practices and outcomes in Australian
workplaces’, Australian Journal of Labour Economics, 4, pp. 19-39
McLeod, W. (1990) ‘Labor-management cooperation: Competing visions and labour’s
challenge’, Industrial Relations Law Journal, 12, pp. 233-292.
Sheppeck, M. A. and Militello, J. (2000) ‘Strategic HR Configurations and Organizational
Performance’, Human Resource Management, 39(1), Spring, pp. 5-16.
Voos, P. (1987) ‘Managerial perceptions of the economic impact of labor relations
programs’, Industrial and Labor Relations Review, 40, pp. 104-117
Wagar, T. H. (1997) ‘The Labour-Management Relationship and Organizational Outcomes’,
Relations Industrielles/Industrial Relations, 52, pp. 430-446
Wooden, M., Loundes, J. and Tseng, Y. (2002) Industrial Relations Reform and Business
Performance: An Introduction, Melbourne Institute of Applied Economic and Social
Research Working Paper No. 2/02, University of Melbourne.

Minerva Access is the Institutional Repository of The University of Melbourne
Author/s:
Webster, E.; Loundes, J.
Title:
Factors Affecting the Industrial Relations Climate in Australian Enterprises
Date:
2002-05
Citation:
Webster, Elizabeth and Loundes, Joanne (2002) Factors Affecting the Industrial Relations
Climate in Australian Enterprises.
Persistent Link:
http://hdl.handle.net/11343/33615
File Description:
Factors Affecting the Industrial Relations Climate in Australian Enterprises