Factors affecting the excitability of skinned fibres of ...
251
.J.<^'°% (• LIBRARY •] Factors affecting the excitability of skinned fibres of the rat Submitted by Craig Andrew Goodman B. Sc. (Hons.) A thesis submitted in the total fulfillment of the requirement for the degree of Doctor of Philosophy Muscle Cell Biochemistry Laboratory, School of Biomedical Sciences Footscray Park Campus, Victoria University PO Box 14428 Melbourne City Mail Centre Victoria, 8001, Australia December 2003
Transcript of Factors affecting the excitability of skinned fibres of ...

.J.<^'°% (• LIBRARY • ]
Factors affecting the excitability of skinned
fibres of the rat
Submitted by
Craig Andrew Goodman B. Sc. (Hons.)
A thesis submitted in the total fulfillment of the requirement for the degree of
Doctor of Philosophy
Muscle Cell Biochemistry Laboratory, School of Biomedical Sciences
Footscray Park Campus, Victoria University
PO Box 14428 Melbourne City Mail Centre
Victoria, 8001, Australia
December 2003

FTS THESIS //"^' 573.751935 GOO /' \ 3 0 0 0 1 0 0 8 0 8 9 1 5 5 (!* • ' /• ^jj Goodman, Craig Andrew ^ . /J Factors affecting the V • "</ excitability of skinned '' fibres of the rat

Table of Contents
Summary
Declaration
Acknowledgements
List of publications
List of abbreviations
List of figures
List of tables
X
XIV
XV
XVI
xvni
xxn
xxv
Chapter 1.
GENERAL INTRODUCTION 1
The Excitation-Contraction-Relaxation cycle - an overview 1
Structures and molecular events involved in the E-C-R cycle 2
Transverse-tubular system 3
Dihydropyridine receptor/voltage sensor 5
Sarcoplasmic reticulum 7
Ryanodine receptor/calcium release channel 8
RyR isa farms and splice variants 10
Putative endogenous regulators of the skeletal muscle RyRl
isa form 12
Ca and Mg ions 12
ATP 14
Calmodulin 14

Other triadic proteins 15
FKBP12 15
Triadin 15
Junatin 16
SR C^^ A TPase/SR C^^ pump 16
The contractile apparatus 17
rA//7 filament structure at rest 17
7&//2 filament activation and muscle contraction 19
7i^/c^ filament structure 20
Iso forms of the contractile and regulatory proteins of the thin and
thick filaments 2 0
Myosin heavy chain iso farms 22
Calcium up-take by the SR calcium A TPase/Pump 23
Signal ti-ansduction between the DHPR andR YR 24
Protein-protein interaction 24
IPj mediated coupling 25
C^* mediated coupling 26
Skeletal muscle fibre diversity 27
Methods of classifying muscle fibre types 28
Immunahistoahemiaal determination ofMHC isa forms 31
Determination ofMHC iso farms using SDS-PA GE 31
Aspects of postnatal development of rat skeletal muscle relevant to the E-C-R cycle 32
Growth of whole muscle and individual fibres 3 3
Ill
T-system and SR 35
DHPR/voltage sensors and RyR/calcium release channels 3 5
E-C coupling 36
Myosin heavy chain iso forms 3 8
Contractile properties 39
Concluding remarks 39
Use of skiimed fibres for studying E-C coupling 41
Advantages of the mechanically skiimed fibre preparation 44
Disadvantages of the mechanically skinned fibre preparation 45
Skeletal muscle glycogen 45
Glycogen particle structure 45
Location of skeletal muscle glycogen and glycogenolytic enzymes 49
Glycogenolysis 51
Glycogen phasphorylase 5 2
Phosphorylase kinase 52
Glycogen and muscle fatigue 53
Energy related role of glycogen in fatigue 5 4
Nan energy related rale of glycogen in fatigue 5 5
Aims of this study 58
Chapter 2.
GENERAL MATERIALS AND METHODS 59
Animals 59

60
IV
Muscle dissection 59
Single muscle fibre dissection
Mechanical skirming 60
Measurement of muscle fibre dimensions 62
Mounting the skinned muscle fibre preparation to the force measuring
system (y2
Force measurements and recording apparatus 64
Farce transducer calibration 66
The protocol far T-system depolarization induced activation 66
Parameters describing skinned fibre responsiveness to T-system depolarization
67
Force detection limit 70
Solution composition 70
Free [Ca' ] in the Polarizing solution 74
Chapter 3.
DEVELOPMENTAL AGE AND E-C COUPLING CHARACTERISTICS OF
MECHANICALLY SKINNED MUSCLE FIBRES OF THE RAT
Introduction 76
Materials and Methods 77
Animals 77

92
Skinned fibre preparation 11
Skinned fibre solutions 11
T-system depolarization and E-C coupling parameters 78
Contractile apparatus experiments 78
Data analyses and statistics 82
Results 82
Age related differences in E-C coupling characteristics 82
Maximum depolarization-induced force response 82
75% run-dawn 89
Stability of responsiveness to T-system depolarization
Discussion 92
Age related differences in E-C coupling characteristics 94
Maximum depolarization-induced force response 94
Run-dawn 96
Methodological comments 97
Chapter 4.
MHC-BASED FIBRE TYPE AND E-C COUPLING CHARACTERISTICS OF
MECHANICALLY SKINNED MUSCLE FIBRES OF THE RAT
Introduction 99
Materials and Methods 101
Animals and muscles 101
Mechanically skinned single fibre preparations and T-system depolarization experiments 102
Skinned fibre solutions 102

\ 1
Myosin hea vy chain analysis 102
Sample preparation 102
Electraphoretia set up 102
Staining afpalyaarylamide gels 104
Statistics 105
Results 105
Profiles of T-system depolarization induced force responses developed by eleatropharetically typed single fibre preparations from EDL, SM and SOL 105
Relationship between quantitative E-C coupling characteristics 110
Quantitative E-C coupling characteristics in eleatropharetically typed
single fibres from EDL, SM and SOL 113
Type flB EDL fibres vs type IIB SM fibres 113
Type IIB EDL and type IIB SM fibres vs Type I SOL fibres 116 Type IIB/D SM fibres vs type IIB SM fibres; type I/IIA
SOL fibres vs type I SOL fibres 116
Type I SOL fibres 118
Discussion 118
maxDIFR and MHC-based fibre type 119
750/Jl-D and MHC-based fibre type 121
Profile of T-system depolarization induced force responses produced by mechanically skinned fibres from EDL, SM and SOL muscles 123 Are Rinctional characteristics of the T-system and SR compartments related to MHC-based fibre type ? 126

vu
Chapter 5.
GLYCOGEN STABILITY AND GLYCOGEN PHOSPHORYLASE ACTIVITIES
IN ISOLATED SKELETAL MUSCLES FROM RAT AND TOAD
Introduction
Materials and Methods
Animals
Results
Muscle preparation
Muscle storage
Glycogen determination
Wet weight/dry weight conversion
Phosphorylase activities
Statistics
Glycogen content in control muscles
Glycogen content in muscles stored under ail atRT
Glycogen content in muscles stored under ail at 4^C
Phostotai andPhos a activities in control muscles
Phostotal and Phas a activity in muscles stored under ail atRT 4>C 140
137
Discussion
Glycogen content and phasphorylase activities m freshly dissected (control) muscles
Glycogen loss and phasphorylase activities in muscles stored under ail at RTand at 4"C
130
131
131
132
133
133
135
135
136
137
137
139
140
and
144
144
149

Vlll
Chapter 6.
GLYCOGEN CONTENT AND RESPONSIVENESS TO T-SYSTEM
DEPOLARIZATION IN RAT MECHANICALLY SKINNED MUSCLE FIBRES
Introduction 153
Materials and Methods 154
Animals and muscles 15 4
Skinned fibre responsiveness to T-system depolarisation 155
Skiimed fibre solutions 155
Glycogen analysis in single fibre segments 15 5
Preparation of Petri dishes far enzymatic reactions in pi
volumes 157
Solutions 157
Reaction steps 157
Preparation of reaction droplets 158
Determination ofSFGlyc in washed fibre segments 158
Determination offluargenic material in washing solution 160
Determination ofNGlyc material in the washing solution 160
Micrafluorametric reading of samples 160
STD curves 162
Glucose and insulin treatment 164
Statistics 164
Results 164
Glycogen content in mechanically skinned fibres from rat EDL muscle 164
The contractile responsiveness to T-system depolarization of mechanically skinned fibres from rat EDL muscles 165

LX
SR C^^-release induced by T-system depolarization in mechanically skinned fibres from rat EDL muscle is not accompanied by detectable loss of fibre glycogen 16 8
Initial SFGlyc and response capacity in mechanically skinned fibres from rat EDL muscle 170
Discussion 170
CONCLUDING REMARKS 180
REFERENCES 183
Summary
During the last decade, the rat mechanically skinned fibre preparation has been used
with increasing frequency to investigate cellular aspects of excitation-contraction (E-
C) coupling processes in mammalian skeletal muscle. The main aim of this PhD
project was to increase awareness of factors that affect the contractile responsiveness
of rat mechanically skinned fibre preparations to T-system depolarization, a
functional parameter of E-C coupling referred to, sometimes, as skinned fibre
excitability. More specifically, the work presented in this thesis is concerned with the
relationship between rat skinned fibre excitability and (i) developmental age {Chapter
J), (ii) MHC composition, muscle of origin {Chapter 4) and (iii) glycogen content
{Chapter 6). Below are summarized the specific aims of the individual studies carried
out within the scope of this project, and the major findings produced.
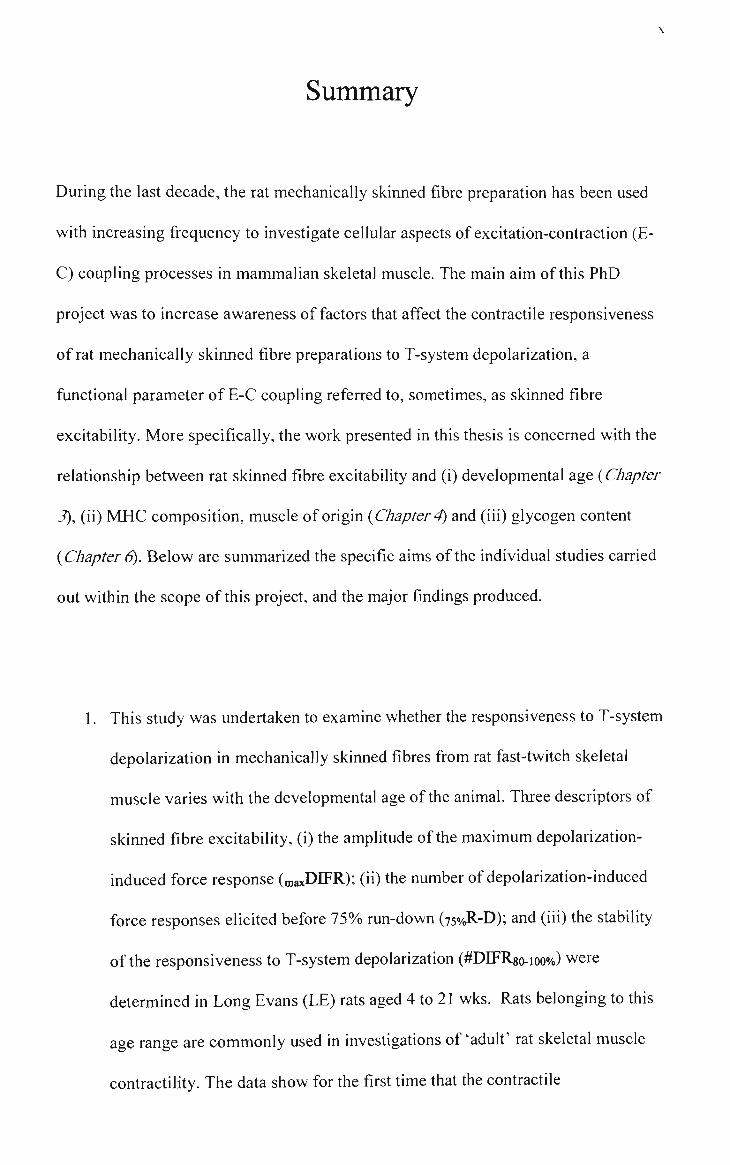
1. This study was undertaken to examine whether the responsiveness to T-system
depolarization in mechanically skinned fibres from rat fast-twitch skeletal
muscle varies with the developmental age of the animal. Three descriptors of
skinned fibre excitability, (i) the amplitude of the maximum depolarizafion-
induced force response (maxDIFR); (ii) the number of depolarization-induced
force responses elicited before 75% run-down (750/^-D); and (iii) the stability
of the responsiveness to T-system depolarization (#DIFR«o.ioo%) were
determined in Long Evans (LE) rats aged 4 to 21 wks. Rats belonging to this
age range are commonly used in investigations of 'adult' rat skeletal muscle
contractility. The data show for the first time that the contractile
XI
responsiveness of mechanically skinned fibre preparations from rat extensor
digitorum longus (EDL) muscle to T-system depolarization varies with the
developmental age of the animal. More specifically it was found that
mechanically skinned fibres from 21wk old rats performed well with respect
to all descriptors of E-C coupling (maxDIFR, 75%R-D, #DIFR8o-ioo%) examined,
while fibres from 4 wk old rats were the poorest performers for all three
parameters. By comparison, fibres from 10 wk old rats performed as well as
21 wk fibres with respect to maxDIFR but not with respect to 750/oR-D or
#DIFR8o-ioo%-
2. In this study, it was investigated whether the previously established
differences between fast- and slow-twitch single skeletal muscle fibres of the
rat, in terms of myosin heavy chain (MHC) isoform composition and
contractile function, are paralleled by differences in E-C coupling.
Characteristics of contractile responsiveness to T-system depolarization-
induced activation of electrophoretically typed, mechanically skinned single
fibres from the soleus (SOL), EDL, and the white region of the stemomastoid
(SM) muscle were determined and compared. The quantitative parameters
assessed were maxDIFR and yso^R-D. The mean maxDDFR values for type IIB
EDL and type IIB SM fibres were not statistically different, and both were
greater than the mean maxDIFR for type I Sol fibres. The mean 75%R-D for type
IIB EDL fibres was greater than that for type 1 Sol fibres as well as type IIB
SM fibres. These data suggest that E-C coupling characteristics of
mechanically skinned rat single muscle fibres are related to MHC based fibre
type and the muscle of origin.

Xll
3. This study was concerned with the stability of glycogen in isolated EDL and
SOL muscles of the rat and illiofibularis (IF) muscles of the toad during
storage conditions commonly used in experiments involving mechanically
skinned single fibre preparations. Glycogen content was determined
fluorometrically in homogenates prepared from whole muscles stored under
paraffin oil for up to 6 hrs at RT (20-25°C) or 4°C. Control muscles and
muscles stored for 0.5 hr and 6 hrs were also analysed for total phosphorylase
and phosphorylase a activities. No significant change was observed in the
glycogen content of EDL and SOL muscles stored at RT for 0.5 hr. In rat
muscles stored at RT for longer than 0.5 hr, the glycogen content decreased to
67.6 % (EDL) and 78.7 % (SOL), when compared to controls, after 3hrs and
to 25.3 % (EDL) and 37.4 % (SOL) after 6 hrs. Rat muscles stored at 4°C
retained 79.0 % (EDL) and 92.5 % (SOL) of glycogen after 3hrs and 75.2 %
(EDL) and 61.1 % (SOL) after 6 hrs. The glycogen content of IF muscles
stored at RT or 4°C for 6 hrs was not significantly different from controls.
Taken together, these results indicate that storage under paraffin oil for up to 6
hrs at RT or 4°C is accompanied by a time- and temperature-dependent
glycogen loss in EDL and SOL muscles of the rat and by minimal glycogen
loss in toad IF muscles.
4. Glycogen content (determined microfluorometrically), response capacity to T-
system depolarization (a composite parameter describing the amplitude of
force responses and the number of responses to 'run-down') and the
relationship between these two parameters were examined in single

Xll l
mechanically skinned fibres from rat EDL muscle in the presence of high and
constant [ATP] and [creatine phosphate]. These experiments were carried out
within 3 hours of muscle dissection. Total glycogen content (tGlyc) in freshly
dissected fibres was 58.1 ± 4.2 mmol glucosyl units/1 fibre (n - 53), with a
large proportion being retained in the skinned fibres (SFGlyc) after 2 min
(73.1 + 2.8 %) and 30 min (64 ± 12.3 %) exposure to an aqueous relaxing
solution. The proportion ofSFGlyc was markedly lower (-28%) after 30 min
incubation of the fibre in a high (30 )J.M) Ca solution, which suggests that rat
skinned fibres contain a Ca -sensitive glycogenolytic system. In rat skinned
fibres there was no detectable loss of glycogen associated with T-system
9-1-
depolarization-induced Ca release and there was no correlation between
response capacity and initial SFGlyc, indicating that other factors, unrelated to
glycogen depletion, ultimately limited the capacity of rat skinned fibres to
respond to T-system depolarization. These data indicate that rat mechanically
skinned fibre preparations are well suited for studies of glycogenolysis at a
cellular level and that with further refinement of the depolarization protocol
may be suitable for studies of the non-metabolic role of glycogen in
mammalian skeletal muscle contractility.
Knowledge of the contribufion of animal age and MHC isoform composifion to inter-
fibre variability, with respect to skinned fibre responsiveness to T-system
depolarization, has direct practical value for single fibre studies of E-C coupling in
mammalian muscle which use the mechanically skinned fibre preparation.

X l \
Declaration
This thesis contains no material that has been presented or accepted for the award of
any other degree or diploma in this or any other university. Except where specifically
indicated in the text, the data presented herein is the result of work of the author, and
to the best of my knowledge and belief, has not been previously written or published
by any other person.
Craig Andrew Goodman

x\
Acknow ledgements
1 would like to acknowledge and thank my supervisor Professor Gabriela Stephenson
for her support, commitment, patience and insight. I am forever indebted for all that I
have learned, professionally and personally, over the past few years.
I also thank current (Dr Ronnie Blazev, Mr Brett O'Connell and Mr Justin Kemp) and
past members (Dr Susie Bortolotto, Dr Long Nguyen and Dr Michael Patterson) of
the Muscle Cell Biochemistry Laboratory for their support, guidance, and for many
funny moments.
To the guys 'down stairs' in the Exercise Metabolism Unit (Assoc. Prof Michael
Carrey, Dr Alan Hayes and Mr Andy Williams) thanks for your friendship, for great
debates and lunch time quizzes.
To my family and friends, 1 thank you for all your encouragement and prayers over
the years. A big 'thank you' to my Dad for helping edit the final manuscript.
Finally, 1 would like to acknowledge my wife, Katrina, for her emotional, spiritual
and financial support over the past decade that has allowed me to follow my dream.
Your patience, encouragement and dedication have been a life line in times of doubt. 1
promise that 1 will spend more time with you and our beautiful Audrey.

X\l
List of Publications
Refereed papers
1. Goodman CA & Stephenson GMM (2000). Glycogen stability and glycogen
phosphorylase activities in isolated skeletal muscles from the rat and toad. /
Muscle Res CellMotil2\, 655-662.
2. Goodman CA, Patterson MF & Stephenson GM (2003). MHC-based fibre type
and E-C coupling characteristics in mechanically skinned muscle fibres of the rat.
Am/Physiol2S4, C1448-C1459.
Goodman CA, Blazev R & Stephenson GMM. Glycogen content and contractile
responsiveness to T-system depolarization in skinned muscle fibres of the rat. Cell
Physiol Biochem {under review, Ms no. 2003MS078).
Blazev R, Goodman CA & Stephenson GMM. The effect of age and strain on E-C
coupling characteristics of rat mechanically skinned skeletal muscle fibres, (in
preparation).
Conference Presentations
1. Goodman CA & Stephenson GMM (1999). Glycogen stability in isolated
muscles from toad and rat. Proceedings of the Australian Physiological and
Pharmacological Society. 30 (2): 38P.

XVII
2. Goodman CA, Patterson MF, Cellini M & Stephenson GMM (2000). MHC
isoform expression and EC-coupling in mechanically skinned muscle fibres of
the rat. Proceedings of the Australian Physiological and Pharmacological
Society 31{2): 102P.
3. Goodman CA, Patterson MF, Cellini M & Stephenson GMM (2000). MHC
isoform expression and EC-coupling in mechanically skinned muscle fibres of
the rat. The Physiologist. 43(4): 357.
4. Goodman CA, Nguyen LT & Stephenson GMM (2001). A study of the
relationship between glycogen content and excitation-contraction coupling in
mechanically skinned muscle fibres of the rat. Proceedings of the XXXIV
International Congress of Physiological Sciences. lUPS 2001 Christchurch,
NZ. CD-ROM Abstract 750.

XVIU
List of abbreviations
ADP - adenosine diphosphate
AMP - adenosine monophosphate
ANOVA - analysis of variance
ATP - adenosine triphosphate
ATPase - adenosine triphosphatase
cAMP - cyclic adenosine monophosphate
C - the proportion of total acrylamide monomer (acrylamide &
methylenebisacrylamide) represnted by methylenebisacrylamide
°C - degrees celcius
CaM - calmodulin
Ca " - calcium ion
[Ca' ] - concentration of ion X. e.g. [Ca^^] - concentration of calcium ions
cDNA - complementary deoxyribonucleic acid
CICR - calcium-induced calcium release
cm - centimeter
CP - creatine phosphate
C-terminal - carboxyl terminal
d - diameter
Da - Daltons
DHP - dihydropyridine
DHPR - dihydropyridine receptor
DIFR - depolarization-induced force response
E-C coupling - excitation contraction coupling
E-C-R cycle - excitation-contraction-relaxation cycle
EDL - extensor digitorum longus
EDTA - ethylenediaminetetraacetic acid
EGTA - ethyleneglycol-bis(P-aminoethylether)-N,N'-tetraacetic acid
Em - membrane potential
FT - fast twitch
G-6-P - gluocse-6-phosphate
GP - glycogen phosphorylase

XIX
g -g ram
HDTA - hexamethalenediamine N,N,N',N'-tetraacetic acid
HEPES - N-2-hydroxethyl-piper-azine-N'-2-ethylsulphonic acid
HMM - heavy meromyosin
hr - hour
IF - illiofibularis
IP3 - inositol trisphosphate
K^ - potassium ion
Kapp - apparent affinity constant
KD - apparent dissociation constant
kDa - kilodaltons
kg - kilogram
Km - Michaelis-Menton constant
1 - length
LE - Long Evans
LMM - light meromyosin
M - molar
maxCaF - maximum Ca^^-activated force
maxDIFR - maximum depolarization-induced force response
mg - miUigram
MG - macroglycogen
Mg^^ - magnesium ion
MHC - myosin heavy chain
ml - milliliter
MLC - myosin light chain
mm - millimeter
mM - millimolar
mosmol - milliosmols
mRNA - messenger ribonucleic acid
mV - millivolt
MW - molecular weight
Na^ - sodium ion
NADH - nicotine adenine dinucleotide (reduced form)
NAD^ - nicotine adenine dinucleotide (oxidized form)

XX
NaN3 - sodium azide
nF - no force response
nl - nanoliter
nm - nanometer
nM - nanomolar
N-terminal - amino terminal
pCa- -logio[Ca'^]
pF - prolonged force response
PG - proglycogen
pH - -logio[H^]
PhK - phosphorylase kinase
Phos a - phosphorylase a
Phos b - phosphorylase b
Phostotai- phosphorylase total
Pi - inorganic phosphate
PIP2 - phosphatidylinositol 4,5-bisphosphate
pmol - picomol
PPl - protein phosphatase 1
r - correlation co-efficient
r -co-efficient of determination
750/0 R-D- number of depolarization-induced force responses to 75% run-down
RT - room temperature (20-25°C)
rtF - rapid transient force
RYR - ryanodine receptor
RYRl - skeletal muscle ryanodine receptor isoform
RYR2 - cardiac muscle ryanodine receptor isoform
RYR3 - brain ryanodine receptor isoform
s- second
51 - myosin subfragment 1
52 - myosin subfragment 2
SDS-PAGE - sodium dodecyl sulfate-polyacrylamide gel electrophoresis
SEM - standard error of the mean
SM - stemomastoid
SOL - soleus
XXI
SR - sarcoplasmic reticulum
ST - slow twitch
T - the total concentration of monomer used to produced a polyacrylamide gel
(expressed as % w/v)
TC - terminal cistemae
TCA - trichloroacetic acid
Tm - tropomyosin
Tn - Troponin
TnC - troponin C
Tnl - troponin 1
TnT - troponin T
T-systera - transverse tubular system
t-tubule - transverse tubule
|j.g - microgram
11 - microliter
|j,m - micrometer
fxM - micromolar
|iN - micronewton
V - volume
w - width
wks - weeks

xxn
List of Figures
Figure No. Figure Title Page
1.1 Skeletal muscle triad 4
1.2 The t-tubular DHPR/voltage sensor 6
1.3 Diagram of the molecular structure of the SR RyR/Ca^^ release channel 9
1.4 Triad proteins involved in skeletal muscle E-C coupling 11
7-1-
1.5 RyR/Ca release channel regulation 13
1.6 The ultrastructure of the thin filament in vertebrate skeletal
muscle 1 g
1.7 Myosin heavy chain 21
1.8 Changes in rat body mass, muscle length and muscle girth with age 34
1.9 The mechanically skinned muscle fibre 43 1.10 The glycosome 47
1.11 The molecular structure of a glycogen particle 48
1.12 Correlation between toad fibre capacity to respond to T-system depolarization and initial fibre glycogen concentration 57
2.1 Dissecting microscope with video monitor system used for dissection, skinning and measuring single muscle fibres 61
2.2 Force measurement and recording apparatus 63
2.3 Circuit diagram of the Wheatstone bridge 65
2.4 Force transducer calibration curve 71
3.1 Representative chart recording of force response by a 10 week rat EDL fibre exposed to solutions with varying free Ca^^ concentrations 81
3.2 T-system depolarization-induced force responses elicited in single mechanically skinned EDL fibres from Long Evans rats of different ages 83

XXI11
3.3 Summarized data for (A) the maximum depolarizafion-induced force response and (B) the number of responses to depolarization obtained before 75% run-down in skinned fibres from 4-wk, 8-wk, 10-wk, 15-wk, and 21 -wk Long Evans rats 87
3.4 Averaged force/pCa curves for 4 week (•; n = 16) and 10 week (o;n = 21) EDL fibres 88
3.5 Correlation between fibre cross-sectional area and the number of depolarization-induced force responses obtained before 75% run-down 93
4.1 Electrophoresis equipment 103
4.2 An example of a rapid transient force {rtF) response developed by a type IIB EDL muscle fibre 106
4.3 Sample force responses produced by soleus fibres 107
4.4 An example of a trace from a soleus fibre that produced no force {nF) in response to T-system depolarisation 109
4.5 Representative electrophoretogram of the muscle fibre types from extensor digitorum longus (EDL), stemomastoid (SM) and soleus (SOL). 112
4.6 Relationship between the maxDIFR and 75o/„R-D for type IIB EDL fibres, type IIB stemomastoid (SM) fibres, and type 1 SOL fibres 114
4.7 (A) The amplitude of the maximum depolarization induced force 7-1-
response (maxDIFR; expressed as a % of the maximum Ca activated force) for type IIB EDL, type IIB stemomastoid (SM) and type 1 SOL mechanically skinned muscle fibres. (B) The number of depolarization induced force responses to 75 % run-down (75o/„R-D) in type IIB EDL, type IIB stemomastoid (SM) and type 1 SOL mechanically skinned muscle fibres. 117
5.1 The time course of glycogen loss in rat EDL, SOL and IF muscles stored under oil at room temperature (20 - 25°C) (A) and 4°C (B) 138
5.2 (A) Total phosphorylase activities (fimol/min/g dry weight) in rat EDL and SOL and toad IF control muscles. (B) Phosphorylase a activities (expressed: mol/min/g dry weight and as % of total phosphorylase) in rat EDL and SOL and toad IF control muscles 141
5.3 Phosphorylase 'a' activities (expressed as % of total phosphorylase) in rat EDL and SOL and toad IF muscles stored under oil at room temperature (20 - 25°C) (A) and 4°C (B) for up to 6 hrs 145
6.1 Arrangement of reagent droplets under a layer of mineral oil on the bottom of a Petri dish 159

X.X1\
6.2 Custom designed brass frame with two microcells 161
6.3 Microfluormetric system used in single fibre glycogen content experiments 163
6.4 An example of the depolarization induced force responses developed by an EDL muscle fibre to 75 % run-down 167
6.5 Correlation between initial fibre glycogen concentration and fibre response capacity in mechanically skinned fibres 171

xx\
List of Tables
Table No. Table Title Page b"
1.1 Fibre type differences in structures and molecular species involved in the E-C-R cycle 29
1.2 Summarized information on the time taken by various structures and processes involved in the E-C-R cycle to reach adult values 40
2.1 Essential positive contributors to the upstroke and downstroke of T-system depolarization induced force responses in mechanically skinned fibre preparations 69
2.2 Solutions used in E-C coupling experiments 72
2+
3.1 Volumes of relaxing (high EGTA) and maximum Ca activation (high Ca-EGTA) solutions required to obtain Ca^^-activation solutions used in force/pCa experiments 80
3.2 Mean summarized data for E-C coupling (and other) parameters examined in skinned fibres of different aged Long Evans rats 91
4.1 Profiles of T-system depolarisation induced force responses and the magnitude of low Mg^^ -induced force responses developed by electrophoretically typed single fibre preparations from EDL, SM and SOL 111
5.1 Ratio Phostotai 6 hrs /Phostotai control for EDL, SOL and IF 143

Chapter 1
GElSfERAL INTRODUCTION
The Excitation-Contraction-Relaxation cycle - an overview
The term excitation-contraction relaxation cycle (E-C-R cycle) describes the process
initiated by an electrical signal produced by normal nervous transmission or by direct
stimulation, which involves excitation of the membraneous interface between
myoplasm and extracellular fluid [sarcolemma and transverse (t)-tubular system (T-
system)], activation of the contractile apparatus, deactivation of the contractile
apparatus and muscle relaxafion (Sandow, 1965; Stephenson etal, 1998). More
specifically for vertebrate skeletal muscle, the E-C-R cycle comprises the following
events: 1) initiation and propagation of an action potential along the sarcolemma and
into the T-system; 2) action potential induced depolarisation of the t-tubular
membrane; 3) dihydropyridine receptor (DHPR)/voltage sensor activation associated
with the T-system depolarization; 4) transmission of the signal from the T-system to
the sarcoplasmic reticulum (SR) where Ca^^ is stored; 5) activation of the ryanodine
receptor (RyR)/Ca^^ release channel and release of Ca ^ from the SR into the
94- 9-1-
myoplasm; 6) the rise in myoplasmic [Ca ], binding of Ca to the regulatory
proteins on the thin filament and activation of the contractile apparatus, and 7) the
reuptake of Ca into the SR and muscle relaxation (Stephenson et ah, 1998).
Most of these events can be investigated at the cellular level using mechanically
skinned fibre preparations, i.e. single muscle fibres demembranated under oil with a
pair of fine forceps and incubated under controlled conditions in carefully designed
aqueous solutions. This thesis is concemed with the relationship between the
responsiveness to T-system depolarisafion (also referred to as fibre excitability; Bames
etal, 2001) of rat mechanically skinned fibres and the developmental age of the rat,
myosin heavy chain composifion (MHC) of the fibre and fibre glycogen content.
Accordingly, this chapter will briefly survey current knowledge on selected structures
and events in the E-C-R cycle, the polymorphic nature of muscle proteins (with
emphasis on MHC), the molecular diversity of skeletal muscle cells, the postnatal
development of the rat and skeletal muscle glycogen.
Structures and molecular events involved in the E-C-R cycle
In the first step, there is a local change in the membrane potential (which becomes
more positive inside) above a critical value known as 'threshold'. This event activates
voltage-gated Na^- (and K -) channels, triggering a wave of depolarizations (known
as an 'action potential') which spread along the sarcolemma and into the T-system.
In the second step, the action potential is detected by a voltage sensitive protein
complex (known as 'voltage sensor') located at the junction of the T-system and the
SR. This protein, also referred to as the dihydropyridine receptor (DHPR), transmits
the electrical signal to Ca^^ release channels located in the SR membrane. Once the
Ca " release channel is activated, Ca^^ is rapidly released from the SR into the
9-1-
sarcoplasm causing a transient increase in the myoplasmic [Ca ] from about 0.1 \xM
at rest to about 10 |iM (Bagshaw, 1993). According to the current paradigm for the
mechanism involved in the shortening or contraction of skeletal muscle, Ca diffuse
rapidly into the myofibrilar lattice and bind to the troponin C (TnC) protein on the
actin thin filament. The binding of Ca^^ to TnC resuhs in the removal of the inhibitory

acfion of Tnl on tropomyosin and the movement of tropomyosin along the thin
filament, which exposes the myosin binding sites on actin (Bagshaw, 1993). Myosin
SI heads can now bind to the thin filaments. Using the free energy released from the
hydrolysis of ATP by the myosin ATPase, myosin swivels or rotates at the S2 flexible
hinge, causing the actin filaments to slide over the myosin filaments. Once the
electrical signal initiatmg SR Ca " release ceases the intracellular [Ca^^] must be
lowered back to resting levels (0.1 |aM) to induce muscle relaxafion. This is
accomplished in part by Ca^^ binding to myoplasmic Ca^^ binding proteins such as
parvalbumin. Most Ca^^ however is actively 'pumped' back into the SR by the Ca^^
94- 94-
ATPase-Ca pump. Once intracellular [Ca ] has been lowered and TnC proteins are 9+
no longer occupied by Ca , Tnl resumes its inhibitory influence on tropomyosin,
which in tum blocks the myosin binding sites on the thin filament.
Transverse-tubular system
The T-system is composed of a network of tubular invaginations (t-tubules)
originating from the plasma membrane that project transversely into the cell interior
making contact with every myofibril. The t-tubules enter mammalian muscle fibres at
the region corresponding to the overlap between the actin and myosin filaments and
hence occur twice every sarcomere. The major role of the T-system is to allow the
propagation of an action potential from the plasma membrane into the core of the
fibre and facilitate the activation of myofibrils deep within the muscle cell. The
majority of the T-system is located in direct apposifion to the terminal cistemae (TC)
region of the SR. A triad (see Figure 1.1) is formed when a TC is located on either
side of one t-tubule.
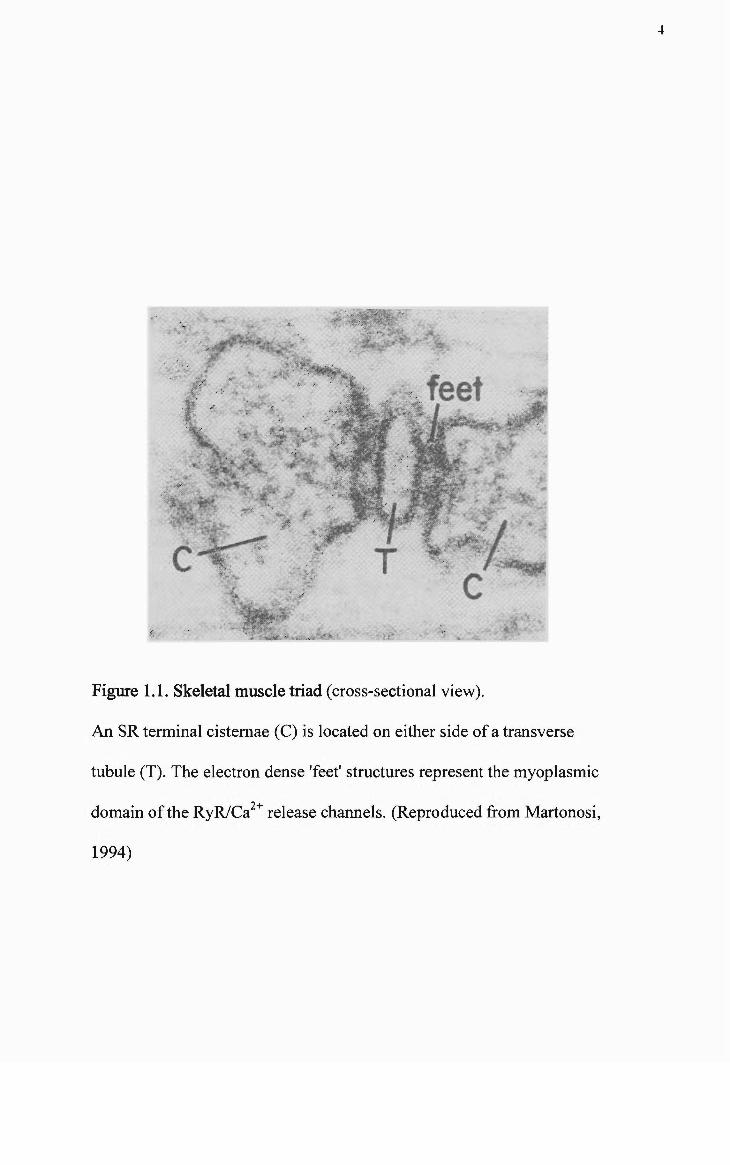
Figure 1.1. Skeletal muscle triad (cross-sectional view).
An SR terminal cistemae (C) is located on either side of a transverse
tubule (T). The electron dense 'feet' structures represent the myoplasmic
,2+ domain of the RyR/Ca release channels. (Reproduced from Martonosi,
1994)

Dihydropyridine receptor/voltage sensor
The skeletal muscle t-tubule membrane is a rich source of DHPRs (Fosset et al,
1983). The DHPR has the potential to act as a voltage-dependent L-type Ca^^ channel
(Curtis & Catterall 1983, 1986) but less than 5 % of total appear to perform this
function (Schwartz etal, 1985). As shown in Figure 1.2 A, the DHPR is made up of a
large ai subunit (185 kDa) and several smaller subunits known as the a i (143 kDa), p
(54 kDa), y (30 kDa) and 6 (26 kDa) (for reviews see Dulhunty, 1992, Aidely, 1998).
The exact functions of these smaller subunits remain unclear but the ai subunit
appears to contain the channel pore, the DHP binding sites and the voltage sensor.
(Dulhunty etal, 2002). There exist two molecular forms (isoforms) of the DHPR ai
subunit, the ais (skeletal isoform) and aic (cardiac isoform). The ais is the most
common isoform found in fast and slow skeletal muscle. The aic has been found in
the heart, neonatal skeletal muscle, and in adult slow-twitch skeletal muscle (e.g.
soleus) and in the diaphragm (Froemming et al., 2000). The presence of the aic
isoform may confer cardiac-type E-C coupling characteristics to skeletal muscle fibres
(Tanabe etal, 1990).
The molecular structure of the DHPR is very similar to that of the voltage dependent
Na" channel, containing four membrane spanning repeat domains (1 -IV), each of
which contains six transmembrane a-helices (S1-S6) (Figure 1.2B). The fourth a-
helix of each domain (S4) contains numerous positive charges and is thought to form
the voltage sensor and be responsible for the asymmetrical charge movement
observable upon membrane depolarization. The peptide loop located between 'repeat'
domains II and 111 on the myoplasmic side of the t-tubular membrane appears to be
essential for signal transmission between the T-tubule and the SR (Dulhunty, 1992;

c.'-
H
Y
-y
a,
¥ ^
WW If
B
Reooot I
^a
XT 17
^
1 . ^ ^ / u
34
xrxj
IB suDunttI
^-nj
IV
u ?|3 4| j r|6
OvitvOe
msioe
\J \J
Figure 1.2 The t-tubular DHPR/voltage sensor.
A. The protein subunits that make up the t-tubular DHPR/voltage sensor L type Ca
channel. B. The molecular structure of the t-tubular DHPR/voltage sensor L type Ca 2+
channel. (Reproduced from Melzer, 1995)

Matterson, 1994; see also section on Signal transduction between the DHPR and RyR,
page 24). DHPRs are arranged in symmetrical groups of four called tetrads. Each
9-1-
DHPR tetrad is directly apposed to a RyR/Ca release channel homotetramer.
As already mentioned, although the DHPR is an L-type Ca^^ channel, the entry of
Ca through the channel from the extracellular fluid is not essential, in skeletal
muscle, for an action potential or for muscle contraction (Luttgau & Spiecker, 1979;
Dulhunty & Gage, 1988). Instead it seems that the major role of the DHPR in skeletal
muscle is as a t-tubule membrane-bound voltage sensor. Indeed, dysgenic mice that
do not express the a l subunit display a lack of E-C coupling and DHP sensitive Ca ^
channels (Beam etal, 1986) both of which can be restored by the microinjection of
the a l cDNA (Tanabe etal, 1988).
Sarcoplasmic reticulum
The internal membrane system called the SR is the muscle cell equivalent of smooth
endoplasmic reticulum and is separate from the outer plasma membrane and t-tubules
(Peachy & Franzini-Armstrong, 1980). The two major regions of the SR relevant to
the E-C-R cycle are the TC and the longitudinal tubules. The TC, also known as
juncfional SR, is involved in forming the triad (see Figure 1.1) whereby a TC is
located on each side of a t-tubule (Franzini-Armsfrong, 1994), while longitudinal SR
run parallel to the muscle filaments and connect two TC together medially. The
junctional surface of the SR is covered with regularly arranged and electron dense
'feet' structures (Figure 1.1) while non-junctional surfaces, including the longitudinal
SR contain a high density of ATP-dependent Ca^^ pumps (Franzini-Armstrong, 1994).
The basic ftincfion of the SR is to regulate the [Ca"^] in the myoplasm and as a
consequence regulate the activation state of the contractile apparatus (Peachy &
Franzini-Armstrong, 1980). A resting myoplasmic [Ca^^] of 0.1 ^M is maintained by
the SR Ca ^pumps which actively transports Ca^^ into the SR against a concentration
gradient (Gillis, 1985). The glycoprotein calsequestrin, located within the TC, has a
high capacity and medium affinity for Ca^^ binding and acts primarily as a Ca"" buffer
helping to reduce the SR lumen/myoplasm Ca^^ gradient (Yano 8c Zarain-Herzberg,
1994). When the muscle cell is stimulated Ca^^ is rapidly released from the SR via
Ca ^ release channels located in the SR TC.
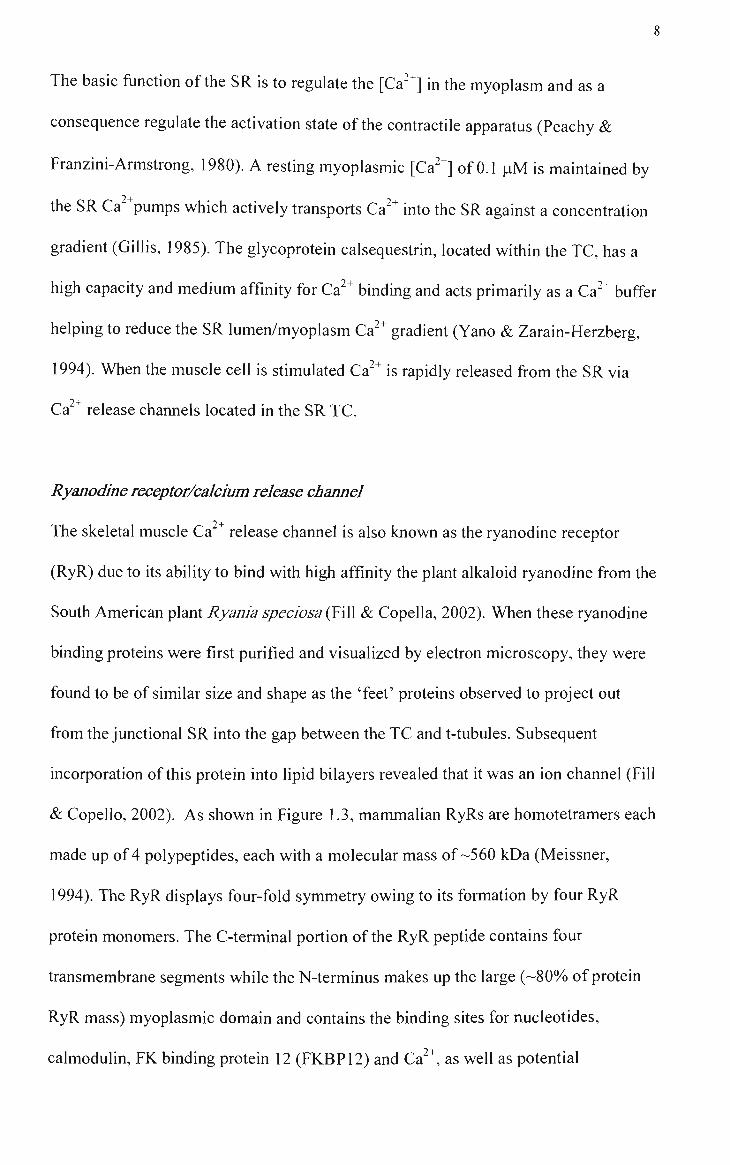
Ryanodine receptor/calcitim release channel
The skeletal muscle Ca release channel is also known as the ryanodine receptor
(RyR) due to its ability to bind with high affinity the plant alkaloid ryanodine from the
South American plant Ryania speciosa (Fill & Copella, 2002). When these ryanodine
binding proteins were first purified and visualized by electron microscopy, they were
found to be of similar size and shape as the 'feet' proteins observed to project out
from the junctional SR into the gap between the TC and t-tubules. Subsequent
incorporation of this protein into lipid bilayers revealed that it was an ion channel (Fill
& Copello, 2002). As shown in Figure 1.3, mammalian RyRs are homotetramers each
made up of 4 polypeptides, each with a molecular mass of-560 kDa (Meissner,
1994). The RyR displays four-fold symmetry owing to its formation by four RyR
protein monomers. The C-temiinal portion of the RyR peptide contains four
transmembrane segments while the N-terminus makes up the large (-80% of protein
RyR mass) myoplasmic domain and contains the binding sites for nucleotides,
calmodulin, FK binding protein 12 (FKBP12) and Ca^*, as well as potential

Myoplasm
'SRMefribrdne
SR Lumen
Figure 1.3 Diagram of the molecular structure of the SR RyR/Ca^^ release channel. (1.
malignant hyperthermia mutations; 2. phosphorylation site; 3. potential calmodulin
binding sites; 4. potential nucleotide binding sites; 5. Ca^^ activation site) (Modified
from Hermann-Frank etal, 1999).

10
phosphorylation sites (Melzer, 1995). It is these large N-terminal domains that are
responsible for the 'feet' projecfions mto the triadic gap region that are visible in
electron micrographs. In mammalian skeletal muscle every second RyR homotetramer
in the SR membrane faces a DHPR tetrad on the apposite t-tubule membrane (Figure
1.4A). hi negafive stained samples the RyR has been shown to have a four leaf clover
like (quarter foil) appearance which is likely due to four identical radial 'sub'
channels branching from a central common channel (Melzer, 1995). Upon
stimulation, it is thought that Ca^^ diffuses through the main centre channel and then
out the side of the protein complex via the four radial channels (Fill & Copello, 2002).
RyR isoforms and splice variants
In mammals there are three genetically distinct RyR isoforms: RyRl, RyR2 and
RyR3. Each of these three mammalian isoforms show a high degree of sequence
homology sharing 66-70% amino acid sequence identity (Rossi & Sorrentino, 2002).
RyRl is the primary isoform found in skeletal muscle, RyR2 is the main isoform
found in cardiac muscle (and to a lesser extent in the brain), while the RyR3 isoform
was first found in the brain but appears to be present in very small amounts in skeletal
muscle (for reviews see Sutko & Airey, 1996 and Murayama & Ogawa, 2002).
Although the RyR3 represents only a few percent of total RyR in aduh diaphragm and
close to nil in other mature skeletal muscles, it is more abundant in the late embryonic
and early neonatal developmental periods. Alternative splice variants for each of the
three mammalian RyR isoforms have been identified at the mRNA level (Zorato et ai,
1994 8c Futatsugi etal, 1995). To date, no direct evidence exists to verify any
functional differences between the protein products of these mRNA species (Rossi &
11
B t-tubule membrane
4-DHPR tetrad \
t-tubule
SR meinbranc
RyR
\ Calsequestrin
FKBP12
Myoplasm Triadin SR
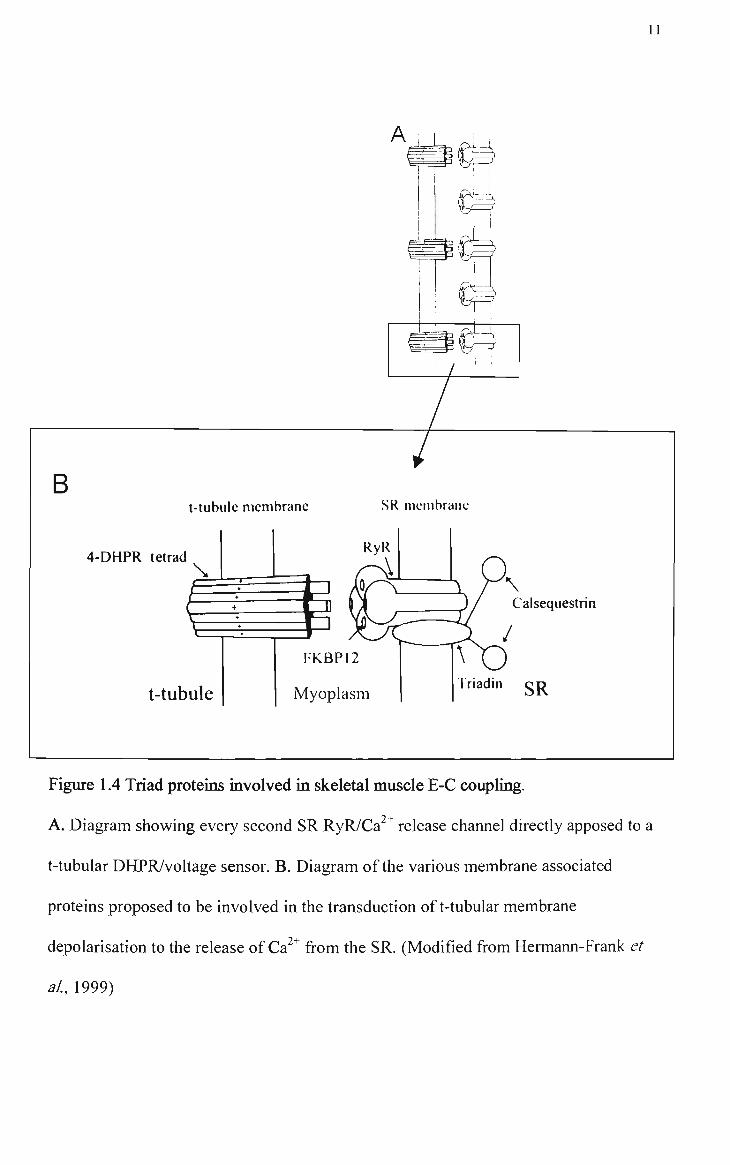
Figure 1.4 Triad proteins involved in skeletal muscle E-C coupling.
A. Diagram showing every second SR RyR/Ca^^ release channel directly apposed to a
t-tubular DHPR/voltage sensor. B. Diagram of the various membrane associated
proteins proposed to be involved in the transduction oft-tubular membrane
depolarisation to the release of Ca" " from the SR. (Modified from Hermann-Frank et
al, 1999)

Sorrentino, 2002). However, some of the predicted amino acid variations occur in
regions containing putative binding sites for ATP, calmodulin, Ca'^ and sites for
phosphorylation, which suggests the potential for differences in function and
regulation (Sutko & Airey, 1996).
Putative endogenous regulators of the skeletal muscle RyRl isoform
The RyRl/Ca release channel is primarily affected by four endogenous regulators;
Ca^ , Mg^^, ATP and calmodulin.
Ca and Mg ions
Myoplasmic Ca " has the potential to regulate the RyRl/Ca^^ release channel in a
biphasic manner. Ca^^ activates the RyRl by binding to a high affinity activation site
(KD - l^M; see Figure 1.5) causing a Ca^^-induced Ca^^ release (CICR) effect (Lamb,
1993). However, at physiological levels of free Mg^^ (~lmM) this Ca^^ activation
effect is significantly prevented as Mg^^ competes with Ca^ , albeit with a much lower
94-
affinity, for the same binding site (Meissner et al., 1986). ft is thought that Ca binds
also to a low affinity inhibitory site (KD - 0. ImM) on the Ca^^ release channel (see
Figure 1.5). Mg^^ also competes with Ca^^ as both Ca^^ and Mg^^ bind with a similar
affinity to this relatively non-specific divalent cation site (Lamb, 1993). Under
physiological conditions where the myoplasmic free [Mg^*] (- 1 mM) is much higher
than the resting [Ca^^] (~ 0.1 iM), this site would be almost fully saturated by Mg^
and thus unavailable for Ca^^ binding and activation. As such. Lamb (1993) has
proposed that this site should be referred to as a Mg^^-inhibitory site rather than a
Ca^^-inhibitory site. Therefore in a resting muscle fibre the Ca^^ release channels
remain closed due to the potent inhibitory action of Mg^* at this inactivation site.
2+
13
t-tubule
/Activation
k a = 1 pmot/L
^ D H P R ; • • . T" A , i %. -," w a- ' .
. . . . . . . . . . . . . . . . . J .
Inhibition
Ki =0.1mmcl/C
Myoplasm •r'« ' • ' • - • - • " • • T T ' *> '
SR
1 r
t
ATP RYRl
/ ^
Ca 2+
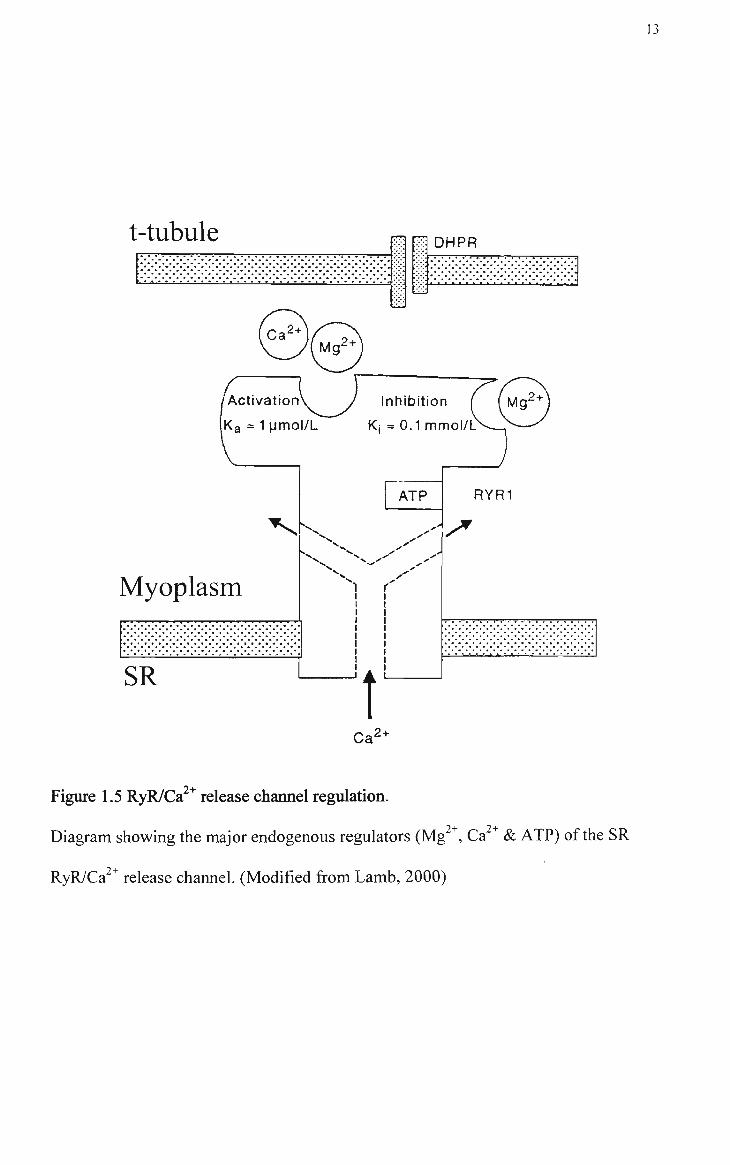
Figure 1.5 RyR/Ca^^ release channel regulation.
Diagram showing the major endogenous regulators (Mg , Ca & ATP) of the SR
RyR/Ca^^ release channel. (Modified from Lamb, 2000)

14
(Figure1.5). It has been proposed that upon depolarization, the T-system
DHPR/voltage sensor lowers the affinity of the Mg^^ inhibitory she causing Mg^^to
dissociate and allowing Ca ^ release. The released Ca^^ displaces Mg^^ from the Ca"^
activation site giving maximum open probability of the RyR (Melzer, 1995 and Lamb,
2002b).
ATP
ATP is present in the muscle cell at a concentration of between 6 - 8 mM. Studies
utilizing single release channels, SR vesicles and skinned fibres have shown that ATP
94-
in the millimolar range stimulates Ca release from the RyR (Lamb, 2002b). ATP
binds to a stimulatory site on the release channel (KD - 1 mM) (see Figure 1.5) and its
stimulatory effect does not involve ATP hydrolysis or protein phosphorylation (Lamb,
2002b).
Calmodulin
Calmodulin (CaM) is a ubiquitously expressed 17 kDa protein made up of a single
148 amino acid polypeptide and contaming four E-F hand motifs capable of binding
Ca^^ (Tang etal, 2002). CaM can bind to proteins m both a Ca^^-dependent and
Ca^^-mdependent manner. In the case of the RyRl/ Ca " release channel, the biphasic
dependence of release channel activity on Ca^^ is aftered by CaM binding in such a
way that activation and inhibition take place at lower Ca^^ concentrations (Hamifton
etal, 2000). The Ca^^ free form of CaM (apoCaM) activates while the Ca^^-CaM
complex mhibits release channel activity (Rodney etal, 2000). The exact role played
by CaM in E-C coupling in vivo is at this stage unclear, but may involve protection of
the RyR from various forms of oxidation at critical sites (Tang etal, 2002).

15
Other triadic proteins
FKBP12
The FK binding protein 12 (FKBP12) is a small protem (12 kDa) bound to each RyR
subunit with one homotetramer RyR containing four FKBPs (see Figure 1.4). The
number 12 is related to the particular isoform found m skeletal muscle. The FKBP12
is known to dissociate from the RyR is the presence of the immunosuppressant drugs
FK-506 or rapamycin. Data on the function of this protein are at this stage conflicting.
Many studies have found that when the FKBP12 is dissociated from isolated single
RyR channels the channels are activated (Fill & Copello, 2002). However in the
skinned fibre preparation where the RyR is under control of the DHPR, dissociation
94-
of the FKBP12 results in reduced Ca release as it effectively uncouples the release
channel from the voltage sensor (Lamb & Stephenson, 1996).
Triadin
Triadin is a 95 kDa intrinsic membrane glycoprotein located predominantly in the
junctional SR. (Corconado etal, 1994). It contains a single transmembrane domain
with a relatively short myoplasmic N-terminal and a long luminal C-terminal. The C-
terminal end has the ability to interact with calsequestrin while both the N-terminal
and C-terminal ends have been proposed as candidates to interact with the RyR
(Figure 1.4) (Franzini-Armstrong & Protasi, 1997). The exact function of triadin
remains unclear but two proposals are that it provides a Imk between the RyR and
calsequestrin or between the RyR and DHPR (Coronado etal, 1994 and Franzini-
Armstrong & Protasi, 1997).

16
Junctin
Junctin is a 26 kDa calsequestrin binding protein that is proposed to provide an anchor
for calsequestrin to the junctional SR membrane (Franzini-Armstrong & Protasi,
1997).
SR C^^ATPase/SR C^^pump
94-
The Ca pump/ATPase, predominantly located in the longitudinal SR, is a 100 -110
kDa protein with ten membrane spanning a helices, three myoplasmic globular
shaped domains and small luminal side loops (Lee, 2002). The myoplasmic portion of
the pump contains an enzymatic binding site for one Mg-ATP molecule and two high
affinity (KD~0.3 |LIM), high specificity binding sites for Ca^^ (Gillis, 1985). The
process of Ca "^transport involves the hydrolysis of ATP and Ca^^ translocation
through the SR membrane. During translocation, the ATPase undergoes a dramatic 94-
loss of affinity for Ca enabling it to be discharged on the luminal side of the SR 9-f-
membrane (Gillis, 1985). The Ca pump is capable of lowering the myoplasmic free 94- S 94-
Ca concentration to - 10" M and generating a 1000 fold transmembrane Ca 94-
gradient. Once Ca has entered the SR lumen much of it will be sequestered by
calsequestrin to keep free Ca^^ low and prevent feedback inhibition of pump activity
(Gilhs, 1985).
Two genes, known as SERCAl and SERCA2 encode the Ca^^ ATPase proteins for
skeletal muscle. SERCAl produces two splice variants; (i) SERCAl a found in adult
fast twitch skeletal muscle and (ii) SERCAlb found in neonatal skeletal. The
SERCA2 produces one isoform (SERCA2a) expressed predominantly in aduh slow

17
twitch, cardiac and neonatal skeletal muscle (Martonosi, 1994) (see Table 1.1, page
29).
In skeletal slow twitch and cardiac muscle, Ca "" pump activity is enhanced by the
presence of a pentameric, 22 - 25 kDa protein known as phospholamban.
Phospholamban is phosphorylated by either cAMP-dependent, calmodulin-dependent
or phospholipid-dependent protein kinases (Dux, 1993). Once phosphorylated,
phospholamban dissociates from the ATPase causing an increase in Ca^^ affinity and
94-
a two-fold increase in Ca transport. Although detected in many mammalian species,
phopholamban has not been detected in rat slow twitch skeletal muscle (Damiani et
al., 1999).
The contractile apparatus
Thin filament structure at rest
Actin filaments are predominantly polymers of the globular protein called G-actin, but
also contain four regulatory proteins. Tropomyosin (Tm), TnC, Troponin T (TnT) and
Troponin 1 (Tnl). G-actin polymerizes to form a double helical strand known as F-
actin (Craig, 1994). The regulatory protein Tm (MW - 35 kDa) is a 2 chain a-helix
that extends over every seven G-actin molecules and is located in the groove between
the two F-actin helical strands (see Figure. 1.6) (Craig, 1994).
To each Tm is bound one troponin (Tn) complex (see Figure. 1.6). The Tn complex
comprises three subunits; TnC (MW - 18 kDa), Tnl (MW-21 kDa) and TnT
(MW-30 kDa) (Bagshaw, 1993). TnC interacts with Tnl and TnT and binds Ca'^
causing a signal to be transmitted to the thin filament. TnC is dumbbell shaped with

18
A c t i n 36.5 nm Tropomyosin Troponin
Figure 1.6. The ultrastructure of the thin filament in vertebrate skeletal muscle. The
actin filament in made up of G-actin monomers and the associated troponin (Tn)
complex and tropomyosin (Tm). (Reproduced from Luttgau & Stephenson, 1986)

19
two divalent metal binding sites formed by helix-loop-helix EF hand motifs at each
end (Squire & Morris, 1998). According to the current dogma, the two bmding sites
(sites I & II) located at the N-terminal which bind Ca " with a low affinity, are
responsible for signal transmission (Squire & Morris, 1998) and therefore are referred
to as regulatory sites. The other two binding sites (III & IV) at the C-terminal end can
94- 94-
bind both Ca and Mg , however under physiological conditions (i.e. 1 mM free 94- 94-
Mg ) these sites are most likely occupied by Mg (Szczesna & Potter, 2002). Tnl
interacts with both TnC and TnT and when bound to actin is able to inhibit actin-
myosin interaction (Craig, 1994). TnT interacts with both troponins 1 and C and with
Tm (Bagshaw, 1993). Its exact role is unclear but what is known is that Tn-T is
involved in attaching the Tn complex to Tm (Squire & Morris, 1998).
Thin filament activation and muscle contraction
At resting levels of cytoplasmic Ca^ , Tm effectively blocks the attachment of myosin
cross bridges to actin and hence the production of force. When Ca"^ levels rise due to
the release of Ca ^ from the SR, Ca " binds to TnC which strengthens the binding of
TnC to Tnl and breaks the interaction between Tnl and actin (Gordon et ai, 2000 &
2001). The detachment of Tnl from actin allows Tm to move over the surface of the
thin filament, in a back and forth motion, causing a large increase in the average
number of weak binding sites for the myosin SI head and a smaller increase in the
average strong myosin binding sites (Gordon etal, 2000 & 2001). As myosin cross
bridges attach to the strong binding sites on actin, Tm is stabilized in such a position
that strong myosin binding sites are on average exposed for a longer duration allowing
even more myosin cross bridges to strongly attach (Gordon etal, 2000 & 2001).

20
94-
Thus, Ca and strongly bound cross bridges act co-operatively to activate the thin
filament and allow the production of force.
Thick f lament structure
The thick filament is made up mostly of myosm hexamers that consist of two MHCs
(MW~220 kDa) and four myosin light chains (MLC; MW-16 - 30 kDa). The two
myosin heavy chains coil in a helical manner similar to two intertwined golf clubs
(see Figure 1.7).
The MHC is an a-helix with most of the C-terminal half comprising a long tail and
the N-terminal half folding into a globular head (Craig, 1994). Studies using
controlled enzymatic digestion have produced two fragments known as light
meromyosin (LMM), which makes up most of the tail, and heavy meromyosin
(HMM) which makes up the globular head and the remainder of the tail (Figure. 1.7)
(Craig, 1994). The HMM portion is able to bind to actin and hydrolyze ATP.
Alternative enzymatic digestion ofMHC produces a rod fragment that makes up the
whole tail and a sub fragment 1 (SI) that retains the ability to bind actin and to
hydrolyze ATP. The rod portion can be further digested to produce LMM and an S2
sub fragment (Craig, 1994). Each SI head also has attached two MLCs. MLCs are
divided into two distinct classes known as essential or alkali and regulatory or
phosphorylatable (Talmadge etal, 1993).
Isoforms of the contractile and regulatory proteins of the thin and thick flaments
With the exception of actin, all the proteins associated with the contractile apparatus
described thus far (TnC, Tnl, TnT, Tm, MLC and MHC) exist as different isoforms.

21
Figure 1.7 Myosin heavy chain. Diagram of two myosin heavy chains coiled together
in a helical manner and the different sub fragments produced by the use of selective
enzymatic digestion. (Reproduced from Craig, 1994). Boxed areas highlight proposed
regions of amino acid sequence divergence that account for different MHC isoforms;
(1) the a-helical neck region, (2) the hinge region between the LMM and S2 sub
fragment and (3) the C-terminal (Schiaffino & Reggiani, 1996).
1~)
which are the products of either multiple genes or alternative splicing of a single
mRNA transcript A detailed description of the protein isoforms associated with the
thin filament (TnC, Tnl, TnT & Tm) or the MLC isoforms of the thick filament is
beyond the scope of this literature review and beyond the purpose of this thesis.
Comprehensive reviews regarding the expression and function of these protems have
previously been published by Pette & Staron, (1990), Moss et al. (1995) and
Schiaffino & Reggiani (1996). Isoforms of the thick filament myosin heavy chain
will however be reviewed in the next section.
Myosin heavy chain isoforms
Based on protein and mRNA analyses, mammalian extrafusal skeletal muscle contains
eleven MHC isoforms encoded by multigene families (Weiss & Leinwand, 1996;
Pette & Staron, 2000). Some MHC isoforms are expressed at different stages of
muscle development, while in adult skeletal muscle some MHC isoforms are either
expressed in a muscle specific manner or are distributed widely through out the
musculature (Pette & Staron, 2000). The amino acid sequences of these MHC
isoforms are highly homologous with the main regions of sequence divergence
occurring at the C-terminal, the hinge region between the LMM and S2 subfragment
and the a-helical neck region (Figure. 1.7) (Schiaffmo & Reggiani, 1996). Note that
the nomenclature used in this thesis for MHC isoform and fibre type is that of Pette &
Staron (1997 & 2000) who use a Roman numeral and a lower case letter (e.g. lla
isoform) to identify the MHC isoform, and a Roman numeral and capital letter (e.g.
IIA fibre) to indentify muscle fibre type

23
The mammalian MHC isoforms include:
• An embryonic (MHCemb) and neonatal (MHCneo) MHC isoform found in
embryonic and early postnatal developing muscle, respectively. These isoforms
are also found in aduh extraocular and jaw muscles, and in muscle regenerating
after some form of injury or damage.
• One slow-tonic MHC isoform (MHCIton) found in extraocular, laryngeal and inner
ear muscle.
• Three slow-twitch MHC isoforms (MHCIa, MHCla and MHClp). The MHCIa
isoform is found in muscles such as plantaris, soleus and in fibres transforming
from slow- to fast phenotype (Galler etal, 1997). The MHCIa isoform is found in
the diaphragm, extraocular and jaw muscles and also in fibres transforming from
slow- to fast phenotype. The MHCip isoform is found in type I fibres and in IC
and l ie hybrid fibres.
• Two super-fast MHC isoforms (MHCeom and MHClIm). The MHCeom isoform is
found in extraocular and laryngeal muscles while the MHClIm isoform is found in
masticatory muscles.
• Three adult fast-twitch MHC isoforms (MHCIla, MHCIld and MHCIIb). These
MHC isoforms are found throughout the aduh musculature (Pette & Staron, 1997
& 2000).
C^'^ uptake by the SR calcium A TPase/Pump
As already stated at the begmnmg of this hitroduction, relaxation of a muscle occurs
following the deactivation of the DHPR/voltage receptors, closure of the RyR/Ca ^
release channels and the dissociation of Ca^^ from TnC on the contractile apparatus.
The myoplasmic Ca ^ is buffered by Ca^^ binding protein parvalbumin and is also

24
actively pumped back into the SR lumen by the SR/ER Ca^^ ATPase (SERCA) or
Ca^^ pump.
Signal transduction between the DHPR and the RyR
Three main hypotheses have been proposed to explain the mechanism of signal
transduction from the t-tubule vohage sensors to the SR Ca "" release channels.
Protein-protein interaction
The discovery by Schneider & Chandler (1973) of the intramembrane charge
movement occuring within the T-system upon depolarization led to the hypothesis
that there is a protein-protein interaction between the DHPR/voltage sensor and the
94-
RyR/Ca release channel. According to this model, the t-tubule voltage sensor is
attached to a mechanical plunger-like structure such that at rest the plunger blocks the 94-
release channel opening and inhibits Ca release (Chandler etal, 1976). The t-tubule
depolarization, which is detected by the voltage sensor (now known to be the
positively charged S4 membrane spanning segment of the DHPR; see
Dihydropyridine receptor/voltage sensor section, page 5), induces a conformational
change in the plunger causing the RyR release channel pore to be unblocked thereby
allowing Ca^^ to difftise out (Csemoch, 1999).
Evidence suggesting a protein-protein interaction or conformational coupling
(Dulhunty & Pouliquin, 2003) comes from morphological studies using electron
microscopy. These studies showed evidence of ordered arrangement and close
proximity of the electron dense 'feet' structures and the t-tubule DHPR tetrads
thereby indicating a possible interaction between these two proteins (see Figure 1.1)
(Franzini-Armstrong, 1970). Recently, it has been proposed that the 11-111 myoplasmic

->s
loop between the 2"'* and 3" repeats of the DHPRais subunit (see Figure 1.2) may
directiy interact with the RyR conferring skeletal muscle type E-C coupling. More
specifically, the region of the DHPR ll-III loop containmg amino acid residues 724-
760 and amino acid residues 1635-2635 on the RyRl are being investigated as
potential regions of interaction between the two proteins (for reviews see Mackrill,
1999; Dulhunty et al., 2002; Dulhunty & Pouliquin, 2003). Due to the large size of
both the DHPR and RyR it is quite possible that there is more than one region of
interaction between these proteins (Dulhunty & Pouliquin, 2003).
It appears that as well as the traditional communication from the DHPR to the RyR,
known as orthograde coupling, the RyR can strongly influence the activity of the
DHPR in a retrograde coupling action (for review see Dirksen, 2002). In this case,
muscle cells expressing normal amounts of DHPR, but lacking skeletal RyRl,
displayed a very small slow Ca^^ current through the L-type Ca " channel upon
depolarization. When the RyRl protein is expressed after mjection of RyR cDNA into
94-
these cells, normal Ca current is restored.
IPj mediated coupling
IP3 or inositol trisphosphate, the product of the membrane phospholipid
phosphatidylmositol 4,5-bisphosphate (PIP2) hydrolysis by phospholipase C, has been
considered as a candidate for transmitting the depolarization signal from the DHPR to
the RyR due to its established role in Ca ^ release in smooth muscle and other non-
muscle cells (Schneider, 1994). The idea was that IP3 would be released from the t-
tubular membrane following voltage dependent activation of phospholipase C and
subsequently activate the RyR/Ca^^ release channel (Schneider, 1994). There is now

however reasonable evidence to suggest that IP3 would play a very minor role, if any.
in the skeletal muscle signal transduction process. Thus, Walker et al. (1987)
demonstrated that the photolytic liberation of IP3 caused a very slow SR Ca^^ release,
far too slow to be the main release activator. Also, Harmon etal. (1992) showed that
there was no contractile activation when IP3 was microinjected into fully polarized
intact fibres. These later authors found only a small effect in fibres that were already
partially depolarized. Evidence that these small responses were abolished in fully
depolarized fibres or in nefidipine (blocker of the DHPR) treated fibres indicates that
IP3 has a minor effect on the t-tubule membrane which is then transmitted to the
DHPR and subsequentiy to the RyR (Hannon et ai, 1992).
C^^ mediated coupling
Early work with skinned fibres showing that a rise in the intracellular [Ca ] induces
SR Ca " release, led to the proposal that in skeletal muscle SR Ca ^ release may be
triggered by the process of Ca " -induced Ca ^ release (CICR) similar to cardiac
muscle (Endo, 1977). More recent work however has shown that the influx of
extracellular Ca^^ through the DHPR L-type Ca^^ channel following a depolarizing
24-
stimulus is too small and too slow to be responsible for the fast activation of SR Ca
release (Brum etal, 1987). Furthermore, when external Ca^^ is removed or blocked
from entering the cell, fibres retain their ability to contract. Taken together, these data
rule out a cardiac style CICR as the major mechanism for inducing Ca^^ release in
skeletal muscle (Csemoch, 1999).
ft is worth considering that CICR could still play a secondary role in SR Ca'^ release,
where Ca^^ released from RyRs directly apposed to DHPR/voltage sensor tetrads

27
activate neighboring RyRs not linked with a DHPR (see Figure 1.4A) causing a
regenerative release of Ca^^ (for review see Melzer, 1995). Experiments where high
concentrations (millimolar range) of strong Ca^^ buffers such as BAPTA or Fura 2
were injected into fibres have shown that when the voltage sensor mediated increase
in intracellular Ca^^ was reduced to less than 0.1 iM the SR Ca^^ release was
attenuated (Jacquemond etal, 1991). This would suggest that the voltage sensor
94-
controlled SR Ca release is responsible for further CICR, possibly through the RyR
release channels not facing a DHPR/vohage sensor, and has led to the proposal of
dual control {Cd^^-xndGpQndQnX and Ca^^-dependent) of SR Ca^^ release. To date much
of this evidence has been obtained using amphibian muscle. The extent of the role (if
any) of CICR in mammalian muscle, under physiological conditions, remains to be
determined (Csemoch, 1999).
Skeletal muscle fibre diversity
Skeletal muscle is a heterogeneous tissue consisting of fibres that differ in their
physiological, biochemical and morphological properties. Diversity among muscle
fibres is due to 'qualitative and quantitative mechanisms' of gene regulation
(Bottinelli & Reggiani, 2000; Bortolotto & Reggiani, 2002). The 'qualitative
mechanism' of gene regulation refers to the presence of many similar but not identical
muscle proteins known as isoforms. These isoforms may have different functional
properties and therefore modify the functional phenotype of a muscle fibre. Isoforms
can be derived from multiple gene families or from the same gene through alternative
splicing. The 'quantitative mechanism' of gene regulation refers to the extent of
expression of the same gene. This means that one gene within a given muscle fibre
may be expressed more or less than another or that a specific gene in one muscle fibre

28
may be expressed more or less than the same gene in another fibre (Bottinelli &
Reggiani, 2000; Bortolotto & Reggiani, 2002). This could result in a greater amount
or density of specific proteins (e.g. DHPR or glycolytic enzymes) and/or a greater
amount or relative volume of an internal membrane network (i.e. T-system or SR).
Table l.l lists some of the reported differences between fast-twitch and slow-twitch
muscles/muscle fibres from adult mammalian muscle with respect to cellular
stmctures and molecular species involved in the transduction of the T-system
94-
depolarization signal to SR Ca release (for reviews see Lamb, 1992, Ruegg 1992,
Stephenson et al., 1998). To date, no studies have attempted to examine if any
differences in E-C coupling characteristics exist between single fibres that have been
typed as either fast or slow twitch. This issue is specifically examined in Chapter 4 of
this thesis.
Methods of classifying muscle fibre types
As long ago as 1678, skeletal muscles had been observed to have differing degrees of
red coloration and as such were classified as red and white muscles (Loughlin, 1993).
Some two hundred years later Ranvier (1873) demonstrated that 'red' muscles
contracted and relaxed more slowly than 'white' muscles. Over the last fifty years
more sophisticated techniques have been developed to differentiate individual muscle
fibres with respect to: (i) twhch contractile properties of a fibre subjected to electrical
stimulation or maximal Ca^^ activation (Close, 1972); (ii) the senshivity to strontium
(Sr^^) of the contractile apparatus (Fink etal, 1986); (iii) the lability of the
myofibrillar ATPase enzyme to incubation m solutions of different pH (Brooke &
Kaiser, 1970); (iv) glycolytic or oxidative metabolic enzyme activity determined

Ji
I U
I W
>
.1 Vi
'o u
3 u u
I
en
.a CO
i I u
I
u s
s
I CO
992
bO 00 0)
^-, • ^
C5
an S
T (1
j 3
7) h
ighe
r 0.
2
— H fa
992
jS 5=1
ST
Lai
_c S
->
nt i
n FT
er
am
ou
Si op
IS X
1 ( N
O o o ( N
ing
et a
l
B B ii o fa
H 00
_G
B o Vi
(/J
H fa c
CO
a
992
00 00 (U
5)
Ru
--; rn H C/)
than
in
OS
T(4
.5
fa
j :3 00
IS
992
00 00 D
6)
Ru
OS
o H C/}
than
in
rT
T(1
.6
fa
k H
- C op
s
'., 19
91
GT)
Tth
an
fa
k 4
)-; op
IS
^ OS OS
^^ .-
c o
Step
hen;
kn
<u Fr
y
C/5
_c
;r in
FT
tha
n lo
we
OS OS
^ .c -• (U
& M
arg
'S
Dai
H c/) _c en
isof
orm
<N
nF
T,
i
•for
o en
— <
t ^
OS
Vi 00 hn
Bri
j in
ST
T
than
fa
k.1
-C op
X
si, 1
994
ono:
t : C3
H C/3
_c X )
ER
CA
2
oo
in F
T,
03
<
cii; w C/3
(U
s
volu
(11
(% f
ibr(
S ii
H
P.:
Q
B k.1
isof
o
, .
subu
nil
a c S Q
B
• vol
u
ii
(% f
ibr
fti 00
15 o
H
vol
fibr
e 1
SR {
%
03 C
_o
June
C/3
T3
0^
ai
1 1
+ CM
13 .B 'B _3 5 X/1
orm
s
^ H
o en
U 3 O"
ais
u
dens
it
< U fti w t/)
isof
on
< U Pi fal on
o
o
on
o
to
fa
fa

30
histochemically (Barnard etal, 1971; Peter etal, 1972) and (v) the myosin heavy
chain (MHC) isoform expression as determined by sodium dodecyl sulfate-
polyacrylamide gel electrophoresis (SDS-PAGE) or immunohistochemistry (Pette &
Staron, 1997).
To date three major groups of muscle fibres have been identified. Type I fibres
typically rely heavily on oxidative metabolism, have slow contraction and relaxation
times, and contain type I MHC (MHC I) isoforms. Type IIB fibres rely predominantly
on glycolytic metabolism, have fast contraction and relaxation times, and contain type
lib MHC (MHC lib) isoform. Type IIA fibres are generally intermediate with respect
to oxidative and glycolytic metabolism, have fast contraction times but contain type
Ila MHC (MHC Ila) isoform (for review see Pette 8L Staron, 1990 & 1997). A fourth
MHC isoform (type Ilx/IId) subsequently identified in rat skeletal by Bar and Pette
(1988) and later confirmed by other groups (Schiaffino et al, 1989; Gorza, 1990) has
been confirmed to have properties intermediate to the lla and lib MHC isoforms (for
review see Schiaffino & Reggiani, 1994). In adult skeletal muscle the MHC isoform
composition of muscle fibres is not always exclusively homogeneous. Instead there
seems to be a muscle-specific percentage of fibres that contain a mixture ofMHC
isoforms (Talmadge, 2000; Stephenson, 2001). Fibres containing different proportions
of the different MHC isoforms are knovm as hybrid fibres while fibres containing
only one MHC isoform are called pure fibres (for review see Stephenson, 2001).
Because of the central role played by MHC m muscle contractile performance (being
the protein associated with myosin-ATPase activity and the crossbridge responsible
for the production of force and muscle shortening; Bagshaw, 1993; see also Thin

31
filament activation and muscle contraction, page 19) and due to their relative
abundance (accounting for - 50 % of total myofibrillar protein; Pearson & Young,
1989), MHC isoform expression (as detected by high resolution polyacrylamide gel
electrophoresis or by immunohistochemistry) has become the method of choice for
classifying skeletal muscle fibre types into distinct functional groups (Bottinelli etal,
1996; Moss etal, 1995; Stephenson, 2001).
Immunahistochemical determination of MHC isoforms
Immunohistochemistry involves the use of a specific antigen-antibody reaction to
identify a required tissue constituent in ^//z/(Loughlin, 1993). More specifically,
transverse serial (or longitudinal) sections of muscle fibres are exposed to a certain
MHC antibody tagged with a microscopically visible label. The advantage of the
immunohistochemical technique is that it allows the investigator to identify the
location of specific MHC isoforms along the width and/or length of the muscle fibre
(Schiaffino & Salviati, 1997). The disadvantage of this technique is that because
MHC composition has been shown to vary along the length of a muscle fibre (e.g.
Edman et al, 1988) several serial transverse sections need to be taken to identify
whether a particular fibre is a pure or hybrid fibre. This technique also, does not allow
accurate quantitation of the relative proportions ofMHC isoforms in hybrids muscle
fibres (Stephenson, 2001).
Determination of MHC isoforms using SDS-PAGE
Sodium dodecyl sulphate polyacrylamide gel electrophoresis or SDS-PAGE allows
the investigator to quantify the relative proportion ofMHC isoforms in a given muscle
sample. Analysis ofMHC isoforms can be performed using whole muscle

homogenates, cmde myosin extracts, purified myosin and single muscle fibre
segments. Carraro & Catani (1983), using a slightly modified version of Laemmli's
(1970) protocol, were the first to utilize this technique to separate skeletal muscle
MHC isoforms. SDS-PAGE allows the separation of the MHC isoforms based on
minor molecular weight differences that translate into differing migration distances of
each MHC isoform protein band on the gel. These MHC bands can be visualized by
staining the protein with either a silver or Coommassie blue stain. Confirmation of
each protein band's identity can be achieved with westem blotting and specific
antibodies and/or by running a standard MHC marker of known MHC isoform
composition. The most important advantage of this technique is that the relative
proportion ofMHC isoforms co-expressed in hybrid fibres can be accurately
quantified (Pette et al, 1999). SDS PAGE was utilized in the study described in
Chapter 4 of this thesis in which the relationship between E-C coupling characteristics
and MHC isoform composition was investigated.
Aspects of postnatal development of rat skeletal muscle relevant to the E-C-R cycle
Rat development is characterized by a 22 day embryonic period (UNSW Embryology
website) followed by a postnatal life span of between 2 -3 years dependmg on the
specific strain (Weihe, 1987). Full weaning occurs at around 6 -7 wks while sexual
maturity is reportedly reached by age 6-10 wks (Weihe, 1987). A survey of the
literature to date reveals that there is a general lack of concensus regarding the age
range of the 'aduh' rat. For example, SR/t-tubule triads appear to reach'aduh' status at
1.5 to 2 wks while muscle fibre diameter reaches 'aduh' dimensions by 27 wks.
Growth of whole muscle and individual fibres
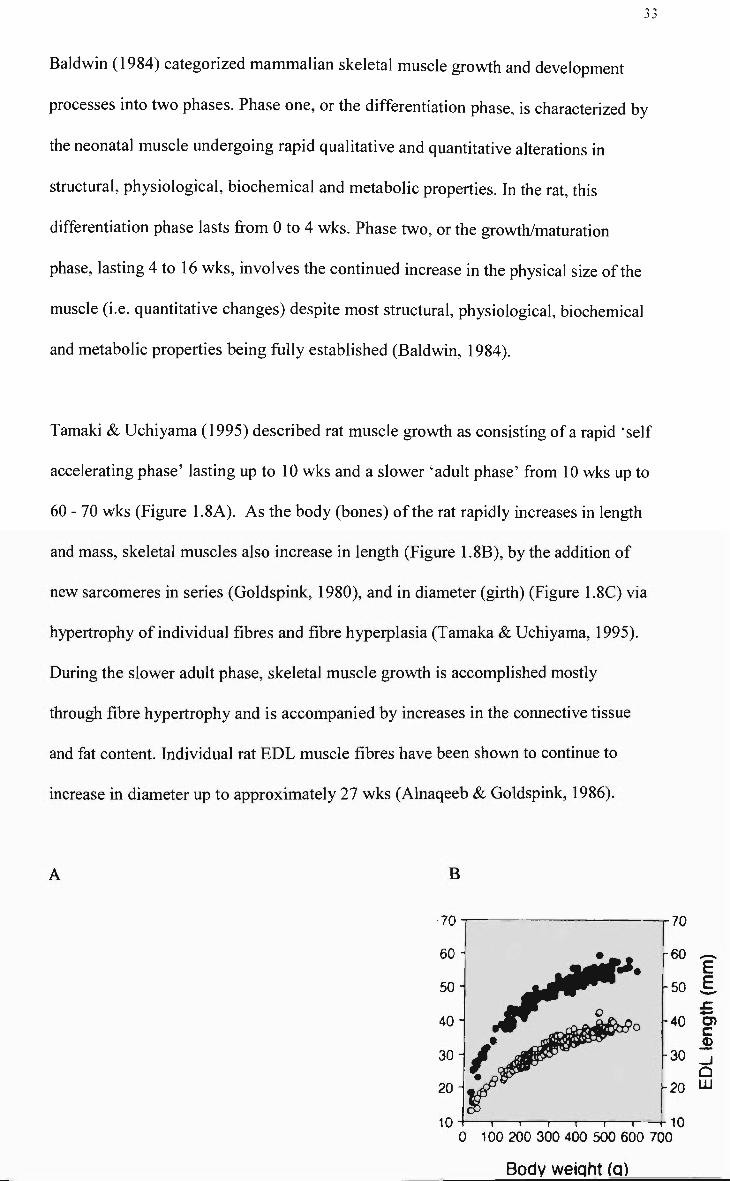
J J
Baldwin (1984) categorized mammalian skeletal muscle growth and development
processes into two phases. Phase one, or the differentiation phase, is characterized by
the neonatal muscle undergoing rapid qualhative and quantitative aherations in
stmctural, physiological, biochemical and metabolic properties. In the rat, this
differentiation phase lasts from 0 to 4 wks. Phase two, or the growth/maturation
phase, lasting 4 to 16 wks, involves the continued increase in the physical size of the
muscle (i.e. quantitative changes) despite most structural, physiological, biochemical
and metabolic properties being fully established (Baldwin, 1984).
Tamaki & Uchiyama (1995) described rat muscle growth as consisting of a rapid 'self
accelerating phase' lasting up to 10 wks and a slower 'adult phase' from 10 wks up to
60 - 70 wks (Figure 1.8A). As the body (bones) of the rat rapidly increases in length
and mass, skeletal muscles also increase in length (Figure 1.8B), by the addition of
new sarcomeres in series (Goldspink, 1980), and in diameter (girth) (Figure 1.8C) via
hypertrophy of individual fibres and fibre hyperplasia (Tamaka & Uchiyama, 1995).
During the slower adult phase, skeletal muscle growth is accomplished mostly
through fibre hypertrophy and is accompanied by increases in the connective tissue
and fat content. Individual rat EDL muscle fibres have been shown to continue to
increase in diameter up to approximately 27 wks (Alnaqeeb & Goldspink, 1986).
B
0 100 200 300 400 500 600 700
Body weight (q)
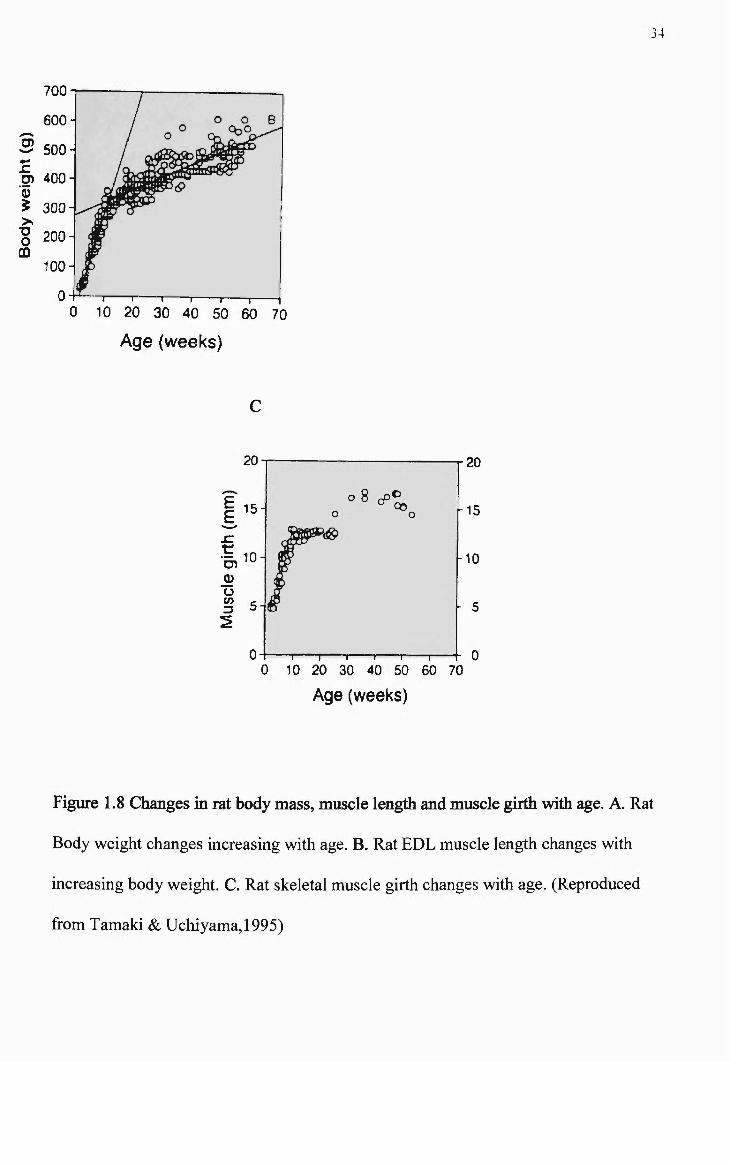
34
cn
> •o o
700-
600-
500-
400-
300-
200-
100-
0-
/ 0 / °
PK^
1 1 1 r-
0 0
t - r -
B
10 20 30 40 50 60 70
Age (weeks)
-1 ; 1 r 1 r 0 10 20 30 40 50 60 70
Age (weeks)
Figure 1.8 Changes in rat body mass, muscle length and muscle girth with age. A. Rat
Body weight changes increasing with age. B. Rat EDL muscle length changes with
increasing body weight. C. Rat skeletal muscle girth changes with age. (Reproduced
from Tamaki & Uchiyama, 1995)

35
T-system andSR
At birth the SR in rat skeletal muscle is discontinuous around individual myofibrils at
the level of the A band/I band junction (Schiaffino & Margreth, 1969). Triadic regions
of SR and t-tubule are present at birth and when viewed by electron microscopy
appear to be the same as those found in adult muscle, but are fewer in number and
oriented longitudinally or obliquely instead of transversely (Schiaffino & Margreth,
1969; Edge, 1970). By 1.5 to 2 wks, triads achieve a transverse orientation typical of
'adult' rat skeletal muscle (Edge, 1970). The tubular-system of neonatal rat EDL
muscle, when viewed under an electron microscope, displays extensive longitudinal
tubules between all myofibrils and short transverse sections at the A and 1 band level
that do not extend across consecutive parallel myofibrils (Kelly, 1980). Beam &
Knudson (1988), using an indirect measure of relative T-system (linear
capacitance/fibre surface area ratio) showed that the T-system of the rat fast twitch
flexor digitorum brevis muscle continues to increase in area reaching adult levels by 5
to 6 wks of age.
DHPR/voltage sensors and RyR/calcium release channels
In terms of the two major protein complexes involved in E-C coupling, Kyselovic et
al (1994) reported a different time course of expression of the DHPR/vohage sensor
and RyR/Ca^^ release channel in rat skeletal muscle. Dihydropyridine binding was
shown to increase in a linear fashion from 1 week, reaching "adult" levels (5-6 wks)
by 3 wks postnatal. In contrast, ryanodine binding remained relatively low from birth
to 1-2 wks and then increased exponentially reaching aduh levels by 4 to 5 wks
(Kyselovic etal, 1994). It should be noted that ahhough very little research has been
done on rat muscle, developing skeletal muscle from other species (e.g. mouse) has

36
been shown to contain two RyR/Ca ^ release channel isoforms (RyR 1 8c RyR 3)
(Flucher etal, 1999). In mouse EDL, muscle RyR3 containing fibres account for 17
% of total at 2 wks, while there are no detectable RyR3 by 3.5 to 4 wks. The presence
94-
of two Ca release channel isoforms in the immature muscle and only one in the adult
muscle raises the possibility of differences in E-C coupling processes related to
developmental age.
The presence of RyR3 isoforms in the early postnatal period correlates with finding
that in the first two wks postnatal, E-C coupling in rat skeletal muscle relies on an
inward flow of extracellular Ca^^ through the DHPR/voltage sensor (Pereon etal,
1993). The increased expression of RyR/Ca^^ release channels after 2 wks coincides
with the reported changes in triad orientation from longitudinal to transverse
(Schiaffino & Margreth, 1969).
E-C coupling
The resting membrane potential (Em) of rat fast twitch skeletal muscle has been
shown to increase from - -27 mV at birth (Pereon et al, 1993), to - -5 ImV by one
week (Conte Camerino etal, 1989) and to - -68 mV by 3 to 4 wks (Hazlewood &
Nichols, 1967; Conte Camerino etal, 1989). Conte Camerino etal (1989) reported
that in rat EDL, Em did not reach adult levels (- -75 mV) until 10 to 11 wks. ft is
worth noting that in this study no time points were examined between 4 and 10 wks,
making it difficult to ascertain the time when Em reaches its aduh level. Membrane
conductance of chloride ions has been shown to increase to "aduh" (10-11 wks)
levels by 4 wks postnatal (Conte Camerino etal, 1989). Similarly, the number of
active Na+/K-F pumps (as indicated by number of [ H] ouabain binding sites) was

37
reported to reach a peak value by approximately 4 wks postnatal in rat skeletal muscle
(Clausen, 2003).
The calculated voltage required for activation of the DHPR/voltage sensor, as
determined from potassium contracture experiments, is considerably less negative in
newborns (- -1.6 mV) than in aduh (12 wks) rat EDL muscle with aduh values (~ -19
mV) being reached by about 4 wks postnatal (Pereon etal, 1993). The development
of the membrane potential required for voltage sensor inactivation follows a slightly
different time course than the activation potential. At birth the inactivation potential
is - -20 mV, reaching aduh values (- -39 mV) by only 2 wks postnatal (Pereon etal,
1993).
Pereon etal (1993) also demonstrated that the twitch tension developed by immature
(especially in the first week) rat EDL muscle is depressed or enhanced by the
elimination or enhancement, respectively, of extracellular [Ca ^]. This effect was still
evident from 2 to 4 wks albeit to a much lesser extent. This indicates that an inflow of
Ca"* through the t-tubular L-type Ca^^ channel/voltage sensor is required for E-C
coupling in the first few wks postnatal, which may be related to an under developed
SR (Pereon etal, 1993). The dependence of E-C coupling on extracellular Ca * could
in part be due to the presence of RyR3/Ca^^ release channel isoforms. As already
mentioned, in mouse EDL muscle, the RyR3 isoform accounts for 100 % of Ca
release channels in the late embryonic stage of development decreasing to zero by 3.5
to 4 wks (Flucher etal, 1999). RyR3 knockout studies have shown that this isoform is
required for efficient transduction of an electrical signal to force generation. More
specifically, the presence of the RyR3 isoform may amplify Ca^^ release in response

38
to an electrical stimulus via a Ca'^ induced Ca'^ release (CICR) mechanism
(Berrtochmi etal, 1997). A CICR mechanism may allow more efficient E-C coupling
at a time when triad structure and orientation, and fiinctional coupling between T-
tubule voltage sensors and SR RyRl/Ca^^ release channels is yet to be ftilly
established (Bertocchini, etal, 1997).
Chaplin etal (1970) examined excitation-contraction latencies (defined as the time
taken for action potential conduction along the sarcolemma and into the T-tubules,
94-
Ca release from the SR and subsequent contractile apparatus activation) in immature
rat EDL muscles and found that the latency time decreased from - 6 milliseconds at
birth, to 2.8 milliseconds by 2 wks and reached 'aduh' values (2.5 milliseconds) by 3
wks postnatal.
Myosin heavy chain isoforms
At birth, fast twitch rat skeletal muscles predominantly express the embryonic
(MHCemb) and neonatal (MHCneo) MHC isoforms. Adams etal (1999), using gel
electrophoresis and westem blotting, showed that in the presence of normal
innervation and thyroid status, 1 week old rat fast twitch plantaris muscle is composed
of 61.5 % MHCneo, 24.3 % MHCemb, 5.6 % MHC I, 6.0 % MHC Ila and 3.6 %
MHCIIb. By 3 - 4 wks, both rat plantaris (Adams etal, 1999) and EDL (Albis etal,
1989) muscles have been shown, using gel electrophoresis, to be composed of only
aduh MHC isoforms. Likewise, La Framboise etal (1990) could not detect any
MHCemb or MHCneo isoforms by electrophoresis m 3 week rat EDL muscles but when
using immunohistochemistry was able to detect a poshive reaction to MHCneo in 24 %
of fibres. This positive reaction was absent by postnatal wks 8-9.
39
Contractile properties
Close (1964) has shown that rat EDL isometric contraction time and half relaxation
time reached a minimum by 5 wks and then increased slowly over the next 9 wks. In
this study. Close (1964) also showed that the optimum frequency for tetanic
stimulation reached its highest value by 5 wks, while isotonic speed of shortening (at
one tenth of maximum tetanic tension) did not reach its maximum value until 7 to 8
wks. Later, Drachman & Johnston (1973) reported that isometric contraction time and
half relaxation time decrease rapidly in rat EDL muscle, being half as fast as the aduh
muscle by the third day postnatal, and that 'adult' values could be reached as early as
3 wks. Although slightly different to the data of Close (1964), the decrease in
relaxation time was consistent with an increase in the SR Ca^^ uptake which reached
85 % of adult levels by 3 wks postnatal (Drachman & Johnston, 1973).
Concluding remarks
The data reviewed above (and summarized in Table 1.2) suggest that, in the rat, a
muscle reaches the 'adult' stage at different times during postnatal development,
depending on the parameter under consideration. Thus, by 3-4 wks postnatal most of
the molecular structures involved in the E-C-R cycle and the few physiological
processes measured to date are similar to those found m 'adult' rat fast twitch muscle.
94-
Exceptions however include the number of RyR/Ca release channels which reach
adult values by 4-5 wks, the relative volume of T-system and number of

<s
3 et H
CO
Ref
eren
ce
i-H T-H
o 1-H
ON
0 0
Wei
he,
1987
r»H
Wei
he,
1987
vo^^H
>o
Ti
en
fS
. - H
wks
pos
tnat
al
Wea
ning
R
epro
duct
ive
mat
urit
y
Bea
m &
Knu
dson
, 19
88
Kys
elov
ic e
tal,
199
4 R
elat
ive
T-s
yste
m
DH
PR
num
ber
Kys
elov
ic e
tal,
199
4 R
yR n
umbe
r E
dge,
197
0
1 I
Tri
ad o
rien
tatio
n OS OS
c o ii
ii OH Pe
reon
eta
l, 1
993
Con
te C
amer
ino
eta
l, 1
989
Cla
usen
, 200
3 C
onte
Cam
erin
o eta
l, 1
989
Cha
plin
eta
l, 1
970
• 1
DH
PR
act
ivat
ion
volta
ge
DH
PR in
acti
vati
on v
olta
ge
Mem
bran
e C
I" c
ondu
ctan
ce
Na
/K
AT
Pase
num
ber
Alb
is tY
<•//.,
1989
; La
Fram
bois
e ct
:i/.
1990
Res
ting
mem
bran
e po
tent
ial
Exc
itat
ion-
cont
ract
ion
late
ncy
Myo
sin
heav
y ch
ain
Dra
chm
an &
Jol
inst
on,
1973
; C
lose
196
4 D
rach
man
& J
ohns
ton,
197
3; C
lose
196
4 Is
omet
ric
cont
ract
ion
tim
e Is
omet
ric
half
rela
xati
on ti
me
Clo
se,
1964
A
lnaq
eeb
«& G
olds
pink
, 19
86
1
1 1
Isot
onic
spe
ed o
f sh
orte
ning
M
uscl
e fi
bre
diam
eter
"o cn 3
B
13 cn s: o cn M-1
a
a <U
'S -»
X
o a ki a ^ a ii X H ii .*.i
o Z
41
DHPR/voltage sensors which continue to increase until 5 -6 wks postnatal, and
isotonic speed of shortening which reaches aduh values by 7-8 wks. Due to study
design limitations ft is difficult to say with any certainty the age at which the resting
membrane potential reaches aduh values. The current data suggest a broad time period
of between 4 and 10 wks postnatal [as indicated by the question marks (?) m Table
1.2] in which an 'aduh' resting membrane potential is attained. Interestingly, muscle
fibre diameter (a morphological parameter) continue to increase up to 27 wks of age.
An important question arising from these data is, at what age does rat fast twitch
skeletal muscle reach a truly 'adult' status? Should fast twitch rat muscle be
considered 'aduh' at 3-4 wks, a time when most E-C-R cycle parameters stabilize, or
should it be referred to as 'adult' only at -27 wks when muscle fibre diameters
plateau? Also, from the data reviewed here it is clear that, despite some focus on
individual components of the E-C-R cycle, there exists very little information
regarding functional characteristics of the E-C-R cycle over a broad range of postnatal
ages in rat fast twitch skeletal muscle. In Chapter 3 of this thesis, responsiveness to T-
system depolarization of mechanically skinned fibre preparations (a functional
parameter of E-C coupling. Lamb & Stephenson, 1990a; see also Parameters
describing skinned fibre responsiveness to T-system depolarization, page 67) has been
determined over a broad range of rat ages ( 4 - 2 1 wks).
Use of skinned fibres for studying E-C couplmg
Skinned fibres is a term used to describe individual muscle fibres that have had their
sarcolemma either disrupted or removed chemically or mechanically. Chemical
skinning involves incubating a single fibre or a bundle of muscle fibres in one or a
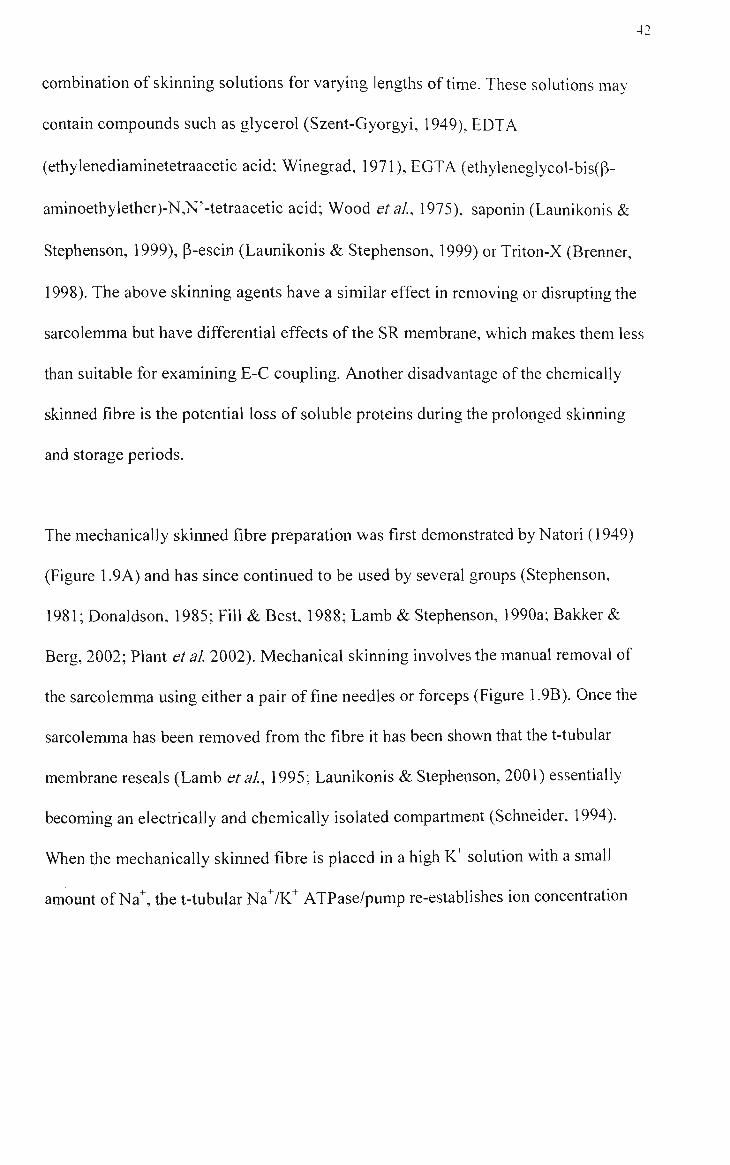
42
combmation of skirming solutions for varying lengths of time. These solutions may
contain compounds such as glycerol (Szent-Gyorgyi, 1949), EDTA
(ethylenediaminetetraacetic acid; Winegrad, 1971), EGTA (ethyleneglycol-bis(P-
aminoethylether)-N,N'-tetraacetic acid; Wood et al, 1975), saponin (Launikonis &
Stephenson, 1999), P-escin (Launikonis & Stephenson, 1999) or Triton-X (Brenner,
1998). The above skinning agents have a similar effect in removing or dismptmg the
sarcolemma but have differential effects of the SR membrane, which makes them less
than suitable for examining E-C coupling. Another disadvantage of the chemically
skinned fibre is the potential loss of soluble proteins during the prolonged skinning
and storage periods.
The mechanically skinned fibre preparation was first demonstrated by Natori (1949)
(Figure 1.9A) and has since continued to be used by several groups (Stephenson,
1981; Donaldson, 1985; Fill & Best, 1988; Lamb 8c Stephenson, 1990a; Bakker &
Berg, 2002; Plant etal 2002). Mechanical skinning involves the manual removal of
the sarcolemma using either a pair of fine needles or forceps (Figure 1.9B). Once the
sarcolemma has been removed from the fibre it has been shown that the t-tubular
membrane reseals (Lamb etal, 1995; Launikonis & Stephenson, 2001) essentially
becoming an electrically and chemically isolated compartment (Schneider, 1994).
When the mechanically skirmed fibre is placed in a high K^ solution with a small
amount of Na^, the t-tubular Na^/K^ ATPase/pump re-establishes ion concentration
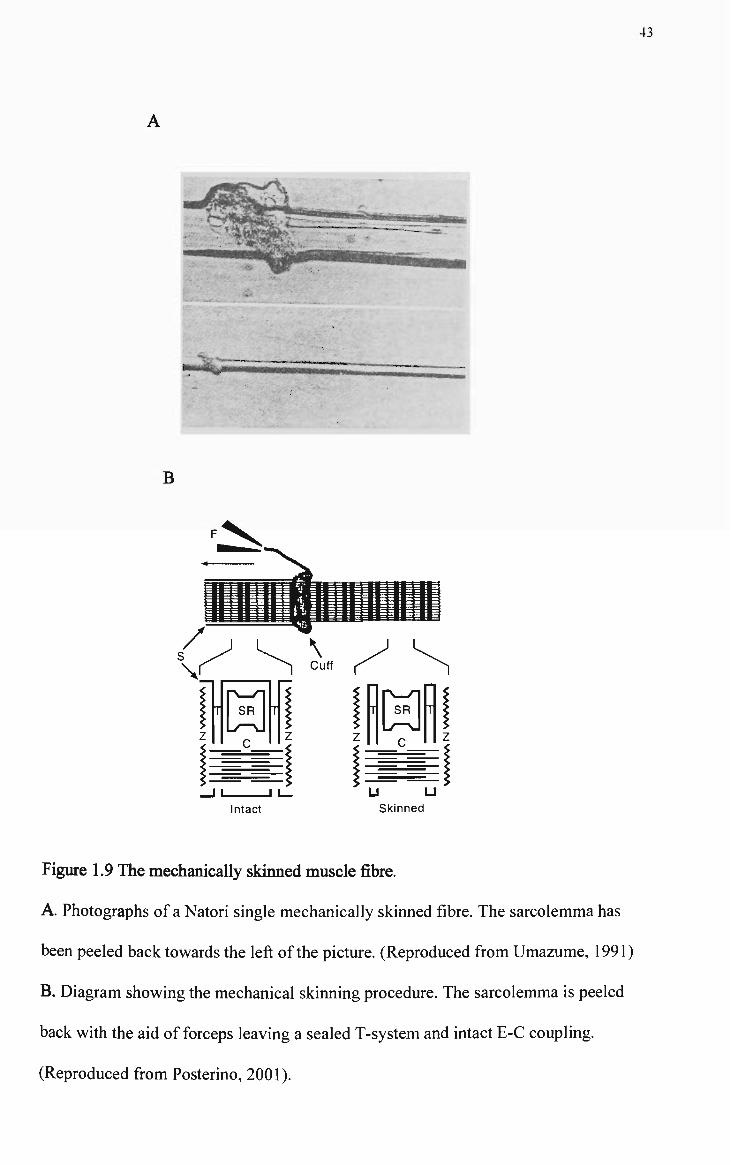
43
1 ^ - ' ^ # ^ ^
^Z~:».j.^
^ ^ V
-
-fe ' -* -—~^3C.,
B
u u Skinned
Figure 1.9 The mechanically skiimed muscle fibre.
A. Photographs of a Natori single mechanically skinned fibre. The sarcolemma has
been peeled back towards the left of the picture. (Reproduced from Umazume, 1991)
B. Diagram showing the mechanical skinning procedure. The sarcolemma is peeled
back with the aid of forceps leaving a sealed T-system and intact E-C coupling.
(Reproduced from Posterino, 2001).

44
differences across the t-tubular membrane similar to those found in viva (i.e. the t-
tubular environment relatively more positive than the myoplasm) (Lamb &
Stephenson, 1990a; Coonan & Lamb, 1998).
Advantages of the mechanically skiimed fibre preparation
The major advantage of the mechanically skinned fibre is that it allows experimental
manipulation of the myoplasmic environment while retaining the all essential
elements of the E-C-R cycle (Lamb, 2002a & b; Posterino, 2001). In this preparation,
contractile activation can be achieved either by the normal sequence of events starting
with the depolarization of the sealed t-system and activation of the voltage sensors
(Lamb & Stephenson, 1990 a «fe b; Launikonis & Stephenson, 2001), by direct
activation of the ryanodine receptors (RyRs)/sarcoplasmic reticulum (SR) Ca ^ release
channels (Lamb & Stephenson, 1990b; Endo & lino, 1980; Fink & Stephenson, 1987)
thus by-passing the voltage sensor activation, or by direct activation of the contractile
machmery in strongly Ca^^-buffered solutions (Fink etal, 1986). Thus the
mechanically skinned fibre allows the functional probing of the voltage dependent
Ca " release (E-C coupling), SR properties (SR Ca^^ uptake and release) and Ca^ -
induced activation of the contractile apparatus. In addition, the skinned fibre allows
the 'endogenous' SR Ca^^ content to be maintained or varied over a wide range
(Lamb, 2002a & b). T-system depolarization can be achieved by rapidly lowering the
myoplasmic K^ concentration (substituted with equimolar amounts of Na ) which
reverses the t-tubular membrane potential (Lamb & Stephenson, 1990a).
Alternatively, mechanically skinned fibres can be electrically stimulated to produce
action potentials that spread through the transverse and longitudinal tubular systems
and trigger SR Ca^^ release (Posterino et al., 2000; Posterino, 2001). Based on these

45
features, studies using the skinned fibre preparation fill the gap between whole muscle
or intact fibre studies, and studies utilizing isolated SR and/or isolated contractile or
channel proteins (Lamb, 2002b).
Disadvantages of the mechanically skinned fibre preparation
There are, however, some limitations to the mechanically skinned fibre preparation
which include: (i) inability to accurately determine or control the T-system membrane
potential as the t-tubule is too small to use the patch clamp or microelectrode
techniques (Schneider, 1994; Melzer, 1995) and (ii) important soluble and diffusible
intracellular components (such as some of the proteins participating in the E-C-R
cycle, enzymes and some glycogen) may be lost from the preparation to the bathing
solution.
Skeletal muscle glycogen
Glycogen enables muscle cells (as well as other cells) to store glucose in a form which
has very little influence on the intracellular osmotic pressure (De Barsy & Hers,
1990). Skeletal muscle glycogen can reach up to 1% of total muscle wet weight and is
the major form of stored energy for muscular work.
Glycogen particle structure
Glycogen, as viewed by electron microscopy, exists as spherical shaped P-particles
(Geddes, 1986). The p-particle is not solely a chemically homogenous structure of
stored glucose as ft also contains a covalently bound protein core (glycogenin; see
below), non-covalently bound enzymes responsible for glycogen metabolism and
minor inorganic constituents such as phosphate (Roach, 2002). Figure 1.10 shows a
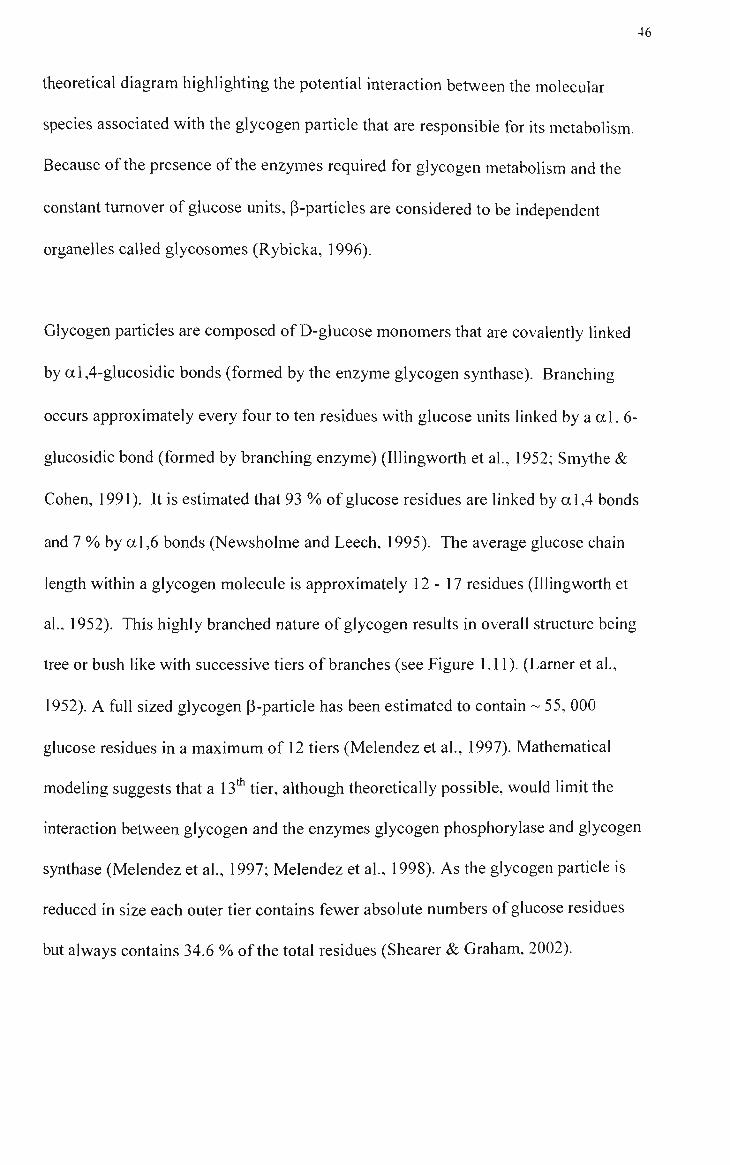
46
theoretical diagram highlighting the potential interaction between the molecular
species associated with the glycogen particle that are responsible for its metabolism.
Because of the presence of the enzymes required for glycogen metabolism and the
constant turnover of glucose units, (3-particles are considered to be independent
organelles called glycosomes (Rybicka, 1996).
Glycogen particles are composed of D-glucose monomers that are covalentiy linked
by al,4-glucosidic bonds (formed by the enzyme glycogen synthase). Branching
occurs approximately every four to ten residues with glucose units linked by a a 1. 6-
glucosidic bond (formed by branching enzyme) (Illingworth et al., 1952; Smythe &
Cohen, 1991). It is estimated that 93 % of glucose residues are linked by a 1,4 bonds
and 7 % by al ,6 bonds (Newsholme and Leech, 1995). The average glucose chain
length within a glycogen molecule is approximately 12-17 residues (Illingworth et
al., 1952). This highly branched nature of glycogen results in overall structure being
tree or bush like with successive tiers of branches (see Figure 1.11). (Lamer et al.,
1952). A full sized glycogen p-particle has been estimated to contain - 55, 000
glucose residues in a maximum of 12 tiers (Melendez et al., 1997). Mathematical
modeling suggests that a 13* tier, although theoretically possible, would limh the
interaction between glycogen and the enzymes glycogen phosphorylase and glycogen
synthase (Melendez et al., 1997; Melendez et al., 1998). As the glycogen particle is
reduced in size each outer tier contains fewer absolute numbers of glucose residues
but always contains 34.6 % of the total residues (Shearer & Graham, 2002).

47
Sarcolemmal or SR membrane
Figure 1.10 The glycosome.
This diagram shows a hypothetical arrangement of the glycogen particle, its
associated enzymes and other neighboring structures. (GP, glycogen phosphorylase;
GS, glycogen synthase; BE, branching enzyme; DE, debranching enzyme; PhK,
phosphorylase kinase; GN, glycogenin; PTG. Protem targeting to glycogen; GSR,
glycogen synthase kinase regulatory subunit; RQL, glycogen targeting subunh; CI,
type 1 phosphatase catalytic subunh; R, kinase targeting subunh) (Modified from
Shearer & Graham, 2002).
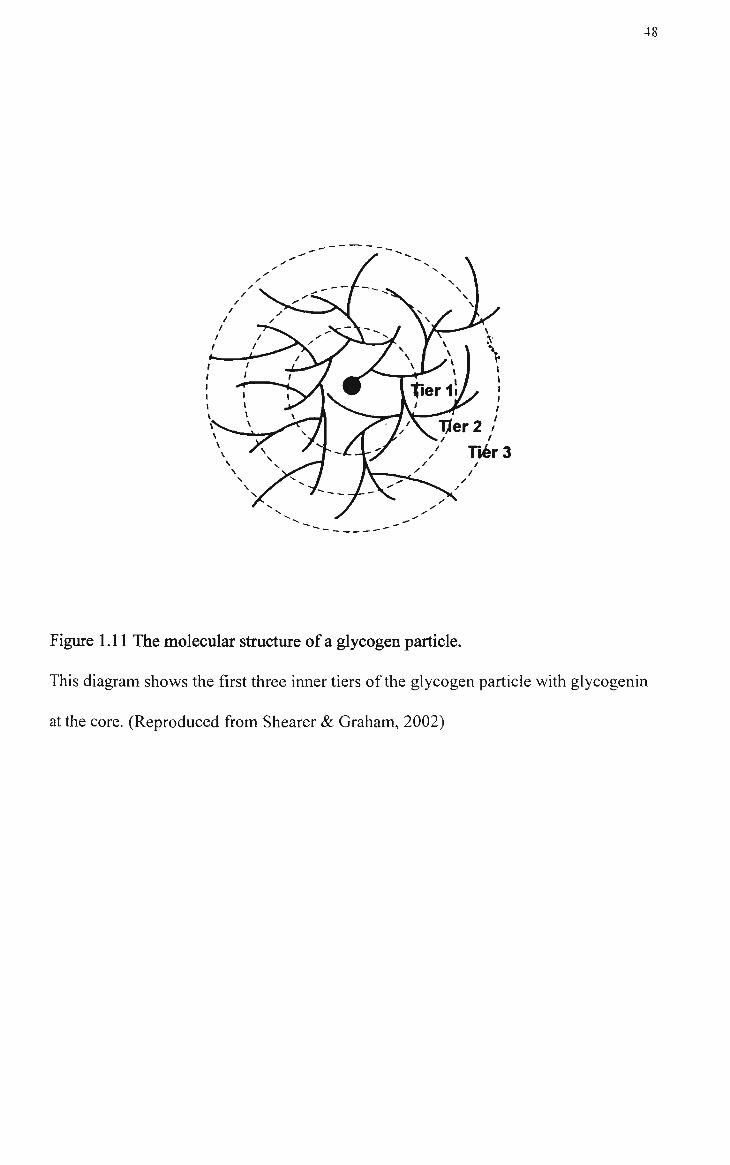
48
Figure 1.11 The molecular structure of a glycogen particle.
This diagram shows the first three inner tiers of the glycogen particle with glycogenin
at the core. (Reproduced from Shearer & Graham, 2002)

49
Location of skeletal muscle glycogen and glycogenolytic enzymes
Skeletal muscle glycogen is heterogeneously distributed throughout the cell (Sjostrom
etal, 1982; Friden etal, 1985 & 1989; Marchand etal, 2002). Friden etal (1989).
using electron microscopy, revealed several locations of glycogen deposhs within
human skeletal muscle. These locations included the subsarcolemmal space
especially in the near vicinity of subsarcolemmal mitochondria, the intermyofibrillar
space particularly around the region of the I-band and as intramyofibrillar longitudinal
rows between actin filaments on either side of the Z-line. More recently, Marchand et
al (2002) showed that the largest intracellular pool of glycogen was located in the
intermyofibrillar space although the subsarcolemmal space was more densely packed
with smaller glycogen particles. Of the glycogen found in the inter- and
intramyofibrillar spaces, particles present at the level of the sarcomeric I band are of
particular interest to studies on E-C coupling as the I band corresponds, in mammalian
skeletal muscles, to the location of the T-system and SR junction (triad).
It has long been knovm that glycogen is somehow associated with the SR membrane
(Wanson & Drochman, 1968; Meyer, 1970; Wanson & Drochman, 1972). However, ft
is difficult to conclude from the literature what proportion of SR associated glycogen
is in physical contact with or attached to the SR membrane, and how much is just
located near the SR. Wanson & Drochman (1968) observed 'some' particles in
contact with the SR, while Entman etal (1980) suggested that SR glycogen
represented a 'minority' of total muscle glycogen. This is in contrast to the large pool
of glycogen that has been shown to exist in the vicinity of the sarcotubular triad
region by Friden etal (1989) and Marchand etal (2002). The possibility of glycogen
attaching to membranous structures is supported by data showing that glycogenm, by
50
virtue of the presence of a very hydrophobic amino acid sequence (Kennedy etal,
1985), could bind to membranous stmctures like the SR membrane (Polishchuk etal,
1995). Another mechanism by which glycogen could be attached to the SR membrane
is via the RQL glycogen targeting subunh of protein phosphatase-1 (see Figure 1.10)
that also contains a hydrophobic sequence that has been postulated to allow for the
localization of glycogen to membranous sites including the SR (Newgard etal, 2000).
Polishchuk etal (1995) proposed that glycogen is inhially synthesized on the SR
membrane until the particle reaches a critical size (~ 200 kDa) after which it is
released into the myoplasm. This proposal is consistent with the earlier observation of
Wanson & Drochman (1972) that the few glycogen particles actually in contact with
the SR membrane are much smaller than average glycogen particle. Two studies have
attempted to quantify the amount of glycogen associated with the SR with the results
obtained using rat skeletal muscle being quite divergent (32 |iig/mg SR protein,
Cuenda etal, 1994 vs 400 |Lig/mg SR protein. Lees etal, 2001). ft remains unclear if
these figures represent true in wVo values. Despite the growing volume of information
regarding the intracellular location of glycogen, the exact relationship between
glycogen and the function of the neighboring subcellular compartments remains to be
elucidated.
As mentioned earlier (see Glycogen particle structure, page 45) glycogen particles or
glycosomes contain the various protein species required for glycogenolysis such as
glycogen phosphorylase (GP), phosphorylase kinase (PhK) and debranching enzyme
(Figure 1.10). Previous studies have also shown that GP and PhK (Wanson &
Drochman, 1972; Entman etal, 1980; Cuenda etal, 1993, 1994, 1995; Polishchuk et
51
al, 1995; Lees etal, 2001), along with many of the enzymes of the glycolytic
pathway (Xu etal, 1995; Xu & Becker, 1998), are located on the SR membrane.
More recently, GP has been shown to be associated with the RyRl/Ca^^ release
channel (Hirata et al., 2003) and the Na^/K^-ATPase/pump a subunit (Takeyasu et al.,
2003).
Glycogenolysis
Muscle glycogen is broken down in a process known as glycogenolysis. This
pathway is distinct from the glycogen synthesis pathway that involves different
enzymes. Firstly, the enzyme GP in the presence of inorganic phosphate (Pi)
phosphorolytically cleaves the a-1, 4 glucosidic bond joining the terminal non-
reducing glucose residue and hs neighbour resuhing in the formation of glucose-1-
phosphate (Stryer, 1995). The glucose-1-phosphate can then enter the glycolytic
pathway to produce ATP, nicotinamide adenine dinucleotide (reduced form; NADH)
and pyruvate. GP continues activate phosphorolysis of successive a-1, 4 bonds
toward the centre of the P-particle until it reaches a glucose residue that is four
residues away from an a-1, 6 branch point. At this point another enzyme known as
debranching enzyme or amylo-1, 6-glucosidase catalyses a two step reaction to
remove the branch point glucose residue, since the a-1, 6 glucosidic bond is not
susceptible to cleavage by GP (Stryer, 1995). In the first step, the debranching
enzyme acts as a transferase that removes three glucose residues and adds them to
another side chain of a-1,4 residues which effectively exposes the a-1,6 connected
residue. The second action of the debranching enzyme is then to hydrolyse the a-1, 6

52
bond and release a single glucose molecule (Brown, 1994). GP is then free to
continue to cleave a-1, 4 linked residues until the next a-1, 6 branch point.
Glycogen phosphorylase
GP, the rate limiting enzyme of glycogenolysis, exists as a dimer with a molecular
weight of 97.5 kDa (Johnson, 1992). GP can exist in either a less active T state or a
more active R state (Newgard etal, 1989), with the most active form having a Km for
glycogen of- 1-2 mM (Shearer & Graham, 2002). The activity state of GP is
modulated by phosphorylation and/or the binding of various metabolites. Thus,
phosphorylation at the Serl4 residue converts the unphosphorylated phosphorylase b
(phos b) into the potentially more active phosphorylase a (phos a). Metabolic effectors
including glycogen. Pi, glucose-1-phosphate, fructose-1-phosphate and uridine
diphosphate glucose activate both phos a and phos b while AMP activates phos b
only. Factors such as glucose and caffeine act as inhibitors for both phos a and phos b,
while glucose-6-phosphate (G-6-P) and ATP act as inhibitors for phos b only
(Newgard etal, 1989). In this thesis, phos a and phos b activhies have been
examined as part of a study aimed to establish the stability of glycogen in rat (and
toad) skeletal muscle stored for various lengths of time and at different temperatures
(Chapter 5).
Phosphorylase kinase
PhK is responsible for the Serl4 phosphorylation of Phos b that leads to the
transformation of GP into the more active a form. PhK is composed of 16 subunits; 4
X a, p, Y, 6. The a and p subunits contain cAMP phosphorylation sites, the y subunit
has the catalytic site while the 8 subunh is the Ca^^ binding protein calmodulin

53
(Roach, 2002). Two isozymes of the a subunit exist with the a* isozyme, a splice
variant of the PHKAl gene, being expressed m red/slow skeletal muscle while the a
isozyme, a splice variant of the PHKB gene, is expressed in white/fast skeletal muscle
(Roach, 2002). The functional significance of these isozymes remains unknown. PhK
can be activated by cAMP phosphorylation, elevated levels of ADP and by Ca "
binding to the 6 calmodulin subunh (Kruszynska etal, 2001). Ca^^ released from the
SR following membrane depolarization is sufficient to activate PhK which in tum
phosphorylates and activates GP leading to increased glycogenolysis (Ebashi & Endo,
1968). So far, most studies concemed with the regulation of phosphorylase kinase and
other glycogenolytic enzymes have involved the use of whole muscle preparations
that do not allow an insight into the inter-fibre differences with respect to these issues.
The findings presented in Chapter 6 together with the results of Stephenson et al.
(1999) strongly suggest that the mechanically skinned fibre preparation can be used in
studies of skeletal muscle glycogen.
Glycogen and muscle fatigue
Muscular fatigue, defined as the inability of a muscle to maintain a required force
output with respect to time (Fitts, 1994 ; Asmussen, 1979 for reviews), is a
multifactorial phenomenon and is largely task dependent (Fitts, 1994 ; Enoka, 1995
for reviews). The actual site(s) of fatigue within the muscle cell are still speculative
but much attention has been focused recently on factors that mfluence the E-C
coupling mechanism and more specifically, the release of Ca " from the SR. It is well
established that Ca"^ is essential for removal of the inhibition of actin-myosin
interaction which then enables the sliding of the protein filaments which in tum
causes the muscle to shorten and produce force (Allen etal, 1995 for review; also see
54
Thin filament activation and muscle contraction, page 19). A reduction in Ca "
release would in theory resuh in reduced force generation by the contractile proteins.
Bergstrom et al (1967) were the first to demonstrate that during moderate to heavy
intensity exercise (65 - 90 % of maximal oxygen uptake;V02max) there is a high
positive correlation (r = 0.92) between muscle glycogen depletion and muscular
fatigue. This correlation however only holds tme at this range of work intensities. At
lower intensities (i.e. < 60 % VOimax) fatty acid and blood glucose oxidation are
capable of supplying sufficient energy as evidenced by high muscle glycogen levels
after exercise (Fitts, 1994). Likewise, exercise at 90 % V02max or above results in
rapid fatigue despite high remaining muscle glycogen levels (Fitts, 1994). At
moderate to heavy work levels, fatigue is possibly related to an inability of the muscle
to sustain the rate of flux through the glycolytic pathway; this would result in a
reduction of the rate of ATP production needed to maintain the required level of work
(for review see Green, 1991). Indeed, the data of Broberg & Sahlin (1989) showed a
10 % decrease in ATP and an increase in inosine monophosphate (an indicator of
ATP degradation) with prolonged exercise at 60 - 70 % of VO2 max. until exhaustion
(Broberg & Sahlin, 1989). Whether this decrease in ATP is enough to reduce power
output is still however questionable (Fitts, 1992).
Energy related role of glycogen in fatigue
Recently, Chin and Allen (1997) investigated the influence of muscle glycogen
concentration on Ca^^ release and force production in single muscle fibres of the
mouse. Using two fatiguing stimulation periods, separated by incubation of the fibre
either with or without glucose, and comparing the Ca " release and force production

55
for each of the work periods, Chin and Allen (1997) have showed that both force and
94-
Ca release are affected by the level of muscle glycogen. When fibres were
incubated with glucose between stimulation periods, glycogen recovered and Ca~
release increased from 47 % to 82 % at the end of the first stimulation period.
However when the fibres were incubated without glucose, muscle glycogen remained 94-
low and Ca release recovered to only 57 %. They concluded that 25 % (82 minus 94-
57 %) of the Ca release recovery was glycogen dependent.
Based on these findmgs the authors speculated that the repeated tetanic contractions
reduced glycogen and creatine phosphate below a crhical level causing a small
localized decrease in [ATP] near the SR-T tubule triad (Han etal, 1992; for review
see Korge & Campbell, 1995). This in tum would have had an inhibhory effect on
the release of Ca " through the Ca^^ release channels (see Putative endogenous
regulators of the skeletal muscle RyRl isoform, page 12) and/or a direct or indirect
effect on the actin-myosin interaction and hence force production (Chin & Allen,
1997).
Nan energy related rale of glycogen in fatigue
There is evidence, produced mainly by studies on muscle fatigue, to suggest that
glycogen function in the muscle is not strictly confined to its role as an energy store.
Thus, Vollestad et al. (1988) were unable to show any significant decrease in cellular
ATP at the point of fatigue despite a large decrease in muscle glycogen. The study of
Vollestad etal (1988) demonstrated that fatigue from prolonged muscular activity is
unlikely to be due to depletion of ATP.

56
Recentiy, Stephenson etal (1999) investigated the hypothesis that glycogen, as well
as having a role in energy storage and supply, also plays a non-energy related
protective role against fatigue. To test this hypothesis, these authors examined
glycogen content in single mechanically skinned muscle fibres of the toad and fibre
responsiveness to T-system depolarization in solutions containing excess ATP (8
mM) and creatine phosphate (10 mM). This strategy eliminates the possibility of low
energy charge of the muscle cell causing reduced force output. As shown in Figure
1.12 a positive correlation (r = 0.83) was found between single fibre glycogen content
and its ability to respond to depolarization of the T-system (Stephenson et al, 1999).
Therefore despite adequate ATP levels within the fibre, low muscle glycogen was
associated with lower force responses to T-tubule depolarization indicating a possible
function link between glycogen content and Ca ^ release from the SR. An
examination of the relationship between glycogen content and mechanically skinned
fibre responsiveness to T-system depolarization in rat skeletal muscle was carried out
in the study presented in Chapter 6 using the depolarization/repolarization protocols
of Stephenson et al. (1999).
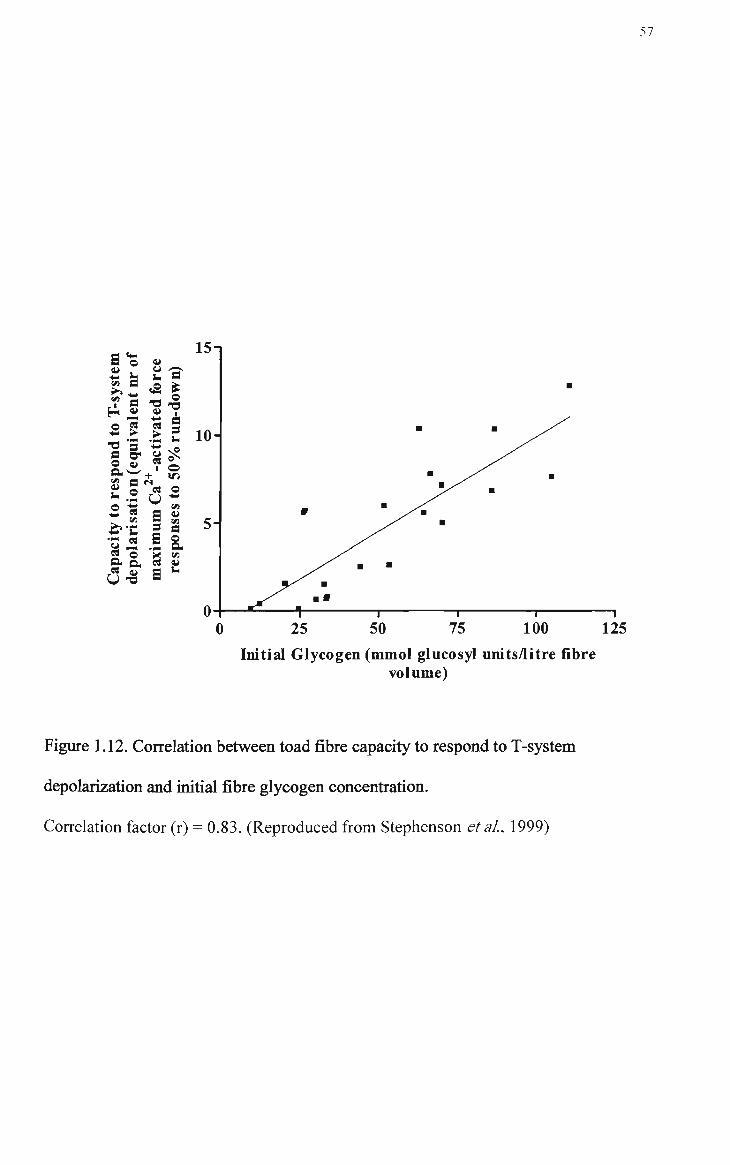
57
Initial Glycogen (mmol glucosyl units/litre fibre volume)
Figure 1.12. Correlation between toad fibre capacity to respond to T-system
depolarization and initial fibre glycogen concentration.
Correlation factor (r) = 0.83. (Reproduced from Stephenson etal, 1999)

58
Aims of this study
At the time when work for this thesis was started, the experimental approach
employed in the majority of studies using the mechanically skinned fibre preparation
to examine E-C-R cycle events in mammalian systems at the cellular level involved
the use of muscles dissected from animals belonging to an age range of 12 to - 20
wks (e.g. Posterino & Fryer, 2000; Posterino etal, 2001) which is smaller than the
range of 4 - 21 wks commonly used in studies of aduh skeletal muscle (see Aspects
of postnatal development of rat skeletal muscle relevant to the E-C-R cycle, page 32).
Furthermore, the fibres used in most of these studies were obtained from the rat
extensor digitorum longus (EDL), a muscle that has a relatively homogeneous fast-
twitch fibre type composition (Armstrong & Phelps, 1984). Finally, when examining
the mechanisms underlying the effect of potential regulators of E-C-R cycle events,
experimenters typically used the test fibre as its own control. Thus, little was known
about differences in rat skinned fibre responsiveness to T-system depolarization
between (i) fibres from animals belonging to the whole "aduh" age range, (ii) fibres
containing different MHC isoforms and (iii) fibres containing different glycogen
concentrations. Therefore the aim of this study was to examine the relationship
between mechanically skiimed fibre excitability and the developmental age of the rat,
in the range of 4 to 21 wks {Chapter 3), MHC isoform composition, muscle of origin
{Chapter 4) and glycogen content {Chapter 6). Prior to examining the relationship
between glycogen content and skinned fibre excitability in rat EDL muscle, the
stability of glycogen in EDL (and soleus; SOL) muscle stored for various lengths of
time and at different temperatures was established and compared to that in toad
iliofibularis (IF) muscle {Chapter5).

59
Chapter 2
GENERAL IVdATERL^LS A l ^ METHODS
Animals
The animals used in this study were male rats {Rattus narvegicus) aged between 4 and
21 weeks and male and female cane toads {Bufa marinus). Rats were housed at room
temperature (20 - 25°C) with normal light and dark cycle and access to food and
water ad libitum. Cane toads were kept unfed in a dark environment at room
temperature. Rats were killed by deep inhalation of the volatile anaesthetic halothane
(Zeneca) while toads were double pithed. All animal related procedures described in
this thesis were carried out in accordance with the guidelines of the Victoria
University Animal Experimentation Ethics Committee.
Muscle dissection
Immediately after animal death, the muscle required, EDL, soleus (SOL) or
stemomastoid (SM) from the rat or iliofibularis (IF) from the toad were dissected
from the body taking care not to cut or excessively stretch the muscle. The muscle
was subsequently blotted dry on Whatman No 1 filter paper to remove any excess
interstitial fluid or blood. Each muscle was then placed into a Petri dish layered with a
bed of Sylgard 184 transparent resin (Dow Coming Chemicals, USA) and covered
with paraffin oil (Ajax Chemicals, Australia). In studies of mechanically skinned
fibres, paraffin oil is used m the Petri dish for the following reasons: (i) h facilitates
the visualization of the single muscle fibres by having a different refractive index; (ii)
h prevents muscle fibre gaining or losing water while the fibre is being prepared; and

60
(iii) ft helps to confer the fibre a quasicircular cross-sectional area through the surface
tension exerted on the fibre at the fibre/oil interface (Bortolotto etal, 1999). Each
muscle was pinned through the tendons to the Sylgard resm bed with entomological
pins at approximate resting length. Unless stated otherwise, when not being used for
single fibre dissection, the muscles were kept refrigerated at 4°C.
Single muscle fibre dissection
Single muscle fibres were dissected from muscles with the aid of No. 5 jewellers
forceps (Dupont, Switzerland), iris scissors (Vannas, Germany) and an Olympus
dissecting microscope (magnification range- 6.4x - 40x) (see Figure 2.1). To begin, a
small incision was made through the epimysium, then while holding a small bundle of
5 -10 fibres, another incision was made parallel to the muscle fibre's long axis and
the bundle carefully pulled away to about 1 - 1.5 cm from the muscle. Then using the
forceps, this larger bundle was then continuously halved until a single fibre remained.
Mechanical skinning
Taking the free end of the dissected fibre with one pair of forceps, the other forceps
was used to pinch a small portion of sarcolemma and peel the membrane up the fibre
towards the muscle belly (See Figure 1.9, Chapter 1). Caution was taken to not
excessively stretch the fibre during this procedure. The presence of a 'cuff as the
membrane was peeled back indicated that the fibre was being skinned properly and
not split into two pieces.
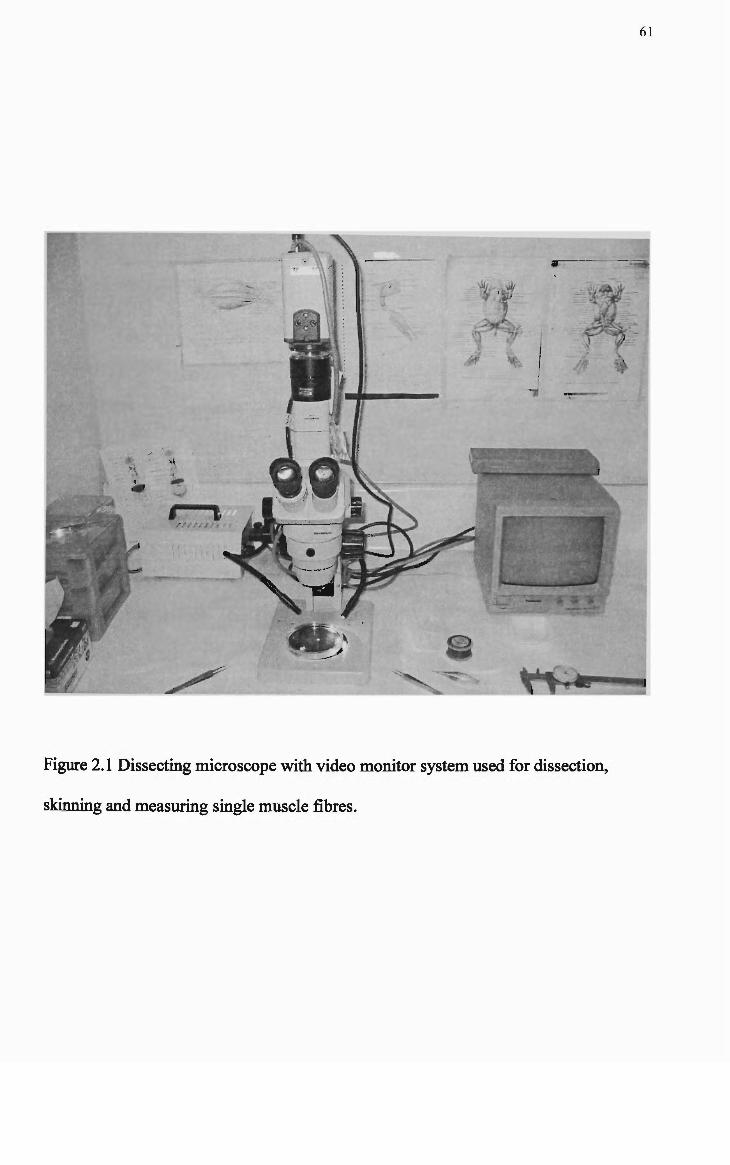
61
Figure 2.1 Dissecting microscope with video monitor system used for dissection,
skinning and measuring single muscle fibres.
62
Measurement of muscle fibre dimensions
A video camera-monitor system (Olympus; see Figure 2.1) and a pair of callipers
(Mitutoyo, Japan) were used to measure the length (1) and width (w = d) of each
skinned muscle fibre segment under paraffin oil at 6.4 x and 40 x magnification
respectively. Muscle fibre width was measured in 2 - 3 places along the length of the
fibre and a mean calculated. Dimensions measured on the monitor screen were
converted to actual fibre dimensions (expressed in mm) using conversion factors
obtained from calibration with a graticule. Assuming the fibre to be cylindrical, fibre
volume (V) was calculated using the following equation:
V = 7rd^l/4 (Eql)
Mounting the skinned muscle fibre preparation to the farce measuring system
While still under oil and using finely braided surgical silk (Deknatel, No 10), a single
knot was tied to the free end of the skinned muscle fibre. The Petri dish with fibre
preparation was then positioned under the force measuring apparatus. With the aid of
an inverted microscope (Olympus; see Figure 2.2A), the single fibre segment was
then attached to a stainless steel pin (connected with shellac to a force transducer)
with a surgeon's double knot (see Figure 2.2B). Once tied, the other end of the fibre
was clamped between the tips of a pair of fine forceps attached to a micromanipulator.
The fibre was freed from the whole muscle by cutting h with microscissors, between
the muscle and forceps, as close as possible to the edge of the forceps. Resting length
was obtained by slightly stretching the fibre so that force was just detectable on the
chart recorder and then releasing the tension until no measurable force could be
detected. This length was measured with the aid of an eye piece graticule in the

63
Figure 2.2 Force measurement and recordmg apparatus. A) Microscope (M), chart
recorder (CR), laboratory jack (LJ), Perspex tray (PT) and Perspex cover (PC), (power
supply and Wheatstone bridge not shown). B) Enlarged photo of micromanipulator
(MM), forceps (F) and transducer (T) with steel pin attached.

64
inverted microscope. The fibre was then stretched to 120 % of hs resting length
resulting in an approximate sarcomere length of 2.8 - 3.0 )am for rat skeletal muscle
fibres. The sarcomere length adjustment was performed based on compelling evidence
that: (i) the plateau region for isometric force production in rat skeletal muscle occurs
at longer sarcomere lengths (2.4 - 2.9 \im) (Stephenson & Williams, 1982), a
characteristic which has been related to longer thin filaments (Close, 1972), and (ii) in
vertebrate skeletal muscle, an increase in the sarcomere length as accompanied by an
94-
increase in the sensitivity of the contractile apparatus to Ca (Rassier etal, 1999). At
sarcomere lengths of 2.8 - 3.0 pm, rat EDL muscle fibres produce close to maximum
force. With the activation procedures used in this study, both the sarcomere pattern
and sarcomere homogeneity in small vertebrate skeletal muscle fibre segments are
well preserved during sub-maximal activation (Stephenson & Williams, 1982).
Finally, the Petri dish was removed and the fibre was lowered into a 2 ml Perspex
bath containing a K^-HDTA based Polarizing solution, where it was allowed to
equilibrate for 2 mins before the commencement of depolarization experiments.
Force measurement and recording apparatus
As shovm m Figure 2.2 A & B, the apparatus used for measuring the force output of a
single skinned muscle fibre consisted of a micomanipulator (Prior, UK), a pair of fine
forceps, a peizzo-resistive force transducer (AME801, Sensonor, Norway) with a
stainless steel pin secured to h with shellac, a chart recorder (Linear), a Wheatstone
bridge (see Figure 2.3), preamplifier, power supply and laboratory jack.
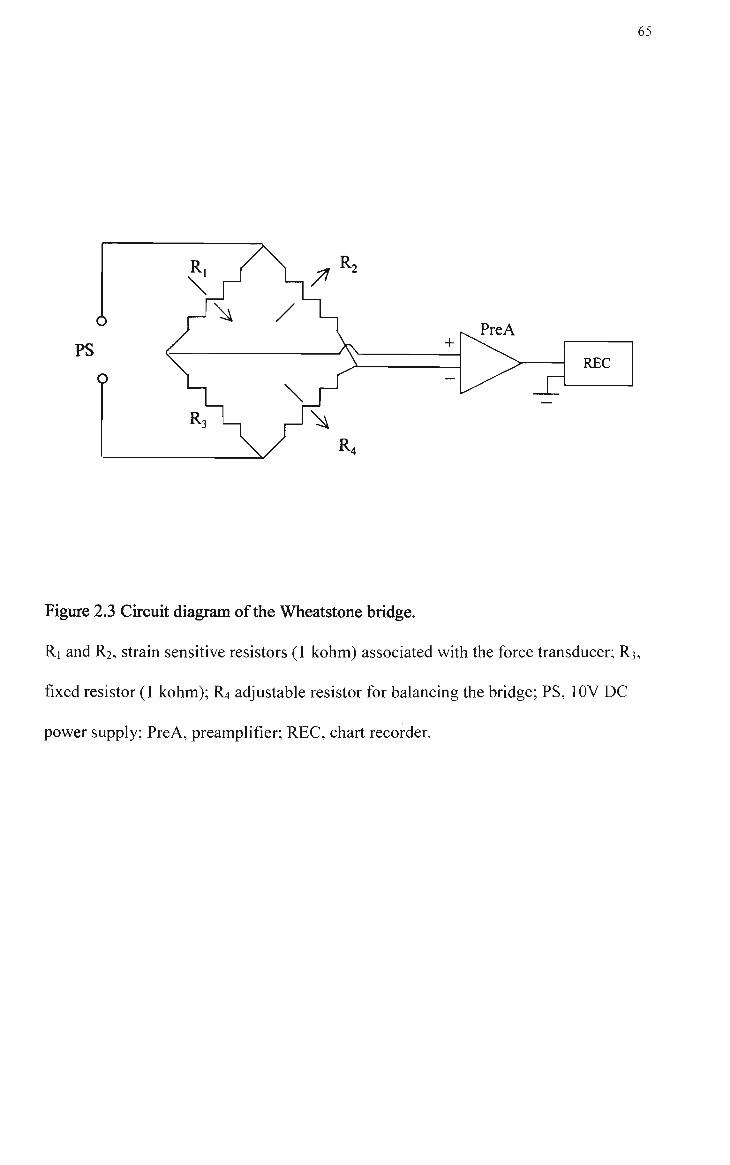
65
PreA
Figure 2.3 Circuit diagram of the Wheatstone bridge.
Rl and R2, strain sensitive resistors (1 kohm) associated with the force transducer; R3,
fixed resistor (1 kohm); R4 adjustable resistor for balancing the bridge; PS, lOV DC
power supply; PreA, preamplifier; REC, chart recorder.
66
Force transducer calibration
To calibrate the force transducer, the micromanipulator was laid on its side so that the
transducer and attached steel pin were in a horizontal position. Small weights, ranging
from 6.9 mg (35.3 pN) to 93.5 mg (919.2pN), were then placed on the end of the pin
where a fibre would normally be tied. The resulting force signals were recorded on the
chart recorder at different sensitivities (2, 5 & 10 mV) and subsequently plotted to
create a calibration curve of chart recorder pen displacement (mm) versus weight (mg
or pN) (See Figure 2.4).
Protocol far T-system depolarization induced activation in mechanically skinned
fibres
Immediately after a fibre is mechanically skinned, it is placed in a high K solution
(Polarizing solution; the chemical composition of this and all other solutions
mentioned below are given in detail in Chapter 2) for 2 mins to allow the t-tubule
membrane to repolarize. Once repolarized, depolarization of the t-tubules, which
triggers a force response (depolarization-induced force response; DIFR) via the
normal E-C coupling pathway, is achieved by placing the fibre into a Depolarizing
solution in which the K^ has been replaced with sodium (Na^) (Lamb & Stephenson,
1990a). Each depolarization typically lasts for approximately 3 - 5 seconds after
which the fibre is returned to the Polarizing solution to repolarize the T-system
membrane and reprime the vohage sensor, for 1 min before the next depolarization.
The typical pattern of DlFRs produced by a fibre subjected to this protocol includes:
(i) an initial 'work-up' period where the force generated gradually increases to a
maximum value (Coonan & Lamb, 1998) and (ii) a 'mn-down' period where the force
responses decrease until no more force responses can be eliched (Lamb &
67
Stephenson, 1990a). The amplitude of the force response reached at the end of the
work-up period may begin to decrease rapidly or may be maintained for several
depolarization/repolarization cycles.
In the studies described in this thesis, depolarizations were continued until the force
response had run-down by a value of 75 % of the largest depolarization-mduced force
response. After the last DIFR, the fibre was placed back into the Polarizing solution.
Then, to check if the mn-down was due to depleted SR Ca^* levels or to dysfiinction
of the Ca ^ release channels, each fibre was placed in a low (0.015 mM) [Mg^ ] (Low
Mg^ ) solution to release endogenous SR Ca " . From the Low Mg^ solution the fibre
was then placed into a Relaxing solution before the maximum Ca^^-activated force
94- 94-
(maxCaF) was obtained in a high Ca (pCa 4.5; Maximum Ca Activation) solution.
Parameters describing skinned fbre responsiveness to T-system depolarization
The two most commonly used descriptors of skinned fibre responsiveness to T-system
depolarization are the amplhude of the maximum DIFR (maxDIFR), normalized to
maxCaF in the same fibre and the number of DIFRs produced by the fibre until the
force response decreasing by a certain percentage of the maxDIFR. As mentioned
above, in this thesis, this percentage was 75% and the corresponding parameter is
referred to as 75«/Jl-D. Other parameters particular to each study are defined in the
Methods section of individual chapters.
In mechanically skinned muscle fibre preparations, the maxDIFR is ultimately
94-
determined by the amount of Ca^^ released from the SR, the rate of Ca
release/uptake and the sensitivity to Ca^^ of the confractile apparatus. As shown in

68
Table 2.1, several non-experimenter-related events mvolving the T-system and SR
can impact on the amount of Ca^^ released and on the rate of Ca^^ release/uptake by
the SR compartment. Generally, the size of a DIFR is influenced by the number of
voltage sensors activated by the depolarizing stimulus, the number of SR Ca ^ release
channels opened as the result of the cross-talk between voltage sensors and the SR
channels, and by the SR luminal [Ca^^]. It is assumed that, if Ca^^ loss from the intra
myofibrillar space into the aqueous bathing solution is minimal (Lamb & Stephenson,
1990a), full coupling of the two compartments will resuh in enough Ca^^ being
released from the SR to elicit a near maximal contractile response as compared to the
94-
maximum Ca activated force response (Lamb & Stephenson, 1990a).
The determinants of the second parameter, 75o/< -D, are as yet unknown. According to
Lamb & Stephenson (1990a), the run-down phenomenon is not related to the length of
time that a fibre is exposed to aqueous solutions, nor to the depletion of SR Ca
94-
content, as exposure to low [Mg ] (0.015 mM), produces relatively large force 94-
responses in run-down fibres indicative of adequate SR free Ca and functional
RyR/Ca^^ release channels (Lamb & Stephenson, 1994). Run-down in mechanically
skinned muscle fibres is unlikely to be related to energy depletion as experiments are
carried out in the presence of high [ATP] (8 mM) and [CP] (10 mM) which maintain
the energetic potential of the fibre. One possibility is that the decrease in DIFRs in
mechanically skinned fibre preparations is related to a use-dependent loss of some
factor such as glycogen located near the triad region (Stephenson etal, 1999; see Nan
Energy Related Rale of Glycogen in Fatigue, page 55). Ca^^-dependent or
phosphorylation/dephosphorylation-dependent processes leading to a gradual
inactivation of t-tubule voltage sensors or disruption of the coupling between the

69
Table 2.1. Essential positive contributors to the upstroke and downstroke of T-system
depolarization mduced force responses in mechanically skinned fibre preparations.
Upstroke Downstroke
experimenter/protocol related
• effective sealing of the T-system after mechanical skinning. • optimum conditions (composition of solutions, incubation times) for repolarization and
depolarization of the sealed T-system in the skinned fibre preparation.
T-system related (assumption: PK » P^a)
• effective polarization of the sealed t-tubule membrane (dependent on Na,K ATPase/pump & [K^] on both sides of the t-tubule membrane).
• effective depolarization of the t-tubule membrane in low pc^] solution
• effective activation of the voltage sensors associated with the DHP receptors.
• effective signal transmission between the DHPR/voltage sensors and RyR/Ca " release channels.
• effective depolarization induced inactivation of the DHPR/voltage sensors.
sarcoplasmic reticulum related
• effective signal reception by the SR RyR/Ca^ -release channels and opening of the channels
• amount and rate of Ca'^ released from the SR following depolarization (dependent on the SR-Ca^* content, the functional status of the SR RyR/Ca^ -release channels and the number of SR RyR/Ca^ -release channels functionally coupled to the DHPR/vohage sensors)
• SR Ca ^ ATPase/pump activity
94-
• inactivation or closure of SR RyR/Ca channels (use-dependent, Ca"'* -dependent)
• SR Ca^" ATPase/pump activity
contractile apparatus related
• responsiveness to Ca'^ of the contractile apparatus (dependent on its sensitivity to Ca'")
• diffusion-related loss of Ca"" from the myofilament environment
70
9-4-
DHPR/voltage sensor and RyR/Ca release channel may also contribute to the mn-
down (for review see Stephenson etal, 1995).
Force detection limit
Under our experimental conditions, accurate determination of the amplitude of the
force response developed by a fibre was possible if the response was > 12 pN (the
detection limit for 5 mV/scale).
Solution composition
An important feature of the mechanically skinned fibre preparation is that the
experimenter can control the myoplasmic milieu by exposing the fibre to various
solutions (see Advantages of the skinned fbre preparation in Chapter 1, page 44). The
solutions used in the T-system depolarization induced activation experiments
(Polarizing, Depolarizing, Low Mg^", Relaxing and Maximum Ca " Activation)
contained the following important ingredients (see also Table 2.2):

71

+ 00
+
ii
+ U o
OS
O
o • »« i ^
i=!
S •c .B "o S' Q
CO d o
' • «
o c«
o OS
o OS
o OS
o OS
o OS
00 00 oo oo oo
00 00 o 00
o
o o ki
o
oo
1 ^
so
O
o o ki
o
00
m ^
o o
o
w-1
o kH
o
oo so
00
.s +
o
1.0
o IT)
o OS
A
t^ r^
' O ( N
.^ g
Rel
1.0
o
4.5
1 ^ ro
^ ( N
^^ 03 U ran
Q
'x
ion
eS .^
eg "5
J 3 C3 (L»
c S ^ O .2P cn
luti
ons
was
dep
ende
nt
8 w
hile
HD
TA
fro
m S
de
Hae
n).
All
solu
tion
O ^ -i. cn 3 oj + '^ -O
^ o + 9 + 00
lari
zing
and
jr
ing
free
C
ma,
exc
ept
O — 00 Q, o •-r
ing,
De
adde
d t
; fr
om S
. N <U ^ ki ^ <U
Pola
A
to
ais
w
TA
]in
oE
GT
;h
emic
'—' ? -^ B 'B ° o cr =
P O o W
cn O
CI- o
J2 < H Q X C 4 . 1
o
ii o
CT- +1 2 o
ii J -

73
1. All solutions, with the exception of the Depolarizing solution, contained 126
mM K" and 37 mM Na" . For the Depolarizing solution, all K* was substituted
with Na* bringing the final Na* concentration to 163 mM.
2. In all solutions the total concentrations of ATP and CP were 8 mM and 10
mM, respectively, so that with the aid of the endogenous creatine kinase,
stmctures and processes (such as the contractile apparatus, RyR/Ca^* release
channel, SR Ca^* ATPase/pump and T-tubular Na*/K* ATPase/pump) would
be kept in constant supply of ATP.
94-
3. The major anion in the Polarizing, Depolarizing and Low Mg solutions was
HDTA^" (hexamethalenediamine N,N,N',N'-tetraacetic acid; 50mM) that does 2+ not difftise through the SR or T-tubule membranes or significantly bind Ca
In the Relaxing and Maximum Ca^* Activation solutions HDTA " was
replaced with 50 mM of the Ca^* chelator EGTA '.
4. With the exception of the Low Mg^* solution, the free Mg * concentration in
all other solutions was 1 mM, a concentration similar to that found at rest m
vivo. The concentration of free Mg^* in the Low Mg^* solution (0.015 mM)
was obtained by mixing two otherwise identical solutions containing 0.05 mM
and 0.0 mM free Mg^* at a 1:1 ratio. The total Mg^* required to make up these
levels of free Mg^* was calculated using the apparent Mg^* affinity constants
of 6.9 X 10 M ' for ATP, 8 M"' for HDTA^", 15 M"' for CP and 5 x lO' M ' for
EGTA (Moisescu & Thieleczek, 1978; Stephenson & Williams, 1981; Fink et
al 1986). The total concentration (mM) of Mg^* in the Polarizing,

74
Depolarizing, Low Mg *, Relaxmg, and Maximum Ca^* Activation solutions
was 8.5, 8.5, 1.1, 10.3, 8.12, respectively.
5. 1 mM Azide (NaNs) was added to all solutions to prevent mitochondria from
infiuencing Ca^* transients.
6. The pH (pH = -logio[H*]) was strongly buffered with 90 mM HEPES (N-2-
hydroxethyl-piper-azine-N'-2-ethylsulphonic acid) at 7.10 ± 0.01. The pH of
all solutions was measured with a digital pH meter (Orion).
7. The Maximum Ca^* Activation solution contained 48.5 mM total [Ca *]
resulting in a free [Ca^*] of - 31.6 pM (pCa 4.5). The Relaxing solution
containing 50 mM EGTA^' and no added Ca^* had a free [Ca^*] of < 1.0 nM
(pCa < 9.0).
8. The osmolality of all solutions was 290 mosmol/kg, similar to that found in
viva.
Free [C3'^] in the Polarizing solution
An important feature of the mechanically skinned fibre preparation is that at the
beginning of an experiment, h contains approximately the normal endogenous SR
[Ca^*] (Owen etal, 1997). This is because the fibre is skinned under paraffin oil, a
procedure that prevents a loss or gain of SR Ca^*. Lamb 8c Stephenson (1990a)
showed that during each depolarization, a small amount of released Ca (-10 %) is
lost to the bathing solution. This loss of SR Ca^* is, however, offset by the SR Ca 2+

75
ATPase/pump slowly sequestering a small amount of contaminating Ca'^ from the
solution during the subsequent 1 minute polarizing step (Owen etal, 1997).
To quahtatively assess whether the free [Ca^*] in the Polarizing solution was
sufficient to maintain approximate endogenous levels of SR Ca^* after each
depolarization, single fibres were tested using the Polarizing solution from a freshly
made batch. If, during this preliminary testmg, successive DIFRs became larger and
progressively wider, this would indicate that the contaminating Ca^* in the Polarizing
solution was too high and the SR was artificially loading too much Ca^*. If, however,
the DIFRs became smaller and progressively thinner, this would indicate that the
94-
contaminating Ca in the Polarizing solution was too low leading too progressive SR 94- 94-
Ca depletion. If a solution was deemed to have too little or too much free Ca then 94- 94- ^ ^
a small amount of Ca or the Ca chelator EGTA, respectively, was added.
When DIFRs remained relatively constant (especially the width) h was judged that the
approximate endogenous levels of SR Ca' * were being maintained. Once established
24-
as appropriate to use for the following E-C coupling experiments, the free [Ca ] was
checked with a Ca^*-sensitive electrode (Orion, model no. 9720), and found to be
equivalent to a pCa of 6.8.
The freshly made Polarizing solutions were also compared to a reference Polarizing
solution, i.e. an older solution that had previously been demonstrated to contain an
adequate free [Ca^*].

76
Chapter 3
DEVELOPIVIENTAL AGE AlSfD RESPONSIVEISIESS TO T-
SYSTEIVI DEPOLARIZATION IN RAT IVECHAlSflCALLY SKBSfNED
SKELETAL IVTUSCLE FIBRES
Introduction
So far, the method of Lamb and Stephenson (1990a) for determining responsiveness to
T-system depolarization in mechanically skinned fibres, introduced in Chapter 1, has
been employed in studies aimed at furthering the understanding of the cellular events
involved in E-C coupling and identifying endogenous regulators which may act as
potential fatiguing agents in normal vertebrate skeletal muscle (rat, toad and mouse)
(for reviews see Lamb, 2002a & b; Posterino, 2001).
It is reasonable to expect that this method, which was developed for fast twitch muscle
of disease-free rats aged 12-20 wks (Lamb and Stephenson, 1990a; Lamb and
Stephenson, 1994), could also provide important insights into aspects of E-C coupling
in muscles of rats used as experimental models of human disease at different stages of
development of the disease, which often involve the use of animals aged between 4
and 20 wks (e.g. hypertension; Bortolotto etal, 1999). An obvious prerequisite for
such application is that T-system depolarization-induced activation of Ca * release is
achievable in skinned fibre preparations from the animals used as controls for the
pathological conditions under consideration. Thus far there have been no
investigations on the impact of animal age within the full aduh age range on the
applicability of the Lamb and Stephenson method to single fibres from rat skeletal
muscle. Therefore, the aim of the present study was to systematically examine whether
E-C coupling characteristics in mechanically skinned fibre preparations from rat fast-
twitch skeletal muscle vary with age, within the 'aduh' range.
Materials and methods
Note that the contractile apparatus experiments in this study were performed with the
assistance of Dr R Blazev.
Animals
In this study, excitation-contraction (E-C) coupling characteristics were examined in
mechanically skinned fibre segments of EDL muscle from Long Evans (LE) hooded
rats aged 4-wks (4.0 to 4.4-wks), 8-wks (7.6 to 8.0-wks), 10-wks (10.1 to 10.6-wks),
15-wks (15.0 to 15.6-wks), and 21-wks (20.7 to 21.3-wks) postnatal.
Skinned fbre preparation
Mechanically skinned fibre segments were prepared and their dimensions measured as
described in Chapter 2. All experiments were carried out at room temperature (20-25 °
C).
Skinned fbre solutions
All solutions were as described in Chapter 2 with the exception of a Ca * load
solution. This was identical to the Polarizing solution except that ft contained 40 pM
CaCb and 25 pM EGTA. Unless otherwise stated, the 'Ca^* loading strategy' involved
exposure of a fibre to a Ca^* load solution (see above) for 15-30 s to allow the SR to
actively load extra Ca^*.
T-system depolarization and E-C coupling parameters
hi addition to the two commonly used E-C coupling parameters mentioned in Chapter
2 (see Parameters describing skinned fibre responsiveness to T-system depolarization,
page 67), maxDIFR and 75%R-D, two new parameters were introduced m this study.
These were (i) the number of responses taken to reach the maximum depolarization-
induced response and (ii) the stabilhy of the responsiveness to T-system
depolarization expressed as the number of consecutive depolarization-induced force
responses within the range 80 to 100% of the maximum depolarization-induced
response (#DIFR8o-ioo%)-
In this study, the force response developed in the low Mg^* solution (LMgFR) was
related to the DIFR produced by the fibre preceding its exposure to low Mg^*
(R-DDIFR). More specifically, the SR in a run-down fibre was deemed to be
functionally competent if the ratio of the two responses (LMgFR/R.DDIFR) was higher
than 4, which is the value of the ratio between the maxDIFR and the DIFR produced by
the fibre at 75% run-down.
Contractile apparatus experiments
9-1-
The Ca -sensitivity of the contractile apparatus in skinned fibres from 4- and 10-wk
rats was determined using a procedure similar to that employed previously by
Bortolotto etal (1999 & 2000). In should be noted that, to be consistent with fibres
used in the E-C coupling experiments {Mounting the skinned muscle fibre preparation
to the force measuring system in Chapter 2, page 62), the fibres used in these
experiments were stretched to 120% of resting length. To obtain solutions with the
required free [Ca^*] (pCa) values, the Relaxing (high EGTA) and Maximum Ca^*

79
Activation (high Ca-EGTA) solutions were mixed together in specific ratios. Prior to
mixing these two solutions, the free [EGTA] of the heavily buffered high Ca-EGTA
solution was determmed using the pH titration method of Moisescu & Pusch (1975).
Specific proportions of the Maximum Ca^* Activation and Relaxing solutions were
then mixed together (see Table 3.1) and the free [Ca^*] (pCa) of these new solutions
was determined using the following equation:
[Ca'*]free= [CaEGTA]/[EGTA]fieeX 1/Kapp,
where [CaEGTA] = [EGTAjtotai - [EGTAj^ee and Kapp = 5 x 10 M^ (Moisescu 8c
Thieleczek, 1978; Fink etal, 1986) atpH 7.1 and 1 mM free [Mg^*].
As shown in the force trace of Figure 3.1, skinned fibres were exposed to a sequence
of heavily buffered EGTA-CaEGTA solutions over a range of progressively higher
94- 94-
free [Ca ] (pCa>9 to pCa<5), until the maximum Ca -activated force was obtained.
After the maximum Ca^*- force was recorded, fibres were placed into the Relaxing
solution.
The force produced at each [Ca^*] was expressed as a percentage of the maximum
Ca ^-activated response and plotted as a function of pCa, using GraphPad Prism
(GraphPad Software Inc., San Diego, CA, USA). Hill curves were fitted to the forces
pCa data and the pCaso (pCa giving half-maximum force), pCaio value (pCa giving
10% maximum force) and Hill co-efficient (steepness of the force-pCa curve) were
determined.
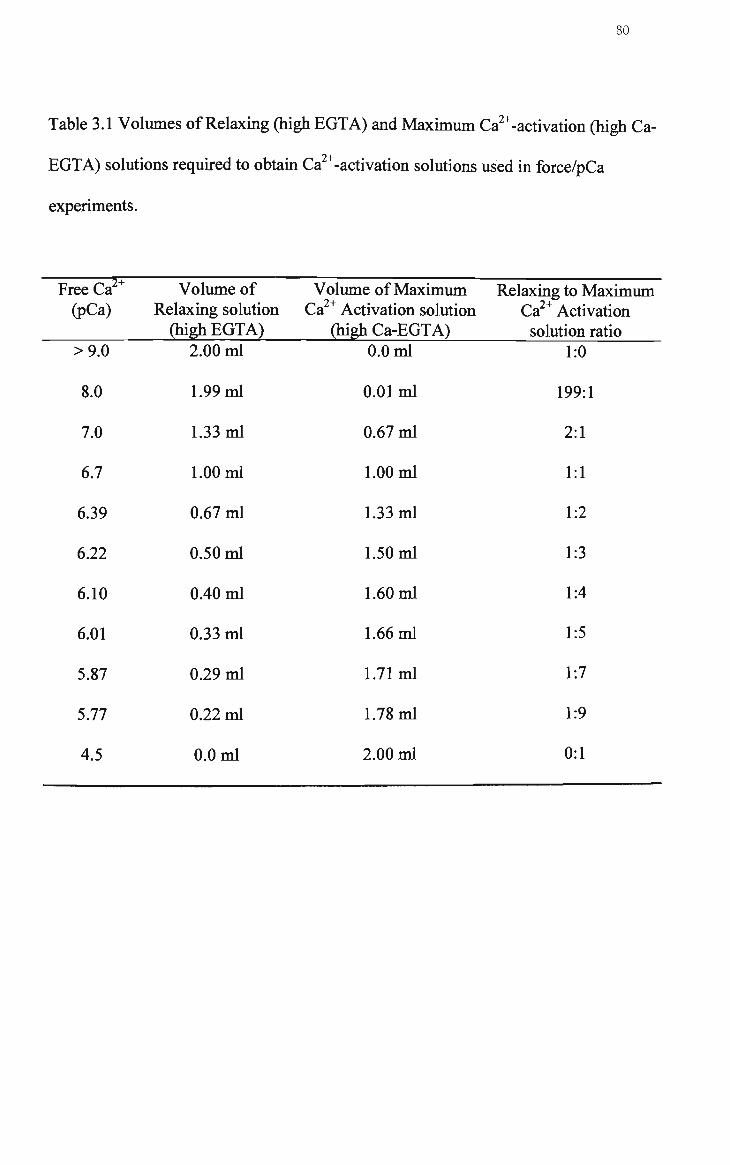
80
Table 3.1 Volumes of Relaxing (high EGTA) and Maxhnum Ca^*-activation (high Ca-
EGTA) solutions required to obtain Ca^*-activation solutions used m force/pCa
experiments.
TT Free Ca' (pCa)
Volume of Relaxing solution
(high EGTA)
Volume of Maximum Relaxing to Maximum Ca * Activation solution Ca * Activation
(high Ca-EGTA) solution ratio >9.0
8.0
7.0
6.7
6.39
6.22
6.10
6.01
5.87
5.77
4.5
2.00 ml
1.99 ml
1.33 ml
1.00 ml
0.67 ml
0.50 ml
0.40 ml
0.33 ml
0.29 ml
0.22 ml
0.0 ml
0.0 ml
0.01ml
0.67 ml
1.00 ml
1.33 ml
1.50 ml
1.60 ml
1.66 ml
1.71ml
1.78 ml
2.00 ml
1:0
199:1
2:1
1:1
1:2
1:3
1:4
1:5
1:7
1:9
0:1

81
1
t tt t 2 11 2
1
30 s
Figure 3.1. Representative chart recording of force response by a 10 week rat EDL
fibre exposed to solutions with varying free Ca ^ concentrations.
Solutions 1-11 represent pCa values of: 9.0 (1), 8.0 (2), 7.0 (3), 6.7 (4), 6.39 (5), 6.22
(6), 6.10 (7), 6.01 (8), 5.87 (9), 5.77 (10) and 4.5 (11).
Data analyses and statistics
In the text, mean values are given + S.E.M. and unless indicated otherwise all
statistical analyses were performed using a one-way ANOVA with a Bonferroni post-
test. Statistical significance was accepted as /^0.05. Sample size is denoted by n.
Results
Age related differences in E-C coupling characteristics
Figure 3.2 shows a series of depolarization-induced force responses (DIFRs) produced
by mechanically skinned EDL fibres from 4-wk (Figure. 3.2A), 10-wk (Figure. 3.2B),
and 21-wk (Figure. 3.2C) rats. During the course of the experiments undertaken in this
study, it was apparent that some fibres gave no detectable force in response to T-
system depolarization within the first few depolarization challenges. The proportion of
fibres that produced no force (/iFfibres) was greatest in the fibre population isolated
from 4-wk rats (10/30). By comparison, the proportion of iiFfibres from 8-wk (1/26),
10-wk (1/22), 15-wk (3/26), and 21-wk (0/16) rats was substantially lower. With the
94-
ten zzFfibres from 4-wk rats, subsequent loading of the SR with Ca for a sufficiently
long period (30 to 180 s) failed to induce any response to T-system depolarization. All
zzFfibres were excluded from data analyses.
Maximum depolarization-induced force response.
As seen in the traces illustrated in Figure. 3.2, the profile of the DIFR was
quahtatively similar (rapid transient type) in skinned fibres from 4-wk, 10-wk, and 21-
wk rats. This was also the case for the other age groups examined in this study (8- and
15-wks) for which data are not shown. However, it is clear that the amplhude of the
maxDIFR was smaller in the 4-wk fibre (Figure. 3.2A) than in the 10-wk fibre

83
Depol
0.006 iiiN
2 or .10 s
i
ma.DIFR
I R-D
J<LJ^iJ^JLJA4_N_^L^l , Max
B
Depot 1 I I 1
n.axl>IFR
i
1
1 I
2 I 1 ii
\
I J )
VJ
1
^
0
u r
4
I
0.0.1 mN
2 or 30 s
xCaF
.Max
low Mg2+
Depol I
10 13 16 20
V r \ . J j Vk Jj \L j)
I 1 I I
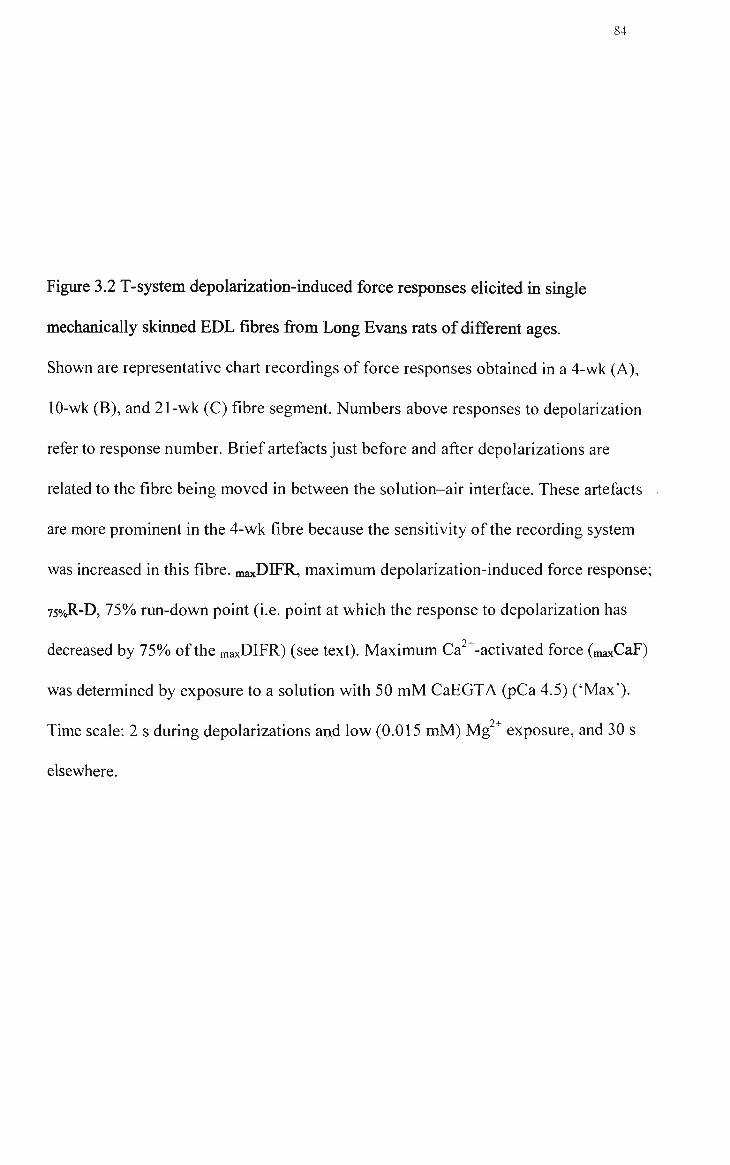
84
Figure 3.2 T-system depolarization-induced force responses eUcited in single
mechanically skinned EDL fibres from Long Evans rats of different ages.
Shown are representative chart recordings of force responses obtained in a 4-wk (A),
10-wk (B), and 21-wk (C) fibre segment. Numbers above responses to depolarization
refer to response number. Brief artefacts just before and after depolarizations are
related to the fibre being moved in between the solution-air interface. These artefacts
are more prominent in the 4-wk fibre because the sensitivity of the recording system
was increased in this fibre. maxDIFR, maximum depolarization-induced force response;
750/oR-D, 75% run-down point (i.e. point at which the response to depolarization has
decreased by 75% of the maxDIFR) (see text). Maximum Ca'^-activated force (maxCaF)
was determined by exposure to a solution with 50 mM CaEGTA (pCa 4.5) ('Max').
94-
Time scale: 2 s during depolarizations and low (0.015 mM) Mg exposure, and 30 s
elsewhere.

85
(Figure 3.2B). Indeed, when this response was normalised to hs respective maximum
Ca^^-activated response (labelled maxCaF in Figure. 3.2), the amplhude of the maxDIFR
in the 4-wk fibre was 13% compared to 85% in the 10-wk fibre (compare
maxDIFR/maxCaF in Figure. 3.2A 8c B). The summarized data presented in Figure. 3.3A
show significant differences with respect to this E-C couplmg parameter between
fibres from 4-wk rats and fibres from all the other age groups investigated, as well as
significant differences between fibres from 8-wk rats and all other age groups. In
contrast, there were no significant differences in the maxDIFR between fibres isolated
from 10-wk, 15-wk, and 21-wk rats (Figure. 3.3A).
The significant difference found with respect to the maxDIFR, between fibres isolated
from 4-wk rats and fibres isolated from 10- to 21-wk rats could be related to
94-
differences in the Ca -sensitvity of contractile apparatus between these age groups.
94-
To investigate this possibility, the Ca -activation properties of the contractile
apparatus in 10-wk fibres (chosen because the maxDIFR for fibres from this group was
not significantly different from that of fibres for 15- and 21-wk groups) was compared
with fibres from 4-wk rats. These experiments (see Figure 3.4) showed that 10-wk 94-
fibres (n=21) had a significantly lower sensitivity to Ca as compared to 4-wk fibres
(n=16), with the pCaso being on average lower by 0.07 ± 0.01 pCa units in 10-wk
fibres (mean pCaso in 10-wk and 4-wk fibres: 6.06 + 0.01 and 6.13 + 0.01,
respectively; /^0.05, unpaired t-test). A similar resuh was also observed with the
pCaio values, where the mean pCaio in 10-wk and 4-wk fibres was 6.28 ± O.Ol and
6.33 ±0.01, respectively (mean change in pCaio: 0.05 ±0.01; /^0.05, unpahed t-test).
No significant differences were observed between these two age groups with respect to
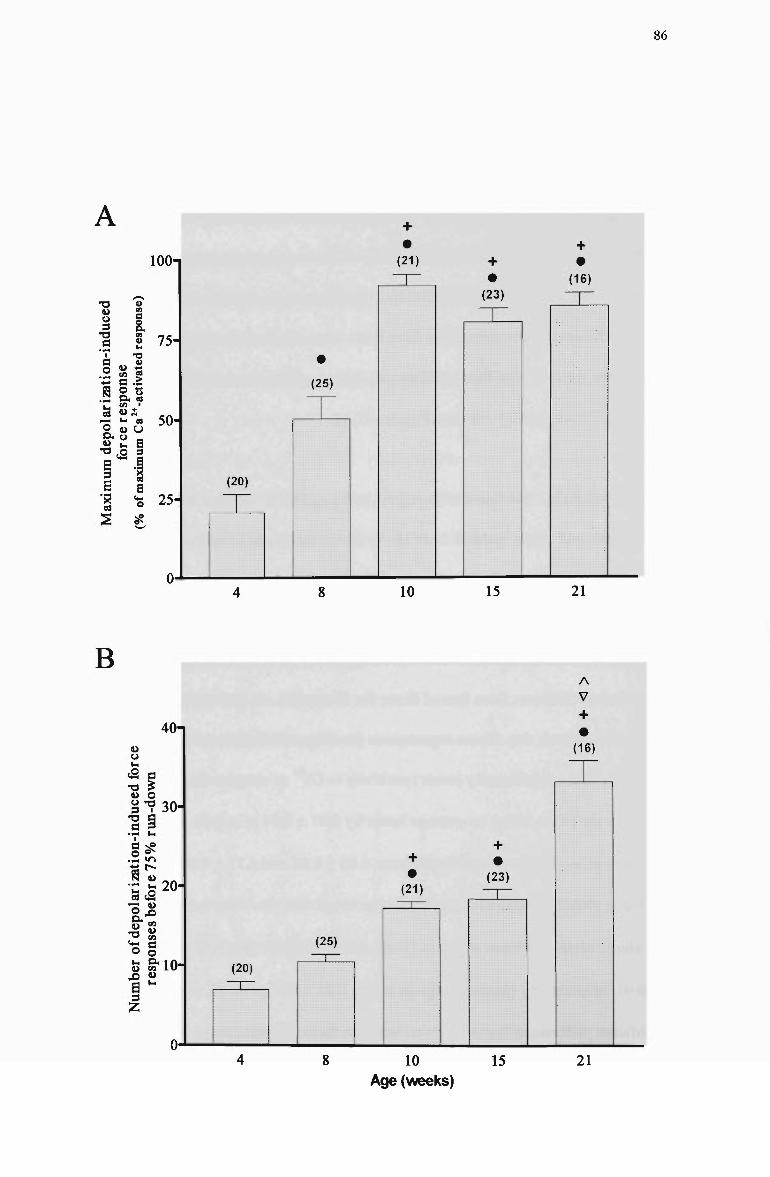
86
lOOn
u u 3 a
a 8.
o .. « o «* ts
I «- k i " J . '
_ . ki a
g « U
e a a
75-
50-
25-(20)
+ (21)
~ 1 ~ +
(23)
+
(16)
10 15 21
B
40-
SOTS > a o
^ J.
•§9 o *^
C g 20-— » o o
o o 10-
a I
A V +
(16)
+
(21)
(25)
(20)
10 Age (>Aeeks)
15 21
Figure 3.3 Summarized data for (A) the maximum depolarization-induced force
response and (B) the number of responses to depolarization obtained before 75% run
down m skinned fibres from 4-wk, 8-wk, 10-wk, 15-wk, and 21-wk Long Evans rats.
Bars show mean ± S.E.M in 'n' fibres. Symbols indicate 'significantly different
(P<0.05) from 4-wks, ^significantly different {P<0.05) from 8-wks, ^significantly
different {P<0.05) from 10-wks, '^significantly different {P<0.05) from 15-wks, as
determined by an ANOVA with Bonferroni post-test.
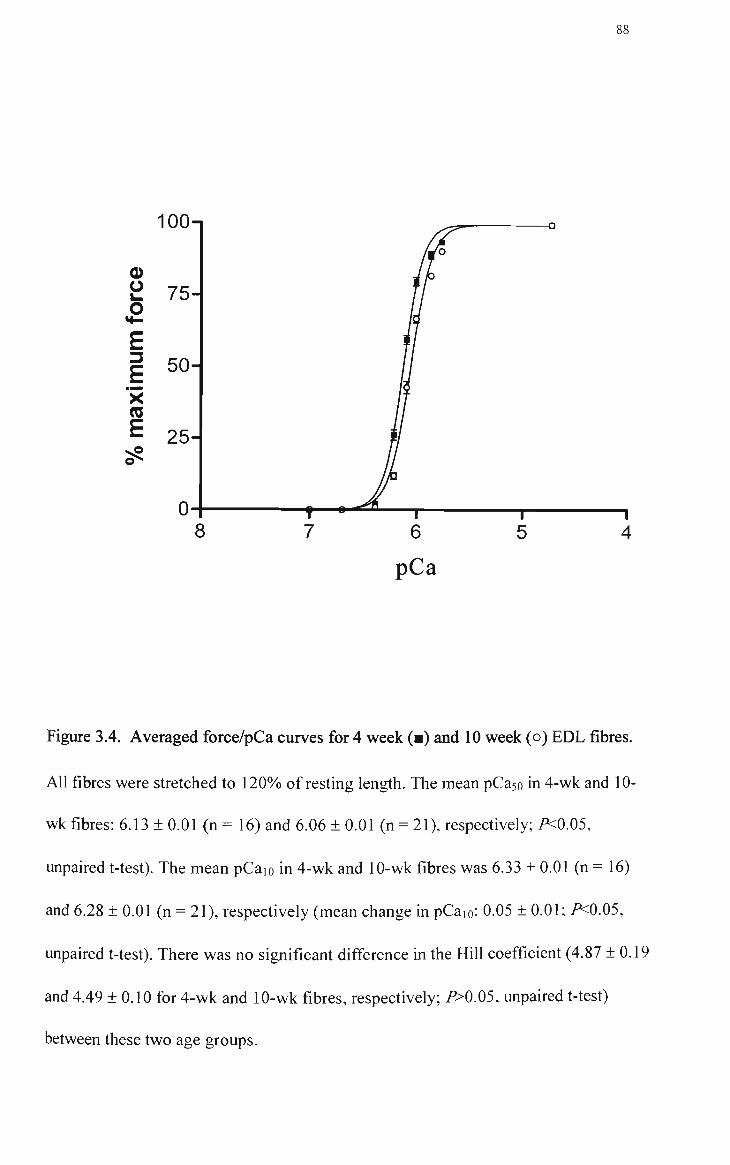
88
o
E 3
X
E
100n
75-
50-
25-
0-r 8 7
~l 4
Figure 3.4. Averaged force/pCa curves for 4 week (•) and 10 week (o) EDL fibres.
All fibres were stretched to 120% of resting length. The mean pCaso in 4-wk and 10-
wk fibres: 6.13 ± 0.01 (n = 16) and 6.06 ± 0.01 (n = 21), respectively; P<0.05,
unpaired t-test). The mean pCaio in 4-wk and 10-wk fibres was 6.33 ± 0.01 (n = 16)
and 6.28 ± 0.01 (n = 21), respectively (mean change in pCaio: 0.05 ± 0.01; 7^0.05,
unpaired t-test). There was no significant difference m the Hill coefficient (4.87 ±0.19
and 4.49 ±0.10 for 4-wk and 10-wk fibres, respectively; P>0.05, unpaired t-test)
between these two age groups.

89
the Hill coefficient (4.49 ±0.10 and 4.87 ±0.19 for 10-wk and 4-wk fibres,
respectively; P>0.05, unpaired t-test). Thus, differences in Ca^^- sensitivhy of the
contractile apparatus do not explain why fibres from 4-wk rats developed smaller
DIFRs than fibres from rats aged 10-21 wk.
Closer inspection of the trace illustrated in Figure. 3.2B shows that the amplhude of
the DIFR progressively increased before it reached a steady level. This phenomenon,
referred to as 'work-up', is commonly seen in mechanically skinned fibre preparations
where T-system depolarization is achieved by Na* substitution (Coonan & Lamb,
1998). As shown in Table 3.2, it took on average -3 depolarizations before the
maxDIFR was elicited in 4- and 8-wk fibres and on average -6 depolarizations before
this response was reached in 21-wk fibres. However, statistical analysis indicated that
the longer 'work-up' period observed in fibres from 21-wk rats was not significantly
different from that observed in the other fibre groups, with the exception of the 8-wk
fibres.
75% Run-down.
The three representative traces illustrated in Figure. 3.2 of single skinned fibres from a
4-wk, 10-wk, and 21-wk rat, also reveal age related differences in the 75%R-D
parameter. Only 5 responses to depolarization were elicited before 75% run-down in
the 4-wk fibre shown in Figure. 3.2A, while a substantially greater number of
responses could be obtained in the 10- and 21-wk fibres (17 and 41 responses,
respectively) shown in Figure. 3.2 B & C.
90
The summarized data presented m Figure. 3.3B show that significantly more
depolarization-induced responses could be obtained before 750/Jl-D in fibres from 10-
wk rats as compared to fibres from 4-wk rats, and in fibres from 21-wk rats as
compared to fibres from 10-wk rats (mean number of responses before 750/oR-D: 7.0 ±
1.0, 17.2 ± 0.81 and 33.1 ± 2.7 for 4-wk, 10-wk, and 21-wk fibres, respectively).
As explained in the Materials and Methods, the SR in a run-down fibre was deemed to
be fiinctionally competent if the ratio of the force response developed in the low Mg^*
solution and the depolarization-induced force response produced by the fibre
94-
preceding its exposure to low Mg was > 4. The mean values for this ratio were 36.0
± 7.9 (4-wk, n=12), 16.5 ± 4.4 (8-wk, n=24), 8.1 ± 0.8 (10-wk, n=19), 5.3 ± 0.5 (15-
wk, n=22), and 6.9 ± 0.9 (21-wk, n=10). Based on these data, it is reasonable to
suggest that the lower responsiveness to T-system depolarization observed in 4 and 8
wk fibres from the age study was more likely to be related to differences in the T-
system and/or coupling mechanism than to SR dysfunction.
The summarized data of fibre cross-sectional area for the age groups investigated in
this study are summarized in Table 3.2. The cross-sectional area of skinned fibres
isolated from 10-wk rats was significantly larger than the cross-sectional area of
skinned fibres isolated from 4-wk rats. Furthermore, the cross-sectional area of 21-wk
skinned fibres was significantly greater than that for skinned fibres of all the other age
groups examined in this study (i.e. 4-wks, 8-wks, 10-wks, and 15-wks). Because fibres
of 21-wk rats also performed significantly better with respect to the 75%R-D parameter
than fibres of all the other age groups exammed (see above & Figure 3.3B), the
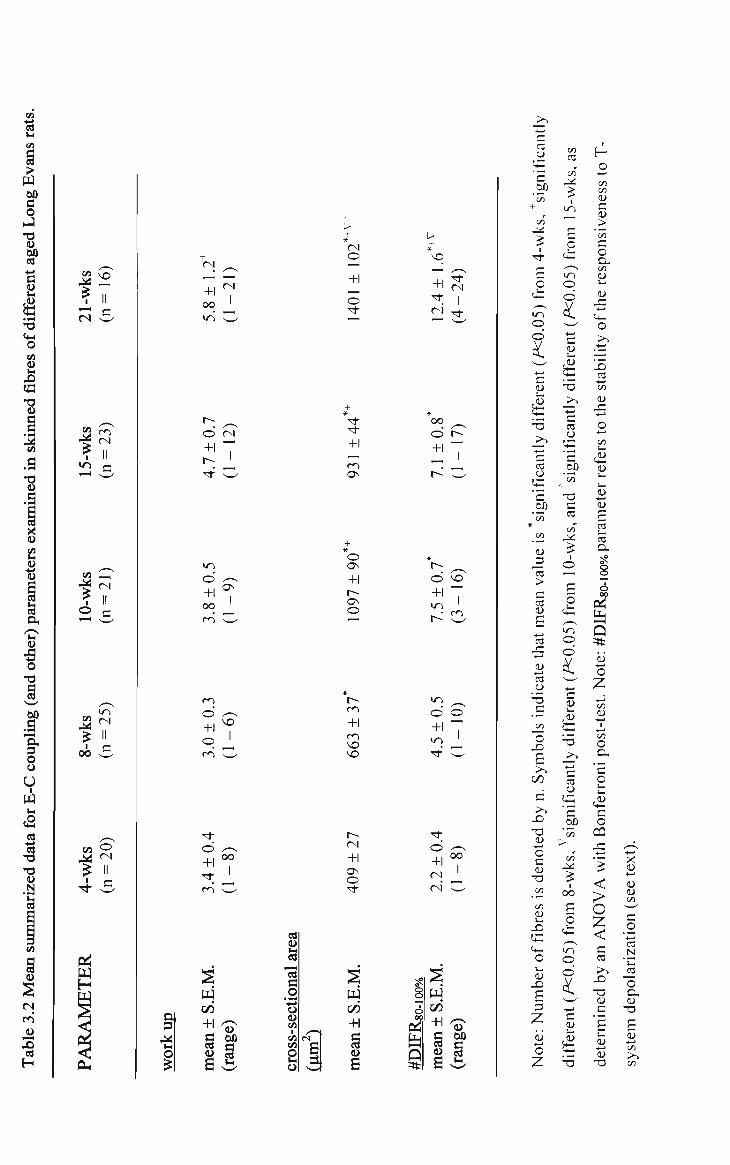
CA
13 >.
J2 ^
^ II
> II
i/a
00
Vi
t I
o (N
+ (N
+1 0 0 i n
CN
I
O fM
+17
«n o +1 00
ON
o +1 o
VO
o +1 00
1
s w
mea
n +
S.
(ran
ge)
B
> + *(N 0
+1 0 ^
l> +
^
+1 TT
ri
+1
as
o OS
+1 OS o
cn +1 m
+1 OS O
c/i +1
I
I
00 ^ ^ O t^
o +1
o
r<l
<0 ^^ O O
+'7
o +1
r i
00 I
-H
i 00
C3 0
?^ •^
sign
+ .-CO
j ^
^ •4
-r—
0
i5)f
r
<=) 0
^
-> c <L> k^
-5 ^ 4 - »
c C3 0
S 'c op
'cn
cn
u _3 "rt >
ii
- ^ - » CC
teth
0
Is i
ndi
mbo
>^ c/) d
X ) - 0 ii 0
; den
i
C/3
fibr
es
^ 0 b . sq
uii
3
Z . 4 . - *
0
z
Vi
cn
1
^O
<— r-
5 ^ / ^ ^ S
i n 0 0
- c ii k>
^ ^ • * "O ^
c re 0 y2
c 00 . ^ H Vi <
T3 C re t/T
^ 1
0 1 - ^
g 0
tS m 0 0
-*-» c
'-5 •4—»
re 0
op '^
[>
cn
1 00
0 .k.<
m 0 0
^ . .
+ j c ii
^ -
1
0
Vi Vi ii C (U > c 0
a. cn <U k>
ii
0 >.
• 4 — •
's> re .4—>
cn ii
0
cn
^ D k H
k H
<u s re re a, 8 3
p? & Q * ii 0 2 Vi ii
+ - • 1
H.H Vi 0
c 0
0 CQ J3 H.H
< >
0 z < c re >>
T3 (U c 1
k H
•a
^^ H . J
ii H-»
(U cn
C _o re N
'Z^ re 0 a. a> - 0
s Vi
>^ Vi
92
relationship between fibre cross-sectional area and fibre run-down was investigated.
Figure 3.5 shows a significant correlation (r = 0.51, P<0.0001) between fibre cross-
sectional area and the number of responses to depolarization attamed prior to 75o/ R-D,
when the data for fibres from all age groups were pooled together.
Stability of responsiveness to T-system depolarization.
As part of the investigation into age related differences in E-C coupling characteristics,
the stability of the responsiveness to T-system depolarization expressed as the number
of consecutive DIFRs within the range 80 to 100% of the maxDIFR (#DIFR«o-ioo%) was
examined. The summarized data presented in Table 3.2 show that fibres isolated from
21-wk rats were able to generate the greatest number of consecutive responses to
depolarization that were larger than 80% of the maximum depolarization-induced
response, and that there were significant differences with respect to the #DIFR«o-ioo%
parameter between fibres from 21-wk rats and fibres from all the other age groups
examined (4, 8, 10 and 15-wks). Significant differences with respect to this parameter
were also observed between both 4 and 10-wk fibres and 4 and 15-wk fibres (Table
3.2).
Discussion
Here, h is reported for the first time that the responsiveness of mechanically
skinned fibre preparations from rat EDL muscle to T-system depolarization varies
with the developmental age of the rat within the range commonly regarded as the
'adult' stage. In agreement with previous findings summarized in Table 1.2 (Chapter
1, page 40), the performance of fibres from rats of a given age is not consistent across
a number of E-C coupling parameters, with fibres of a given age group performing

93
3000n
Number of depolarization-induced responses before 75% run-down
Figure 3.5 Correlation between fibre cross-sectional area and the number of
depolarization-induced force responses obtained before 75% run-down.
The data from 4-wk, 8-wk, 10-wk, 15-wk, and 21-wk fibres were plotted together
regardless of age. Coefficient of determination (r ) = 0.51.
94
well with respect to some (e.g. maximum depolarization-induced force response) but
not other (e.g. 75% mn-down) parameters.
Age related differences in E-C coupling characteristics
Maximum depolarization-induced farce response
In this study, the amplitude of the maxDIFR produced by skinned fibres was
normalised to the respective maxCaF response. This excluded the possibility that the
differences observed in maxDIFR between age groups were due to potential differences
in the force per cross sectional area developed by these fibres (an issue not
specifically investigated as part of this study). As explained in section Parameters
describing skinned fbre responsiveness to T-system depolarization {Chapter 2, page
67), the maxDIFR is determined by the amount of Ca^^ released from and sequestered
by the SR (i.e. the functional competence of the SR) and by the sensitivity to Ca ^ of
94-
the contractile apparatus. In tum, Ca release from the SR is affected by events
occurring at the triad such as depolarization/repolarization of the T-system and signal 94-
transmission between functionally coupled voltage-sensors and Ca release channels.
In this study it was found that the maxDIFR in 4-wk (and 8-wk) fibres was significantly
lower than that in 10-wk, 15-wk, and 21-wk fibres (Figure. 3.3A), which could suggest
94-
that the contractile apparatus in fibres from the younger rats was less senshive to Ca
(and/or that less SR Ca " was released in these fibres). The data showed that the
sensitivhy of the contractile apparatus to Ca^^ was actually higher in 4-wk fibres as
compared to 10-wk fibres (see Resuhs), indicating that the smaller DIFRs developed
by fibres from the youngest rats are more likely to be related to less SR Ca release.

95
As reviewed in Chapter 1 (see Aspects of postnatal development of rat skeletal muscle
relevant to the E-C-R cycle, page 32), it appears that by -A-6 wks postnatal, the
organization of the T-system and SR and the amount/structure of the major proteins
involved in Ca " release from the SR (i.e. voltage-sensors and Ca^^ release channels)
are essentially the same as those in aduh muscle (Chaplin etal, 1970; Edge, 1970;
Kyselovic etal, 1994; Pereon etal, 1993). In other words, the resuhs of these studies
suggest that the components involved in E-C coupling, which are responsible for SR
94-
Ca release, should be functionally competent by 4-6 wks of age. This is not
confirmed by the results presented here, which show that the maxDIFR (a ftmctional
parameter of E-C coupling) was much lower in 4- and 8-wk fibres than that in 10-wk,
15-wk, and 21-wk fibres. The poor performance of the 4- and 8-wk fibres may have
been related to (i) ineffective depolarization/repolarization of the T-system
(compounded by differences in T-system membrane potential), (ii) ineffective signal
transmission from the voltage-sensors to the Ca^^ release channels (due for example to
a smaller number of fimctionally coupled voltage-sensor/Ca ^ release channel units), 94-
and (iii) differences in the amount of Ca released from the SR and the events
involved thereafter. Regarding the first possibility, h is noteworthy that according to
Conte Camerino etal (1989) the resting Em may not reach 'aduh' values until 10 wk
postnatal (see Table 1.2 in Chapter 1, page 40). Differences in the ability of the T-
system membrane to seal (following mechanical skinning) and/or differences in the
lipid composition of the T-system membrane cannot be ruled out as whole or partial
contributors to the disparity in the maximum depolarization-induced response. Such
differences may also account for the relatively large number of/zFfibres (10/30)
obtained from 4-wk rats compared to that obtained from each of the other age groups
investigated (see Results).

96
Run-down
As already mentioned in Chapter I (see Parameters describing skinned fbre
responsiveness to T-system depolarization, page 67), the exact cause of the run-down
phenomenon observed in mechanically skinned fibre preparations, in which the
contractile response is induced by T-system depolarization, is currently not well
understood. It has been suggested that this phenomenon is related to the use-
dependent loss of some factor (Lamb and Stephenson, 1990a). If this were the case,
one might expect that the loss of such a factor would occur by diffusion and therefore
that the time course of run-down (as indicated by the number of responses developed
by a fibre to mn-down) would be related to the cross-sectional area of the fibre. This
study showed a good correlation (r = 0.51; Figure 3.5) between the number of
responses attained by a skinned fibre before 75o/<R-D and the fibre cross-sectional area.
While not directly confirming the theory of Lamb and Stephenson (1990a), our result
is consistent with the hypothesis that the loss of responsiveness to T-system
depolarization of the skinned fibre preparation involves a process of diffiision.
The results show that the run-down state was reached substantially faster with fibres
obtained from 4-wk rats than with fibres obtained from 21-wk rats, ft is worth noting
that unlike maxDIFR, the values of the 75%R-D parameter had not levelled off by
21 wks. This resuh would not be surprising if fibre diameter played a major role in the
75%R-D parameter because according to Alnaqeeb & Goldspink (1986) rat EDL fibres
continue to increase in diameter up to the age of 27 wks. It must however be pointed
out that age related difference in 750/.R-D found in this study can not be fully explained
by developmental differences in EDL fibre diameter, given that the coefficient of

determination (r ) for the relationship between fibre cross-sectional area and run-down
was 0.51. Thus, functional differences, as well as size differences, in mechanically
skinned fibre preparations may explain the age related differences in 75«/.R-D reported
here.
Methodological comments
The parameters most commonly examined so far in studies concemed with the
mechanism/regulation of E-C coupling in skeletal muscle using the Lamb and
Stephenson method (1990a) include the amplitude of the maximum depolarization-
induced force response, and the number of responses to T-system depolarization
obtained before the response declined to a given value relative to the maximum
depolarization-induced response. When considering both these parameters, the best
performing fibres were isolated from 21-wk rats.
In this study, a new parameter was introduced, viz. the number of consecutive
responses with amplitudes between 80 and 100% of the maximum depolarization-
induced response (#DIFR8o-ioo%)- This parameter should be of particular benefit in
studies where the effects of drugs or altered myoplasmic conditions on depolarization-
induced force responses developed in mechanically skinned fibre preparations are
examined by bracketing 'test' responses (produced in the presence of the desired
drug/condition) with 'control' responses (e.g. Blazev 8c Lamb, 1999).
If one assumes that the minimum number of consecutive DIFRs (whose amplitudes are
greater than 80% of the maxDIFR) required for accurately determining the effect (and
reversibility) of a drug on these responses is 6-7 (so that a combination of control-
98
test-control sequences can be carried out), then it is clear from the results obtained in
this study that skinned fibres isolated from 4- or 8-wk LE rats would be inadequate.
Furthermore, while it is apparent that skinned fibres isolated from 10- and 15-wk LE
rats would be satisfactory for such studies (e.g. see Figure. 1 in Blazev & Lamb,
1999), it is also evident that the usefulness of these fibres would be limited in studies
where a greater number of depolarization-induced force responses in the range 80-
100% (of maxDIFR) was needed (e.g. see Figure. 3 in Blazev & Lamb, 1999).
Therefore, skinned fibres isolated from 21-wk LE rats (where on average -12
consecutive responses to depolarization >80% of the maxDIFR were obtained) would
be the most suitable choice.
In summary, this study has shown that mechanically skinned fibres from 21 wk old rats
were the most responsive to T-system depolarization as indicated by the three main E-
C coupling parameters examined (maxDIFR, 75%R-D, #DIFR8o-ioo%), while fibres from
4 wk old rats were the least responsive. By comparison, fibres from 10 wk old rats
performed as well as 21 wk fibres with respect to maxDIFR but not with respect to
75%R-D or #DIFR«o-ioo%-

99
Chapter 4
MHC-BASED FIBRE TYPE AND RESPONSTVENESS TO T-
SYSTEM DEPOLARIZATION IN RAT MECHANICALLY SKINNED
MUSCLE FIBRES
Introduction
In recent years, intense efforts have been directed towards the functional characterization
of the contractile apparatus in single muscle fibres expressing specific MHC isoforms.
These studies, in which MHC isoform analyses and determination of contractile
parameters were carried out in the same fibre segment, have produced compelling
evidence that the MHC isoform expressed in a single muscle fibre is a major determinant
of maximum shortening velocity (Weiss et al, 2001), maximum power output (Bottinelli
etal, 1991), optimal velocity of shortening (Bottinelli etal, 1996), rate of tension
development (Harridge etal, 1996), rate of ATP consumption (Szentesi etal, 2001),
Po/CSA (Geiger etal, 2000) and stretch activation properties (Galler etal, 1994).
Because of the central role played by MHCs in muscle contractile performance and their
relative abundance, MHC isoform expression (as detected by high resolution
polyacrylamide gel electrophoresis or by immunohistochemistry) has become the method
of choice for classifying skeletal muscle fibre types into distinct functional groups (for
reviews see Bortolotto & Reggiani, 2002; Moss etal, 1995; Stephenson, 2001).
100
To date, very little is known about the E-C coupling characteristics (involving the T-
system and SR compartments) of different MHC-based fibre types. Qualitative molecular
differences have been shown to exist between rodent EDL (containing predominantly fast
fibre types) and SOL (containing predominantly slow fibre types) muscles, with varying
amounts of cardiac aic -DHPR/voltage sensor isoform (Froemming etal, 2000; Pereon
etal, 1998), slow calsequestrin isoform (Damiani & Margreth, 1994) and neonatal Ca ^
release channel/RyR3 isoform (Bertocchini etal, 1997) being found in adult SOL
muscles but not in EDL. Studies using whole muscles or untyped single fibres have
demonstrated functional and stmctural differences between rat EDL and SOL with
respect to calcium transients (Delbono & Meissner, 1996; Eusebi etal, 1980),
DHPR'voltage sensor density (Lamb & Walsh, 1987), number of SR RyR/calcium
release channels functionally coupled to T-tubular DHPR/voltage sensors (Delbono &
Meissner, 1996), voltage dependence of DHPR/voltage sensor activation and inactivation
(Chua & Dulhunty, 1988) and SR volume (Cullen etal, 1984). Given the diversity of
MHC-based fibre types that make up most commonly used mammalian skeletal muscles
(including rat EDL and SOL) and the complexity ofMHC isoform expression displayed
by a large proportion of individual fibres (for review see Stephenson, 2001), h is clear
that the methodological approaches using whole muscles or single fibres of unknown
MHC composhion cannot be used to answer the question of whether E-C coupling
chaiacteristics differ between MHC-based fibre types. So far there have been no studies
examining the E-C coupling characteristics and MHC isoform composition in the same
fibre segment.
101
As already stated in the Introductory chapter, currently the most efficient strategy for
probing events spanning between T-system depolarization and force production in a
single fibre involves the use of mechanically skinned fibre preparation and the
experimental protocol for T-system system depolarization-induced activation of
contraction developed by Lamb & Stephenson (1990a). Recently the Alanine-SDS
PAGE method developed by Nguyen and Stephenson (1999 & 2002) was further refined
to enable MHC analysis in rat single muscle fibre segments with a high degree of
reproducibility. In the present study these two methods were combined to examine the E-
C coupling characteristics and MHC isoform composition in single fibre segments from
two predominantly fast-twitch, but functionally different muscles (EDL and the white
region of stemomastoid, SM), and one predominantly slow-twitch (SOL) muscle.
Materials and methods
Animals and muscles
Based on the results of the study described in Chapter 3 the rats used in this study were
aged between 20 -21 wks. Muscle (EDL, SOL and SM) were carefully removed and
handled as described in Chapter 2. The SM muscle has two distinct regions, red and white
(Dulhunty & Dlutowski, 1979; Gottschall etal, 1980). Both regions are considered fast
twitch (Luff, 1985), but for comparison with the fast twitch fibres isolated from the white
EDL muscle, single SM fibre segments were isolated from the white region only.
102
Mechanically skinned single fibre preparations and T-system depolarization experiments
Mechanically skinned fibre segments were prepared and then dimensions measured as
described m Chapter 2. AQ T-system depolarization experiments were carried out at room
temperature (20-25 ° C) as described in Chapter 2.
Skinned fbre solutions
All solutions were as described in Chapter 2
Myosin heavy chain analysis
Sample preparation
After the completion of the depolarization-induced activation protocol, single fibre
segments (volume range 1.0 - 8.8 nl) were removed from the force measuring apparatus
and placed in 12 pi of solubilising buffer composed of 62.5 mM Tris, 2.3 % (w/v) SDS, 5
% (v/v) P-mercaptoethanol, 12.5 % (v/v) glycerol, 13.6 % (w/v) sucrose, 0.01 % (w/v)
Bromophenol blue, 0.1 mM phenylmethylsulfonyl fluoride, 2 pM leupeptin , and 1 pM
pepstatin. Fibre segments were incubated at room temperature for 24 hours and then
boiled for 5 minutes and finally stored at -80°C.
Electrophoretic set up
All gels were prepared manually using 10 x 10.5 cm glass plates, 0.75 mm spacers and
the SE 235 multiple gel caster (See Figure. 4.1 A). The alanine SDS-PAGE protocol used
in this study is a slightly modified version of the protocol developed for separating MHC
isoforms expressed in toad skeletal muscle (Nguyen & Stephenson, 1999 & 2002). The

103
Back block
Pressure bat
B
Positioning tabs
SE 260 ^
lower buffer chamber
Silicone rubber gaskets (2 on each side: 1 while uo(ler.fl«shBt and 1 black over.gaskat)
Casting cradle
Casting damp assembly (2)
Cams (4) PUI cams out to disas-semlJle the caster
Co(or.<oded leads (2)
Safety (id
Upper buffer chamber core
Silicone rubber gaslcet
Spring damps (•<)
Coolant inlet port
Figure 4.1. Electrophoresis equipment. A. Gels were prepared using the SE 235 multiple
gel caster. B. Gels were run in the SE 260 electrophoresis setup connected to a power
supply, (reproduced from Hoefer Gel Electrophoresis Unit instmctions).

104
separating gel [total concentration of monomer (T) = 7.6 %; concentration of cross-linker
relative to T (C) = 1.2 %] which contained 425 mM Tris pH 8.8, 30 % (v/v) glycerol, 75
mM alanine, 0.3 % SDS (w/v) was prepared in a glass conical flask and polymerized with
0.05 % (w/v) ammonium persulfate and 0.075 % (v/v) TV, N, N\ N\-
tetramethylenediamine. Once poured, the gel was overlayed with mnning buffer (see
below) and allowed to set overnight. The stacking gel (T = 4 %; C = 2.6 %) which
contained 125 mM Tris pH 6.8, 40 % (v/v) glycerol, 4 mM EDTA, 0.3 % (w/v) SDS and
polymerized with 0.1 % (w/v) ammonium persulfate and 0.05 % (v/v) N, N, N\ N\-
tetramethylenediamine, was poured and allowed to set for 2 hours with a 15-well comb
inserted in the top. Once set and the comb removed, thin strips of filter paper were
inserted into the wells to remove any excess unpolymerized polyacylamide solution.
After cleaning, the wells were filled with mnning buffer. The mnning buffer containing
175 mM Alanine, 25 mM Tris and 0.1 % (w/v) SDS was freshly prepared and preceded
at 4 "C before use. After loading the sample into the wells, gels were mounted into the
SE 260 electrophoresis setup (see Figure. 4.IB) and mn for 26-27 hours at 4-6 °C at
constant voltage (150 V).
Staining of polyacrylamide gels
The gels were stained with Bio-Rad Silver Stain Plus and MHC bands were analyzed
using a Molecular Dynamics Personal densitometer and ImageQuaNT software (Version
4.1; Molecular Dynamics).
105
Statistics
All resuhs are presented as means and standard error of the mean (M + SEM). Student's
two-way t-test (GraphPad, Prism) was used for comparisons between two groups.
Significance was set at /*< 0.05.
Results
Profiles of T-system depolarization induced force responses developed by
electrophoretically typed single fbre preparations from EDL, SM and SOL
Profiles of T-system depolarization induced force responses (a qualitative descriptor of E-
C coupling) developed by electrophoretically typed single fibre preparations from EDL,
SM and SOL are shown in Figures 4.2, 4.3 and 4.4. A total of 58 mechanically skinned,
single fibres from EDL (8), SM (18) and SOL (32) muscles were subjected to T-system
depolarization by rapidly substituting K^ with Na^ in the Depolarizing solution. Under
the conditions used in this study, the fibres produced three types of T-system
depolarization-induced force responses: rapid transient responses {rtF) where force
retumed to a level equivalent to <10 % of the peak within 2 -3 sec (Figure. 4.2),
prolonged responses (/3!F;Figure.4.3A) where force remained higher than 10 % of the
peak even when, as shown in Figure. 4.3B, the fibre was kept in the depolarizing solution
for as long as 13 sec and no detectable force responses {nF; Figure. 4.4). Based on the
profile of the maximum T-system depolarization-induced response developed by the fibre
preparations examined, three groups of fibres were identified: fibres producing rtF
responses (/tFfibres), fibres producing/Jifresponses (p'/'fibres) and fibres that did not
develop detectable force responses even after 4 - 6 successive depolarization

106
Na+ DIFR
Figure. 4.2. An example of a rapid transient force {rtF) response developed by a type IIB
EDL muscle fibre.
Time scale: 2 seconds during Na^ depolarizations and lowMg^^ responses, and 30
seconds elsewhere.

107
A maxCaF
i
Na+ ,DIFR LMg^
B
>CaF
Na+
0.06 mN | _
2 or 30 sec
LMg'^
0.06 mN [_
2 or 30 sec
ixCaF
J-—L_jy~^~i_jy^-i_ Na+ vDIFR LMg 2+

108
Figure. 4.3 Sample force responses produced by soleus fibres.
(A) An example of prolonged force {pF) responses developed by type 1 SOL fibres. (B)
An example of a joFresponse developed by a SOL fibre subjected to prolonged (~ 13
sees) depolarization. (C) An example of the force response, developed by a SOL fibre,
changing from/7/'to /tFduring the work-up period. Time scale: 2 seconds during Na^
depolarizations and low Mg^^ responses, and 30 seconds elsewhere.

109
0.06 mN I
2 or 30 sec
1 2 3 4 5 I h ^ f^ « f> k h II h
Na+
xCaF
LMg 2+
Figure. 4.4 An example of a trace from a soleus fibre that produced no force {nF) in
response to T-system depolarization.
Time scale: 2 seconds during Na" depolarizations and low Mg " responses, and 30
seconds elsewhere.

110
/repolarization cycles (22F fibres). In this study, only fibres displaying rtF and pF
responses were subjected to analyses of quantitative E-C coupling characteristics.
The type (based on MHC composition) of fibres dissected from EDL, SM and SOL
muscles and the profiles of the force responses produced by T-system depolarization in
these fibres are summarized in Table 4.1. Also shown in Table 4.1 are the low Mg'*-
induced force responses developed by rtF and pFfihres post mn-down and by /zFfibres
after failing to respond to 4 - 6 successive depolarization/repolarization cycles. In Figure
4.5 are shown representative electrophoretograms of the four fibre type groups examined
in this study comprising more than one fibre. It is important to note that, the number of
Sol fibres displaying/rFprofiles (11) was large enough to validate their treatment as a
separate group. However, only the data collected for 3 of these fibres were complete, and
thus only these fibres were considered for further quantitative analyses. As shown in
Figure 4.2C, three SOL fibres (two type 1 and one type I/lIA) initially developed 7?i< type
force responses, but by the end of the work-up period these responses had changed into
rtF-tfpe responses.
Relationship between quantitative E-C coupling characteristics.
The two quantitative E-C coupling characteristics examined in this study are the maxDIFR
and 75o R-D (for full definition of these parameters see Parameters describing skinned
fibre responsiveness to T-system depolarization. Chapter 2, page 67).

I l l
Table 4.1. Profiles of T-system depolarization mduced force responses and the magnitude
of low Mg " -induced force responses developed by electrophoretically typed smgle fibre
preparations from EDL, SM and SOL.
Low Mg induced force response (% max. Ca -
activated force)
Muscle of origin
MHC isoform based fibre type
Profile of T-system depolarization induced force
response
EDL
SM (white region)
IIB (8)
IIB (15)
Rapid transient (8; 100%)
Rapid transient (13; 86.7%)
No response (2; 13.3%)
77.1 ±3 .3% (8)
91.1 ±2.4 %(13)
100 %(1)
IIB/D (3) Rapid transient (3 ; 100%) 88.5 ± 8.2 % (3)
SOL 1(25) Rapid transient (5; 20%)
Prolonged (11; 44%)
No response (9; 36%)
77.8 ± 4.4 % (5)
72.8 ±5.1 %(3)
70.2 ± 4.7 % (9)
I/nA(6)
IL\(1)
Rapid transient (4; 66.7%)
No response (2; 33.3%)
No response (1; 100%)
59.9 ± 6.8 % (4)
67.7 ± 0.3 % (2)
59.4 % (1)
Note: The number of fibres and the proportion for each category is indicated in brackets.
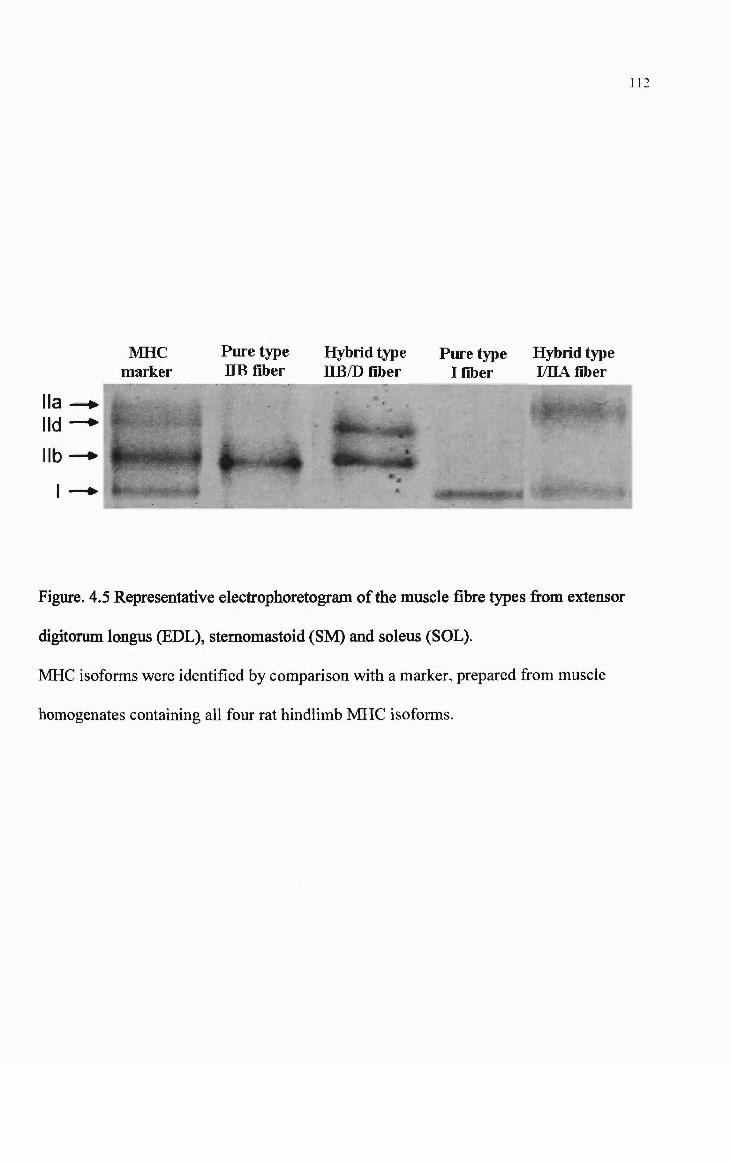
112
MHC marker
Pure type HE fiber
Hybrid type HB/D fiber
Pure type I fiber
Hybrid type I/HA fiber
lla lid
lib
I
Figure. 4.5 Representative electrophoretogram of the muscle fibre types from extensor
digitorum longus (EDL), stemomastoid (SM) and soleus (SOL).
MHC isoforms were identified by comparison with a marker, prepared from muscle
homogenates containing all four rat hindlimb MHC isoforms.

113
The data obtained show (Figure. 4.6) no correlation between niaxDIFR and 750/JR-D for
pure type IIB fibres from EDL (r = 0.19; p = 0.2758; n = 8; top panel) and SM (r = 0.20;
p = 0.1458; n = 13; middle panel), and for pure type 1 fibres from SOL (r = 0.02; p =
0.7587; n = 8; bottom panel). This suggests that in these fibres the intracellular
process(es) responsible for the use-dependent loss of contractile responsiveness to T-
system depolarization is/are in large part independent of the factors determining the size
of the maximum DIFR. In this analysis fibre type groups IIB/D (SM; n = 3) and I/IIA
(SOL; n = 4) which comprised fewer than eight fibres were not included.
Quantitative E-C Coupling characteristics in electrophoretically typed single fibres from
EDL, SM and SOL.
In this study maxDIFR and 750/JR.-D were compared in: (i) fibres of the same type from
different muscles (type IIB EDL fibres vs type IIB SM fibres), (ii) different fibre types
from different muscles (type IIB EDL fibres and type IIB SM fibres vs type 1 SOL
fibres), (iii) different fibre types (hybrid vs pure) from the same muscle (type IIB/D SM
fibres vs type IIB SM fibres; type I/IIA SOL fibres vs type I SOL fibres) and (iv) fibres
of the same type from the same muscle (type 1 SOL fibres).
Type llB EDL fibres vs type IIB SM fibres.
As show n in Figure 4.7A, the mean value of maxDIFR for type IIB fibres from EDL (84.0
% ± 6.0) was not different from that for IIB SM fibres (78.8 % ± 2.9). By comparison the
mean value of 750/Jl-D for IIB SM fibres (20.0 ± 2.9) was significantiy lower than that for
IIB EDL fibres (98.6 ± 20.1) (Figure. 4.7B). The inter-fibre variability (coefficient of
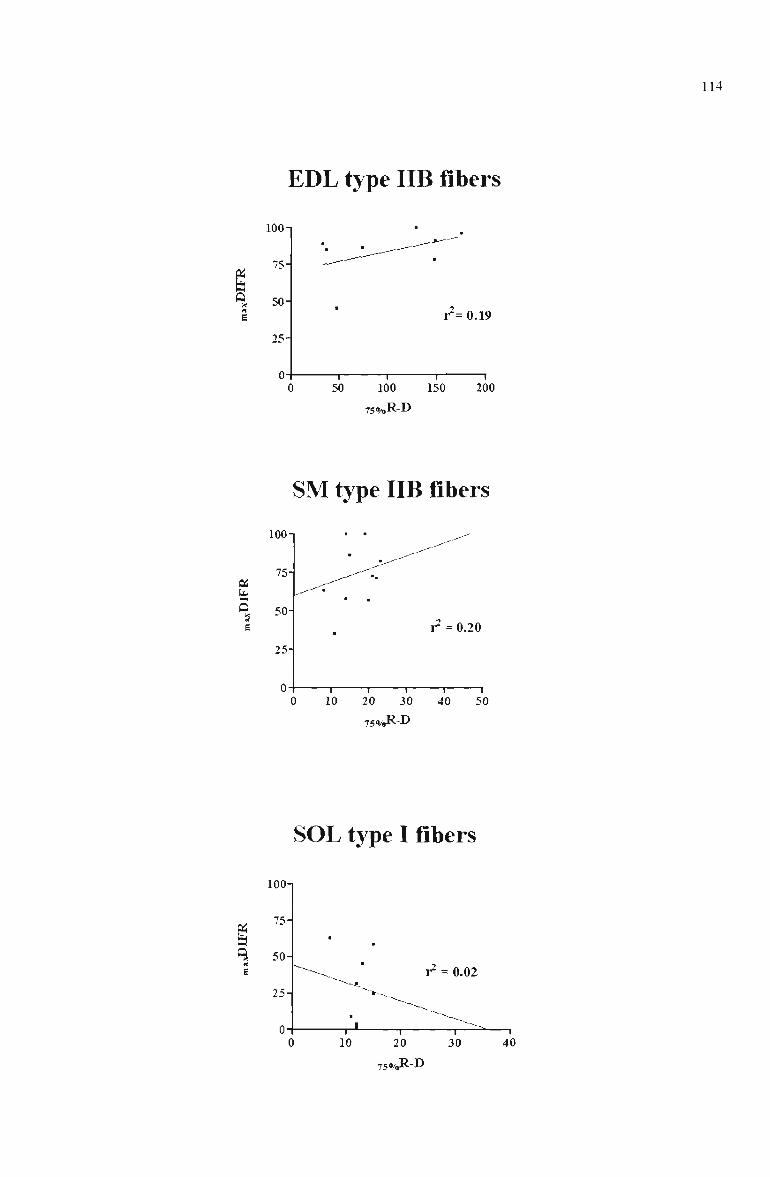
114
EDL type IIB fibers
100-
75-
O. 50H ft
g 25-
r=o.i9
1 1 1 1
0 50 100 150 200
75«M,R-D
SM type IIB fibers
100
75-
50-
25-
1^ = 0.20
1 1 1 1 1 0 10 20 30 40 50
75 <M^-B
SOL type I fibers
e s
lOOn
75-
50-
25-
0-C
^~-~^^ ' i^ = 0.02
• ~- -1 1 1
1 10 20 30 1
40
75 - D

11:
Figure. 4.6 Relationship between maxDIFR and 75 % run-down (750/Jl-D) for type IIB
EDL fibres {? = 0.19), type IIB stemomastoid (SM) fibres {? = 0.20), and type I SOL
fibres (r = 0.02).
116
variation; CV) with respect to the two E-C couplmg characteristics considered was 20.2
% (maxDIFR) and 57.6 % (75%R-D) for IIB fibres from EDL muscle and 26.7 % (maxDIFR)
and 53.5 % (75%R-D) for IIB fibres from SM muscle.
Type IIB EDL and type IIB SM fibres vs Type I SOL fibres.
Figure 4.7 also shows maxDIFR (Figure. 4.7A) and 75%R-D (Figure. 4.7B) values for type 1
SOL fibres. These fibres displayed significantly lower values than pure type IIB EDL
fibres for both maxDIFR (Figure. 4.7A) and 75%R-D (Figure. 4.7B). As seen in
Figure.4.7A, pure type I SOL fibres produced also significantly lower maximum
depolarization-induced force responses (Figure. 4.7A) than pure type IIB SM fibres.
However, while the number of responses to 75 % run-down developed by type I SOL
fibres was lower (1.7 times) than that of IIB SM fibres, this difference just failed to reach
statistical significance (/*= 0.0529) (Figure. 4.7B). The CV for the two E-C coupling
characteristics in SOL fibres was 81.2 % (for maxDIFR) and 20.7 % (for 75%R-D).
Type IIB/D SM fibres vs type IIB SM fibres; type I/IIA SOL fibres vs type I SOL fibres.
A comparison of the small group (n = 3) of hybrid HB/D SM fibres with the pure type IIB
SM fibres (n = 13) showed no significant difference with respect to either maxDIFR (78.8
± 5.8 vs 95.1 ± 3.9) or 750/oR-D (20.0 ± 2.9 vs 26.0 ± 8.1). Taken together with the data
presented in the previous section this fmding could indicate that, under the conditions
used in this study, mechanically skinned rat muscle fibres containing type II MHC
isoforms are more responsive to T-system depolarization than fibres expressing MHCI
isoform. Contrary to this conclusion, the four I/lIA hybrid SOL fibres examined here, all

117
lOOn
75-
9c 50-
25-
0-
(8)
1 (13)
' ' ' '
(8)
EDL IIB SM IIB SOLI
B
125n
100-
9 75
m
50
25-
*
(8)
(13) (8)
EDL IIB SM IIB SOL I
Figure. 4.7 (A) The ampUtude of the maximum depolarization induced force response
(maxDIFR; expressed as a % of the maximum Ca ^ activated force) for type IIB EDL, type
nB stemomastoid (SM) and type I SOL mechanically skinned muscle fibres. #
significantiy different from EDL and SM fibres (P < 0.001). (B) The number of
depolarization mduced force responses to 75 % run-down (750/Jl-D) in type IIB EDL, type
n s stemomastoid (SM) and type I SOL mechanically skinned muscle fibres. *
significantiy different from SM (p < 0.01) and SOL (p < 0.001).

118
of which contained a larger proportion (mean = 72.5 %) of type Ila MHC isoforms were
not significantly different from the pure type I SOL fibres (n = 8) in regards to either
maxDIFR (23.1 % ± 12.8 vs 29.8 % ± 8.5) or 75%R-D (10.3 ± 0.6 vs 12.1 ± 0.9).
Type I SOL fibres.
This analysis was applied to five pure type I SOL fibres producing rapid transient force
responses and three fibres producing prolonged responses to T-system depolarization. A
comparison of the E-C coupling characteristics in the two groups of type I SOL fibres
showed that /tf^fibres did not differ significantly from the joFfibres with respect to either
maxDIFR (34.0 % ± 8.5 vs 22.9 % ± 19.9) or 75%R-D (13.2 ± 0.8 vs 10.3 ± 1.7). To
determine whether the prolonged elevated force responses developed by the />Ffibres
were artifacts due to contaminating Ca in the depolarizing solution that would directly
activate the contractile apparatus, pF&ores were incubated in a 2 % Triton/K"^-HDTA
solution (to dismpt the t-tubular and SR membrane systems and abolish E-C coupling) for
10 mins after obtaining maximum Ca^^ activated force, washed in a Triton free K^-HDTA
solution and then exposed to the depolarizing solution. Under these conditions, no force
was developed by any of the pF&ores, indicating that contaminating Ca was not
responsible for the prolonged profile of the force responses (data not shown).
Discussion
This is the first systematic investigation, at a single fibre level, of the relationship
between functional parameters of the T-system and SR compartments and MHC-based
fibre type in mammalian skeletal muscle. More specifically, this study was undertaken to

119
address the question of whether E-C coupling characteristics, measured in a mechanically
skinned fibre preparation, are correlated to the MHC isoform(s) expressed in the same
fibre segment. The experimental strategy involved the use of single muscle fibres from
one predominantly slow-twitch (SOL) and two predominantly fast-twitch, but
functionally distinct, muscles (EDL and white region of SM) of the adult rat.
maxDIFR and MHC-based fibre type
The maxDIFR values found in the present study for mechanically skinned IIB fibres from
rat EDL muscle relative to maximum Ca ^ activated force (84.0 %) are similar to those
reported for rat EDL fibres in previous investigations (70 - 90 %) using the same kind of
preparation and experimental protocol (e.g. Lamb & Stephenson, 1991). In the present
study, maxDIFR was also determined in fast-twitch fibre preparations from the white
region of rat SM (Luff, 1985), a predominantly fast-twitch skeletal muscle not used in
previous investigations of E-C coupling processes in mechanically skinned fibre
segments. Interestingly, under the same conditions of T-system depolarization, IIB SM
fibres also produced high force responses (78.8 %) that were not statistically different
from IIB EDL fibres. While the membrane potential was not measured in any of the
single fibres examined in this study, the relatively large depolarization induced force
responses (compared to maxCaF) elicited in EDL and SM type IIB fibres suggest that in
these preparations rapid replacement of K^ with Na^ achieved near maximal
depolarization of the T-system membrane (Lamb & Stephenson, 1990a).
120
Slow-twitch fibres are known to be more sensitive than fast-twitch fibres to membrane
depolarization (Dulhunty & Gage, 1983), and to have a higher SR luminal [Ca" "] (Fryer
& Stephenson, 1996). Furthermore, the contractile apparatus in slow-twitch fibres is more
sensitive to activating levels of Ca than that in fast-twitch fibres (Stephenson &
Williams, 1981). In spite of these factors which favour the production of force,
mechanically skinned pure type I slow-twitch SOL fibres gave consistently smaller
responses (29.8 ± 8.5 % of maxCaF, n = 8) to t-tubule membrane depolarization than the
type IIB fast-twitch fibres from EDL and SM. This result is in agreement with the
preliminary data of Stephenson etal. (1998) and with two studies in which mechanically
skinned rat soleus fibres were used to investigate the effects of clenbuterol (Bakker etal,
1998) and hydrogen peroxide (Plant etal, 2002) on E-C coupling parameters. The value
found in the present study for the maxDIFR of SOL fibres (29.8 %) is lower than that
reported by Plant et al (47 ± 5 %, n = 5) (Plant et al, 2002) but higher than that reported
by Stephenson e/'a/(10 ± 4.5 %, n = 8) (1998), while Bakker etal (1998) did not report
the relative size of the SOL force responses.
The smaller responses produced by the type I slow-twitch fibres to T-system
depolarization could be partly explained by the lower proportion of DHPRs functionally
coupled to SR Ca ^ release channels (resuhing in less Ca^^ released upon depolarization;
Delbono 8c Meissner, 1996) and by the slower rate of Ca ^ release (Eusebi etal, 1980)
previously reported for SOL fibres. Other potential contributors include incomplete
sealing of the t-tubules post-skinning and ineffective depolarization/repolarization of the
T-system. From the data obtained from an extensive series of experiments, performed on

121
skinned fibre preparations from toad and rat in which fluorescent dyes were trapped
within the T-system (Launikonis & Stephenson, 2002, and personal communication),
Launikonis & Stephenson concluded that in all fibres (both fast and slow-twitch)
mechanically skinned by the procedure used in this study, the T-system is invariably and
uniformly sealed. This finding supports the possibility that, under the conditions used in
this study, T-system depolarization and/or repolarization in slow-twitch type I fibres is
less effective than in fast-twitch IIB fibres. This may be due to subtle fibre type specific
differences in stmcture/function of the molecular components of the T-system, such as
for example, Na^/K^ ATPase. To date no studies have quantified the number, density or
activity of Na^/K^ pumps located in the t-tubule compartment of electrophoretically typed
single fibres from slow- or fast-twitch muscle.
7sy^-D and MHC -based fibre type
This study is the first to compare the number of DIFRs to mn-down in fibres expressing
the same MHC isoform from two different muscles. The data show that T-system
depolarization induced force responses developed by type IIB fibres from the SM muscle
declined 4.9 times faster than those developed by type IIB EDL fibres. This resuh is
surprising, given the similarity displayed by IIB EDL and IIB SM fibres with respect to
maxDIFR.
Here it was also shown that the T-system depolarization induced force responses
developed by fibres expressing MHC I isoform from the SOL muscle decline faster than
those developed by fibres expressing MHC lib isoform from EDL (8.1 times) and SM
122
(1.7 times) muscles. This resuh is in agreement with the data of Plant etal (2002) who
reported that SOL fibres, classified as slow-twitch on the basis of the sensitivity of the
7-1-
contractile apparatus to strontium (Sr ), produced 2.9 times fewer responses to mn-down
than fast-twitch EDL fibres.
Within the framework of the previously discussed mechanisms involved in the mn-down
phenomenon (Lamb & Stephenson, 1990a), the differences in 75o R-D observed between
type IIB fibres from EDL and SM muscles and between the type 1 (SOL) and type IIB
(EDL & SM) fibres indicate that the processes associated with the use-dependent loss of
E-C coupling in mechanically skinned fibre preparations may be both muscle of origin-
specific and muscle fibre type-specific. It is unlikely that mn-down in either of these fibre
groups was related to SR dysfunction or depleted SR Ca^^ as the responses to low Mg'^
produced by these fibres (see Table 4.1) were relatively large (>70 % of maxCaF).
EDL muscle fibres and the T-system depolarization/repolarization protocol described
here have been used in several studies for determining the effects of particular
compounds on E-C coupling (e.g. Bakker etal, 1998; Blazev etal, 2001; Dutka &
Lamb, 2000). After the 'work up' period (see Methods for definition), test responses
produced by the fibre preparations, when exposed to depolarization/repolarization
solutions containing the compound of interest, are preceded and followed ('bracketed')
by control responses (i.e. responses produced in the absence of the compound of interest).
The sensitivity of this method is determined in large part by the number and amplittide of
successive responses of similar height developed by a fibre between the end of the 'work
123
Up' process and the onset of the mn-down process. Given the relatively small number of
total responses (12.1) to mn-down found by us in mechanically skinned type I SOL
fibres, it is reasonable to suggest that in its current form, the protocol developed by Lamb
& Stephenson (1990a) may not be suitable for accurately determining the magnitude and
reversibility of effects of particular compounds on E-C coupling characteristics in slow
twitch fibre preparations.
Pro fie of T-system depolarization induced force responses produced by mechanically
skinned fibres fom EDL, SM and SOL muscles.
All previous studies using the T-system depolarization method of Lamb & Stephenson
(1990) and mechanically skinned single fibre segments have reported only rtFXype
depolarization induced force responses for both rat EDL (e.g. Lamb & Stephenson,
1990a; Plant etal, 2002) and SOL fibres (e.g. Bakker etal, 1998; Plant etal, 2002).
Under the same conditions, the fibres examined in the present study produced, however,
two different types of responses, rtF and pF{%ee Results for definition), or did not
respond even after several depolarization/repolarization cycles. The lowest variability
with respect to the profile of force responses induced by T-system depolarization was
found among type IIB EDL fibres, all of which developed only .rtFresponses. By
comparison, while the majority of type IIB SM fibre produced also /fFresponses, a small
proportion (13.3%) failed to respond. The highest variability with regard to this
parameter was found in the population of type I SOL fibres, which contained a small
proportion of fibres producing typical / t f responses, a small proportion of fibres
producing/jiFresponses and a large proportion of fibres that did not develop any force.

124
Taken together, these data suggest that, under the conditions used here, the profile of T-
system depolarization induced force responses produced by mechanically skinned muscle
fibre preparations is related to fibre type, muscle of origin and even individual fibre
characteristics.
The finding that some SOL muscle fibres developed rapid transient forces (indicating
complete inactivation) while others developed prolonged forces (indicating incomplete
inactivation) in response to T-system depolarization provides the strongest support to date
for the 'voltage window' model put forward in an earlier study by Chua & Dulhunty
(1988). According to this model, the activation and inactivation curves for a given muscle
preparation overlap to some extent thereby creating a 'window' like area, the size of
which is related to the dependence of the activation and inactivation processes on the
membrane potential at the peak of depolarization. Since the sensitivity of the vohage
sensor to membrane potential in SOL is higher (activation) and lower (inactivation) than
in EDL, the size of the voltage window is expected to be larger for SOL than for EDL
muscle preparations. Chua & Dulhunty (1988) used the 'voltage window' model to
explain the incomplete inactivation of K" contractures ('pedestal tensions') observed in
bundles of intact SOL fibres and argued against the possibility that the profile of these
contractures could have been due to a subpopulation of SOL fibres that did not inactivate.
The single fibre study presented in this paper revealed the presence in the rat SOL muscle
of 7tFand/?/'fibres, whose responsiveness to T-system depolarization can be easily
explained if one considers that, at the peak of depolarization, the membrane potential
reached a value which was more positive {rtF) than the Ihnit of the voltage window or

125
was within it {pF). Given the steepness of the activation and inactivation curves
constmcted for SOL muscles (see Figure 6 a & b in Chua & Dulhunty, 1988), it is
suggested that despite the marked difference in the profile of the /tFand z?/"force
responses, the actual difference between the membrane potentials of rtF and pFfxhres,
could be very small.
It is interesting to note that the forces produced by a small number (two type 1 and one
type I/IIA) of TtFSOL fibres during the work-up period displayed a joFtype profile, with
the pedestal component becoming smaller with successive depolarization/repolarization
cycles such that the maxDIFR was of the rtFXype. The work-up phenomenon has been
related to the presence in the sealed T-system of CI" ions, which exert a polarizing effect
on the membrane potential thereby reducing the effectiveness of the depolarization step
(Coonan & Lamb, 1998). With successive depolarizations, CI gradually diffuses out of
the T-system, the membrane potential reaches more positive values, more DHPR/voltage
sensors become activated and the fibre produces force responses of greater magnitude.
Within this context, the transition of the aforementioned force responses, from pFio rtF,
suggests that the membrane potential reached in these fibres in the depolarizing solution
at the beginning of an experiment may be within the 'voltage window' and that successive
depolarization/repolarization cycles (and subsequent loss of T-system CI") causes the
membrane potential reached during depolarization to shift out of the voltage window
closer to zero.

126
An interesting finding of this study is that 11.1 % of IIB SM fibres and over 50 % of SOL
type I fibres did not respond to T-system depolarization. The large proportion of SOL
fibres not responding to T-system depolarization rat make studies on E-C coupling in
type I fibres using the skinned fibre preparation and the Lamb & Stephenson
depolarization protocol (Lamb & Stephenson, 1990a) a difficult task. It is unlikely that
the 22Ffibres could have been damaged, since all single fibres used in this study were
dissected, skinned and mounted by the same investigator. Furthermore, all the iiFfibres
examined here produced large force responses when exposed to a low Mg solution (see
Table 4.1) indicating that the SR compartment was not depleted of Ca and that the
RyR/Ca^^ release channels were functional. Based on these data it is suggested that in nF
fibres the DHPR/voltage sensors may have been irreversibly inactivated and/or that the
coupling mechanism between the DHPR/voltage sensors and theRyR/Ca2^ release
channels may have been dismpted by some unknown causes.
Are functional characteristics of the T-system and SR compartments related to MHC-
based fbre type?
Myosin heavy chains are the most widely used molecular markers of fibre type
differentiation, specialization and adaptation, yet the extent to which the functional
properties of the T-system and SR in different fibre types are related to MHC-based fibre
type is far from being understood. One finding from the present study is that, regardless
of the muscle of origin (EDL or SM), pure fast-twitch fibre preparations expressing MHC
lib isoform produce larger T-system depolarization induced responses than pure slow-
twitch fibre preparations expressing MHC I isoform. Based on this findmg, which

127
suggests a close relationship between MHC isoform expression and the amplitude of the
responses, one would predict that DIFRs produced by pure muscle fibres expressing
MHC lla (type ILA fibres) or MHC lld/x isoforms (type IID/X fibres) and by hybrid I/II
fibres expressing a larger proportion ofMHC II isoform should be larger than the DIFRs
produced by fibres expressing only MHC I or a combination ofMHC I and MHC II, with
MHC I being the major component. Surprisingly, the force responses produced by four
type FIIA SOL fibres, expressing predominantly MHC Ila isoform (mean value of 73 %),
were not different from those produced by pure type I SOL fibres. This result may
indicate that, in the rat, type IIA fibres resemble type 1 rather than type IIB fibres with
respect to the infracellular factors/events determining the amplitude of DIFR.
Unfortunately, this possibility could not be tested as the pool of fibres used in this study
contained only one pure type IIA fibre, which failed to respond to T-system induced
depolarization. Moreover, to date there is no published information on the E-C coupling
phenotype of mechanically skinned fibre preparations expressing MHC Ila isoform. The
similarity between the maxDIFRs values for type I/IIA and type I SOL fibres may indicate,
however, that the relationship between MHC isoform expression and the factors
determining this parameter (see Parameters indicating skinned fbre responsiveness to T-
system depolarization in Chapter 2, page 67) is stronger for MHC 1 than for MHC Ila.
This possibility seems unlikely though, given that for the population of type 1 SOL fibres,
the inter-fibre variability (as indicated by the value of CV) with respect to maxDIFR was
four times higher than that for IIB EDL and IIB SM fibres. A third possible explanation
for the lower DIFRs developed by the I/IIA SOL fibres expressing predominantly the
MHC lla isoform is that the factors determining maxDIFR relate more to the muscle of
origin (SOL) and to hs specific physiological role, than to the MHC isoform (Ila)
expressed in the fibre. In this case one would expect that, if present in SOL muscle, even
pure type IIB fibres, would produce lower force responses to T-system depolarization,
comparable in height to those produced by the pure type 1 and type I/1L\ SOL fibres.
Again, the absence of type IIB fibres from the pool of rat SOL muscle fibres examined in
this study made it impossible to validate/reject this point.
The possibility that responsiveness to T-system depolarization in a mechanically skinned
fibre preparation relates to MHC-based fibre type as well as to the muscle from which the
fibre was obtained is supported also by the data on 750/J -D, the second E-C coupling
parameter considered in this study: type I SOL fibres produced fewer force responses to
mn-dovm than type IIB fibres from EDL and SM (in agreement with a close relafionship
between E-C coupling characteristics and fibre type) and type IIB SM fibres produced
fewer force responses to mn-down than IIB EDL fibres (in agreement with a close
relationship between E-C coupling characteristics and the muscle of origin). Recentiy
Bortolotto etal (2000) reported another example of functional/stmctural differences
between fibres expressing the same MHC isoform, but originating from two different rat
muscles. In this case, in which IIA SOL fibres displayed significantiy higher sensitivity
of the contractile apparatus to Ca^^than HA EDL fibres (Bortolotto etal, 2000), the inter
muscle difference involved most likely, components of the myofibrillar compartment
(such as troponin C). Taken together with the results presented in this study, these data
suggest that the optimum contractile function of a skeletal muscle fibre type is related to

129
both its MHC isoform composition and to the mnervation pattem and functional role of
the muscle of origin (BottineUi, 2001).
hi summary, this study has shown that pure type IIB fibres (from EDL or SM) produce
larger DIFRs than SOL pure type I fibres suggesting that responsiveness to T-system
depolarization of skinned muscle fibres varies with muscle fibre MHC isoform
composition. When considering the second E-C coupling parameter, 75o,„R-D, EDL IIB
fibres gave more DIFRs than both SM IIB and SOL I fibres suggesting that
responsiveness to T-system depolarization may also vary according to the muscle of
origin. The finding that a small group of SOL type I fibres responded to T-system
depolarization with a prolonged force response, indicating incomplete inactivation of the
DHPR, provided the first evidence at the single fibre level of the 'voltage window' model
of voltage sensor function originally proposed by Chua & Dulhunty (1988).

130
Chapter 5
GLYCOGEN STABILITY AND GLYCOGEN PHOSPHORYLASE
ACTIVITIES IN ISOLATED SKELETAL MUSCLES FROM RAT
AND TOAD
Introduction
The study described in the next Chapter (Chapter 6) examines the relationship
between glycogen content and the responsiveness to T-system depolarization of
mechanically skinned fibres from the rat EDL muscle. A methodological prerequisite
for such a study is that any loss of glycogen and associated enzymes occurring during
muscle storage over the experimental period is kept to a minimum.
In this context it is worth pointing out that in studies involving mechanically skinned
fibre preparations, whole muscles are dissected and single fibres are isolated and
skmned at room temperature; when not being used for the generation of a new single
fibre, the muscles are kept at 4''C. The time taken to perform these procedures, all of
which are carried out under oil (for details see Chapter 2), with fibres isolated from
the hindlimb muscles of one animal (i.e. the total time spent by the muscle tissue,
under oil, at room temperature and at 4°C) depends on the skill of the experimenter
and the functional state of the muscle, but does not usually exceed 6 hours. The
stability of muscle glycogen over this time period has not been examined so far, but
there is evidence to suggest that glycogen in mammalian skeletal muscle is relatively
unstable (as compared for example with amphibian muscle). Thus, Calder and Geddes
(1990) found very rapid glycogen loss (60% in the first 5 minutes after animal death.

131
82% within the first 2 hr) in rat hindlimb muscles left in the body post mortem. By
comparison, Sahyun (1931) reported no decrease in glycogen content in frog {Rana
pipiens) skeletal muscle left in situ for over 2 hours, at room temperature.
hi the present study, the stability of glycogen in rat EDL muscle (the muscle used as a
source of single fibres in Chapter 6) was determined and compared with that of rat
SOL muscle and iliofibularis (IF) muscle of the cane toad.
As described in Chapter 1 (see Glycogenolysis and Glycogen phosphorylase, page 51
and 52, respectively), the enzyme predominantly responsible for the breakdovm of
skeletal muscle glycogen is glycogen phosphorylase, which is present in both active
(phosphorylase a; Phos a) and inactive (phosphorylase b; Phos b) forms. To date there
have been several reports concemed with glycogen phosphorylase activities in EDL
and SOL muscles of the rat (Villa Moruzzi etal, 1981; James & Kraegen, 1984;
Chasiotis, 1985; Chasiotis etal, 1985). In contrast, no equivalent studies have been
performed using the IF muscle of the cane toad and there are no comparative studies
on glycogen phosphorylase activities in rat and toad skeletal muscles. Thus, a second
aim of the present study was to determine and compare total phosphorylase (Phostotai)
and Phos a activities in isolated rat EDL and SOL and toad IF muscles at different
time points over the period of muscle storage.
Materials and Methods
Animals
The animals used in this study were male rats (DRY and Sprague-Dawley; 11-13
weeks) and male and female cane toads {Bufa marinus; 160 - 400 g). The rats were

kept at room temperature and fed water and standard rat chow ad libitum, while toads
were kept unfed in a dark, moist environment (16 - 24° C) for up to one week.
Muscle preparation
Rats were killed by deep halothane inhalation, while toads were double pithed.
Previous studies have demonstrated no adverse effect of rat exposure to anaesthetic
halothane on skeletal muscle glycogen (Musch et al, 1989; Ferreira etal, 1998) or
glycogen phosphorylase activity (Ferreira etal, 1998). To minimise any diumal
variation in muscle glycogen, all rats were killed at the same time of day (Cohn &
Joseph, 1971; Conlee etal, 1976).
Rat EDL and SOL and toad IF muscles were dissected and handled as described in
Chapter 2. The muscles to be stored, either at room temperature (RT) or at 4°C (see
below), were placed in a Petri dish under Paraffin oil kept at RT. In all experiments
(determination of glycogen content and phosphorylase activity), one muscle was used
as a control and processed immediately while the contralateral muscle was stored as
described below and processed as appropriate at the required time. In glycogen
determination experiments, control muscles were homogenised immediately after
weighing, while the contralateral muscles were homogenised after being incubated
(see below). For glycogen phosphorylase assays, control muscles were rapidly
clamped with aluminium tongs precooled in liquid N2 and freeze-dried for 48 hrs,
while stored muscles were blotted free of oil on filter paper, freeze clamped and
freeze-dried. Due to technical constraints, glycogen determmation and phosphorylase
activity assays were performed, for each storage time point, on muscles obtained from
different animals, and different rats were used to obtam the EDL and SOL muscles.

133
Muscle storage
Muscles were stored under paraffin oil at either RT (20 - 25°C) or at 4°C. These
temperatures were chosen based on the protocol employed in studies using
mechanically skinned single fibre preparations, which involves storage of the muscle
tissue at low temperature and isolation of smgle fibres, mechanical skinning and fibre
mounting onto the force measuring system at RT (Stephenson and Stephenson, 1996;
Lamb and Cellini, 1999). For glycogen stability experiments, muscles were stored at
RT for 0.5 (EDL and SOL), 3 hrs (EDL and SOL) and 6 hrs (EDL, SOL and IF) and
at 4°C for 3 hrs (EDL and SOL) and 6 hrs (EDL, SOL and IF). For measurements of
phosphorylase activity, rat SOL and EDL muscles were stored for 0.5 hr (RT) and 6
hrs (RT and 4°C), while toad muscles were stored for 6 hrs (RT and 4°C) only.
Glycogen determination
Whole muscle glycogen was determined using a two-step fluorometric method based
on the analytical protocol of Passonneau & Lowry (1993). All enzymes were
purchased from Boehringer-Mannheim. Whole muscles were mechanically
homogenised (Omni, Warrenton, VA, USA) on ice in six volumes of ice cold 0.5 M
acetate buffer (0.25 M acetic acid & 0.25 M sodium acetate), pH 5.0 to produce a
smooth suspension. Amyloglucosidase (AG; amylo-al, 4-a-l, 6-glucosidase) was
added to the homogenate at a final concentration of 20 pg/ml and samples were
incubated at RT for 4hrs (step I; Glycogen(n) —AG—> Glycogen (n-i) + glucose).
After this period, samples were centrifliged for 5 mins at 12, 000 g. An aliquot of 7.5
to 10 pi was taken from the supematant and added to 3 ml of glucose reagent, which
consisted of 0.05 mM Tris/HCl, pH 8.1, 1.0 mM MgCL, 0.5 mM DTT, 0.3 mM ATP,
0.05 mMNADP^ and 1.76 pg/ml glucose-6-phosphate dehydrogenase (G-6-PDH).
134
To start the reaction, hexokinase (HK) was added at a fmal concentration of 0.4
pg/ml. The sample-reagent mixture was then incubated for 15 minutes in the dark
(step 2; Glucose +ATP+NADF' —HK& G-6-PDH—>NADPH+P-6-
gluconolactone) and subsequently read fluorometrically for NADPH content (Perkin
Elmer, LCI00) at a wavelength of 348 nm. The fluorescence NADPH signal is
produced stoichiometrically with glucose monomers generated from glycogen in Step
1.
In order to determine the actual concentration of NADPH (and hence glycogen) from
the fluorescence signal, a glycogen standard curve (0.5, 1.0, 2.0, 4.0, 8.0, 12.0, 16.0 &
20.0 pM) was prepared using commercial glycogen (Sigma) subjected to the same
reaction steps as the samples. The fluorescence signals produced by the standards
were then read on the fluorometer and the standard curve was plotted on GraphPad
Prism program. The slope of the standard curve was finally used to convert the
fluorescence signals produced by muscle samples to actual glycogen concentrations.
To determine any other endogenous contributors to the fluorescence signal (ie.
glucose, G-6-P, NADH & NADPH), a portion of the original homogenate, without the
addhion of AG, was subjected to the second reaction step and the fluorescence signal
analyzed. The concentration of these non-glycogen fluorescence contributors was
subtracted from the glycogen concentration. Glycogen concentration was expressed
as mmol glucosyl residues/kg wet weight or as mmol glucosyl residues/kg dry weight
(mmol glucosyl residues X conversion factor /kg wet weight).

Wet weight/dry weight conversion
To allow the expression of glycogen concentration or phosphorylase activity relative
to either wet or dry muscle mass, IF, EDL & SOL muscles were weighed wet,
immediately after dissection and weighed again immediately after being freeze-dried
for 48 hours. The muscle conversion factors used in this study, 3.66 (for EDL and
SOL) and 4.34 (for IF), were calculated based on the fmding that, for the three
muscles examined, the dry weight (expressed as percent of wet weight), was 27.5 ±
0.3 % (n = 14; EDL), 27.5 ± 0.4 % (n = 15; SOL) and 22.7 ± 0.2 % (n = 15; IF).
Phosphorylase activities
Total phosphorylase (Phostotai) £iud phosphorylase a (Phos a) activities were
determined at 30°C (the temperature commonly used in phosphorylase assays) in the
direction of glycogen degradation using the two step method of Ren et al. (1992). All
enzymes were purchased from Boehringer-Mannheim. Briefly, 10-25 mg of freeze
dried muscle was homogenised on ice in 0.4 ml of ice cold homogenization solution
containing 100 mM Tris/HCl, pH 7.5, 60% (v/v) glycerol, 50 mM NaF and 10 mM
EDTA. The homogenate was then diluted with 1.6 ml of the above solution without
glycerol and further homogenised on ice. Fifty microliters of homogenate was added
to 0.5 ml of a phosphorylase stock reagent containing 50 mM Imidazole/HCl at pH
7.0, 1.25mM MgCb, 20 mM K2HPO4, 0.25% (w/v) BSA, 62.5 mM glycogen, 5 pM
G-1-6-P, 0.5 mM DTT and 2.5 pg/ml phosphoglucomutase (PGM) (step 1; Glycogen
— Phos—> G-l-P —PGM—> G-6-P). Phosphorylase activity was determined in the
presence (Phostotai) or absence (Phos a) of 3 mM AMP.

136
After 10 mins at 30°C, the reaction was stopped with 60pl of 0.5 N HCl. The
glucose-6-phosphate generated was measured by adding 50 pi sample (Phostotai
assays) or 100 pi sample (Phos a assays) to 2 ml of G-6-P reagent containing 50 mM
Tris/HCl at pH 8.1, 1 mM EDTA, 250 pM NADP^ and 0.5 pg/ml G-6-PDH (step 2;
G-e-P + NADP" —G-6-PDH—> NADPH+P-6-gluconolactone). Samples were
subsequently incubated for 15 mins in the dark at RT, then read fluorometrically for
NADPH fluorescence signal at 348 nm.
In order to determine the actual concentration of NADPH (and hence G-6-P produced
from the breakdown of glycogen by phosphorylase) from the fluorescence signal, a G-
6-P standard curve (1.0, 2.0, 4.0, 8.0, 12.0, 16.0, 20.0 & 24.0 pM) was prepared using
commercial G-6-P (Boehringer-Mannheim) subjected to reaction step 2. The
fluorescence signals produced by the standards were then read on the fluorometer and
the standard curve was plotted on GraphPad Prism ™ program. The slope of the
standard curve was then used to convert the fluorescence signals produced by the
muscle sample to phosphorylase activity. Phostotai activity was expressed as pmol
/min/g dry weight while Phos a activity was expressed both as pmol/min/g dry weight
and as percentage of Phostotai activity.
Statistics
All results are presented as means and standard error of the mean (M ± SEM).
Student's paired t test was used to detect differences between two groups. One way
analysis of variance (ANOVA) with Boferroni's post test was used for muhiple group
comparisons. Significance was set at p< 0.05.

137
Results
Glycogen content in control muscles
As described in the Methods, muscle glycogen content was determined in
homogenates prepared from wet (not freeze-dried) muscles. Control experiments
showed no significant difference between the glycogen content of wet muscles and
that of the rapidly frozen, freeze-dried contra-lateral muscles (data not shown). The
glycogen content (expressed as mmol glucosyl residues/kg wet weight and in bracket
as mmol glucosyl residues/kg dry weight), in freshly dissected EDL, SOL and IF
muscles was 41.1 ± 1.5 (150.4 ± 5.5; n=38), 41.7 ± 1.5 (152.6 ± 5.5; n=37) and 51.4 ±
2.8 (223.1 ±12.1; n=18), respectively. The conversion factors used are given in the
Methods. The [glycogen] in both rat muscles was significantly lower than that in toad
IF. There was no significant difference between EDL and SOL with respect to
glycogen content.
Glycogen content in muscles stored under oil at R T
As seen in Figure. 5.1 A, 6 hrs storage at RT was accompanied by a marked decrease
in glycogen content both in EDL (by 74.7 ± 3.4 %; n = 7) and in SOL (by 62.6 ± 3.9
%; n = 7). In contrast, under the same conditions, there was only a slight decrease (by
13.5 ± 6.2 %; n = 6) in IF glycogen and this decrease was statistically non-significant.
The proportions of glycogen retained in both EDL and SOL muscles after 6hrs storage
at RT were not significantly different (ANOVA with Bonferroni's post-test; p > 0.05),
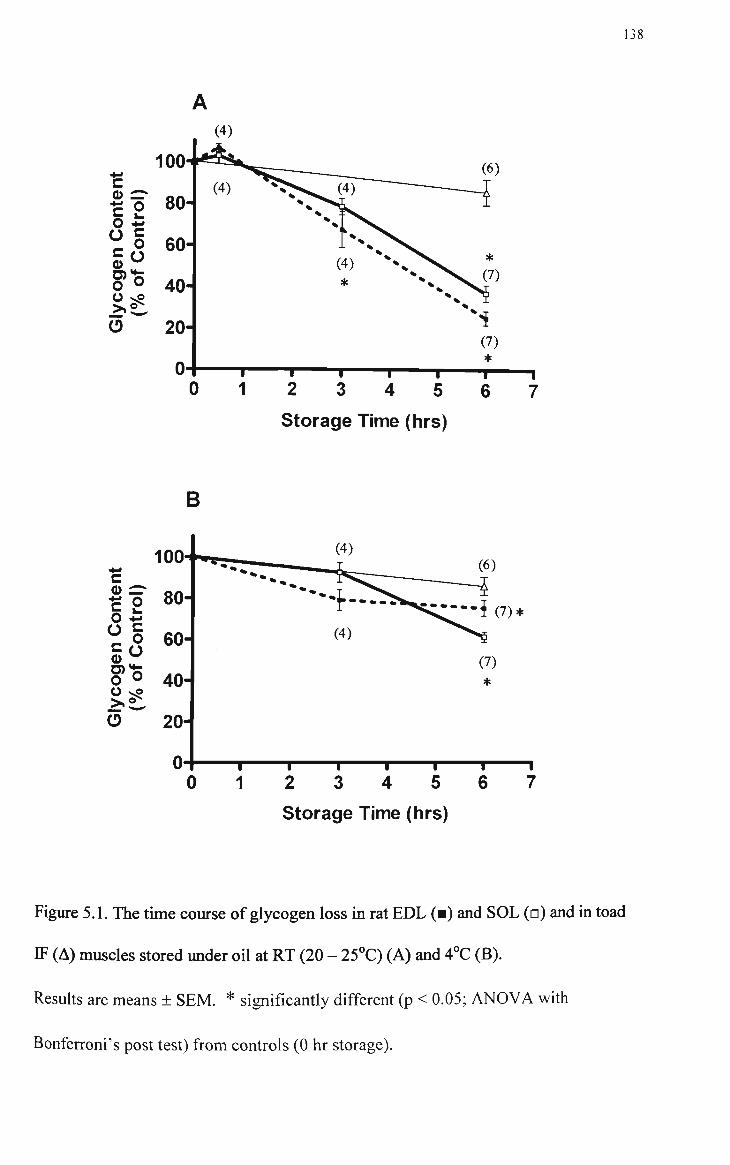
138
2 3 4 5 6
Storage Time (hrs)
B
2 3 4 5 6 7
Storage Time (hrs)
Figure 5.1. The tune course of glycogen loss m rat EDL (•) and SOL (n) and m toad
IF (A) muscles stored under oil at RT (20 - 25°C) (A) and 4°C (B).
Results are means ± SEM. * significantly different (p < 0.05; ANOVA with
Bonferroni's post test) from controls (0 hr storage).
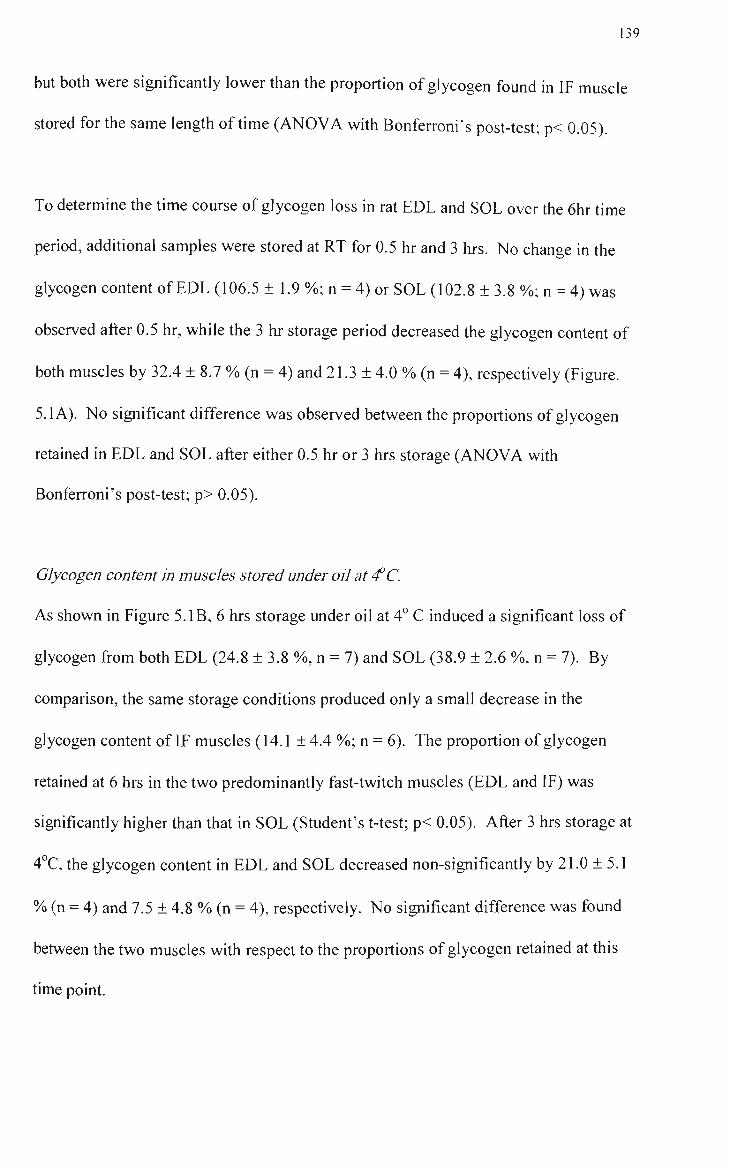
139
but both were significantly lower than the proportion of glycogen found m IF muscle
stored for the same length of time (ANOVA with Bonferroni's post-test; p< 0.05).
To determine the time course of glycogen loss in rat EDL and SOL over the 6hr time
period, additional samples were stored at RT for 0.5 hr and 3 hrs. No change in the
glycogen content of EDL (106.5 ± 1.9 %; n = 4) or SOL (102.8 ± 3.8 %; n = 4) was
observed after 0.5 hr, while the 3 hr storage period decreased the glycogen content of
both muscles by 32.4 ± 8.7 % (n = 4) and 21.3 ± 4.0 % (n = 4), respectively (Figure.
5.1 A). No significant difference was observed between the proportions of glycogen
retained in EDL and SOL after either 0.5 hr or 3 hrs storage (ANOVA with
Bonferroni's post-test; p> 0.05).
Glycogen content in muscles stared under oil at 4C.
As shown in Figure 5. IB, 6 hrs storage under oil at 4° C induced a significant loss of
glycogen from both EDL (24.8 ± 3.8 %, n = 7) and SOL (38.9 ± 2.6 %, n = 7). By
comparison, the same storage conditions produced only a small decrease in the
glycogen content of IF muscles (14.1 ± 4.4 %; n = 6). The proportion of glycogen
retained at 6 hrs m the two predominantly fast-twitch muscles (EDL and IF) was
significantly higher than that in SOL (Student's t-test; p< 0.05). After 3 hrs storage at
4°C, the glycogen content in EDL and SOL decreased non-significantly by 21.0 ± 5.1
% (n = 4) and 7.5 ± 4.8 % (n = 4), respectively. No significant difference was found
between the two muscles with respect to the proportions of glycogen retained at this
time point.

140
Phostotai and Phos a activities in control muscles
The activities of Phostotai (A) and Phos a (B) in control, EDL, SOL and IF muscles are
presented in Figure. 5.2. The Phostotai (expressed as pmol/g dry weight/min) for EDL
(152.9 ± 4.4; n = 23) was significantly higher than for IF (66.3 ± 5.7; n = 12), which
in tum was significantiy higher than for SOL (29.9 ± 2.3; n = 22). By comparison, the
Phos a activity (expressed both as pmol/g dry weight/min and, m bracket, as % of
Phostotai activity) was 72.4 ± 4.0 (48.1 ± 1.8 %; n = 23) for EDL, 6.0 ± 0.6 (19.2 ± 1.7
%; n = 22) for SOL and 3.1 ± 0.7 (4.9 ± 1.1%; n = 12) for IF. The values of Phos a
activhy in SOL and IF, were significantly lower than the Phos a activity in EDL.
Phos total and Phos a activity in muscles stored under oil atRT and 4C.
In all three muscles examined in this study (EDL, SOL and IF), Phostotai did not
change over the entire 6 hr period regardless of the storage temperature (Table 5.1),
indicating no significant storage-induced degradation of glycogen phosphorylase. As
shown in Figure.5.3A, after 6 hrs of storage at RT, Phos a activity (expressed both as
pmol/g dry weight/min and, in bracket, as a % of Phostotai activhy) in EDL decreased
9 fold from 74.6 ± 4.7 (49.6 ± 2.3 %; n =11) to 8.3 ± 1.5 (6.3 ± 1.1 %; n = 6). Six
hours storage at RT of SOL muscles was accompanied by a 4 fold decrease in Phos a
activity from 6.3 ± 0.9 (19.6 ± 2.5 %; n = 12) to 1.6 ± 0.6 (4.9 ± 1.7 %, n = 6). No
decrease in Phos a activity was observed in IF muscles stored for 6 hrs at RT. [4.2 ±
1.7 (6.6 ± 3.2 %; n = 6) versus 3.5 ± 1.0 (5.5 ± 1.8 %)]. To find out how fast the Phos
a activity decreased in EDL and SOL, the enzyme was assayed also in muscles stored
at RT for 0.5 hr. As seen in Figure. 5.3A, a marked decrease in Phos a activity was
observed relatively eariy both in EDL (4.1 fold) and in SOL (2.4 fold).

141
« -5 (0 >
? * O D)
81 -I
EDL SOL
B
EDL SOL IF

142
Figure 5.2 (A) Total phosphorylase activities (pmol/mm/g dry weight) m rat EDL
and SOL and toad IF confrol muscles. Results are means ± SEM. * significantly
different (p<0.05; ANOVA with Bonferroni's post test) from rat EDL; # significantly
different (p<0.05; ANOVA with Bonferroni's post test) from toad IF.
(B) Phosphorylase a activities (expressed: mol/mio/g dry weight and as % of total
phosphorylase) m rat EDL and SOL and toad IF confrol muscles. Results are means ±
SEM. * significantly different from rat EDL. # significantly different (p<0.05;
ANOVA with Bonfertoni's post test) from toad IF.
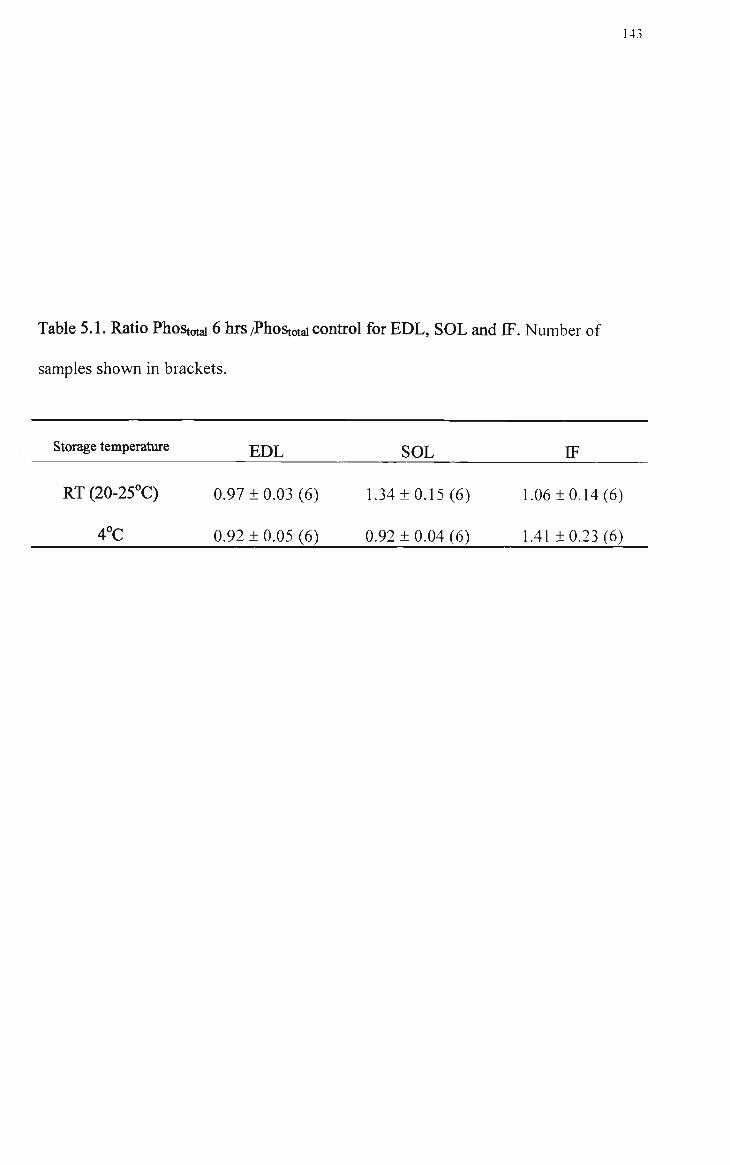
143
Table 5.1. Ratio Phostotai 6 hrs /Phostotai confrol for EDL, SOL and IF. Number of
samples shovm in brackets.
Storage temperature £ J ) L SOL IF
RT(20-25°C) 0.97 ±0.03 (6) 1.34 ±0.15 (6) 1.06 ±0.14 (6)
4°C 0.92 ± 0.05 (6) 0.92 ± 0.04 (6) 1.41 ± 0.23 (6)
144
After 6 hrs storage at 4°C, Phos a activhies decreased 7.3 fold in EDL from 72.0 ± 5.3
(46.6 ± 2.8 %; n = 12) to 9.9 ± 0.6 (7.6 ± 0.6 %; n = 6) and only 3.3 fold in the SOL
muscles [from 6.3 ± 0.7 (18.6 ± 2.3 %; n = 10) to 2.0 ± 0.4 (6.2 ± 0.8 %; n = 6)]
(Figure. 5.3B). There was no decrease in the Phos a activity of IF muscles stored for
6 hrs at 4°C.
hi Figure 5.3B are also shown the values for Phos a activhy in rat muscles stored for
0.5 hr at 4°C. After this period of time, the Phos a activity decreased 2.5 fold to 29.3
± 2.1 (19.6 ± 1.5 %; n = 6) in EDL and 1.3 fold to 4.9 ± 1.7 (13.7 ± 4.2 %; n = 4) in
SOL muscles.
Discussion
The results presented in this study clearly show that storage under oil for up to 6 hrs at
RT or 4°C, is accompanied by a time- and temperature-dependent glycogen loss in rat
EDL and SOL and by minimal glycogen loss in toad IF irrespective of temperature.
These data confirm that glycogen is less stable in skeletal muscle of the rat (mammal)
than in skeletal muscle of the toad (amphibian).
Glycogen content and phosphorylase activities in feshly dissected (control) muscles
The absolute values for EDL and SOL glycogen determined in the present study are
similar to those reported by other investigators who used Sprague-Dawley rats
(Witzmann etal, 1983; Chasiotis, 1985). hi this study, no significant difference was
found in the glycogen content of these two rat muscles. This result is in agreement
with the data of Witzmann etal{\9%3) and James and Kraegen (1984), but in

145
80-1
70-
ivity
CS
u VI
ryla
sp
ho
o M OH
•a
wei
>. •s
in/g
ol
/m
• ^
v _ ^
60-
50-
40-
30-
20-
10-
Muscle Storage Time (hr)
9
IJ ;;:] A
0
EI
5
)L
* (6)
1
6
(12)
0
(6)
ls!ss;s™5S3-
0.5
SOL
(6) 1
6
(6)
0
IF
(6)
1
6
B
(11)
Muscle Storage Q Ttme (hr) 0.5
EDL
0 0.5 6
SOL
0 6
IF

146
Figure 5.3. Phosphorylase 'a' activities (expressed as % of total phosphorylase) in rat
EDL and SOL and toad IF muscles stored under oil at room temperature (20 - 25°C)
(A) and 4°C (B) for up to 6 hrs.
Resuhs are means ± SEM. * significantly different (p<0.05; ANOVA with
Bonferroni's post test) from controls (0 hrs).

147
disagreement with those of Villa Moruzzi and Bergamini (1983), Chasiotis (1985) and
Hutber and Bonen (1989), who reported that the glycogen content in EDL is slightly
higher than in SOL. This discrepancy between different studies can be explained by
the large animal-related variability in muscle glycogen content observed both by us
[the coefficient of variance (CV) for both EDL and SOL glycogen was about 20%],
and by others (Villa Moruzzi & Bergamini, 1983; James & Kraemer, 1984; Chasiotis.
1985).
This is the first study in which the glycogen content of rat EDL and SOL is compared
with that of the cane toad IF muscle, using the same experiment. The data show that
the toad IF (a predominantly fast-twitch muscle; Nguyen and Stephenson, 1999)
contains a significantly higher concentration of glycogen than EDL and SOL of the
rat. This somewhat surprising result, given that the toads were kept unfed while the
rats had access to food ad libitum, may be explained by species-related differences in
dietary habits, muscular activity patterns, or metabolic adaptations to environmental
conditions.
The absolute values of Phostotai determined in this study for freshly dissected and
rapidly freeze-dried EDL and SOL muscles are similar to those reported by others for
Sprague-Dawley rats (Chasiotis, 1985; Chasiotis etal, 1985). Under the experimental
conditions used in this study, the rat EDL Phostotai activity was 4 - 5 fold higher than
that in the SOL. This resuh is in agreement with previous reports that rat fast-twitch
muscles have a higher Phostotai activity than slow-twhch muscles (Villa Moruzzi etal,
1981; Chasiotis etal, 1985). hi this context, h is interesting to note that the Phostotai

148
activity displayed by toad IF, also a predominantiy fast-twitch muscle, was also
higher than that in rat SOL, but was lower (less than half) than that found in EDL.
According to earlier reports (Ren & Hultman, 1988; Ren etal, 1992), the proportion
of Phos a activity in resting mammalian muscle (rat and human) represents
approximately 5-10% of the total phosphorylase. In contrast, Conlee etal. (1979)
found that the proportion of Phos a in the "resting' red region (slow-twitch) of rat
gastrocnemius was 52% whereas that in the white region (fast-twitch) was 60% of the
total phosphorylase. The authors attributed the high values found for Phos a in
gastrocnemius muscle to the activation of glycogen phosphorylase by the cutting and
pulling of the tissue prior to freeze-drying. The proportions of Phos a in the freshly
dissected and rapidly freeze-dried rat muscles used in the present study were also high
(48.1% in EDL and 19.2% in SOL). These values may also be attributed to the Ca ^
release induced by stretching the muscle during freeze clamping (as suggested by
Conlee etal, 1979) and/or inadvertent mechanical stimulation during dissection
(Cohen, 1983a), because, as it will be discussed later, the proportion of Phos a activity
in the rat muscles (particularly in EDL) decreased markedly when the tissues were
freeze-clamped after being stored under oil for at least 0.5 hr.
hi contrast to the rat muscles, the freshly dissected toad IF, which was subjected to the
same dissecting and freeze-drying protocol, displayed a low Phos a activity (4.9% of
Pliostotai). This difference in Phos a activity between the toad and rat muscles suggests
that the mechanisms of regulation of phosphorylase kinase and phosphorylase
activities in the toad may be different from those in the rat. There is currently no

149
information regarding the proportion of Phos a or the cellular mechanisms involved in
the regulation of the glycogenolytic system in 'resting' toad IF muscles.
Glycogen loss and phosphorylase activities in muscles stored under oil atRT and at
4C
In this study no glycogen breakdown was found in the rat muscles stored for 0.5 hrs,
under paraffin oil, at either RT or 4°C. This result strongly suggests that, under these
conditions, stored muscles are not strongly hypoxic because in the experiments
performed by Ren etal. (1992) on rat epitrochlearis, muscles stored for 20 min under
strongly hypoxic conditions (Krebs-Hansleit bicarbonate buffer bubbled with 95%N2-
5% CO2) lost 36% of the initial glycogen, while the controls (muscles stored in
oxygenated Krebs-Hansleit bicarbonate buffer) lost only 1%.
Calder and Geddes (1990) previously reported that in rat 'hindlimb' muscle of a non-
specified type, glycogen was rapidly broken down (60% in the first 5 min post-animal
death and over 80 % within 2hr) when the muscles were left within the animal
carcass. Under the conditions of the present study, the EDL and SOL muscles
retained most of their glycogen (67.6% and 78.7% of the control, respectively) even
after 3 hr of storage. Glycogen losses similar to those reported by Calder & Geddes
(1990) were found only after EDL and SOL muscles had been kept at RT for 6 hr.
The most obvious difference between these two studies, which may explain the
discrepancy between the present data and those of Calder and Geddes (1990), is the
temperature at which the muscle was kept prior to glycogen determination. Thus,
Calder and Geddes (1990) left the muscle tissue after death inside the body, where the

150
temperature, at least inhially, would have been close to normal body temperature of
the rat (37-38°C; Severinsen & Munch, 1999). hi the present study muscles were
stored at RT (20-24°C), which was approximately 15°C lower than that in the Calder
and Geddes (1990) study. At this temperature the rate of all enzyme activities
(including glycogenolytic enzymes) would have been considerably lower.
Storing EDL and SOL under oil at RT produced no glycogen loss at 0.5 hrs, a small
loss (32-21%) after 3 hrs and more than 60% loss after 6 hrs. By comparison, storing
EDL and SOL under oil at 4°C produced less than 25% glycogen loss after 3 hrs and
less than 40% after 6 hrs. This result indicates clearly that in studies concemed with
the correlation between initial single fibre glycogen and rat skinned fibre
responsiveness to T-system depolarization, the muscles can be stored at either RT or
preferably at 4°C up to 3 hrs and at 4°C up to 6 hrs with only minor loss in muscle
glycogen content.
In contrast to the rat muscles, which displayed a temperature and storage time-related
glycogen stability, toad IF muscle lost only a very low proportion of glycogen after
bemg stored under oil at RT or 4° C, for up to 6 hrs. One possible explanation for the
greater glycogen stabilhy in toad IF muscle is that toads have a lower body
temperature (23 - 27°C in cane toads kept at 20°C; Portner etal, 1994) and a lower
resting metabolic rate (as indicated by the rate of oxygen consumption; Portner etaf
1994) than the rat (Bailor & Poehlman, 1993; Severinsen 8c Munch, 1999). The toad
muscle should therefore have a lower energy requirement at rest than the rat, resulting
in less glycogen being broken down over the same period of tissue storage.

An interesting observation made in this study is that the high proportion of Phos a
activity recorded in the freshly dissected EDL declined markedly and rapidly during
tissue storage at RT, reaching values within the range (5-10%) reported by other
laboratories (Conlee etal, 1979; Ren & Hultman, 1988; Ren etal, 1992). A rapid
decrease in the Phos a fraction in human muscles was also reported by Ren and
Hultman (1988) in a study in which the freezing of the tissue post-dissection was
delayed by a few minutes. When the muscles were stored at 4°C, the drop in the
proportion of Phos a activity was slightly smaller. This result could be due to the low
temperature induced inhibition of protein phosphatase - 1 , the enzyme believed to be
responsible for the dephosphorylation and inactivation of Phos a (Cohen, 1983b).
In this study no quantitative correlation was found between the amount of glycogen
broken down and Phos a activity in isolated 'resting' EDL, SOL and IF muscles,
stored under oil. For example, after 6 hrs storage at RT, SOL and EDL lost a similar
amount of glycogen (112.8 and 97.7 mmol glucosyl residues/kg dry weight,
respectively), yet the Phos a activity in SOL was 5.2 fold lower than that in EDL. By
comparison, Phos a activity in IF stored at RT for 6 hrs was only 1.9 fold lower than
that in EDL, yet the proportion of glycogen lost from IF was 3.9 lower than that from
EDL. The finding that SOL lost during storage almost the same amount of glycogen
as EDL, even though h displayed a lower Phos a activity, can be explained, at least in
part, by hs higher content of inorganic phosphate (3.6 mM) relative to EDL (1.1 mM)
(Kushmerick etal.,\992). Inorganic phosphate is known to activate both Phos a and b,
and as a consequence may increase the rate of glycogenolysis (Newgard etal, 1989).
A storage-related build up of inorganic phosphate may also explain why, despite the
decrease in Phos a activity, glycogenolysis occurred consistently in both SOL and

152
EDL during the 6 hrs period. The lack of available information on the Pi content of IF
in cane toad, precludes us from extending the line of reasoning used for EDL and
SOL to explain the lack of correlation between the Phos a activity and rate of
glycogen breakdown found in EDL and IF.
hi summary, the results of this study indicate that storage under paraffin oil for up to 6
hrs at RT or 4°C is accompanied by a time- and temperature-dependent glycogen loss
in EDL and SOL muscles of the rat and minimal glycogen loss in toad IF muscles.
Importantly in the context of this thesis, the rat EDL muscle, handled as required in
the study described in the next Chapter, retained ~ 80% of its initial glycogen content
when stored for 3 hrs at 4°C. Rat EDL had a greater Phostotai activity than toad IF
which in tum had a higher Phostotai activity than rat SOL. Rat EDL and SOL Phos a
activity declined also in a time and temperature dependent manner, while toad Phos a
activity remained low and constant over six hours of storage at both 4°C and RT.

153
Chapter 6
GLYCOGEN CONTENT AND RESPONSIVENESS TO T-SYSTEM
DEPOLARIZATION IN RAT MECHANICALLY SKINNED
MUSCLE FEBRES
Introduction
Skeletal muscle glycogen is an intensely researched area of inquiry particularly with
respect to metabolism and biological function(s). So far most studies concemed with
these issues involved the use of whole muscles, whole muscle extracts or enzymes
isolated from whole muscle homogenates. The main drawback of this experimental
strategy is that it provides little insight into potential inter-fibre differences in the
regulation of glycogen metabolism (see Kobayashi et al, 1999 for supporting
evidence of such differences) or into cellular events that mediate the role of glycogen
in the E-C-R cycle. Further advances in these areas could be made with single fibre
preparations containing different glycogen concentrations, under conditions where (i)
the molecular participants in the glycogen metabolism and other signaling pathways
of interest were accessible for functional testing in situ and (ii) the composition of the
myoplasmic environment could be manipulated as required.
Such a study was conducted by Stephenson etal (1999) with smgle fibres freshly
dissected from the iliofibularis muscle of the cane toad. When mechanically skinned
under oil and then incubated in aqueous solutions mimicking the myoplasmic
environment at rest, the toad fibre preparations retained a large proportion of glycogen
154
and a Ca ^-sensitive glycogenolytic system that was activated during T-system
depolarization induced isometric contraction. By exploiting these features h was
established that, in mechanically skinned fibres of toad iliofibularis muscle, inhial
fibre glycogen content and fibre responsiveness to T-system are poshively correlated
under condhions where [ATP] and [creatine phosphate] in the activating solution is
kept high and constant. This finding is the strongest supporting evidence so far for the
idea that glycogen may also play a non-metabolic role in skeletal muscle contractility
(Green, 1991; Fitts, 1994).
The data produced by the toad study strongly indicate that the mechanically skinned
fibre is a promising preparation for skeletal muscle glycogen studies at a cellular level
in amphibians, but does not predict its applicability to mammalian systems. The
present study fills in this cognitive gap by examining the glycogen content and
responsiveness to T-system depolarization in mechanically skinned fibres of the rat
EDL muscle, using the same T-system depolarization protocol as that described in the
toad study.
Materials and methods
Note that in this study depolarization experiments were performed by Dr R Blazev.
Animals and muscles
The animals used were Long Evans hooded rats, aged 20-21 weeks. EDL muscles
were carefully removed and mechanically skinned fibre segments were prepared as
described in Chapter 2. The age of the animal and the specific muscle used as a source
of single fibres in this study were chosen based on the resuhs of Chapters 3 and 4
respectively. All experiments were carried out at room temperature (20-25 C). To

155
minimize storage-related glycogen loss, each muscle was used within 3 hours from
dissection (See Chapter 5). Due to this time constraint only 3 - 4 fibres were used
from each rat muscle.
Skinned fbre responsiveness to T-system depolarization
The protocol used to determine fibre responsiveness to T-system depolarization is
described in detail in Chapter 2 (see The protocol for T-system depolarization induced
activation in mechanically skinned fbres, page 66). The overall indicator of
contractile responsiveness to T-system depolarization used in this study was that
introduced by Stephenson et al (1999). This indicator, referred to as 'fibre response
capacity' or 'response capacity' was calculated by dividing the sum of amplitudes of
the depolarization induced force responses to 75 % run-down (see Chapter 2 for
definition of the phrase 75% run-down) by the maximum Ca -activated force
response.
Skinned fbre solutions
All solutions were as described in Chapter 2.
Glycogen analysis in single fbre segments
Glycogen concentration in freshly skinned (not freeze dried) single fibres was
determined using the microfluorometric technique described previously (Nguyen et
al, 1998a & b and Stephenson etal, 1999). This analytical protocol distinguished two
glycogen pools in toad skinned muscle fibres (Stephenson etal, 1999) incubated in
100 mM Na acetate buffer (pH 7.0): one that was lost from the fibre relatively fast
(within 2 min) and another which remained associated with the fibre for at least

156
another 30 min. Note: the two min wash step is used to mimic the mcubation of the
test fibre segment in aqueous solution immediately prior to the commencement of an
E-C coupling experiment. In the toad study these two glycogen pools were referred to
as washable glycogen (WGlyc) and non-washable glycogen (NWGlyc), respectively.
However, both in the toad study and in the present work it was observed that if the
mechanically skinned fibre was incubated in a solution mimicking the myoplasmic
environment (such as the Polarizing solution; see Solution composition in Chapter 2,
page 70), the loss of endogenous glycogen followed a different pattem. In this case,
the glycogen retained by the fibre after the 2 min wash continued to move gradually
into the solution by a non-enzymatic process (Stephenson et al., 1999; see also
below). Based on this observation, it was decided to refer to the pool of glycogen
retained in the skinned fibre preparations after 2 min incubation in Polarizing solution
as skinned fibre glycogen (SFGlyc) rather than NWGly. SFGlyc was the parameter of
interest in the present study and thus was determined in all fibres.
During the initial 2 min wash in Polarizing solution, an amount of fluorogenic
material is washed (WFluo) out of the fibre (Nguyen etal, 1998b). This pool includes
not only WGlyc but also other non-glycogen (NGlyc) compounds that contribute to
the fluorescence signal such as NADPH, NADH, G-6-P and glucose. To properly
determine what proportion of WFluo is WGlyc, the NGlyc signal needs to be
subtracted from the WFluo signal (i.e. WGlyc - WFluo minus NGlyc). WGlyc (and
by implication Wfluo and Nglyc) was determined only in some fibres.

157
Preparation of Petri dishes for enzymatic reactions in pi volumes
The micorfluorometric technique of Nguyen et al. (1998a & b) involves the
determination of minute amounts of metabolic analytes in small droplets of reagent
formed under oil on the bottom of a Petri dish to avoid evaporation into the
atmosphere. Before making the droplets, Petri dishes were first cleaned thoroughly to
remove any biological or non-biological contaminants that could potentially interfere
with the reaction steps, and to also help the formation of spherical droplets. To this
end, glass Petri dishes (20 x lOOmm, Schott & Gen Main, Germany) were rinsed with
acetone, washed with detergent and hot water, rinsed with 6M KOH/ethanol, rinsed 4
times with hot water and then rinsed 6 times with milliQ water. Clean Petri dishes
were left 'face' down to dry at room temperature.
Solutions
Polarizing/Washing solution - 50 mM HDTA^", 90 mM HEPES, pH 7.1. 1
mM free Mg^^ (8.5 mM total), 1 mM azide, 8 mM ATP, 10 mM CP,
126nlMK^37nlMNa^
AG reagent - 100 mM Na^-acetate buffer, pH 5.0, 2.5 mM Tris, 0.002% BSA,
10 pg/ml amyloglucosidase (AG).
GLU reagent - 676 mM Tris-HCl, pH 8.8, % mM MgCli, 0.8 mM NADP^,
0.8 mM ATP, O.l mM DTT, 2.4 pg/ml hexokinase (HK), 1.6 pg/ml
glucose-6-phosphate dehydrogenase (G-6-PDH).
Reaction steps
Glycogen was assayed using the two step analytical protocol of Passonneau & Lowry
(1993):

158
Step 1/reaction I Glycogen—AG—>n-glucose
Step 2/reaction 1 Glucose +ATP —HK—> G-6-P + ADP
Step 2/reaction 2 G-6-F + NADP" ~G-6-PDH~> P-6-gluconolactone + NADPH+it
Preparation of reaction droplets
On the day of an experiment each dish was covered with a ~ 2 mm layer of oil
mixture (30 % hexadecodane & 70 % light mineral oil; Sigma). Droplets of reagent
were then dispensed under oil on the bottom of the dish using a 2.5 pi micro-pipette
(Eppendorf, Germany), aided by a dissecting microscope (Olympus). The
arrangement of droplets used in this study is shown in Figure 6.1. In one dish a
column of 0.75 pi droplets of Polarizing/washing solution was created, while in a
second dish three droplets of solutions were injected as follows: (i) 0.25 pi of 100 mM
Na^- Acetate buffer, pH 5.0 (no AG); (ii) 0.25 pi of AG reagent; and (iii) 0.5 pi of AG
reagent.
Determination of SFGlyc in washed fibre segments
To analyze the glycogen content of a washed single fibre segment, the segment was
transferred through the air from the washing droplet to a 0.5 pi droplet of AG reagent
in a second dish (see Figure 6.1). The fibre was left to mcubate in the AG reagent
(Step 1) for 45 minutes while glycogen was broken down to individual glucose units
after which 2.0 pi of GLU reagent was added to the droplet to initiate step 2 and left
for 30 minutes.

159
NGlyc WFluo SFGlyc
0.75 111 washing solution in a separate dish
45 miiL incubation
Figure 6.1. Arrangement of reagent droplets under a layer of mineral oil on the
bottom of a Petri dish.
After the 45 mins incubation period, 2.0 pi of GLU reagent was added to each droplet
and incubated for an addhional 30 mins. Note: WGlyc was determined by subtracting
NGlyc from WFluo (see Glycogen analysis in single fibre segments, page 155).
160
Determination of fuorogenic material in washing solution
To determine the amount of fluorogenic material washed out of the fibre durina the
two minute washing step (i.e. WFluo), 0.25 pi of the washing solution in the first dish
was withdrawn and added to the 0.25 pi droplet of AG reagent (Step 1) in the second
dish (see Figure 6.1) and then left for 45 minutes. At the end of 45 mmutes, 2.0 pi of
GLU reagent was added to the droplet (Step 2) and left for 30 another minutes.
Determination of NGlyc material in the washing solution
To assess the NGlyc in the washing solution, 0.25 pi was withdrawn from the
washing droplet and added to a 0.25 pi droplet (see Figure 6.1) of a solution identical
to the AG reagent except that AG had been omitted (i.e. no Step 1/reaction 1). After
45 minutes, 2.0 pi of GLU reagent was added to the droplet to start Step 2 and left for
30 minutes.
Microfuorometric reading of samples
After the 30 minute incubation time for Step 2, a micropipette was used to withdraw
0.75 pi from each droplet which was then aspirated by capillarity into individual
rectangular borosilicate glass microcells with dimensions of 0.05 x 0.5 x 50 mm
(Vitro Dynamics hic, USA). As illustrated in Figure 6.2, the microcells were then
carefully placed side by side in separate grooves on a custom buih brass frame with
dimensions of 3 x 30 x 75 mm. This brass frame could then be placed on the stage of
the epifluoroescence microscope for fluorometric readings.
Fluorescence signals were measured in a dark room using an inverted
epifluoroescence microscope (Axiovert lOOTV, Zeiss) with a bialkali photomultiplier
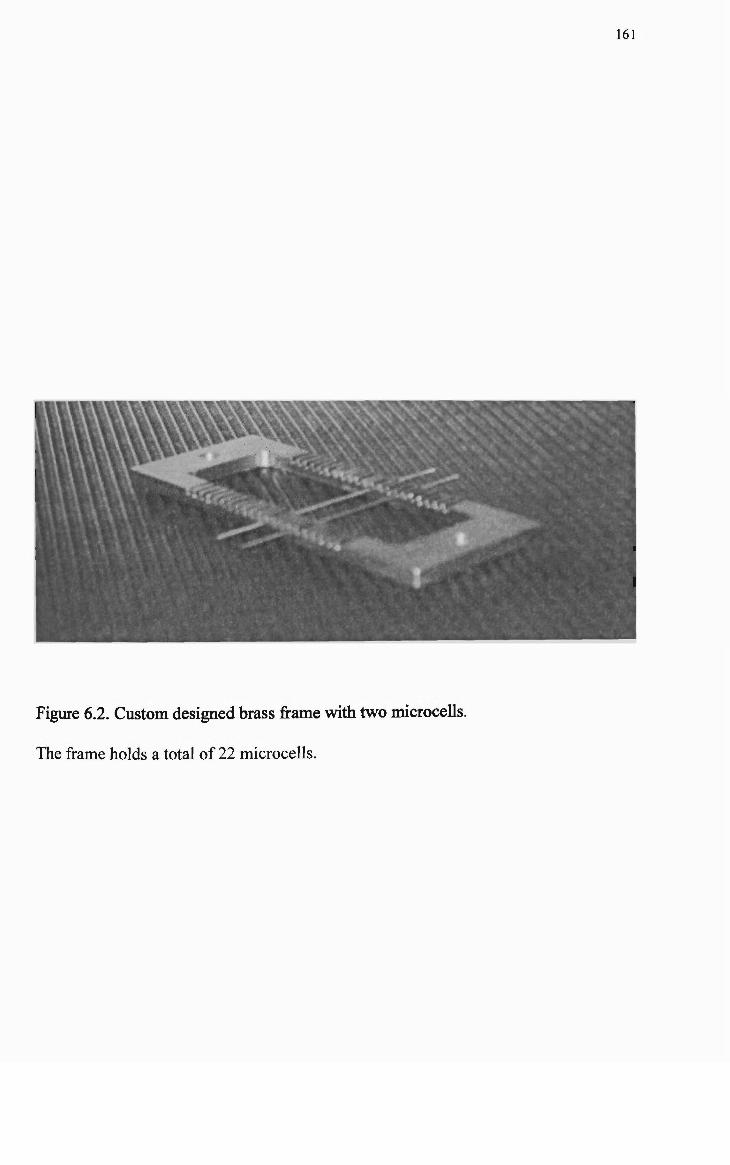
161
Figure 6.2. Custom designed brass frame with two microcells.
The frame holds a total of 22 microcells.

162
(Thom, EMI) and personal computer with Power Lab software (ADInstmments)
(Figure 6.3). Zeiss excitation (365 nm), beamsplitter (425 nm) and emission (420 nm)
filters were used with a Xenon lamp as the light source. The light field was adjusted
so that h covered a 1 mm (25 nl) section of an individual microcell. Fluorescence
signals were recorded over a 5 - 10 second period over which no significant bleaching
was observed. The fluorescence signal was measured at three places along the length
of each microcell with the final values given as an average of the three readings
STD curves
In order to determine the actual amount of NADPH (and hence glycogen) from the
fluorescence signal, a glycogen standard curve was prepared using commercial
glycogen (Sigma) subjected to the same reaction steps as the samples. The standard
solutions were then aspirated into the microcells and the fluorescence signal produced
by each standard was then read on the fluorometer and the standard curve was plotted
on GraphPad Prism program. Finally, the slope of the standard curve was used to
convert the fluorescence signals to an amount of glycogen and this value was then
divided by the fibre segment volume (see Measurement of muscle fibre dimensions in
Chapter 2, page 62). The minimum amount of fibre glycogen (NADPH) that could be
accurately detected by the fluorometric method used here, defined as the amount of
glycogen corresponding to 3 standard deviations of the blank (Bergmeyer etal,
1983), was 6.1 mmol GU for a 5 nl fibre.
Total fibre glycogen (tGlyc) was calculated by adding WGlyc and SFGlyc. Total
glycogen was expressed as mmol glucosyl unhs/litre fibre volume (mmol GU/1 fibre).

163
XeL
PM
EPI-FM
PM
EPI-FM
Figure 6.3 A & B. Microfluormetric system used in single fibre glycogen content
experiments. PC, personal computer; XeL, xenon lamp; EPI-FM, epifiuorescence
microscope; PM, photo muhiplier.

164
while WGlyc and SFGlyc were expressed either as a percentage of tGlyc or as mmol
GU/1 fibre.
Glucose and insulin treatment
In a small number of experiments, glycogen content was determined in single fibres
from muscles treated with glucose and insulin. For these experiments, the test EDL
muscles were incubated for 2 hours at room temperature (20-25°C) in a Krebs solution
containing (in mM): 118 NaCl, 4.75 KCl, 1.18 KH2PO4, 1.18 MgS04, 24.8 NaHCOs,
2.5 CaCb, 10 glucose and insulin (20 U/L), pH 7.4, which was constantly bubbled
with 95 % O2/5 % CO2. The control muscles were incubated in a Krebs solution
without glucose and insulin for the same length of time and at the same temperature as
the test muscles.
Statistics
All resuhs are presented as means and standard error of the mean (M ± SEM) where n
represents the number of fibres. Two-tailed paired and non-paired Student's t-tests
(GraphPad, Prism) were used for comparisons between two groups of fibres (test and
control). Significance was set at p < 0.05.
Results
Glycogen content in mechanically skinned fbres from rat EDL muscle
Under the experimental conditions of this study, the average total glycogen content
(tGlyc) in 53 mechanically skinned fibres from 16 freshly dissected muscles (16 rats)
was 58.1 ± 4.2 mmol GU/l fibre (range 7.7-139.2 mmol GU/1 fibre), with 88% of the
values falling between 20 and 90 mmol GU/1 fibre. After 2 min exposure to an

165
aqueous solution mimicking the myoplasmic environment at rest, the average
glycogen content in the skinned fibres (SFGlyc) was 40.9 ± 3.3 mmol GU/1 fibre,
which represents 73.1 ± 2.8 % of the total glycogen.
Fibres dissected from 6 muscles (6 rats) pre-incubated with glucose and insulin had
significantly (p = 0.0095, Student's two tailed unpaired t-test) higher tGlyc (79.7 ±7.8
mmol GU/l fibre, n = 32) than fibres isolated from freshly dissected muscles. In the
fibres from treated muscles, tGlyc ranged between 8.0 and 200.8 mmol GU/1 fibre,
with 88 % of values falling between 20 and 140.3 mmol GU/1 fibre. The proportion
(81.6 ± 2.8 %) ofSFGlyc (64.5 ± 7.1 mmol GU/1 fibre) in fibres from glucose and
insulin treated muscles was slightly higher, but not statistically significant (p =
0.0502, Student's two tailed unpaired t-test, n = 32), than that in the non-treated fibres.
In the experiments described below, the glycogen content in a skinned fibre segment
subjected to a given set of conditions ('test') was related to that of an adjacent skinned
fibre segment used as 'control'. To validate this experimental strategy the difference
in SFGlyc between two adjacent segments of the same fibre was determined. The data
obtained with 7 individual fibres showed that this difference (mean value: 2.9 ± 4.4
mmol GU/1 fibre) was not statistically significant from zero (Student's two-tailed
paired t-test).
The contractile responsiveness to T-system depolarization of mechanically skinned
fibres from rat EDL muscles
There was no significant difference (p = 0.2862; two tailed unpaired t-test) in
contractile responsiveness to T-system depolarization between fibres from freshly

166
dissected muscles and those from muscles incubated with glucose and insulm.
Therefore in this section only the data obtained from fibres prepared from freshly
dissected muscles are presented.
Figure 6.4 shows a sample trace of the isometric force responses produced by rat
skinned fibres when subjected first to a series of depolarization/repolarization cycles.
2+' 2+ then briefly to a low [Mg ] solution, which promotes T-system independent-SR Ca
release, and finally to a maximally Ca -activatmg solution. The fibre that produced
the data shown in Figure 6.4 developed twenty T-system depolarization-induced force
responses to 75 % run-down (R-D75o/„), with the highest response being equal in
amplitude with the maximum Ca -activated force response (CaFmax) and the low
74-
Mg -induced response being equivalent to 70% of CaFmax- As explained in the
Methods, for each fibre activated by T-system depolarization to run-down and then by 74-
exposure to the high [Ca ] solution (i.e. subjected to the complete
depolarization/repolarization protocol) the response capacity was calculated by adding
the amplitudes of the depolarization-induced responses to 75% run-down and then
dividing this sum by CaFmax • The response capacity for the fibre depicted in Figure
6.4 was 12.8 equivalent maximum Ca'^-activated force responses.
Under the conditions used in this study, the average number of responses to 75% run
down and the average response capacity of a population of 17 skinned fibre segments
from freshly dissected rat EDL muscles was 18.4 ± 1.7 and 26.4 ± 2.7, respectively.
Ten of these fibre segments were subjected to the complete
depolarization/repolarization protocol described in the Methods, but the other seven
were not exposed to the maximum Ca^^-activating solution since they were

167
4 5 0.12 mN
6 7 8 9
Na+ D1FR„3,
^ •^''max
LMg'*
Figure 6.4 An example of the depolarization-induced force responses developed by
an EDL fibre to 75 % run-down.
Time scale, 30 s, except during Na* depolarizations and low [Mg "1 (LMg '*')
responses (2 s). CaFmax, maximum Ca^^-activated force; DlFRmax, maximum T-system
depolarization -induced force response; R-Dys-Zo, the force response elicited by the
fibre at 75 % run-down (for this fibre this was the 20* response in the sequence). The
response capacity for this fibre was 12.8 equivalent maximum Ca ^-activated force
responses.

168
subsequently used for determining SFGlyc at mn-down (see below). For these 7
fibres, the response capachy was calculated using a value for CaFmax that was
estimated from the average relative amplitude of the maximum depolarization-
induced force responses (82. 2 ± 6.8% of CaFmax) developed by the 10 fibres
subjected to the complete protocol. Note that there was no statistically significant
difference between the response capachies of the fibres subjected to the complete or
incomplete depolarization/repolarization protocol (Student's unpaired two-tailed t-
test; p = 0.2554). Nine of the 10 fibres that were subjected to the complete protocol
74-
were also exposed to the low [Mg ] solution, immediately after the 75% run-down
point (see Methods). The average force response produced by the fibres in this
solution was 77.8 ± 7.2 % of CaFmax, suggesting that, under the experimental
conditions used in this study, the loss of fibre response capacity at run-down was not 74-
due to SR Ca depletion or to use-related alterations in the functional status of RyRs.
SR Ca''^- release induced by T-system depolarization in mechanically skinned fbres
from rat EDL muscle is not accompanied by detectable loss of fbre glycogen.
Since in this study the average time spent by the test fibre segments in an aqueous
solution, as part of the depolarization/repolarization experiment, was 38.4 ± 4.3 min
(range: 20.6 to 54.2 min), h was necessary to determine the proportion ofSFGlyc lost
from the fibres into the bathing solution, independent of the T-system depolarization-
induced events. For this purpose SFGlyc was measured in 4 pairs of skinned fibre
segments, where one segment of a pair was incubated for 2 min (control) and the
other for 32 min (test) in the Polarizing solution. As shown by this experiment, the
test skinned fibre segments lost on average 36.0 ± 12.3% of their inhial glycogen
content durmg the 30 min incubation in the Polarizing solution.
169
To establish the extent of glycogen loss from rat mechanically skinned muscle fibres
during the T-system depolarization-induced events, SFGlyc was measured in seven
fibre segments that were run-down to 75% (without being subsequently exposed to
the low [Mg ""] or maximally [Ca^*] activating solutions) and compared to the inhial
SFGlyc measured in the adjacent control segments. The result of this experiment
showed that SFGlyc in the mn-down fibre segments was 33.5 ± 13.5% lower (p <
0.05, Student's two-tailed paired t-test) than that in the paired controls.
From the two sets of data given above it is clear that under the experimental
conditions used in this study, there was no detectable loss of glycogen from the
skinned fibre preparation directly related to T-system depolarization-induced SR Ca *
release. One possible reason for this finding is that the rat skinned muscle fibres do
74-
not contain a Ca -sensitive glycogenolytic system. This possibility was tested by
74-
placing one group of skinned fibres into a high [Ca ] solution (30 pM), and another 74-
(the control group) into the Polarizing solution in which the free [Ca ] was less than
0.2 pM. This strategy, which was used by this laboratory for the same purpose in the
toad study (Stephenson etal, 1999), is based on eariier reports (e.g. Ebashi & Endo,
1968) that at high concentrations, Ca^* directiy activates phosphorylase kinase, which
in tum phosphorylates/activates glycogen phosphorylase thereby initiating
glycogenolysis (for review see Picton etal, 1981). After 30 minutes of incubation at
room temperature, SFGlyc in fibres exposed to 30 pM Ca^* (n = 8) decreased by 71.6
+ 6.4 % compared with the control fibres (n = 8) and this difference was statistically
significant (p = 0.0007, Student's two-tailed unpaired t-test). This result suggests that
mechanically skinned fibres of rat EDL, like those of toad iliofibularis muscle.
170
contain an active glycogenolytic system, which is stimulated when the fibre is
exposed to high [Ca^*] for a relatively long (30 min) period of time. However, this
glycogenolytic system, unlike that in the toad skinned fibres, was not activated durin
the brief (3-5 sec) bouts of T-system depolarization-induced sarcoplasmic reticulum
(SR) Ca^* release.
Initial SFGlyc and response capacity in mechanically skinned fbres from rat EDL
muscle
Previously, Stephenson et al. (1999) reported that, under conditions where the
concentrations of ATP and creatine phosphate were maintained high and constant, the
capachy of toad mechanically skinned fibres to respond to T-system depolarization
was positively correlated {P <0.000l) with inhial fibre glycogen concentration. In
other words, toad fibres with a lower initial glycogen content developed fewer force
responses to run-down. In the present study, using the same protocols for measuring
fibre glycogen content and testing contractile responsiveness to T-system
depolarization as those used in the toad study, no significant correlation (r = 0.2249;
P= 0.0544) was found between fibre response capacity and initial glycogen content
for 17 rat mechanically skinned fibres, whose SFGlyc ranged from 11.9 to 97.2 mmol
GU/1 fibre (Figure. 6.5).
Discussion
This is the first study in which single mechanically skinned fibres of rat EDL muscle
were investigated with respect to glycogen content and contractile responsiveness to
T-system depolarization when activated in solutions containing high levels of ATP (8
mM) and creatine phosphate (10 mM).
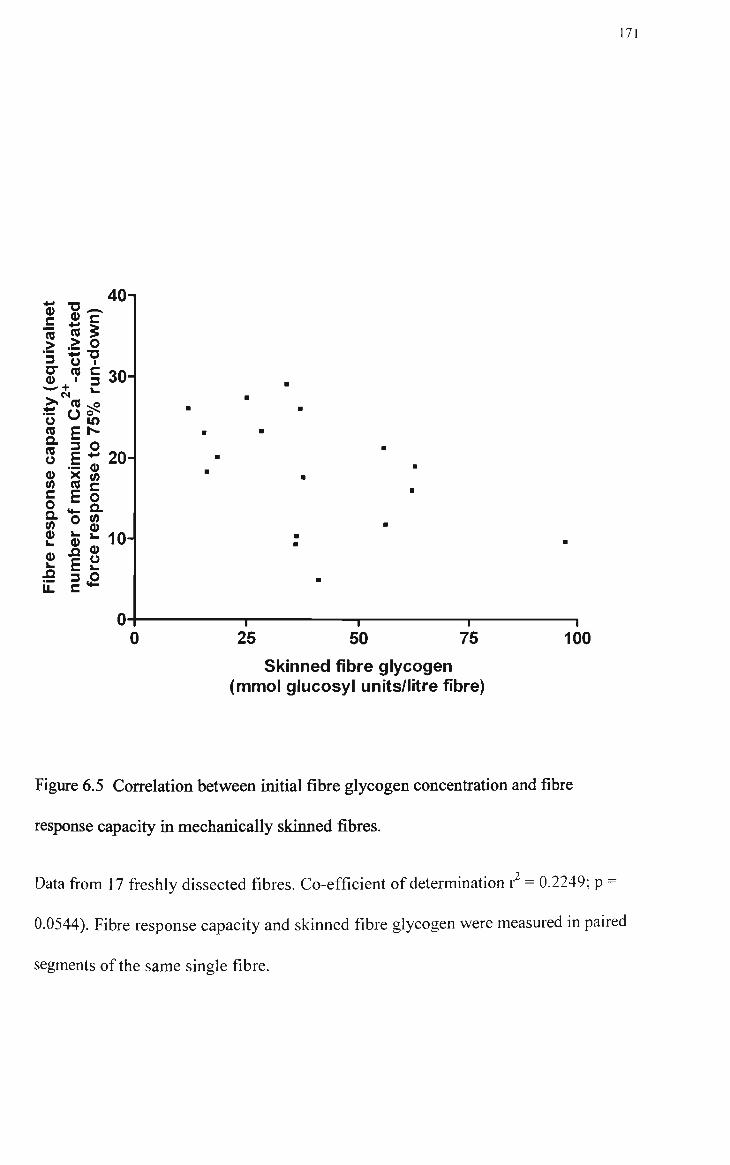
171
0) "D ^^ 40n
o
>• «
o E (0 (0
II (0 0)
c o •o
c 3
30-
0) 0) n E 3 C
lO
o : ;2o <n c o a (A O »- 10-u a
—f—
25 —r— 50 75 100
Skinned fibre glycogen (mmol glucosyl units/litre fibre)
Figure 6.5 Correlation between iiutial fibre glycogen concenfration and fibre
response capacity in mechanically skinned fibres.
Data from 17 freshly dissected fibres. Co-efficient of determination r = 0.2249; p =
0.0544). Fibre response capachy and skinned fibre glycogen were measured in paired
segments of the same single fibre.

172
The mean total glycogen concentration in 53 rat fibres from freshly dissected muscles
was 58.1 mmol GU/1 fibre or 162.7mmol GU/kg dry weight. The unit conversion was
made on the basis that Ig mammalian muscle contains 0.23g protein, 0.125g
extracellular water and 0.645g intracellular water (Meissner etal, 1973). The average
total glycogen value for freshly dissected fast-twhch rat EDL fibres, determmed by a
microfluorometric technique not involving analyte amplification (Nguyen etal,
1998b), is similar to that (-162 mmol/kg dry weight) previously found by Hmtz etal
(1982) for freeze dried fast-twitch fibres from rat plantaris muscle by conventional
fluorometry with analyte amplification.
As part of the T-system depolarization/repolarization protocol, a skinned fibre was
first incubated for 2 mins in the Polarizing solution, which is an aqueous relaxing
solution mimicking the myoplasmic environment. At the end of this period a large
proportion (-73 %) of the total glycogen pool remained associated with the skinned
fibre preparation, possibly trapped within or tightly associated with intracellular
structures such as the SR (Wanson & Drochmans, 1972; Entman etal, 1980; Friden
etal, 1989; Cuenda etal, 1995), while the rest moved as glycogen into the bathing
solution. This value is not significantly different from that previously reported for
toad skinned fibres (74 -85 %; Nguyen etal, 1998b). If the rat skinned fibre was kept
in the Polarizing solution for 30 min, the proportion of glycogen retained by h
decreased only by another 9% (to -64% of the initial value), indicating that the
glycogen loss from the fibre occurred in a biphasic manner, at a fast rate (13.50 %min
') m the first 2 min and -42 times slower (0.32%min'^) thereafter. Based on this result
and that from the toad study (Nguyen etal, 1998b), h is reasonable to suggest that the
two pools of glycogen, which are distinguishable by the pattem of elution from a

173
skinned fibre preparation (of rat or toad) exposed to an aqueous relaxing solution,
represent two different glycogen species which differ either by size and/or by
intracellular location.
When the Ca concentration in the incubating solution was increased to 30 pM, the
rate of glycogen loss from rat skinned fibre preparations was markedly higher
(2.40%min"^) than that in the relaxing solution (0.32%min"^), such that after 30 min
the pool of glycogen retamed by the fibre was only -28% of the initial. This rate of
fibre glycogen loss is similar to that recorded under the same conditions in the toad
study (2.66 %min ' \ Stephenson etal, 1999), in which h was ascertained that -80%
of the glycogen lost in the bathing solution was broken down into glucose-1-
phosphate, the end product of glycogen phosphorolysis. Based on this result it is
concluded that rat skinned fibres, like toad skinned fibres, retain a Ca^^-senshive
glycogenolytic enzyme system even when exposed to an aqueous solution for up to 30
min.
So far, most studies on the regulation of glycogen catabolism in skeletal muscle have
been carried out on whole tissue extracts or on purified enzymes (see references in
Chebotareva etal, 2001; Roach, 2002). Such studies have two major intrinsic
limitations: (i) they involve biochemical alteration of enzyme stmcture and
microenvironment and (ii) they cannot address issues related to the fibre type
specificity of the glycogenolytic process. From the data presented here and in the
previous study of Stephenson etal (1999), h is clear that, single, mechanically
skinned fibres of both rat and toad skeletal muscle possess an endogenous
glycogenolytic system as well as an experimentally accessible intracellular milieu.
174
Furthermore, these fibres can be typed by microelectrophoretic analysis ofMHC
composhion (Nguyen & Stephenson, 2002; O'Connell etal, 2003). On this basis it is
proposed that mechanically skinned, single fibre preparations, which proved to be
extremely valuable in studies of muscle contractility (Lamb 2002 a & b),
heterogenehy (Bortolotto et al., 2000) and plasticity (Bortolotto etal, 1999;
Bortolotto etal, 2001) would be well suited for more physiologically meaningfiil
studies of regulation of glycogen catabolism in vertebrate skeletal muscle.
It has been previously reported (Bames etal, 2001) that the total glycogen content of
rat EDL muscle (determined colorimetrically by the PAS method in bundles of fibres)
is significantly increased following incubation of the whole muscle in a Krebs
solution containing glucose and insulin. In the present study, the average total
glycogen content of single fibres isolated from rat EDL muscles treated with glucose
and insulin was significantly higher than that of fibres from control muscles,
confirming the data of Bames etal (2001). The glucose-insulin treatment did not
eliminate low glycogen fibres, but increased the glycogen content and relative
proportion of the high glycogen fibres. Since the outcome of these effects is an
increase in muscle heterogeneity with respect to fibre glycogen content (as reflected
by the broader range of values recorded for fibres from treated muscles), it is
concluded that in studies concemed with the relationship between glycogen
concentration and other biochemical or physiological properties of single fibres, the
parameter of interest and glycogen content should be determined in the same fibre,
particularly if the muscle glycogen level is manipulated experimentally prior to single
fibre analyses. It should also be noted that the average value of SFGlyc (expressed as
a proportion of tGlyc) in fibres from muscles incubated with glucose and insulin was
175
not significantly different from that in fibres from control muscles mdicating that this
treatment affected in a similar manner the pool of glycogen retained by and that lost
from the skinned fibre exposed to an aqueous relaxing solution.
hi toad skinned fibres (Stephenson etal, 1999), T-system depolarization-induced SR
Ca ^ release was accompanied by a substantial loss of fibre glycogen (-76% of
initial). This was not observed with rat skinned fibre preparations even though they
contained, as argued above, a Ca^^-activatable glycogenolytic system. The apparent
lack of glycogen depletion in rat fibres subjected to the same
depolarization/repolarization protocol as that used in the toad study (Stephenson etal,
74-
1999) could be explained for example by too little Ca being released from the SR
during the depolarization step in the rat fibres or by a lower sensitivity to Ca^^ of the
rat glycogenolytic system.
Both in this study and in the toad study, the amount of Ca ^ released from the SR in
response to T-system depolarization could be estimated from the amplitude of the
depolarization-induced force developed by the skinned fibre. However, this parameter
74-
is determined not only by the amount of Ca released from the SR for each 94-
depolarization bout, but also by the sensitivity to Ca of the contractile apparatus. 74-
The sensitivity of the contractile apparatus to Ca in rat EDL fibres is comparable to
that in toad iliofibularis fibres (Fink etal, 1986). Moreover, the average amplhude of
the maximum depolarization-induced force responses produced by the rat EDL
skinned fibres was similar (-80% of CaFmax) to that observed previously for the toad
iliofibularis fibres. Taken together, these data suggest that the amount of Ca~^ released
from the SR in response to T-system depolarization is similar in the rat and toad

176
fibres, and that the inability to detect T-system depolarization-mduced glycogen
depletion in rat skinned fibres is more likely to be related to a lower sensitivity to Ca^*
of the rat glycogenolytic system. Currently there is no published information
regarding potential differences between rat and toad skeletal muscles with respect to
the sensitivity to Ca of the glycogen phosphorylase kinase activity.
Another possibility for explaining the differences in the extent of T-system
depolarization-induced glycogen depletion m skinned fibres from rat and toad
muscles is that toad fibres were used at the normal physiological temperature for
amphibians (Portner et al, 1994) while rat fibres were used at temperatures well below
the normal physiological range for mammalian muscle (Severinsen & Munch, 1999).
Earlier research on muscle fatigue in humans has produced compelling evidence that
glycogen content and mammalian skeletal muscle performance are positively
correlated (for reviews see Green, 1991; Fitts, 1994). Later it was found that the
depletion of intracellular glycogen stores associated with exercise-induced decrease in
human muscle function is not accompanied by drastic changes in the cellular pool of
ATP (Vollestad etal, 1988; reviewed by Green, 1991; Fitts, 1994), a surprising result
given the well established role of glycogen as a rapid metabolic source of ATP for
anaerobic glycolysis. One of the ideas put forward to explain the tight correlation
between exercise-induced reduction in human muscle performance and endogenous
glycogen depletion, when the whole cell ATP concentration is still relatively high, is
that muscle glycogen plays a protective role in excitation-contraction (E-C) coupling
processes that is independent of hs metabolic function (Green, 1991; Fitts, 1994). So
far, the strongest support for this idea has come from the toad study (Stephenson et

177
al, 1999) in which h was shown that when activated m high [ATP]-[creatme
phosphate] solutions, mechanically skinned iliofibularis muscle fibres containing
lower levels of inhial glycogen produce fewer T-system depolarization induced force
responses to run-down than skinned fibres with higher glycogen content.
hi the present study, the same protocols for fibre dissection, skinning and
depolarization/repolarization as those used in the toad study (Stephenson etal, 1999)
found no close correlation between initial glycogen content and fibre response
capacity in rat mechanically skinned EDL muscle fibres. A possible explanation for
this resuh is that glycogen does not play a protective, non-metabolic role in E-C
coupling events in rat mechanically skinned fibres. This possibility is not fully
consistent, however, with the finding that rat skinned fibres, which retained a
relatively large proportion (-67%) of initial glycogen throughout the process of T-
system depolarization induced activation, displayed an average response capacity
(18.4) that was about 4 times higher (P < 0.0001) than that obtained previously for
toad mechanically skinned fibres (4.6 ± 0.8, n = 22; see Figure. 4 in Stephenson etal,
1999) in which the rate of fibre glycogen loss associated with the T-system
depolarization induced activation process was quite high (at least one order of
• 74-
magnitude higher than that elicited by exposure of the skinned fibres to a high [Ca ]
containing solution for 30 min). Indeed, the largest response capacity value displayed
by a single fibre segment in the present study was 29.1, while the highest response
capacity value displayed by a fibre segment in the toad study was 12.9 (Stephenson et
al, 1999). The possibility that glycogen does not play a protective role in the
contractile responsiveness of rat skinned muscle fibres to T-system depolarization
activation is also inconsistent with the data of Bames etal (2001), who found that

178
mechanically skinned fibres from rat EDL muscles in which the glycogen content
(determined in bundles of fibres) was elevated by the glucose-insulin treatment
discussed above reached 50% mn-down after a larger number of T-system
depolarizations than their paired controls.
An altemative explanation for the lack of correlation between initial glycogen content
and responsiveness to T-system depolarization in rat skinned fibres is that the
experimental strategy, which proved to be well suited for probing the non-metabolic
role of glycogen in toad iliofibularis muscle fibre excitability cannot be used for the
same purpose with fibres of rat EDL muscle. This is because, under the condhions
used in this study, the endogenous glycogen level in the skinned fibre preparations
activated in the presence of high [ATP] and [creatine phosphate] does not fall below a
'critical value' (with respect to E-C coupling processes) before other non-glycogen
related factors, such as the redox and/or Ca^^-dependent phosphorylation status of
reactive groups on the RYR/Ca release channel or DHPR/voltage sensor (Han &
Bakker, 2003; Stephenson etal, 1995), ultimately limit the capacity of the fibres to
respond to T-system depolarization. Based on this rationale one would predict that a
strategy similar to that used in the toad study, but including a method that would
increase the rate of glycogen depletion during T-system depolarization induced
contractions without affecting the E-C coupling related processes in a glycogen-
dependent manner, should enable the experimenter to gain further insights into the
non-metabolic role of glycogen in mammalian muscle fibre excitability by using rat
mechanically skinned fibres as an experimental model.

179
hi summary, this study has shown that mechanically skinned fibres of rat EDL retain a
large proportion of endogenous glycogen when exposed to an aqueous low [Ca^^]
solution, but lost most of it when exposed to a high [Ca^^] solution for 30 min,
probably due to the action of a Ca2 -sensitive glycogenolytic system. These data
suggest that rat mechanically skinned EDL fibres, like toad iliofibularis muscle fibres
could be easily used in studies concemed with vertebrate skeletal muscle glycogen
and its regulation as they relate to MHC-based fibre type. When subjected to T-
system depolarization (by ionic substitution), rat mechanically skinned fibres did not
appear to loose any detectable glycogen above that lost through incubation in a
relaxing aqueous solution and there was no correlation between their initial glycogen
content and their excitability.
180
CONCLUDING REIVTARKS
The data obtained from the four studies described in this thesis lead to several major
conclusions of conceptual and methodological nature:
• The responsiveness of rat EDL mechanically skinned fibres to T-system
depolarisation induced by ion substitution (described by the parameters
maxDIFR and 750/JR-D), using the Lamb & Stephenson (1990a) method, varies
with animal age over the broad period currently regarded as the 'adult' stage
of rat development (4-21 wks), with 4 wks and 21 wks fibres being the worst
and the best performers, respectively. Two potential contributors to this
phenomenon are the age-related changes in the molecular structure/function of
the T-system membrane and fibre diameter.
• In rat skeletal muscle, participants/events in E-C coupling reach the adult stage
in a non-synchronized manner. This idea (suggested also by a number of
published studies) is supported by the finding that the two seemingly unrelated
descriptors of E-C coupling processes in mechanically skinned fibres of the rat
EDL muscle examined in this work, maxDIFR and 750/JR.-D, display a slightly
different pattem of change with age over the period 4-21 wks postnatal.
• The responsiveness to T-system depolarisation of mechanically skinned fibres
from 21 wk-old rat skeletal muscle [determined with the Lamb & Stephenson
protocol (1990a)] varies with the fibre type (indicated by MHC composhion)
and identity (probably the fiinction) of the muscle of origin, such that type IIB

181
EDL fibres perform overall significantiy better than type I SOL fibres and type
IIB stemomastoid fibres. The data obtained m this thesis indicate that the
Lamb & Stephenson protocol (1990a) would require further refinement if
needed to investigate at the cellular level, E-C coupling processes in rat
skeletal muscles other than EDL.
• The "voltage window" phenomenon, first described by Chua & Dulhunty
(1988) for bundles of rat SOL fibres, can also be observed in single,
mechanically skinned rat SOL fibres subjected to the T-system depolarisation
protocol developed for rat EDL fibres.
• Under a set of storage conditions simulating those used in T-system
depolarisation experiments with mechanically skinned fibres (alternating, brief
incubations under oil, at RT and at 4° C), rapidly dissected rat skeletal muscles
(EDL and SOL) retain a large proportion (> - 70%) of endogenous glycogen
and phosphorylase activities for up to 3 hrs.
• The temperature sensitivity of glycogenolytic processes in skeletal muscle
may be species specific. This idea is supported by the finding that the stability
of glycogen and phosphorylase activities in rat EDL and SOL muscles
incubated under oil at RT or 4°C was markedly lower than that of glycogen
and phosphorylase activities in toad iliofibularis muscle stored under the same
conditions.

182
Mechanically skinned fibres of rat skeletal muscle may be used to investigate
the relationship between glycogenolytic processes and fibre type. This
conclusion is based on the well established feasibility ofMHC isoform
analyses in single rat fibres and on the finding that, when exposed to aqueous
relaxing solutions, mechanically skinned fibre preparations retain a large
proportion of glycogen, which decreases quite markedly in the presence of
high [Ca'1.
The experimental protocol used to investigate the relationship between
glycogen content and responsiveness to T-system depolarisation of toad
mechanically skinned muscle fibres when glycogen was not required as an
energy source may not be used, without further modification, for the same
purpose with rat mechanically skinned fibres. This is likely to be due to the
stability of the glycogen pool associated with rat skinned fibre preparation,
during the T-system depolarisation-induced activation process.

183
REFERENCES
Adams GR, McCue SA, Zeng M & Baldwin KM (1999). Time course of myosin
heavy chain transitions in neonatal rats: importance of innervation and thyroid state.
Am I Physiol 216, R954-R961.
Aidley, DJ (1998). The physiology of excitable cells. 4th Ed. Cambridge University
Press, Cambridge, UK.
Albis A, Couteaux R, Janmot C & Roulet A (1989). Specific programs of myosin
expression in the postnatal development of rat muscles. Eur J Biochem 183, 583-590.
Allen DG, Lannergren J & Westerblad H (1995). Muscle cell function during
prolonged activity: cellular mechanisms of fatigue. Exp Physiol %0, 497-527.
Alnaqeeb MA & Goldspink G (1986). Changes in fibre type, number and diameter in
developing and ageing skeletal muscle. JAnat 153, 31-45.
Armstrong RB & Phelps RO (1984). Muscle fibre type composition of the rat
hindlimb. Am JAnat 111, 259-272.
Asmussen E (1979). Muscle fatigue. MedSciSports.ll, 313-21
184
Bagshaw CR (1993). Muscle contraction. 2°'' Ed. London: Chapman & Hall.
Bakker AJ, Head SI, Wareham AC and Stephenson DG (1998). Effect of clenbuterol
on sarcoplasmic reticulum function in single skinned mammalian skeletal muscle
fibers. Am J Physiol 274, C1718-C1726.
Bakker AJ & Berg HM (2002). Effect of taurine on sarcoplasmic reticulum function
and force in skiimed fast-twitch skeletal muscle fibres of the rat. J Physiol 53S, 185-
194.
Baldwin KM (1984). Muscle development: neonatal to aduh. In: Ed RL Terjung,
Exercise and sport sciences reviews. MacMillan Pub Co., NY, USA. 12, 1-19.
Bailor DL & Poehlman ET (1993). Exercise intensity does not affect depression of
resting metabolic rate during severe diet restriction in male Sprague-Dawley rats. J
Nutr 123, 1270-1276.
Bar A & Pette D (1988). Three fast myosin heavy chams in aduh rat skeletal muscle.
FEBSLett235, 153-155.
Bamard RJ, Edgerton VR, Fumkawa T 8c Peter JB (1971). Histochemical,
biochemical and contractile properties of red, white, and intermediate fibers. Am J
Physiol 220,410-414.
185
Bames M, Gibson LM & Stephenson DG (2001). hicreased muscle glycogen content
is associated with increased capacity to respond to T-system depolarization in
mechanically skinned skeletal muscle fibres from the rat. Pfugers Arch 442, 101-106.
Beam KG, Knudson CM 8c Powell JA (1986). A lethal mutation in mice eliminates
the slow calcium current in skeletal muscle cells. Nature 2)20, 168-170.
Beam KG & Knudson CM (1988). Effect of postnatal development on calcium
currents and slow charge movement in mammalian skeletal muscle. J Gen Physiol 9\,
799-815.
Bergmeyer HU, Horder M & Markowetz D (1983). Reliability of laboratory resuhs
and practicability of procedures. In: Eds Bergmeyer HU, Bergmeyer J & Grable M.
Methods of enzymatic analysis. Weinheim: Verlag Chemie. pp. 21-39.
Bergstrom J, Hermansen L, Hultman E & Saltin B (1967). Diet, muscle glycogen and
physical performance. Acta Physiol Scand 71, 140-150
Bertocchini F, Ovitt CE, Conti A, Barone V, Scholer HR, Bottinelli R, Reggiani C &
Sorrentino V (1997). Requirement of the ryanodine receptor type 3 for efficient
contraction in neonatal skeletal muscles. EMBO J16, 6956-6963.

186
Blazev R & Lamb GD (1999). Adenosine inhibits depolarization-induced Ca(2^)
release in mammalian skeletal muscle. Muscle Nerve 22, 1674-1683.
Blazev R, Hussain M, Bakker AJ, Head SI & Lamb GD (2001). Effects of the PKA
inhibitor H-89 on excitation-contraction coupling in skinned and intact skeletal
muscle fibres. J Muscle Res Cell Motil 22, 277-86.
Bortolotto S, Stephenson DG & Stephenson GMM (1999). Fibre type populations and
Ca^^-activated properties of single fibres in soleus muscle from SHR and WKY rats.
Am J Physiol 216, C628-C637.
Bortolotto SK, Cellini M, Stephenson DG & Stephenson GM (2000). MHC isoform
composition and Ca(2+)- or Sr(2+)-activation properties of rat skeletal muscle fibers.
Am JPhysiol219, C1564-C1577.
Bortolotto SK, Stephenson DG & Stephenson GM (2001). Caffeine thresholds for
contraction in electrophoretically typed, mechanically skinned muscle fibres from
SHR and WKY rats. Pfugers Arch 441, 692-700.
Bortolotto S & Reggiani C (2002). Cellular and molecular basis of heterogeneity in
contractile performance of human muscles. Basic Appl Myal 12, 7-16.

187
Bottinelli R, Schiaffino S & Reggiani C (1991). Force-velocity relations and myosin
heavy chain isoform compositions of skinned fibres from rat skeletal muscle. /
Physiol431, 655-672.
Bottinelli R, Canepari M, Pellegrino MA & Reggiani C (1996). Force-velocity
properties of human skeletal muscle fibres: myosin heavy chain isoform and
temperature dependence. J Physiol 495, 573-586.
Bottinelli R & Reggiani C (2000). Human skeletal muscle fibres: molecular and
functional diversity. ProgBiophys Mol Biol 13, 195-262.
BottineUi R (2001). Functional heterogeneity of mammalian single muscle fiber: do
myosin isoforms tell the whole story? Pfugers Arch 443, 6-17.
Brenner B (1998). Muscle mechnanics II: skinned muscle fibres. In: H Sugi (Ed).
Current methods in muscle physiology: advantages, problems and limitations. Oxford
University Press, NY, USA. pp. 33-69.
Briggs FN, Poland JL & Solaro RJ (1977). Relative capabilities of sarcoplasmic
reticulum in fast and slow mammalian skeletal muscles. J Physiol 266, 587-594.
Broberg S & Sahlin K (1989). Adenine nucleotide degradation m human skeletal
muscle during prolonged exercise. J Appl Physiol 61, 116-22.

188
Brook MH & Kaiser KK (1970). Muscle fiber types: how many and what kind? Arch
Neural23, 369-379.
Brown DH (1994). Glycogen metabolism and glycolysis in muscle. In: AG Engel &
C Franzini-Armstrong (Eds), Myology. Vol 1, Chpt 25. McGraw-Ifill, New York:
US. pp. 648 - 664.
Bmm G, Stefani E & Rios E (1987). Simultaneous measurements of Ca current and
intracellular Ca concentrations in single muscle fibres of the frog. Can J Physiol
Pharmacol65, 6S\-6S5.
Calder PC & Geddes R (1990). Post mortem glycogenolysis is a combination of
phosphorolysis and hydrolysis. In t J Biochem 22, 847-856.
Carraro U & Catani A (1983). A sensitive SDS-PAGE method separating myosin
heavy chain isoforms of rat skeletal muscles reveals the heterogeneous nature of the
embryonic myosin. Biochem BiophysRes Comm 116, 793-802.
Chandler WK, Rakowski RF & Schneider MF (1976). Effects of glycerol treatment
and maintained depolarization on charge movement in muscle. JPhysiol254, 285-
316.

189
Chaplin ER, Nell GW & Walker SM (1970). Excitation-contraction latencies in
postnatal rat skeletal muscle fibers. Exp Neurol 29, 142-151.
Chasiotis D (1985). Effects of adrenaline infusion on cAMP and glycogen
phoshporylase in fast twitch and slow twitch rat muscles. Acta Physiol Scand 125,
537-540.
Chasiotis D, Edstrom L, Sahlin K & Sjoholm H (1985). Activation of glycogen
phosphorylase by electrical stimulation of isolated fast twitch and slow twitch
muscles from rat. Acta Physiol Scand 123, 43-47.
Chebotareva NA, Klinov SV & Kurganov BI (2001). Regulation of muscle glycogen
phosphorylase by physiological effectors. Biotechnol Genet EngRev 18, 265-297.
Chin ER & Allen DG (1997). Effects of reduced muscle glycogen concentration on
74-
force, Ca release and contractile function in intact mouse skeletal muscle. J Physiol
498, 17-29.
Chua M & Dulhunty AF (1988). Inactivation of excitation-contraction coupling in rat
extensor digitomm longus and soleus muscles. J Gen Physiol9\, 131-151.
Clausen T (2003). Na' -K' pump regulation and skeletal muscle contractility. Physiol
Rev%3, 1269-1324.
190
Close R (1964). Dynamic properties of fast and slow skeletal muscles of the rat
during development. J Physiol 173, 74-95.
Close Rl (1972). Dynamic properties of mammalian skeletal muscles. Physiol Rev
52, 129-97.
Cohen P (1983a). Phosphorylase kinase from rabbit skeletal muscle. Meth Enzymal
99, 243-250.
Cohen P (1983b). Protein phosphorylation and the conttol of glycogen metabolism in
skeletal muscle. Philos Trans R Soc LondB Biol Sci 302, 13-25.
Cohn C & Joseph D (1971). Feeding habhs and daily rhythms in tissue glycogens in
the rat. Proc Soc Exp Biol Med 137, 1305-1306.
Conlee RK, Rennie MJ & Winder WW (1976). Skeletal muscle glycogen content:
diumal variation and effects of fasting. Am JPhysiol23\, 614-618.
Conlee RK, Mclane JA, Rennie MJ, Winder WW & Hohoszy JO (1979). Reversal of
phosphorylase activation in muscle despite continued confractile activity. Am J
Physiol231, R291-R296.
191
Conte Camerino D, De Luca A, Mambrini M 8c Vrbova G (1989). Membrane ionic
conductances in normasl and denervated skeletal muscle of the rat during
development. Pfugers Arch 413, 568-570.
Coonan JR & Lamb GD (1998). Effect of transverse-tubular chloride conductance on
excitability in skinned skeletal muscle fibres of rat and toad. J Physiol 509, 551-564.
Corconado R, Morrissette J, Sukhareva M & Vaughan DM (1994). Stmcture and
function of ryanodine receptors. Am J Physiol 266, C1485-C1504.
Craig R (1994). The stmcture of the contractile filaments. In:. C Franzini-Armstrong
& AG Engel (Eds). Myology 2"* ed. Chpt 5. McGraw-Hill, NY: USA. pp. 134-175.
Csemoch L (1999). Regulation of the ryanodine receptor calcium release channel of
the sarcoplasmic reticulum in skeletal muscle. Acta Physiol Hung %6, 77-97.
Cuenda A, Nogues M, Gutierrez-Merino C & de Meis L (1993). Glycogen
74- •
phosphorolysis can form a metabolic shuttle to support Ca uptake by sarcoplasmic
reticulum membranes in skeletal muscle. Biochem Biophys Res Comm 196, 1127-
1132.
192
Cuenda A, Henao F, Nogues M & Gutierrez-Merino C (1994). Quantification and
removal of glycogen phosphorylase and other enzymes associated with sarcoplasmic
reticulum membrane preparations. Biochim Biophys Acta 1194, 35-43.
Cuenda A, Nogues M, Henao F & Gutierrez-Merino C (1995). Interaction between
glycogen phosphorylase and sarcoplasmic reticulum membranes and its functional
role. J Biol ChemllO, 11998-12004.
Cullen MJ, Hollingworth S & Marshah MW (1984). A comparative study of the
transverse tubular system of the rat extensor digitorum longus and soleus muscles. /
^/7an38, 297-308.
Curtis BM & Catterah WA (1983). Solibulization of the calcium antagonist receptor
from the rat brain. J Biol Chem 258, 7280-7283.
Curtis BM & Catterall WA (1986). Reconstitution of the voltage-sensitive calcium
channel purified from skeletal muscle transverse tubules. Biochem25, 3077-3083.
Damiani E & Margreth A (1994). Characterization study of the ryanodine receptor
and of calsequestrin isoforms of mammalian skeletal muscles in relation to fibre
types. J Muscle Res CeU Motil 15, 86-101.

193
Damiani E, Sacchetto R & Margreth A (1999). Regulatory protein phospholamban is
not expressed in rat soleus muscle. J Muscle Res Cell Motil20, 90.
De Barsy T & Hers H-G (1990). Normal metabolism and disorders of carbohydrate
metabolism. In: JB Harris & DM TumbuU (Eds), Clinical endocrinology and
metabolism. 4, 499-522.
Delbono O & Meissner G (1996). Sarcoplasmic reticulum Ca ^ release in rat slow-
and fast-twitch muscles. J Membrane Biol 151, 123-130.
Dirksen RT (2002). Bi-directional coupling between dihydropyridine receptors and
ryanodine receptors. FrontBioscil, d659-70.
Donaldson SKB (1985). Peeled Mammalian skeletal muscle fibers. Possible
stimulation of Ca^^ release via a transverse tubule-sarcoplasmic reticulum
mechanism. J Gen Physiol %6, 501-525.
Drachman DB & Johnston DM (1973). Development of a mammalian fast muscle:
dynamic and biochemical properties coiTclated. JPhysiol234, 29-42.
Dulhunty AF (1992). The voltage-activation of contraction in skeletal muscle. Prog
Biophys Molec Biol 57, 181 -223.
194
Dulhunty AF & Dlutowski M (1979). Fiber types in red and white segments of the rat
stemomastoid muscle. Am JAnat 156, 51-62.
Dulhunty AF & Gage PW (1983). Asymmetrical charge movement in slow- and fast-
twitch mammahan muscle fibres in normal and paraplegic rats. J Physiol 341, 213-
231.
Dulhunty AF & Gage PW (1988). Effects of extracellular calcium concentration and
dihydropyridines on contraction in mammalian skeletal muscle. JPhysiol399, 63-80.
Dulhunty AF, Haarmann CS, Green D, Laver DR, Board PG 8c Cararotto MG (2002).
Interactions between dihydropyridine receptors and ryanodine recpetors in striated
muscle. Prog Biophys Molec Biol 19, 45-75.
Dulhunty AF & Pouliquin P (2003). What we don't about the structure of ryanodine
receptor calcium release channels. Clin Exp Pharmacol Physiol 30, 713-723.
Dutka TL & Lamb GD (2000). Effect of lactate on depolarization-induced Ca ^
release in mechanically skiimed skeletal muscle fibers. Am J Physiol 21%, C517-
C525.
Dux L (1993). Muscle relaxation and sarcoplasmic reticulum function in different
muscle types. Rev Physiol Biochem Pharmacol \22, 69-147.

195
Ebashi S & Endo M (1968). Calcium ion and muscle contraction. Prog Biophys Mo I
5/0/18,123-178.
Edge MB (1970). Development of apposed sarcoplasmic reticulum at the T system
and sarcolemma and the change in orientation of triads in rat skeletal muscle. Dev
Biol 23,634-650.
Edman KA, Reggiani C, Schiaffino S, & te Kronnie G (1988). Maximum velocity of
shortening related to myosin isoform composition in frog skeletal muscle fibres. /
Physiol395, 679-694.
Endo M (1977). Calcium release from the sarcoplasmic reticulum. Physiol Rev 51,
71-108.
Endo M & Bno M (1980). Specific perforation of muscle cell membranes with
preserved SR functions by saponin treatment. J Muscle Res Cell Motil 1, 89-100.
Enoka RM (1995). Mechanisms of muscle fatigue: central factors and task
dependency. JElectramyogr Kinesiol 5, 141-149.

196
Entman M. L, Keslensky SS, Chu A & Van Winkle WB (1980). The sarcoplasmic
reticulum-glycogenolytic complex in mammalian fast twitch skeletal muscle. J Biol
a?em 255, 6245-625.
Eusebi F, Miledi R & Takahashi T (1980). Calcium transients in mammalian muscles.
Nature2%4,560-56\.
Ferreira LDM, Pahner TN & Foumier PA (1998). Prolonged exposure to halothane
and associated changes in carbohydrate metabolism in rat muscles in vivo. J Appl
Physiol %4, 1470-1474.
Fill MD & Best PM (1988). Contractile activation and recovery in skinned frog
muscle stimulated by ionic substitution. Am J Physiol 254, C107-C114.
Fill M & Copello JA (2002). Ryanodine receptor calcium release channels. Physiol
Revn, 893-922.
Fmk RH, Stephenson DG & Williams DA (1986). Potassium and ionic strength
effects on the isometric force of skinned twitch muscle fibres of the rat and toad. /
Physiol 310,311-331.

197
Fink RH & Stephenson DG (1987). Ca' ' -movements in muscle modulated by the
state of K+-channels in the sarcoplasmic reticulum membranes. Pfugers Arch 409,
374-380.
Fitts RH (1992). Subsfrate supply and energy metabolism during brief high intensity
exercise: importance in limiting performance. In DR Lamb & CV Gisolfi (Eds).
Energy metabolism in exercise and sport. Chpt 2. Cooper Publishing, Carmel, IN,
USA. pp. 53-106.
Fitts R (1994). Cellular mechanisms of muscle fatigue. Physiol Rev 14, 49-94.
Flucher BE, Conti A, Takeshima H 8c Sorrentino V (1999). Type 3 and type 1
ryanodine receptors are localized in triads of the same mammalian skeletal muscle
fibers. J Cell Biol \46, 621-629.
Fosset M, Jaimovich E, Delpont E & Lazdunski M (1983). [3H] Nitrendipine
receptors in skeletal muscle. J Biol Chem 258, 6086-6092.
Franzini-Armstrong C (1970). Sttidies of the ttiad. 1. Stmcttire of the junction in frog
twitch fibres. J Cell Biol 41, 488-498.
198
Franzini-Armstrong C (1994). The sarcoplasmic reticulum and the transverse tubules.
In: AG Engel & C Franzini-Armstrong (Eds). Myology. T^ Ed. Chpt 6. McGraw-
Hill, NY, USA, pp. 176-199.
Franzini-Arsmstrong C & Protasi F (1997). Ryanodine receptors of striated muscles:
a complex channel capable of multiple interactions. Physiol Rev 11, 699-729.
Friden J, Seger J & Ekblom B (1985). Implementation of periodic acid-
thiosemicarbazide-silver proteinate staining for ultrastructural assessment of muscle
glycogen utilization during exercise. Cell Tissue Res 242, 229-232.
Friden J, Seger J & Ekblom B (1989). Topographical locahzation of muscle
glycogen: an ultrahistochemical study in the human vastus lateralis. Acta Physiol.
Scand \35,3%\-39\.
Froemming GR, Murray BE, Harmon S, Pette D & Ohlendieck K (2000).
Comparative analysis of the isoform expression pattem of Ca(2+)-regulatory
membrane proteins in fast-twitch, slow-twitch, cardiac, neonatal and chronic low-
frequency stimulated muscle fibers. Biochim Biophys Acta 1466, 151-68.
Fryer MW & Stephenson DG (1996). Total and sarcoplasmic reticulum calcium
contents of skinned fibres from the rat. J Physiol 493, 357-370.

199
Futatsugi A, Kuwajima G & Mikoshiba K (1995). Tissue-specific and
developmentally regulated altemative splicing in mouse skeletal muscle ryanodine
receptor mRNA. Biochem J305, 373-378.
Galler S, Schmitt TL & Pette D (1994). Stretch activation, unloaded shortenmg
velocity, and myosm heavy chain isoforms of rat skeletal muscle fibres. J Physiol
478,513-521.
Galler S, Hilber K, Gohlsch B & Pette D (1997). Two functionally distinct myosin
heavy chain isoforms in slow skeletal muscle fibres. FEBSLet410, 150-152.
Geddes R (1986). Glycogen: a metabolic viewpoint. BiosciRep6, 415-428.
Geiger PC, Cody MJ, Macken RL & Sieck GC (2000). Maximum specific force
depends on myosin heavy chain content in rat diaphragm muscle fibers. J Appl
Physiol S9, 695-103.
Gillis JM (1985). Relaxation of vertebrate skeletal muscle. A synthesis of the
biochemical and physiological approaches. Biochim Biophys Acta 811, 97-145.
Goldspink G (1980). Alterations in myofibril size and structure during growth,
exercise, and changes in environmental temperature.. In: LD Peachy (Ed), Skeletal
muscle. Handbook of Physiology. Sect. 10, Chpt. 18, American Physiological
Society, Bethesda, Maryland, USA. pp. 539-554.

200
Gordon AM, Homsher E & Regnier M (2000). Regulation of contraction in sttiated
muscle. Physiol Rev %0, 853-924.
Gordon AM, Regnier M & Homsher E (2001). Skeletal and cardiac muscle
contractile activation: tropomyosin "rocks and rolls". News Physiol Sci \6, 49-55.
Gorza I (1990). Identification of a novel type 2 fiber population in mammalian
skeletal muscle by combined use of histochemical myosin ATPase and anti-myosin
monoclonal antibodies. JHistochem Cytochem3S, 257-265.
Gottschall J, Zenker W, Neuhuber W, Mysicka A 8c Muntener M (1980). The
stemomastoid muscle of the rat and its innervation. Muscle fiber composition,
perikarya and axons of efferent and afferent neurons. Anat Embryol (Berl) 160, 285-
300.
Green HJ (1991). How important is endogenous muscle glycogen to fatigue in
prolonged exercise? Can J Physiol Pharmacol 69, 290-297.
Hamihon SL, Serysheva I & Straburg GM (2000). Calmodulin and exchation-
contraction coupling. News Physiol Sci 15, 281-284.

201
Han JW, Thieleczek R, Varsanyi M & Heilmeyer LM (1992). Compartmentalized
ATP synthesis in skeletal muscle triads. Biochemistry 31, 377-84.
Han R & Bakker AJ (2003). The effect of chelerythrine on depolarization-induced
force responses in skinned fast skeletal muscle fibres of the rat. Brit J Pharmacol 138,
417-426.
Hannon JD, Lee NKM, Yandong C & Blinks JR (1992). Inositol trisphosphate (InsPs)
causes contraction in skeletal muscle only under artificial conditions: evidence that
Ca ^ release can resuh from depolarization of t-tubules. J Muscle Res Cell Motil 13,
447-456.
Harridge SDR, Bottinelli R, Canepari M, Pellegrino MA, Reggiani C, Esbjorsson M
& Saltin B (1996). Whole-muscle and single-fibre contractile properties and myosin
heavy chain isoforms in humans. Pfugers Arch 432, 913-920.
Hazlewood CF & Nichols BL (1967). In vifro investigation of resting muscle
membrane potential in preweanling and weanling rat. Nature 935-936.
HeiTmann-Frank A, Luttgau HC & Stephenson DG (1999). Caffeine and excitation-
confraction coupling: a stimulating story. J Muscle Res Cell Motil20, 223-237.

202
Hintz CS, Chi MM, Fell RD, Ivy JL, Kaiser KK, Lowry CV & Lowry OH (1982).
Metabolite changes in individual rat muscle fibers during stimulation. Am J Physiol
242, C218-C228.
Hirata Y, Atsumi M, Ohizumi Y & Nakahata N (2003). Mastoparan bmds to
glycogen phosphorylase to regulate sarcoplasmic reticular Ca ^ release in skeletal
muscle. Biochem J311, 81-88.
Hutber CA & Bonen A (1989). Glycogenesis in muscle and liver during exercise. /
Appl Physiol 66, 2811-2817.
Illingworth B, Lamer J & Cori GT (1952). Stmcture of glycogens and
amylopectins.l. Enzymatic determination of chain length. J Biol Chem 199, 631-640.
Jacquemond V, Csemoch L, Klein MG & Schneider MF (1991). Voltage-gated and
calcium-gated calcium release during depolarization of skeletal muscle fibers.
Biophys J60,%61-^13.
James DE & Kraegen EW (1984). The effect of exercise training on glycogen,
glycogen synthase and phosphorylase in muscle and liver. Eur J Appl Physiol 52,
276-281.
Johnson LN (1992). Glyocgen phosphorylase: control by phosphorylation and
allosteric effectors. FASEBJ6, 2274-2282.
203
Kelly AM (1980). T tubules in neonatal rat soleus and extensor digitomm longus
muscles. Dev Biol SO, 501-505.
Kennedy LD, Kirkman BR, Lomako J, Rodriguez IR & Whelan WJ (1985). The
biogenesis of rabbit-muscle glycogen. In: MC Berman, W Gevers & LH Opie (Eds),
Membranes and Muscle. ICSU Symposium Series Volume 6. IRL Press.
Kobayashi M, Takatori T, Nakajima M, Saka K, Iwase H, Nagao M, Niijima M &
Matsuda Y (1999). Does the sequence of onset of rigor mortis depend on the
proportion of muscle fibre types and on intra-muscular glycogen content? IntJLegal
MedlU, 167-171.
Korge P & Campbell KB (1995). The importance of ATPase microenvironment in
muscle fatigue: a hypothesis. Int J Sports Med 16, 172-9.
Kmszynska YT, Ciaraldi TP & Henry RR (2001). Regulation of glucose metabolism
in skeletal muscle. In: LS Jefferson & AD Cherrington (Eds), The endocrine pancreas
and regulation of metabolism. Handbook of Physiology, Sect. 7, Vol 2. Oxford
University Press, USA. pp. 579-607.

204
Kushmerick MJ, Moeriand TS & Wiseman RW (1992). Mammalian skeletal muscle
fibers distinguished by contents of phosphocreatine, ATP and Pi. Proc Natl Acad Sci
USA. 89, 7521-7525.
Kyselovic J, Leddy JJ, Ray A, Wigle J & Tuana BS (1994). Temporal differences in
the induction of dihydropyridine receptor subunits and ryanodine receptors during
skeletal muscle development. J Biol Chem 269, 21770-21777.
Laemmli UK (1970). Cleavage of stmctural proteins during the assembly of
bacteriophage T4. Nature221, 680-685.
La Framboise WA, Daood MJ, Guthrie RD, Butier-Browne GS, Whalen RG & Ontell
M (1990). Myosin isoforms in neonatal rat extensor digitomm longus, diaphragm,
and soleus muscles. Am J Physiol 259, LI 16-L122.
Lamb GD (1992). DHP receptors and exchation-contraction coupling. J Muscle Res
Cell Motil 13, 394-405.
Lamb GD (1993). Ca^^-inactivation, Mg^^inhibition and malignant hyperthermia. /
Muscle Res Cell Motil 14,554-556.
Lamb GD (2000). Excitation-contraction coupling in skeletal muscle: comparison
with cardiac muscle. Clin Exp Pharmacol Physiol 21, 216-224.

205
Lamb GD (2002a). Exchation-contraction coupling and fatigue mechanisms in
skeletal muscle: studies with mechanically skinned fibres. / Muscle Res Cell Motil
23,81-91.
Lamb GD (2002b). Voltage-sensor control of Ca ^ release in skeletal muscle: insights
from skinned fibers. Front Bioscil, d834-d842.
Lamb GD & Walsh T (1987). Calcium currents, charge movement and
dihydropyridine binding in fast- and slow-twitch muscles of the rat and rabbit. /
Physiol393, 595-617.
Lamb GD & Stephenson DG (1990a). Calcium release in skinned muscle fibres of the
toad by transverse tubule depolarization or by direct stimulation. J Physiol 423, 495-
517.
Lamb GD & Stephenson DG (1990b): Control of calcium release and the effect of
ryanodine in skinned muscle fibres of the toad. J Physiol 423, 519-542.
Lamb GD & Stephenson DG (1991). Exchation-contraction coupling in skeletal
muscle fibres of rat and toad in the presence of GTP gamma yS. J Physiol 444, 65-84.

206
Lamb GD & Stephenson DG (1994). Effects of mtracellular pH and [Mg'^] on
excitation-contraction coupling in skeletal muscle fibres of the rat. J Physiol 478,
331-339.
Lamb GD & Stephenson DG (1996). Effects of FK506 and rapamycin on excitation-
contraction coupling in skeletal muscle fibres of the rat. J Physiol 49, 569-576.
Lamb GD & Cellini MA (1999). High intracellular [Ca2+] alters sarcoplasmic
reticulum function in skinned skeletal muscle fibres of the rat. J Physiol 519, 815-27.
Lamb GD, Junankar PR & Stephenson DG (1995). Raised intracellular [Ca2+]
abolishes excitation-contraction coupling in skeletal muscle fibres of rat and toad. /
Physiol 4%9,349-362.
Lamer J, Illingworth B, Cori GT & Cori CF (1952). Stmcture of glycogens and
amylopectins.2. Analysis by stepwise enzymatic degradation. J Biol Chem 199, 641-
651.
Launikonis BS & Stephenson DG (1999). Effects of (3-escin and saponin on the
fransverse-tubular system and the sarcoplasmic reticulum membranes of rat and toad
skeletal muscle. Pfugers Arch 431, 955-965.

207
Launikonis BS & Stephenson DG (2001). Effects of membrane cholesterol
manipulation on excitation-contraction coupling in skeletal muscle of the toad. J
Physiol534, 71-85.
Launikonis BS & Stephenson DG (2002). Tubular system volume changes in twitch
fibres from toad and rat skeletal muscle assessed by confocal microscopy. J Physiol
538, 607-18.
Lee AG (2002). A calcium pump made visible. Curr Opin Struct Biol 12, 547-554.
Lee YS, Ondrias K, Duhl AJ, Ehrlich BE «fe Km DH (1991). Comparison of calcium
release from sarcoplasmic reticulum of slow and fast twitch muscles. JMemb Biol
122, 155-163.
Lees SJ, Franks PD, Spangenburg EE & Williams JH (2001). Glycogen and glycogen
phosphorylase associated with sarcoplasmic reticulum: effects of fatiguing activity. /
Appl Physiol 91, 1638-1644.
Loughlin M (1993). Muscle biopsy. A laboratory investigation. Butterworth-
Heinemann, Oxford, UK
Luff AR (1985). Dynamic properties of fiber bundles from the rat stemomastoid
muscle. ExpNeurol%9, 491-502.
208
Luttgau HC & Spiecker, H (1979). The effects of calcium deprivation upon
mechanical and electrophyiological parameters in skeletal muscle fibres of the frog. /
Physiol296, 411-429.
Luttgau HC & Stephenson DG (1986). Ion movements in skeletal muscle in relation
to the activation of contraction. In: TE Androli, JF Hoffman, DD Fanestil & SG
Schultz (Eds), Physiology of membrane disorders.2^^ Ed. Plenum, NY, USA. pp.
449-468.
Mackrill JJ (1999). Protein-protein interactions in intracellular Ca^^-release channels
function. Biochem J331, 345-361.
Marchand I, Chomeyko K, Tamopolsky M, Hamilton S, Shearer J, Potvin J &
Graham TE (2002). Quantification of subcellular glycogen in resting human muscle:
granule size, number, and location. J Appl Physiol 93, 1598-1607.
Martonosi AN (1994). Regulation of calcium by the sarcoplasmic reticulum. In: AG
Engel & C Franzini-Armstrong (Eds). Myology 2"'' Ed. Chpt 21 A. McGraw-Hill,
NY, USA, pp. 553-584.

209
Matterson DR (1994). Ionic channels in excitable cells, hi: AG Engel & C Franzini-
Armstrong (Eds). Myology 2"' Ed. Chpt 14 A. McGraw-Hill, NY, USA, pp. 391-
404.
Meissner G, Conner GE & Fleischer S (1973). Isolation of sarcoplasmic reticulum by
zonal centrifugation and purification of Ca 2+ -pump and Ca 2+ -binding proteins.
Biochim Biophys Acta 298, 246-69.
Meissner G, Darling E & Eveleth J (1986). Kinetics of rapid Ca ^ release by
sarcoplamic reticulum. Effects of Ca^ , Mg^* and adenine nucleotides. Biochem 26,
236-244.
74-
Meissner G (1994). Ryanodine receptor/Ca release channels and their regulation by
endogenous effectors. Annu Rev Physiol 56, 485-508.
Melendez R, Melendez-Hevia E & Cascante M (1997). How did glycogen stmcture
evolve to satisfy the requirement for rapid mobilization of glucose? A problem of
physical consfraints in stmcture building. JMolEval45, 446-455.
Melendez R, Melendez-Hevia E, Mas F, Mach J & Cascante M (1998). Physical
consfraints in the synthesis of glycogen that infiuence its stmctural homogeneity: a
two-dimensional approach. Biophys Jl5, 106-114.
210
Melzer W (1995). The role of calcium ions in excitation-contraction coupling of
skeletal muscle fibres. Biochim Biophys Acta 1241, 59-116.
Meyer F, Heilmeyer LMG, Haschke RH & Fischer EH (1970). Control of
phosphorylase activity in a muscle glycogen particle. J Biol Chem 245, 6642-6648.
Moisescu DG & Pusch H (1975). A pH-metric method for the determination of the
relative concenfration of calcium to EGTA. Pfugers Arch 355, R122.
Moisescu DG & Thieleczek R (1978). Calcium and strontium concentration changes
within skinned skeletal muscle preparations following a change in the external
bathing solution. J Physiol 215, 241-262.
Moss RL, Diffee GM 8c Greaser ML (1995). Contractile properties of skeletal muscle
fibers in relation to myofibrillar protein isoforms. Rev Physiol Biochem Pharmacol
126, 1-62.
Murayama T & Ogawa Y (2002). Roles of two ryanodine receptor isoforms
coexisting in skeletal muscle. Trends CardiovascMed 12, 305-311.
Musch Tl, Warfel BS, Moore RL 8c Larach DR (1989). Anaesthetic effects on liver
and muscle glycogen concentrations: rest and post exercise. J Appl Physiol 66, 2895-
2900.

:ii
Natori R (1949). On the mechanism of muscle contraction (in Japanese). J Physiol
Soc Jpn 11, \4-\5.
Newgard CB, Hwang PK &c Fletterick RJ (1989). The family of glycogen
phosphorylases: stmcture and function. Cnt Rev Biochem Mol Biol 24, 69-95.
Newgard CB, Brady MJ, O'Doherty RM & Saltiel AR (2000). Organizing glucose
diposal: emerging roles of the glycogen targeting subunits of protein phosphatase-1.
Diabetes 49, 1967-1977.
Newsholme EA & Leech AR (1995). Biochemistry for the medical sciences. John
Wiley & Sons, Chichester: UK.
Nguyen LT & Stephenson GMM (1999). An electrophoretic study of myosin heavy
chain expression in skeletal muscles of the toad Bufo marinus. J Muscle Res Cell
Motil20, 687-695.
Nguyen LT & Stephenson GM (2002). Myosin heavy chain isoform expression and
Ca^^-stimulated ATPase activity in single fibres of toad recttis abdominis muscle. /
Muscle Res Cell Motil23,141-56.

212
Nguyen LT, Stephenson DG & Stephenson GMM (1998a). A direct micorfiuormetric
method for measuring subpicomole amounts of nicotinamide adenine dinucleotide
phosphate, glucose and glycogen. Anal Biochem 259, 274-278.
Nguyen LT, Stephenson DG & Stephenson GMM (1998b). Microfluorometric
analyses of glycogen in freshly dissected, single skeletal muscles of the cane toad
using a mechanically skinned fibre preparation. J Muscle Res Cell Motil 19, 631-638.
O'Connell B, Nguyen LT & Stephenson GM (2003). A single fibre sUidy of the
relationship between MHC and TnC isoform composition in rat skeletal muscle.
Biochem J in press DOI: 10.1042/B J20031170.
Owen VJ, Lamb GD, Stephenson DG & Fryer MW (1997). Relationship between
depolarization-induced force responses and Ca' ^ content in skeletal muscle fibres of
rat and toad. J Physiol 49%, 571-586.
Passonneau JV & Lowry OH (1993). Enzymatic analysis: A practical guide. Humana
Press, Totowa, NJ.
Peachy LD & Franzini-Armstrong C (1980). Stmcture and function of membrane
systems of skeletal muscle cells. In: LD Peachy (Ed). Skeletal muscle. Sect 10.
Handbook of Physiology. Williams & Wilkins, Baltimore, USA. pp. 23-71.
213
Pearson AM & Young RB (1989). Muscle and meat biochemistry. Academic Press.
San Diego, Califomia, USA.
Pereon Y, Louboutin JP & Noireaud J (1993). Contractile responses in rat extensor
digitomm longus muscles at different times of postnatal development. J Camp
Physiol[B] 163, 203-211.
Pereon Y, Dettbam C, Lu Y, Westiund KN, Zhang JT & Palade P (1998).
Dihydropyridine isoform expression in adult rat skeletal muscle. Pfugers Arch. 436,
309-314.
Peter JB, Bamard RJ, Edgerton VR, Gillespie CA & Stempel KE (1972). Metabolic
profiles of three fiber types of skeletal muscle in guinea pigs and rabbhs. Biochem 11,
2627-2633.
Pette D & Staron RS (1990). CeUular and molecular divershies of mammalian
skeletal muscle fibers. Rev Physiol Biochem Pharmacol 116, 1-76.
Pette D & Staron RS (1997). Mammalian skeletal muscle fiber type transhions. hit
RevCytolllO, 143-223.
Pette D, Peuker H & Staron RS (1999). The impact of biochemical methods for single
muscle fibre analysis. Acta Physiol Scand 166, 261-277.

214
Pette D & Staron RS (2000). Myosin isoforms, muscle fiber types, and transitions.
Micros Res Tech 50, 500-509.
Picton C, Klee CB & Cohen P (1981). The regulation of muscle phosphorylase kinase
by calcium ions, calmodulin and troponin-C. Cell Calcium 2, 281-294.
Plant DR, Lynch GS & Williams DA (2002). Hydrogen peroxide increases
depolarization-induced contraction of mechanically skinned slow twitch fibres from
rat skeletal muscles. J Physiol 539, 883-891.
Polishchuk SV, Brandt NR, Meyer HE, Varsanyi M & Heilmeyer LMG (1995). Does
phosphorylase kinase control glycogen biosynthesis in skeletal muscle? FEBS Lett
362,271-275.
Portner HO, Branco LGS, Malvin GM & Wood SC (1994). A new function for lactate
in the toad Bufo marinus. J Appl Physiol 16, 2405-2410.
Posterino GS (2001). "Current" advances in mechanically skinned skeletal muscle
fibres. Clin Exp Pharmacol Physiol 28, 668-74.

215
Posterino GS, & Fryer MW (2000). Effects of high myoplasmic L-lactate
concentration on E-C coupling in mammalian skeletal muscle. J Appl Physiol %9,
517-528.
Posterino GS, Lamb GD & Stephenson DG (2000). Twitch and tetanic force
responses and longitudinal propagation of action potentials in skinned skeletal muscle
fibres of the rat. J Physiol 527,131-7.
Posterino GS, Dutka TL & Lamb GD (2001). L(+)-lactate does not affect twitch and
titanic responses in mechanically skinned mammalian muscle fibres. Pfugers Arch
442, 197-203.
Ranvier L (1873). Proporietes et stmctures differentes des muscles rouges et des
muscles blancs chez les lapins et chez les raies. Comptes rendus hebomadair des
seances de rAcademic des sciences (?aris) 11, 1030-1034.
Rassier DE, Macintosh BR and Herzog W (1999). Length dependence of active force
production in skeletal muscle. J Appl Physiol %6, 1445-1457.
Ren JM & Hultman E (1988). Phosphorylase activity in needle biopsy samples -
factors influencing transformation. Acta Physiol Scand 133, 109-114.
216
Ren JM, Gulve EA, Cartee GD & Hohoszy JO (1992). Hypoxia causes
glycogenolysis without an increase in percent phosphorylase a in rat skeletal muscle.
Am J Physiol 263, E1086-E1091.
Roach PJ (2002). Glycogen and its metabolism. Curr Mol Med 2, 101-120.
Rodney GG, Williams RY, Stracburg GM, Beckingham K & Hamilton SI (2000).
Regulation of RYRl activity by Ca ^ and calmodulin. Biochem 39, 7807-7812.
74-
Rossi D & Sorrentino V (2002). Molecular genetics of ryanodine receptors Ca -
release channels. Cell Calcium 32, 307-319.
Ruegg JC (1992). Calcium in muscle contraction. 2"'' ed. Springer-Verlag, Berlin,
Germany.
Rybicka KX (1996). Glycosomes - the organelles of glycogen metabolism. Tissue
Cen2S, 253-265.
Sahyun M (1931). On the carbohydrate of the muscles of the frog {Rana Pipiens). J
Biol Chem 94, 29-3%.
Sandow A (1965). Excitation-contraction coupling m skeletal muscle. Pharmacol Rev
17, 265-320.
217
Schiaffino S & Margreth A (1969). Coordinated development of the sarcoplasmic
reticulum and t-system during postnatal differentiation of rat skeletal muscle. J Cell
Biol41, 855-875.
Schiaffino S, Gorza L, Sartore S, Saggin L, Ausoni S, Vianello M, Gunderson K &
Lomo T (1989). Three myosin heavy chain isoforms in type 2 skeletal muscle fibres.
J Muscle Res CellMotillO, 197-205.
Schiaffino S & Reggiani C (1994). Myosin isoforms in mammalian skeletal muscle. /
ApplPhysiolll, 493-501.
Schiaffino S & Reggiani C (1996). Molecular diversity of myofibrillar proteins: gene
regulation and functional significance. Physiol Rev 16, 371-423.
Schiaffino S 8c Salviati G (1997). Molecular diversity of myofibrillar proteins:
isoform analysis at the protein and mRNA level. Meth CellBiol52, 349-369.
Schneider MF (1994). Control of calcium release m functioning skeletal muscle
fibers. Annu Rev Physiol 56,463-484.
Schneider MF & Chandler WK (1973). Voltage dependent charge movement in
skeletal muscle. Nahire242, 244-246.

218
Schwartz LM, McCleskey EW«& Aimers W (1985). Dihydropyridme receptors in
muscle are vohage-dependent but most are not functional calcium channels. Nature
314,747-751.
Severinsen T & Munch IC (1999). Body core temperattxre during food restriction in
rats. Acta Physiol Scand 165, 299-305.
Shearer J & Graham TE (2002). New perspectives on the storage and organization of
muscle glycogen. Can J Appl Physiol 21, 179-203.
Sjostrom M, Friden J & Ekblom B (1982). Fine stmctural details of human muscle
fibres after fibre type specific glycogen depletion. Histochem 76, 425-438.
Smythe C & Cohen P (1991). The discovery of glycogenin and the priming
mechanism for glycogen biogenesis. Eur J Biochem 200, 625-631.
Squire JM & Morris EP (1998). A new look at thin filament regulation in vertebrate
skeletal muscle. FASEB J12, 761-771.
Stephenson, DG & Wilhams DA (1981). Temperature effect on Ca ^ -activation
curves in fast and slow-twitch skinned muscle fibres of the rat. J Physiol 311, 281-
302.

Stephenson, DG & Williams DA (1982). Effects of sarcomere length on the force-
pCa relation in fast- and slow-twitch skinned muscle fibres from the rat. J Physiol
333, 637-653.
Stephenson DG, Lamb G, Stephenson GMM & Fryer MW (1995). Mechanisms of
excitation-confraction coupling relevant to skeletal muscle fatigue. AdvExpMed
Biol 384, 45-56.
Stephenson DG, Lamb GD & Stephenson GMM (1998). Events of the excitation-
contraction-relaxation (E-C-R) cycle in fast- and slow-twitch mammalian muscle
fibres relevant to muscle fatigue. Acta Physiol Scand 162, 229-245.
Stephenson DG, Nguyen LT & Stephenson GMM (1999). Glycogen content and
excitation-contraction coupling in mechanically skinned muscle fibres of the cane
toad. J Physiol 519, 177-187.
Stephenson EW (1981). Activation of fast skeletal muscle: contributions of studies on
skinned fibers. Am JPhysiol240, C1-C19.
Stephenson GM & Stephenson DG (1996). Effects of ammonium ions on the
depolarization-induced and direct activation of the contractile apparatus in
mechanically skinned fast-twitch skeletal muscle fibres of the rat. J Muscle Res Cell
Motil 11, 611-616.

220
Stephenson GMM (2001). Hybrid skeletal muscle fibers: a rare or common
phenomenon? Clin Exp Pharmacol Physiol 28, 692-702.
Stryer L (1995). Biochemistry. 4' Ed. WH Freeman & Co. New York, NY, USA. pp.
581-602
Sutko JL & Airey JA (1996). Ryanodine receptor Ca ^ release channels: Does
diversity in form equal diversity in function? Physiol Rev 16, 1027- 1071.
Szczesna D & Potter JD (2002). The role of troponin in the Ca^^-regulation of skeletal
muscle contraction. Results Prob CellDiff36, 171-190.
Szentesi P, Zaremba R, Van Mechelen W & Stienen GJM (2001). ATP utilization for
calcium uptake and force production in different types of human skeletal muscle
fibres. J Physiol 531, 393-403.
Szent-Gyorgyi A (1949). Free-energy relations and contracions of actomyosin. Biol
Bull 96, 140-161.
Takeyasu K, Kawase T 8c Yoshimura SH (2003). Intermolecular interaction between
Na^/K '-ATPase a subunh and glycogen phosphorylase. Ann NY Acad Sci 9%6, 522-
524.
221
Talmadge RJ, Roy RR & Edgerton VR (1993). Muscle fiber types and fiinction. Curr
Opin Rheumatol5, 695-705.
Talmadge RJ (2000). Myosin heavy chain isoform expression following reduced
neuromuscular activity: potential regulatory mechanisms. Muscle Nerve 23, 661-679.
Tamaki T & Uchiyama S (1995). Absolute and relative growth of rat skeletal muscle.
PhysiolBehav51, 913-919.
Tanabe T, Beam KG, Powell JA & Numa S (1988). Restoration of excitation-
contraction coupling and slow calcium current in dysgenic muscle by dihydropyridine
receptor complementary DNA. Nature336, 134-139.
Tanabe T, Mikami A, Numa S & Beam KG (1990). Cardiac-type excitation
contraction coupling in dysgenic skeletal muscle injected with cardiac
dihydropyridine receptor cDNA. Nature344, 451-453.
Tang W, Sencer S & Hamilton SL (2002). Calmodulin modulation of proteins
involved in excitation-contraction couphng. Front Bioscil, dl583-dl589.
Umazume Y (1991). Natori's skinned fiber, hi: E Ozawa, T Masaki & Y Nabeshima
(Eds), Frontiers in muscle research: myogenesis, muscle contraction, and muscle
dystrophy. Chpt 10. Excerpta Medica, New York, USA. pp 261-274.
UNSW Embryology. Rat development.
http://anatomy.med.unsw.edu.au/cbl/embryo/OtherEmb/Rat.htm
Villa Momzzi E, Bergamini E & Gori Bergamini Z (1981). Glycogen metabolism and
the function of fast and slow muscles of the rat. Pfugers Arch 391, 338-342.
Villa Moruzzi E & Bergamini E (1983). Effect of denervation on glycogen
metabolism in fast and slow muscle of rat. Muscle Nerve 6, 356-366.
Vohestad NK, Sejersted OM, Bahr R, Woods JJ & Bigland-Ritchie B (1988). Motor
drive and metabolic responses during repeated submaximal contractions in humans. /
Appl Physiol 64, 1421-1427.
Walker JW, Somlyo AV, Goldman YE, Somlyo AP &Trentham DR (1987). Kinetics
of smooth and skeletal muscle activation by laser pulse photolysis of caged inositol
1,4,5-ttisphosphate. Nature321, 249-52.
223
Wanson JC & Drochman P (1968). Rabbit skeletal muscle glycogen. A
morphological and biochemical study of glycogen (3-particles isolated by the
precipitation-centrifugation method. JCeUBiol3%, 130-150.
Wanson JC & Drochmans P (1972). Role of the sarcoplamsic reticulum in glycogen
metabohsm. J Cell Biol 54, 206-224.
Weihe WH (1987). The laboratory rat. hi: T Poole (Ed), The UFA Whandbook on the
care and management of laboratory animals. 6* Ed. Longman Scientific & Technical,
UK, pp. 309-330.
Weiss A & Leinwand LA (1996). The mammalian myosin heavy chain gene family.
Annu Rev CeU Dev Biol 12, 417-439.
Weiss S, Rossi R, Pellegrino MA, BottineUi R & Geeves MA (2001). Differing ADP
release rates from myosin heavy chain isoforms define the shortening velocity of
skeletal muscle fibers. J Biol Chem. 276, 45902-45908.
Winegrad S. (1971). Studies of cardiac muscle with high permeability to calcium
produced by treatment with ethylenediaminetetraacetic acid. J Gen Physiol 5%, 71-93.
Witzmann FA, Kim DH & Fitts RH (1983). Effect of hmdlhnb immobilization on the
fatigabUity of skeletal muscle. J Appl Physiol 54, 1242-1248.

224
Wood DS, ZoUman J & Reuben JP (1975). Human skeletal muscle: properties of the
'chemically skinned' fiber. Science 187, 1075-1076.
Xu KY, Zweier JL & Becker LC (1995). Functional coupling between glycoysis and
sarcoplasmic reticulum Ca^^ transport. CircResll, 88-97.
Xu KY & Becker LC (1998). Ultrastmcural localization of glycolytic enzymes on
sarcoplasmic reticulum vesicles. J Histochem Cytochem 46, 419-427.
Yano K & Zarain-Herzberg A (1994). Sarcoplasmic reticulum calsequestrins:
stmctural and functional properties. Mol Cell Biochem 135, 61-70.
Zorato F, Sacchetto R & Margreth A (1994). Identification of two ryanodine receptor
transcripts in neonatal, slow-, and fast-twitch rabbit skeletal muscles. Biochem
Biophys Res Com 203, 1725-1730.