Factors Affecting Performance of Stock Market: Evidence ...
15
International Journal of Academic Research in Business and Social Sciences September 2012, Vol. 2, No. 9 ISSN: 2222-6990 1 www.hrmars.com/journals Factors Affecting Performance of Stock Market: Evidence from South Asian Countries Dr. Aurangzeb HOD, Business Administration, DADABHOY Institute of Higher Education, Pakistan Email: [email protected] Abstract This study identifies the factor affecting performance of stock market in South Asia. The data used in this study were collected from the period of 1997 to 2010 of 3 South Asian countries namely, Pakistan, India and Sri Lanka. Regression results indicate that foreign direct investment and exchange rate have significant positive impact on performance of stock market in South Asian countries while; interest rate has negative and significant impact on performance of stock market in South Asia. Results also indicate the negative but insignificant impact of inflation on stock market performance in South Asia. It is recommended that in order to take the full advantage of stock market and carry on with the international markets well managed macroeconomic policies are necessary in which interest rates and inflation rate are thoroughly monitor and try to reduce the value as much possible. It gives the confidence to the investors as well as the industries. It is also recommended that some extra benefits were given to the foreign investors because we observed that the influence of foreign investors is strong in this region. Keywords: Advances, Economic Growth, Deposits, Investments, Profitability Introduction When we talk about the stock market the first thing come into our mind is this is an important element of a economy because stock market plays a vital role in the growth of key sectors of the economy and that ultimately affects the economy of the country. Stock market plays the significant role for the industry and also for the investor who wants to invest in the stock market to gain maximum return on his savings. Whenever any company wants to raise funds and consider other than debt option they float their shares into the market and raise funds from the investors who keen to invest in that company the company list themselves in the stock market and issue their shares through IPO (Initial Public Offering) if the company is already listed in the stock market and want to raise fund by floating their shares they have two options available either they offer their shares to the market and anyone who is interested to invest in that company purchase their shares or they offer the right shares to the existing share holders. There are some rules and regulations imposed by the regulators of stock markets which companies have to fulfill if they want to list in the stock market.
Transcript of Factors Affecting Performance of Stock Market: Evidence ...
International Journal of Academic Research in Business and Social Sciences September 2012, Vol. 2, No. 9
ISSN: 2222-6990
1 www.hrmars.com/journals
Factors Affecting Performance of Stock Market: Evidence from South Asian Countries
Dr. Aurangzeb HOD, Business Administration, DADABHOY Institute of Higher Education, Pakistan
Email: [email protected] Abstract This study identifies the factor affecting performance of stock market in South Asia. The data used in this study were collected from the period of 1997 to 2010 of 3 South Asian countries namely, Pakistan, India and Sri Lanka. Regression results indicate that foreign direct investment and exchange rate have significant positive impact on performance of stock market in South Asian countries while; interest rate has negative and significant impact on performance of stock market in South Asia. Results also indicate the negative but insignificant impact of inflation on stock market performance in South Asia. It is recommended that in order to take the full advantage of stock market and carry on with the international markets well managed macroeconomic policies are necessary in which interest rates and inflation rate are thoroughly monitor and try to reduce the value as much possible. It gives the confidence to the investors as well as the industries. It is also recommended that some extra benefits were given to the foreign investors because we observed that the influence of foreign investors is strong in this region. Keywords: Advances, Economic Growth, Deposits, Investments, Profitability Introduction When we talk about the stock market the first thing come into our mind is this is an important element of a economy because stock market plays a vital role in the growth of key sectors of the economy and that ultimately affects the economy of the country. Stock market plays the significant role for the industry and also for the investor who wants to invest in the stock market to gain maximum return on his savings. Whenever any company wants to raise funds and consider other than debt option they float their shares into the market and raise funds from the investors who keen to invest in that company the company list themselves in the stock market and issue their shares through IPO (Initial Public Offering) if the company is already listed in the stock market and want to raise fund by floating their shares they have two options available either they offer their shares to the market and anyone who is interested to invest in that company purchase their shares or they offer the right shares to the existing share holders. There are some rules and regulations imposed by the regulators of stock markets which companies have to fulfill if they want to list in the stock market.

International Journal of Academic Research in Business and Social Sciences September 2012, Vol. 2, No. 9
ISSN: 2222-6990
2 www.hrmars.com/journals
The primary function of any stock market is to play the role of supporting the growth of the industry and economy of the country and it is also the measurement tool that gives the idea about the industrial growth as well as the stability of the economy with their performance. The rising index or consistent growth in the index is the sign of growing economy and if the index and stock prices are on the falling side or their fluctuations are on the higher side it gives the impression of un stability in the economy exist in that country. On the other side we know that the growth of the country is directly related to the economy which consists of various variables like GDP, Foreign Direct Investment, Remittances, Inflation, Interest rate, Money supply, Exchange rate and many others. These variables are the backbone of any economy. The movements in the stock prices are affected by changes in fundamentals of the economy and the expectations about future prospects of these fundamentals. Stock market index is a way of measuring the performance of a market over time. These indices used as a benchmark for the investors or fund managers who compare their return with the market return. Number of studies conducted in USA, UK and Japan to find out the relationship between macroeconomic variables and the fluctuations of stock prices. The findings of these studies show that with the minor variation these macroeconomic variables have the significant impact on stock prices. These results helped investors to make better predictions about the movement of stock prices whenever these fundamentals change their position. There are two types of investors exist in the market, a bullish investor is someone who invests with an expectation that stock prices will rise. Conversely, a bearish investor believes financial market conditions are not conducive to gains and therefore trades stocks accordingly. Both types of investors want to take advantage of the movement in stock prices and to maximize their profit accordingly. The movement in stock prices is directly related to some fundamentals like performance of the company, movement in key macroeconomic variables and government actions. The investor really needs to know about the right time to take the right action whenever these fundamentals produce something different. The number of studies shows that these stock market indices are affected by macroeconomic variables of the economy with respect to their intensity in different markets. An investor wants to keep himself aware about the behavior of the stock market with the result which is generated after the fluctuation of these key variables. An investor wants to know about the actions which he needs to take and the time when that decision gives him the maximum advantage. As we all aware about the fact that the Asian region is one of the most important region of the world and the movement in macroeconomic variables of Asian countries have the significant impact on economies of rest of the world. In this research we will take the data of three most important south Asian countries and see the movement in the stock prices with respect of changing macroeconomic variables of those countries.

International Journal of Academic Research in Business and Social Sciences September 2012, Vol. 2, No. 9
ISSN: 2222-6990
3 www.hrmars.com/journals
We will take the data of Pakistani stock market, Karachi Stock Exchange (KSE) which is the largest and oldest capital market of Pakistan which was founded in independence year. KSE is also the most liquid market of Pakistan with the average daily turnover of 525.15 million shares. In 2002 Business Week an international magazine reported KSE as the best performing stock market in the world. There are number of indices established in the KSE which includes KSE 100 index, KSE 30 index, KSE All Share index and KMI 30 index. The oldest and most reliable index is the KSE 100 index In which best performing 100 companies with respect to the volume are selected by the regulators to include in the KSE 100 index these companies are analyzed time to time to keep up to date this index. In KSE 30 index top 30 companies are selected while in the All Share index all listed companies includes in the index. KMI 30 index includes 30 companies whom core business is HALAL and certified by Shairah board. This index is specially developed for those investors who want to earn HALAL profit of their savings. We used KSE 100 index data for our research. We will also take the data of Indian stock market, Bombay Stock Exchange (BSE) which is the oldest stock market of Asia. The market capitalization of the listed companies in the BSE is about USD 1.6 trillion. BSE has the award of Golden Peacock Global CSR which was given by “The World Council of Corporate Governance” due to taking the initiatives in Corporate Social Responsibility. We used the data of BSE 30 index which also called SENSEX for our present research. We used the data of Colombo Stock Exchange (CSE) for Sri Lankan stock market in this research which is the main stock exchange of Sri Lanka. The market capitalization of CSE is over 20 billion USD. Colombo stock exchange is the first south Asian region stock market and overall 52nd who obtain the membership of World Federation of Exchanges. There are two indices which are currently running in the CSE, All Share price index and The Milanka Price index. We used the data of all share price index in this study. Number of studies had been conducted globally about the influence of macroeconomic variables on the capital markets and various studies had shown different results according to different behavior of the capital markets and different macroeconomic variables they chosen. No study has been conducted in recent times with the data of south Asian countries data. This research include the data of three south Asian countries because in this part of the world lack of knowledge and supporting material regarding impact of the key macroeconomic factors on performance of stock market is the real problem for the investors and they do not take necessary actions on the right time and ultimately suffer with losses. The objective of conducting this study is to find out the relationship between these key macro economic factors and the movement of south Asian stock markets and another most important consideration of this study is to find out the intensity of the relationship so the investor can quickly react and alter their decisions when there is any change or move take place in these factors to enhance their investment returns. The rest of the paper is organized as follows. Section 2 reviews the empirical literature on the relationship between considered variables. Section 3 discusses the empirical strategy for examining the relationship. Section 4 shows the

International Journal of Academic Research in Business and Social Sciences September 2012, Vol. 2, No. 9
ISSN: 2222-6990
4 www.hrmars.com/journals
model’s estimation results. Final section concludes the study, provides some policy implications and set directions for further research. Literature Review Pal & Mittal (2011) examined the long run relationship between two Indian capital markets and some macroeconomic variables such as interest rates, inflation, and exchange rate and gross domestic savings. They use the quarterly data from January 1995 to December 2008 and with the help of unit root test, co integration and error correction mechanism they found out that the inflation rate have the significant impact on both capital markets whereas interest rate and foreign exchange rate have the impact on one capital market. Gross domestic saving played insignificant role in both markets. The study can be made for longer period with some other macroeconomic variables gives us more comprehensive results. Coleman & Agyire-Tetty (2008) try to explore the impact of some macroeconomic variables on the performance of Ghana Stock Exchange with the help of quarterly time series data for the period from 1991 to 2005 by using co integration and error correction model. The findings suggest that there is a weak effect of Treasury bill rates and on at the other hand market takes time to respond in inflation scenario. More reliable results can be generated by including some other macroeconomic variables like money supply and industrial production in this study. Ahmed & Imam (2007) investigates the relationship between stock market and different macroeconomic variables such as money supply, Treasury bill rate, interest rate, GDP, industrial production index. They use series of tests such as unit roots, co integration, and vector error correction models. They analyze the Monthly data series for the period of July 1997 to June 2005 and they found that generally there exists no long run relationship between stock market index and macroeconomic variables but interest rate change or T-bill growth rate may have some influence on the market return. Chen, et al (1986) examined the effect of some macroeconomic variables on stock market returns. They took short and long term interest rates; expected and unexpected inflation, industrial production and the spread between high and low grade bonds. The data during the period from 1953 to 1972 was taken and applied 12 cross sectional regression and it is concluded that some of these macroeconomic variable have significant impact on stock returns such as industrial production and changes in risk premium. Humpe & Macmillan (2007) applied the co integration analysis to find out the relationship between key macroeconomic factors and stock prices in the U.S and Japanese capital markets with the data for the period of 1971 to 1990 and found out that there is single co integrating vector exist in the US which suggest that there is a positive relationship between stock prices and industrial production exists on the other hand these stock prices are negatively related with the CPI and interest rate. Insignificant but positive impact of money supply exists in this market. Whereas the Japanese data they found out there are two co integrating vectors. The first one explores that there is positive relationship between industrial production and stock prices

International Journal of Academic Research in Business and Social Sciences September 2012, Vol. 2, No. 9
ISSN: 2222-6990
5 www.hrmars.com/journals
whereas the negative one with the money supply and the second vector identifies there is a negative influence of CPI and long term interest rates on industrial production. Fang & Miller (2002) identifies the effect of volatility in Korean foreign exchange market on Korean stock market with the GARCH-M model and the daily data of those variables from 3rd of January 1997 to 21st of December, 2000 and they found out that the Korean foreign currency market impact in three different ways on the stock market. The first channel suggests that exchange rate negatively affect stock market returns. Secondly the depreciation volatility positively affects these returns and at last stock market return volatility responds to exchange rate depreciation volatility. If they include some more macroeconomic variables such as money supply or interest rates their result would have much more considerable while taking the decision of investment. One of the earliest studies which provide the fair idea about the type of relationships between some macroeconomic variables and stock market indices was conducted by Gay (2008) in which the researcher investigates the relationship between macroeconomic variables and stock prices in Emerging countries like Brazil, China, India and Russia. The macroeconomic variable in this study was exchange rate and oil price. The monthly data from March 1999 to June 2006 was analyzed on Box-Jenkins ARIMA model and the results suggest that there is no significant relationship sound between the oil prices and exchange rate over the stock market of those emerging countries and because of that weak form of market efficiency exist in these capital markets. Stavarek (2004) examined the nature of casual relation between stock prices and exchange rate in four old EU countries (Austria, France, Germany and the UK) and the four new members (Czech Republic, Hungary, Poland and Slovakia) and in the USA. The data varies for each county depending upon the availability. The monthly data from December 1969 to December 2003 is used for Austria, France, Germany, UK and USA while for Poland it is from December 1993 to December 2003 for Czech Republic December 1994 to December 2003 for Hungary January 1995 to December 2003 and for Slovakia June 1995 to December 2003. There are several tests are used like Co integration analysis, vector error correction modeling standard Granger casualty test to find out the linkage between exchange rate and stock prices and they conclude that there is no long run relationship exist in first analyzed period covering from 1970 to 1992. In the period from 1993 to 2003 much stronger casualty found out in old EU members and USA because of their strong stock market and exchange rate development. Long run equilibrium does not exist in new EU members due to relative under development markets. Flannery & Protopapadakis (2002) checked the impact of some macroeconomic factors on aggregate stock returns. They used 17 macroeconomics data announcements starting from 1980 to 1996 and applied GARCH model to find out the impact of these factors on realized returns as well as their volatility. After the analysis they found out that there are six variables in which three are nominal (CPI, PPI and Monetary Aggregate) and three are real (Employment Report, Balance of Trade, and Housing Starts) as strong candidates for risk factors. Form three nominal only money supply affect the both the level of returns and the volatility the other two

International Journal of Academic Research in Business and Social Sciences September 2012, Vol. 2, No. 9
ISSN: 2222-6990
6 www.hrmars.com/journals
nominal variables only affect the level of returns. On the other hand all three real macroeconomic variables only affect the volatility of the returns. Schwert (1989) argue that the some nominal and real macroeconomic variables affect the stock market volatility. The monthly data from 1857 to 1987 was used to determine impact of these variables on stock volatility. The researcher applies the regression model on the above data and find out that the average level of volatility is much higher in Great Depression period (1929-1939) but other than that the effect of financial leverage is low whether the other variables such as inflation rates, money growth and industrial production volatility have positive impact on stock volatility by the sum of coefficient is 0.45 if the volatility of inflation, money growth or industrial production increases by 1% the stock volatility increases by 0.45%. Ibrahim & Aziz (2003) explore the relationship between four macroeconomic variables and Kuala Lampur Composite Index (KLCI) through conintegration and vector autoregression model. They take the monthly data of their variables which were real output, infaltion rate, money supply and exchange rate from 1977 to August 1998 and their model suggestg that there is short term relationship as well as long term relationship exist between the macroeconomic variables and the KLCI. They further explore that two variables which were excahnge rate and money supply are negetively associated with the stock prices while the other two have positive impact on the index. Wickremasinghe (2011) examined the long run relationship between Sri Lankan capital markets (CSE) and six macroeconomic variables such as three month fixed deposit rate, consumer price index, US stock market index narrow M1 and GDP of Sri Lanka. They use the monthly data from January 1985 to December 2004 and with the help of unit root test, co integration, variance decomposition and error correction mechanism they found out that short term and long term relationship between stock prices and macroeconomic variables. Results of this study suggest that there is Bi-directional relationship exist between stock market index and fixed deposit rate stock prices and US Share price and GDP while remaining variables which are CPI, M1 and exchange rate casual bi-directional relationship exists. Results of variance decomposition suggest that GDP and M1 plays an important role in longer horizon to forecast variance in stock prices. Liu & Shrestha (2008) investigates the long run relationship between chinese stock market and a set of macroeconomic variables which includes industrial production, exchange rate, inflation, money supply and interst rate. They used secendory data of all variales from January 1992 to December 2001 and applied heteroscedastic cointegration test on the above varaibles. Findings of this study suggest that industrial production and money supply have the positive relationship with chinese stock indices while inflation, interest rate and exchange rate have the negetive impact on stock prices. They recommend that the investors who want to invest in chinese stock market they should invest for long term horizon because in short term the chinese stock market is very volitile and risky.
International Journal of Academic Research in Business and Social Sciences September 2012, Vol. 2, No. 9
ISSN: 2222-6990
7 www.hrmars.com/journals
Merikas & Merika (2006) try to re-examine the hypothesis which suggest the stock market have negative impact on real economic activities in Germany. They collect the data of 41 years from 1960 to 2000 and build the VAR model. They used CPI as the measure of inflation while real rate of return of DAX stock index was used as stock market returns. They conclude that the stock prices are negatively related with the growth of employment in the country while the GDP growth rate have the positive relation with stock market. This study could be done with adding more variables into the model which generates more appropriate results. Hussainey & Ngoc (2009) explore the effect of domestic and international macroeconomic variables on Vietnamese stock prices.They applied regression model on vieteame data as well as the US data of same variables which includes Vietnam srock prices, industrial production, CPI, VN basic interest rates and government bond rates for Vietnam while S&P 500, industrial production, CPI, US treasury bill three month rates and long-term government bond data for US. The results of the study suugest that industrial production have the positive impact on vietnamese stock prices whereas short term and long term both type of interest rates shown insignificant effect on stock prices. The results also suggest that real prduction activity of US has the significant impact on Vietnamese stock prices. Methodology To find the long run relationship between the variables we have used multiple regression analysis. In this research we have focused on secondary type of data, all data is collected from the official database of World Bank, official publications of respected stock markets and official website of yahoo finance. In this study we have used five variables namely, stock performance, interest rate, inflation, exchange rate and foreign direct investment. In this study we have used the data of 3 countries namely, Pakistan, India and Sri Lanka from the period of 1997 to 2010. After selection of the above variables we can describe the stock market performance function of South Asian countries in the following way:
SMI = f (IR, CPI, ER, FDI)
Where SMI is the stock market index, f represents the function of and IR, CPI, ER, FDI represent respectively, interest rate, inflation, exchange rate and foreign direct investment. After specifying the stock market performance function in linear form with an addition of error term, we can write in following way: SMI = α + β1 IR + β2 CPI + β3 ER + β4 FDI + This research is based on the following hypothesis that clearly defines the research criterion. H1: Interest rate has no significant impact on Stock Market Performance H2: Inflation has no significant impact on Stock Market Performance H3: Exchange Rate has no significant impact on Stock Market Performance H4: Foreign Direct Investment has no significant impact on Stock Market Performance

International Journal of Academic Research in Business and Social Sciences September 2012, Vol. 2, No. 9
ISSN: 2222-6990
8 www.hrmars.com/journals
Data Analysis and Findings In this chapter we will analyze the results which are generated by the statistical software when we applied the statistical tools on our data. The tools which was used in this research was SPSS (Statistical Package for Social Sciences) and Eviews. In this chapter we will interpret the results and based on those results we will conclude our research in the last chapter. Descriptive Analysis This is the tool to summarized the data and provide the measures of the sample data. We formulate three different tables for this analysis because we have the data of three countries and they all have different dimensions.
Table 4.1.1 Descriptive Statistics for Pakistan
N Minimum Maximum Mean Std. Dev.
SMI 14 920 13,740 5,586 4,411
Interest Rate 14 2.72 8.91 6.89 2.10
CPI 14 2.91 20.29 8.24 5.06
Exchange Rate 14 41.11 85.19 60.34 12.27
Foreign Direct Investment 14 308,000 5,590,000 1,912,590 1,875,909
Table 4.1.1 shows the descriptive analysis related to Pakistan; it shows total number of observations, minimum value, maximum value mean value and standard deviation of all the variables. These numeric figures will help to understand the data in proper manner. The dependent variable which is KSE index shows the low of 920 which was observed in 1998 and shows the high of 13,740 which was observed in 2007, mean value of the dependent variable is 5,586 and standard deviation is 4,411 which shows the high fluctuation in this variable. Interest rate touch the low of 2.72 and the peak of 8.91 in the last 14 years, mean value shows the value of 6.89 and the standard deviation of 2.10 which suggest that there is much stability in this variables compare to the dependent variable. The average of CPI is 8.24 while the minimum of 2.91 and maximum of 20.29 which were observed in 2003 and 2008 respectively. The standard deviation of this variable is 5.06 which was due to international crises between 2007 to 2009. Exchange rate shows the low of 41.11 and high of 85.19 in last 14 years this increase is mainly due to oil transactions because every time the government paid the oil payments the rupee loses its strength against the dollar. Foreign direct investment averages 1,912,590 (in thousands) during the period which was not good enough for the economy. This variable is mainly distracted due to war & terror situation in

International Journal of Academic Research in Business and Social Sciences September 2012, Vol. 2, No. 9
ISSN: 2222-6990
9 www.hrmars.com/journals
the country and this will cause lot of trouble for the economy. This variable also shows the standard deviation of 1,875,909 (in thousands) which was clearly mentioning the uncertainty of the economy. Table 4.1.2 Descriptive Statistics for India
N Minimum Maximum Mean Std. Dev.
SMI 14 2,988 17,868 8,103 5,520
Interest Rate 14 4.50 10.75 7.77 1.88
CPI 14 3.68 13.23 6.62 3.28
Exchange Rate 14 36.31 48.61 44.40 3.25
Foreign Direct Investment 14 2,168,591 43,406,277 13,553,083 13,685,708
Table 4.1.2 shows the descriptive analysis related to India; it shows total number of observations, minimum value, maximum value mean value and standard deviation of all the variables. The dependent variable which is BSE index (Bombay Stock Exchange) shows the low of 2,988 and high of 17,868 during last 14 years, mean value of the dependent variable is 8,103 which suggest that the index is consistently plays around the 10,000 mark, standard deviation is of this variable is 5,520 which is higher than KSE and that shows that this variable is highly fluctuated in this region. Interest rate touch the low of 4.50 which was observed in 2003 and the peak of 10.75 which was observed in 1997 which shows the negative trend in this variables, average interest rate of India in the last 14 years was observed is 7.77 and the standard deviation of 1.88 which suggest that there is much stability in this variables compare to the dependent variable. The average of CPI is 6.62 while the minimum of 3.68 and maximum of 13.23 which were observed in 2001 and 1998 respectively. The standard deviation of this variable is 3.28 which is much lesser than the earlier one. Exchange rate shows the low of 36.31 and high of 48.61 in last 14 years this increase is mainly due to increase in inflation and unemployment rate of the country. Foreign direct investment averages 13,553,083 (in thousands) during the period which was far better than Pakistan. This variable shows the consistent improvement during the period which is mainly due to confidence of the foreign investor’s on the economy of the country and the growth rate of the industries in India.
International Journal of Academic Research in Business and Social Sciences September 2012, Vol. 2, No. 9
ISSN: 2222-6990
10 www.hrmars.com/journals
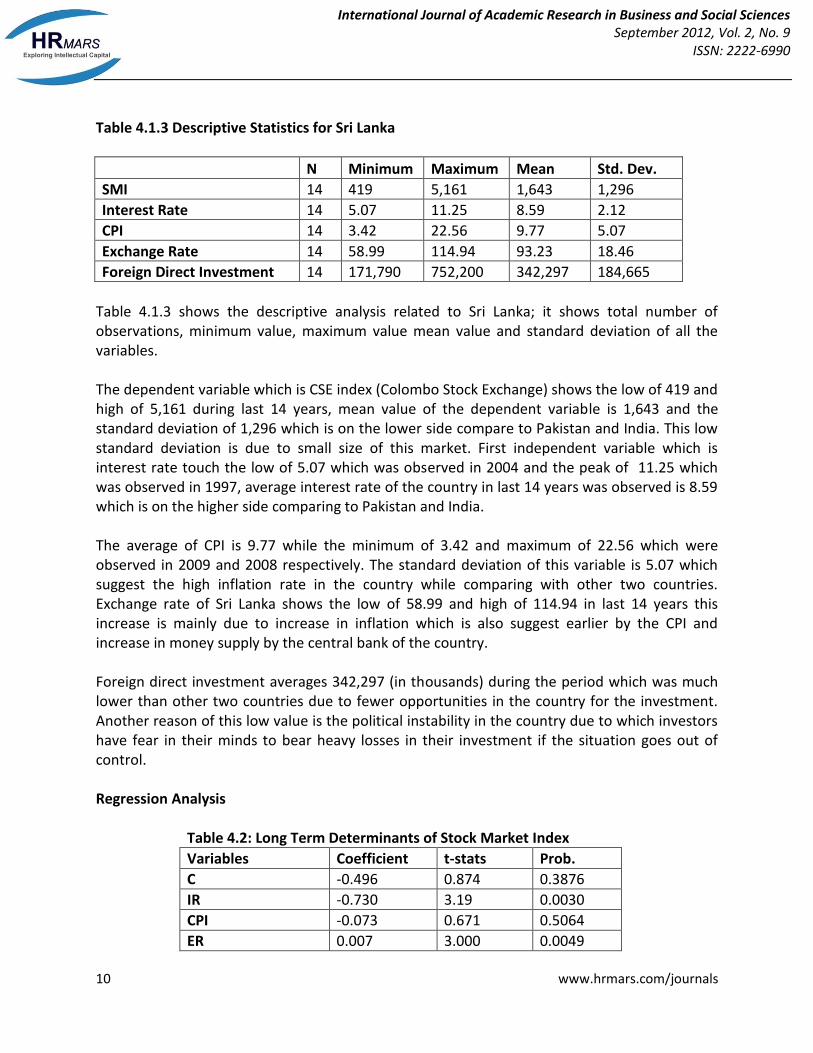
Table 4.1.3 Descriptive Statistics for Sri Lanka
N Minimum Maximum Mean Std. Dev.
SMI 14 419 5,161 1,643 1,296
Interest Rate 14 5.07 11.25 8.59 2.12
CPI 14 3.42 22.56 9.77 5.07
Exchange Rate 14 58.99 114.94 93.23 18.46
Foreign Direct Investment 14 171,790 752,200 342,297 184,665
Table 4.1.3 shows the descriptive analysis related to Sri Lanka; it shows total number of observations, minimum value, maximum value mean value and standard deviation of all the variables. The dependent variable which is CSE index (Colombo Stock Exchange) shows the low of 419 and high of 5,161 during last 14 years, mean value of the dependent variable is 1,643 and the standard deviation of 1,296 which is on the lower side compare to Pakistan and India. This low standard deviation is due to small size of this market. First independent variable which is interest rate touch the low of 5.07 which was observed in 2004 and the peak of 11.25 which was observed in 1997, average interest rate of the country in last 14 years was observed is 8.59 which is on the higher side comparing to Pakistan and India. The average of CPI is 9.77 while the minimum of 3.42 and maximum of 22.56 which were observed in 2009 and 2008 respectively. The standard deviation of this variable is 5.07 which suggest the high inflation rate in the country while comparing with other two countries. Exchange rate of Sri Lanka shows the low of 58.99 and high of 114.94 in last 14 years this increase is mainly due to increase in inflation which is also suggest earlier by the CPI and increase in money supply by the central bank of the country. Foreign direct investment averages 342,297 (in thousands) during the period which was much lower than other two countries due to fewer opportunities in the country for the investment. Another reason of this low value is the political instability in the country due to which investors have fear in their minds to bear heavy losses in their investment if the situation goes out of control. Regression Analysis
Table 4.2: Long Term Determinants of Stock Market Index
Variables Coefficient t-stats Prob.
C -0.496 0.874 0.3876
IR -0.730 3.19 0.0030
CPI -0.073 0.671 0.5064
ER 0.007 3.000 0.0049

International Journal of Academic Research in Business and Social Sciences September 2012, Vol. 2, No. 9
ISSN: 2222-6990
11 www.hrmars.com/journals
FDI 0.682 9.351 0.0000
Adj. R2 .910
D.W stats 1.775
F-stats (prob.) 82.618 (0.000)
After applying the regression model the above results are generated in which coefficients of all variables with their t-statistics and p-value were observed. The above table also shows the value of R Square and Durbin Watson, R square is the coefficient of determination and it shows that how many times actual & estimated values are same, small values indicate that the model does not fit the data well whereas larger values of R squared indicate the model is fit. Since the value of Adjusted R-square in the above table suggests that the model is approx. 91% fit and the results which are generated from this model are reliable. The above table also shows the value of Durbin Watson (DW) test which was used to test the auto correlation in the model. The value of DW lies between 0 to 4 if the value of DW is near to 2 it shows that there is no auto correlation exists in the model and the data will be used for the analysis. The value of below 1 predicts that there may be positive auto correlation and the value of above 3 predicts the vice versa. We applied serial LM test to calculate the value of Durbin Watson which suggest the value of (1.775) as the DW value this means there is no auto correlation exists in this model and this model is good for analysis. As mentioned in theoretical background interest rates have the significant negative impact on stock market because interest rate is the alternative source of investment. The above results strengthen the theory by showing the negative coefficient which means that every time interest rate increase by 1 percent the stock market will decrease by 0.73 percent. So whenever the interest rates in the economy increases the negative trend in the stock market will be observed because interest rates gives the opportunity to the investors to move their investment from stock market to bank deposits and gain the maximized returns. As interest rates which offered on deposit decreases investors find it more worthwhile to invest their money into other avenues such as the stock exchanges and real estate etc. A similar but opposite behavior is witnessed in the case of an increase in interest rates. When interest rate increases people find it more profitable to keep their money in the bank than to invest it in risky avenues such as the stock market. Results of CPI suggest that there is negative relation exist between CPI and stock market but this relationship is not significant enough in this region due to various reasons. We examine that in this region foreign investment plays a vital role in capital market and local participants are mainly follow the foreign buyers this was the major reason of this insignificant impact of CPI because there is no impact have been made on purchasing power of foreigners when the inflation in the particular economy fluctuate. Exchange rate shows the positive and significant impact on stock prices. As mentioned in the theoretical background exchange rate have the both kind of impacts on capital market with respect to the behavior of the market. In this region the positive impact have been observed

International Journal of Academic Research in Business and Social Sciences September 2012, Vol. 2, No. 9
ISSN: 2222-6990
12 www.hrmars.com/journals
because the influence of foreign investors as we earlier mentioned. Increase in exchange rate was also increase the purchasing power of foreign buyers because they invest the same amount in their local currency but after the conversion the amount will increase and they can purchase more stocks than earlier so ultimately it gives the more liquidity in the market. The another reason of this positive impact is this whenever the foreign exchange rate increases investors were shift their investment from the foreign exchange market to other markets due to increase of risk in foreign exchange market. The results of this variable suggest that every time foreign exchange rate increases by 1 percent the stock market will be increases by 0.1 percent. This coefficient is not strong enough to manipulate the market because whenever the exchange rate increase local investors can move from stock market to foreign exchange market to enhance their returns. The above results suggest that the FDI have the most significant, positive and strong impact on stock prices because every time FDI was increased by 1 percent the stock market was also increased by 1 percent. As we conduct our study on the data of south Asian countries which are not fully developed we observed that the influence of foreign investment is strong. If the economic conditions are good for investment foreign investors prefer to invest in the capital markets of developing countries. FDI also gives the confidence to the local industries by investing their money into their stocks. These results also strengthen the theory which was explained earlier that the foreign direct investment is one of the key positive factor in any stock market because it gives liquidity to the market and the market will turn into bullish mode and local investors also invest at that time as a result of that liquidity in the market increases and whenever the liquidity in the market increase it will help the stock prices to increase sharply. Conclusion and Recommendations This study identifies the factor affecting performance of stock market in South Asia. The data used in this study were collected from the period of 1997 to 2010 of 3 South Asian countries namely, Pakistan, India and Sri Lanka. Regression results indicate that foreign direct investment and exchange rate have significant positive impact on performance of stock market in South Asian countries while; interest rate has negative and significant impact on performance of stock market in South Asia. Results also indicate the negative but insignificant impact of inflation on stock market performance in South Asia. Under the light of above results it is highlighted that there is a need of well managed macroeconomic policies in order to obtain the benefits from the capital market. In order to take the full advantage of stock market and carry on with the international markets well managed macroeconomic policies are necessary in which interest rates and inflation rate are thoroughly monitor and try to reduce the value as much possible. It gives the confidence to the investors as well as the industries. It is also recommended that some extra benefits were given to the foreign investors because we observed that the influence of foreign investors is strong in this region.
International Journal of Academic Research in Business and Social Sciences September 2012, Vol. 2, No. 9
ISSN: 2222-6990
13 www.hrmars.com/journals
References Husain, Fazal & Mahmood, Tariq (2001). “The Stock Market and the Economy in Pakistan.” The
Pakistan Development Review, 40: 2, 107–114. Imran , Kashif, Ayse, Muhammad and Hasan (2010). “Causal relationship between macro-
economic indicators and stock exchange prices in Pakistan.” African Journal of Business Management, Vol. 4 (3), pp. 312-319.
Nishat, Mohammed and khan, Rozina shaheen, (2004). Macroeconomic Factors and Pakistani
Equity Market, The Pakistan Development Review, 43, issue 4, p. 619-637. Husain, Fazal & Mahmood, Tariq, (2001). "The Stock Market and the Economy in Pakistan,"
MPRA Paper 4215, University Library of Munich, Germany. Saif and Faisal (2008). “Trading Volume and Stock Returns: Evidence from Pakistan’s Stock
Market.” International Review of Business Research Papers, Vol. 4 No.2 March 2008 Pp.151-162.
Iqbal, Javed (2008): Stock Market in Pakistan: An Overview, Online at http://mpra.ub.uni-
muenchen.de/11868/ MPRA Paper No. 11868 Udegbunam, R. J. (2002). Openness, stock market development and industrial growth in
Nigeria. The Pakistan Development Review 41(1): 69-92 Billmeier, A., and I. Massa (2009). “What drives stock market development in emerging markets
– institutions, remittances, or natural resources?” Emerging Markets Review, Vol. 10 (1), pp. 23-35.
Garcia and L. Liu, (1999). “Macroeconomic determinants of stock market development,” Journal
of Applied Economics, Vol. 2, pp. 29–59. Ologunde, A., Elumilade, D., Saolu, T., (2006). “Stock market capitalization and interest rate in
Nigeria: A time series analysis,” International Research Journal of Finance and Economics, Issue 4, pp.154-67.
Deb, S. G., & Mukherjee, J.(2008). “Does stock Market Development Cause Economic growth? A
Time Series Analysis for Indian Economy”. International Research Journal of Finance and Economics , Issue.21,pp.142-149, .
Yartey, C. A., and C. K. Adjasi (2007). ‘Stock market development in Sub-Saharan Africa: Critical
issues and challenges’, IMF Working Paper 07/209. Washington, DC: International Monetary Fund

International Journal of Academic Research in Business and Social Sciences September 2012, Vol. 2, No. 9
ISSN: 2222-6990
14 www.hrmars.com/journals
Hussain F, Mahmood T (2001). The stock market and the economy of Pakistan. Pak. Dev. Rev.
40(2): 107-114. Guryay, Safakali and Tuzel (2007). “Financial Development and Economic Growth: Evidence
from Northern Cyprus.” International Research Journal of Finance and Economics, ISSN 1450-2887 Issue 8.
Levine and Zervos (1996). “Stock Market Development and Long Run Growth” The World Bank
Economic Review, Vol. 10, No 2. Ted, A., Lazar, D., & Jeyapaul, J. (2005). “Is the Indian Stock Market A Casino?”, Journal of
Business and Economic Research, Vol. 3 No. 4, pp. 63-72 Aggarwal, R., Demirgüç(Kunt, A., & Martinez Peria, M.S. (2006). “Do workers’ remittances
promote financial dependence? “ World Bank Policy Research Working Paper No. 3957) Ihsan H, Ahma E, Ihsan M, Sadia H (2007). Relationship of Economic and Financial Variables with
behavior of Stock Prices. J. Econ. Cooperation 28(2): 1-24. Ali I, Rehman KU, Yilmaz AK, Khan MA, Afzal H (2005). Causal relationship between macro-
economicindicators and stock exchange prices in Pakistan, African Journal of Business Management, 4(3): 312-319.
Carsten Burhop, David Chambers and Brian Cheffins (2011). “Is Regulation Essential to Stock
Market Development? Going Public in London and Berlin, 1900-1913.” Max Planck Institute for Research on Collective Goods, Kurt-Schumacher-Str. 10, D-53113 Bonn.
Dr. Ataur Rahman and Mohammad Mizenur Rahaman (2011). “ Performance of Stock Market
of Bangladesh: An Empirical Study on Chittagong Stock Exchange (CSE).” Asia Pacific Journal of Research in Business Management, Volume 2, Issue 1.
Mustafa Cem Kirankabeş and Çağatay Başarir (2012). “Stock Market Development and
Economic Growth in Developing Countries: An Empirical Analysis for Turkey.” International Research Journal of Finance and Economics, Issue 87.
Heritage Foundation, (2012). Index of Economic Freedom, available at
http://www.heritage.org/features/index/. Creane, S., R. Goyal, A. Mushfiq Mobarak, and R. Sab, (2004). “Financial Sector Development in
the Middle East and North Africa,” IMF Working Paper No. 04/201 Lombardo, D., and M. Pagano, (2000). “Legal determinants of the return on equity,” CSEF
Working Paper No. 24 (Salerno: Centre for Studies in Economics and Finance).

International Journal of Academic Research in Business and Social Sciences September 2012, Vol. 2, No. 9
ISSN: 2222-6990
15 www.hrmars.com/journals
Ali Raza, Nasir Iqbal, Zeshan Ahmed, Mohammad Ahmed, Tanvir Ahmed (2010). “The Role of
FDI on Stock Market Development: The Case of Pakistan.”Journal of Economics and Behavioural Studies, Vol. 4 (1), pp. 26-33.