17093549 Factors Affecting Investors Preference for Mutual Funds in India

FACTORS AFFECTING PERFORMANCE OF
MUTUAL FUNDS IN KENYA
By:
Amunga Prisca Ingrid
D61/65061/2013
A Research Project Submitted in Partial Fulfilment of the Requirements
for the Award of Degree in Master of Business Administration (MBA) in
Finance, University of Nairobi
November, 2015

ii
DECLARATION
This research project is my original work and has not been submitted for the award of a
diploma or degree in any other university or college.
Signed: __________________________________ Date: __________________________
Ingrid Amunga
Registration Number: D61/65061/2013
This research project has been submitted the examination with my approval as a university
supervisor.
Signed________________________ Date____________________________
Dr. Sifunjo Kisaka
University Supervisor

iii
DEDICATION
I dedicate this research project to my parents Mr & Mrs Amunga and my entire family, who
have been a constant source of encouragement and inspiration while undertaking the project.

iv
ACKNOWLEDGEMENTS
Firstly, I would like to acknowledge the Almighty God for giving me strength, health and the
required resources to be able to complete this program.
Secondly, I would like to acknowledge my supervisor Dr. Sifunjo Kisaka for his guidance
and insights accorded to me while undertaking this study. I also thank the staff of the School
of Business, University of Nairobi for their administrative support.
Thirdly, I would like to acknowledge my parents for their support and guidance throughout
the period I was undertaking this program and instilling in me the importance of intellectual
intelligence.
Fourthly, I would like to thank my friends Christine Sayo, Ruth Mwangi, Jael Oyende,
Perpetual Wamwati, Dalmas Ochieng and Samson Kiptanui for their encouragement and
positive criticism which helped shape the outcome of this project.
Finally, I would like to acknowledge the various employees in the mutual fund industry
companies in Kenya who assisted me with data from their published and online financial
records as well as their willingness to take part in filling in the questionnaire given to them
for the purpose of data collection. This project would be incomplete without their input.
Thank you all.

v
LIST OF TABLES
Table 1: Measures of Dispersion – Investment Styles 44
Table 2: Measures of Dispersion – Fund Characteristics 49
Table 3: Measures of Dispersion – Behavioural Patterns 51
Table 4: Analysis of Managerial Capabilities 53
Table 5: Trends in Performance 54
Table 6: Measures of Dispersion – Persistence of Returns 56
Table 7: Regression Analysis 57

vi
LIST OF FIGURES
Figure 1: Response Rate from Questionnaire 37
Figure 2.Gender of the respondents 37
Figure 3: Age Bracket of Fund Managers 38
Figure 4: Academic Qualifications 39
Figure 5: Fund Managers’ Experience 39
Figure 6: Types of Funds Invested by Fund Managers 40
Figure 7: Average Value of Funds Invested 40
Figure 8: Frequency of Change of Investment Styles 41
Figure 9: Method of Assessing Fund Performance 41
Figure 10: Types of Securities Fund Managers’ Invest in 42
Figure 11: Frequency of Disposing Investments 42
Figure 12: Method of Buying and Disposing Stocks 43
Figure 13: Regulation of Fund Industry 45
Figure 14: Average Age of Fund 45
Figure 15: Clientele Type 46
Figure 16: Average Net Assets 46
Figure 17: Judicial System 47
Figure 18: Fund Expenses 47
Figure 19: Method of Charging Commission/Load Fees 48
Figure 20: Behavioural Patterns Displayed by Investors 50
Figure 21: Investment Strategies Employed by Fund Managers 52
Figure 22: Market Timing and Stock Picking Abilities 52
Figure 23: Education Level and Experience 53
Figure 24: Use of Past Performance for Prediction 55
Figure 25: Ability to Predict the Future 55

vii
LIST OF ABBREVIATIONS
APT – Arbitrage Pricing Theory
CAPM – Capital Asset Pricing Model
CBK – Central Bank of Kenya
CMA – Capital Markets Authority
EMH – Efficient Market Hypothesis
GARP – Growth at Reasonable Price
GDP – Gross Domestic Product
ICEA – Insurance Companies of East Africa
MPT – Modern Portfolio Theory
SEC – Securities and Exchange Commission
SPSS – Statistical Package for Social Sciences
RBA – Retirement Benefits Authority

viii
TABLE OF CONTENTS
Declaration-------------------------------------------------------------------------------- ii
Dedication -------------------------------------------------------------------------------- iii
Acknowledgement ----------------------------------------------------------------------- iv
List of Tables ----------------------------------------------------------------------------- v
List of Figures ---------------------------------------------------------------------------- vi
List of Abbreviations -------------------------------------------------------------------- vii
Abstract ----------------------------------------------------------------------------------- xi
CHAPTER ONE: INTRODUCTION ---------------------------------------------- 1
1.1 Background of the Study ------------------------------------------------------------ 1
1.1.1 Risk and Return ------------------------------------------------------------------ 2
1.1.2 Size of Mutual Fund ------------------------------------------------------------- 3
1.1.3 Mutual Fund Performance ------------------------------------------------------ 4
1.1.4 Relationship between Risk, Return and Size of Mutual Funds ------------ 5
1.1.5 Mutual Funds in Kenya ---------------------------------------------------------- 7
1.2 Statement of the Problem ------------------------------------------------------------ 8
1.3 Objective of the Study ---------------------------------------------------------------- 10
1.4 Importance of the Study -------------------------------------------------------------- 10
CHAPTER TWO: LITERATURE REVIEW -------------------------------------- 12
2.1 Introduction ---------------------------------------------------------------------------- 12
2.2 Theoretical Literature Review ------------------------------------------------------- 12
2.2.1 Efficient Market Hypothesis (EMH) ------------------------------------ 12
2.2.2 Modern Portfolio Theory (MPT) ---------------------------------------- 13
2.2.3 Capital Asset Pricing Model (CAPM) ---------------------------------- 14
2.2.4 Arbitrage Pricing Theory (APT) ----------------------------------------- 16
2.3 Empirical Literature Review --------------------------------------------------------- 18

ix
2.3.1 Risk and Return ------------------------------------------------------------ 18
2.3.2 Size -------------------------------------------------------------------------- 20
2.3.3 Market Timing Ability ---------------------------------------------------- 21
2.3.4 Investment Styles ---------------------------------------------------------- 22
2.3.5 Fund Characteristics ------------------------------------------------------- 23
2.3.6 Investor Behavioural Patterns -------------------------------------------- 24
2.3.7 Persistence of Returns ----------------------------------------------------- 26
2.3.8 Other Factors ---------------------------------------------------------------- 27
2.4 Summary of Literature Review ------------------------------------------------------ 29
CHAPTER THREE: RESEARCH METHODOLOGY -------------------------- 31
3.1 Introduction ----------------------------------------------------------------------------- 31
3.2 Target Population ---------------------------------------------------------------------- 31
3.3 Research Design and Sampling Techniques --------------------------------------- 31
3.4 Data and Data Collection Instruments ---------------------------------------------- 32
3.5 Data Analysis --------------------------------------------------------------------------- 32
CHAPTER FOUR: DATA ANALYSIS, RESULTS AND DISCUSSION ---- 34
4.1 Introduction ----------------------------------------------------------------------------- 34
4.2 Data Presentation ---------------------------------------------------------------------- 34
4.2.1 Rate of Return -------------------------------------------------------------- 34
4.2.2 Treasury bill Rate ---------------------------------------------------------- 35
4.2.3 GDP Growth Rate --------------------------------------------------------- 35
4.2.4 Inflation Rate --------------------------------------------------------------- 35
4.2.5 Market Interest Rates ------------------------------------------------------ 36
4.2.6 Fund Size -------------------------------------------------------------------- 36
4.3 Response Rate from Questionnaire ------------------------------------------------- 37
4.3.1 Biographical Information of the Respondents ---------------------------------- 37

x
4.3.2 Investment Style and Fund Performance ---------------------------------------- 40
4.3.3 Fund Characteristics and Fund Performance --------------------------------- 44
4.3.4 Behavioural Patterns and Fund Performance --------------------------------- 50
4.3.5 Managerial Capabilities and Fund Performance ----------------------------- 51
4.3.6 Persistence of Returns and Fund Performance ------------------------------- 54
4.4 Regression Analysis --------------------------------------------------------------- 56
4.5 Summary ---------------------------------------------------------------------------- 58
CHAPTER FIVE: SUMMARY OF FINDINGS, CONCLUSIONS &
RECOMMENDATIONS ------------------------------------------------------------ 59
5.1 Introduction ------------------------------------------------------------------------- 59
5.2 Summary of Findings -------------------------------------------------------------- 59
5.3 Conclusions ------------------------------------------------------------------------- 61
5.4 Limitations to the Study ----------------------------------------------------------- 64
5.5 Suggestions for Further Research ------------------------------------------------ 64
REFERENCES ------------------------------------------------------------------------ 67
APPENDICES --------------------------------------------------------------------------------------- 70
Appendix 1: Research Questionnaire
Appendix 2: Registered Fund Managers in Kenya
Appendix 3: Mutual Funds Data
Appendix 4: Economic Factors

xi
ABSTRACT
The mutual Fund industry in Kenya has developed rapidly over the past two decades.
This can be attributed to the various advantages associated with mutual funds as opposed to
other investment instruments. Survival if the fund is purely determined by its performance in
the market. This is determined by growth of fund investments and amount of periodic returns
to investors for growth and value funds respectively. Furthermore, the growth in the mutual
funds market in Kenya has led to great interest in the risk – return relationship in the market.
Various asset pricing models can be utilized in empirical testing to determine the dominant
risk factors affecting funds in the market.
Kenyan fund market is still budding and of late it has not been performing well when
compared to other developed fund markets in the world. Despite this, little research has been
done to determine the reasons for poor performance and especially in studying the
fundamentals that determine the fund performance. They included risk and return, size,
investment styles, fund characteristics, behavioural patterns of investors, managerial
capabilities and persistence of returns. The study also adopted the arbitrage pricing model to
identify these factors. The Treasury bill, GDP growth rate, inflation size and the fund size
were the independent variables selected for the model whose beta parameters were analysed.
The research results will be of utmost importance to the fund managers, investors,
government and the academic fraternity. The study involved the registered fund managers in
Kenya, which stands at 16, according to the Retirements Benefit Authority (RBA). The
research design was descriptive and the researcher employed the census method of study
where each registered fund manager was issued with two questionnaires; one to the
investment manager and the other to the fund administrator. 28 out of 32 questionnaires
issued were duly completed and returned. The data collected was first subjected to descriptive
statistics including frequencies, percentages, means and standard deviations.
The study found that a positive relationship existed between mutual funds’ returns and
the Treasury bill rate and the market interest rates. A negative beta was computed for GDP
growth rate, inflation rate and fund size factors. These factors represent risk in the mutual
funds market and a positive risk return relationship as computed from the model. Inflation
rate, market interest rates and GDP growth rate were observed to have the greatest impact on
mutual fund returns. The fund size had a lower but significant coefficient while the beta for
Treasury bill rate factor was insignificant. It was also found that there is a negative
relationship between fund performance and behavioural patterns of investors.
The study recommends that Kenyan fund managers be exposed to the best investment
practices including adopting the appropriate styles and changing them frequently, holding the
right size of fund, cleverly selecting the funds to invest in, methods of assessing fund
performance among other investment style characteristics.

1
CHAPTER ONE
INTRODUCTION
1.1 Background to the Study
The predictability of mutual fund performance or the performance of any manager has
become an important topic in finance. There is vast literature in finance that deals with
models to measure portfolio performance. Moreover, financial services devote a huge amount
of attention to developing and marketing statistics. While there are many reasons for
measuring performance, the most important reason is to tell the investor something about
future performance based on past performance of the mutual funds. The fact that the
investing public believes that past performance contains useful information about the future
can be seen in two ways; the size by which the industry has grown up to supply performance
data to the public and the level by which funds invested in mutual funds have changed from
year to year as investors seek better returns with relative levels of risk. For this reason,
scrutinizing risk and size of fund as factors affecting performance of mutual funds is of
importance.
The investment strategy used determines the risk and reward profile for mutual funds and
they vary. Mutual funds provide diversification, divisibility, low transaction costs, access to a
broader array of assets and professional management for the individual investor, factors that
have propelled their popularity in the past decades, according to Saraoglu and Detlzer (2002).
Corporate and private investors evaluate risk and return associated with them in comparison
with those associated with other investment assets, before allocating their investment in
mutual funds. Hence, investor will evaluate the inherent risk and return associated with
different asset classes while allocating his assets. According to Markowitz (1952), the higher
the risk an investor exposes themselves to, the higher a return they will seek to gain. Hence,

2
an investor is likely to evaluate the returns offered by the mutual funds in the past and
compare these returns with those of other assets before making an investment decision.
Fund performance is measured in terms of capital growth and periodical returns for growth
and value funds respectively. The investigation of performance has evolved from the
examination of benchmarking and modelling issues to analyses of other factors that may
impact performance. Most research documented was based on investment styles which
include the size dimension and fundamental attributes of that holding as affecting fund
performance. Other factors affecting fund performance include fund characteristics and
behavioural patterns, managerial abilities and persistence of return patterns (Oliver, 2009).
1.1.1 Risk and Return
Risk is the possibility of an outcome deviating from the expectation. It is highly likely that
the actual returns will deviate from the expected returns in portfolio management. Downside
risk is more critical in portfolio management since it’s a probability of making a financial
loss. This may include getting less return than the expected, making no return at all or even
losing the whole investment itself. Variability in return is analysed by calculating the
standard deviation thus reflects the inherent risk in an investment. Mutua (2011) noted that
the risk in a portfolio is affected by the asset composition and their individual variances.
Returns from financial assets consist of both periodic income and capital gain for traded
assets. Periodic income can be measured in terms of the yield rate which is the percentage of
the return of the value asset.
Income yield = (1)
Where CF1 = the expected cash flow
P0 = Purchase price

3
Expected return is the average return in the period under consideration multiplied by their
probability percentages.
E(r) = (2)
Where E(r) = the expected return
pi = the probability of return
ri = the return per period
The asset risk is therefore the standard deviation of the returns, which is the square root of its
variance.
σ = √ (Ʃ piri2 – E(r) 2) (3)
An investor will seek to maximize returns of the asset at minimum possible risk. The investor
will consider diversifiable and non-diversifiable risk. Non-diversifiable risk is systematic risk
that affects the whole market. Diversifiable risk is non-systematic risk which only affects a
certain industry hence can be reduced or eliminated in a portfolio through diversification.
Hence a portfolio should contain assets which are negatively correlated. Correlation refers to
the degree at which the returns of two assets change in the same direction. Therefore, a
portfolio with two perfectly negatively correlated assets would be riskless.
Saraoglu and Detzler (2002) observed that portfolio management by fund managers involves
constructing a variety of risky portfolios that maximize returns. They analyse risk factors that
affect returns and provide a competitive yield rate for the investors.
1.1.2 Size
How does mutual fund performance depend on the size or asset base of the fund? According
to (Gruber, 1996 and Berk & Green, 2002), the issue of the persistence of fund performance
depends crucially on the scale-ability of fund investments. The nature of the economies of
scale in this industry may also have implications for the agency relationship between

4
managers and investors and the optimal compensation contract between them (Brown et al,
1996 and Becker & Vaughn, 2001). Thus, understanding the effects of fund size on fund
returns is an important first step towards addressing such critical issues.
While the effect of scale on performance is an important question, it has received little
research attention to date. Some researchers point out that there are advantages to scale, such
as more resources for research and lower expense ratios, while others believe that a large
asset base erodes fund performance because of trading costs associated with liquidity or price
impact (Perold & Salomom, 1997). Whereas a small fund can easily put all of its money in its
best ideas, a lack of liquidity forces a large fund to have to invest in its not-so-good ideas and
take larger positions per stock than is optimal, thereby eroding performance.
1.1.3 Mutual Fund Performance
According to the Investment Company Fact Book 2014, the US mutual fund market remained
the largest in the world – with $15 trillion in assets under management at year end 2013-
accounting for half of the $30 trillion mutual funds worth worldwide.
Overall demand for mutual funds as measured by net new cash flow slowed in 2013.
Increased demand for equity, hybrid and money market mutual funds are more often offset by
lower demand for bond funds. Overall mutual funds hold a net cash inflow of $167 billion in
2013, down from $196 billion in 2012. Investors added $152 billion, on net, to long term
funds and $15 billion, on net, to money market funds. Actions by the Federal Reserve, global
economic conditions, evolving investment preferences and ongoing demographic trends
appeared to influence mutual fund flows in 2013.
Relative outperformance of equities, together with lower stock market volatility helped to
bolster steady demand for equity mutual funds throughout 2013. Bond fund flows in 2013

5
were easily influenced by developments related to monetary policy. The Federal Reserve held
short-term interest rates at a very low level and also continued to make large scale purchases
of fixed income securities. In the second half of the year, the markets interpreted the Federal
Reserve’s action as an indication that the Federal Reserve might begin to curtail its asset
purchases. Consequently, long-term interest rates rose sharply, depressing returns in the
United States Fixed-Income market.
Hybrid funds ensure that investors achieve a managed balanced portfolio of stocks and bonds.
Over the past seven years, a sum of $384 billion was added by investors I the net new cash
and reinvested dividends to these funds. In 2013, investors added a record $73 billion in net
new cash flow to hybrid funds, up from $47 billion in 2012.
1.1.4 Relationship between Risk and Return and Size of Mutual Funds
Prospective investors need to have a strong understanding of market capitalization (‘market
cap’) in order to effectively begin their search for mutual funds. When a mutual fund is
described in terms of market cap, (i.e., small-cap, mid-cap and large-cap), it indicates the size
of the companies in which the fund invests, not the size of the mutual fund itself. Market cap
is calculated as the number of shares outstanding multiplied by the current market price of
one share. Thus, a company with one million shares outstanding selling at $100 per share
would have a market cap of $100 million.
Small-cap funds typically include companies with market capitalization of less than $1 billion
and are generally those companies in their early stages of business and are presumed to have
significant growth potential, but are not as financially strong or established as larger
companies. Since small cap funds invest in companies that are less stable than large cap
companies, the funds can be quite volatile. This has its pros and cons. In times of market
instability, small cap funds can suffer greatly as less established companies go out of

6
business. On the other hand, small cap funds can be great investments for those who can
tolerate more risk and are looking for more aggressive growth. Finally, many mutual funds
cannot take substantial positions in small cap stocks without filling with the Securities and
Exchange Commission (SEC), and this usually means greater transparency when it comes to
funding holdings.
Mid cap funds are those that invest in companies with market caps of $1 billion to $8 billion,
and is the most popular choice among the general investing public. These companies share
some of the growth characteristics of small cap companies, but they entail less risk (at least in
theory) because they are slightly larger. These funds don’t always move with the broader
market, and are usually not as prone to violent swings as small caps. They can be great
investment vehicles for investors seeking to fund with great return possibilities – without the
risk of small caps and index-related returns like those of large caps.
Large cap funds comprise companies with market caps of $8billion or more. However, due to
their large size, large cap funds are often forced to imitate a larger index, such as the S & P
500, since mutual funds have restrictions on the level of the ownership they can have in any
one company, which is generally no more than 10% of their outstanding shares. This results
in large cap funds being forced to buy large companies – the same ones that make up the
major market indexes. These funds can be great for investors who have longer-term
investment timelines and would like to ‘buy and hold’. There are many large cap income
funds that are great income vehicles for those who want to take less risk, but not for those
seeking greater diversification in smaller, more aggressive companies.
Generally, small and mid-cap companies have the ability to produce greater returns through
more agile and dynamic businesses that tend to be more growth oriented than large
conglomerates. In simple terms, a company with a $1 billion market cap can much more

7
easily double its entire market cap than a large conglomerate of $50 billion. And because
share price is an important factor in measuring market cap, a rapidly growing market cap
most often translates to the price of the stock climbing higher as well.
In conclusion, when an investor is considering what type of mutual fund is right for their
portfolio, it is crucial that they remember that there are many other factors to consider, e.g.,
whether the fund specializes in growth, value or another investing style. They should also
distinguish between load and no-load funds and determine whether they prefer open or closed
end funds.
1.1.5 Mutual Funds in Kenya
In Kenya, the mutual fund industry did not take of as early as in developed countries.
However, unit trusts have largely grown in acceptance and popularity over the recent years
and this is evidenced by the number of approved trust funds from virtually zero in 2001 to
eleven in 2008. According to the Capital Market Authority (CMA) Investor Education
handbook (2010), there were eleven functional unit trust schemes, namely; African Alliance
Kenya Unit Trust Scheme, Old Mutual Unit Trust Scheme, British American Unit Trust
Scheme, Stanbic Unit Trust Scheme, Commercial Bank of Africa Unit Trust Scheme, Zimele
Unit Trust Scheme, Suntra Unit Trust Scheme, Insurance Companies of East Africa (ICEA)
Unit Trust Scheme, CFC Unit Trust Scheme, Dyer and Blair Unit Trust Scheme and Standard
Unit Trust Scheme.
Since the initial work of Sharpe (1966), various research studies have been conducted and
various determinants documented as affecting the mutual fund performance. For instance, the
works of Brown et al (2009), Rawkoski and Wang (2009), Duan Hu and Mclean (2008) and
Cohen et al (2008) have documented investment style, fund characteristic, investors’

8
behavioural patterns, managerial characteristics and mutual fund risks, as affecting mutual
fund performance.
During the 1990’s, there was significant growth in the mutual industry worldwide as a result
of the advantages associated with mutual funds. This was the period during which individual
investors were shifting from real estate and tangible assets to financial assets, and their
preference for ownership of stocks and bonds and the growth of tax deferred investing for
retirement through pension plans which were used to own mutual funds (Fabbozi and
Modigliani, 2002).
There was substantial growth in the number of mutual funds in the United States of America
in the 1980’s. Towards the end of 2005, the combined assets of the US mutual funds
approached $9 trillion, up from $370 billion in 1984, while the number of individual funds
grew from 1200 to 900 over the same period (Bliss, Potter and Schwarz, 2008). This implies
that the investing public relies on non-bank financial institutions and increased sophistication
of investors as regards to their knowledge and appreciation of alternatives to commercial
bank services (Johnstone, Hatem and Carnes, 2010).
The regulators of the financial industry in Kenya are Capital Markets Authority (CMA),
provisions of the Central Bank of Kenya (CBK), Retirement Benefits Authority (RBA), stock
exchanges and international institutions. In 2010, the Funds Managers’ Association was set
up as a self-regulatory initiative.
1.2 Statement of the Problem
Over the last few years, mutual funds have attracted considerable attention due to their
increase in funds holding across the globe and as a result, fund managers’ operations have
been reviewed (Gitagia, 2012). Foreign investors evaluate the risks that range from economic

9
stability, inflation and other macroeconomic variables against the rate of return available
locally relative to the international rates. They evaluate past yields offered by mutual funds
with the volatility of such return constituting the inherent risk. Ramasang (2003) observed
that robust growth in fund management in emerging markets has resulted in a rapid increase
in investment firms offering diversified portfolio funds. However, the investors, while
evaluating these factors, do not investigate them conclusively before settling on a fund to
invest in.
Mutual funds in Kenya have recorded significant growth in the last two decades and the
rapidly growing middle class is gradually gaining interest in them (Kariuki, 2012). The fund
management firms play a significant role in boosting national savings and compete for
investor funds with other investment assets. Over the last two decades the level of funds
invested in mutual funds has changed from year to year as investors seek better returns with
relatively low levels of risk (Mutua, 2011). Mutual funds offer different products that yield
periodic incomes and capital gains on listed assets. It is also these different products that
influence the performance of different funds in the market.
Sharpe (1964) in an investigation into the relationship between risk and the return found a
positive relationship. Locally, Muriithi (2005) evaluated the risk return relationship of equity
mutual funds and found a positive relationship between the two factors. This concluded that
investors in Kenya were highly risk averse and highly prefer low risk assets, demanding
higher return if they were to incur more risk. This has an effect on the performance of the
mutual funds in that, the low risk securities will be more attractive to the investors as opposed
to those with higher risk.
Berk and Green (2004) argued out why past performance should not predict future
performance. They argued that a successful manager would capture excess return by charging

10
more per dollar managed, hence increasing expense ratios, or, on the other hand the fund
would increase in size and due to resulting diseconomies of scale, such as, greater transaction
costs, organizational diseconomies or the need to add poorer performing investments, excess
returns will disappear and eliminate predictability.
Does increase in size of a mutual fund or its good performance lead to an increase in
expenses? Pollet and Wilson (2008) examine influences that could lead to diseconomies of
scale which in turn increase the expenses. They hypothesize that management can put more
money into existing stocks, therefore incurring higher transaction costs or they can increase
the number of stocks in the portfolio, thus having to select securities with lower expected
returns.
All the above studies were carried out in isolation, hence it cannot be concluded that a
particular factor is solely responsible for how a specific mutual fund performs. This implies
that limited research was carried out in examining the factors that affect the performance of
mutual funds and to what extent. Some factors may be known while others emerge with
changing times. It is due to this background that this study sought to fill this knowledge gap
by assessing the factors that affect the performance of mutual funds in Kenya.
1.3 Objective of the Study
The objective of the study is to find out the factors that influence the performance of mutual
funds in Kenya.
1.4 Importance of the Study
Through its findings, the study will contribute to both the academia and the financial
practitioners. To begin with, the study will help fund managers to observe the general view of
factors influencing the performance of mutual funds in the past and the decisions investors
took using the information that was available to them. It will indicate whether their

11
predictions materialized and the impact they had on the returns that they generated. It will
help fund managers better understand economic factors expectations and choices, hence
provide products that cater for their unique preferences.
Secondly, it will aid investors to review their asset allocation methods by highlighting the
prevailing factors and the resultant actual market returns. The study will further highlight the
critical factors investors should put into consideration and their impact to returns realized.
This information will be critical to individual, corporate and private investors making
investment decisions against a large field of investment options.
The study will benefit the economic policy makers who seek to boost investment in different
sectors. It will highlight the factors that determine mutual funds’ performance and thus
information on how to boost the industry and consequently domestic investments. It will
provide information on how to influence investment towards certain asset classes by
determining what factors influence returns in these asset classes over the others, thus
formulate policy to direct investments towards the critical asset classes.
The study will be beneficial to the academic sector as it will contribute to the body of
knowledge by providing empirical evidence against theoretical factors expected to affect
mutual funds’ performance in the industry.
Finally, the study will recommend new areas for further study that influence the mutual fund
industry. It will highlight currently available information, expected changes in the market and
possibility of more research as the mutual fund market grows in Kenya.

12
CHAPTER TWO
LITERATURE REVIEW
2.1 Introduction
This chapter explores the theories associated with the mutual fund performance. Section 2.2
discusses the theoretical literature. Section 2.3 presents the empirical literature to the study.
Section 2.4 outlines other relevant factors that determine mutual fund performance. Finally,
section 2.5 summarises all the discussions in the chapter and the way forward.
2.2 Theoretical Literature Review
The theoretical review will provide some theories related to mutual fund performance and in
particular those that are linked to risk and size as factors affecting mutual fund performance.
Some of the theories explored include Efficient Market Hypothesis (EMH), Modern Portfolio
Theory (MPT), Capital Asset Pricing Model (CAPM) and Arbitrage Pricing Theory (APT)
2.2.1 Efficient Market Hypothesis
The Efficient Market Hypothesis (EMH) created by Fama (1970) states that, the security
prices reflect all publicly available information. Trading based on insider knowledge is
illegal, and even if it were possible, not enough investors would be privy to such non-public
information to make any significant impact on the overall returns of any stock. Most financial
products available to the investors today assume the sanctity of the EMH. Passive investing,
diversification and overall market index as a benchmark for performance are all a result of
blind faith in the EMH.
The EMH assumes three things: First, that all investors perceive all information available in
the same manner. Second, under the EMH, no single investor is able to gain greater
profitability than the other with the same amount of invested funds, their equal possession of

13
information means they can only achieve equal returns. Thirdly, no investor should ever be
able to beat the market, or the average annual returns that all investors and funds are able to
achieve using their best efforts.
However, the EMH does not give strict definition of how much time prices need to revert to
fair value. In addition, under the efficient market, random events are entirely acceptable but
will always be ironed out as prices revert to the norm.
2.2.2 Modern Portfolio Theory (MPT)
Modern Portfolio Theory (MPT) is a hypothesis put forward by Harry Markowitz (1952),
which was based on the idea that risk-averse investors can construct portfolios to optimize or
maximize expected return based on a given level of market risk, emphasizing that risk is an
inherent part of higher reward. It suggests that it is not enough to look at the expected risk
and return of one particular stock, rather, by investing in more than one stock, an investor can
recap the benefits of diversification (also known as not putting all your eggs in one basket),
particularly a reduction in the riskiness of the portfolio.
One of the basic assumptions in this theory is that an investor seeks to maximize discounted
expected returns and variance of returns is undesirable. Variance is a measure of dispersion
from the expected. Expected returns can be measured by the yield of the asset while the
variance of return is considered as a risk. The choice of portfolio is separated from beliefs
using the expected return-variance of returns rule. Hence, the evaluation of this relationship is
the basis of the choice made by investors, thus eliminating decisions made of beliefs.
MPT suggests that it is possible to construct an ‘efficient frontier’ of optimal portfolios,
offering the maximum possible expected return for a given level of risk. The efficient frontier

14
can be defined as a combination of assets with maximum expected returns that is superior to
any other combination and gives the highest level of returns at the lowest level of risk.
Return on the portfolio is the weighted sum of expected return of the component assets, i.e,
E (Rp) = Ʃ wi E (Ri) (1)
Where Rp is the return on the portfolio, Ri is the return on asset I and wi is the weighting of
component asset i (i.e., the share of asset i in the portfolio).
Portfolio return variance is calculated as follows:
σp2 = Ʃ wi
2 σi2 + Ʃi Ʃj≠i wi wj σi σj ρij (2)
Where ρij is the correlation coefficient between the returns on assets i and j. alternatively, the
expression can be written as:
σp2 = Ʃi Ʃj wi wj σi σj ρij (3)
Where ρij = 1; for i=j.
The theory concludes that diversification provides a superior portfolio. It minimizes the
variance with caution being placed on ensuring that the assets don’t have a high covariance
with each other.
Weaknesses in the MPT emerge from the difficulty in estimating the correlation coefficient
for two assets. It is even harder for multiple assets which require complex tools, thus it is not
practical. In reality, unlimited range of possibilities of investments exists.
2.2.3 Capital Asset Pricing Model (CAPM)
The CAPM model was the work of financial economist (and later Nobel Laureate in
Economics), William Sharpe, 1970, as set out in his book, ‘Portfolio Theory and Capital
Markets.’ He put forth the idea that individual investment contains two types of risk:

15
systematic Risk which is market risk that cannot be diversified away. They include interest
rates, recessions, wars, etc., and unsystematic Risk/specific risk which is risk specific to
individual stocks and can be diversified away as the investor increases the number of stocks
in his/her portfolio. In other words, it represents the component of a stock’s return that is not
related with general market moves.
Even though MPT shows that specific risk can be removed through diversification,
diversification still does not solve the problems of systematic risk; even if a portfolio contains
all the shares in the stock market, that risk cannot be eliminated. Therefore, CAPM offers a
way to measure this systematic risk when calculating a deserved return.
Sharpe (1964) found that the return on an individual stock, or a portfolio of stocks, should
equal its cost of capital. The standard CAPM formula which describes the relationship
between risk and expected return is given by:
Ra = Rf + βa (Rm - Rf) (4)
Where; Rf = Risk free rate
βa = Beta of the security
Rm = Expected market return
(Rm - Rf) = Equity market premium
CAPM’s starting point is the risk-free rate, typically, a 10-year government bond yield. A
premium demanded by equity investors is added to this to compensate them for the extra risk
they accept. This ‘equity market premium’ consists of the expected return from the market as
a whole less the risk-free rate of return. The ‘equity risk premium’ is multiplied by a
coefficient called “beta”, as called by Sharpe (1964).

16
Beta measures a stock’s relative volatility, i.e., it shows how much the price of a particular
stock jumps up and down. A beta greater than one means that the asset is more sensitive than
the market portfolio thus has a greater variance. A beta less than one means the asset is less
sensitive, thus has a low systematic risk. For instance, if a share price moves exactly in line
with the market, then the stock beta is 1. A stock with a beta of 1.5 would rise by 15% if the
market rose by 10% and fall by 15% if the market fell by 10%.
The beta formula is given by:
βi = Cov (Ri Rm)/Var Rm (5)
CAPM uses various assumptions about markets and investor behaviour to give a set of
equilibrium conditions that allow us to predict the return of an asset for its level of systematic
(or undiversifiable) risk. By using a measure of a systematic risk that can be compared with
other assets in the market, theoretically, investors are allowed to improve their portfolios and
fund managers to find their required rate of return. However, there are infinite assets in the
market portfolio, making it unobservable – only an index can be used, hence limiting its
testability.
2.2.4 Arbitrage Pricing Theory (APT)
Ross (1976), created the arbitrage pricing theory, which is an asset pricing model based on
the idea that an asset’s return can be predicted by using the relationship between that same
asset and many common risk factors. The theory predicts a relationship between the returns
of a portfolio and the returns of a single asset through a linear combination of many
independent macro-economic variables. Where the price of an asset is mispriced, APT
describes where it is expected to be. APT is viewed as an alternative to CAPM, since it has
more flexible assumption requirements. While the CAPM formulae requires the market’s
expected return, APT uses the risky asset’s expected return and the risk premium of a number

17
of macro-economic factors, such as, changes in the gross domestic product, inflation and the
structure of the interest rate.
The fundamental logic is that arbitrageurs use the APT model by taking advantage of
mispriced securities to make a theoretic risk-free profit, since a mispriced security will have a
price that differs from the theoretic price predicted by the model.
The APT model is derived from the unpredictable components of asset return as follows:
E (Rj) = Rf + UR (6)
Where; E (Rj) = the expected return of asset j
Rf = the risk free rate of return
UR = the unpredictable rate of return
The unpredictable component depends on economic factors which are identified and
represented as follow:
UR = β1F1 + β2F2 + β3F3 + ……. + βnFn (7)
Where: βi = the beta of the factors
β = b (Rfactor1 - Rf)
The beta measures the sensitivity of each stock to the factor. (Rfactor1 - Rf) estimates the risk
premium on each factor. This is the difference between the factors rate of return and the jrisk
free rate of return. Hence;
E (Rj) = Rf + β1F1 + β2F2 + β3F3 + ……. + βnFn (8)
The APT model does not require the market portfolio to be measured and can be used when
only data from a sample of risky assets is available.

18
2.3 Empirical Literature Review
There have been large numbers of studies published about mutual fund performance in
general. However, the number of empirical studies on the performance of mutual funds in
fund markets is relatively small. These section of the study attempts to summarize the
conclusions of some selected studies.
2.3.1 Risk and Return
Gaumnitz (1970) evaluated the portfolio return variability and market price. He concluded
that portfolio managers are better off maximising the portfolio market prize to maximise
returns rather than try to minimise its variability. The returns on a portfolio vary more
significantly than the portfolio market price. Hence, the return measures dominated the risk
measures in calculation of the market price of risk than consideration of the variability.
Black, Jensen and Scholes (1972) improved the precision of the CAPM in estimating the beta
by working with portfolios rather than individual assets. The evaluation was not purely for
the pricing of a single asset but the pricing of a portfolio of assets. Jensen (1968) highlighted
the fact that a time-series regression test would prove the accuracy of the capital asset pricing
model. His evaluation considered the CAPM parameters and their estimation concluding that
a regression analysis would provide the estimate which would be used in the model. Actual
returns would then be compared with forecasts generated from the model. Significance test
proved that the beta was significant in explaining changes in explaining changes in expected
returns and estimates were within close range to the actual returns earned.
Taylor & Yoder (1994) investigated whether mutual fund trading activity by managers of
high-risk mutual funds make a positive contribution to investor utility. Stochastic dominance
is used to compare the returns of high-turnover funds with those of low-turnover funds. This
approach avoids the limitations of a mean/variance or regression approach and minimizes

19
problems of survivorship bias. The results show that high-turnover groups dominate low-
turnover groups, or at least are equally attractive to risk-averse investors. Active portfolio
management can enhance investor utility, even when the cost of obtaining and exploiting
costly information are taken into account.
Grinblatt & Titman (1989) analysed mutual fund performance using quarterly portfolio
holdings. They employed the 1975-85 quarterly holdings of a sample of mutual funds to
construct an estimate of their gross returns. The sample which was not subject to survivor-
ship bias was used in conjunction with a sample that contains the actual (net) returns of the
mutual funds. In addition to allowing estimation of the bias in measured performance that is
due to the survival requirement it also afforded estimates of total transaction costs, and the
sample was used to test for existence of abnormal performance. The test indicated that the
risk-adjusted gross returns of some funds were significantly positive.
Roll (1997) however heavily criticised the Capital Asset Pricing Model due to the fact that
the market portfolio was unidentifiable. A market portfolio would include all risky assets
available in the market and would be infinite. He was in support of the arbitrage pricing
theory that evaluated more factors and included economic risk factors. This multifactor
model was derived by Ross (1990). In this theory the level of risk in an asset and therefore its
average expected return is directly related to anticipate changes in economic variables. These
factors include inflation, industrial productivity, risk premiums, slope of the term structure of
interest rates among others.
Ngene (2002) investigated the portfolio performance measures used by pension managers and
the challenges they face in portfolio management in Kenya. He established that most
investment managers are aware of the portfolio performance measures yet only one of the
nine respondents used the measures in pension fund management.

20
Maina (2003) researched on the risk and return of the investments held by insurance
companies in Kenya from January 1997 to December 2001. He concluded that there is very
little correlation between return and risk of investment held by Kenyan insurance companies.
Investment in secured loans however had a positive relationship between risk and returns.
Mutua, (2010) evaluated the relationship between portfolio composition, risk and return
among fund management firms in Kenya. He concluded that asset selection affects the risk
and return associated with a portfolio. He found that portfolio composition was evaluated by
fund managers in determining acceptable risk and achievable returns by the fund.
2.3.2 Size
Indro, Jiang, Hu & Lee (1999) evaluated whether fund size affects a mutual fund’s
performance. They found that the fund size, which is the value of net assets under
management, affects the mutual funds’ performance. Mutual funds must attain a minimum
fund size in order to achieve sufficient returns to justify their costs of acquiring and trading
on information. Furthermore, there are diminishing marginal returns to information
acquisition and trading, and the marginal returns become negative when the mutual fund 22
exceeds its optimal size. In a sample of 683 non-indexed American equity funds over the
1993-95 periods, they found that 20 per cent of the mutual funds were smaller than the
breakeven-cost fund size and 10 per cent of the largest funds overinvested in information
acquisition and trading. In addition, they found that value funds and blend (value-and-
growth) funds have more to gain than growth funds from these information activities.
O’Neal (1997) researched on how many mutual funds constitute a diversified mutual fund
portfolio. Using simulation analysis he found that time-series diversification benefits are
minimal but the expected dispersion in terminal-period wealth can be substantially reduced
by holding multiple funds. Portfolios with as few as four growth funds halve the dispersion in

21
terminal-period wealth for 5 to 19-year holding periods. In addition, downside risk measures
decline as funds are added to portfolios. These advantages to multiple-fund portfolios are
especially meaningful for investors funding fixed-horizon investment goals such as
retirement or college savings.
2.3.3 Market Timing
Merton (1981) developed a framework for evaluating market timing ability that does not
require knowledge of the distribution of returns on the market or any particular model of
security valuation. It takes the simple form that the investment manager either forecasts that
the stock market will provide a greater return than riskless securities. The forecaster does not
attempt to predict, or is not able to predict, by how much stocks will perform better or worse
than riskless securities, but s/he will adjust the relative proportions of the market portfolio
and riskless securities that are held in the fund.
Comer (2006) examined the stock market timing ability of two samples of hybrid mutual
funds. He found that the inclusion of bonds indices’ and a bond timing variable in a
multifactor Treynor-Mzuy model framework leads to substantially different conclusions
concerning the stock market timing performance of these funds relative to the traditional
Treynor-Mazuy model. Results from this multifactor model find less stock timing ability over
the 1981-91 time periods and provide evidence of significant stock timing ability across the
second fund sample during the 1992-2000 time periods.
Market timing ability is based on the notion that the decision to issue equity depends on
market performance (Lucas and McDonald (1990) and Korajczyk, Lucas and McDonald
(1992)). Empirical evidence supports the prediction that mutual fund price performance is
important for equity issues decisions (Rajan and Zingales (1995), Baker and Wurgler (2002),
and Entrepreneurs’ Survey by Kamath’s (1997) and Graham and Harvey (2001)). Mixed

22
evidence exists regarding whether investors overpay for shares or not. Some researchers
argue that investors tend to be overoptimistic during new issues and the analysts’ forecasts
are inadequately high and that managers manipulate earnings prior to going public. (Baker
and Wurgler (2002), Teoh, Welch and Wong (1998)).
Additionally, some research argues in favour of efficient market version of the market timing
argument (Hansen and Savin (1998), Knill and Lee (2006)). Still, some research suggests that
market timing is not based on good market performance as compared to firm’s predicted
performance. Instead it is based on the market performance prior to the issue (“pseudo-
market timing, Schultz (2003) and Butter, Grullon and Weston (2005)).
Evidence mostly supports the market timing theory in that managers wait until the market
conditions are better, that stocks have high return prior to equity issues and that prior to
issues firms window-dress or improve their performance. Mixed evidence exists regarding
whether investors overpay for mutual funds and shares. Also can the market timing theory be
used to explain numerous phenomena about mutual fund performance? The fact is that we
lack theoretical models on market timing. As a result, the authors have sometimes different
opinion about the interpretation of market timing.
2.3.4 Investment Styles
Funds’ preference for one investment style over another (due to behavioural or agency
reasons) may affect the structure of asset prices. Barberis and Shleifer (2000) show how
funds’ pursuit of styles can account for observed patterns in stock returns. For instance, if
funds favour a style and allocate more resources to that style than is warranted by underlying
fundamentals, the prices of stocks belonging to that style category may temporarily deviate
from fair values. Chan, Karceski and Lakonishok (2000) provided evidence on the operating
performance of size-value equity asset classes.

23
Though many style dimensions might be used, in practice, investment managers generally
tend to break the domestic equity investment universe down into four classes: large
capitalization or small capitalization growth stocks and large capitalization and small
capitalization value stocks. Academic research by Fama and French (1992, 1993) and Chan,
Karceski and Lakonishok (1998), found that size and book-to-market are important for
capturing the variation in stock returns.
Models vary with respect to the choice of style indices. Fama and French (1992, 1993) found
that three factors – the market and mimicking portfolios for size and book-to-market – can
explain the cross-section of average returns and common variation in returns. Accordingly,
the Fama-French factors are used as style indices, hence a fund’s loadings on the factors
provide one way for identifying a fund’s style. Alternatively, the style indices are either used
for the first three or four statistical factors extracted from stock returns used as the asymptotic
principal components method of Connor and Korajczyk (1991). Brown and Goetzmann
(1997) performed a cluster analysis on fund returns and identified eight style dimensions.
Sharpe (1992) provided a different style classification procedure that is widely used in the
investment management industry. This procedure regresses a fund’s return on the returns to
cash and a variety of equity classes. The model thus yields the fund’s effective asset mix.
2.3.5 Fund Characteristics
Numerous studies generally indicate that mutual funds as a group do not outperform passive
benchmarks (Jensen (1968), Ippolito (1989), Elton et al. (1993) and Malkiel (1995)). This
finding is even more striking when juxtaposed against the voluminous research documenting
various return anomalies. For example, a portfolio of “value” stocks (with high ratios of
book-to-market value of equity) generated on paper, returns that have in the past substantially
exceeded the return on the Standard and Poor’s (S&P) 500 index. The puzzle then is why so

24
few funds consistently generate superior performance. One explanation borrows from related
research on the pension fund industry (which generally has not displayed superior
performance either). Although there are important differences in the structure of the pension
and the mutual fund industries, the conjecture is that mutual fund managers’ behaviour may
be coloured by considerations beyond the maximization of portfolio return or diversification.
Khorana (1996), Chavelier and Ellison (1997) and Karceski’s (1998). Insofar as these choices
degrade performance, the result is the general underperformance in mutual funds.
On the methodological front, existing literature directly confronts the size-value style
classification scheme with several alternatives based on expanded style dimensions. Previous
research, Brown and Goetzmann (1997), Carhart (1997), show that sixe and value help
account for differences in fund performance. Instead of basing a fund’s style on the
sensitivity of its return to factors, an alternative approach uses the characteristics of the fund
holdings. Grinblatt and Titman (1989) and Daniel et al. (1997) use such an approach to
evaluate fund performance. On a related note, Daniel and Titman (1997) found that fund
characteristics do better than factor loadings in explaining the cross-sectional behaviour of
average returns.
2.3.6 Investor Behavioural Patterns
“Prospect Theory”, (Kahneman and Tversky, 1979), found that individual were much more
distressed by prospective losses than they were happy by an equivalent gains. Some
economists have conclude that investors typically consider the loss of $1 twice as painful as
the pleasure received from a $ gain. The implication is that individuals will respond
differently to equivalent situations depending on whether it is presented in the context of
losses or gains.

25
Pogue (1974) observed that most investors are risk averse and will maximise their level of
expected return while minimising the level of risk in their investment. Bowman (1980)
however took exception where he noted a negative relationship between risk and returns. This
however occurred in cases where risk aversion was low such as in cases of troubled firms.
Such cases are driven by more long run expectation in turnaround of the troubled firms.
Fear of regret theory, developed by Bell (1982), Fishburn (1983) and Loomes and Sugden
(1982, 1983, 1987), deals with the emotional reaction people experience after realizing
they’ve made an error in judgement. Investors become emotionally affected by the price at
which they purchased the stock when faced with the prospect of selling that stock. As a
result, they avoid selling it as a way of avoiding the regret that comes with making a bad
investment decision, as well as the embarrassment of reporting a loss.
People have a tendency to place particular events into mental compartments, and the
difference between these compartments may sometimes impact on their behaviour more than
the events themselves. This concept of mental accounting was first named by Thaler (1999).
An investing example of mental accounting is illustrated by the hesitation to sell an
investment that once had huge gains and now has very little gain.
According to Langer (1983), when mutual fund preference is based on choices, there is more
ego involvement and attachment to the preferences, hence suggesting heightened level of
preference bias. This phenomenon is consistent with that prediction from Cognitive
Dissonance theory of Festinger (1957).
Many investors do not have any data analysis and interpretation skills Shiller (1993). This is
because data from the market supports the merits of index investing, passive investors are
more likely to base their investment choices on information received from objective or
26
scientific sources. Philip (1995) reported that there is a change in financial decision-making
and investor behaviour as a result of participating in investor education programmes
sponsored by employees. Berhein and Garnette (1996) affirmed Phillip’s findings and further
stated that a serious national campaign to promote savings through education and information
could have a measurable impact on financial behaviour.
Alexander et al., (1996) reported that only 18.9% of respondents could provide an estimate of
expenses for their largest mutual fund holding. 57% stated that they did not know what the
expenses were even at the time the made the mutual fund purchase. This suggested
insensitivity to costs and many investors do not use fund cost as an evaluative criterion in
making investment decisions. Finally, Hirshleifer (2001) categorized different types of
cognitive errors that investors make i.e. self-deception occur because people tend to think that
they are better than they really are; heuristic simplification which occurs because individuals
have limited attention, memory and processing capabilities; disposition effect, individuals are
prone to sell their winners too quickly and hold their losers too long.
2.3.7 Persistence of Returns
Mutual fund persistence is well documented in finance literature, but not well explained.
Hendricks, Patel and Zeckhauser (1993), Goetzmann and Ibbotson (1994), Brown and
Goetzmann (1995), and Wermers (1996) find evidence of persistence in mutual fund
performance over short-term horizons of one to three years, and attribute the persistence to
“hot-hands” or common investment strategies. Grinblatt and Titman (1992), Elton, Gruber,
Das and Hlavka (1993) and Elton, Gruber, Das and Blake (1996) document mutual fund
return predictability over long-term horizons of five to ten years, and attribute this to manager
differential information or stock-picking talent. Contrary evidence comes from Jensen (1969),
who does not find that good subsequent performance follows good past performance. Carhart

27
(1992), shows that persistence in expense ratios drives much of the long-term persistence in
mutual fund performance.
There is analysis indicating that Jegadeesh and Titman’s (1993) one-year momentum in stock
returns accounts for Hendricks, Patel and Zeckkhauser’s (1993) hot hands effect in mutual
fund performance. However, funds that earn higher one-year returns do so not because fund
managers successfully follow momentum strategies, but because some mutual funds just
happen by chance to hold relatively a larger position in last year’s winning stocks. Hot-hands
funds infrequently repeat their abnormal performance. This is in contrast to Wermers (1996),
who suggested that it is the momentum strategies themselves generate short-term persistence.
Grinblatt, Titman and Wermers (1995) found that funds following momentum strategies
realize better performance before management fees and transaction expenses.
2.3.8 Other Factors
An individual’s prior educational background can be a predictor of occupational
performance, as suggested by a substantial amount of recorded evidence. With higher
education, there is increased knowledge and skill set needed to systematically search for new
opportunities, (Hambrick and Mason, 1984), and the ability for tolerating ambiguity and
handling complexity, (Dollinger, 1984). In addition, Wiersema and Bantel (1992), suggested
that education is positively associated with high capacity for information processing and
tolerance for ambiguity. Furthermore, Golec (1996), analysed the fund managers’ age, tenure
and whether or not the possessed an MBA degree. He concluded that younger managers with
MBA degrees, who had longer tenure in their funds, had better risk adjusted performance.
However, he found no significant relationship to age.
Focus on fund managers’ international studying experience was an area that had previously
not been studied. Black, Gregersen and Mendenhall (1992) argued that managers with
28
previous international assignment experiences could help their companies achieve global
competitiveness. This was majorly because these managers are able to learn and transfer
knowledge about various foreign markets and competitors. Further, Sambharya (1996) argued
that international experience is a proxy for the reduction of uncertainty.
According to Oakley (2000), women are often stereotyped as being less competent and
effective managers when compared to their male counterparts. Powel and Ansie (1997), also
suggested that men and women use different strategies in their financial decision making
processes. Furthermore, they suggested that these differences in strategies may reinforce
stereotypical beliefs that women are less able financial decision makers. But according to
Lundeberg et al (1994), both men and women are overconfident but more so men when
incorrect. Other studies suggested women are less confident about investment decisions
(Barber and Odean, 2001; Estes and Hosseini, 1998). Researchers also found the risk
characteristic may differ owing to the gender difference. Bliss and Potter (2002), concluded
that women fund managers, both domestic and international, hold portfolios with marginally
more risk than men. This was after their evaluation on whether gender affects fund manager
performance. In addition, measures of raw return showed that female fund managers
outperform their male counterparts at domestic equity funds and not at international funds.
Managers’ tenure refers to the length of time a professional money manager has been
working or worked as a fund manager. It determines one’s expertise and experience, hence
tenure is beneficial to performance, Adrangi, Chatrath and Shank (2002) and Goetzmann and
Ibbotson (1994). On the contrary, longer tenured top fund managers are likely to have
narrower past experiences and knowledge base, consequently resulting in a limited search for
alternatives (Pfeffer, 1983), and less engagement in information gathering and analysis

29
(Miller, 1991). In addition, managers’ tenure has been associated with reduced learning and
increased inertial responses (Virany et al, 1992).
A total of 313 mutual funds were studied by Lemak and Satish (1996) and they found that
more stable returns are produced by long term managers than short-term fund managers. This
was due to the fact that longer-term fund managers construct less volatile portfolios. Hence,
they came to a conclusion that there is a negative relationship between manager’s tenure and
performance, in terms of return. According to Fortin and Michelson (1999) and Porter and
Trifts (1998), fund managers’ experience is not an advantageous factor in fund performance.
Cross-sectional data over a nine-year span from 1992-2000, as examined by Peterson et al
(2001), further revealed that mutual fund managers with longer tenures construct less risky
portfolios and lead to lower portfolio returns. Costa and Porter (2003) found that expertise is
not a result of experience or tenure of mutual fund managers. However, they did not suggest
relationship between performance and managers’ tenure is necessarily negative. Hsu (2001),
found that mutual fund managers’ tenure related positively to fund size and related negatively
to funds’ turnover ratio in Taiwan’s mutual fund market.
2.4 Summary
From the literature discussed above, it is evident that the mutual fund industry in Kenya is at
its early stages. Several factors have been found to affect the fund in different ways.
Throughout the literature, it is evident that very little attempts have been carried out in trying
to determine how the fundamentals identified affect the fund performance in Africa and
particularly in Kenya.
The theoretical literature indicates the relationship between risk factors and mutual fund
performance developed over the years. Theories put in perspective include efficient market
hypothesis, modern portfolio theory, capital asset pricing model and the arbitrage pricing

30
theory. Also discussed is the Prospect theory and regret theory. Empirical research outlines
the studies conducted over the years and has tested the applicability of these models in actual
mutual fund performance. Factors that have been put in perspective include risk and return,
size of mutual fund, market timing ability, investment styles, fund characteristics, investor
behavioural patterns and persistence of returns.
The researchers have employed quantitative methods based on financial statements of certain
funds and no attempt has been made to get information regarding various fundamentals from
different fund managers despite the fact that they are the ones entrusted with the role of
investing investors’ funds. It is also evident that the mutual funds in Kenya are not as
common as other securities despite their advantages over other securities. This raises the
question on their performance given the fact that investors are assumed to be rational and will
always go for any investment so long as there are high returns.
Therefore, the study seeks to fill these gaps by studying the various factors that predict
mutual fund performance in Kenya and relate the findings to other studies in order to
determine the stability of the Kenyan fund market.

31
CHAPTER THREE
RESEARCH METHODOLOGY
3.1 Introduction
This chapter provides the methodology to be used in the research. Section 3.2 discusses the
research design applied in this study. Section 3.3 talks about the target population and the
sampling techniques used. Section 3.4 outlines the type of data and data collection
instruments used. Section 3.5 presents the data and analysis of the same data.
3.2 Target Population
The registered fund managers in Kenya were the main target population of interest in this
study. There are sixteen registered fund managers according to the Retirement Benefits
Authority of Kenya (RBA). Their schedule, location and contact persons were available and
obtained from the RBA website. All the investment managers and fund administrators of
registered funds were the target population of this study.
The researcher adopted census method of study in order to increase the accuracy of the data
collected in this research. Census method refers to data collection about everyone or
everything in a group or population. It has the advantage of accuracy and detail. Since the
target population was small, the census method was chosen and hence a sample selected from
such a population would be meaningless (Mugenda and Mugenda, 2003). Two questionnaires
were issued to the sixteen fund managers in Kenya; one to the investment manager and the
other to the fund administrators. Hence a total of 32 surveys were administered.
3.3 Research Design and Sampling Techniques
This study adopted a descriptive survey design. The descriptive survey research study was
preferred since it has the dimension of investigating possible relationships between two or
more variables (Mugenda and Mugenda, 2003). The descriptive survey design is ideal since it

32
is concerned with making accurate assessment of the inference, distribution and relationship
of the phenomenon (Edwards, 2006).
The population of fourteen mutual fund managers provided a sample of fourteen fund
managers, out of the total of sixteen. A few of the funds operated for the period of the seven
years with the shortest fund period sampled operating for four years. This ensured that the
funds could be comparatively reviewed.
3.4 Data and Data Collection Instruments
This study used both primary and secondary data to test the relationship between the key
variables. Primary data was collected from each registered fund manager who was issued
with two questionnaires (Appendix 1). The questionnaire was made up of both open and
close ended questions. The items on the questionnaire were developed on the basis of the
objectives of the study. The questionnaire contained three sections consisting of background
information, investment style, fund characteristics, behavioural pattern, managerial skills and
persistence of returns.
Published financial statements from fund managers provided secondary data for fourteen
mutual funds. Secondary data was also collected from officially published statistical data on
national statistics such as GDP growth rate, inflation rate and interest rates for the seven year
period between 2008 and 2014. Sources include the Economic Survey, the World Bank
online database and the African Development Bank database.
3.5 Data Analysis
Before processing, the questionnaires were edited for completeness and consistency and later
edited to detect and correct errors and omissions to ensure maximum data quality standards
were achieved. Data was then coded to enable responses to be grouped into categories.

33
Coding involved assigning numbers so that the responses could be grouped into number of
classes or categories.
Data analysis was carried out using Statistical Package for Social Sciences (SPSS). The data
collected was first subjected to descriptive statistics which included frequencies, percentages,
means and standard deviations. Inferential statistics was also employed in the study. In this
case, Pearson’s moment correlation coefficient was used to determine the magnitude of
relationship between two variables. A positive relationship means that an increase in one
variable leads to an increase in another variable and vice versa.
3.5.1 Conceptual Model
The basis for developing this conceptual framework is the documented relationship between
mutual fund performance and certain characteristics (Melih, 2010). This function can be
represented as:-
MFP = f {A + RR + IS + FC + FCBP + PR + MS}
Where MFP = Mutual Fund Performance
A = Constant
RR = Risk and Return
IS = Investment Style
FCBP = Fund Characteristics and Behavioural Pattern
PR = Persistency of Returns
MS = Managerial Skills/Styles
34
CHAPTER FOUR
DATA ANALYSIS, RESULTS AND DISCUSSION
4.1 Introduction
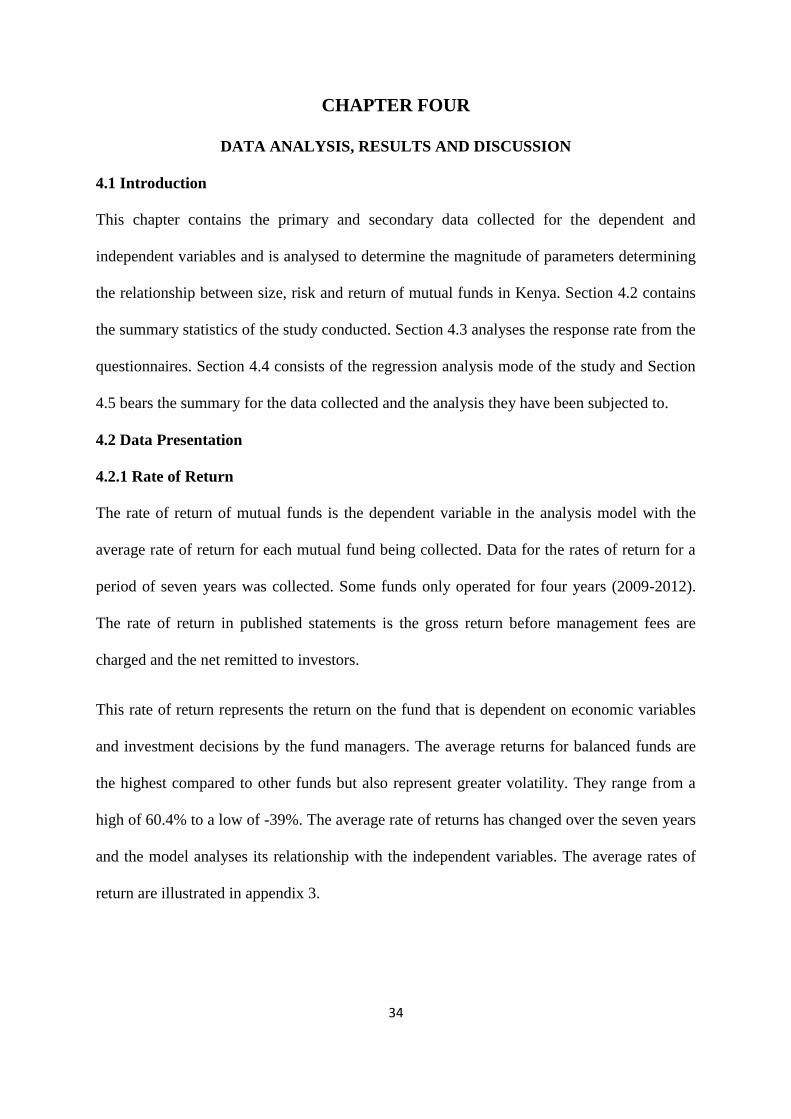
This chapter contains the primary and secondary data collected for the dependent and
independent variables and is analysed to determine the magnitude of parameters determining
the relationship between size, risk and return of mutual funds in Kenya. Section 4.2 contains
the summary statistics of the study conducted. Section 4.3 analyses the response rate from the
questionnaires. Section 4.4 consists of the regression analysis mode of the study and Section
4.5 bears the summary for the data collected and the analysis they have been subjected to.
4.2 Data Presentation
4.2.1 Rate of Return
The rate of return of mutual funds is the dependent variable in the analysis model with the
average rate of return for each mutual fund being collected. Data for the rates of return for a
period of seven years was collected. Some funds only operated for four years (2009-2012).
The rate of return in published statements is the gross return before management fees are
charged and the net remitted to investors.
This rate of return represents the return on the fund that is dependent on economic variables
and investment decisions by the fund managers. The average returns for balanced funds are
the highest compared to other funds but also represent greater volatility. They range from a
high of 60.4% to a low of -39%. The average rate of returns has changed over the seven years
and the model analyses its relationship with the independent variables. The average rates of
return are illustrated in appendix 3.

35
4.2.2 Treasury bill Rate
The 182 day Treasury bill rate represents the risk free rate of government borrowing. An
average of this rate was obtained per year for the period of seven years. The highest rate was
13.54% in 2012 and the lowest rate being 3.81% in 2010. Money market and balanced funds
by definition have investments in treasury bills.
The mutual funds market performance is influenced by the Treasury bill rate since the rate is
used by the fund managers as the baseline rate. The Treasury bill rates for the period are
illustrated in appendix 4.
4.2.3 GDP Growth Rate
The GDP growth rate indicates the changes in the economy and is main indicator for
expansion or recession. It is therefore a key indicator of the economic risk prevalent in an
economy affecting the returns to mutual funds and other investments.
The highest GDP growth rate was recorded in 2007 at 6.99% and the lowest in 2008 at a rate
of 1.53%. The average growth rate for the period is 4.56% and a median of 4.38%. The GDP
growth rates for the period are illustrated in appendix 4.
4.2.4 Inflation Rate
Data on the annual inflation rate for the period of seven years (2006 - 2012) was collected for
the second independent variable in the model. The inflation rate reduces the real returns to the
investor as the time value of money diminishes. Investors adjust their expected rate of return
depending on the prevailing inflation rate.
The highest inflation rate for the period was 16.20% in 2008 and the lowest rate at 4.08% in
2010. The median inflation rate is 9.65 with an average rate of 9.25%. The inflation rates are
illustrated in appendix 4.

36
4.2.5 Market Interest Rates
The market interest rate represents the average lending rate offered by commercial banks.
Data was collected on the average market interest rates per year for the seven year period.
Market interest rates represent the cost of financing and hence affect the rates of return.
The highest market interest rate for the period was at 19.63% in 2012 and the lowest at
13.30% in 2007. The average rate for the period is at 14.96 with a median of 14.40. The
market interest rates are illustrated in appendix 4.
4.2.6 Fund Size
The size of the fund represents the internal factor that is unique to each fund. Data on mutual
fund size was collected from both primary and secondary sources. Published financial
statements were available for twelve funds while a data form was used to collect primary data
from eleven funds. The fund size is the fifth independent variable in the model representing
the risk return relationship whose beta parameter is analysed.
The equity fund has the biggest fund size with the Old Mutual Equity Fund of 5.8 billion
shillings in 2007. Money market fund follows in fund size with the balanced fund and bond
fund following in rank. The fund size generally rises with time hence funds that have existed
for a long time are bigger. This variable helped determine whether fund size affects the rate
of return and how much inherent risk it represents. The mutual fund sizes are illustrated in
appendix 3.

37
4.3 Response Rate from Questionnaire
A total of 32 questionnaires were issued and out of those issued, 28 were returned duly filled
as presented in the figure below. 2 questionnaires were rejected for failing reliability test
while 2 questionnaires were never returned by the respondents.
Fig 1: Response Rate
4.3.1 Biographical Information of the Respondents
The fund managers’ biographical information was important and was sought in the study.
Area studied included their gender, age, academic qualifications and experience.
4.3.1.1 Gender of Fund Managers
Figure 2: The Gender of Respondents

38
Information on gender, age, academic qualification and experience was sought. 71.4% of the
respondents were found to be male while 28.6% were female. This implies that most fund
managers are male and are likely to take active strategies in investing the investors’ funds
while their female counterparts were more likely to take passive strategies in investing.
4.3.1.2: Age Bracket
Information on the age of the fund managers was sought. The study established that most of
the fund managers in Kenya are below 40 years of age. This shows that fund managers are
young and as such they lack the experience that comes with many years of practice and are
likely to undertake active strategies which adversely affect the fund market.
Figure 3: Age Brackets of the Fund Managers
4.3.1.3 Academic Qualifications
Information on fund managers’ academic qualifications was sought. Most of the respondents
were found to have a bachelor’s degree. The literacy level of fund managers in Kenya highly
favours the growth of the fund market.

39
Figure 4: Fund Managers’ Education Level
4.3.1.4 Fund Managers’ Experience
The research findings established that while some of the managers accounting for 7.1% were
found to have less than one year experience, most of the managers accounting for over 90%
Figure 5: Fund Managers’ Experience
have over one year experience. 50% of the respondents were found to have experience of less
than five years. This may be attributed to a high number of young fund managers in the
Kenyan market. This experience, though adequate, may negatively affect the fund market.

40
4.3.2 Investment Style and Fund Performance
Various investment styles used by fund managers in Kenya were studied. They included:-
4.3.2.1 Types of Funds
The researcher sought to determine the types of funds the fund managers have invested in.
The results indicated that most fund managers in Kenya invest in the blend of both growth
and value funds accounting for 67.8%. This makes it favourable for the fund market to
perform well in Kenya. The results are as presented in Figure 6.
Figure 6: Type of Funds Invested by the Fund Managers
4.3.2.2: Average Value of the Fund
The study sought information regarding the average value of the funds invested in and
Figure 7: Value of the Funds Invested by Fund Managers

41
established that most funds in Kenya lie under medium fund. This fact may adversely affect
the fund performance because small growth funds have been found to perform better than
large and medium funds. The following graph summarizes these findings.
4.3.2.3 Frequency of Change in Investment Style
Information regarding frequency of change in investment style was sought in the study. 75%
Figure 8: Frequency of Change in Investment Style
of the fund managers were found to change their investment styles. These style drifts have
been found to negatively affect the fund performance and as such the Kenyan market may be
negatively affected. The summary of the finding are as in the figure below.
4.3.2.4 Method of Assessing Fund Performance
Most fund managers (55.6%) were found to use a combination of methods in assessing fund
Figure 9: Method of Assessing Fund Performance

42
performance. The use of combination of methods to predict the market was found to have a
positive correlation with fund performance and hence favoured the Kenyan fund market.
4.3.2.5 Types of Securities Fund Managers Invest In
The study established that most fund managers were found to diversify the risk by investing
in several securities. According to research results, diversification is shown by a high of
Figure 10: Types of Securities Fund Managers Invest In
48.1%. It has been found to be one of the best methods of mitigating risk and hence high
performance. The findings are summarized in the figure below.
4.3.2.6 Frequency of Disposing Investments
Information regarding how frequently the fund managers disposed of investments was also
sought in the study.
Figure 11: Frequency of Disposing Investments

43
Most were found to frequently dispose investments. This implies that there is a high
probability of better performance of the fund market since high turnover is related to great
fund performance.
4.3.2.7 Method of Buying and Disposing Stocks
Information regarding frequency of methods of buying and disposing stock was investigated.
Figure 12: Method of Buying and Disposing Stocks
From the findings, it was established that most stocks are bought through the help of a broker.
It gave the fund managers the opportunity to utilize the expertise of registered brokers in
buying and selling of stocks, hence implying better performance in the Kenyan fund market.
The findings are summarized in the figure below.
4.3.2.8 Investment Style Measures of Dispersion
The table below shows the measures of dispersion as regards to the investment styles. From
the below measures of dispersion, it’s clear that most of the investment styles highly favour
the fund market in Kenya; as shown by the mean, median and modes. A mean of 2.67 on type
of fund shows that on average, most fund managers invest in blend of growth and value fund.
Most funds were found to be of mid capital as shown by mean and mode of average value of
fund of 2.92 and 2.00 respectively. On average and as shown by mean of 1.55 and mode of
3.00, most fund managers were found to dispose their investments frequently.

44
Table 1: Measure of Dispersion of Investment Styles
Type of Fund Average
Value of the
Fund
Frequency of
Change in
Investment
Style
Method of
Assessing
Fund
Performance
Types of
Securities
Invested In
Frequency of
Disposing
Investments
Methods of
Buying and
Disposing
Stock
Mean 2.67 2.92 1.55 1.00 1.6 2.5 1.9
Median 3.0 2.0 3.0 4.0 4.0 3.0 4.0
Mode 4.0 2.0 4.0 4.0 4.0 4.0 4.0
Std.
Deviation
1.01202 1.15272 1.35860 1.00261 0.97195 1.00342 1.6720
Variance 1.02418 1.32875 1.84579 1.00523 0.94469 1.6342 1.77561
Skewness -0.362 0.924 -0.012 -0.493 -0.751 0.763 -0.234
Std. Error of
Skewness
0.236 0.236 0.236 0.237 0.236 0.236 0.236
Kurtosis -0.823 0.107 -1.297 -0.822 -0.039 -0.102 0.106
Methods of assessing performance and securities invested in were found to be a combination
of methods and a combination of securities as shown by an average of 1.00 and 1.6
respectively. Most fund managers were found to buy and dispose their securities by use of
brokers, shown by a mean of 1.9 and mode of 4.0. All these investment styles favour the fund
market in Kenya. The standard deviation ranges from 9% to 16.7%. This may be interpreted
to mean that most responses were found to be within a small range that is not very highly
dispersed making the data more reliable. This has further been shown by measures of
skewness and kurtosis.
4.3.3 Fund Characteristics and Fund Performance
Information on the various fund characteristics displayed by various funds in Kenya was
investigated. Some of the characteristics studies included:
4.3.3.1: Regulation of the Fund Industry
Regarding regulation of the fund industry, 92.9% (26 respondents) felt it was not well
regulated while 7.1% (2 respondents) felt that it was well regulated. Lack of or poor fund
industry regulations effects the fund performance negatively. Therefore, absence or poor
regulations of the fund industry in Kenya is likely to affect the fund performance negatively.
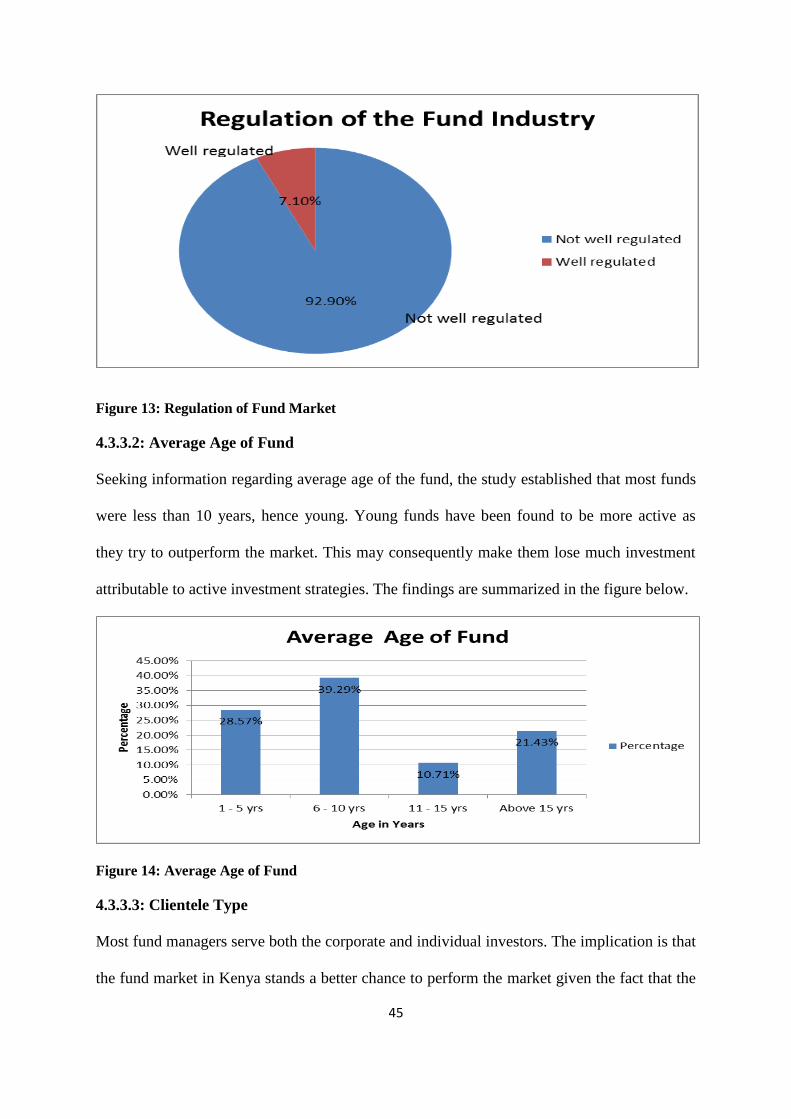
45
Figure 13: Regulation of Fund Market
4.3.3.2: Average Age of Fund
Seeking information regarding average age of the fund, the study established that most funds
were less than 10 years, hence young. Young funds have been found to be more active as
they try to outperform the market. This may consequently make them lose much investment
attributable to active investment strategies. The findings are summarized in the figure below.
Figure 14: Average Age of Fund
4.3.3.3: Clientele Type
Most fund managers serve both the corporate and individual investors. The implication is that
the fund market in Kenya stands a better chance to perform the market given the fact that the
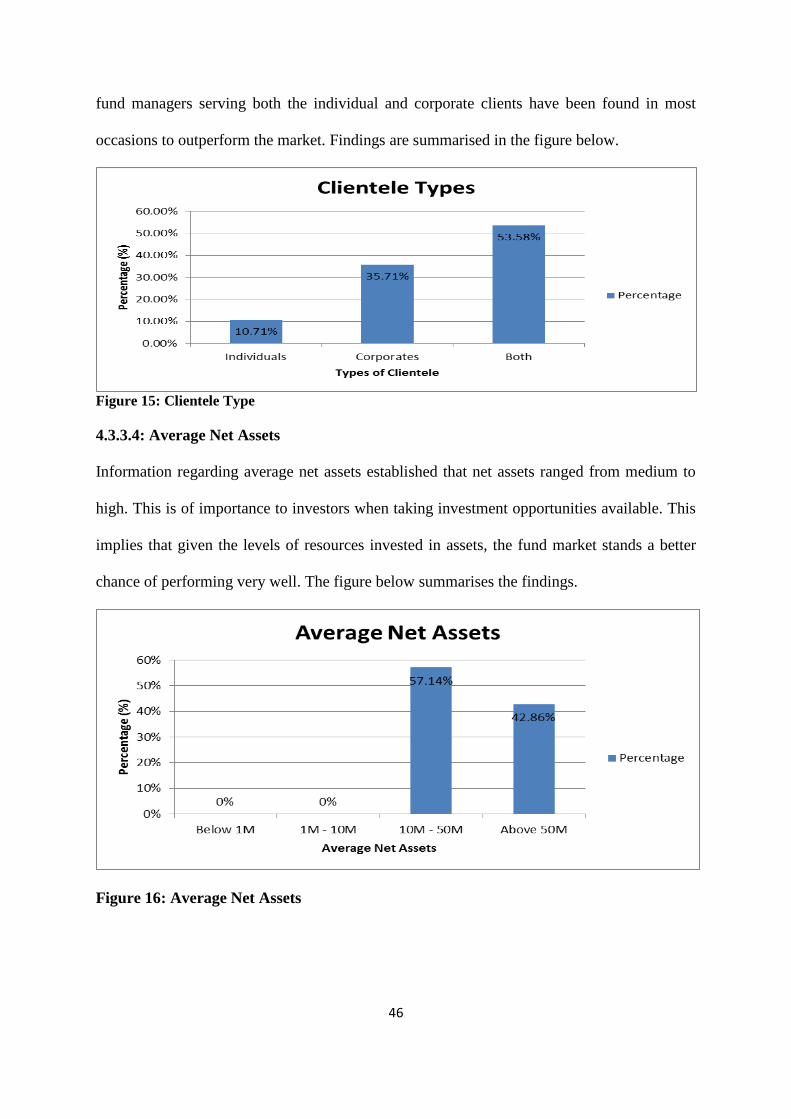
46
fund managers serving both the individual and corporate clients have been found in most
occasions to outperform the market. Findings are summarised in the figure below.
Figure 15: Clientele Type
4.3.3.4: Average Net Assets
Information regarding average net assets established that net assets ranged from medium to
high. This is of importance to investors when taking investment opportunities available. This
implies that given the levels of resources invested in assets, the fund market stands a better
chance of performing very well. The figure below summarises the findings.
Figure 16: Average Net Assets

47
4.3.3.5: Judicial System
Information regarding the opinion of fund managers regarding Kenyan judicial system was
sought. 2% of the respondents felt that the system was excellent, others totalling to 8%, 45%,
Figure 17: Judicial System in the Country
30% and 15% were of the opinion that it was very good, good, poor and very poor
respectively. This implies that most fund managers have confidence in the judiciary. This is
vital for performance of the fund market and as such the Kenyan fund market stands a chance
of good performance.
4.3.3.6: Fund Expenses
Information on fund expenses, such as management and advertising fees, was investigated.
Figure 18: Fund Expenses

48
57.14% (16 respondents) felt that the expenses were very high, 25% (7 respondents); 17.86%
(5 respondents) and 0% of the respondents felt that they were very high, low and very low
respectively. There is a positive correlation between advertising expenses and performance.
This makes Kenyan fund market favourable since most incur high expenses.
4.3.3.7: Method of Charging Load Fees
From findings, it was established that 42.86% (12 respondents) charge front end load while
57.14% (16 respondents) back end load fees. Funds charging back end load attract more
investors and as such the Kenyan fund market which is dominated by fund managers
charging back end load fees has high chances of performance.
Figure 19: Method of Charging Load Fees
The research found that most characteristics of Kenyan fund market favour the fund
performance. The mean, mode and median shown in the table above clearly shows; clientele
type with mean, median and mode of 1.4, 4.0 and 4.0 favours both corporate and individual
clients. Average age of the fund was found to be between 6 and 10 years as shown by a mean
of 2.8, expenses with mean of 3.0 means that the fund expenses were found to be high, which
means that the fund industry stands a better chance of good performance since high

49
advertising expenses have been linked to high performance. The load fees with mean of 2.3
means that most funds charge end load fees; this is related to good fund performance.
Table 2: Measures of Dispersion of Fund Characteristics and Performance
Regulation Average Age
of Funds
Clientele Average Net
Assets
Judicial
Systems
Expenses Load Fees
Mean 1.0685 2.806 1.867 2.0683 3.0086 3.0608 2.3606
Median 4.0 3.0 3.0 4.0 3.0 3.0 4.0
Mode 4.0 2.0 2.0 4.0 4.0 4.0 3.0
Std. Dev 1.10303 1.20970 1.26172 1.05716 1.07775 1.3643 1.0067
Variance 1.21667 1.46337 1.59194 1.11758 1.16154 1.86131 1.0134
Skewness -1.820 0.308 0.000 -0.584 -0.081 -0.684 -1.720
Std. Error of
Skewness
0.236 0.236 0.236 0.236 0.236 0.235 0.233
Kurtosis 2.839 -0.933 -1.252 -0.451 -0.944 -0.833 1.823
Std. Error of
Kurtosis
0.467 0.467 0.467 0.467 0.467 0.467 0.467
However, the regulation of the fund industry was found to be unfavourable as shown by mean
of 1.06 which shows that the fund industry as not well regulated. This affects the fund
performance negatively. The judicial system was found to be very good as shown by mean
and mode of 3.00. 3.00 and 4.00 respectively. This implies that the judicial system in Kenya
highly favours fund performance. In understanding the level of dispersion, standard deviation
and variance from the mean was also computed. The dispersion was found to be between
10.0% and 12.6%. This can be interpreted to mean that the response from the respondents
were reliable since they were not highly dispersed for each response. This was also shown by
measures of skewness and kurtosis which shows the dispersion in most cases skewed to the
left.

50
4.3.4: Behavioural Patterns and Fund Performance
Information on the behavioural patterns displayed by investors in Kenya was investigated.
Behavioural patterns of investors have been found to affect the fund performance. The
researcher established that most investors display behaviours such as overconfidence,
excessive trading, buying attention grabbing stocks, selling winning stocks earlier and selling
losing stocks late. This implies that the Kenyan fund market has been negatively affected by
these behavioural patterns and inability to predict the market.
Most investors end up losing most of their investments due to these behavioural aspects. The
study established that the most prevalent behavioural characteristic in Kenya is buying the
attention grabbing stocks accounting for 99.6% which makes most investors lose their
investments.
Figure 20: Behavioural Pattern Displayed by Investors
From the table below, it is clear that most investors display negative behavioural
characteristics that negatively affect the fund performance. A likert was used to determine the
frequency with which such behaviours are shown by investors. The mean from the responses
was found to be within the range of 2.8 and 3.48.

51
Table 3: Behavioural Patterns and Fund Performance
Overconfidence Excessive Trading Buying attention
grabbing stocks
Selling winning
stocks earlier
Selling losing
stocks late
Mean 3.2667 2.8095 3.1524 3.4857 3.2000
Median 3.00 3.00 3.00 4.00 3.00
Mode 4.00 2.00 2.00 4.00 4.00
Std. Dev 1.12609 1.23577 1.26342 1.12345 1.77689
Variance 1.20232 1.87654 1.30862 1.54320 1.37543
Skewness -1.820 0.308 0.000 -0.584 -0.081
Std. Error of
Skewness
0.226 0.246 0.246 0.246 0.246
Kurtosis 2.938 -0.922 -1.356 -0.438 -0.944
Std Error of
Kurtosis
0.330 0.330 0.330 0.330 0.330
This can be interpreted to mean that most investors often practice these behavioural patterns.
The practice of this behaviour negatively affects the fund performance. The level of
dispersion was found as measured by standard deviation and variance and was found to range
between 11.2% and 17.7%. This implies that the levels of responses were within reliable
range and hence the findings were reliable. This if further shown by measures of skewness
and kurtosis.
4.3.5: Managerial Capabilities and Fund Performance
The study investigated the managerial capabilities displayed by fund managers.
4.3.5.1: Investment Strategies Employed by Fund Managers
In the study, it was found that 20 (71.43%) respondents employ active strategies in investing
the funds while 8 (28.57%) use passive strategies in investing the funds. Active strategies
have been found to negatively affect the fund market whereby most investors undertake to
carry out their market research before investing in any stock. This is as opposed to passive
strategies involving limited on-going buying and selling actions. Passive investors purchase

52
investments with the intention of long-term appreciation and limited maintenance. The fund
market is likely to be negatively affected by these negative strategies of investment.
Figure 21: Strategies Employed by Fund Managers
4.3.5.2: Market Timing and Stock Picking Abilities
The stock picking abilities of fund managers was investigated by the researcher and it was
established that 18 (64.29%) respondents possess market timing and stock picking abilities,
while 10 (35.71%) do not possess the abilities. This implies that the Kenyan fund market is
likely to perform very well since the market and stock picking abilities has been positively
associated with good fund performance.
Figure 22: Market Timing and Stock Picking Abilities

53
4.3.5.3: Education Skills and Experience
Investigation on whether education skills matter in determining fund performance was
Figure 23: Education and Experience
conducted. The study established that 16 (57.14%) respondents consider experience as the
key determinant while 12 (42.86%) consider education as the key determinant of fund
performance. Since the fund market in Kenya is young, experience largely lacks amongst
several fund managers but education level has played a positive role in the fund industry.
Table 4: Analysis of Managerial Capabilities
Investment Strategies Market Timing and
Picking Abilities
Education Skills Experience
Mean 2.6 2.33 3.067 1.4332
Median 3.00 3.00 3.00 2.00
Mode 4.00 4.00 4.00 2.00
Std. Deviation 1.12318 1.12375 1.21106 1.20081
Variance 1.26154 1.26282 1.46667 1.44194
Skewness -0.898 -0.278 -0.097 -0.486
Std. Error of Skewness 0.236 0.236 0.236 0.236
Kurtosis 0.007 -1.020 -1.281 -0.697
Std. Error of Kurtosis 0.467 0.467 0.467 0.467
From the table above, most fund managers were found to practice active strategies when
investing. This is shown by a mean, median and mode of 2.6, 3.0 and 4.0. Most fund

54
managers were found to possess market timing and stock picking abilities as shown by mean
of 2.33, median of 3.0 and mode of 4.0. This highly favours the performance of the fund
market. Level of education was also found to affect the performance of fund market
positively as shown by a mean of 3.066. However, the experience of most fund managers was
found to be inadequate as shown by a mean of 1.4. This negatively affects the fund
performance in the Kenyan market. The measure of dispersion from the mean was found to
lie between 11% and 12%. This can be interpreted to mean that the responses from the fund
managers were found to be reliable hence the credibility of data collected.
4.3.6: Persistence of Returns and Fund Performance
The researcher investigated the persistence of returns and how they affect fund performance.
The particular areas investigated were: the trends in performance of the fund, reasons for
such trends, relevance of past information, ability to predict the market
4.3.6.1: The Trends in Performance
The following table summarizes the findings of information regarding the trends in
performance as investigated by the researcher.
Table 5: Trends in Performance
Trend Frequency Percentage Cumulative %age
Constantly increasing 16 57.14 57.14
Constantly decreasing 0 0 57.14
Same returns 1 3.57 60.71
Varying with time 11 39.29 100
The study established that most funds’ performance has been experiencing constantly
increasing returns. Funds with such persistency have been found to outperform the market as
opposed to funds with drifting returns. This makes it suitable for the Kenyan fund market.
4.3.6.2: The Use of Past Performance
The following figure summarizes the findings of information regarding the extent of use of
past information to predict the future performance of funds.
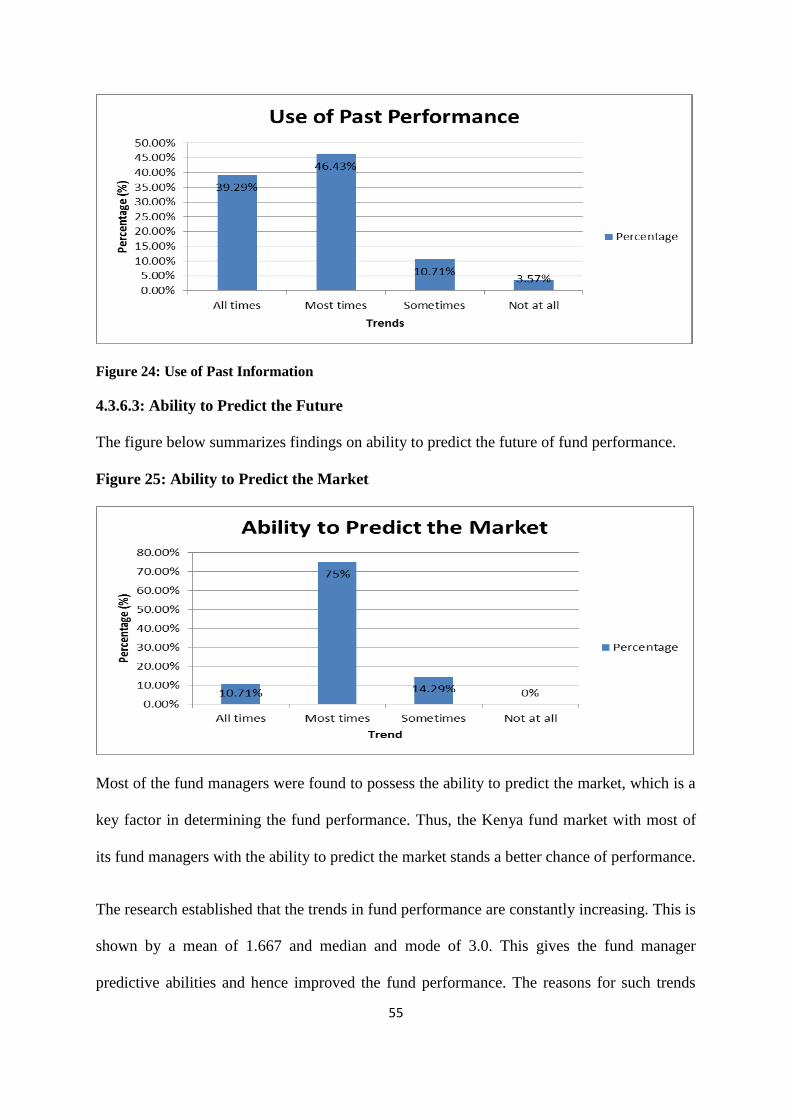
55
Figure 24: Use of Past Information
4.3.6.3: Ability to Predict the Future
The figure below summarizes findings on ability to predict the future of fund performance.
Figure 25: Ability to Predict the Market
Most of the fund managers were found to possess the ability to predict the market, which is a
key factor in determining the fund performance. Thus, the Kenya fund market with most of
its fund managers with the ability to predict the market stands a better chance of performance.
The research established that the trends in fund performance are constantly increasing. This is
shown by a mean of 1.667 and median and mode of 3.0. This gives the fund manager
predictive abilities and hence improved the fund performance. The reasons for such trends

56
have been attributed to market timing and stock picking abilities as shown by a mean of
1.332 and median of 2.000.
Table 6: Measures of Dispersion
Trends in Performance Reasons for such trends Relevance of Past
Information
Ability to Predict the
Market
Mean 1.6667 1.3222 2.5564 1.3354
Median 3.00 2.00 3.00 2.00
Mode 3.00 3.00 2.00 2.00
Std. Dev 1.6532 1.5437 1.1342 1.4537
Variance 1.3427 1.4537 1.6342 1.346
Skewness -0.798 -0.278 -0.134 0.342
Std. Error of skewness 0.246 0.234 0.243 0.236
Kurtosis 0.007 -1.020 -1.281 0.467
Std. Error of Kurtosis 0.467 0.467 0.467 0.467
Since fund managers were found to have these skills, there is increased possibility of fund
performance. Use of past information was also found to be prevalent among fund managers
as shown by the means of 2.556. This highly increases the fund performance since managers
are capable of using past information to predict the future. The measure of dispersion as
shown by deviations from the mean were found to range from 11% to 18%, which implies the
responses were reliable since they are not highly dispersed from the mean.
4.4. Regression Analysis
Regression analysis was used to estimate the effect of independent variables (factors affecting
fund performance) and the dependent variable (fund performance). Karl Pearson moment
correlation was used to determine this relationship. The model is represented by:
MFP = f (A + IS + FC + FCBP + PR + MS)
Where:
MFP = Mutual Fund Performance
A = Constant
IS = Investment Style

57
FCBP = Fund Characteristics and behavioural patterns
PR = Persistency Returns
MS = Managerial Skills
Using the values of the coefficients from the regression table below, the established
regression equations take the form of:
FP = 0.227 + (0.643 × IS) + (0.571 × FC) + (0.543 × BP) + (0.809 × MC) + (0.436 × PR)
Table 7: Regression Analysis
Unstandardized
Coefficients
Standardized
Coefficients
t Sig
Model B Std. error beta
Constant 0.227 0.114 3.985 0.000
Investment Styles 0.643 0.298 0.350 1.386 0.005
Fund
Characteristics
0.571 0.213 0.214 1.452
Behavioural
Patterns
-0.543 0.080 -0.381 -1.033
Managerial
Capabilities
0.809 0.343 0.363 1.462
Persistence of
Returns
0.436 0.211 0.253 1.564
This can be interpreted to mean, in the absence of various fundamentals of fund performance,
the fund performance will change by magnitude of 0.227. The results further indicate that
there is a positive correlation between fund performance and the investment style adopted; a
unit change in investment style will result in 64.3% change in fund performance.
Similarly, the research establishes a positive correlation between fund performance and fund
characteristic, managerial capabilities and persistence of returns. This means that a unit
change in fund characteristic, managerial capabilities and persistence of returns will result in
57.1%, 80.9% and 43.6% change in fund performance. The research further established that
there is a negative correlation between the fund performance and behavioural characteristics,

58
meaning, a unit increase in behavioural characteristic will lead to a reduced fund performance
by 43.6%. The results also show that all variables are significant as the p-values are less than
0.05 (p<0.05).
4.5 Summary
This chapter was based on the analysis of how various factors affect fund performance.
Factors studied included economic variables such as the Treasury bill rate, GDP growth rate,
Inflation rate, market interest rates and fund size. Other factors analysed from information
collected from the questionnaire included the investment styles, fund characteristics, investor
behavioural patterns, managerial capabilities and persistence of returns. Some of these factors
were found to have a positive correlation with fund performance while others were found to
have a negative correlation with fund performance. The details will be discussed in the next
chapter.
59
CHAPTER 5
SUMMARY OF FINDINGS, CONCLUSION AND RECOMMENDATIONS
5.1: Introduction
In this chapter, section 5.2 contains the summary of findings. Section 5.3 outlines
conclusively the factors that impact directly on fund performance. Section 5.4 outlines the
suggestions put across by the researcher. Section 5.5 discusses the limitations to the study.
Finally, section 5.6 puts across suggestions for further research.
5.2. Summary of Findings
Regarding the economic factors, the objective of this part of the study was to analyse the beta
parameters of factors that define risk-return relationship in the Kenya mutual funds market. A
descriptive research design was used to collect and analyse data which involves observing
and describing the relationship between variables. The arbitrage pricing model was used to
select economic variables that define risk and the mutual fund market. The economic
variables selected included the Treasury bill rate, GDP growth rate, inflation rate, market
interest rate and fund size.
Data was collected from various mutual fund managers operating different mutual funds. The
funds included the money market fund, equity fund, balanced fund and bond fund. Both
primary and secondary data was collected and analysed through linear regression. The
average rate of returns was observed to be negatively related to the GDP growth rate,
inflation rate and fund size.
The relationship between average rate of returns and market interest rates and the Treasury
bill rate was found to be positive. The beta parameter for the GDP growth rate, inflation rate
and market interest rate are statistically significant while the beta parameter for the Treasury
bill rate was found to be statistically insignificant. These beta variables were found to

60
represent a positive relationship in the risk-return relationship with unique magnitudes for
each factor. The market interest rates, GDP growth rate and inflation rate have the greatest
impact on rates of return. The fund size has slightly weaker but significant beta with the
Treasury bill rate being insignificant.
In the investment styles and fund performance section, the study established that the
performance of mutual funds is highly dependent on the investment style employed by fund
managers. This is shown by the positive Pearson coefficient of correlation of 0.643. Most
fund managers invest in a blend of funds. The average value of fund was found to be 50
million and above and most investors often dispose of their investments. In assessing the
performance of funds, most fund managers combine benchmarking and industry performance
to determine the performance of their fund. In investing the investors’ wealth, the fund
managers purchase and sell a diversified portfolio as shown by a high percentage of 66.7% of
fund managers who invest in diversified portfolio. The investors frequently purchase and sell
their securities. A high number of fund managers, 62.9%, were found to use brokers in
purchasing and selling securities.
On fund characteristics and fund performance, the study established that fund characteristics
are positively correlated to fund performance. This is shown by the positive correlation of
0.571. Most respondents, accounting to 85%, felt that the fund industry is not well regulated.
The average age of funds was found to be 6-10 years while the average net assets were found
to be between Kshs10 and 50 million accounting for 59.2%. Most fund managers serve a
combination of individual and corporate clients, accounting for 55.6%. Most fund managers
felt that the Kenyan judicial system is good, accounting for 45%. The fund managers were
also found to incur high expenses in administration and advertising the funds. This is shown
by a percentage of 59.3% of those who incur very high expenses.

61
A correlation was established between behavioural patterns displayed by investors and fund
performance. This is shown by a negative correlation of -0.543. The study also established
that investors often portray overconfidence, excessive trading, buying attention grabbing
stocks, selling winning stocks earlier and selling losing stock later. All of these affect the
fund performance negatively.
The study further established that there is a correlation between managerial capabilities and
find performance. This is shown by the positive correlation of 0.809. 74% were found to
employ active strategies in fund investment while most fund managers were found to have
market timing and stock picking abilities as shown by a high of 62.9%. Most managers
consider education as opposed to experience as a key determinant of fund performance.
Also established in the study was that there is a positive correlation of 0.436 between the
persistence of returns and fund performance. The trend in performance has been constantly
increasing as shown by high frequency rate of 81.5%. Most fund managers were found to use
past information to predict the future as shown by frequency rate of 44.4%. Most fund
managers were found to have the ability to predict the market, accounting for 74.1% of the
managers.
5.3 Conclusion
A negative beta which is statistically significant was obtained for the GDP growth rate. This
implies that a decrease in the economic growth rate is an increase in the risk faced by
investors and hence they will demand a high rate of return. The drop in the GDP growth rate
represents worsening of the economic condition. Hence, it can be concluded that a positive
relationship exists in the risk – return variables where the GDP growth rate variable is used to
evaluate the risk changes in an economy.

62
A statistically significant beta was obtained for the inflation rate variable in this model. This
implies that an increase in the price level results in a lower rate of return to mutual funds.
Where inflation results in product prices rising higher than input prices, a higher return would
be realized, as is the case in most Kenyan markets. Consequently, a rise in the inflation rate
would result in a drop in the market risks, hence a drop in the rate of return required by the
investors.
The market interest rate beta obtained is positive and statistically significant. This implies
that an increase in the cost of borrowing is a risk faced by investors since it reduces their
profit margins. Hence, when the market interest rate increases, the investor will demand a
higher rate of return as compensation for the higher risk undertaken. A slightly weaker,
statistically significant negative beta for the fund size was obtained for this model. The
implication is that the smaller the fund size, the higher the inherent risk in a mutual fund.
Therefore, an investor will demand a higher rate of return for the higher risk. The conclusion
from this model is that a positive risk return relationship exists in the mutual fund market
agreeing with theory but with different impact of variables on risk and returns.
From the research, it can be concluded that the performance of the fund will be greatly
determined by the factors of fund performance in the following ways:
In relation to the findings of this research, it can be concluded that there is high positive
correlation between fund performance and investment style adopted. It can also be concluded
that the investment styles adopted by fund managers in Kenya is perfect for fund
performance. Most of the investment style characteristics favour fund performance.
The type of funds invested in Kenya was found to be a blend of growth and value fund, thus
favouring the fund market. Other investment styles found to favour the fund market in Kenya
included the average value of the fund, frequency of investments, methods of assessing fund

63
performance, securities invested in and frequency of buying and selling investments. All
these characteristics work in favour of the Kenyan fund market.
Fund characteristics were found to have a positive correlation with fund performance. Most
of the fund characteristics were found to be favourable to fund performance. These include
clientele type, average net assets, judicial system, advertising expenses and commissions
charging. However, the regulation and the age of the fund in Kenya were found to be
unfavourable. Largely, characteristics of Kenyan fund market were found to be favourable for
fund performance.
The study established that there is a negative correlation between behavioural patterns and
fund performance. The study established that there are negative behavioural patterns
portrayed by investors in the Kenyan fund market. Behaviour patterns such as
overconfidence, excessive trading, buying attention grabbing stocks, selling winning stocks
earlier and selling losing stocks later were found to be prevalent in the Kenyan market. This
has negatively affected the fund market in Kenya as investors lose their investments to these
behavioural characteristics.
Investigations in the study established that there is a positive correlation between managerial
capabilities and fund performance. Market timing, stock picking abilities as well as education
skills were found to be prevalent in the Kenyan market. These highly favour the fund market
in Kenya and as such, the fund market has greater chances of better performance. However,
the fund managers’ experience was found to be highly inadequate owing to the average age
of the fund market in Kenya.
Finally, the study established that the performance of the fund market in Kenya has been
consistently increasing. This positively impacts the Kenyan fund market since it enables the

64
fund managers to predict the market and hence increasing its performance. The researcher
further established that there is a positive correlation between performance and persistence of
returns. The persistency of returns which was found to be constantly increasing enables the
fund managers to predict the market and hence the fund performance
5.4 Limitations to the Study
When conducting this research study, a number of limitations were encountered. The first
limitation was the existence of low informational efficiency in the mutual funds market. The
Nairobi Securities Exchange market has grown tremendously but still has not achieved high
information efficiency where prices of an asset reflect all information available. Most mutual
funds invest in the stock market and also publish the rate of returns they offer on a daily
basis. However, price change with a lag effect as the economic variable change.
The second limitation is the possibility of different mutual funds being affected by the
various factors differently. The money market fund is affected by the Treasury bill rate by a
greater magnitude that the balanced fund. Similarly, variables affecting the equity fund and
Kenyan shillings fund will be affected by the economic growth rate and inflation by a
different magnitude.
Thirdly, the research is limited to data provided by mutual fund which conforms to periodic
financial reporting statements. This implies that the cut off of a period can be in the middle of
an economic cycle hence provides return statistics before the market corrects itself. This can
be observed in the data where the return could drop drastically for one year and rise
drastically the next year providing a normal average return for the two years.
5.5 Recommendations and Suggestions for Further Research
The conclusions made from this research study support the following government and mutual
fund policy recommendations. The government should adopt expansionary economic policies

65
that ensure high GDP growth rate to ensure that returns in each sector increase and reduce the
risk prevalent in the economy. This will result in higher returns to the mutual funds since they
are invested in different sectors of the economy.
The Central Bank of Kenya should control the base lending rate to commercial banks to
control inflation and ensure appropriate cost of borrowing in the market. High inflation
reduces the real returns to mutual funds and other investments. Hence, when the inflation rate
is rising, the base lending rate should be raised to reduce the money supply and reduce the
purchasing power. On the other hand, the base lending rate to commercial banks should be
regulated to ensure that the cost of borrowing remains low enough to stimulate more
investment and better returns.
Mutual fund policies and business strategies should be tailored to address the factors that
determine the risks and returns in the market. Mutual fund managers should adopt
diversification policies to mitigate economic changes in different industries. Investing in
different industries that are negatively correlated eliminates systematic risk. The inflation rate
is less felt in some industries than others hence a diversified portfolio will achieve better
returns than undiversified ones.
A large fund size enjoys economies of scale and broader diversification options. This study
found that bigger funds earned higher returns than small ones. Effective marketing strategies
should be adopted to attract more investors and merging of smaller funds.
In light of the research findings, the study established a positive relationship between
investment style and fund performance. It recommends that the Kenyan fund managers be
trained on the best investment styles including the size of fund to hold, types of funds to
invest in, frequency of change of investment style, methods of assessing fund performance
among other investment style characteristics.

66
Further, the study established a positive relationship between fund characteristics and
performance. Most characteristics in Kenya were found to favour fund performance.
However, regulation of fund industry was found to be greatly lacking as one of the
characteristics. It is recommended that the various regulators of the fund industry come up
with the necessary regulations to control the fund market and hence fund improved
performance.
The behavioural characteristics were found to have a negative relationship with fund
performance. This factor has been found to be prevalent in Kenya. The research there for
recommends that fund investors and managers be trained on the best practices to avoid such
negative behaviours.
Finally, persistence of returns and managerial capabilities were found to have a positive
relationship with fund performance. In this regard, the researcher recommends time to time
training of fund managers to enhance these vital skills and hence remove the element of
‘luck’ when investing.
Further studies relating to this research topic can be undertaken in the following areas.
Firstly, a comparative study on the performance of mutual funds relative to pension funds and
the factors that are unique to each of them can be analysed. Both of these funds invest in
different sectors but with different investment objectives. The marketing and investment
strategies differ resulting in risks and returns that are unique to each type of fund.
Secondly, further studies can be conducted to analyse risk factors that are unique to sectors
that individual mutual funds are invested in. Bond funds, equity funds and Kenya shilling
funds can be affected by different magnitudes of the economic factors. Some funds may be
highly influenced by a certain factor hence policies and business strategies are unique to
them.

67
REFERENCES
Alexander, G., G. Cici, and S. Gibson, (2007). Does Motivation Matter When Assessing
Trade Performance? An Analysis of Mutual Funds. Review of Financial Studies,
20(1):125-150.
Arteaga, K.R., C.S. Ciccotello, and C.T. Grant, (1998). New Equity Funds: Marketing and
Performance, Financial analysts Journal, 54(6): 43-49.
Black, F. (1972). Capital Market Equilibrium with Restricted Borrowing. Journal of
Business, 45(3): 444-454.
Bollen, N.P.B. and Busse J.A. (2005). Short-Term Persistence in Mutual Fund Performance.
The Review of Financial Studies, 18(2): 569-597.
Brown, C., V. Harlow and H. Zhang (2009). Staying the Course: The Role of Investment
Style Consistency in the Performance of Mutual Funds. Working Paper Series, 1-61
Browman E.H. (1980). A Risk Return Paradox for Strategic Management, Sloan
Management Review.
Carhart, M. (1997). On Persistence in Mutual Fund Performance. Journal of Finance,
52(1): 57-82.
Comer, G. (2006). Hybrid Mutual Funds and Market Timing Performance. The Journal of
Business, 79(2): 771-797.
Cresson J.E. (2002). A Market–Based Measure of Portfolio and Mutual Fund
Diversification. Quarterly Journal of Business and Economics, 41(3/4): 115-143.
Cai, J., K.C Chan and T. Yamadi (1997). The Performance of Japanese Mutual Funds. The
Review of Financial Studies, 10(2): 237-273.
Elsas, R., M. El-shaer and E. Theissen (2003). Beta and Return revisited: Evidence from the
German stock market. Journal of International Financial Markets, Institutions and
Money, 13(1): 1-18.
Fama, E. & French, K. (2007). Migration. Financial Analysts Joumal, 63(3): 1-24

68
Fletcher, J. (1997). An examination of the cross-sectional relationship of beta and return; UK
evidence. Journal of Economics and Business, 49(3): 211-221.
Fung, W. & Hsieh, D.A. (2002). Asset-Based Style Factors for Hedge Funds. Financial
Analysts Journal, 58(5): 16-27.
Gaumnitz, J.E. (1970). Appraising Performance of Investment Portfolios. The Journal of the
American Finance Association, 25(3): 555-560.
Grinblatt, M. and Titman, S. (1989). Mutual Fund Performance: An Analysis of Quartely
Portfolio Holdings. The Journal of Business, 62(3): 393-416.
Indro, D.C, C.X. Jiang, M.Y. Hu and W.Y. Lee (1999). Mutual Fund Performance: Does
Fund Size Matter? Financial Analysts Journal, 55(3): 74-87.
Jensen, M.C. (1972). Optimal Utilization of Market Forecast and Evaluation of Investment
Performance in G. P. Szego and K. Shell (Ed.) Mathematical Methods of Investment &
Finance, Amsterdam: North Holland 32(2): 559 – 572.
Jensen, M.C. (1968). The Performance of Mutual Funds in the period 1945-1964. Journal of
Finance, 23(2): 389-416.
Khorana, A., H. Servaes and P. Tufano (2009). Mutual Fund Fees Around the World.
Review of Financial Studies, 22(3): 1279-1310.
Malkiel, B. (1995). Returns from Investing in Equity Mutual Funds: 1971 to 1991.
Joumal of Finance, 50(2): 549-572.
Markowitz, H. (1952). Portfolio Selection. Journal of Finance, 7: 77-91.
Miller, M. and Scholes, M. (1972). Rate of Return in Relation to Risk: A Re-examination
of some recent findings in studied in the theory of Capital Markets. Michael C. Jensen,
eds New York: Praeger, 47-75.
Muriithi D.K. (2005). An Evaluation of the Risk & Return of Equity Mutual Funds in Kenya,
Unpublished MBA Project. University of Nairobi.
Mutua, F.M. (2010). The Relationship between Portfolio Composition and Risk and Return

69
among Fund Management Firms in Kenya. Unpublished MBA Project, University of
Nairobi.
Ngene, G.M. (2002). Empirical Investigation into Portfolio Performance Measures by
Pension Fund Managers and the Challenges they face in Portfolio Management in
Kenya, Unpublished MBA Project. University of Nairobi.
O’Neal, E.S. (1997). How Many Mutual funds constitute a Diversified Mutual Fund
Portfolio? Financial Analysts Journal, 53(2): 37-46.
Pollet, J. and Wilson, M. (2008). How Does Size Affect Mutual Fund Behaviour. Journal
of Finance, 63(6): 1-49.
Ramsany, B.H. & Yeung M.C (2003). Evaluating Mutual Funds in an Emerging Market:
Factors that Matter to Financial Advisors. International Journal of Bank marketing,
122- 136.
Ross, S.A., R.W. Westerfield and F.J. Jaffe (1990). Corporate Finance, 2nd Edition Irwin,
295-311
Roy, S.M. (2005). Money Market Mutual Funds: A Macro Perspective, Economic and
Political weekly, 40(12) Mutual, Banking and Finance (Mar, 19-25, 2005): 1254-
1256, 1258-1263.
Taylor, W.R.L. and Yoder, J.A. (1994). Mutual Fund Trading and Investor Utility. Financial
Analysts Journal, 50(3): 66-69.
Saraoglu, H. and Detzler M.L. (2002). A Sensible Mutual Funds Selection Model. Financial
Analysts Journal, 58(3): 60-72.
Sharpe, W.F. (1964). Capital Asset Prices: A Theory of Market Equilibrium under conditions
of Risk. Journal of Finance, 19(3): 425-442.
Zhang, L. and Massa, M. (2009). Cosmetic Mergers: The Effect of Style Investing on the
Market for Corporate Control. Journal of Financial Economics, 1-28

70
APPENDICES
APPENDIX1: RESEARCH QUESTIONNAIRE
Please tick the most appropriate answers
PART A: BACKGROUND INFORMATION
Section 1
1.Gender
(a) Male □ (b) Female □
2.Age Bracket
(a) 18 -30 yrs □ (b) 31 – 40 yrs □
(c) 41 – 49 yrs □ (d) Above 50 yrs □
3.Highest Education Level
(a) Doctorate □ (b) Masters □
(c) Bachelors □ (d) Diploma □
4.How many years have you been in the fund management profession?
(a) Below 1 yr □ (b) 1- 5 yrs □
(c) 6 – 10 yrs □ (d) Above 10 yrs □
Section 2
5.What type of fund do you invest the funds?
(a) Growth □ (b) Value □ (c) Combination □
6.What is the estimate of the average value of funds you manage?
Kshs 1M – 10M □ Kshs 10M – 100M □ Above Kshs 100M □
7.How often do you change your investment style?
Very Often □ Often □ Rarely □ Not at all □
8.Which criteria do you use in assessing the performance of the fund?
Past Performance □ Industry Performance □
Benchmarking □ Combination of methods □
9.What kind of instruments do you prefer when investing?
Government Bonds □ Corporate Bonds □

71
Equity Securities □ Combination □
10.How often do fund investors dispose their holdings in the fund you are managing?
Very Often □ Often □ Rarely □ Not at all □
11.How do you buy and sell your securities?
(a) Through a Broker □ (b) Direct Buying □
PART B: FUND CHARACTERISTICS AND BEHAVIORAL PATTERNS
Fund Characteristics
12.Is the fund industry well regulated, in your opinion?
Yes □ No □
13.What is the average age of the funds you are managing?
Below 5 years □ 6-10 years □
11-15 years □ Above 15 years □
14.What type of clients do you serve?
Corporate □ Individuals □ Both □
15.What is the average net assets estimate of the funds you manage?
Below Kshs 1M □ Kshs 1M – 10M □
Kshs 10M – 50M □ Above Ksh 50M □
16.How do you rate the judicial system in terms of competence and equity?
Excellent □ Very good □ Good □ Poor □ Very Poor
17.How do you rate your advertising expenses?
Very high □ High □ Low □ Very Low □
18.What is your main objective when investing funds?
(a) High monthly/annual return to investors □
(b) Growth of investors’ wealth □
(c) Both value and growth □
19.When do you charge your commission charges?
(a) When investing in the fund (Front End Load) □
(b) When selling your investments (Back End Load) □

72
20.In administration of the fund, how would you rate the expenses incurred (Management Fees)?
Very High □ High □ Low □ Very Low □
21.Does the mutual fund industry have the necessary and supportive regulations in Kenya?
Yes □ No □
If the answer is no above, please indicate the area, in your opinion, should be improved.
22.Certain factors may make investors irrational when investing and disposing off their investments.
In the following list, indicate how often these factors are displayed by investors in the funds you are
managing (tick as appropriate).
Very Often Often Rarely Not at all
Overconfidence
Excessive trading
Buying attention-
grabbing stocks
Selling winning
stocks earlier
Selling losing
stocks late
23.How would you describe the investor’s investment strategies?
Passive (advice from experts) □
Active (trying on their own while carrying out analysis) □
24.On a daily basis, you buy and sell securities. Which is the most prevalent activity, in your opinion,
in terms of time and cost?
Buying □ Selling □
25.In the fund market, some securities outperform others while others do not do well. In your opinion,
which is the major contributing factor amongst those listed below?
Managerial Capabilities differences □
Net Assets amount of the fund □
Luck □

73
Combination of the above □
PART C: PERSISTENCE OF RETURNS AND MANAGERIAL CAPABILITIES
26.In your opinion, how would you describe the performance of your fund over the period in
operation?
Constantly Increasing □ Constantly Decreasing □
Constant (same returns) □ Varying from time to time □
27.If the answer in number 26 above is constantly increasing, how would you explain it?
Superior Managerial Capabilities and skills
Experience
Luck
28.In trying to outperform the market, how often do you use past performance information of the fund
to predict performance of stocks?
All the time □ Sometimes □
Rarely □ Not at all □
29.How would you describe your investment strategies as the fund manager?
Passive (use of a selected benchmark) □
Active (make attempt to get best securities) □
30.How often do you succeed in market timing and picking the right stock for investment?
Always □ Most of the time □
Half of the time □ Never □
31.In assessing managerial capabilities, educational skills and experience matters, which of these two,
in your opinion, matters the most?
Education □ Experience □
32.In your opinion, which area in fund management requires improvement?
_________________________________________________________________________________
_________________________________________________________________________________
_________________________________________________________________________________

74
APPENDIX 2: REGISTERED FUND MANAGERS IN KENYA – 2014
1) African Alliance Kenya Investment Bank Limited
2) Amana Capital Limited
3) Apollo Asset Management Company Limited
4) British-American Asset Managers Limited
5) Co-op Trust Investment Services Limited
6) Dry Associates Limited
7) Genesis Kenya Investment Management Limited
8) ICEA Asset Management Limited
9) Jubilee Financial Services Limited
10) Kenindia Asset Management Company Limited
11) Madison Asset Management Services Limited
12) Old Mutual Asset Managers (Kenya) Limited
13) Pinebridge Investment East Africa Company Limited
14) Sanlam Investment Management Kenya Limited
15) Stanbic Investment Management Services (EA) Limited
16) Zimele Asset Management Company Limited
Source: Retirement Benefits Authority, 2013

75
APPENDIX 3: MUTUAL FUNDS DATA
No. Rate of
Return
TB
Rate
GDP Growth
Rate
Inflation
Rate
Market Interest
Rate
Fund Size
(millions)
1 6.85 7.69 6.32 6.06 13.60 260.00
2 6.76 7.89 6.99 4.27 13.30 385.00
3 7.63 8.52 1.53 16.20 14.00 288.00
4 7.30 8.15 2.74 10.53 14.80 350.00
5 5.90 3.81 5.76 4.06 14.40 500.00
6 5.50 8.89 4.38 13.98 15.00 396.00
7 12.00 13.54 4.22 9.65 19.63 300.00
8 7.80 7.69 6.32 6.06 13.60 144.00
9 8.20 7.89 6.99 4.27 13.30 264.00
10 8.60 8.52 1.53 16.20 14.00 190.00
11 18.00 8.15 2.74 10.53 14.80 270.00
12 2.90 3.81 5.76 4.06 14.40 450.00
13 3.40 8.89 4.38 13.98 15.00 425.00
14 25.00 13.54 4.22 9.65 19.63 280.00
15 15.45 7.69 6.32 6.06 13.60 312.00
16 15.20 7.89 6.99 4.27 13.30 565.00
17 13.00 8.52 1.53 16.20 14.00 400.00
18 22.00 8.15 2.74 10.53 14.80 550.00
19 24.90 3.81 5.76 4.06 14.40 891.00
20 8.52 8.89 4.38 13.98 15.00 1000.00
21 31.00 13.54 4.22 9.65 19.63 1300.00
22 8.30 7.89 6.99 4.27 13.30 2073.00
23 -29.38 8.52 1.53 16.20 14.00 2005.00
24 2.33 8.15 2.74 10.53 14.80 2830.00
25 21.39 3.81 5.76 4.06 14.40 4250.00
26 -31.37 8.89 4.38 13.98 15.00 3360.00
27 22.10 13.54 4.22 9.65 19.63 4763.00
28 6.53 7.89 6.99 4.27 13.30 551.00
29 -10.44 8.52 1.53 16.20 14.00 757.00
30 3.73 8.15 2.74 10.53 14.80 857.00
31 18.70 3.81 5.76 4.06 14.40 1273.00
32 -25.83 8.89 4.38 13.98 15.00 1115.00
33 18.66 13.54 4.22 9.65 19.63 1447.00
34 5.70 7.89 6.99 4.27 13.30 982.00
35 8.10 8.52 1.53 16.20 14.00 1197.00
36 9.25 8.15 2.74 10.53 14.80 1253.00
37 9.18 3.81 5.76 4.06 14.40 2299.00
38 -11.11 8.89 4.38 13.98 15.00 2376.00
39 15.32 13.54 4.22 9.65 19.63 2265.00
40 5.30 7.89 6.99 4.27 13.30 132.00
41 5.64 8.52 1.53 16.20 14.00 177.00

76
42 6.07 8.15 2.74 10.53 14.80 247.00
43 5.06 3.81 5.76 4.06 14.40 435.00
44 6.08 8.89 4.38 13.98 15.00 493.00
45 7.30 13.54 4.22 9.65 19.63 397.00
46 4.50 7.89 6.99 4.27 13.30 355.00
47 -12.53 8.52 1.53 16.20 14.00 375.00
48 8.13 8.15 2.74 10.53 14.80 541.00
49 25.17 3.81 5.76 4.06 14.40 711.00
50 -18.08 8.89 4.38 13.98 15.00 686.00
51 17.75 13.54 4.22 9.65 19.63 428.00
52 7.00 7.89 6.99 4.27 13.30 96.00
53 8.00 8.52 1.53 16.20 14.00 90.00
54 8.50 8.15 2.74 10.53 14.80 135.00
55 8.50 3.81 5.76 4.06 14.40 316.00
56 7.50 8.89 4.38 13.98 15.00 274.00
57 9.00 13.54 4.22 9.65 19.63 297.00
58 60.40 7.89 6.99 4.27 13.30 496.00
59 -39.50 8.52 1.53 16.20 14.00 307.00
60 -8.10 8.15 2.74 10.53 14.80 274.00
61 30.70 3.81 5.76 4.06 14.40 339.00
62 -8.90 8.89 4.38 13.98 15.00 253.00
63 23.20 13.54 4.22 9.65 19.63 217.00
64 7.52 8.15 2.74 10.53 14.80 12.00
65 6.56 3.81 5.76 4.06 14.40 20.00
66 9.08 8.89 4.38 13.98 15.00 27.50
67 9.42 13.54 4.22 9.65 19.63 22.00
68 -5.40 8.52 1.53 16.20 14.00 6.00
69 -1.87 8.15 2.74 10.53 14.80 7.25
70 4.75 3.81 5.76 4.06 14.40 9.00
71 7.09 8.89 4.38 13.98 15.00 16.00
72 5.69 13.54 4.22 9.65 19.63 7.00
73 5.01 8.52 1.53 16.20 14.00 265.00
74 6.66 8.15 2.74 10.53 14.80 258.00
75 2.75 3.81 5.76 4.06 14.40 453.00
76 5.45 8.89 4.38 13.98 15.00 495.00
77 9.60 13.54 4.22 9.65 19.63 1059.00
78 1.18 8.52 1.53 16.20 14.00 106.00
79 1.22 8.15 2.74 10.53 14.80 88.00
80 54.31 3.81 5.76 4.06 14.40 76.00
81 -18.59 8.89 4.38 13.98 15.00 47.00
82 41.60 13.54 4.22 9.65 19.63 52.00
83 5.40 7.69 6.32 6.06 13.60 2020.00
84 6.14 7.89 6.99 4.27 13.30 2665.00
85 6.69 8.52 1.53 16.20 14.00 2309.00
86 8.03 8.15 2.74 10.53 14.80 3460.00

77
87 6.21 3.81 5.76 4.06 14;40 3648.00
88 6.17 8.89 4.38 13.98 15.00 3800.00
89 12.64 13.54 4.22 9.65 19.63 5378.00
90 0.54 7.69 6.32 6.06 13.60 713.00
91 8.07 7.89 6.99 4.27 13.30 1222.00
92 -11.00 8.52 1.53 16.20 14.00 991.00
93 2.10 8.15 2.74 10.53 14.80 802.00
94 29.16 3.81 5.76 4.06 14.40 881.00
95 -13.23 8.89 4.38 13.98 15.00 529.00
96 35.06 13.54 4.22 9.65 19.63 458.00
97 0.92 7.69 6.32 6.06 13.60 4326.00
98 4.88 7.89 6.99 4.27 13.30 5818.00
99 -22.12 8.52 1.53 16.20 14.00 4461.00
100 1.56 8.15 2.74 10.53 14.80 3338.00
101 34.82 3.81 5.76 4.06 14.40 3895.00
102 -19.96 8.89 4.38 13.98 15.00 2064.00
103 49.06 13.54 4.22 9.65 19.63 1896.00
104 0.27 8.52 1.53 16.20 14.00 15.00
105 6.03 8.15 2.74 10.53 14.80 97.00
106 17.94 3.81 5.76 4.06 14.40 226.00
107 -9.28 8.89 4.38 13.98 15.00 118.00
108 18.94 13.54 4.22 9.65 19.63 80.60
109 0.15 8.52 1.52 16.20 14.00 11.00
110 3.05 8.15 2.74 10.53 14.80 16.00
111 31.09 3.81 5.76 4.06 14.40 32.00
112 -14.90 8.89 4.38 13.98 15.00 28.00
113 28.62 13.54 4.22 9.65 19.63 25.00
114 8.67 8.52 1.53 16.20 14.00 453.00
115 8.56 8.15 2.74 10.53 14.80 583.00
116 9.17 3.81 5.76 4.06 14.40 1059.00
117 9.37 8.89 4.38 13.98 15.00 874.00
118 10.74 13.54 4.22 9.65 19.63 953.00
119 2.10 8.15 2.74 10.53 14.80 140.00
120 20.91 3.81 5.76 4.06 14.40 235.00
121 -11.23 8.89 4.38 13.98 15.00 210.00
122 32.20 13.54 4.22 9.65 19.63 340.00
123 6.04 8.15 2.74 10.53 14.80 45.00
124 8.70 3.81 5.76 4.06 14.40 52.00
125 5.20 8.89 4.38 13.98 15.00 49.00
126 10.80 13.54 4.22 9.65 19.63 38.00
127 5.20 8.15 2.74 10.53 14.80 57.00
128 18.70 3.81 5.76 4.06 14.40 148.00
129 -16.49 8.89 4.38 13.98 15.00 134.00
130 15.31 13.54 4.22 9.65 19.63 175.00
Source: African Development Bank online database (2006 - 2012); Economic Survey

78
APPENDIX 4: ECONOMIC FACTORS
YEAR Treasury Bill
Rate
GDP Growth
Rate
Inflation Rate Market Interest
Rate
2008 8.52 1.53 16.20 14.00
2009 8.15 2.74 10.53 14.80
2010 3.81 5.76 4.06 14.40
2011 8.89 4.38 13.98 15.00
2012 13.54 4.22 9.65 19.63
2013 8.52 2.74 10.53 14.00
2014 8.15 5.76 4.06 14.80
Source: The World Bank and Central Bank of Kenya online databases