Factor structure of the Behavior Rating Inventory of ... · following clear verbal instructions...
22
Full Terms & Conditions of access and use can be found at http://www.tandfonline.com/action/journalInformation?journalCode=ncny20 Download by: [University of Oslo] Date: 04 December 2015, At: 02:12 Child Neuropsychology A Journal on Normal and Abnormal Development in Childhood and Adolescence ISSN: 0929-7049 (Print) 1744-4136 (Online) Journal homepage: http://www.tandfonline.com/loi/ncny20 Factor structure of the Behavior Rating Inventory of Executive Functions (BRIEF-P) at age three years Annette Holth Skogan, Jens Egeland, Pål Zeiner, Kristin Romvig Øvergaard, Beate Oerbeck, Ted Reichborn-Kjennerud & Heidi Aase To cite this article: Annette Holth Skogan, Jens Egeland, Pål Zeiner, Kristin Romvig Øvergaard, Beate Oerbeck, Ted Reichborn-Kjennerud & Heidi Aase (2015): Factor structure of the Behavior Rating Inventory of Executive Functions (BRIEF-P) at age three years, Child Neuropsychology, DOI: 10.1080/09297049.2014.992401 To link to this article: http://dx.doi.org/10.1080/09297049.2014.992401 © 2015 The Author(s). Published by Taylor & Francis. Published online: 09 Jan 2015. Submit your article to this journal Article views: 361 View related articles View Crossmark data Citing articles: 1 View citing articles
Transcript of Factor structure of the Behavior Rating Inventory of ... · following clear verbal instructions...
Full Terms & Conditions of access and use can be found athttp://www.tandfonline.com/action/journalInformation?journalCode=ncny20
Download by: [University of Oslo] Date: 04 December 2015, At: 02:12
Child NeuropsychologyA Journal on Normal and Abnormal Development in Childhood andAdolescence
ISSN: 0929-7049 (Print) 1744-4136 (Online) Journal homepage: http://www.tandfonline.com/loi/ncny20
Factor structure of the Behavior Rating Inventoryof Executive Functions (BRIEF-P) at age three years
Annette Holth Skogan, Jens Egeland, Pål Zeiner, Kristin Romvig Øvergaard,Beate Oerbeck, Ted Reichborn-Kjennerud & Heidi Aase
To cite this article: Annette Holth Skogan, Jens Egeland, Pål Zeiner, Kristin Romvig Øvergaard,Beate Oerbeck, Ted Reichborn-Kjennerud & Heidi Aase (2015): Factor structure of the BehaviorRating Inventory of Executive Functions (BRIEF-P) at age three years, Child Neuropsychology,DOI: 10.1080/09297049.2014.992401
To link to this article: http://dx.doi.org/10.1080/09297049.2014.992401
© 2015 The Author(s). Published by Taylor &Francis.
Published online: 09 Jan 2015.
Submit your article to this journal Article views: 361
View related articles View Crossmark data
Citing articles: 1 View citing articles
Factor structure of the Behavior Rating Inventory of
Executive Functions (BRIEF-P) at age three years
Annette Holth Skogan1, Jens Egeland2,3, Pål Zeiner1,Kristin Romvig Øvergaard1, Beate Oerbeck1,Ted Reichborn-Kjennerud4,5, and Heidi Aase4
1Division of Mental Health and Addiction, Oslo University Hospital, Oslo, Norway2Institute of Psychology, University of Oslo, Oslo, Norway3Division of Mental Health and Addiction, Vestfold Hospital Trust, Tønsberg, Norway4Division of Mental Health, Norwegian Institute of Public Health, Oslo, Norway5Institute of Clinical Medicine, University of Oslo, Oslo, Norway
The preschool period is an important developmental period for the emergence of cognitive self-regulatoryskills or executive functions (EF). To date, evidence regarding the structure of EF in preschool childrenhas supported both unitary andmulticomponent models. The aim of the present study was to test the factorstructure of early EF as measured by the Behavior Rating Inventory of Executive Function-Preschoolversion (BRIEF-P). BRIEF-P consists of five subscales and three broader indexes, hypothesized to tapinto different subcomponents of EF. Parent ratings of EF from a nonreferred sample of children recruitedfrom the NorwegianMother and Child Cohort Study (N = 1134; age range 37–47 months) were subjectedto confirmatory factor analyses (CFA). Three theoretically derived models were assessed; the second-order three-factor model originally proposed by the BRIEF-P authors, a “true” first-order one-factormodel and a second-order one-factor model. CFA fit statistics supported the original three-factor solution.However, the difference in fit was marginal between this model and the second-order one-factor model. Afollow-up exploratory factor analysis (EFA) supported the existence of several factors underlying EF inearly preschool years, with a considerable overlap with the five BRIEF-P subscales. Our results suggestthat some differentiation in EF has taken place at age 3 years, which is reflected in behavior ratings. The
We are grateful to the children and their parents for their efforts taking part in the present study. Theauthors wish to thank statisticians Are Hugo Pripp and Guido Biele for valuable input during data analysis andchild psychologist Anne-Grethe Urnes for her important contributions through all phases of the present study.
The study was supported by a grant from the Norwegian South Eastern Health Region, grant no. 2010081.The study “Preschool ADHD: Early characteristics, developmental trajectories, risk and protective factors in aprospective birth cohort (The ADHD study)” from which the present data were drawn, was supported by funds andgrants from the NorwegianMinistry of Health, The Norwegian Health Directorate, The South Eastern Health Region,G & PJ Sorensen Fund for Scientific Research, and from The Norwegian Resource Centre for ADHD, Tourette’ssyndrome and Narcolepsy. MoBa is supported by the Norwegian Ministry of Health and the Ministry of Educationand Research, NIH/NIEHS (Contract no. N0-ES75558) and NIH/NINDS (Grant no. 1 UO1 NS047537-01).
Address correspondence to Annette Holth Skogan, PsyD, Oslo University Hospital, Division of MentalHealth and Addiction, Pb 4959 Nydalen, 0424, Oslo, Norway. E-mail: [email protected]
Child Neuropsychology, 2015http://dx.doi.org/10.1080/09297049.2014.992401
© 2015 The Author(s). Published by Taylor & Francis.This is an Open Access article distributed under the terms of the Creative Commons Attribution-
NonCommercial-NoDerivatives License (http://creativecommons.org/licenses/by-nc-nd/4.0/), which permits non-commercial re-use, distribution, and reproduction in any medium, provided the original work is properly cited,
and is not altered, transformed, or built upon in any way.
Dow
nloa
ded
by [
Uni
vers
ity o
f O
slo]
at 0
2:12
04
Dec
embe
r 20
15

internal consistency of the BRIEF-P five clinical subscales is supported. Subscale interrelations may,however, differ at this age from those observed in the preschool group as a whole.
Keywords: Executive function; BRIEF-P; Preschool; Factor analysis; Development.
Complex cognitive functions that are integral to the self-regulation of behavior anddevelopment of social and cognitive competence develop during early childhood.Collectively referred to as executive function (EF), they are considered distinct frommodular cognitive functions (visuospatial abilities, language skills, memory), encompass-ing higher order functions such as working memory, inhibitory control, planning andorganization, mental flexibility, decision making, initiation of activity, and monitoring ofongoing behavior (Anderson, 2002; Miyake et al., 2000). EF is thought to be implicatedin cognitive processes, emotional responses and behavioral actions (Anderson, 2002;Espy, Sheffield, Wiebe, Clark, & Moehr, 2011). In an influential integrative model ofEF, Miyake and colleagues propose that EF may best be described as a unitary conceptwith partially dissociable constructs (Miyake et al., 2000).
The preschool years (ages 3–6 years) constitute a particularly active period in thedevelopment of EF. Developmental spurts are demonstrated in performance on several EFtasks during these years (Best & Miller, 2010; Carlson, 2005; Carlson & Moses, 2001),and prefrontal neural systems implicated in EF show a gradual differentiation into separatefunctional systems (Posner, Rothbart, Sheese, & Voelker, 2012; Rubia, 2013; Tsujimoto,2008). Based on the literature on normative EF development, a developmental sequencehas been proposed, with basic inhibitory and working memory abilities (inhibition of aprepotent response, information retention) emerging during the first year of life, followedby more complex forms of the two core EF components (solving response conflict,manipulation of information kept active in memory) around age 3 (Carlson, 2005;Garon, Bryson, & Smith, 2008). The ability to shift is thought to depend on basicinhibitory and working memory skills. At age 3, most children will be able to shiftattention in response to situational demands and to shift between simple response setsfollowing clear verbal instructions (Espy, Kaufmann, McDiarmid, & Glisky, 1999; Zelazoet al., 2003). Rudimentary planning and organizational skills have been demonstrated instudies of 3- to 4-year-old children (Espy, Kaufmann, & Glisky, 2001; Welsh, Pennington,& Groisser, 1991). These complex skills involve several other, more basic EF processesand show a more protracted developmental trajectory. The regulation of emotionalresponses is thought to develop in concert with other EF processes, steadily improvingthroughout childhood (e.g., Hill, Degnan, Calkins, & Keane, 2006; Lamm & Lewis, 2010;Posner et al., 2012). In early childhood, when fundamental executive skills first becomeoperational, the structure of EF is likely to be different from what has been described inolder children and adolescents (Lee, Bull, & Ho, 2013). Both unitary (Wiebe et al., 2011;Willoughby, Blair, Wirth, & Greenberg, 2010) and multifactorial models of early EF(Anderson, 2002; Isquith, Gioia, & Espy, 2004; Miller, Giesbrecht, Müller, McInerney, &Kerns, 2012) have been proposed, but methodological differences have complicated thecomparison of competing theoretical models of EF in this age group (van der Ven,Kroesbergen, Boom, & Leseman, 2013; Wasserman & Wasserman, 2013).
The Behavior Rating Inventory of Executive Function- Preschool version (BRIEF-P; Gioia, Espy, & Isquith, 2003) was developed in order to provide information aboutspecific subcomponents in EF through observable, behavioral manifestations of these
2 A. H. SKOGAN ET AL.
Dow
nloa
ded
by [
Uni
vers
ity o
f O
slo]
at 0
2:12
04
Dec
embe
r 20
15

processes in children aged 2 through 5 years. The preschool version is an adaptation of theoriginal inventory, BRIEF (Gioia, Isquith, Guy, & Kenworthy, 2000), in which specificEF domains were defined on the basis of theory, clinical practice, and extant researchliterature (Gioia et al., 2000). The inventory represents a multicomponent view of EF. Inthe instrumentation of the preschool version, irrelevant items reflecting more maturelevels of EF behavior were deleted, some were edited in order to reflect behavior inpreschool contexts, and a new set of items were included to capture preschool-specificbehavior (Isquith et al., 2004). The BRIEF-P consists of five subscales, assessing EFwithin five domains labeled Inhibit, Shift, Emotional Control, Working Memory, and Plan/Organize. Exploratory factor analyses (EFAs) performed in the normative sample and in amixed clinical sample (ages 2–5) yielded three latent factors that proved stable acrossraters and the presence of neurodevelopmental disorder: The Inhibit and EmotionalControl subscales constituted the broader construct of Inhibitory Self-Control.Combined with the Shift subscale, Emotional Control also loaded onto a second factor,which was labeled Flexibility. The third factor, Emergent Metacognition comprised theWorking Memory and Plan/Organize subscales, referring to the developing metacognitiveaspects of EF (Isquith et al., 2004). This three-part model of EF has clear similarities withmodels proposed in factor analytic studies of older children and adults, which seem toconverge on inhibition, mental flexibility (shifting), and working memory or updating asthe three main components in EF (Huizinga, Dolan, & van der Molen, 2006; Lehto,Juujaervi, Kooistra, & Pulkkinen, 2003; Miyake et al., 2000).
Three recent studies of nonreferred preschool children have investigated interrela-tions between the subscales and/or latent second-order factors in BRIEF-P. Based on anEFA of BRIEF-P ratings from parents and teachers, Bonillo, Jimenez, Ballabriga,Capdevila, and Riera (2012) concluded that the observed relations between the fiveclinical subscales in their sample of children aged 3–6 years corresponded well with theoriginally proposed three-factor structure. In a confirmatory factor analysis (CFA) of thecomplete BRIEF-P structure (63 items, five subscales, three indexes), Ezpeleta, Granero,De La Osa, Penelo, and Domènech (2012) found that the three-part model performed wellin reconstructing interrelations in teacher ratings of a sample of 3-year olds after theremoval of four items. An even more fractionated structure in EF was recently suggestedin a study demonstrating that two of the BRIEF-P subscales (Inhibition and Shift) werelikely to reflect more than one underlying construct (Duku & Vaillancourt, 2013).
In contrast to the above findings, the majority of research on EF in preschoolchildren proposes that less fractionated models will be better able to capture the structureof early EF (Lee et al., 2013). Support for a single-factor model has come from severalmethodological traditions including neuropsychological tests (Hughes, Ensor, Wilson, &Graham, 2010; Wiebe et al., 2011; Willoughby et al., 2010), behavioral ratings (Espyet al., 2011), and studies of prefrontal networks implicated in self-regulation (Tsujimoto,2008). The moderate-to-high correlations between latent factors in CFAs have also beenargued to indicate a unitary EF construct (Espy et al., 2011). It should be noted,however,that previous conclusions in favor of a unitary EF construct have not always been basedon a comparison of a unidimensional EF model with multidimensional alternatives. Aspointed out by Miller et al. (2012), some of those investigating more fragmented modelsreport similar or equal fit indices for two- and three-factor structures relative to thepreferred unitary EF construct (Wiebe et al., 2011; Willoughby et al., 2010).
According to research on normative EF development, a gradual differentiation of EFcomponents takes place during the preschool period, towards the multifactorial structure
FACTOR STRUCTURE OF BRIEF-P AT AGE THREE YEARS 3
Dow
nloa
ded
by [
Uni
vers
ity o
f O
slo]
at 0
2:12
04
Dec
embe
r 20
15
typically described in older children and adolescents (Huizinga et al., 2006; Lehto et al.,2003; Miyake et al., 2000). It is relevant to ask, whether multifactorial models of EF—here represented by the BRIEF-P—are the most adequate description of EF structure asmeasured through behavioral observations also for the youngest preschool children.Research to date does not offer a satisfactory answer to this question. The two previousstudies investigating a one-factor structure of EF as measured by the BRIEF-P in a CFAwere based on pooled data from children aged 3–6 years (Bonillo et al., 2012; Duku &Vaillancourt, 2013). During these three years, the preschool child undergoes fundamentalchanges in all aspects of cognition, and it is likely that the structural organization of EFchanges significantly during this period. Possible age-specific interrelations in EF maythus have been obscured (Pauli-Pott & Becker, 2011). Factor analyses reported in theBonillo et al. study (2012) were based exclusively on the inventory’s five clinicalsubscales not on the individual items. This is also potentially problematic, given thequestions raised about the unidimensionality of the clinical subscales (Duku &Vaillancourt, 2013). The third study, investigating EF structure as measured by theBRIEF-P in a large sample of 3-year olds (teacher ratings), assessed two multifactorial,first-order factorial solutions (63 items, five first-order factors;and 63 items, three first-order factors). No information is provided, however, regarding these models’ fit to data,other than that they “yielded unsatisfactory solutions” (Ezpeleta et al., 2012, p.9).
Assessment of EF in the youngest preschool children needs to be based on anunderstanding of its structural organization. The BRIEF has gained support as an ecologi-cally valid measure of EF, which captures important aspects of children’s self-regulation inan everyday context. Both in school-aged and preschool samples, the inventory has beenshown to capture profiles of EF characteristic of developmental and acquired disorders,such as attention deficit/hyperactivity disorder (ADHD), autism spectrum disorder, trau-matic brain injury, and Tourette’s syndrome (Donders, DenBraber, & Vos, 2010; Gioia,Isquith, Kenworthy, & Barton, 2002; Hovik et al., 2014; Mahone & Hoffman, 2007;Nadebaum, Anderson, & Catroppa, 2007; Teunisse et al., 2012). Little is known, however,about how its basic assumptions with regard to EF structure will map onto emerging EFprocesses in the earliest preschool years. The overall aim of the present study was to testwhether a differentiation of EF into subfunctions is reflected in the BRIEF-P already at age3. We compared the second-order three-factor model of EF proposed in the BRIEF-P with afirst-order one-factor model and a second-order one-factor model using CFA. Given that thedifferentiation of EF processes still is in its earliest phase at age 3 years, a one-factor model(first- or second-order) was hypothesized to fit the observed structural relationships in oursample better than a more fractionated, three-factor model of EF.
METHOD
Participants
The present study used data from a longitudinal prospective study of ADHD thatrecruited its participants from The Norwegian Mother and Child Cohort Study (MoBa), apopulation-based birth cohort study including prospective data from more than 107,000pregnancies, managed by the Norwegian Institute of Public Health (Magnus et al., 2006).The MoBa sample has been discussed elsewhere (Magnus et al., 2006; Nilsen et al., 2009).Participants in the MoBa completed questionnaires at several time points during pregnancyand after child birth. The questionnaire at 36 months covers child development and behavior
4 A. H. SKOGAN ET AL.
Dow
nloa
ded
by [
Uni
vers
ity o
f O
slo]
at 0
2:12
04
Dec
embe
r 20
15

including six questions on hyperactivity, impulsivity, and attention problems from the ChildBehaviour Checklist (CBCL; Achenbach & Ruffle, 2000) and five questions reflectingDSM-IV-TR) criteria for ADHD (American Psychiatric Association, 2000). Children wereinvited to take part in the prospective study if the sum score of these 11 questions was abovethe 90th percentile in the population, or if their parents reported hyperactivity as a healthproblem. In addition, a comparison group was randomly selected among children in the fullMoBa cohort and was invited to the same clinical assessment. A total of 2,798 childrenscoring high on the screening questions or parent report of hyperactivity as a health problemwere invited, and 1,048 (37.5%) participated in the clinical assessments. For the compar-ison group, 654 were invited, and 147 (22.5%) participated.
All children participating in the prospective study’s clinical assessments (N = 1,195)were eligible for the present study. Inclusion required a BRIEF-P parent form with overallnumber of missing responses less than 12 and less than two missing responses within anysingle subscale. In line with scoring instructions, missing scores were replaced with itemscore 1 (n = 110) (Gioia, Espy, & Isquith, 2002). Finally, 23 children were excluded due toIQ score below 70 (n = 5) or missing data on this variable (n = 18). Our data set thusconsisted of BRIEF-P parent ratings of 1,134 children (544 girls and 590 boys with meanage = 41.8 months, range 37–47 and mean IQ of 101.8, range 70–130). Average number ofADHD symptoms were 4.0 (range 0–18), and average length of maternal education was15.3 years (range 9–18). Missing analyses revealed no significant difference betweenchildren included in the data set, and those excluded were due to an incomplete BRIEF-Pform (n = 38) with regard to any of these variables.
The present sample was recruited in order to investigate early symptoms of ADHD;thus, children meeting the diagnostic criteria for ADHD (American Psychiatric Association,2000) were overrepresented (14.2%) compared to the general population, where prevalenceestimates vary between 2 and 6% (Egger & Angold, 2006; Wichstrom et al., 2012).
None of the children in the sample were or had been receiving psychopharmacolo-gical treatment at the time of the assessment. Parents of the participating children gaveinformed consent to the research and to publication of the results. The study was approvedby the Norwegian Regional Committee of Ethics in Medical Research and The NorwegianData Inspectorate.
Procedure and Measures
Upon accepting the invitation to participate in the ADHD prospective study, parentswere requested to fill out the BRIEF-P and return it by the time of the clinical assessment.This was done approximately 4 weeks prior to the 1-day assessment at the ADHD studylocation at Oslo University Hospital. As part of the clinical assessment, a semi-structured,clinical interview (described below) was conducted with one of the parents.
The BRIEF-P consists of 63 items or behavioral descriptors, that is, “Forgets whathe/she is doing in the middle of an activity” or “Overreacts to small problems” within fivetheoretically and clinically derived domains (described earlier). Parents respond how oftena specific behavior has been a problem during the past 6 months choosing Never (1),Sometimes (2), or Often (3). Thus, higher scores are associated with poorer executivefunctioning. The data collection in the prospective study commenced in 2007, using theexisting Norwegian translation developed for research purposes (Nicholas & Solbakk,2006). A new BRIEF-P translation with a closer resemblance to the original version(Gioia et al., 2003) became available for research purposes in 2009 and was implemented
FACTOR STRUCTURE OF BRIEF-P AT AGE THREE YEARS 5
Dow
nloa
ded
by [
Uni
vers
ity o
f O
slo]
at 0
2:12
04
Dec
embe
r 20
15

in the second half of the data collection (from 2009 to 2011). To ascertain that thedifferent wordings in some of the inventory’s items did not lead to differences in factorstructure, we compared four different EFA solutions that allow same and/or differentfactor means and factor loadings for the two BRIEF translations. We found the bestsolution to be the one assuming same loadings and different means (Results listed inAppendix A). In sum, this analysis suggests a unitary factor structure for the two BRIEFtranslations, allowing us to combine their data for all further analyses.
Psychiatric symptoms were assessed using an adapted Norwegian version of thePreschool Age Psychiatric Assessment interview (PAPA; Egger & Angold, 2004). Theinterview provides information about the scale and frequency of symptoms according todiagnostic criteria in DSM-IV-TR. Interrater reliability (intraclass consistency) of the totalnumber of DSM-IV-TR ADHD symptoms assessed by PAPA in the present study was .98.
Statistical Analyses
Three a priori models of BRIEF-P factor structure were subjected to CFA, assessingtheir ability to reproduce the pattern of item interrelations in our sample. CFA is a theory-driven, analytical approach that allows for the verification of the number of underlyingdimensions (factors or latent variables) and the pattern of item-factor relationships in aprespecified structural model. It also allows for statistical testing of differences in model fit.The following models were assessed: firstly, a “true” unidimensional model, where all 63items were expected to load directly onto a single, first-order EF factor; secondly, analternative one-factor model where the 63 items were expected to load onto a single, unitaryEF (second-order) factor through the five BRIEF-P subscales; and, thirdly, the completethree-factor model of EF (Isquith et al., 2004), consisting of the 63 items, the five clinicalsubscales (first-order factors), and the three broader indexes (second-order factors).
Due to the BRIEF-P three-category response format and a large proportion ofpositively skewed variables in our data set, weighted least squares means and variance(WLSMV) was used. Analyses were conducted on the factor variance-covariance matrix.Latent factors were expected to correlate—this was allowed in the model—while allmeasurement error was presumed to be uncorrelated. Due to a negative residual variancerelated to one of the first-order factors (Inhibit), variance for this variable was set to 0 in theestimation of the three-factor model. Model fit was evaluated and compared using a range-of-fit statistics: the Tucker-Lewis index (TLI), Comparative fit index (CFI), and the root-mean-square of approximation (RMSEA). According to recommended cut-off values, a TLIand CFI less than .90 indicate lack of fit, between .90 and .95 indicate reasonable fit, andbetween .95 and 1.00 indicate good fit. RMSEA values at .05 or lower are considered toindicate good fit, whereas values between .05 and .08 indicate reasonable fit (Marsh, Hau, &Wen, 2004; Tabachnick & Fidell, 2007). Bartlett’s theory of Sphericity was highly sig-nificant (p < .001) and the Kaiser-Meyer-Olkin (KMO) measure of sampling adequacyvalue of .96 indicated that the sample was suitable for factor analysis. The two second-ordermodels were nested, allowing for statistical testing of differences in model fit in Mplus.
Based on an evaluation of the CFA results, we supplemented the examination of thetheoretically derived models with two EFAs. In contrast to CFA, EFA is a data-drivenprocedure that does not require a highly constrained prespecified model of structuralrelations between items and factors. The method is considered appropriate when linksbetween measured (indicators) and latent variables (factors) are unknown or uncertain(Byrne, 2005). EFA yields information that indicate a number of interpretable constructs
6 A. H. SKOGAN ET AL.
Dow
nloa
ded
by [
Uni
vers
ity o
f O
slo]
at 0
2:12
04
Dec
embe
r 20
15
that maximally account for covariances among the observed variables (Tabachnick &Fidell, 2007). The extraction of factors is usually guided by the inspection of factoreigenvalues and the scree plot. As these criteria may be affected differently by sample sizeand the number of variables, they often provide different solutions. Parallel analysis isrecommended as a supplementary method (Field, 2009). An important, final criterion isthat a factor must be substantially meaningful in a theoretical and/or a clinical perspective.In the present analyses, the solution was subjected to an oblimin rotation, which allowslatent factors to be correlated. A second EFA, where the number of factors were restrictedto three, was conducted in order to investigate how items from the five first-order factorscombined into three proposed second-order factors in our sample.
Descriptive statistics, together with the EFAs, were calculated using PASW Statistics21.0, and follow-up parallel analysis using Watkins’ (2002) Monte Carlo Parallel analysisprogram. The confirmatory factor analyses (CFAs) were conducted in Mplus 7.11.
RESULTS
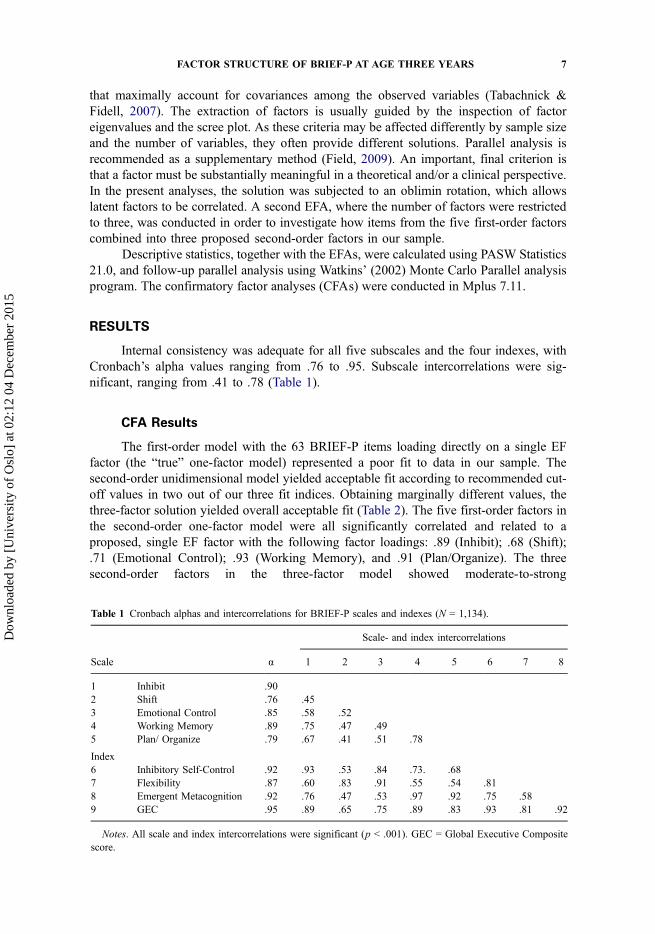
Internal consistency was adequate for all five subscales and the four indexes, withCronbach’s alpha values ranging from .76 to .95. Subscale intercorrelations were sig-nificant, ranging from .41 to .78 (Table 1).
CFA Results
The first-order model with the 63 BRIEF-P items loading directly on a single EFfactor (the “true” one-factor model) represented a poor fit to data in our sample. Thesecond-order unidimensional model yielded acceptable fit according to recommended cut-off values in two out of our three fit indices. Obtaining marginally different values, thethree-factor solution yielded overall acceptable fit (Table 2). The five first-order factors inthe second-order one-factor model were all significantly correlated and related to aproposed, single EF factor with the following factor loadings: .89 (Inhibit); .68 (Shift);.71 (Emotional Control); .93 (Working Memory), and .91 (Plan/Organize). The threesecond-order factors in the three-factor model showed moderate-to-strong
Table 1 Cronbach alphas and intercorrelations for BRIEF-P scales and indexes (N = 1,134).
Scale- and index intercorrelations
Scale α 1 2 3 4 5 6 7 8
1 Inhibit .902 Shift .76 .453 Emotional Control .85 .58 .524 Working Memory .89 .75 .47 .495 Plan/ Organize .79 .67 .41 .51 .78
Index6 Inhibitory Self-Control .92 .93 .53 .84 .73. .687 Flexibility .87 .60 .83 .91 .55 .54 .818 Emergent Metacognition .92 .76 .47 .53 .97 .92 .75 .589 GEC .95 .89 .65 .75 .89 .83 .93 .81 .92
Notes. All scale and index intercorrelations were significant (p < .001). GEC = Global Executive Compositescore.
FACTOR STRUCTURE OF BRIEF-P AT AGE THREE YEARS 7
Dow
nloa
ded
by [
Uni
vers
ity o
f O
slo]
at 0
2:12
04
Dec
embe
r 20
15

intercorrelations (r = .59 to .84). As variance of the first-order factor Inhibit was fixed to 0in the specification of this model, its loading onto the second-order factor Inhibitory SelfControl was not estimated. The other factor expected to load onto the same second-orderfactor, Emotional Control, showed a moderate loading (.44) onto the second-order factor.First-order factor loadings onto the second-order factor Flexibility were .99 (Shift) and .40(Emotional Control): For the second-order factor Emergent Metacognition, first orderloadings were .98 (Working Memory) and .93 (Plan/Organize). Investigating the differ-ence in fit between the two second-order models, we found a small but statisticallysignificant difference in favor of the three-factor model (see Table 2).
Inspection of the modification indices singled out items 20 (“Takes a long time to feelcomfortable in new places or situations”) and 50 (“Act overwhelmed or overstimulated incrowded, busy situations”) as particular sources of ill fit in both second-order models. In theprespecified three-factor model, these items were proposed to load onto the Flexibility factorthrough the Shift subscale. Item 20 proved unrelated to a large proportion of items from theother component of this second-order factor (Emotional Control), and item 50 was closelyrelated to several items from subscales constituting the two other second-order factors.
EFA Results
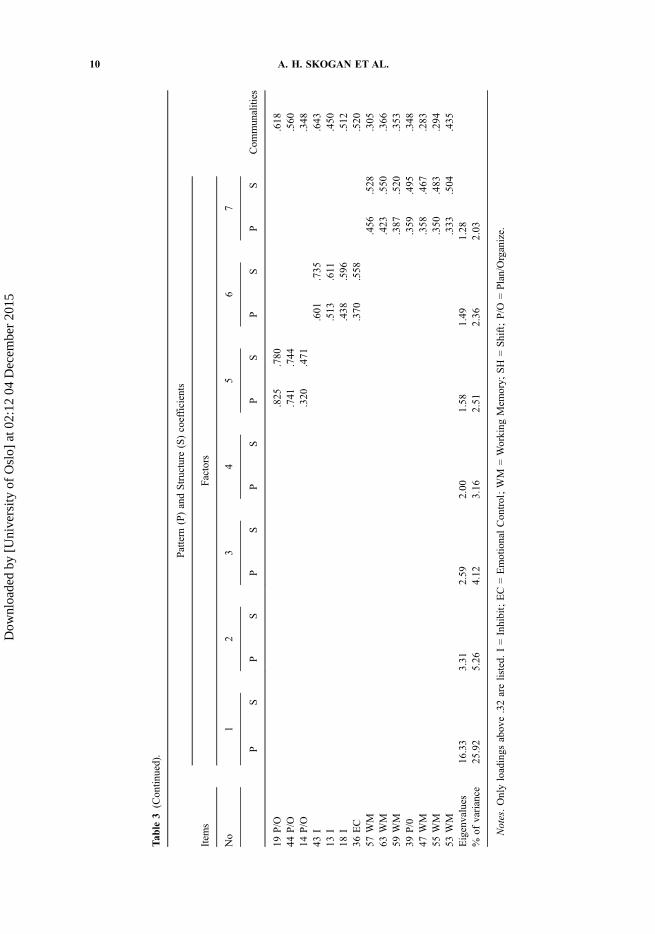
The exploratory analysis indicated the presence of several latent factors (Table 3). EFAyielded 12 factors with eigenvalues exceeding 1. In the screeplot, there was a break betweenFactors 1 and 2, and a smaller one after the fourth factor. Results from the parallel analysisindicated that six factors exceeded the criterion value. A seventh factor was included on thebasis of its interpretability and relatively high factor loadings (see Appendices B and C forcomplete pattern and structure matrices).
The seven rotated factors accounted for 45.4% of the variance in BRIEF-P ratingsand were moderately correlated (rs ranging from .12 to .46). The first factor, accountingfor 25.9% of the variance, comprised five items from the Working Memory subscale, twoitems from the Inhibit scale and one from the Plan/Organize scale. All eight behavioraldescriptions were related to sustained attention (e.g., “Has trouble concentrating ongames, puzzles, or play activities”; “Has trouble finishing tasks”; “Gets easily sidetrackedduring activities”; “Does not complete tasks even after given directions”). Seven items, allfrom the Emotional Control scale constituted a second factor, reflecting emotional reac-tivity and intensity in emotional reactions (e.g., “Has outbursts for little reason”;“Overreacts to small problems”; “Angry or tearful outbursts are intense but end sud-denly”). The third factor comprised four items from the Shift scale; all four describing theability to adjust to new people or situations (e.g., “Takes a long time to feel comfortable in
Table 2 Summary of Fit Indices for Three BRIEF-P Models.
Model RMSEA (90% C.I.) TLI CFI X2diff
1-factor (first-order) .06 (.060–.062) .83 .841-factor (second-order) .05 (.047–.049) .90 .893-factor (second-order) .05 (.044–.046) .91 .91 9.92*
Note. C.I. = 90% confidence interval. The X2diff value indicates a significant difference in
fit between the two second-order models in favor of the three-factor solution.*p = .002 90%
8 A. H. SKOGAN ET AL.
Dow
nloa
ded
by [
Uni
vers
ity o
f O
slo]
at 0
2:12
04
Dec
embe
r 20
15

Tab
le3Pattern
andStructure
Matriceswith
Oblim
inRotationof
Seven
FactorEFA
Solutionof
BRIEF-P
Item
s(N
=1,13
4).
Item
s
Pattern
(P)andStructure
(S)coefficients
Com
munalities
Factors
No
12
34
56
7
PS
PS
PS
PS
PS
PS
PS
12WM
.782
.787
.639
42WM
.728
.767
.605
7WM
.497
.635
.489
32WM
.482
.622
.497
58I
.471
.652
.509
56I
.438
.571
.435
61WM
.385
.622
.539
49P/O
.351
.607
.567
16EC
.668
.701
.626
1EC
.645
.701
.523
6EC
.628
.700
.549
21EC
.609
.695
.538
26EC
.598
.665
.537
11EC
.525
.630
.495
31EC
.519
.605
.451
20SH
.867
.801
.668
10SH
.695
.671
.459
40SH
.578
.612
.402
5SH
.452
.593
.443
52I
.550
.739
.642
48I
.546
.671
.525
60I
.505
.640
.483
54I
.413
.638
.539
62I
.388
.549
.381
23I
.328
.553
.457
(Con
tinued)
FACTOR STRUCTURE OF BRIEF-P AT AGE THREE YEARS 9
Dow
nloa
ded
by [
Uni
vers
ity o
f O
slo]
at 0
2:12
04
Dec
embe
r 20
15
Tab
le3(Contin
ued).
Item
s
Pattern
(P)andStructure
(S)coefficients
Com
munalities
Factors
No
12
34
56
7
PS
PS
PS
PS
PS
PS
PS
19P/O
.825
.780
.618
44P/O
.741
.744
.560
14P/O
.320
.471
.348
43I
.601
.735
.643
13I
.513
.611
.450
18I
.438
.596
.512
36EC
.370
.558
.520
57WM
.456
.528
.305
63WM
.423
.550
.366
59WM
.387
.520
.353
39P/0
.359
.495
.348
47WM
.358
.467
.283
55WM
.350
.483
.294
53WM
.333
.504
.435
Eigenvalues
16.33
3.31
2.59
2.00
1.58
1.49
1.28
%of
variance
25.92
5.26
4.12
3.16
2.51
2.36
2.03
Notes.Onlyloadings
abov
e.32arelisted.
I=Inhibit;EC=EmotionalCon
trol;WM
=Working
Mem
ory;
SH
=Shift;P/O
=Plan/Organize.
10 A. H. SKOGAN ET AL.
Dow
nloa
ded
by [
Uni
vers
ity o
f O
slo]
at 0
2:12
04
Dec
embe
r 20
15

new places or situations”; “Has trouble joining in at unfamiliar social events”). A fourthfactor, reflecting primarily the ability to control one’s own behavior, comprised six itemsfrom the Inhibit scale (e.g., “Acts too wild or out of control”; “Talks or plays too loudly”).Three items, all from the Plan/Organize scale, constituted a fifth factor, related to thechild’s ability to find an item (i.e., toys, clothes) by following instructions. Another set ofitems from the Inhibit scale, similar in content to items in the fourth factor (out of controlbehavior), constituted a Factor 6. A closer inspection of the items in these two factorsrevealed that both reflect wild, uncontrolled behavior; the “new” factor differed from theother, however, by the inclusion of a comparison with other children (e.g., “Gets out ofcontrol more than playmates”; “Has to be more closely supervised than similar play-mates”). Possibly, this refers to difficulties observed primarily in social interaction andplay settings. The last factor comprised six items from the Working Memory subscaletogether with one item from the Plan/Organize subscale; all related to the monitoring ofone’s own task-oriented behavior (e.g., “Is unaware when he/she performs a task right orwrong”; “Cannot stay on the same topic when talking”). An inspection of the pattern andstructure matrices indicated good discrimination between factors, with only one cross-loading (Item 18: “Acts wilder or sillier than others in groups”) in Factor 6 showed asecondary loading on the fourth factor. When the number of factors were restricted tothree in a second EFA, items from the Working Memory, Plan/Organize, and Inhibitsubscales combined into a first factor, items from the Emotional Control and Inhibitsubscales combined into a second factor, and a third factor comprised four items from theShift subscale without any contribution from the other four subscales. Together, thesethree factors explained 35.3% of the total variance.
DISCUSSION
In the present study, we investigated the factor structure of EF in 3-year old childrenas measured by the BRIEF-P. Prior research was replicated and extended through acombination of CFA and EFA in a large, nonreferred sample of 3-year-old children.The second-order, three-factor model of EF proposed by the BRIEF-P authors proved abetter fit to data than the two alternative, one-factor solutions. However, the difference infit between this retained model and the second-order one-factor model was marginal. Theexploratory analysis supported the presence of several underlying factors in our sample.EFA yielded seven interpretable factors, showing considerable overlap with the originallyproposed five first-order factors in the BRIEF-P. Taken together, our results suggest thatsome differentiation in EF has taken place at age 3 years, which is reflected in parentratings of behavior.
The empirically based BRIEF-P subscales showed acceptable levels of internalconsistencies, with alpha values very close to those previously reported, both in thenormative sample (Isquith et al., 2004) and in two other studies that included childrenaged 2–6 years (Bonillo et al., 2012; Duku & Vaillancourt, 2013).
Contrary to our expectations, confirmatory factor analyses yielded support for theproposed second-order three-factor structure of EF in our sample. As such, our results arein line with a multifactorial view of early EF as measured by the BRIEF-P in earlypreschool years and with previous preschool studies based on BRIEF-P ratings from bothparents and teachers (Bonillo et al., 2012; Ezpeleta, Granero, Penelo, De La Osa, &Domenech, 2013; Isquith et al., 2004). The marginal difference in fit between our twosecond-order models (three-factor versus one-factor) suggests, however, that patterns of
FACTOR STRUCTURE OF BRIEF-P AT AGE THREE YEARS 11
Dow
nloa
ded
by [
Uni
vers
ity o
f O
slo]
at 0
2:12
04
Dec
embe
r 20
15
item interrelations in the present sample may not be very different from those described inprevious factorial studies suggesting a unidimensional model of early EF (Wiebe et al.,2011; Willoughby et al., 2010). Moderate-to-strong factor intercorrelations on the second-order level indicate that the EF components, as they are defined in the BRIEF-P, areclosely related in our sample and are possibly less differentiated than in the entirepreschool-age span (Isquith et al., 2004).
Although acceptable, neither of the two best-fitting factorial solutions proved agood fit to data in our young sample (Table 2). Frequently used in CFA studies, post hocmodifications may be valuable in improving a given theoretical model’s ability to capturepatterns of structural interrelations. For our purposes, however, complementary analyseswith a data-driven approach was considered more useful, given the scarcity of previousresearch on the structure of EF as measured by the BRIEF-P at age 3 years. As theconfirmatory and exploratory analyses were conducted in the same sample, informationregarding item and factor interrelations from the EFAs was used to shed light on possiblereasons for the modest fit between data and the two best-fitting models from the CFAs. Ofthe seven factors identified in EFA, four consisted of items from only one of the subscales,while three contained one or two items from a second subscale. As such, the identifiedfactors did not depart substantially from factors constituting the first-order level of theBRIEF-P model of EF in our young sample. The EFA results identified, however, twoadditional factors. The discrepancy with regard to the original model (Isquith et al., 2004)seems primarily to be the partition of the Inhibit items into three subcomponents in ourdata: (a) sustained attention, (b) behavior control, and (c) behavior control in socialsettings. This partition bears a clear resemblance to the distinction between the monitoringof task performance and of one’s behavior (self-monitoring) previously described in theschool-age version (BRIEF; Gioia & Isquith, 2002; Gioia, Isquith, Retzlaff, & Espy,2002), which has led to a change from two to three postulated second-order factors. Afactor analytic study of the BRIEF in a mixed healthy and clinical school-aged sampleconfirmed this subdivision, noting that behavior regulation in a social context is likely tobe more influenced by emotions than is task-oriented behavior (Egeland & Fallmyr,2010). The concepts of “hot” and “cool” EF, separating regulative processes elicited inaffect-laden situations from those implicated in emotional neutral settings, has gainedgrowing research interest in recent years (Hongwanishkul, Happaney, Lee, & Zelazo,2005). There is also a parallel between the described partition of the first-order Inhibitfactor in the present sample and the reported multidimensionality in the Inhibit subscale(Duku & Vaillancourt, 2013).
The forced three-factor solution in the second EFA suggested a somewhat differentpattern of factor interrelations in BRIEF-P ratings of the youngest preschool children,relative to findings from studies of the preschool group as a whole. The difference incontent of the three second-order factors in this analysis versus the ones prespecified inthe second-order three-factor model was related primarily to the combination of itemsfrom the Inhibit and Working Memory into a single, first factor, and to the splitting of theEmotional Control, and Shift subscales into two, separate factors in our sample. The factorrelated to emotional control was the one explaining the second largest proportion of thetotal variance, and one of the two most clearly differentiated factors in the exploratoryanalysis. This finding speaks for the significance of emotion regulation as a separate factorfrom early on in EF development, and for taking the emotional control dimension intoconsideration when describing and interpreting young children’s executive behavior bothin everyday situations and in clinical assessment. Previous theoretical conceptualizations
12 A. H. SKOGAN ET AL.
Dow
nloa
ded
by [
Uni
vers
ity o
f O
slo]
at 0
2:12
04
Dec
embe
r 20
15

of EF structure have to a large extent rely on performance-based measures(Hongwanishkul et al., 2005). Few of these have integrated, let alone investigated infactor analyses, emotional regulation as part of a general EF construct.
Recent research indicates that early EF development is characterized by both differ-entiation and integration of core executive processes (Lee et al., 2013). Results from thefactor analyses in the present study do not support a unidimensional conceptualization ofearly EF as measured by the BRIEF-P. At the same time, we cannot rule out the possibilitythat a major proportion of variance in the BRIEF-P scores may be tracked down to ameaningful, single EF factor in the youngest preschool children. The seven factors in theEFA explained less than half of the total variance; with three factors, only about one third ofthe variance in BRIEF-P scores was accounted for. These low figures may be taken to meanthat the reaction patterns inherent in the factors are not yet stable and consistent. It is likelythat what we observe, comparing models differing in complexity at this early stage in EFdevelopment, can best be described as an initial stage of progress towards a more stable,multilevel executive system as it is outlined in Miyake’s integrative model of EF (Miyakeet al., 2000). This interpretation is supported by studies of neurological correlates todeveloping EF, showing progressive functional segregation and integration throughoutchildhood (Rubia, 2013). At this early stage in the differentiation process, EF componentsmay operate more independently (Anderson, 2002). During the preschool period, these earlyregulatory capacities then develop further, into more complex, integrated processes, whichbecome reliably identifiable first at a later stage in development.
Taken together, the present findings have several implications considered relevant forresearch on EF development, and for the clinical assessment of EF in young children. Ourresults suggest that early forms of EF processes as measured by parent ratings are differentiatedand identifiable as early as age 3. Further, that EF subprocessesmay bemeaningfully assessed inyoung preschool children by the use of developmentally appropriate behavioral descriptions. Alarge proportion of unexplained variance in the exploratory analyses of the BRIEF-P inventoryindicate, however, that emerging self-regulatory skills are still unstable and subject to consider-able extraneous variation at this early point in development. Labels used to characterize specificEF subdomains should be interpreted with caution. This is illustrated by the differentiation inour results between possible subcomponents in the BRIEF-P Inhibit scale (i.e., attentionalcontrol or regulation of social- or task-oriented behaviors) and, on the other hand, the closerelationship between items from the Plan/Organize subscale and items in the Working Memorysubscale. Finally, our results indicate that the presence or absence of emotional cues may act as asalient, organizing factor from early on in the development of EF. The inclusion of “hot” EFtasks in assessments of children’s self-regulatory capacities may thus add important informationabout early EF in both research and clinical settings.
Strengths and Limitations
The following strengths and limitations should be taken into consideration evaluat-ing findings from the present study. Among its particular strengths is the large samplesize, allowing for analyses of complex, multilevel factor structures. Circumventing meth-odological problems, such as divergent operationalization and measurement of EF, simi-larities and differences may more reliably be ascribed to structural aspects of thecompared factorial solutions. The narrow age range in the present sample offers a uniqueopportunity to draw some conclusions regarding EF structure at age 3. At the same time,it limits the generalizability of the findings to the youngest preschool children.
FACTOR STRUCTURE OF BRIEF-P AT AGE THREE YEARS 13
Dow
nloa
ded
by [
Uni
vers
ity o
f O
slo]
at 0
2:12
04
Dec
embe
r 20
15
Children were selected for participation in the present study through a two-stepprocess; first into the MoBa study, and then from MoBa into the longitudinal ADHDstudy. Both screening procedures may have influenced our results. The relatively lowparticipation rates in the MoBa cohort and in the longitudinal ADHD study (45% and35%, respectively) are likely to have resulted in an underrepresentation of children fromhigh-risk families (low-socioeconomic status, young mothers, single-parent families,smoking during pregnancy) and possibly of children with the most severe behavioraland cognitive problems (Nilsen et al., 2009; Overgaard, Aase, Torgersen, & Zeiner,2012). Comparing mothers from the MoBa with mothers of children participating in ourstudy, we found that the mothers of the children in the present study reported slightlyhigher educational levels (mean = 15.3 years versus mean = 14.9 years). Parentaleducation has frequently been linked to both child IQ and behavioral difficulties; a similartrend is therefore likely, also with regard to other variables of interest in the second step ofthe sampling process. The oversampling of children with elevated levels of ADHD-relateddifficulties from the MoBa sample into the present substudy may have affected estimatesof relationships between variables under study through restricted variance. Investigationsof exposure-outcome relations in MoBa versus the population and in a similar Danishbirth cohort suggest, however, that the effects that these two screening steps may have hadon the present results are limited and not likely to represent a validity problem (Greene,Greenland, Olsen, & Nohr, 2011; Nilsen et al., 2013).
As only parent ratings were included here, findings may not apply to the use of theinventory by teachers. Evidence have so far been inconclusive with regard to possibledifferences in the structural organization of EF in normally developing children versuschildren with psychiatric symptoms (Delis, Jacobson, Bondi, Hamilton, & Salmon, 2003;Gioia, Isquith, Retzlaff, & Espy, 2002). Thus, the generalizability of the present findingsmay be limited with regard to normally developing preschool children. The findings are,however, considered to be highly relevant in clinical settings, addressing relationsbetween EF ratings and psychiatric symptoms in a group of children with behavioraldifficulties sufficient to raise concern in their parents.
CONCLUSIONS
In the present study, the second-order three-factor model of BRIEF-P proposed bythe BRIEF-P authors was found to capture the structural organization of EF better thantwo competing, one-factor models in a large sample of nonreferred 3-year-olds. Thepresence of several EF subcomponents was confirmed in exploratory analyses. Ourfindings thus suggest that some differentiation in EF has taken place at age 3 years,which is reflected in parents’ perceptions of behavior. Our findings support the internalconsistency of the BRIEF-Ps five clinical subscales but indicate that subscale interrela-tions at age 3 years may differ from those observed in the preschool group as a whole.Labels used to characterize specific EF subdomains should be interpreted with cautionwhen assessing EF in young preschool children.
Original manuscript received July 3, 2014Revised manuscript accepted November 23, 2014
First published online January 6, 2015
14 A. H. SKOGAN ET AL.
Dow
nloa
ded
by [
Uni
vers
ity o
f O
slo]
at 0
2:12
04
Dec
embe
r 20
15
REFERENCES
Achenbach, T. M., & Ruffle, T. M. (2000). The child behavior checklist and related forms forassessing behavioral/emotional problems and competencies. Pediatric Review, 21, 265–271.doi:10.1542/pir.21-8-265
American Psychiatric Association. (2000). Diagnostic and statistical manual of mental disorders(4th ed., text rev). Washington, DC: Author.
Anderson, P. (2002). Assessment and development of executive function (EF) during childhood.Child Neuropsychology, 8, 71–82. doi:10.1076/chin.8.2.71.8724
Best, J. R., & Miller, P. H. (2010). A developmental perspective on executive function. ChildDevelopment, 81, 1641–1660. doi:10.1111/j.1467-8624.2010.01499.x
Bonillo, A., Araujo Jimenez, E. A., Jane Ballabriga, M. C., Capdevila, C., & Riera, R. (2012).Validation of Catalan version of BRIEF-P. Child Neuropsychology, 18, 347–355.
Byrne, B. M. (2005). Factor analytic models: Viewing the structure of an assessment instrumentfrom three perspectives. Journal of Personality Assessment, 85, 17–32. doi:10.1207/s15327752jpa8501_02
Byrne, B. M. (2012). Structural equation modeling with Mplus. New York, NY: Routledge.Carlson, S. M. (2005). Developmentally sensitive measures of executive function in preschool
children. Developmental Neuropsychology, 28, 595–616. doi:10.1207/s15326942dn2802_3Carlson, S. M., & Moses, L. J. (2001). Individual differences in inhibitory control and children’s
theory of mind. Child Development, 72, 1032–1053. doi:10.1111/1467-8624.00333Delis, D. C., Jacobson, M., Bondi, M. W., Hamilton, J. M., & Salmon, D. P. (2003). The myth of
testing construct validity using factor analysis or correlations with normal or mixed clinicalpopulations: Lessons from memory assessment. Journal of the InternationalNeuropsychological Society, 9, 936–946. doi:10.1017/S1355617703960139
Donders, J., DenBraber, D., & Vos, L. (2010). Construct and criterion validity of the behaviourrating inventory of executive function (BRIEF) in children referred for neuropsychologicalassessment after paediatric traumatic brain injury. Journal of Neuropsychology, 4, 197–209.doi:10.1348/174866409X478970
Duku, E., & Vaillancourt, T. (2013). Validation of the BRIEF-P in a sample of Canadian preschoolchildren. Child Neuropsychology. Advance online publication. doi:10.1080/09297049.2013.796919.
Egeland, J., & Fallmyr, O. (2010). Confirmatory factor analysis of the behavior rating inventory ofexecutive function (BRIEF): Support for a distinction between emotional and behavioralregulation. Child Neuropsychology, 16, 326–337. doi:10.1080/09297041003601462
Egger, H., & Angold, A. (2004). The preschool age psychiatric assessment (PAPA): A structuredparent interview for diagnosing psychiatric disorders in preschool children. In R. Del Carmen-Wiggins & A. Carter (Eds.), Handbook of infant, toddler and preschool mental health assess-ment (pp. 223–243). New York, NY: Oxford University Press.
Egger, H. L., & Angold, A. (2006). Common emotional and behavioral disorders in preschoolchildren: Presentation, nosology, and epidemiology. Journal of Child Psychology andPsychiatry and Allied Disciplines, 47, 313–337. doi:10.1111/j.1469-7610.2006.01618.x
Espy, K. A., Kaufmann, P. M., & Glisky, M. L. (2001). New procedures to assess executivefunctions in preschool children. Clinical Neuropsychology, 15, 46–58. doi:10.1076/clin.15.1.46.1908
Espy, K. A., Kaufmann, P. M., McDiarmid, M. D., & Glisky, M. L. (1999). Executive functioning inpreschool children: Performance on A-not-B and other delayed response format tasks. Brainand Cognition, 41, 178–199. doi:10.1006/brcg.1999.1117
Espy, K. A., Sheffield, T. D., Wiebe, S. A., Clark, C. A., & Moehr, M. J. (2011). Executive controland dimensions of problem behaviors in preschool children. Journal of Child Psychology andPsychiatry and Allied Disciplines, 52, 33–46. doi:10.1111/j.1469-7610.2010.02265.x
FACTOR STRUCTURE OF BRIEF-P AT AGE THREE YEARS 15
Dow
nloa
ded
by [
Uni
vers
ity o
f O
slo]
at 0
2:12
04
Dec
embe
r 20
15

Ezpeleta, L., Granero, R., De La Osa, N., Penelo, E., & Domènech, J. M. (2012). Dimensions ofoppositional defiant disorder in 3-year-old preschoolers. Journal of Child Psychology andPsychiatry and Allied Disciplines, 53, 1128–1138. doi:10.1111/j.1469-7610.2012.02545.x
Ezpeleta, L., Granero, R., Penelo, E., De La Osa, N., & Domenech, J. M. (2013). Behavior ratinginventory of executive functioning-preschool (BRIEF-P) applied to teachers: Psychometricproperties and usefulness for disruptive disorders in 3-year-old preschoolers. Journal ofAttention Disorders. Advance online publication. doi:10.1177/1087054712466439.
Field, A. (2009). Discovering statistics using SPSS. (2 ed.). London: Sage.Garon, N., Bryson, S. E., & Smith, I. M. (2008). Executive function in preschoolers: A review using
an integrative framework. Psychological Bulletin, 134(1), 31–60. doi:10.1037/0033-2909.134.1.31
Gioia, G., Espy, K. A., & Isquith, P. K. (2003). Behavior rating inventory of executive function-preschool version. Norwegian manual supplement 2007. Lutz, FL: Psychological AssessmentResources.
Gioia, G., & Isquith, P. K. (2002). Abstracts presented at the thirtieth annual international neurop-sychological society conference. Journal of the International Neuropsychological Society, 8,143–321.
Gioia, G. A., Espy, K. A., & Isquith, P. K. (2002). Behavior rating inventory of executive function,preschool version (BRIEF-P). Odessa, FL: Psychological Assessment Resources.
Gioia, G. A., Isquith, P. K., Guy, S. C., & Kenworthy, L. (2000). Behavior rating inventory ofexecutive function. Child Neuropsychology, 6, 235–238. doi:10.1076/chin.6.3.235.3152
Gioia, G. A., Isquith, P. K., Kenworthy, L., & Barton, R. M. (2002). Profiles of everyday executivefunction in acquired and developmental disorders. Child Neuropsychology, 8, 121–137.doi:10.1076/chin.8.2.121.8727
Gioia, G. A., Isquith, P. K., Retzlaff, P. D., & Espy, K. A. (2002). Confirmatory factor analysis ofthe behavior rating inventory of executive function (BRIEF) in a clinical sample. ChildNeuropsychology, 8, 249–257. doi:10.1076/chin.8.4.249.13513
Greene, N., Greenland, S., Olsen, J., & Nohr, E. A. (2011). Estimating bias from loss to follow-up inthe Danish National Birth Cohort. Epidemiology, 22, 815–822.
Hill, A. L., Degnan, K. A., Calkins, S. D., & Keane, S. P. (2006). Profiles of externalizing behaviorproblems for boys and girls across preschool: The roles of emotion regulation and inattention.Developmental Psychology, 42, 913–928. doi:10.1037/0012-1649.42.5.913
Hongwanishkul, D., Happaney, K. R., Lee, W. S., & Zelazo, P. D. (2005). Assessment of hot andcool executive function in young children: Age-related changes and individual differences.Developmental Neuropsychology, 28, 617–644. doi:10.1207/s15326942dn2802_4
Hovik, K. T., Egeland, J., Isquith, P. K., Gioia, G., Skogli, E. W., & Andersen, P. N. et al. (2014).Distinct patterns of everyday executive function problems distinguish children with Tourettesyndrome from children with ADHD or autism spectrum disorders. Journal of AttentionDisorders, Advance online publication. doi:10.1177/1087054714550336.
Hughes, C., Ensor, R., Wilson, A., & Graham, A. (2010). Tracking executive function across thetransition to school: A latent variable approach. Developmental Neuropsychology, 35(1), 20–36. doi:10.1080/87565640903325691
Huizinga, M., Dolan, C. V., & van der Molen, M. W. (2006). Age-related change in executivefunction: Developmental trends and a latent variable analysis. Neuropsychologia, 44, 2017–2036. doi:10.1016/j.neuropsychologia.2006.01.010
Isquith, P. K., Gioia, G. A., & Espy, K. A. (2004). Executive function in preschool children:Examination through everyday behavior. Developmental Neuropsychology, 26, 403–422.doi:10.1207/s15326942dn2601_3
Lamm, C., & Lewis, M. D. (2010). Developmental change in the neurophysiological correlates ofself-regulation in high- and low-emotion conditions. Developmental Neuropsychology, 35,156–176. doi:10.1080/87565640903526512
16 A. H. SKOGAN ET AL.
Dow
nloa
ded
by [
Uni
vers
ity o
f O
slo]
at 0
2:12
04
Dec
embe
r 20
15
Lee, K., Bull, R., & Ho, R. M. (2013). Developmental changes in executive functioning. ChildDevelopment. Advance online publication. doi:10.1111/cdev.12096.
Lehto, J. E., Juujaervi, P., Kooistra, L., & Pulkkinen, L. (2003). Dimensions of executive function-ing. Evidence from children. British Journal of Developmental Psychology, 21, 59–80.doi:10.1348/026151003321164627
Magnus, P., Irgens, L. M., Haug, K., Nystad, W., Skjaerven, R., & Stoltenberg, C. (2006). Cohortprofile: The Norwegian mother and child cohort study (MoBa). International Journal ofEpidemiology, 35, 1146–1150. doi:10.1093/ije/dyl170
Mahone, E. M., & Hoffman, J. (2007). Behavior ratings of executive function among preschoolerswith ADHD. Clinical Neuropsychology, 21, 569–586. doi:10.1080/13854040600762724
Marsh, H. W., Hau, K., & Wen, Z. (2004). In search of golden rules: Comment on hypothesis-testingapproaches to setting cutoff values for fit indexes and danger in overgeneralizing Hu andBentler’s (1999) findings. Structural Equation Modeling, 11, 320–341. doi:10.1207/s15328007sem1103_2
Miller, M. R., Giesbrecht, G. F., Müller, U., McInerney, R. J., & Kerns, K. A. (2012). A latentvariable approach to determining the structure of executive function in preschool children.Journal of Cognition and Development, 13, 395–423. doi:10.1080/15248372.2011.585478
Miyake, A., Friedman, N. P., Emerson, M. J., Witzki, A. H., Howerter, A., & Wager, T. D. (2000).The unity and diversity of executive functions and their contributions to complex “FrontalLobe” tasks: A latent variable analysis. Cognitive Psychology, 41, 49–100. doi:10.1006/cogp.1999.0734
Nadebaum, C., Anderson, V., & Catroppa, C. (2007). Executive function outcomes followingtraumatic brain injury in young children: A five year follow-up. DevelopmentalNeuropsychology, 32, 703–728. doi:10.1080/87565640701376086
Nicholas, J., & Solbakk, A. K. (2006). BRIEF-P Norwegian manual supplement. Lutz, FL:Psychological Assessment Resources.
Nilsen, R. M., Suren, P., Gunnes, N., Alsaker, E. R., Bresnahan, M., & Hirtz, D., et al. (2013).Analysis of self-selection bias in a population-based cohort study of autism spectrum disorders.Paediatric and Perinatal Epidemiology, 27, 553–563. doi:10.1111/ppe.12077
Nilsen, R. M., Vollset, S. E., Gjessing, H. K., Skjaerven, R., Melve, K. K., & Schreuder, P., et al.(2009). Self-selection and bias in a large prospective pregnancy cohort in Norway. Paediatricand Perinatal Epidemiology, 23, 597–608. doi:10.1111/j.1365-3016.2009.01062.x
Overgaard, K. R., Aase, H., Torgersen, S., & Zeiner, P. (2012). Co-occurence of ADHD and anxietyin preschool children. Journal of Attention Disorders. Advance online publication.doi:10.1177/1087054712463063.
Pauli-Pott, U., & Becker, K. (2011). Neuropsychological basic deficits in preschoolers at risk forADHD: A meta-analysis. Clinical Psychology Review, 31, 626–637. doi:10.1016/j.cpr.2011.02.005
Posner, M. I., Rothbart, M. K., Sheese, B. E., & Voelker, P. (2012). Control networks andneuromodulators of early development. Developmental Psychology, 48, 827–835.doi:10.1037/a0025530
Rubia, K. (2013). Functional brain imaging across development. European Child and AdolescentPsychiatry, 22, 719–731. doi:10.1007/s00787-012-0291-8
Tabachnick, B. G., & Fidell, L. S. (2007). Using multivariate statistics (5th ed.). Boston, MA:Pearson.
Teunisse, J. P., Roelofs, R. L., Verhoeven, E. W., Cuppen, L., Mol, J., & Berger, H. J. (2012).Flexibility in children with autism spectrum disorders (ASD): Inconsistency between neurop-sychological tests and parent-based rating scales. Journal of Clinical and ExperimentalNeuropsychology, 34, 714–723. doi:10.1080/13803395.2012.670209
Tsujimoto, S. (2008). The prefrontal cortex: Functional neural development during early childhood.Neuroscientist, 14, 345–358. doi:10.1177/1073858408316002
FACTOR STRUCTURE OF BRIEF-P AT AGE THREE YEARS 17
Dow
nloa
ded
by [
Uni
vers
ity o
f O
slo]
at 0
2:12
04
Dec
embe
r 20
15
van der Ven, S. H., Kroesbergen, E. H., Boom, J., & Leseman, P. P. (2013). The structure of executivefunctions in children: A closer examination of inhibition, shifting, and updating. British Journal ofDevelopmental Psychology, 31, 70–87. doi:10.1111/j.2044-835X.2012.02079.x
Wasserman, T., & Wasserman, L. D. (2013). Toward an integrated model of executive functioning inchildren. Applied Neuropsychology Child, 2, 88–96. doi:10.1080/21622965.2013.748394
Watkins, M. W. (2002). Monte Carlo PCA for parallel analysis [Computer software]. State College,PA: Ed & Psych Associates.
Welsh, M. C., Pennington, B. F., & Groisser, D. B. (1991). A normative-developmental study ofexecutive function: A window on prefrontal function in children. DevelopmentalNeuropsychology, 7, 131–149. doi:10.1080/87565649109540483
Wichstrom, L., Berg-Nielsen, T. S., Angold, A., Egger, H. L., Solheim, E., & Sveen, T. H. (2012).Prevalence of psychiatric disorders in preschoolers. Journal of Child Psychology andPsychiatry and Allied Disciplines, 53, 695–705. doi:10.1111/j.1469-7610.2011.02514.x
Wiebe, S. A., Sheffield, T., Nelson, J. M., Clark, C. A., Chevalier, N., & Espy, K. A. (2011). Thestructure of executive function in 3-year-olds. Journal of Experimental Child Psychology, 108,436–452. doi:10.1016/j.jecp.2010.08.008
Willoughby, M. T., Blair, C. B., Wirth, R. J., & Greenberg, M. (2010). The measurement ofexecutive function at age 3 years: Psychometric properties and criterion validity of a newbattery of tasks. Psychological Assessment, 22, 306–317. doi:10.1037/a0018708
Zelazo, P. D., Muller, U., Frye, D., Marcovitch, S., Argitis, G., & Boseovski, J., et al. (2003). Thedevelopment of executive function in early childhood. Monographs for the Society forResearch in Child Development, 68, vii–viii. doi:10.1111/j.0037-976X.2003.00260.x
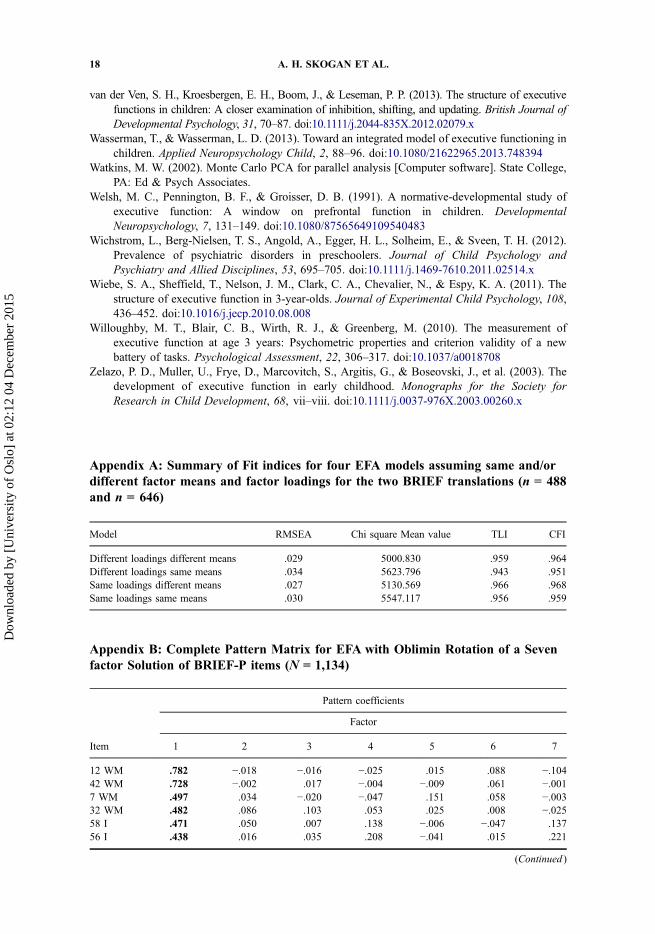
Appendix A: Summary of Fit indices for four EFA models assuming same and/ordifferent factor means and factor loadings for the two BRIEF translations (n = 488and n = 646)
Appendix B: Complete Pattern Matrix for EFA with Oblimin Rotation of a Sevenfactor Solution of BRIEF-P items (N = 1,134)
Model RMSEA Chi square Mean value TLI CFI
Different loadings different means .029 5000.830 .959 .964Different loadings same means .034 5623.796 .943 .951Same loadings different means .027 5130.569 .966 .968Same loadings same means .030 5547.117 .956 .959
Pattern coefficients
Factor
Item 1 2 3 4 5 6 7
12 WM .782 −.018 −.016 −.025 .015 .088 −.10442 WM .728 −.002 .017 −.004 −.009 .061 −.0017 WM .497 .034 −.020 −.047 .151 .058 −.00332 WM .482 .086 .103 .053 .025 .008 −.02558 I .471 .050 .007 .138 −.006 −.047 .13756 I .438 .016 .035 .208 −.041 .015 .221
(Continued )
18 A. H. SKOGAN ET AL.
Dow
nloa
ded
by [
Uni
vers
ity o
f O
slo]
at 0
2:12
04
Dec
embe
r 20
15

Appendix B (Continued).
Pattern coefficients
Factor
Item 1 2 3 4 5 6 7
61 WM .385 .042 .020 .201 −.031 .059 .15949 P/O .351 .081 −.012 .140 .142 −.095 .05929 P/O .269 .049 .042 −.096 .143 .047 .17051 WM .225 .007 .006 .076 .215 .028 .18016 EC .052 .668 −.062 .015 .079 .047 −.0011 EC .040 .645 −.007 −.067 .020 −.005 .0186 EC −.031 .628 .084 .054 −.007 .107 −.10021 EC .022 .609 .040 .016 .029 .010 .01726 EC −.003 .598 −.011 .045 .078 .010 .07511 EC .009 .525 .178 .013 .022 −.027 .01031 EC .042 .519 .023 .062 −.067 .049 −.01520 S .002 .006 .867 −.021 .005 −.074 −.01110 S −.040 .004 .695 −.018 −.024 −.033 −.03040 S .015 −.062 .578 .010 .042 .131 .0155 S −.019 .133 .452 −.010 −.003 −.002 .02452 I .074 .034 −.005 .550 .034 .204 −.14048 I .022 .076 −.023 .546 .074 −.048 −.01460 I .014 .035 .032 .505 .046 −.028 .16254 I .059 .008 −.005 .413 .064 .047 .00162 I .018 −.050 .034 .388 −.009 .135 .08823 I .202 .053 −.029 .328 −.026 .077 −.04750 SH .085 .003 .133 .265 .014 .144 .04828 I .116 .046 −.014 .245 −.082 .130 .04722 WM .150 .079 .020 .208 .146 −.079 .18819 P/O −.020 .009 −.002 .013 .825 .011 −.10044 P/O −.036 .010 .051 .007 .741 −.046 .00214 P/O .040 −.038 .010 −.074 .320 .068 .1572 WM .172 .042 .008 −.001 .174 −.018 .07743 I .030 .239 −.002 .128 .018 .601 .00113 I .163 −.048 .075 −.070 −.032 .513 .06818 I .011 −.055 −.061 .333 .123 .438 −.08636 EC .005 .297 .143 −.027 −.011 .370 .06357 WM .040 .022 .066 .011 −.001 .003 .45663 WM −.002 −.093 .042 .049 .025 .027 .42359 WM .032 −.006 .033 .009 .154 .081 .38739 P/O .035 .086 −.018 −.018 −.001 −.034 .35947 WM .026 .019 .010 .065 −.021 .029 .35855 WM .035 .007 .036 −.008 .086 .079 .35053 WM .315 .047 .082 .062 .150 .014 .33327 WM .220 .000 .021 −.048 .107 .103 .22517 WM .179 .045 .000 .010 .167 .076 .1918 I −.033 .036 .052 .125 .068 .076 .18045 SH −.003 −.012 .012 .025 −.028 −.050 .01815 SH .093 .051 .015 .026 −.009 .021 −.04830 SH −.017 −.050 .078 −.052 .052 .053 −.00846 EC −.051 .179 .016 −.017 .023 .075 .11735 SH −.061 .041 .004 .057 .064 .111 .11125 SH .091 .028 .132 .087 .042 −.048 −.007
(Continued )
FACTOR STRUCTURE OF BRIEF-P AT AGE THREE YEARS 19
Dow
nloa
ded
by [
Uni
vers
ity o
f O
slo]
at 0
2:12
04
Dec
embe
r 20
15

Appendix C: Complete Structure Matrix for EFA with Oblimin Rotation of a Seven-Factor Solution of BRIEF-P items (N = 1,134)
Structure coefficients
Factor
Item 1 2 3 4 5 6 7
12 WM .787 .191 .149 .331 .319 .296 .28142 WM .767 .204 .168 .333 .320 .276 .34358 I .652 .247 .182 .422 .342 .238 .4327 WM .635 .251 .147 .282 .433 .260 .33961 WM .622 .251 .187 .488 .336 .339 .44732 WM .622 .290 .243 .337 .345 .232 .30349 P/O .607 .321 .164 .426 .463 .197 .39656 I .571 .176 .171 .415 .256 .250 .42951 WM .484 .231 .192 .333 .477 .255 .45129 P/O .453 .248 .233 .194 .404 .233 .4132 WM .428 .226 .156 .281 .416 .210 .3511 EC .238 .701 .196 .201 .233 .211 .19316 EC .203 .701 .149 .247 .208 .267 .1616 EC .180 .700 .213 .271 .184 .286 .07921 EC .240 .695 .260 .279 .239 .274 .21826 EC .225 .665 .241 .235 .288 .241 .25411 EC .224 .630 .392 .237 .245 .238 .22431 EC .258 .605 .152 .289 .179 .241 .15320 SH .087 .149 .801 .010 .143 .044 .13210 SH .078 .158 .671 .055 .125 .099 .12040 SH .152 .138 .612 .121 .206 .243 .1975 SH .189 .340 .593 .166 .234 .230 .24752 I .387 .318 .154 .739 .269 .500 .19248 I .365 .319 .139 .671 .316 .285 .26960 I .353 .257 .180 .640 .299 .285 .37954 I .385 .304 .166 .638 .319 .364 .299
(Continued )
Appendix B (Continued).
Pattern coefficients
Factor
Item 1 2 3 4 5 6 7
9 P/O .030 .071 −.005 .050 .135 .059 .06333 I .024 .023 .013 .028 .000 .038 −.04438 I −.049 −.007 .005 .056 .009 .016 .0713 I −.004 .139 .013 .000 −.016 −.011 −.01134 P/O .119 .055 .043 .052 .110 −.050 .0144 P/O .107 .033 −.013 .050 .152 −.093 .05824 P/O .029 .056 .030 .125 .024 .112 −.00941 EC −.003 .090 .062 .146 .063 .179 .08437 WM .083 −.021 −.011 .020 .148 .077 .213
Notes. Major loadings for each item are bolded. I = Inhibit; SH = Shift; EC = Emotional Control; WM =Working Memory; P/O = Plan/Organize.
20 A. H. SKOGAN ET AL.
Dow
nloa
ded
by [
Uni
vers
ity o
f O
slo]
at 0
2:12
04
Dec
embe
r 20
15

Appendix C (Continued).
Structure coefficients
Factor
Item 1 2 3 4 5 6 7
23 I .463 .274 .107 .553 .263 .340 .24562 I .323 .163 .115 .549 .237 .353 .28928 1 .407 .284 .129 .501 .241 .373 .29550 SH .347 .259 .323 .470 .276 .406 .31719 P/O .276 .175 .171 .184 .780 .189 .27344 P/O .273 .188 .224 .181 .744 .154 .33914 P/O .300 .110 .158 .155 .471 .232 .38143 I .299 .458 .210 .456 .263 .735 .25313 I .351 .191 .264 .268 .243 .611 .30918 I .302 .195 .096 .555 .304 .596 .20136 EC .265 .507 .386 .288 .272 .558 .30441 EC .203 .228 .225 .296 .225 .356 .25863 WM .305 .128 .218 .293 .323 .248 .55057 WM .283 .174 .230 .197 .281 .183 .52859 WM .322 .125 .177 .225 .396 .246 .52053 WM .485 .199 .221 .271 .397 .189 .50439 P/O .315 .276 .198 .227 .314 .196 .49555 WM .304 .161 .192 .219 .340 .257 .48327 WM .473 .231 .237 .257 .426 .312 .48047 WM .297 .184 .159 .277 .263 .232 .46717 WM .408 .230 .204 .279 .400 .295 .42837 WM .330 .130 .147 .245 .361 .259 .40322 WM .397 .245 .174 .384 .369 .178 .4008 I .165 .157 .163 .233 .219 .207 .28045 SH .146 .261 .296 .176 .169 .210 .22015 SH .195 .282 .305 .181 .167 .262 .18246 EC .095 .307 .198 .116 .166 .216 .21635 SH .153 .241 .204 .205 .247 .270 .26530 SH .098 .132 .240 .082 .168 .188 .14925 SH .171 .152 .276 .150 .156 .119 .1539 P/O .275 .228 .150 .228 .340 .224 .27133 I .330 .326 .213 .430 .279 .329 .26538 I .288 .297 .193 .435 .287 .302 .3283 I .318 .398 .195 .392 .279 .277 .26934 P/O .408 .300 .128 .337 .383 .180 .2834 P/O .372 .197 .030 .278 .370 .097 .27324 P/O .238 .239 .143 .309 .211 .290 .187
Note. I = Inhibit; SH = Shift; EC = Emotional Control; WM = Working Memory; P/O = Plan/Organize.
FACTOR STRUCTURE OF BRIEF-P AT AGE THREE YEARS 21
Dow
nloa
ded
by [
Uni
vers
ity o
f O
slo]
at 0
2:12
04
Dec
embe
r 20
15