Factor-Based Investing - Risk · characteristics – for instance ... Aon Hewitt Factor-Based...
8
Aon Hewitt Retirement and Investment Risk. Reinsurance. Human Resources. Factor-Based Investing
Transcript of Factor-Based Investing - Risk · characteristics – for instance ... Aon Hewitt Factor-Based...

Aon HewittRetirement and Investment
Risk. Reinsurance. Human Resources.
Factor-Based Investing
Aon Hewitt Factor-Based Investing 2
Summary
The right equity portfolio for an investor depends on their risk and return objectives, investment beliefs, cost constraints and governance resource.
Risk-adjusted returns are often considered when setting asset allocation, but can be overlooked
when constructing an equity portfolio, as some equity investors follow market capitalisation
strategies without considering any other approaches beforehand.
There are a number of widely available alternative “factor” based indices using different stock
weighting techniques (often known as “Smart Beta” strategies) which can be attractive in a
number of different scenarios for investors who:
• want to reduce sensitivity to equity market movements through low-volatility investments;
• are seeking different sources of returns but may have governance or cost constraints or
have an aversion to significant active risk;
• are looking to improve potential long-term risk-adjusted returns of an equity portfolio by
investing in a combination of factors.
Market cap doesn’t always fitMarket capitalisation based equity portfolios provide exposure
to each company in weights equal to the value of the shares
available to investors. For a number of reasons passive equity
investments constructed in this way remain popular. They are
easy for investors to understand and can provide liquid
exposure to global equity markets at a relatively low cost.
However, both active managers and supporters of factor
investing question why investors should hold more of an asset
just because it is large in size, or has performed well recently.
Capturing a factorThere are a number of different ways to construct equity indices
which do not follow a market capitalisation weighting method,
which have been designed to keep fairly constant exposure to a
specific factor using a rules-based approach. These include
approaches which weight stocks based on certain
characteristics – for instance company accounting ratios or
stocks which have exhibited low volatility.
In this paper we focus on two factors, “value” and “low
volatility” and it is the exposure to a particular factor which
drives performance from this type of investing. Selecting and
combining appropriate factors can also provide the benefits of
capturing the long-term risk premium for each factor, whilst
dampening volatility over shorter periods.
The right approach will depend on an investor’s circumstances
and we have helped a number of clients tailor their equity
allocations based on their objectives. The following scenarios
illustrate how factor investing can be used to achieve this.
Factor-Based Investing

Aon Hewitt Factor-Based Investing 3
Scenario 1: Risk reductionAn investor who requires the outperformance associated with
equities, but with an objective to reduce equity portfolio
volatility, could consider one of the low volatility approaches.
The relative liquidity and low cost of a low volatility equity
portfolio compared to some alternative asset classes can be
attractive. This can be particularly important for pension
schemes which have implemented a structured de-risking
plan involving a gradual reduction in exposure to higher
returning asset classes.
The “Minimum Variance” method is a common approach to
low volatility investing. Minimum Variance portfolios allocate to
companies which are not necessarily low volatility stocks in
isolation but, when combined in a portfolio, achieve an
aggregate reduction in volatility.
This is illustrated below, by comparing the volatility of the MSCI
World Minimum Volatility index (a minimum variance approach)
to the MSCI World index (a market capitalisation index) over 15
calendar years.
1 As at 31 December 2015
Ann
ual V
olat
ility
(%
)
20
15
10
5
02001 2002 2003 2004 2005 2006 2007 2008 2009 2010 2011 2012 2013 2014 2015
Board
Calendar year volatility
MSCI Index: MSCI World Minimum Volatility-ND MSCI Index: MSCI World-ND
The graph below also demonstrates how a minimum variance
approach has the potential to protect during equity market
downturns over the same period.
The fall in value (“drawdown”) associated with the minimum
variance approach is lower than a comparable market
capitalisation index.
-45.0%
-40.0%
-35.0%
-30.0%
-25.0%
-20.0%
-15.0%
-10.0%
-5.0%
0.0%
Jan
01
Jan
02
Jan
03
Jan
04
Jan
05
Jan
06
Jan
07
Jan
08
Jan
09
Jan
10
Jan
11
Jan
12
Jan
13
Jan
14
Jan
15
Jan
16
Cumulative drawdown
MSCI World Min Volatility MSCI World
Aon Hewitt Factor-Based Investing 4
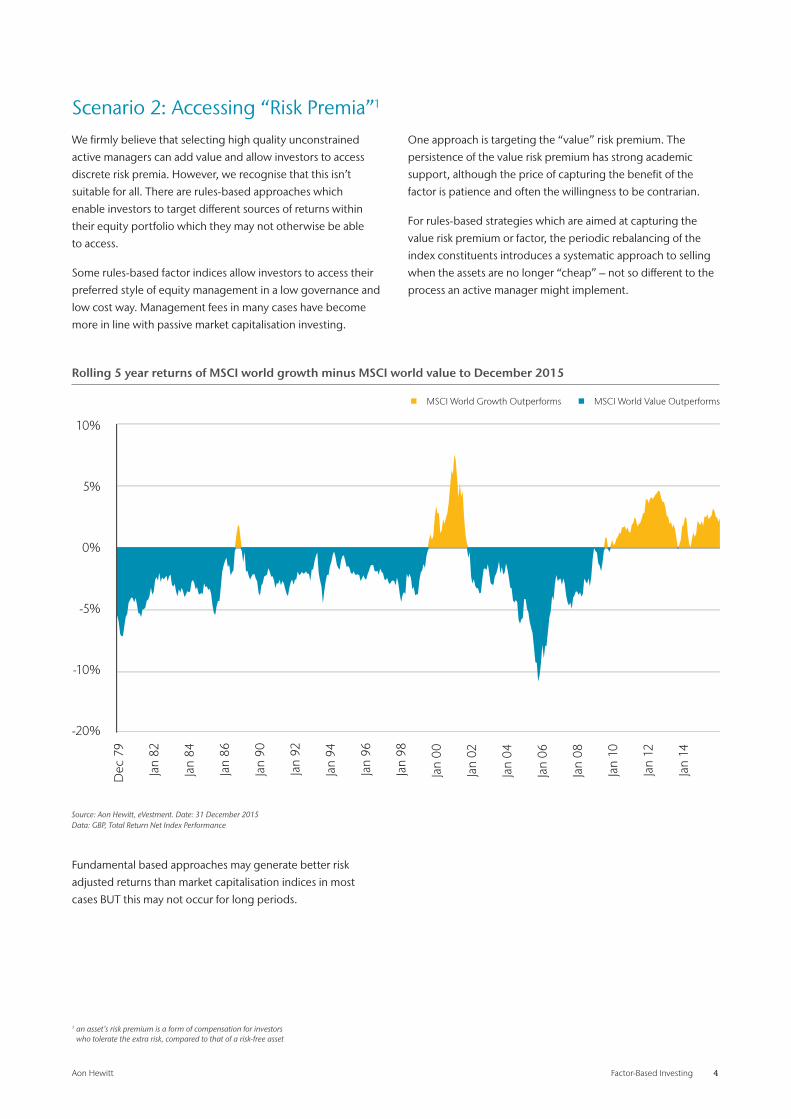
Scenario 2: Accessing “Risk Premia”1
We firmly believe that selecting high quality unconstrained
active managers can add value and allow investors to access
discrete risk premia. However, we recognise that this isn’t
suitable for all. There are rules-based approaches which
enable investors to target different sources of returns within
their equity portfolio which they may not otherwise be able
to access.
Some rules-based factor indices allow investors to access their
preferred style of equity management in a low governance and
low cost way. Management fees in many cases have become
more in line with passive market capitalisation investing.
One approach is targeting the “value” risk premium. The
persistence of the value risk premium has strong academic
support, although the price of capturing the benefit of the
factor is patience and often the willingness to be contrarian.
For rules-based strategies which are aimed at capturing the
value risk premium or factor, the periodic rebalancing of the
index constituents introduces a systematic approach to selling
when the assets are no longer “cheap” – not so different to the
process an active manager might implement.
1 an asset’s risk premium is a form of compensation for investors who tolerate the extra risk, compared to that of a risk-free asset
Fundamental based approaches may generate better risk
adjusted returns than market capitalisation indices in most
cases BUT this may not occur for long periods.
10%
5%
0%
-5%
-10%
Dec
79
Jan
82
Jan
84
Jan
86
Jan
90
Jan
92
Jan
94
Jan
96
Jan
98
Jan
00
Jan
02
Jan
04
Jan
06
Jan
08
Jan
10
-20%
Jan
12
Jan
14
Rolling 5 year returns of MSCI world growth minus MSCI world value to December 2015
MSCI World Growth Outperforms MSCI World Value Outperforms
Source: Aon Hewitt, eVestment. Date: 31 December 2015 Data: GBP, Total Return Net Index Performance

Aon Hewitt Factor-Based Investing 5
Scenario 3: Better risk-adjusted returnsRisk-adjusted returns are often considered when setting asset
allocation, but can be overlooked when constructing an equity
portfolio – particularly for passively managed mandates.
For investors who recognise some of the limitations associated
with the market capitalisation approach, investing in
combinations of factor-based strategies has delivered higher
risk adjusted returns, at least over the longer term.
Some investors select an index fund under the impression that
this will always provide diversification at low cost, without
understanding possible risks, especially in small markets,such
as extreme concentration in a small number of stocks or to a
particular industry.
The market capitalisation approach invests a larger proportion
of the index to stocks which have been driven up to levels
which may not reflect their intrinsic value. Although investors
will benefit from the price increase, these are potentially the
holdings which may suffer the greatest losses when market
bubbles burst. One well-known historic example of this is the
“Dotcom Bubble” when equity market indices developed a
relatively high concentration to Technology, Media and
Telecommunications sectors.
Combining strategies can be a particularly effective way of
including rules-based factor indices in a portfolio. The chart
below demonstrates how a higher “Sharpe Ratio”, a common
measure of risk-adjusted returns, might be achieved by
combining exposure to different factors compared to an
investment in a market capitalisation index.
The portfolio below combines a minimum variance low volatility
approach and a value weighted index constructed using a
composite of company fundamentals in equal proportions.
Weight of the IT sector in the S&P 500 index
Weight of the IT sector in the S&P 500 Index
Source: Datastream
Ind
ex w
eig
ht
0%
10%
20%
30%
40%
50%
1992 1994 1996 1998 2000 2002 2004 2006 2008 2010

Aon Hewitt Factor-Based Investing 6
Index risk return
MSCI World
Low Volatilty Value Weighted Fundamentals
50% Low Volatility / 50% Value Weighted
Fundamental
0.0%
1.0%
2.0%
3.0%
4.0%
5.0%
6.0%
7.0%
8.0%
9.0%
10.0%
10.0% 11.0% 12.0% 13.0% 14.0% 15.0% 16.0% 17.0% 18.0%
An
nu
alis
ed R
etu
rn
Annualised Risk Source: Aon Hewitt, eVestment. MSCI, S&P, FTSE Data: GBP, Total Return Net Index Performance. 10 years to 31 December 2015.
MSCI World
50% Low Volatility / 50% Value Weighted Fundamentals
Return (% pa) 4.1 6.4
Risk (% pa) 14.8 12.9
Sharpe Ratio 0.1 0.3
It should be noted that the above combination is a backtest and
not a live portfolio implemented over the entire period shown.
We would not typically expect the observed level of
outperformance relative to a market capitalisation index
over all time periods.
Aon Hewitt Factor-Based Investing 7
ContactOliver Sample Associate Consultant+44 (0)113 291 [email protected]
ConclusionImplementing an equity allocation is an active decision and
market capitalisation indices may not always be the best fit.
The scenarios above demonstrate how equity portfolios
tailored towards specific factors have the potential to be
better suited to investors’ objectives.
Although factor-based investments can produce periods of
underperformance against market capitalisation indices over
the short to medium term, over the longer term, investing in
combinations of factors has the potential to deliver higher
risk adjusted returns.
We recommend talking to your usual Aon Hewitt contact
to discuss how factor-based investing can be employed
effectively within your strategy.
GlossaryMSCI minimum volatility index Minimum variance approach which weights portfolios to target
the lowest portfolio volatility for a given opportunity set and
under certain constraints.
Drawdown Measures the fall in cumulative return from a previously
reached peak in market value.
Value stocks Stocks which are priced cheaper than their company
fundamentals (earnings, sales etc.) would suggest.
Sharpe ratio Risk adjusted return measure, defined as the excess return
above a risk free return, per unit of volatility.
Value weighted fundamental indices
Illustrative portfolio in Scenario 3 uses a fundamental based
index which weights portfolios using a combination of
fundamental factors, including total cash dividends, free cash
flow, total sales and book equity value.
Aon Hewitt empowers organisations and individuals to secure a better future through innovative talent, retirement and health solutions. We advise, design and execute a wide range of solutions that enable clients to cultivate talent to drive organisational and personal performance and growth, navigate risk while providing new levels of financial security, and redefine health solutions for greater choice, affordability and wellness. Aon Hewitt is a global leader in human resource
solutions, with over 30,000 professionals in 90 countries serving more than 20,000 clients worldwide. For more information on Aon Hewitt, please visit: aonhewitt.com
Follow Aon on Twitter: twitter.com/Aon_plc
Sign up for News Alerts: http://aon.mediaroom.com/index.php?s=58
About Aon Hewitt

About Aon Aon plc (NYSE:AON) is a leading global provider of risk
management, insurance brokerage and reinsurance
brokerage, and human resources solutions and
outsourcing services. Through its more than 72,000
colleagues worldwide, Aon unites to empower results
for clients in over 120 countries via innovative risk
and people solutions. For further information on our
capabilities and to learn how we empower results for
clients, please visit: http://aon.mediaroom.com/
This document and any enclosures or attachments are prepared on
the understanding that it is solely for the benefit of the addressee(s).
Unless we provide express prior written consent, no part of this
document should be reproduced, distributed or communicated to
anyone else and, in providing this document, we do not accept or
assume any responsibility for any other purpose or to anyone other
than the addressee(s) of this document.
Notwithstanding the level of skill and care used in conducting due
diligence into any organisation that is the subject of a rating in this
document, it is not always possible to detect the negligence, fraud,
or other misconduct of the organisation being assessed or any
weaknesses in that organisation’s systems and controls or operations.
This document and any due diligence conducted is based upon
information available to us at the date of this document and takes no
account of subsequent developments. In preparing this document we
may have relied upon data supplied to us by third parties (including
those that are the subject of due diligence) and therefore no warranty
or guarantee of accuracy or completeness is provided. We cannot
be held accountable for any error, omission or misrepresentation of
any data provided to us by third parties (including those that are the
subject of due diligence). This document is not intended by us to
form a basis of any decision by any third party to do or omit to do
anything.
Any opinions or assumptions in this document have been derived
by us through a blend of economic theory, historical analysis and/or
other sources. Any opinion or assumption may contain elements of
subjective judgement and are not intended to imply, nor should be
interpreted as conveying, any form of guarantee or assurance by us of
any future performance. Views are derived from our research process
and it should be noted in particular that we can not research legal,
regulatory, administrative or accounting procedures and accordingly
make no warranty and accept no responsibility for consequences
arising from relying on this document in this regard.
Calculations may be derived from our proprietary models in use at
that time. Models may be based on historical analysis of data and
other methodologies and we may have incorporated their subjective
judgement to complement such data as is available. It should be
noted that models may change over time and they should not be
relied upon to capture future uncertainty or events.
Aon Hewitt Limited is authorised and regulated by the
Financial Conduct Authority. Registered in England & Wales.
Registered No: 4396810.
Registered Office:
The Aon Centre
The Leadenhall Building
122 Leadenhall Street
London EC3V 4AN
Copyright © 2016 Aon plc
aon.com
Risk. Reinsurance. Human Resources.